Embed Size (px)
Citation preview

HAL Id: hal-00302825https://hal.archives-ouvertes.fr/hal-00302825
Submitted on 30 May 2007
HAL is a multi-disciplinary open accessarchive for the deposit and dissemination of sci-entific research documents, whether they are pub-lished or not. The documents may come fromteaching and research institutions in France orabroad, or from public or private research centers.
L’archive ouverte pluridisciplinaire HAL, estdestinée au dépôt et à la diffusion de documentsscientifiques de niveau recherche, publiés ou non,émanant des établissements d’enseignement et derecherche français ou étrangers, des laboratoirespublics ou privés.
A scheme for calculating soil moisture content by usingroutine weather data
K. Z. Shang, S. G. Wang, Y. X. Ma, Z. J. Zhou, J. Y. Wang, H. L. Liu, Y. Q.Wang
To cite this version:K. Z. Shang, S. G. Wang, Y. X. Ma, Z. J. Zhou, J. Y. Wang, et al.. A scheme for calculating soilmoisture content by using routine weather data. Atmospheric Chemistry and Physics Discussions,European Geosciences Union, 2007, 7 (3), pp.7451-7472. �hal-00302825�

ACPD
7, 7451–7472, 2007
A scheme for
calculating soil
moisture content
K. Z. Shang et al.
Title Page
Abstract Introduction
Conclusions References
Tables Figures
◭ ◮
◭ ◮
Back Close
Full Screen / Esc
Printer-friendly Version
Interactive Discussion
EGU
Atmos. Chem. Phys. Discuss., 7, 7451–7472, 2007
www.atmos-chem-phys-discuss.net/7/7451/2007/
© Author(s) 2007. This work is licensed
under a Creative Commons License.
AtmosphericChemistry
and PhysicsDiscussions
A scheme for calculating soil moisture
content by using routine weather data
K. Z. Shang1, S. G. Wang
1, Y. X. Ma
1, Z. J. Zhou
2, J. Y. Wang
1, H. L. Liu
3, and
Y. Q. Wang3
1Gansu Key Laboratory of Arid Climatic Change and Reducing Disaster, College of
Atmospheric Sciences, Lanzhou University, Lanzhou 730000, P.R. China2National Meteorological Center, CMA, Beijing 100081, P.R. China
3Chinese Academy of Meteorological Sciences, CMA, Beijing 100081, P.R. China
Received: 5 April 2007 – Accepted: 10 May 2007 – Published: 30 May 2007
Correspondence to: K. Z. Shang (kezheng [email protected])
7451

ACPD
7, 7451–7472, 2007
A scheme for
calculating soil
moisture content
K. Z. Shang et al.
Title Page
Abstract Introduction
Conclusions References
Tables Figures
◭ ◮
◭ ◮
Back Close
Full Screen / Esc
Printer-friendly Version
Interactive Discussion
EGU
Abstract
Soil moisture content is one of the most important parameters as input conditions in
forecasting model systems of dust storm, but it can not be directly obtained from daily
routine weather report. In this paper, a scheme is developed to calculate the surface
soil moisture content in China by using both precipitation and evaporation. Precipita-5
tion is directly from routine weather report, while evaporation is indirectly calculated by
using meteorological elements which are also from routine weather report. According
to the formula by Penman, evaporation can be considered as a linear composition of
dynamic evaporation and thermodynamic evaporation caused by radiation. First, an
equation for calculating daily global radiation within China is given by using regres-10
sion analysis and the data of global radiation and cloud cover from 116 meteorological
stations in China. Then, an equation for calculating evaporation within China is given
by using regression analysis and the data of cloud cover, air temperature, precipita-
tion, relative humidity, and wind velocity from 701 meteorological stations. Finally, a
scheme for calculating soil moisture content within China is established by using re-15
gression analysis and the soil moisture content, precipitation, and evaporation at 79
agro-meteorological stations. Validation results show that the forecasting accuracy of
the Chinese dust numerical model can be clearly increased by using this scheme.
1 Introduction
As a key physical factor in land surface processes, soil moisture content is an impor-20
tant parameter to scientists in many related fields. It plays an important role in adjusting
and controlling the interactive processes between the ground and the atmosphere. On
the one hand, the thermodynamic character of soil moisture determines Bonn ratio of
sub grid processes and causes the flux of sensible heat, latent heat, and long wave
radiation from the ground to atmosphere to change, thus influencing climatic changes.25
On the other hand, the change of soil moisture content itself also affects the thermo-
7452

ACPD
7, 7451–7472, 2007
A scheme for
calculating soil
moisture content
K. Z. Shang et al.
Title Page
Abstract Introduction
Conclusions References
Tables Figures
◭ ◮
◭ ◮
Back Close
Full Screen / Esc
Printer-friendly Version
Interactive Discussion
EGU
dynamic character of the soil and the hydrological cycle of the land surface, making
various physical and biochemical parameters change accordingly, thus further affect-
ing climatic changes. Research results show that in the processes of climatic changes,
the effect of soil moisture is only inferior to that of sea-surface temperature, and it also
has an important influence on the formation and variation of regional climate (Yeh et5
al., 1984; Lin et al, 2001).
In the processes of wind erosion and dust storm development, soil moisture content,
by affecting the cohesion between soil particles, influences the threshold friction ve-
locity at which dust particles escape from the surface, and thus influences the amount
of dust emitted into the atmosphere from the surface. However, in most numerical10
models, soil moisture content in China is treated as a constant, namely the climatic
mean value, because it can not be directly obtained from routine daily weather report.
Obviously this is not reasonable.
Up to now, there have been no directly observed data of routine daily soil moisture
content, and calculation of soil moisture content is also very difficult. Because of the im-15
portance of soil moisture in synoptic, climatic, and environmental studies, some schol-
ars have studied the distribution characteristics of soil moisture content within local
areas based on a limited amount of experimental and observational data (Matsuyama
et al., 1997; Li et al., 2000). At the present, the methods for estimating soil moisture
content can be divided into three types. The first type is based on the relationship20
between meteorological factors and soil moisture by using statistical analysis (Clapp et
al., 1978; Lu, 1989; Wang et al., 1991; Jin et al., 1998; Reichle et al., 2002; Zhang et
al., 2004, 2006), but these studies are mostly limited to local areas. The second type is
based on the equilibrium equation of soil moisture or hydrodynamic equation (Baier et
al., 1966; Campbell et al., 1974; Lei et al., 1988; Pei et al.,1990; Xie et al.,1998, 1999;25
Entin et al., 1999; Shen et al., 2003; Zhang et al., 2006). But this type needs real-time
soil moisture content data of multiple layers as initial values and thus can not be used
widely. The third type is based on the retrieval of soil moisture content from satellite
remote sensing data (Kerstin et al., 1993; Jackson et al., 1996; Lin et al., 1994; Houser
7453

ACPD
7, 7451–7472, 2007
A scheme for
calculating soil
moisture content
K. Z. Shang et al.
Title Page
Abstract Introduction
Conclusions References
Tables Figures
◭ ◮
◭ ◮
Back Close
Full Screen / Esc
Printer-friendly Version
Interactive Discussion
EGU
et al., 1998; Levitt et al., 1998; Liu et al., 1998; Gao et al., 2001; Yao et al., 2004; Qiao
et al., 2006; She et al., 2006). This type is good for drought monitoring and the climatic
evaluation of soil moisture, but not so good for daily soil moisture content retrieval.
Therefore establishing a reasonable scheme for estimating soil moisture content is an
important and urgent task in current synoptic and climatic numerical simulation studies5
(Sellers, 1996).
Research results show that precipitation is the most important of all meteorological
factors which influence soil moisture content (Chen et al., 2005), and the influence of
precipitation on surface soil moisture content does not last over a month (He et al.,
2002). In this paper we use the Penman formula, statistical analysis, and available me-10
teorological data in China to develop a scheme for calculating daily soil moisture con-
tent, with the aim to improve the numerical forecasting accuracy of dust storm events.
2 Data and research method
2.1 Data
Data used in this study are as follows: (1) the data of soil moisture content 0 to 10 cm15
depth, measured by oven drying, from 79 agro-meteorological stations in China be-
tween 1981 and 2002; (2) global radiation data from 116 meteorological stations in
China between 1961 and 2000; (3) the data of cloud cover, air temperature, precipita-
tion, relative humidity, wind velocity and evaporation from 700 meteorological stations
in China between 1961 and 2002.20
2.2 Research method
The most important factors affecting soil moisture content are precipitation and evap-
oration. In geography and climatology, the ratio of annual (or monthly) precipitation to
annual (or monthly) evaporation is used to indicate the wetness of soil (Liu et al., 2000).
7454

ACPD
7, 7451–7472, 2007
A scheme for
calculating soil
moisture content
K. Z. Shang et al.
Title Page
Abstract Introduction
Conclusions References
Tables Figures
◭ ◮
◭ ◮
Back Close
Full Screen / Esc
Printer-friendly Version
Interactive Discussion
EGU
Based on the same principle, the ratio of daily precipitation to evaporation can also be
used to calculate daily soil moisture.
In routine weather report, precipitation is given directly, but not evaporation. How-
ever, it can be calculated by using of other meteorological elements. According to the
Penman formula (Chen et al., 1993), evaporation can be calculated as follows:5
ET = C(Eh + Em) (1)
Eh =∆
γ + ∆
RS
L(2)
Em =∆
γ + ∆[0.37(1 + V/160)](es−ea) (3)
es = e0 exp
(
at
273.16 + t − b
)
(4)
ea = RH · es (5)10
Rs = (1 − α)Q − F (6)
where ET is total evaporation,Eh is thermodynamic evaporation, Em is dynamic evapo-
ration, ∆=ea
Ta(6463
Ta−3.927), γ=
CpPs0.622L
, Rs is net radiation, L is the latent heat of vapor-
ization per unit mass, V is wind velocity, ea is actual vapor pressure, es is saturation
vapor pressure, a, b, and e0 is constant, t is air temperature, RH is air relative humidity,15
α is surface albedo, Q is global radiation, and F is effective radiation.
According to Eq. (6), α and F are needed to calculate Rs, but they can’t be obtained
directly from routine weather report. Generally, effective radiation F is proportional
to global radiation, and surface albedo α is proportional to vegetation cover rate and
indirectly related to global radiation. In order to simplify the calculation, net radiation20
Rs can be assumed proportional to global radiation
Rs = D0 + D1Q (7)
7455

ACPD
7, 7451–7472, 2007
A scheme for
calculating soil
moisture content
K. Z. Shang et al.
Title Page
Abstract Introduction
Conclusions References
Tables Figures
◭ ◮
◭ ◮
Back Close
Full Screen / Esc
Printer-friendly Version
Interactive Discussion
EGU
Replacing Eq. (6) with Eq. (7), we get:
ET = C∆
γ + ∆[0.37(1 + V/160)](es−ea) + C
∆
γ + ∆
D0 + D1Q
L
= C∆
γ + ∆
D0
L+ C
∆
γ + ∆[0.37(1 + V/160)](es − ea) + C
∆
γ + ∆
D1Q
L
Let B0=C∆
γ+∆
D0
L
B1 = C∆
γ + ∆5
B2 = C∆D1
γ+∆
E1 = [0.37(1 +V
160)] (es − ea) (8)
E2 =Q
L(9)
then
ET = B0 + B1E1 + B2E2 (10)10
where E1 can be calculated by ground wind speed, air temperature and air relative hu-
midity, and E2 can be calculated by global radiation and the latent heat of vaporization
per unit mass L. But the value of C, D0, and D1 is uncertain . For this reason, B0, B1,
andB2 need to be calculated by statistical regression
There are no radiation data at most meteorological stations in China, so we need15
to calculate global radiation Q. When solar radiation enters into the atmosphere, it is
usually weakened by the reflection and absorption due to many meteorological factors,
among which cloud is the most important. So global radiation can be calculated as
follows:
Q = S0[1 − (A0 + A1Cn + A2CL)] (11)20
7456

ACPD
7, 7451–7472, 2007
A scheme for
calculating soil
moisture content
K. Z. Shang et al.
Title Page
Abstract Introduction
Conclusions References
Tables Figures
◭ ◮
◭ ◮
Back Close
Full Screen / Esc
Printer-friendly Version
Interactive Discussion
EGU
where Cn is total cloud cover, CL is low cloud cover, and S0 is astronomical radiation.
A0, A1 and A2 can be calculated by statistical regression. S0 can be calculated as
follows (Wen, 1997):
S0 =
∫ t0
−t0
I0
ρ2sinhΘ dt =
∫ t0
−t0
I0
ρ2(sinϕ sinδ + cosϕ cosδ cosω)dt (12)
where I0 is the solar constant and is equal to 1367 W/m2, hΘ is solar altitude angle,5
1ρ2 is the correction to the average sun-earth distance, ϕ is geographical latitude, δ is
declination, ω is the azimuth angle of the sun, -t0 is the time of sunrise, and t0 is the
time of sunset. From Eq. (11) we have:
S0 =T I0
πρ2(ω0 sinϕ sinδ + cosϕ cosδ sinω0) (13)
where T=86 400 s, −ω0 is the azimuth angle of sunrise, and ω0 is the azimuth angle of10
sunset.
ω0 = arccos(−tgϕtgδ) (14)
1ρ2 and δ can be calculated as follows:
1
ρ2=1.00011+0.03422 cosθ0+0.00128 sinθ0+0.000719 cos 2θ0+0.000077 sin 2θ0 (15)
δ = 0.006918 − 0.399912 cosθ0 + 0.070257 sinθ0 − 0.006758 cos 2θ0
+ 0.000907 sin 2θ0 − 0.0002697 cos 3θ0 + 0.000148 sin 3θ0(16)15
where θ0=2π(dn–1)/365, dn is the order number of the day, counted from 1 January to
31 December.
To sum up the above discussion, a scheme for calculating soil moisture content in
China can be developed according to the following four steps:
7457

ACPD
7, 7451–7472, 2007
A scheme for
calculating soil
moisture content
K. Z. Shang et al.
Title Page
Abstract Introduction
Conclusions References
Tables Figures
◭ ◮
◭ ◮
Back Close
Full Screen / Esc
Printer-friendly Version
Interactive Discussion
EGU
First, a method for calculating daily solar radiation Q can be established by using
global radiation and cloud data available from some meteorological stations in China.
Second, a method for calculating total evaporation ET can be set up by using dynamic
evaporation E1 and the thermodynamic evaporation E2 which can be calculated from
routine meteorological elements available from some meteorological stations in China.5
Third, a scheme for calculating soil moisture content can be established by using the
data of precipitation, total evaporation, and soil moisture content available from some
agro-meteorological stations in China.
Fourth, validation of the established scheme.
3 Establishment of the scheme for calculating soil moisture content10
3.1 Calculation of global radiation
There are only 116 meteorological stations in China with available global radiation
data. By using the data of total cloud cover, low cloud cover and global radiation
from the 116 meteorological stations, we get the coefficients A0, A1, and A2 for these
stations through statistical regression based on Eq. (11). The results show that the15
value of the multiple correlation coefficient R of this regression equation is from 0.5715
to 0.8592. All regression equations of the 116 meteorological stations can pass the
significance test at the level of α=0.001. The coefficients A0, A1, A2 at the 116 me-
teorological stations are different from each other, but they are all related to latitude,
longitude, elevation, annual mean temperature, annual precipitation, annual mean total20
cloud cover, and annual mean low cloud cover (denoted by x1, x2, . . . x7, respectively,
and the same applies below) from 116 meteorological stations. By using the above
parameters as independent variables and A0, A1, A2 as dependent variables, we get a
7458

ACPD
7, 7451–7472, 2007
A scheme for
calculating soil
moisture content
K. Z. Shang et al.
Title Page
Abstract Introduction
Conclusions References
Tables Figures
◭ ◮
◭ ◮
Back Close
Full Screen / Esc
Printer-friendly Version
Interactive Discussion
EGU
group of regression equations as follows:
A0=0.17412+0.0010343x2−0.0000197x3+0.0055469x4−0.0000501x5 R=0.7494
A1=0.01392−0.0011179x4+0.0000103x5+0.0065975x6−0.0064179x7 R=0.7840
A2=0.01810−0.0000015x3+0.0004412x4−0.0024786x6+0.0043320x7 R=0.7589
(17)
It can be seen clearly that Eq. (17) also passes the significance test at the level of
α=0.001. Putting Eq. (17) into Eq. (11), we can calculate daily global radiation in
China by using daily cloud cover data.5
3.2 Calculation of evaporation
By using the data of daily wind velocity V , air temperature t, and air relative humidity
RH from 701 meteorological stations in China, based on Eqs. (4), (5), and (8), we
obtain dynamic evaporation E1 for the 701 meteorological stations.
By using the data of daily cloud cover from 701 meteorological stations in China,10
based on Eq. (13) to (16), (11), and (9), we obtain daily thermodynamic evaporation E2
for the 701 meteorological stations.
By using the data of daily observed evaporation, E1, and E2 for the 701 meteorolog-
ical stations, the coefficients B0, B1, B2 and multi-correlation coefficient R of the 701
meteorological stations can be obtained based on Eq. (10) through statistical regres-15
sion. The value of R ranges from 0.73 to 0.97, so all the regression equations pass
the significance test at the level of α=0.001. The coefficients B0, B1, B2 (dependent
variables) of the 701 meteorological stations are different from each other, but they are
also related to x1, x2, . . . x7 (independent variables). By using regression analysis we
get a group of regression equations as follows:20
B0= 3.77802−0.063042x1−0.011743x2−0.000454x3−0.085141x4+0.000552x5R=0.7331
B1= 3.86344−0.056688x1+0.008792x2−0.095390x4−0.000092x5 R=0.8636
B2=+0.74944−0.002038x2+0.008871x4−0.000068x5−0.039797x6R=0.6656
(18)
It can be seen clearly from Eq. (18) that the equations also pass the significance test
at the level of α=0.001. By putting Eq. (18) into Eq. (10), daily total evaporation in
7459

ACPD
7, 7451–7472, 2007
A scheme for
calculating soil
moisture content
K. Z. Shang et al.
Title Page
Abstract Introduction
Conclusions References
Tables Figures
◭ ◮
◭ ◮
Back Close
Full Screen / Esc
Printer-friendly Version
Interactive Discussion
EGU
China can be calculated by using daily cloud cover, wind velocity, air temperature, and
air relative humidity.
3.3 Calculation of soil moisture
In China there are only 79 agro-meteorological stations with available soil moisture
data “non- routine weather report”. Based on Eqs. (4) to (5), (13) to (16), (11), (18),5
and (8) to (10), we can calculate evaporation for the 79 agro-meteorological stations,
By using the data of daily cloud cover, wind velocity, air temperature, and air relative
humidity from the 79 agro-meteorological stations.
According to the above discussion, soil moisture content can be calculated by using
the ratio of daily precipitation to daily evaporation. The influence of precipitation on soil10
moisture content decreases with time. In other words, the influence of precipitation on
the day which is K days ago on soil moisture is related to the sum of evaporation since
then. Thus, the combined effect of precipitation and evaporation can be defined as
follows:
ZK =
PK
K∑
j=1
ETJ
(19)15
wherePk is precipitation of K days ago, ET i is evaporation of j days ago. The compound
influence of all the precipitation events and evaporation in the past N days on soil
moisture content can be defined as follows:
X =
(
N∑
K=1
(ZK )C
)D
(20)
In order to obtain the best values of N, C, and D, we first take C=0.02, 0.04, 0.06,···,2.0;20
D=0.02, 0.04, 0.06,· · ·,2.0; and N=1,2,3,· · ·,38; then we calculate the daily value of Xfor the 79 available agro-meteorological stations in China by using Eq. (20). And then
7460

ACPD
7, 7451–7472, 2007
A scheme for
calculating soil
moisture content
K. Z. Shang et al.
Title Page
Abstract Introduction
Conclusions References
Tables Figures
◭ ◮
◭ ◮
Back Close
Full Screen / Esc
Printer-friendly Version
Interactive Discussion
EGU
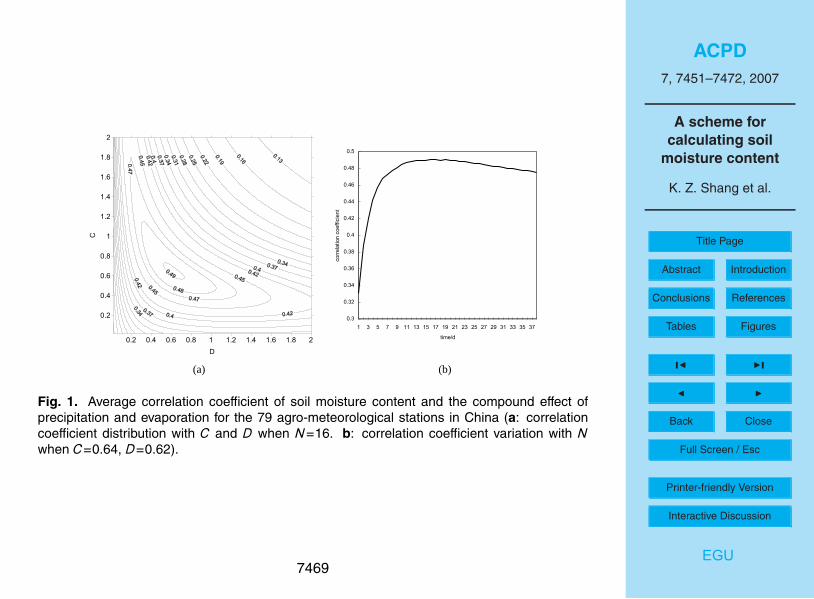
the correlation coefficient between X and soil moisture content is calculated. Calcu-
lation results show that when N=16, C=0.64, and D=0.62, the average value of the
correlation coefficients of the 79 agro-meteorological stations is the greatest (0.4909)
(see Fig. 1)
As a result, Eq. (20) can be concretely expressed as follows:5
X =
16∑
K=1
PK
K∑
j=1
ETJ
0.64
0.62
(21)
Assuming that soil moisture content has a linear relationship with X, we have
S = A + BX (22)
where S is soil moisture content, while A and B can be obtained through regression
analysis. The values of A and B of the 79 agro-meteorological stations are different10
from each other, but they are all related to longitude (x2), annual mean temperature
(x4), and total cloud cover (x6). By using regression analysis, we can obtain the values
of A and B as follows:
A = −33.37 + 0.253x2 − 0.300x4 + 4.15x6R = 0.6229
B = 6.30 − .038x2R = 0.5048(23)
It can be seen clearly from Eq. (23) that the equations pass the significance test at the15
level of α=0.001. Based on Eqs. (4) to (5), (13) to (16), (11), (18), (8) to (10), and (21)
to (23), the daily soil moisture content in China can be calculated by using the data of
daily cloud cover, wind velocity, air temperature, air relative humidity and precipitation
from routine weather report.
However, sometimes one or two of the meteorological elements needed for the20
above calculations is not available in routine weather reports, so simplified schemes
7461

ACPD
7, 7451–7472, 2007
A scheme for
calculating soil
moisture content
K. Z. Shang et al.
Title Page
Abstract Introduction
Conclusions References
Tables Figures
◭ ◮
◭ ◮
Back Close
Full Screen / Esc
Printer-friendly Version
Interactive Discussion
EGU
are needed to replace the original scheme. Three kinds of simplified schemes are
given as follows:
1. Scheme without cloud data
When cloud data are absent, only E1 can be calculated. The compound effect Xis given as follows:5
X =
12∑
K=1
PK
K∑
j=1
E1j
0.6
0.6
(24)
A = 1.59 − 0.636x4 + 0.015x5 + 2.01x6R = 0.6157
B = 3.87 − 0.024x2R = 0.5987(25)
2. Scheme with only cloud cover and precipitation
If there are only cloud cover and precipitation, only E2 can be calculated. The
compound effect X is given as follows:10
X =
16∑
K=1
PK
K∑
j=1
E2j
0.70
0.68
(26)
A = 1.09 − 0.641x4 + 0.0150x5 + 0.208x6R = 0.6139
B = 8.47 − 0.049x2R = 0.5065(27)
7462

ACPD
7, 7451–7472, 2007
A scheme for
calculating soil
moisture content
K. Z. Shang et al.
Title Page
Abstract Introduction
Conclusions References
Tables Figures
◭ ◮
◭ ◮
Back Close
Full Screen / Esc
Printer-friendly Version
Interactive Discussion
EGU
3. Scheme with only precipitation
We have to consider evaporation as constant when only precipitation is available.
The compound effect X is given as follows:
X =
12∑
K=1
(
PK
K
)0.70
0.74
(28)
A = 0.94 − 0.643x4 + 0.015x5 + 2.20x6R = 0.6280
B = 3.08 − 0.00186x2R = 0.5385(29)5
4 Validation of the scheme for calculating soil moisture content
4.1 Direct validation of the scheme
In order to validate the established scheme for calculating soil moisture, calculated
and observed soil moisture content data from 2003 to 2005 are compared for 7 agro-
meteorological stations in the east of Gansu Province in China (see Table 1). The10
results show that the correlation coefficients of 6 stations pass the significance test at
the level of α=0.001, but that of the Maqu station only passes the significance test at
the level of α=0.01. This demonstrates that the established scheme can be used to
calculate ground soil moisture content.
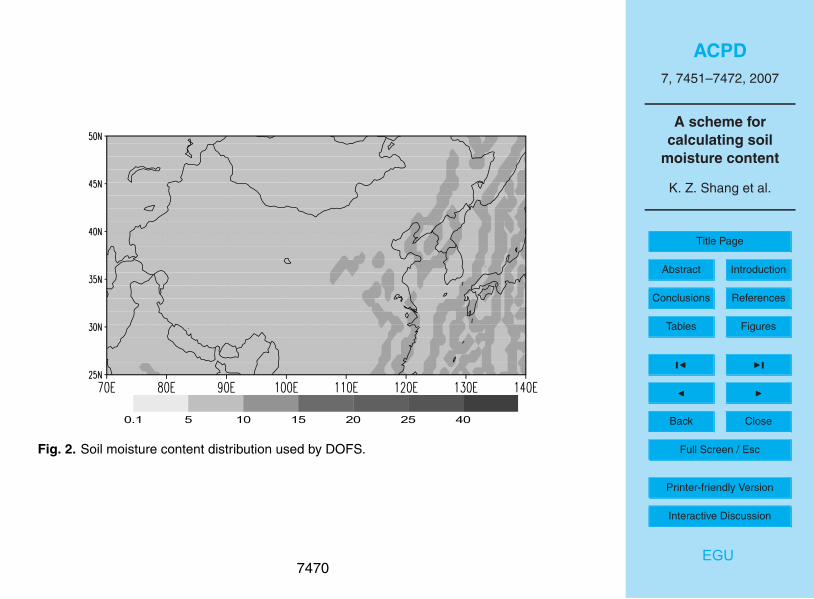
4.2 Indirect validation of the scheme15
Soil moisture content is an important parameter in the dust event operational forecast-
ing system(DOFS) of the National Meteorological Center in China, but it is treated as
a constant. Figure 2 shows its distribution in China used by the DOFS. It can be seen
from Fig. 2 that the soil moisture content in most of China is from 5 to 10%. Obviously,
this is unreasonable.20
7463

ACPD
7, 7451–7472, 2007
A scheme for
calculating soil
moisture content
K. Z. Shang et al.
Title Page
Abstract Introduction
Conclusions References
Tables Figures
◭ ◮
◭ ◮
Back Close
Full Screen / Esc
Printer-friendly Version
Interactive Discussion
EGU
Figure 3 shows the soil moisture content distribution in China on 19 March 2002,
calculated based on our scheme. It can be seen from Fig. 3 that soil moisture content
increases from the northwest to the southeast, which is much closer to the reality in
China.
From 18 to 20 March 2002, a strong dust storm event occurred in Northwest China.5
Figure 4a shows the simulated dust concentration distribution output by the DOFS,
with soil moisture content input as shown in Fig. 2. Figure 4b shows the simulated
dust concentration distribution output by the DOFS, but with soil moisture content input
calculated according to our scheme as shown in Fig. 3. It can be seen clearly that
the distribution of simulated dust concentration shown in Fig. 4b is much closer to the10
observed intensity distribution of the dust event than that shown in Fig. 4a. Particularly,
the two simulated dust storm centers shown in Fig. 4b are much closer to the actually
observed ones, but the position and intensity of the simulated dust storm centers as
shown in Fig. 4a are much more different from the actually observed situation. The
above results show that the forecasting accuracy of the DOFS can be clearly improved15
by using our scheme.
5 Conclusions
1. The influence of precipitation on surface soil moisture content does not last more
than 16 days.
2. The compound effect of the ratio of precipitation to evaporation, which is non-20
linearly summed, can be used to calculate the surface soil moisture content in
China.
3. Direct validation results show that our scheme can be used to calculate soil mois-
ture content in China satisfactorily.
4. Indirect validation results show that the forecasting accuracy of dust storm events25
in China can be clearly improved by using our soil moisture scheme.
7464
ACPD
7, 7451–7472, 2007
A scheme for
calculating soil
moisture content
K. Z. Shang et al.
Title Page
Abstract Introduction
Conclusions References
Tables Figures
◭ ◮
◭ ◮
Back Close
Full Screen / Esc
Printer-friendly Version
Interactive Discussion
EGU
Acknowledgements. The research is supported by the National Key Project of Basic Research
in China (2006CB403701) and the Project of National Natural Science Foundation of China
(40675077). We would like to thank S. Gong for his help with this paper.
References
Peng, S. F.: Soil moisture content analysis on the area of Hui-he river and Shi-guan river:5
Study of energy and water cycle on the area of Hui-he river, Meteorological press, Beijing,
182–186, 1999.
Baier, W. and Robertson, G. W.: A new versatile soil moisture budget, Canadian J. Plant Sci.,
46, 299–315, 1966.
Campbell, G. S.: A simple method for determining unsaturated conductivity from moisture10
retention data, Soil Sci., 117–311, 1974.
Chen, B., Ding, Y. G., and Liu, J. M.: The Soil moisture Prediction Model Experiment Research
of The Climatic Humid Zone, Scientia Meteorological Sinica, 25(3), 231–237, 2005.
Chen, Q. and Chen, T. Y.: Estimation of River Basin evapotranspiration over Complex Terrain
Using NOAA AVHRR Data, Acta Geographica Sinica, 48(1), 61–69, 1993.15
Clapp, R. R. and Honberger, G. M.: Empirical equations for soil hydraulic properties, Water
Resour. Res., 14, 601–604, 1978.
Entin, J. K., Robock, A., Vinnikov, K. Y., et al.: Evaluation of global soil wetness project soil
moisture simulation, J. Meteorol. Soc. Japan, 77(1B), 183–198, 1999.
Gao, F., Wang, J. M., Sun, C. Q., and Wen, J.: Advances in Study on Microwave Remote20
Sensing of Soil Moisture, Rem. Sens. Technol. Appl., 16(2), 97–102, 2001.
He, Z. B. and Zhao, W. Z.: Variability of Soil Moisture of Shifting Sandy Land and Its Depen-
dence on Precipitation in Semi-arid Region, J. Desert Res., 22(4), 359–402, 2002.
Houser, P. R., Shuttle, W. J., Famiglietti, J. S., et al.: Integration of soil moisture remote sens-
ing and hydrologic modeling using data assimilation, Water Resour. Res., 34(12), 405–420,25
1998.
Jackson, T. J.: Measuring surface soil moisture using passive microwave remote sensing, Hy-
drol. Processes, 7, 139–152, 1993.
Jackson, T. J., Schmugge, T. J., and Engman, E. T.: Remote sensing applications to hydrology:
Soil moisture, Hydrol. Sci. J., 41(4), 517–530, 1996.30
7465

ACPD
7, 7451–7472, 2007
A scheme for
calculating soil
moisture content
K. Z. Shang et al.
Title Page
Abstract Introduction
Conclusions References
Tables Figures
◭ ◮
◭ ◮
Back Close
Full Screen / Esc
Printer-friendly Version
Interactive Discussion
EGU
Jin, L., Luo, Y., Miao, Q. L., and Shen, S. H.: Forecast Model of Farmland Soil Moisture by
Artificial Neural Network, Acta Pedologica Sinica, 35(1), 25–32, 1998.
Kerstin, R., Leif, K., Sune, A., and Thomas, R.: Estimates of denitrification in soil by remote
sensing of thermal infrared emission at different moisture levels, Biology and Fertility of Soils,
16(3), 193–197, 1993.5
Lei, Z. D., Yang, S. X., and Xie, S. C.: Soil Water Dynamics, Tsing-Hua University Press,
Beijing, 1988.
Levitt, D. G., Simpson ,J. R., and Huete, A. R.: Estimates of surface soil water content using
linear combinations of spectral wavebands, Theoretical and Applied Climatology, 42(4), 245–
252, 1990.10
Li, Y. and Liu, J. J.: Advance in Spatial Variability of Soil Properties, Journal of Shihezi Univer-
sity (Natural Science), 4(4), 331–337, 2000.
Lin, D. S., Wood, E. F., Troch, P. A., et al.: Comparisons of remotely sensed and model sim-
ulated soil moisture over a heterogeneous watershed, Rem. Sens. Environ., 48, 159–171,
1994.15
Lin, Z. H., Yang, X. S., and Guo, Y. F.: Sensitivity of Land Surface Model to the Initial Condition
of Soil Moisture, Clim. Environ. Res., 6(2), 240–248, 2001.
Liu, C. M., Yue, T. X., and Zhou, C. H.: Geographical mathematics model and application,
Science press, Beijing, 2000.
Liu, J. Y., Liu, C. S., and Zhang, W. Z.: A Method of Calculating Surface Moisture From GMS20
and AVHRR, Quart. J. Appl. Meteorol., 9(2), 197–204, 1998.
Lu, Y. B.: Study on the Model for Soil Moisture Forecast in the Three-River Plain Region, Acta
Pedologica Sinica, 26(1), 51–56, 1989.
Matsuyama, K. M.: Estimates of continental-scale soil wetness and comparison with the soil
moisture data of Mintz and Serafini, Clim. Dyn., 13(10), 681–689, 1997.25
Pei, B. X., Mao, F., and Liu, H. Q.: North China spring the soil moisture development imitates
the on trial research that forecast the mode, Journal of China Agricultural University, 16(sup.),
116–122, 1990.
Qiao, P. L., Zhang J. X., and Wang, C. H.: Soil moisture retrieving by passive microwave remote
sensing data, Journal of Liaoning Technical University, 25(3), 342–344, 2006.30
Reichle, R. H., Walker, J. P., and Randal, D. K.: Extended versus ensemble Kalman filtering for
land data assimilation, J. Hydrometeorol., 3, 728–740, 2002.
Sellers, A.: Soil Moisture: a critical focus for global change studies, Global and Planetary
7466

ACPD
7, 7451–7472, 2007
A scheme for
calculating soil
moisture content
K. Z. Shang et al.
Title Page
Abstract Introduction
Conclusions References
Tables Figures
◭ ◮
◭ ◮
Back Close
Full Screen / Esc
Printer-friendly Version
Interactive Discussion
EGU
Change, 13, 39–40, 1996.
She, W. M. and Ye, C. H.: Review on Soil Moisture and Drought Remote Sensing Monitoring
Based MODIS Satellite Data, Meteorology Journal of Henan., 29(1), 44–46, 2006.
Shen, H. J., Yan, C. R., and Dai, Y. P.: Progress and application of soil moisture monitoring and
forecast models, Ecologic Science, 22(4), 366–370, 2003.5
Wang, F. T., Feng, D. Y., and Zhang, H. M.: Introduction of Agro-meteorological forecasting,
Agriculture press, Beijing, 1991.
Wen, D. M.: China radiates weather, Meteorological press, Beijing, 1997.
Xie, Z. H., Luo, Z. D., Zeng Q. C., et al.: A numerical simulation solving moisture content and
flux for an unsaturated soil water flow problem, Progress in Natural Sciences, 9(12), 280–10
286, 1999.
Xie, Z. H., Zeng, Q. C., Dai, Y. J., et al.: Numerical simulation of an unsaturated flow equation,
Sciences in China, Series D, 28(4), 175–180, 1998.
Yao, C. S., Zhang, Z. X., and Wang, X.: Evaluating Soil Moisture Status in XinJiang Using the
Temperature Vegetation Dryness Index (TVDI), Remote Sensing Technology and Applica-15
tion, 19(6), 473–478, 2006.
Yeh, T. C., Wetherald, R. I., and Manabe, S.: The effect of soil moisture on the short term
climate and hydrology change–A numerical experiment, Mon. Wea. Rev., 112, 474–490,
1984.
Zhang, S. L., Xie, Z.H., Tian, X. J., et al.: A Soil Moisture Assimilation Scheme With an Unsat-20
urated Soil Water Flow Model and In Site Observation, Adv. Earth Sci., 21(12), 1350–1362,
2006.
Zhang, S. W., Qiu, C. J., and Xu, Q.: Estimating soil water contents from soil temperature
measurements by using adaptive Kalman filter, J. Appl. Meteorol., 43, 379–389, 2004.
Zhang, S. W., Li, H. R., Zhang, W. D., et al.: Estimating the soil moisture profile by assimilating25
near-surface observations with the Ensemble Kalman Filter(EnKF), Adv. Atmos. Sci., 22(6),
936–945, 2006.
7467

ACPD
7, 7451–7472, 2007
A scheme for
calculating soil
moisture content
K. Z. Shang et al.
Title Page
Abstract Introduction
Conclusions References
Tables Figures
◭ ◮
◭ ◮
Back Close
Full Screen / Esc
Printer-friendly Version
Interactive Discussion
EGU
Table 1. Correlation coefficients between estimated and observed soil moisture content at 7
ago-meteorological stations in the east of Gansu.
ago-meteorological station Dingxi Huanxian Xifeng Tongwei Maqu Tianshui Chengxian
Latitude/(◦
N) 35.58 36.58 35.73 35.22 34.00 34.57 33.75
Longitude/(◦
E) 104.62 107.30 107.63 105.23 102.08 105.87 105.72
Correlation coefficient 0.662 0.759 0.800 0.748 0.337 0.688 0.717
Numbers of samples 75 75 75 75 75 75 75
7468
ACPD
7, 7451–7472, 2007
A scheme for
calculating soil
moisture content
K. Z. Shang et al.
Title Page
Abstract Introduction
Conclusions References
Tables Figures
◭ ◮
◭ ◮
Back Close
Full Screen / Esc
Printer-friendly Version
Interactive Discussion
EGU
8
0.2 0.4 0.6 0.8 1 1.2 1.4 1.6 1.8 2
D
0.2
0.4
0.6
0.8
1
1.2
1.4
1.6
1.8
2
C
0.3
0.32
0.34
0.36
0.38
0.4
0.42
0.44
0.46
0.48
0.5
1 3 5 7 9 11 13 15 17 19 21 23 25 27 29 31 33 35 37
time/dcorr
ela
tion c
oeffic
ient
(a) (b)
BX
α
Fig. 1. Average correlation coefficient of soil moisture content and the compound effect of
precipitation and evaporation for the 79 agro-meteorological stations in China (a: correlation
coefficient distribution with C and D when N=16. b: correlation coefficient variation with Nwhen C=0.64, D=0.62).
7469
ACPD
7, 7451–7472, 2007
A scheme for
calculating soil
moisture content
K. Z. Shang et al.
Title Page
Abstract Introduction
Conclusions References
Tables Figures
◭ ◮
◭ ◮
Back Close
Full Screen / Esc
Printer-friendly Version
Interactive Discussion
EGU
10
shows it’s
0.1 5 10 15 20 25 40 Fig. 2. Soil moisture content distribution used by DOFS.
7470

ACPD
7, 7451–7472, 2007
A scheme for
calculating soil
moisture content
K. Z. Shang et al.
Title Page
Abstract Introduction
Conclusions References
Tables Figures
◭ ◮
◭ ◮
Back Close
Full Screen / Esc
Printer-friendly Version
Interactive Discussion
EGU
10
shows it’s
70 80 90 100 110 120 130 140
30
35
40
45
50
0.1 5 10 15 20 25 40
Fig. 3. Soil moisture content distribution in China on 19 March 2002 based on our scheme.
7471

ACPD
7, 7451–7472, 2007
A scheme for
calculating soil
moisture content
K. Z. Shang et al.
Title Page
Abstract Introduction
Conclusions References
Tables Figures
◭ ◮
◭ ◮
Back Close
Full Screen / Esc
Printer-friendly Version
Interactive Discussion
EGU
11
(a) (b)
Fig. 4. Comparison of simulated dust concentration distribution (20 March 2002, 03:00 UTC)
(a: result from the original DOFS; b: result from our scheme; 1,2,3 represent actual floating
dust, blowing sand and dust storm, respectively; simulated dust concentration is in µg/m3).
7472


![Calculating wet topsoil pile weight Calculate the moisture content (w): w = [(g water) / (g dry soil)] x 100 = % Calculate dry topsoil weight using Db](https://img.pdfslide.us/doc/110x75/56649d3f5503460f94a1907f/calculating-wet-topsoil-pile-weight-calculate-the-moisture-content-w-w-.jpg)