Embed Size (px)
Citation preview

Jenny M. Dauer, Jennifer M.Withington, Jacek Oleksyn, Jon Chorover,Oliver A. Chadwick, Peter B. Reich, David M. Eissenstat*
A scanner-based approach to soil profile-wallmapping of root distribution
Received: 11 May 2009; Accepted: 14 September 2009
Abstract: Root distribution sampling techniques are often inaccurate, time consuming and costly. We pres-ent an inexpensive approach to soil profile-wall mapping using a desktop scanner that allowed us to spend re-duced time in the field. The scanner was pressed onto the vertical surface of a 1 x 1 m soil pit and images of theroots were taken in situ. In a common garden planting of eleven, 30-year-old conifer and hardwood tree spe-cies in Poland, we compared root counts (number of roots cm–2) obtained by this method with independentmeasurements of root length density (RLD) obtained from soil cores. We found a positive correlation(Spearman rank correlation r=0.93; P<0.001) suggesting general agreement of the two approaches in rank-ing among the species. Soil coring as well as grid mapping with plastic overlays took a longer total time forquantifying root distribution than the scanning procedure. The desktop scanner approach we developed is aninexpensive, time efficient and accurate way of quantifying root distribution and abundance that allows aunique coupling of root data to soil properties.
Additional key words: methods, soil profile-wall mapping, root distribution, scanner
Address: J.M. Dauer, J.M. Withington, D.M. Eissenstat*: Department of Horticulture and the IntercollegeGraduate Program in Ecology, The Pennsylvania State University, University Park, Pennsylvania 16802, USA,e-mail: [email protected]. Oleksyn: Institute of Dendrology, Polish Academy of Sciences, PL-62-035 Kornik, Poland, and Departmentof Forest Resources, University of Minnesota, St. Paul, Minnesota 55108, USAJ. Chorover: Department of Soil, Water, & Environmental Science, University of Arizona, Tucson, Arizona85721, USAO.A. Chadwick: Department of Geography, University of California, Santa Barbara, Santa Barbara, California93106, USAP.B. Reich: Department of Forest Resources, University of Minnesota, St. Paul, Minnesota 55108, USA*corresponding author
IntroductionRoot distribution in soil plays a major role in water
and nutrient acquisition, plant competition, soil de-velopment and the composition and distribution ofsoil biota. Yet procedures for quantifying root distri-bution are often inaccurate, time consuming and
costly. Most methods involve digging a trench or pitand recording roots by counting on a sampling grid,or marking positions on plastic overlays (vanNoordwijk et al. 2000). Alternatively, soil cores canbe taken and root length or mass quantified in eachcore. However, these techniques have disadvantages:sampling on a grid or plastic over-lay requires exten-
2009, vol. 62, 35–40
36 J.M. Dauer, J.M.Withington, J. Oleksyn, J. Chorover, O.A. Chadwick, P.B. Reich, D.M. Eissenstat
sive time spent in the field marking each root in agrid, and substantial time quantifying the root distri-bution from the overlays. Root analyses conductedusing soil cores are also time-costly and do not readilyallow a comparison of root densities with soil genetichorizons.
We present here a novel approach to profile-wallmapping that allowed us to spend reduced time in thefield. We used a desktop scanner that captures imagesof roots on a vertical soil surface to determine numberof roots visible in a vertical plane (root count cm–2) ofdifferent soil horizons. This method was described inbrief in Dauer et al. 2007, however, the purpose ofthis paper is to 1) validate this new method by com-paring it to independent measurements of root lengthdensity (RLD) obtained from soil cores taken at thesame site and 2) compare advantages and disadvan-tages of the desk-top scanner technique to classic tech-niques of profile-wall mapping and soil core methods.
Methods
Study siteThe study area was located in a common garden in
the Siemianice Experimental National Forest in cen-tral Poland (51°14.87’N, 18°06.35’E, altitude: 150m). Soils were nutrient poor with a plowed A-hori-zon, and the soil texture averaged 80% sand and 15%silt. Climate of the region is transitional betweenmaritime and continental, and the mean annual pre-cipitation was 591 mm. Mean temperature was 8.2°Cwith a mean growing season of 213 d, calculated asthe number of days with a mean temperature =5°C.
Six conifer species (Abies alba, Picea abies [L.]Karst., Pinus sylvestris L., P. nigra Arn., Larix deciduaMill., Pseudotsuga menziesii Franco) and eight hard-wood species (Acer platanoides L., A. pseudoplatanus L.,Betula pendula Roth., Carpinus betulus L., Fagus sylvaticaL., Quercus robur L., Q. rubra L., Tilia cordata Mill.) wereplanted in 1970 and 1971 in 1 × 1 m spacing in twoadjacent plantings. Each planting had nine of the spe-cies, replicated three times, in a total of 27, 20 × 20 mmonospecific plots. Details of the experimental area
were presented elsewhere (Szymanski 1982,Withington et al. 2003, 2006; Reich et al. 2005;Hobbie et al. 2006, 2007; Knight et al. 2008; Przybylet al. 2008). Due to the high tree density, fewunderstory plants were present.
Image collectionDuring one week in 2002, pits 1 m wide, 1.8 m
long and 2 m deep [soil pit dimensions differed fromthose of scanning windows] were excavated in eachplot (from 3–6 plots per species, 53 pits in total). Be-cause of the time constraints of working at a distantfield site and the requirement to work ahead of soilscientists who were sampling soil profiles in each pit,it was not possible to map roots with the conven-tional plastic over-lay method, which may take half aday for each pit (Table 1). Dong et al. (2003) de-scribed a method of monitoring root growth of appletrees growing in greenhouses by pressing a scanner toa transparent acrylic sheet on one side of a root box.We modified this scanner-based approach from im-age acquisition of small areas in controlled indoor en-vironment to documenting large area of roots grow-ing in soil in field conditions. We used a scanner tocapture images of our soil pits in Poland, which al-lowed us to map root distribution of a pit face of ap-proximately 1 m2 in about one hour. In each monocul-ture plot at our field site, the faces of each pit wereprepared by smoothing the soil with a flat shovel andcement knife. Soil was brushed away to expose theroots, particularly in the organic horizon. All rootswere clipped to <3 cm in length. The face was sprayedwith water to increase the color contrast betweenroots and soil, wash soil from the roots and stabilizethe sandy soil on the side of the pit. The face wasgrid-marked in squares 30.5 × 22.8 cm (fit to scannerwindow) to cover the area of the pit face (1 × 1 me-ter). The grid was marked with pins. Images of eachsquare were taken at 200 dpi using a desktop scannerEpson Perfection 1250 (Seiko Epson Corporation)and a Mac PowerPC G3 computer with a 700 Mhzprocessor and 384 RAM. The scanner had a depth offield of approximately 3.5 cm. At 200 dpi, roots weremagnified 2.2 times. The lid of the scanner was re-
Table 1. Advantages and disadvantages of root distribution methods based on scanning and coring events in Poland(Withington et al. 2006), profile wall mapping in a grape vineyard in New York (Rick Dunst 2004 personal communica-tion) and digitizing profile-wall maps (van Noordwijk, et al. 2000)
Technique Field person-hours Lab person-hours Total hrs per plot Other unique advantages
Profile-wall scanningimages
1.2 per soil pit takingimages
2.3 per soil pit analyzingimages
3.5 Can quantify roots by soil lo-cation, data is in digital form
Profile-wall grid mappingwith plastic over-lay
4.0 per soil pit 12.0 per soil pit digitizingprofile-wall maps
16.0 Can quantify roots by soil lo-cation
Soil cores 3.0 per plot (based on 3cores per plot [156 cores to-tal] taken in Poland)
9.0 per plot (based oncleaning and sorting 3cores per plot [156 corestotal] in Poland)
12.0 Can group roots by order,analyze root biomass, archi-tecture and anatomy
A scanner-based approach to soil profile-wall mapping of root distribution 37
moved and the surface was covered with acetate andtape to protect it from being scratched. After the im-ages were obtained, soil horizons in each pit werecharacterized and sampled for chemical analysis.
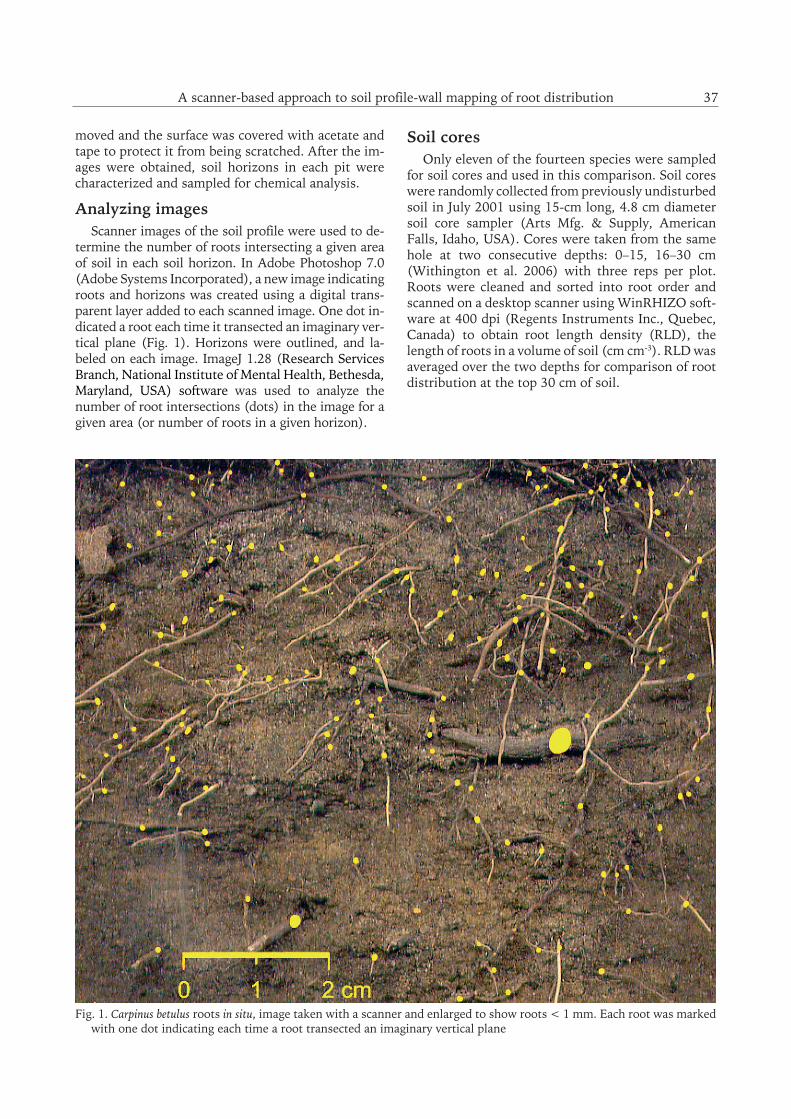
Analyzing imagesScanner images of the soil profile were used to de-
termine the number of roots intersecting a given areaof soil in each soil horizon. In Adobe Photoshop 7.0(Adobe Systems Incorporated), a new image indicatingroots and horizons was created using a digital trans-parent layer added to each scanned image. One dot in-dicated a root each time it transected an imaginary ver-tical plane (Fig. 1). Horizons were outlined, and la-beled on each image. ImageJ 1.28 (Research ServicesBranch, National Institute of Mental Health, Bethesda,Maryland, USA) software was used to analyze thenumber of root intersections (dots) in the image for agiven area (or number of roots in a given horizon).
Soil coresOnly eleven of the fourteen species were sampled
for soil cores and used in this comparison. Soil coreswere randomly collected from previously undisturbedsoil in July 2001 using 15-cm long, 4.8 cm diametersoil core sampler (Arts Mfg. & Supply, AmericanFalls, Idaho, USA). Cores were taken from the samehole at two consecutive depths: 0–15, 16–30 cm(Withington et al. 2006) with three reps per plot.Roots were cleaned and sorted into root order andscanned on a desktop scanner using WinRHIZO soft-ware at 400 dpi (Regents Instruments Inc., Quebec,Canada) to obtain root length density (RLD), thelength of roots in a volume of soil (cm cm-3). RLD wasaveraged over the two depths for comparison of rootdistribution at the top 30 cm of soil.
Fig. 1. Carpinus betulus roots in situ, image taken with a scanner and enlarged to show roots < 1 mm. Each root was markedwith one dot indicating each time a root transected an imaginary vertical plane

38 J.M. Dauer, J.M.Withington, J. Oleksyn, J. Chorover, O.A. Chadwick, P.B. Reich, D.M. Eissenstat
Results and DiscussionBecause scanner data were delineated by horizon
and soil core data were grouped by depth, we usedonly data with median horizon depth < 30 cm in or-der to compare the two methods. Root numbers fromscanned images were positively correlated with RLDfrom soil cores (Fig. 2; r=0.93; P<0.001), suggestinggeneral agreement of the two approaches in rankingroot density among the species. Potential errors inthe scanner approach include underestimates in rootnumber in areas where, due to uneven soil surfaces,the image was dark or unfocused or where the rootswere too small to detect, and overestimates due to in-consistency in clipping roots at 3 cm from the soil sur-face.
Both methods indicate that Acer platanoides andAcer pseudoplatanus ranked highest among the speciesexamined in the number of roots in a given verticalplane or volume of soil (Fig. 2). The scanning methodshowed both Acer species had twice the number ofroots per unit area of profile-wall than the other spe-cies. With the exception of Tilia cordata, the hardwoodtrees had higher root count (roots m–2) and higherroot length density (RLD, cm cm-3) than the conifertrees (Fig. 2).
Both soil coring in Poland, as well as grid mappingand analysis in a grape vineyard in New York (RickDunst 2004, personal communication) took longertotal time for quantifying root distribution than thescanning procedure (Table 1). The time required foreach scan depends on the resolution of the image. A
higher dpi would allow a greater magnification of theimages but at the cost of longer duration for image ac-quisition. At 200 dpi we were able to detect rootswith a diameter of 1 mm and take one 30.5 × 22.8 cmimage in approximately 30 seconds. These time con-straints may be mitigated by faster computers andfaster scanners than those used in this study. Time re-quired for image acquisition may increase if the soilsare rocky, requiring more time to smooth the soil sur-face.
Sorting roots from soil after coring can be a longprocess. It took 150 hours in the field and 480 hoursin the lab to sort roots from 156 soil cores (Table 1).The hours spent in this example are typical of suchroot work, but also include sorting roots into sizeclasses, which inflated the hours to some extent. Al-ternatively, the soil core-break method does not re-quire roots to be sorted from the soil, and instead in-volves estimating the number of roots by breaking thesoil core in half and counting the number of rootssticking out of both soil surfaces (Escamilla et al.1991, van Noordwijk et al. 2000). Due to sources oferror, including effects of preferential root orienta-tion, the break being unrepresentative, random varia-tion of numbers of roots intersecting the plane of ob-servation, and counting errors, this technique can beof low precision (Bland 1989, 1991). In general, soilcores are disadvantageous in directly relating localroot density with other soil characteristics observablefrom soil pits. Additionally, because of low root den-sities deeper in the soil, obtaining accurate estimatesof root distribution at deeper depths with soil coringmay require a very large number of cores. However,soil cores have the advantage of being less destructivethan large soil profiling pits.
A distinct advantage of the scanner technique overusing a plastic sheet to map roots on profile-walls isthe short amount of time spent in the field acquiringdata (Table 1). The scanner may also save processingtime because the images are already in a digital for-mat and there is no extra time logging coordinatesinto the computer. Other studies have captured in situroot images digitally by photography (Schmid andKazda 2002), but photographs require complicatedimage rectification to account for camera angle anduneven light sources.
A disadvantage of both soil cores and profile-wallmapping, is the possibility of missing the finest rootsin the soil. Minirhizotrons are a root quantificationtechnique that can capture the smallest roots by low-ering a camera through a clear plastic tube that re-sides in the soil. We found that minirhizotron rootlength intensity (cm root length cm–2 window viewingarea) data taken from the same plots did not correlatewell with either soil core RLD data or scanner rootcount data (unpublished data). Minirhizotrons havebeen known to distort distribution of roots, giving an
Fig. 2. Eleven species of forest trees ranked by increasingroot count m–2 obtained by scanner images. There is asignificant correlation of root count m–2 with root lengthdensity (RLD) obtained by soil cores taken at the samesite. Spearman rank correlation r= 0.93; P<0.001. Theabbreviation Ps = Pinus sylvestris, Pm = Pseudotsugamenziesii, Pn = Pinus nigra, Pa = Picea abies, Aa = Abiesalba, Tc = Tilia cordata, Qr = Quercus rubra, Fs = Fagussylvatica, Ld = Larix decidua, Apl = Acer platanoides, Aps =Acer pseudoplatanus

A scanner-based approach to soil profile-wall mapping of root distribution 39
inaccurate underestimation of root intensity in theupper soil layers and an overestimate of roots in thedeeper layers (Bragg et al. 1983, Hansson and Andren1987, Parker et al. 1991, Heeraman and Juma 1993,Samson and Sinclair 1994, Pages and Bengough 1997,Ephrath et al. 1999, Smit 2000). Detecting tiny rootsusing the scanner approach may be possible in the fu-ture as increasingly faster computers, data transferand scanner image acquisition should decrease collec-tion time of high-resolution images allowing greatermagnification of images.
The scanner technique may be less expensive thanother approaches as it saves time in labor wages.Also, it required very inexpensive equipment. Thecost of the scanner was $100, while soil corers typi-cally cost from $100–$1000 (Giddings Machine Co.,Windsor, Colorado), and a minirhizotron camera cancost $20,000. Image processing software with simpleanalyzing capabilities was readily available in the pub-lic domain (ImageJ). The greatest strength of thescanner approach was its ability to couple root distri-bution with soil characteristics. For example, rootdata from this site will be coupled to soil solution andexchangeable ion data by horizon to address ques-tions about species-specific local accessibility to nu-trients. We were able to examine roots in the soil hab-itat in which they reside without destroying genetichorizons.
ConclusionThe approach we developed using a desktop scan-
ner is a time efficient, inexpensive and apparently ac-curate way of quantifying root distribution and abun-dance. Quantifying root numbers by soil horizon al-lows a unique coupling with soil properties. The scan-ner technique may be a useful tool in studying a rangeof ecological questions including nutrient cycling, re-source partitioning and biogeochemistry.
AcknowledgmentsWe thank S. Hall, S. Parikh and A.M. Jagodzinski.
This research was supported by NSF with an EasternEuropean International Supplement (IBN 9596050)and by NSF collaborative research: DEB 01298944(PSU), DEB 0090069 (UMN) and DEB 0128958(UMN).
ReferencesBland W.L. 1989. Estimating root length density by
the core-break method. Soil Science Society ofAmerica Journal 53: 1595–1597.
Bland W.L. 1991. Root length density fromcore-break observations: sources of error. In:Plant Roots and their Environment. McMichael
B.L., Persson, H. (eds.) Elsevier, Amsterdam,Netherlands, pp. 565–569.
Bragg P.L, Govi G., Cannell R.Q. 1983. A comparisonof methods, including angled and verticalminirhizotrons, for studying root growth and dis-tribution in a spring oat crop. Plant and Soil 73:435–440.
Dauer J.M., Chorover J., Chadwick O.A., Oleksyn J.,Tjoelker M.G., Hobbie S.E., Reich P.B.,Eissenstat D.M. 2007. Controls over leaf and lit-ter calcium concentrations among temperatetrees. Biogeochemistry 86:175–187.
Dong SF., Neilsen, D., Neilsen G.H., Weis M. 2003. Ascanner-based root image acquisition techniquefor measuring roots on a rhizotron window.Hortscience 38: 1385–1388.
Ephrath J.E., Silberbush M., Berliner P.R. 1999. Cali-bration of minirhizotron readings against rootlength density data obtained from soil cores.Plant and Soil 209: 201–208.
Escamilla J.A., Comerford N.B., Neary D.G. 1991.Soil-core break method to estimate pine root dis-tribution. Soil Science Society of America Journal55: 1722–1726.
Hansson A.C., Andren O. 1987. Root dynamics inbarley, lucerne and meadow fescue investigatedwith a mini-rhizotron technique. Plant and Soil103: 33–38.
Heeraman D.A., Juma N.G. 1993. A comparison ofminirhizotron, core and monolith methods forquantifying barley (Hordeum vulgare L.) and fababean (Vicia faba L.) root distribution. Plant andSoil 148: 29–41.
Hobbie S.E., Reich P.B., Oleksyn J., Ogdahl M.,Zytkowiak R., Hale C., Karolewski P. 2006. Treespecies effects on decomposition and forest floordynamics in a common garden. Ecology 87:2288–2297.
Hobbie S.E., Ogdahl M., Chorover J., Chadwick O.A.,Oleksyn J., Zytkowiak R., Reich P.B. 2007. Treespecies effects on soil organic matter dynamics:the role of soil cation composition. Ecosystems10: 999–1018.
Knight K.S., Oleksyn J., Jagodzinski A.M., Reich P.B.,Kasprowicz M. 2008. Overstory tree species regu-late colonization by native and exotic plants: asource of positive relationships betweenunderstorey diversity and invasibility. Diversityand Distributions 14: 666–675.
Pages L., Bengough A.G. 1997. Modelling minirhi-zotron observations to test experimental proce-dures. Plant and Soil 189: 81–89.
Parker C.J., Carr M.K., Jarvis, N.J., Puplampu B.O.,Lee V.H. 1991. An evaluation of the minirhi-zotron technique for estimating root distributionin potatoes. Journal of Agricultural Science 116:341–350.
40 J.M. Dauer, J.M.Withington, J. Oleksyn, J. Chorover, O.A. Chadwick, P.B. Reich, D.M. Eissenstat
Przybyl K., Karolewski P., Oleksyn J., Labedzki A.,Reich P.B. 2008. Fungal diversity of Norwayspruce litter: effects of site conditions and prema-ture leaf fall caused by bark beetle outbreak. Mi-crobial Ecology 56: 332–340.
Reich P.B., Oleksyn J., Modrzynski J., Mrozinski P.,Hobbie S.E., Eissenstat D.M., Chorover J.,Chadwick O.A., Hale C.M., Tjoelker M.G. 2005.Linking litter calcium, earthworms and soil prop-erties: a common garden test with 14 tree species.Ecology Letters 8: 811–818.
Samson B.K., Sinclair T.R. 1994. Soil core andminirhizotron comparison for the determinationof root length density. Plant and Soil 161:225–232.
Schmid I., Kazda M. 2002. Root distribution of Nor-way spruce in monospecific and mixed stands ondifferent soils. Forest Ecology and Management159: 37–47.
Smit A.L, George E., Groenwold J. 2000. Root obser-vations and measurements at (transparent) inter-
faces with soil. In: Root Methods: A Handbook.Smit A.L. et al. (eds). Springer, Berlin, pp.236–271.
Szymanski S. 1982. Growth of some forest tree spe-cies in the first 10 years on fairly poor mixed coni-fer sites. Sylwan 126(7): 11–29 [in Polish].
van Noordwijk M., Brouwer G., Meijboom F., doRosario M., Oliveira G., Bengough A.G. 2000.Trench profile techniques and core break meth-ods. In Root Methods: A Handbook. Smit A.L. etal. Springer, Berlin, pp. 211–233.
Withington J.M., Reich P.B., Oleksyn J. EissenstatD.M. 2006. Comparisons of structure and lifespan in roots and leaves among temperate trees.Ecological Monographs 76: 381–397.
Withington J.M., Elkin A.D., Bulaj B., Olesinski J.,Tracy K.N., Bouma T.J., Oleksyn J., Anderson L.J.,Modrzynski J., Reich P.B., Eissenstat D.M. 2003.The impact of material used for minirhizotrontubes for root research. New Phytologist 160:533–544.