Embed Size (px)
Citation preview
A Scalable Approach to MPI ApplicationPerformance Analysis
Shirley Moore1, Felix Wolf1, Jack Dongarra1,Sameer Shende2, Allen Malony2, and Bernd Mohr3
1 Innovative Computing Laboratory, University of Tennessee,Knoxville, TN 37996-3450 USA
{shirley, fwolf, dongarra}@cs.utk.edu2 Computer Science Department, University of Oregon,
Eugene, OR 97403-1202 USA{malony, sameer}@cs.uoregon.edu
3 Forschungszentrum Julich, ZAM, 52425 Julich, [email protected]
Abstract. A scalable approach to performance analysis of MPI applications ispresented that includes automated source code instrumentation, low overheadgeneration of profile and trace data, and database management of performancedata. In addition, tools are described that analyze large-scale parallel profile andtrace data. Analysis of trace data is done using an automated pattern-matching ap-proach. Examples of using the tools on large-scale MPI applications arepresented.
1 Introduction
Parallel computing is playing an increasingly critical role in advanced scientific re-search as simulation and computation are becoming widely used to augment and/orreplace physical experiments. However, the gap between peak and achieved perfor-mance for scientific applications running on large parallel systems has grown consid-erably in recent years. The most common parallel programming paradigm for theseapplications is to use Fortran or C with MPI message passing to implement parallelalgorithms. The complex architectures of large parallel systems present difficult chal-lenges for performance optimization of such applications. Tools are needed that col-lect and present relevant information on application performance in a scalable mannerso as to enable developers to easily identify and determine the causes of performancebottlenecks.
Performance data encompasses both profile data and trace data. Profiling involvesthe collect of statistical summaries of various performance metrics broken down byprogram entities such as routines and nested loops. Performance metrics include timeas well as hardware counter metrics such as operation counts and cache and memoryevent counts. Tracing involves collection of a timestamped sequence of events such asentering and exiting program regions and sending and receiving messages. Profilingcan identify regions of a program that are consuming the most resources, while detailed
B. Di Martino et al. (Eds.): EuroPVM/MPI 2005, LNCS 3666, pp. 309–316, 2005.c© Springer-Verlag Berlin Heidelberg 2005
310 S. Moore et al.
tracing can help identify the causes of performance problems. On large parallel systems,both profiling and tracing present scalability challenges.
Collecting either profile or trace data requires the application program to be instru-mented. Instrumentation can be inserted at various stages of the program build process,ranging from source code insertion to compile time to link time to run time options.Although many tools provide an application programmer interface (API), manual in-sertion of instrumentation library calls into application source code is too tedious tobe practical for large-scale applications. Thus our tools support a range of automatedinstrumentation options. Once an instrumented version of the program has been built,only a few environment variables need to be set to control runtime collection of profileand/or trace data.
Collecting profile data for several different metrics on a per-process and per-routinebasis, possibly for several runs with different numbers of processors and/or different testcases and/or on different platforms results in a data management problem as well as apresentation and analysis problem. Similar profile data may be collected by differenttools but be incompatible because of different data formats. Our solution to the datamanagement problems is a performance data management framework that sits on topof a relational database and provides a common profile data model as well as interfacesto various profile data collection and analysis tools. For presentation of profile data wehave developed graphical tools that display the data in 2-dimensional and 3-dimensionalgraphs. Our tools also support multi-experiment analysis of performance data collectedfrom different runs.
Event tracing is a powerful method for analyzing the performance behavior ofparallel applications. Because event traces record the temporal and spatial relation-ships between individual runtime events, they allow application developers to ana-lyze dependencies of performance phenomena across concurrent control flow. Whileevent tracing enables the identification of performance problems on a high level ofabstraction, it suffers from scalability problems associated with trace file size. Our ap-proach to improving the scalability of event tracing uses call-path profiling to determinewhich routines are relevant to the analysis to be performed and then traces only thoseroutines.
Graphical tools such as Vampir, Intel Trace Analyzer, and Jumpshot are available toview trace files collected for parallel executions. These tools typically show a time-lineview of state changes and message passing events. However, analyzing these views forperformance bottlenecks can be like searching for a needle in a haystack. Our approachsearches the trace file using pattern-matching to automatically identify instances of in-efficient behavior. The performance bottlenecks that are found and related to specificprogram call-paths and node/process/thread locations can then be focused on using oneof the previously mentioned trace file viewing tools.
The remainder of this paper is organized as follows. Section 2 describes our auto-mated approach to insertion of performance instrumentation and collection of perfor-mance data. Section 3 describes our performance data management framework. Section4 describes our scalable approaches to analyzing profile data, including techniques formulti-experiment analysis. Section 5 describes our scalable automated approach to tracefile analysis. Section 6 contains conclusions and directions for future research.
A Scalable Approach to MPI Application Performance Analysis 311
2 Automated Performance Instrumentation
TAU (Tuning and Analysis Utilities) is a portable profiling and tracing toolkit for paral-lel threaded and or message-passing programs written in Fortran, C, C++, or Java, or acombination of Fortran and C [3]. TAU can be configured to do either profiling or trac-ing or to do both simultaneously. Instrumentation can be added at various stages, fromcompile-time to link-time to run-time, with each stage imposing different constraintsand opportunities for extracting program information. Moving from source code to bi-nary instrumentation techniques shifts the focus from a language specific to a moreplatform specific approach.
Source code can be instrumented by manually inserting calls to the TAU instrumen-tation API, or by using the Program Database Toolkit (PDT) and/or the Opari OpenMPrewriting tool to insert instrumentation automatically. PDT is a code analysis frameworkfor developing source-based tools. It includes commercial grade front end parsers forFortran 77/90, C, and C++, as well as a portable intermediate language analyzer, data-base format, and access API. The TAU project has used PDT to implement a source-to-source instrumentor (tau instrumentor) that supports automatic instrumentationof C, C++, and Fortran 77/90 programs.
The TAU MPI wrapper library uses the MPI profiling interface to generate pro-file and/or trace data for MPI operations. TAU MPI tracing produces individual node-context-thread event traces that can be merged to produce SLOG, SDDF, Paraver,VTF3, or EPILOG trace formats.
TAU has filtering and feedback mechanisms for reducing instrumentation overhead.The user can specify routines that should not be instrumented in a selective instrumen-tation file. The tau reduce tool automates this specification using feedback frompreviously generated profiling data by allowing the user to specify a set of selectionrules that are applied to the data.
3 Performance Data Management Framework
TAU includes a performance data management framework, called PerfDMF, that is ca-pable of storing parallel profiles for multiple performance experiments. The perfor-mance database architecture consists of three components: performance data input,database storage, database query, and analysis. The performance profiles resident in thedatabase are organized in a hierarchy of applications, experiments, and trials. Applica-tion performance studies are seen as constituting a set of experiments, each representinga set of associated performance measurements. A trial is a measurement instance of anexperiment. Raw TAU profiles are read by a profile translator and stored in the database.The performance database is an object-relational DBMS specified to provide a standardSQL interface for performance information query. MySQL, PostgreSQL, or Oracle canbe used for the database implementation. A performance database toolkit developedwith Java provides commonly used query and analysis utilities for interfacing perfor-mance analysis tools. ParaProf (described in the next section) is one of the tools capableof using this high-level interface for performance database access. Other performanceanalysis tools that have been interfaced with PerfDMF include mpiP, Dynaprof, HPM,gprof, and KOJAK.
312 S. Moore et al.
4 Scalable Display and Analysis of Profile Data
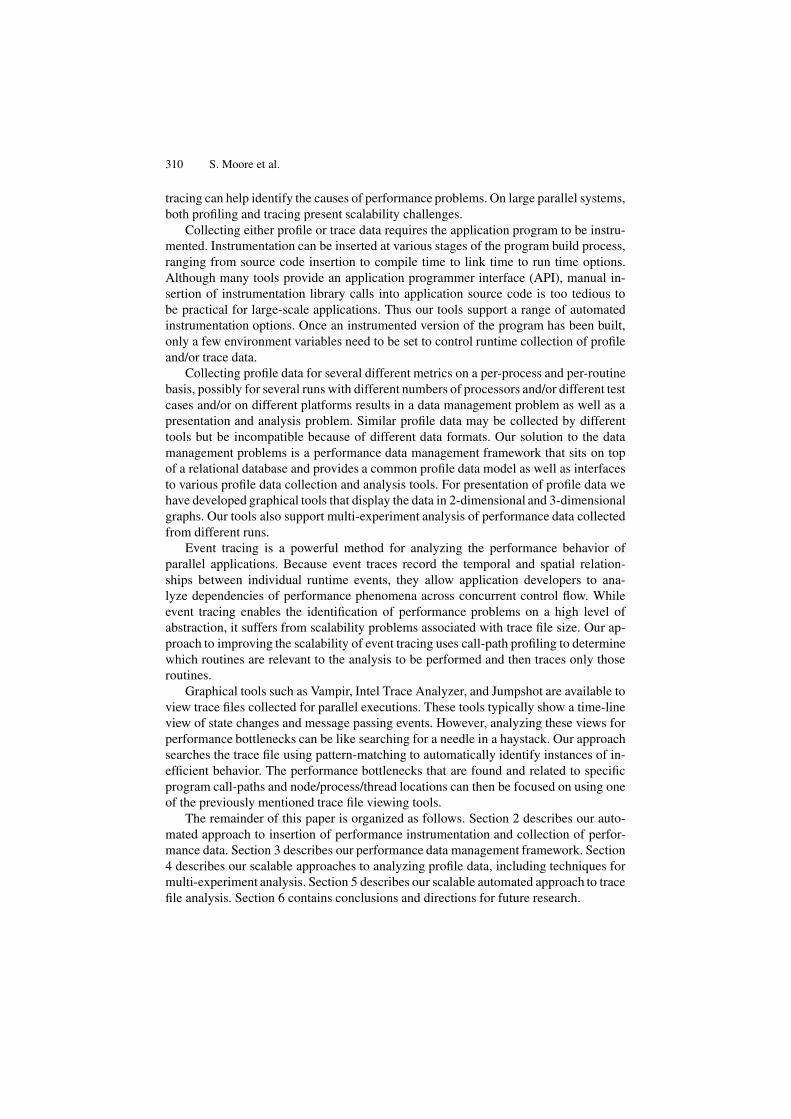
ParaProf is a graphical parallel profile analyzer that is part of the TAU toolkit. Figure 1shows the ParaProf framework architecture. Analysis of performance data requires rep-resentations from a very fine granularity, perhaps of a single event on a single node, todisplays of the performance characteristics of the entire application. ParaProf’s currentset of displays range from purely textual based to fully graphical. Many of the displaytypes are hyper-linked enabled, allowing selections to be reflected across currently openwindows.
(Java event model)
Event System
Acc
ess Profile Management
Displays
Profile Data Model
(node, context, thread)
Dat
abas
eFi
le S
yste
mA
cces
sD
irec
t fro
mA
pplic
atio
n
AP
I
Fig. 1. ParaProf Architecture
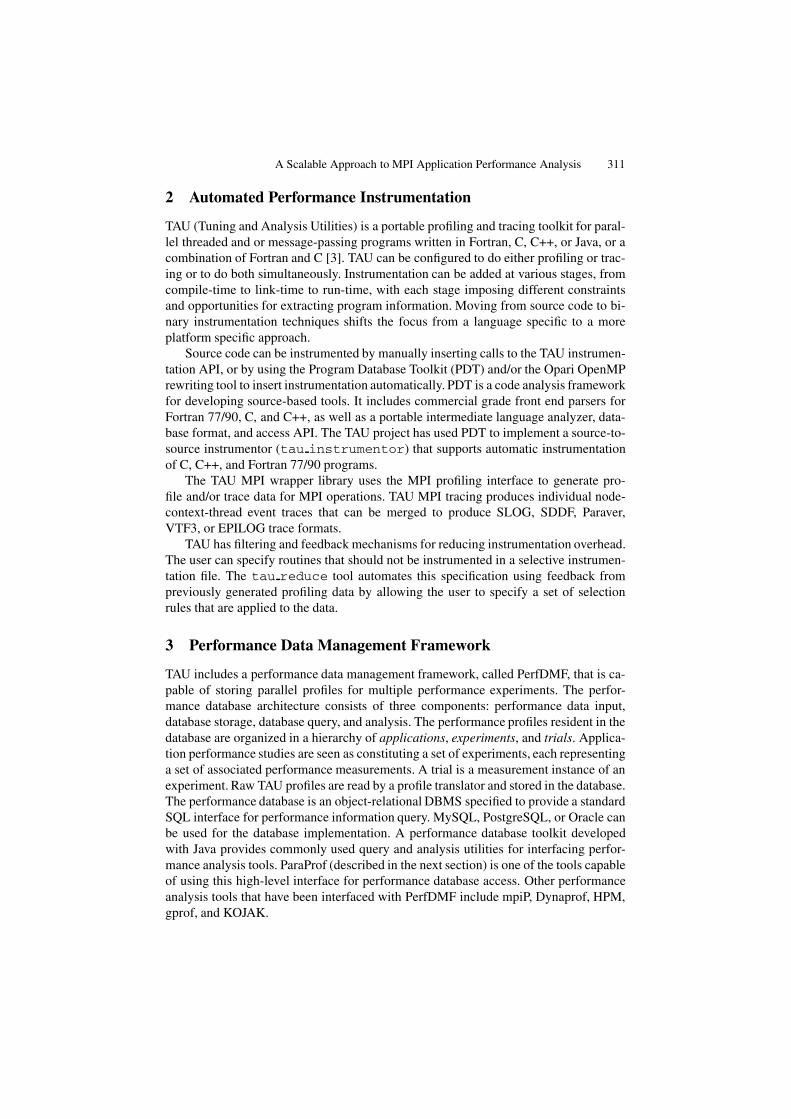
Fig. 2. Scalable Miranda Profile Display
A Scalable Approach to MPI Application Performance Analysis 313
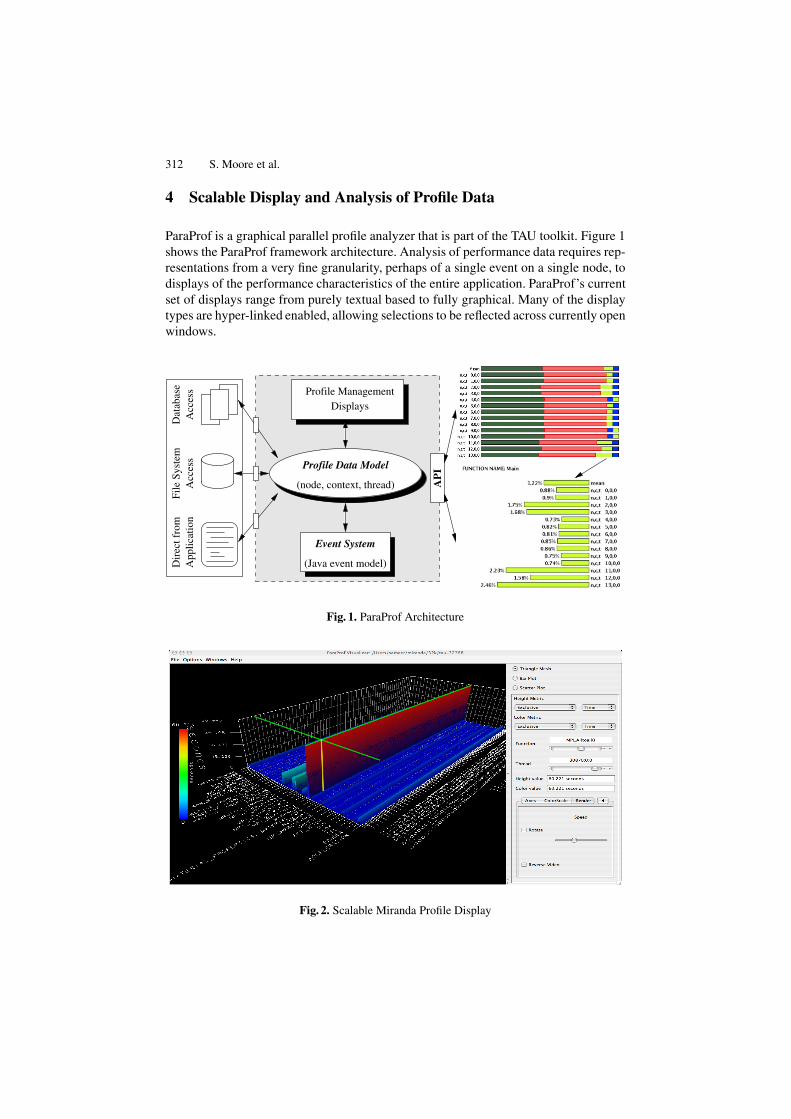
Fig. 3. 3-D Scatter Plot of Performance Metrics for 32K Miranda Processes
Recently, the TAU project has focused on how to measure and analyze larg-scale ap-plication performance data. A significant amount of performance data can be generatedfor large processor runs. We have been experimenting with three-dimensional displaysof large-scale performance data. For instance, Figure 2 shows the entire parallel pro-file measurement for a 32K processor run. The performance events (i.e., functions) arealong the x-axis, the threads are along the y-axis, and the performance metric (in thiscase, the exclusive execution time) is along the z-axis. This full performance view en-ables the user to quickly identify major performance contributors. Figure 3 is of thesame dataset, but in this case each thread is shown as a sphere at a coordinate pointdetermined by the relative exclusive execution time of three significant events. The vi-sualization gives a way to see clustering relationships.
5 Automated Analysis of Trace Data
KOJAK is an automatic performance evaluation system for parallel applications thatrelieves the user from the burden of searching large amounts of trace data manually byautomatically looking for inefficient communication patterns that force processes intoundesired wait states. KOJAK can be used for MPI, OpenMP, and hybrid applicationswritten in C/C++ or Fortran. It includes tools for instrumentation, event-trace genera-tion, and post-processing of event traces plus a generic browser to display the analysisresults. The instrumentation tools complement those supplied by TAU.
After program termination, the trace file is analyzed offline using EXPERT [5],which identifies execution patterns indicating low performance and quantifies them ac-cording to their severity. These patterns target problems resulting from inefficient com-munication and synchronization as well as from low CPU and memory performance.
314 S. Moore et al.
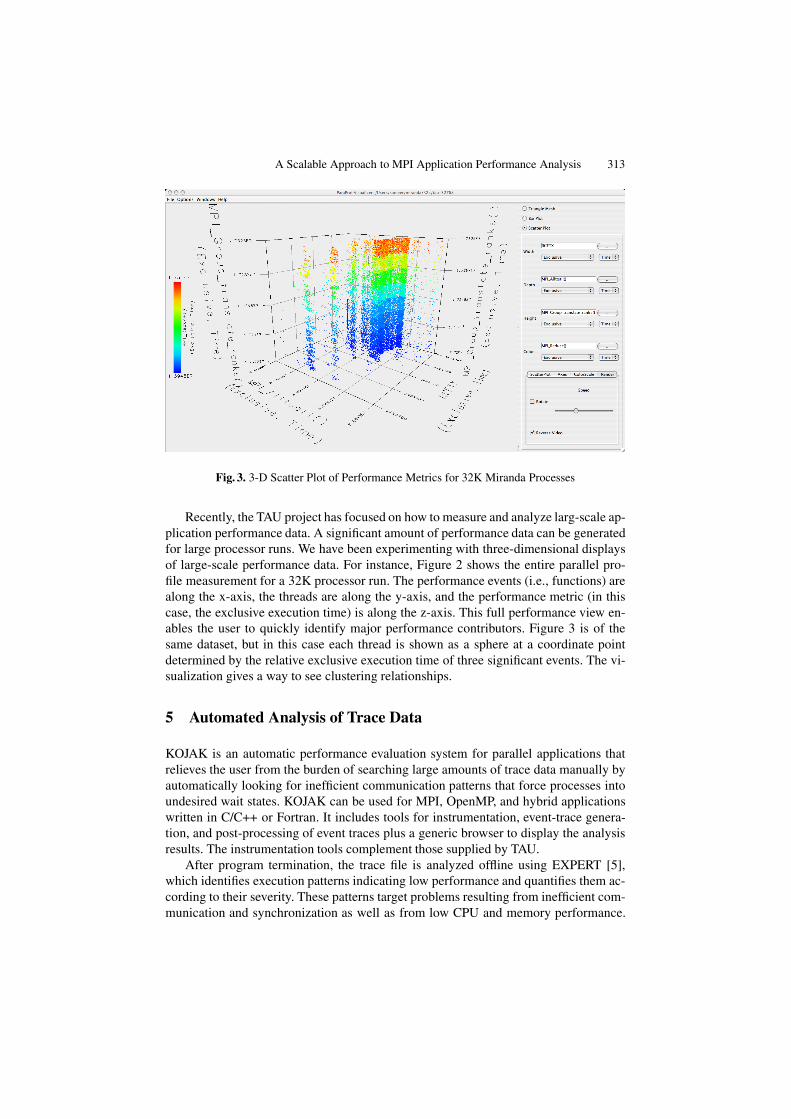
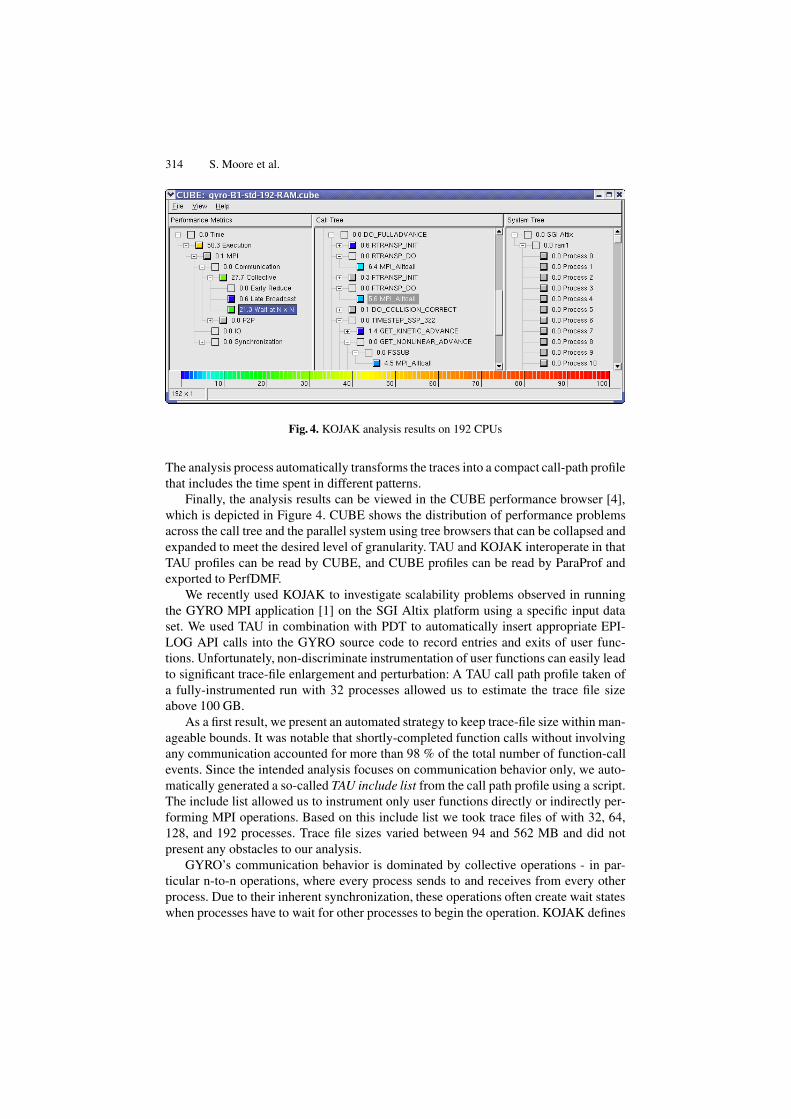
Fig. 4. KOJAK analysis results on 192 CPUs
The analysis process automatically transforms the traces into a compact call-path profilethat includes the time spent in different patterns.
Finally, the analysis results can be viewed in the CUBE performance browser [4],which is depicted in Figure 4. CUBE shows the distribution of performance problemsacross the call tree and the parallel system using tree browsers that can be collapsed andexpanded to meet the desired level of granularity. TAU and KOJAK interoperate in thatTAU profiles can be read by CUBE, and CUBE profiles can be read by ParaProf andexported to PerfDMF.
We recently used KOJAK to investigate scalability problems observed in runningthe GYRO MPI application [1] on the SGI Altix platform using a specific input dataset. We used TAU in combination with PDT to automatically insert appropriate EPI-LOG API calls into the GYRO source code to record entries and exits of user func-tions. Unfortunately, non-discriminate instrumentation of user functions can easily leadto significant trace-file enlargement and perturbation: A TAU call path profile taken ofa fully-instrumented run with 32 processes allowed us to estimate the trace file sizeabove 100 GB.
As a first result, we present an automated strategy to keep trace-file size within man-ageable bounds. It was notable that shortly-completed function calls without involvingany communication accounted for more than 98 % of the total number of function-callevents. Since the intended analysis focuses on communication behavior only, we auto-matically generated a so-called TAU include list from the call path profile using a script.The include list allowed us to instrument only user functions directly or indirectly per-forming MPI operations. Based on this include list we took trace files of with 32, 64,128, and 192 processes. Trace file sizes varied between 94 and 562 MB and did notpresent any obstacles to our analysis.
GYRO’s communication behavior is dominated by collective operations - in par-ticular n-to-n operations, where every process sends to and receives from every otherprocess. Due to their inherent synchronization, these operations often create wait stateswhen processes have to wait for other processes to begin the operation. KOJAK defines
A Scalable Approach to MPI Application Performance Analysis 315
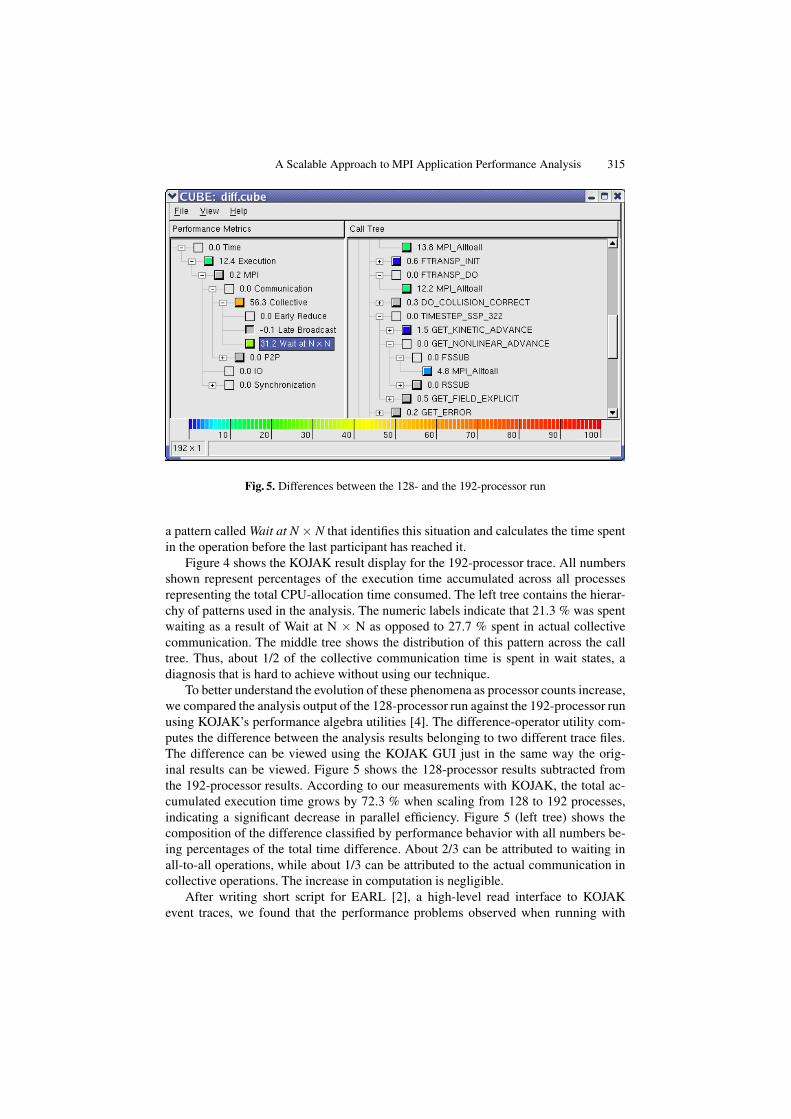
Fig. 5. Differences between the 128- and the 192-processor run
a pattern called Wait at N × N that identifies this situation and calculates the time spentin the operation before the last participant has reached it.
Figure 4 shows the KOJAK result display for the 192-processor trace. All numbersshown represent percentages of the execution time accumulated across all processesrepresenting the total CPU-allocation time consumed. The left tree contains the hierar-chy of patterns used in the analysis. The numeric labels indicate that 21.3 % was spentwaiting as a result of Wait at N × N as opposed to 27.7 % spent in actual collectivecommunication. The middle tree shows the distribution of this pattern across the calltree. Thus, about 1/2 of the collective communication time is spent in wait states, adiagnosis that is hard to achieve without using our technique.
To better understand the evolution of these phenomena as processor counts increase,we compared the analysis output of the 128-processor run against the 192-processor runusing KOJAK’s performance algebra utilities [4]. The difference-operator utility com-putes the difference between the analysis results belonging to two different trace files.The difference can be viewed using the KOJAK GUI just in the same way the orig-inal results can be viewed. Figure 5 shows the 128-processor results subtracted fromthe 192-processor results. According to our measurements with KOJAK, the total ac-cumulated execution time grows by 72.3 % when scaling from 128 to 192 processes,indicating a significant decrease in parallel efficiency. Figure 5 (left tree) shows thecomposition of the difference classified by performance behavior with all numbers be-ing percentages of the total time difference. About 2/3 can be attributed to waiting inall-to-all operations, while about 1/3 can be attributed to the actual communication incollective operations. The increase in computation is negligible.
After writing short script for EARL [2], a high-level read interface to KOJAKevent traces, we found that the performance problems observed when running with
316 S. Moore et al.
192 CPUs happen in relatively small communicators not exceeding a size of 16. Al-though this information was not yet sufficient to remove the performance problem, itallowed us to pose the question about it more clearly by showing the evolution of hard-to-diagnose performance behavior (i.e., wait states) in a way that cannot be done usingtraditional tools.
Future work will investigate the reason for the increased waiting and communica-tion times and try to clarify whether there is a relationship between both phenomena.Since the code scales well on other platforms, platform rather than application charac-teristics might play a role.
6 Conclusions and Future Work
TAU provides an extensible framework for performance instrumentation, measurement,and analysis. KOJAK provides an automated approach to analysis of large-scale eventtraces. The benefits of our research include automated trace-size reduction and auto-mated analysis of hard-to-diagnose performance behavior. However, further work isneeded on integrating profile and trace data analysis and on supporting additional toolssuch as multivariate statistical analysis tools. Further work is also needed to process thetrace files in a distributed parallel manner in order to scale to terascale and petascalesystems of the future.
Acknowledgements
This research is supported at the University of Tennessee by the U.S. Department of En-ergy, Office of Science contract DE-FC02-01ER25490, and at the University of Oregonby the U.S. Department of Energy, Office of Science contract DE-FG02-05ER25680.
References
1. J. Candy and R. Waltz. An Eulerian gyrokinetic Maxwell solver. J. Comput. Phys., 186:545,2003.
2. N. Bhatia F. Wolf. EARL - API Documentation. Technical Report ICL-UT-04-03, Universityof Tennessee, Innovative Computing Laboratory, October 2004.
3. S. S. Shende. The Role of Instrumentation and Mapping in Performan ce Measurement. PhDthesis, University of Oregon, August 2001.
4. F. Song, F. Wolf, N. Bhatia, J. Dongarra, and S. Moore. An Algebra for Cross-ExperimentPerformance Analys is. In Proc. of the International Conference on Parallel Processing (ICPP), Montreal, Canada, August 2004.
5. F. Wolf, B. Mohr, J. Dongarra, and S. Moore. Efficient Pattern Search in Large Traces throughSuccessive Refinement. In Proc. of the European Conference on Parallel Computing (Euro-Par), Pisa, Italy, August - September 2004.