Embed Size (px)
Citation preview
PhUSE 2013
1
Paper CS03
A SAS Macro to Generate High Quality Enhanced Kaplan-Meier Plots using Graphic Template Language
Konrad Żywno, inVentiv Health Clinical, Berlin, Germany Bartosz Kutyła, SAS Institute, Warsaw, Poland
ABSTRACT Kaplan-Meier plots are commonly used in the pharmaceutical industry to analyse time to event data. Since SAS® 9.2 it has been possible to create high quality graphs using the newly introduced Graphic Template Language (GTL). Although it is possible to create Kaplan-Meier plots directly from the SAS/STAT® LIFETEST procedure reviewers very often ask for additional information to be presented on a figure, but this kind of customisation may be not possible with the LIFETEST procedure. This paper presents a user friendly macro which enables highly customised and high quality Kaplan-Meier plots to be produced using GTL and the TEMPLATE procedure. Furthermore the macro makes use of the annotation facility introduced to GTL in SAS 9.3 which allows even more customisation of a figure’s appearance, which should satisfy even the most demanding of reviewers.
INTRODUCTION
With first release of Graphic Template Language (GTL), in SAS 9.2, programmers gained a new way of producing graphics based on templates. This new way of programming renders most macros and related tools obsolete; some of these will need to be reworked to make use of the new technology, but others will no longer be necessary. A significant advantage of GTL is that it permits the user to customise the graphics produced by statistical procedures. These procedures do, admittedly, have many options for the direct generation of graphics, but the potential for customisation was always limited. This paper demonstrates how GTL can be used to overcome the limitations of Kaplan-Meier plots generated by the LIFETEST procedure. It presents a user-friendly macro that generates high quality enhanced figures from output data produced by the procedure. The first section of the paper presents the requirements for the input dataset together with a description of the variables used to produce the graphic and a dummy dataset used later in the presentation. Starting with the default figure produced by the procedure, we consider possible requests from reviewers that would lead to enhancements. The following sections present the macro and discuss some its aspects. The macro allows the user to:
- change axis labels - set the legend - change the appearance of censor markers and line patterns - change the tick values - set titles and footnotes - annotate the graphic, for instance with statistical values (annotation was introduced for GTL in SAS 9.3, but the
macro makes use of new features in SAS 9.4) The macro code includes comments to facilitate understanding of the code and future use by interested programmers.
DATASET REQUIERMENTS The macro presented in this paper was created to use a CDISC TTE dataset but it can easily be used, without any adaptation, with datasets conforming to other data standards so long as they contain the required variables and the variables can be passed to the macro as parameters. The variables are as follows:
A variable containing time to event value. The macro parameter is var and AVAL is set as the default - var = aval.
A variable containing censor and event information. The macro parameter is censor and the default is CNSR – censor = cnsr.
The censor_value parameter contains the value of a censored record for the variable given in the censor parameter. The default value is 1 – censor_value = 1.
A grouping variable. This is not an obligatory variable and is defined by the group_var macro parameter. No default value is set.
We have created a dummy ADTTE dataset for demonstration purposes using the code from appendix 1. It fulfils CDISC requirements and contains all variables necessary to produce a Kaplan-Meier plot. These variables are AVAL and CNSR together with TRTAN which is used for grouping purposes in the examples.
FIGURES DIRECTLY FROM THE LIFETEST PROCEDURE To produce a Kaplan-Meier figure directly from the LIFETEST procedure only the PLOTS=survival option needs to be added.
PhUSE 2013
2
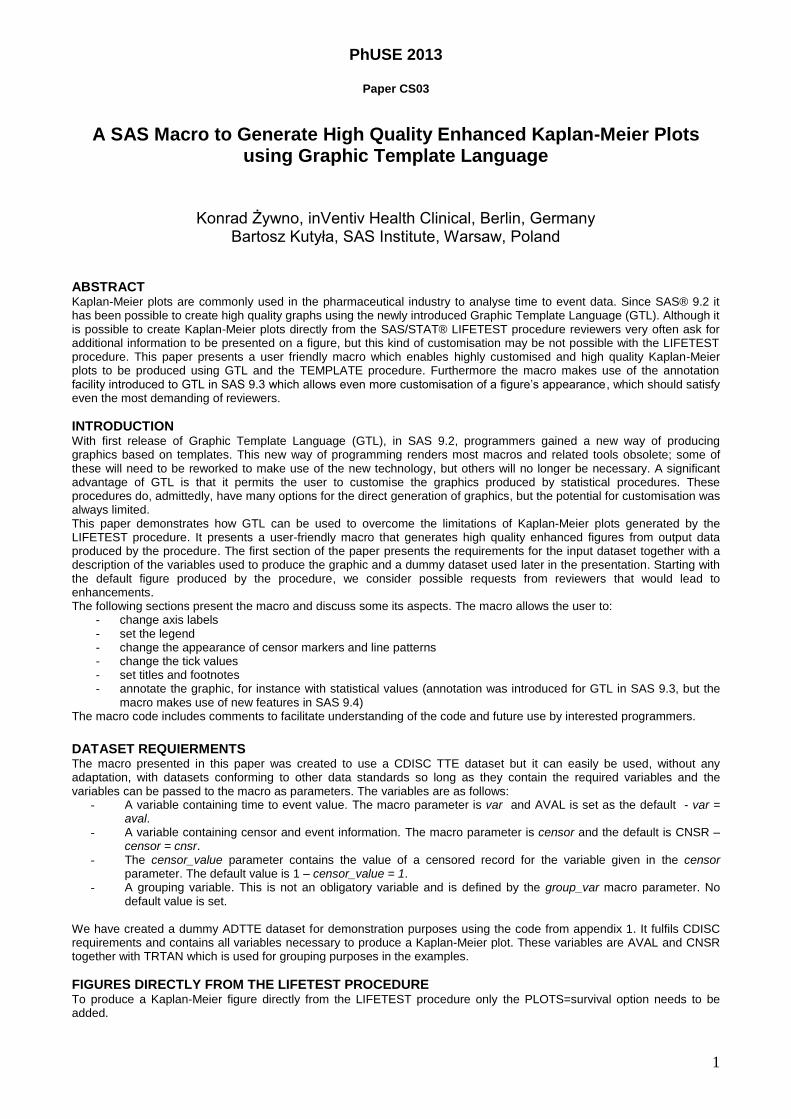
PROC LIFETEST DATA=adtte METHOD=KM PLOTS=survival;
TIME aval*cnsr(1);
STRATA trtan;
RUN;
Figure 1: Default Kaplan-Meier Plot The figure looks very nice at first glance, but it is difficult to imagine how to make changes using the procedure. How can we change the title, the footnote or the axis labels? What about the tick list? How can we change the colour to black to meet regulatory or other requirements? How can we change the shape of the legend? What about the line patterns or the appearance of the censor markers? Is it easy to do these things using options in the LIFETEST procedure? The answer is no in all cases. This is the motivation for developing a macro that will allow these changes to be made easily.
POSSIBILITIES FOR ENHANCING GRAPHICS Reviewers may request various enhancements to the plot. These enhancements are either not possible via the LIFETEST procedure or may require a change to the default template used by the LIFETEST procedure. An alternative method, as used in this paper, is a self made macro template. Macro templates allow for a high level of customisation and allow us to fulfil most reviewer requirements. The macro allows changes to titles, footnotes, axis labels, tick values, markers for censor values and line patterns. It also allows the user to set the legend and to annotate the graphic with a user defined dataset. The code for the entire macro is in appendix 2. In the subsections below different parts of the macro used to fulfil reviewers’ expectations are discussed.
USER DEFINED TEMPLATE
To produce a graphic from a template, we need output data from the LIFETEST procedure giving estimates of the survival function for all strata. In order to produce the dataset, we need to call the LIFETEST procedure with the options METHOD= KM and OUTSURV= option. PROC LIFETEST DATA=_km_temp_indat METHOD=KM outsurv= _km_temp_LTEstimates;
TIME &var. * &censor.(&censor_value.);
STRATA &group_var.;
RUN;
The dataset with the calculated survival function from the procedure needs to be customised a little, because it does not contain values of the survival function for all time points. Moreover, we also need to create a separate variable with the value of the survival function for censored observations.
DATA _km_temp_surv;
SET _km_temp_LTEstimates;
RETAIN prevsurv;
PhUSE 2013
3
IF ~missing(survival) THEN DO;
surv=survival;
END;
ELSE DO;
surv=prevsurv;
END;
IF ~missing(survival) THEN prevsurv = survival;
IF _censor_ = &censor_value. THEN cencsurv = surv;
RUN;
After performing these changes in the output dataset, we can call the template procedure to draw a graph. Within a STORE option we define where the template is stored. The STEPPLOT statement draws the left justified lines on the plot and the SCATTERPLOT statement draws censor markers. Names to these statements are given by the NAME= option for further assignment of the legend. PROC TEMPLATE;
DEFINE STATGRAPH temp/ STORE=work.temp_graph;
BEGINGRAPH;
LAYOUT OVERLAY / XAXISOPTS=( TYPE=linear )
YAXISOPTS=(TYPE=linear)
X2AXISOPTS=( display=none TYPE=auto )
Y2AXISOPTS=( display=none TYPE=auto );
STEPPLOT X=&var. Y=surv / primary=true Group=&group_var. Justify=Left NAME="STEP";
;
SCATTERPLOT X=&var. Y=cencsurv/ Group=&group_var. NAME="SCATTER";
;
...
ENDLAYOUT;
ENDGRAPH;
RUN;
SETTING TITLES AND FOOTNOTES
It is not as easy to set titles or footnotes for the graphic as it was before the introduction of GTL, because they now need to be set within the TEMPLATE procedure. The macro allows titles to be set in open code, but it now needs to search for them in a dictionary table. The macro also allows them to be set as parameters tit1 – tit10 and foot1 – foot10. Titles and footnotes given as parameters to the macro have priority over titles and footnotes set globally. They are all left aligned, and the macro also supports blank titles and footnotes. Within a TEMPLATE procedure titles and footnotes are set in the ENTRYTITLE and ENTRYFOOTNOTE statements respectively: PROC TEMPLATE;
DEFINE STATGRAPH temp/ STORE=work.temp_graph;
BEGINGRAPH;
ENTRYTITLE halign=left textattrs=graphvaluetext "title 1-10" ;
ENTRYFOOTNOTE halign=left textattrs=graphvaluetext "footnote 1-10" ;
...
ENDGRAPH;
RUN;
CHANGING THE AXIS LABELS
Axis labels are defined in options provided by the TEMPLATE procedure. They are given to the macro as x_label and y_label parameters, for the x and y-axes respectively. LAYOUT OVERLAY / XAXISOPTS=( LABEL="&x_label.")
YAXISOPTS=( LABEL="&y_label.")
CHANGING THE TICK VALUES
The macro allows for user defined changes in the tick values for both the x- and y-axes. They can be given as lists to the x_tick_list and y_tick_list parameters respectively. It is also possible to pass minimum and maximum values together with a step between ticks as parameters. The parameters for the x-axis are: x_tick_min, x_tick_max and x_tick_by, and the y-axis: y_tick_min, y_tick_max and y_tick_by. The macro prepares a tick list automatically from these parameters. It is
worth noting that an explicit tick list takes priority over one prepared from minimum, maximum and step values. If the user does not wish to think about tick lists and the values appropriate for a particular graphic they can set the value of the y_tick_list or x_tick_list parameter to AUTO and the macro will set it automatically. This functionality produces ten tick values depending on the data and shows them as ticks on the respective axes. The macro calculates an offset of 5% at the end of each axis in order to present the axes in a more attractive way. The offset is calculated as follows: %LOCAL x_viewmax;
%LET x_viewmax=%sysevalf(&x_tick_max. + (&x_tick_max. - &x_tick_min.)*0.05);
%LOCAL y_viewmax;
%LET y_viewmax=%sysevalf(&y_tick_max. + (&y_tick_max. - &y_tick_min.)*0.05);
PhUSE 2013
4
If a tick list is given as a parameter, then x_tick_max, x_tick_min, y_tick_max and y_tick_min are calculated from the list
as follows: %LET y_tick_min= %scan(&y_tick_list.,1,%str( ));
%LET y_tick_max= %scan(&y_tick_list.,-1,%str( ));
%LET x_tick_min= %scan(&x_tick_list.,1,%str( ));
%LET x_tick_max= %scan(&x_tick_list.,-1,%str( ));
When both tick values and offset values are calculated and ready for use they can be easily used within the TEMPLATE procedure’s LAYOUT statement.
PROC TEMPLATE;
...
LAYOUT OVERLAY /
XAXISOPTS=(TYPE=linear
linearopts=(tickvaluelist=(&x_tick_list.) viewmin=&x_tick_min. viewmax=&x_viewmax.))
YAXISOPTS=(TYPE=linear
linearopts=(tickvaluelist=(&y_tick_list.) viewmin=&y_tick_min. viewmax=&y_viewmax.))
X2AXISOPTS=(display=none TYPE=auto)
Y2AXISOPTS=(display=none TYPE=auto);
...
ENDLAYOUT;
...
RUN;
CHANGING THE CENSOR VALUE MARKERS AND LINE PATTERNS
To change the appearance of censor markers and line patterns, the macro needs to change the default style in the DEFINE STYLE section of the TEMPLATE procedure.The macro loops through all distinct values in the grouping variable given in the parameter group_var (the number of groups is stored in the macro variable num_group_var) and changes the marker symbols and line patterns to those given in the parameters censor_markers and line_patterns respectively. An additional way of setting these parameters is with AUTO, which is also the default, so that the macro will set these parameters automatically. The colour is set to black as it is the standard within the industry to prepare only black and white documents for regulatory purposes. These colours can nonetheless be changed in the same way as the censor markers and line patterns. PROC TEMPLATE;
DEFINE STYLE Styles.temp_groups;
parent=Styles.LISTING;
STYLE ColorStyles / "c1" = BLACK;
STYLE FillStyles / "f1" = BLACK;
%LOCAL i_group;
%DO i_group=1 %TO &num_group_var.;
replace GraphData&i_group. /
MarkerSymbol="&&censor_marker_&i_group.."
LineStyle=&&line_pattern_&i_group..
Color = FillStyles("f1") ContrastColor = ColorStyles("c1");
%END;
END;
...
RUN;
SETTING THE LEGEND
By default the legend is “discrete”, meaning that it provides separate graphical symbols for line patterns and censor markers together with an explanation. Since SAS 9.3, however, there is the possibility of a “merged” legend which maps a line pattern to response values. The macro provides this functionality when the macro parameter merged_legend is set to YES. The legend is shown at the bottom of the figure. If it is discrete then it contains two columns. The line pattern is presented in one column and the censor marker in the other. The macro automatically sets the title of the legend to the label of the analysed variable given in the var parameter. PROC TEMPLATE;
...
LAYOUT OVERLAY /
STEPPLOT X=&var. Y=surv / ... NAME="STEP";
PhUSE 2013
5
SCATTERPLOT X=&var. Y=cencsurv/ ... NAME="SCATTER";
%IF &merged_legend. = YES %THEN %DO;
MergedLegend "STEP" "SCATTER" / title="&group_var_label." across=1 valign=bottom;
%END;
%ELSE %DO;
DiscreteLegend "STEP" "SCATTER"/ title="&group_var_label." across=2 down=&num_group_var.
valign=bottom order=columnmajor;
%END;
...
RUN;
ANNOTATING THE GRAPHIC
Since SAS 9.3 it is possible to annotate graphics using GTL. Furthermore, SAS 9.4 introduced a new option, SGANNO, to the SGRENDER procedure permitting the use of annotation datasets. The SGRENDER procedure generates graphic outputs from templates created with GTL. By using the SGANNO option, users can specify the name of a dataset which includes annotation instruction and options. The annotation dataset is used only if the ANNOTATE statement is included within the TEMPLATE procedure; if so, the instructions are read and applied to the output figure. The last decision to be made is where to put the annotation. If the decision is to put it in the margin then the pad option has to be set. The PAD option specifies the size of the margin inside the figure’s border. The macro uses two parameters for annotation purpose: ANNOTATE (YES|NO) – specifies whether the annotation should be performed or not. The default value is NO. Within the
macro the SAS version is checked; if it is lower than 9.4 then the annotation will not be used (it is reset to NO). %IF &annotate.=YES and %sysevalf(&sysver.) lt 9.4 %THEN %DO;
%PUT %STR(IN)FO: To use annotation functionality SAS version must be higher than 9.3. Will
set annotate parameter to NO.;
%LET annotate= NO;
%END;
ANNO_DS (AUTO|user’s dataset) – specifies the annotation dataset. If AUTO is chosen then the Equality tests over Strata are placed in the margin(see Figure 2 below), but this is only done if the strata variable is defined and it contains at least two distinct values (_check_strata macro variable contains that information). If it is not defined then group_var is set to _km_temp_group_var. If the user chooses to provide a dataset then the macro checks for its existence and uses it for annotation. If it does not exist then the parameter is reset to AUTO and the figure is annotated with the Equality tests over Strata.
%IF %sysfunc(exist(&anno_ds))=0 AND &anno_ds. NE AUTO AND &annotate. EQ YES %THEN %DO;
%PUT %STR(IN)FO: Annotation dataset not specified or does not exist. AUTO will be used.;
%LET anno_ds=AUTO;
%IF &annotate.=YES and (&group_var. = _km_temp_group_var or &_check_strat. lt 2) %THEN
%DO;
%PUT %STR(IN)FO:AUTO annotation is used only if the group_var is set.
%LET annotate= NO;
%END;
After all checks have been performed the TEMPLATE and SGRENDER procedures continue as follows: PROC TEMPLATE;
...
BEGINGRAPH %IF &annotate. EQ YES and &anno_ds. = AUTO %THEN %DO; / pad=( right=40%) %END;;
...
LAYOUT OVERLAY
...
%IF &annotate. EQ YES %THEN %DO; annotate %END;;
ENDLAYOUT;
ENDGRAPH;
END;
RUN;
PROC SGRENDER DATA=_km_temp_surv TEMPLATE=temp %IF &annotate. EQ YES %THEN %DO;
sganno=&anno_ds. %END;;
RUN;
PhUSE 2013
6
FURTHER MACRO PARAMETERS AND WAYS OF ENHANCING THE FIGURE
The macro also provides the possibility of changing the format of the figure’s output file using the figure_format parameter; the default value is PNG. The user can also set the destination where the graphic is stored using the parameter file_path and the name of the figure via the parameter filename.
EXAMPLE MACRO CALLS
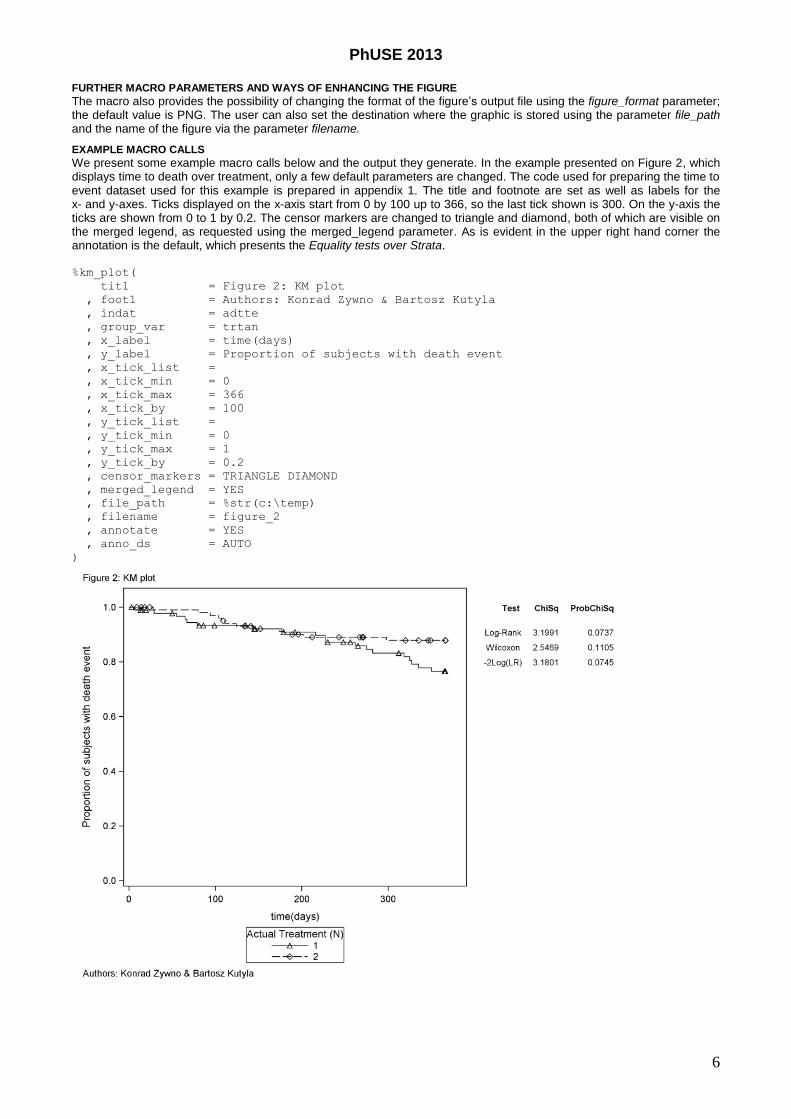
We present some example macro calls below and the output they generate. In the example presented on Figure 2, which displays time to death over treatment, only a few default parameters are changed. The code used for preparing the time to event dataset used for this example is prepared in appendix 1. The title and footnote are set as well as labels for the x- and y-axes. Ticks displayed on the x-axis start from 0 by 100 up to 366, so the last tick shown is 300. On the y-axis the ticks are shown from 0 to 1 by 0.2. The censor markers are changed to triangle and diamond, both of which are visible on the merged legend, as requested using the merged_legend parameter. As is evident in the upper right hand corner the annotation is the default, which presents the Equality tests over Strata. %km_plot(
tit1 = Figure 2: KM plot
, foot1 = Authors: Konrad Zywno & Bartosz Kutyla
, indat = adtte
, group_var = trtan
, x_label = time(days)
, y_label = Proportion of subjects with death event
, x_tick_list =
, x_tick_min = 0
, x_tick_max = 366
, x_tick_by = 100
, y_tick_list =
, y_tick_min = 0
, y_tick_max = 1
, y_tick_by = 0.2
, censor_markers = TRIANGLE DIAMOND
, merged_legend = YES
, file_path = %str(c:\temp)
, filename = figure_2
, annotate = YES
, anno_ds = AUTO
)
PhUSE 2013
7
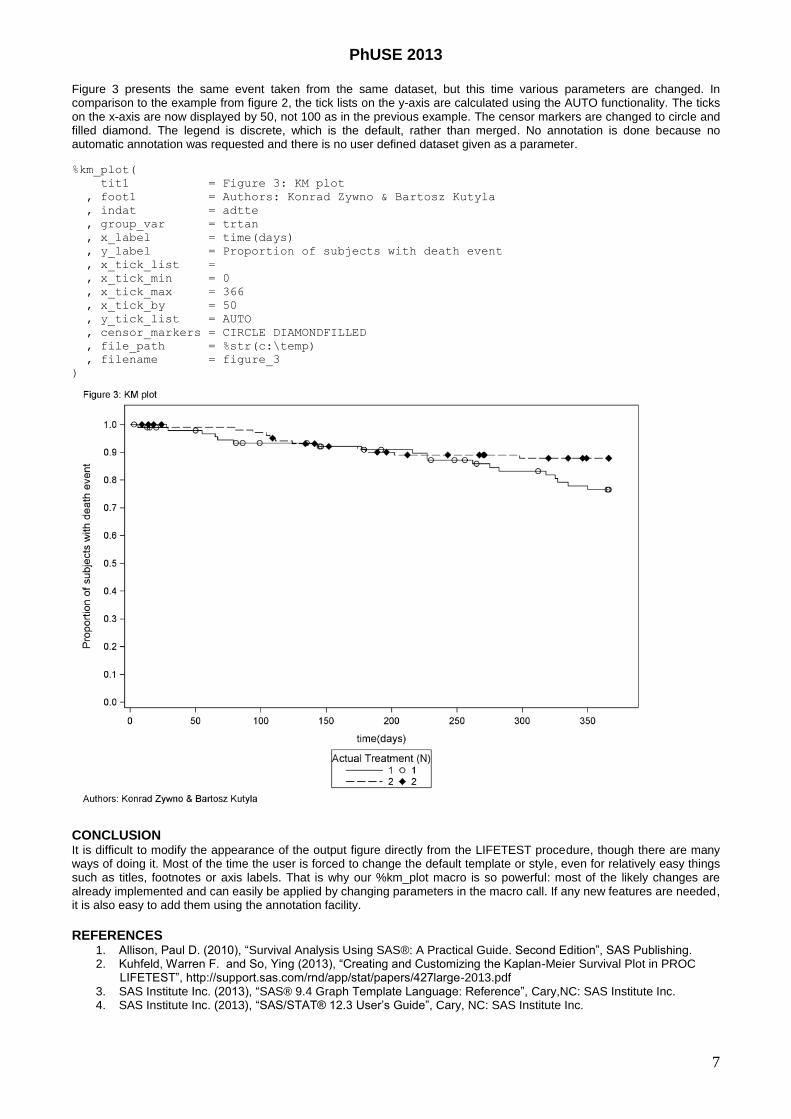
Figure 3 presents the same event taken from the same dataset, but this time various parameters are changed. In comparison to the example from figure 2, the tick lists on the y-axis are calculated using the AUTO functionality. The ticks on the x-axis are now displayed by 50, not 100 as in the previous example. The censor markers are changed to circle and filled diamond. The legend is discrete, which is the default, rather than merged. No annotation is done because no automatic annotation was requested and there is no user defined dataset given as a parameter.
%km_plot(
tit1 = Figure 3: KM plot
, foot1 = Authors: Konrad Zywno & Bartosz Kutyla
, indat = adtte
, group_var = trtan
, x_label = time(days)
, y_label = Proportion of subjects with death event
, x_tick_list =
, x_tick_min = 0
, x_tick_max = 366
, x_tick_by = 50
, y_tick_list = AUTO
, censor_markers = CIRCLE DIAMONDFILLED
, file_path = %str(c:\temp)
, filename = figure_3
)
CONCLUSION It is difficult to modify the appearance of the output figure directly from the LIFETEST procedure, though there are many ways of doing it. Most of the time the user is forced to change the default template or style, even for relatively easy things such as titles, footnotes or axis labels. That is why our %km_plot macro is so powerful: most of the likely changes are already implemented and can easily be applied by changing parameters in the macro call. If any new features are needed, it is also easy to add them using the annotation facility.
REFERENCES 1. Allison, Paul D. (2010), “Survival Analysis Using SAS®: A Practical Guide. Second Edition”, SAS Publishing. 2. Kuhfeld, Warren F. and So, Ying (2013), “Creating and Customizing the Kaplan-Meier Survival Plot in PROC
LIFETEST”, http://support.sas.com/rnd/app/stat/papers/427large-2013.pdf 3. SAS Institute Inc. (2013), “SAS® 9.4 Graph Template Language: Reference”, Cary,NC: SAS Institute Inc. 4. SAS Institute Inc. (2013), “SAS/STAT® 12.3 User’s Guide”, Cary, NC: SAS Institute Inc.
PhUSE 2013
8
CONTACT INFORMATION
Your comments and questions are valued and encouraged. Contact the author at:
Konrad Zywno, M.Sc.
inVentiv Health Clinical
Joachimstaler Str. 10-12
10719 Berlin Germany
Email: [email protected]
Or co-author at:
Bartosz Kutyla
SAS Institute
ul. Gdańska 27/31
01-633 Warszawa Poland
Email: [email protected]
PhUSE 2013
9
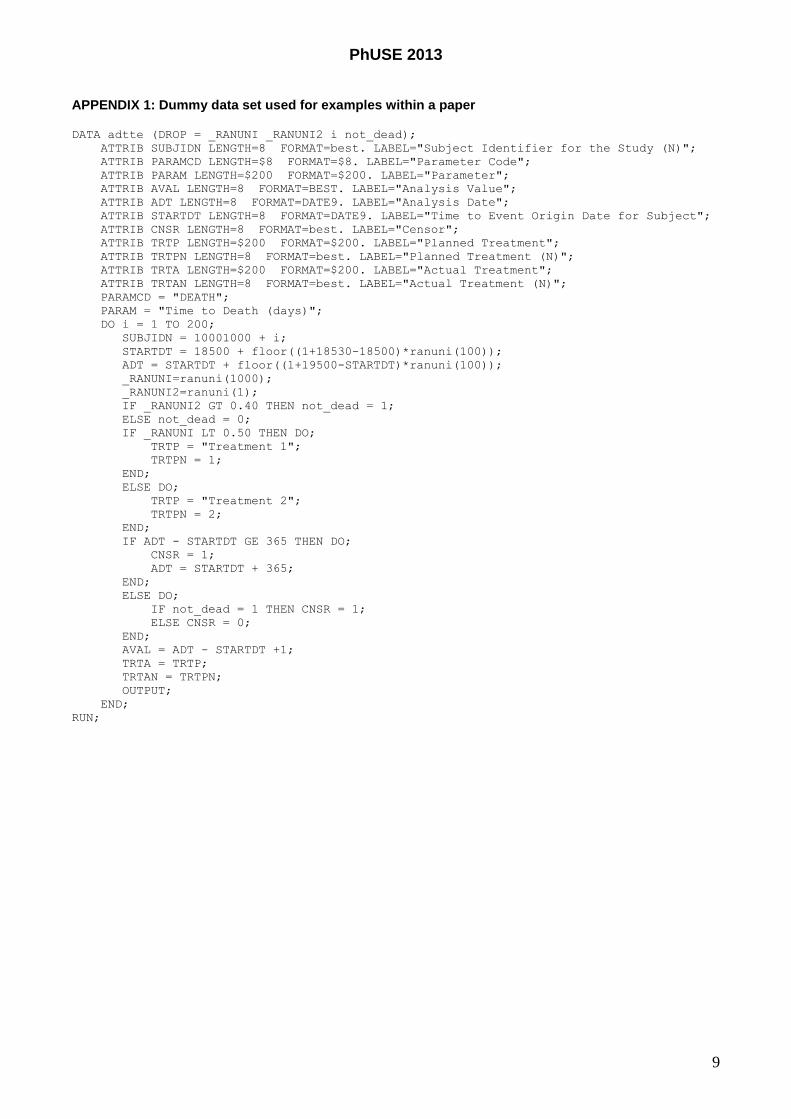
APPENDIX 1: Dummy data set used for examples within a paper DATA adtte (DROP = _RANUNI _RANUNI2 i not_dead);
ATTRIB SUBJIDN LENGTH=8 FORMAT=best. LABEL="Subject Identifier for the Study (N)";
ATTRIB PARAMCD LENGTH=$8 FORMAT=$8. LABEL="Parameter Code";
ATTRIB PARAM LENGTH=$200 FORMAT=$200. LABEL="Parameter";
ATTRIB AVAL LENGTH=8 FORMAT=BEST. LABEL="Analysis Value";
ATTRIB ADT LENGTH=8 FORMAT=DATE9. LABEL="Analysis Date";
ATTRIB STARTDT LENGTH=8 FORMAT=DATE9. LABEL="Time to Event Origin Date for Subject";
ATTRIB CNSR LENGTH=8 FORMAT=best. LABEL="Censor";
ATTRIB TRTP LENGTH=$200 FORMAT=$200. LABEL="Planned Treatment";
ATTRIB TRTPN LENGTH=8 FORMAT=best. LABEL="Planned Treatment (N)";
ATTRIB TRTA LENGTH=$200 FORMAT=$200. LABEL="Actual Treatment";
ATTRIB TRTAN LENGTH=8 FORMAT=best. LABEL="Actual Treatment (N)";
PARAMCD = "DEATH";
PARAM = "Time to Death (days)";
DO i = 1 TO 200;
SUBJIDN = 10001000 + i;
STARTDT = 18500 + floor((1+18530-18500)*ranuni(100));
ADT = STARTDT + floor((1+19500-STARTDT)*ranuni(100));
_RANUNI=ranuni(1000);
_RANUNI2=ranuni(1);
IF _RANUNI2 GT 0.40 THEN not_dead = 1;
ELSE not_dead = 0;
IF _RANUNI LT 0.50 THEN DO;
TRTP = "Treatment 1";
TRTPN = 1;
END;
ELSE DO;
TRTP = "Treatment 2";
TRTPN = 2;
END;
IF ADT - STARTDT GE 365 THEN DO;
CNSR = 1;
ADT = STARTDT + 365;
END;
ELSE DO;
IF not_dead = 1 THEN CNSR = 1;
ELSE CNSR = 0;
END;
AVAL = ADT - STARTDT +1;
TRTA = TRTP;
TRTAN = TRTPN;
OUTPUT;
END;
RUN;
PhUSE 2013
10
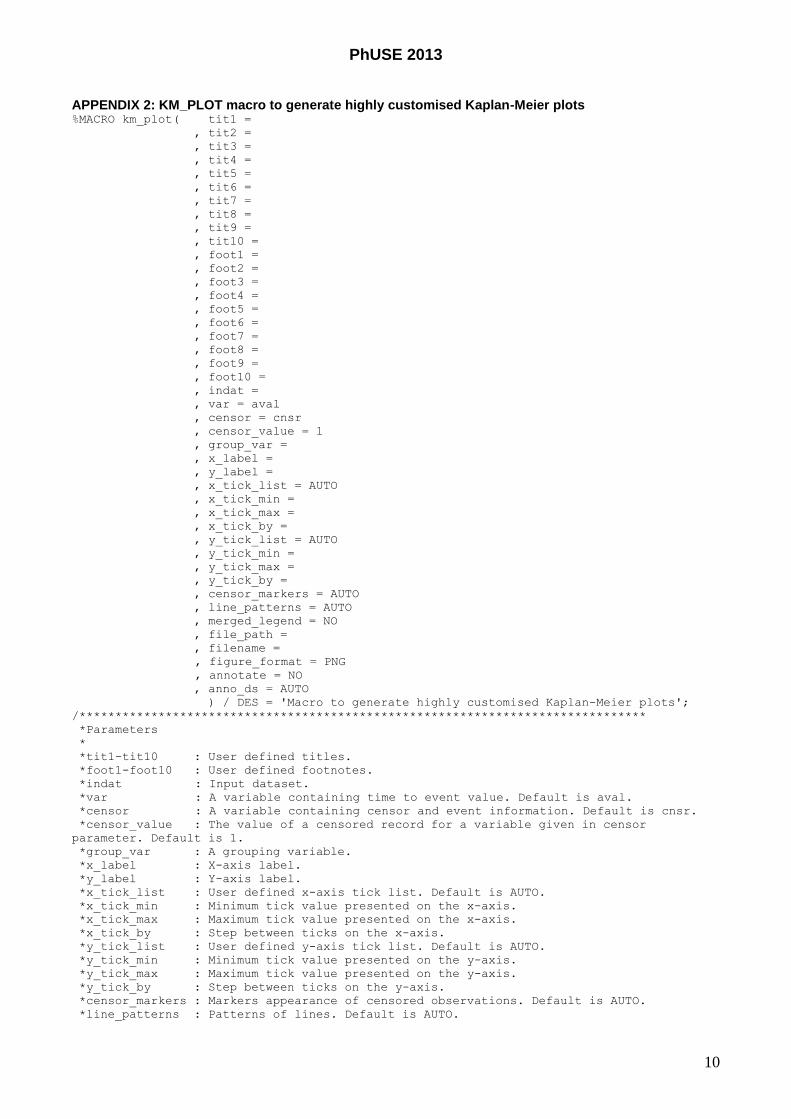
APPENDIX 2: KM_PLOT macro to generate highly customised Kaplan-Meier plots %MACRO km_plot( tit1 =
, tit2 =
, tit3 =
, tit4 =
, tit5 =
, tit6 =
, tit7 =
, tit8 =
, tit9 =
, tit10 =
, foot1 =
, foot2 =
, foot3 =
, foot4 =
, foot5 =
, foot6 =
, foot7 =
, foot8 =
, foot9 =
, foot10 =
, indat =
, var = aval
, censor = cnsr
, censor_value = 1
, group_var =
, x_label =
, y_label =
, x_tick_list = AUTO
, x_tick_min =
, x_tick_max =
, x_tick_by =
, y_tick_list = AUTO
, y_tick_min =
, y_tick_max =
, y_tick_by =
, censor_markers = AUTO
, line_patterns = AUTO
, merged_legend = NO
, file_path =
, filename =
, figure_format = PNG
, annotate = NO
, anno_ds = AUTO
) / DES = 'Macro to generate highly customised Kaplan-Meier plots';
/*******************************************************************************
*Parameters
*
*tit1-tit10 : User defined titles.
*foot1-foot10 : User defined footnotes.
*indat : Input dataset.
*var : A variable containing time to event value. Default is aval.
*censor : A variable containing censor and event information. Default is cnsr.
*censor_value : The value of a censored record for a variable given in censor
parameter. Default is 1.
*group_var : A grouping variable.
*x_label : X-axis label.
*y_label : Y-axis label.
*x_tick_list : User defined x-axis tick list. Default is AUTO.
*x_tick_min : Minimum tick value presented on the x-axis.
*x_tick_max : Maximum tick value presented on the x-axis.
*x_tick_by : Step between ticks on the x-axis.
*y_tick_list : User defined y-axis tick list. Default is AUTO.
*y_tick_min : Minimum tick value presented on the y-axis.
*y_tick_max : Maximum tick value presented on the y-axis.
*y_tick_by : Step between ticks on the y-axis.
*censor_markers : Markers appearance of censored observations. Default is AUTO.
*line_patterns : Patterns of lines. Default is AUTO.
PhUSE 2013
11
*merged_legend : Creates merged legend of censor markers and line patterns. Default
value is NO.
*file_path : Figure's location.
*filename : Name of created figure.
*figure_format : Format of figure. Default is PNG.
*annotate : Specifies if annotation is used. Default values is NO.
*anno_ds : Datasets with annotation instructions. Default values is AUTO.
******************************************************************************/
/*Check whether dataset exists*/
%IF %sysfunc(exist(&indat.)) = 0 %THEN %DO ;
%PUT %STR(ERR)OR: data set &indat. does not exist ;
%GOTO ERR_IN_MACRO ;
%END ;
/*Uppercase parameters which can use AUTO facility or YES/NO answer*/
%LET x_tick_list = %UPCASE(&x_tick_list.);
%LET y_tick_list = %UPCASE(&y_tick_list.);
%LET censor_markers = %UPCASE(&censor_markers.);
%LET line_patterns = %UPCASE(&line_patterns.);
%LET merged_legend = %UPCASE(&merged_legend.);
/*Check SAS version and the value of parameters which need SAS version higher than 9.2*/
%IF &merged_legend. = YES AND %sysevalf(&sysver.) LE 9.2 %THEN %DO;
%PUT %STR(IN)FO: To use merged legend functionality SAS version must be higher than
9.2. Will set merged_legend parameter to NO.;
%LET merged_legend = NO;
%END;
/*Check SAS version for annotate where SAS version higher has to be higher than 9.2*/
%IF &annotate.=YES AND %sysevalf(&sysver) LT 9.4 %THEN %DO;
%PUT %STR(IN)FO: To use annotation functionality SAS version must be higher than 9.3.
Will set annotate parameter to NO.;
%LET annotate= NO;
%END;
/*Set titles and footnote*/
/*Titles and footnotes given as parameters to the macro have priority over titles and
footnotes set globally*/
/*Create dataset with titles and footnotes given as parameters*/
%LOCAL i_tit i_foot;
DATA _km_temp_local_tit_foot;
ATTRIB type LENGTH = $1 FORMAT = $1. LABEL = 'Title Location' ;
ATTRIB number FORMAT = best12. LABEL = 'Title Number' ;
ATTRIB text LENGTH = $256 FORMAT = $256. LABEL = 'Title Text' ;
%DO i_tit=1 %TO 10;
type = "T";
number = %eval(&i_tit.);
text = "&&tit&i_tit..";
OUTPUT;
%END;
%DO i_foot=1 %TO 10;
type = "F";
number = %eval(&i_foot.);
text = "&&foot&i_foot..";
OUTPUT;
%END;
RUN;
/*Check whether titles and footnotes are given as parameters to the macro:*/
%LOCAL _check_param_tit _check_param_foot;
PROC SQL NOPRINT;
SELECT count(*) INTO :_check_param_tit
FROM _km_temp_local_tit_foot
WHERE ~missing(text) AND type = "T";
SELECT count(*) INTO :_check_param_foot
PhUSE 2013
12
FROM _km_temp_local_tit_foot
WHERE ~missing(text) AND type = "F";
QUIT;
/*If titles and footnotes are not given as parameters to the macro then search for them in
sashelp.vtitle*/
DATA _km_temp_global_tit_foot;
SET sashelp.vtitle;
IF 1^=1 OR
%IF &_check_param_tit. = 0 %THEN %DO;
type = "T" OR
%END;
%IF &_check_param_foot. = 0 %THEN %DO;
type = "F" OR
%END;
1^=1;
RUN;
DATA _km_temp_tit_foot;
MERGE _km_temp_local_tit_foot _km_temp_global_tit_foot;
BY DESCENDING type number;
RUN;
/*Get maximum non empty title or footnote*/
%LOCAL _max_tit _max_foot;
PROC SQL NOPRINT;
SELECT max(number) INTO :_max_tit
FROM _km_temp_tit_foot
WHERE ~missing(text) AND type = "T";
SELECT max(number) INTO :_max_foot
FROM _km_temp_tit_foot
WHERE ~missing(text) AND type = "F";
QUIT;
%LOCAL i_macro_var;
DATA _NULL_;
SET _km_temp_tit_foot;
%IF %eval(&_max_tit.>0) %THEN %DO;
%DO i_macro_var=1 %TO &_max_tit.;
IF strip(type) = "T" AND number=&i_macro_var. THEN DO;
CALL symputx("tit&i_macro_var.", text, "L");
END;
%END;
%END;
%IF %eval(&_max_foot.>0) %THEN %DO;
%DO i_macro_var=1 %TO &_max_foot.;
IF strip(type) = "F" AND number=&i_macro_var. THEN DO;
CALL symputx("foot&i_macro_var.", text, "L");
END;
%END;
%END;
RUN;
/*Call lifetest procedure*/
/*If group_var parameter is not defined then set an artificial dummy group_var*/
%IF %length(&group_var.) > 0 %THEN %DO;
DATA _km_temp_indat;
SET &indat.;
RUN;
%END;
%ELSE %DO;
DATA _NULL_;
SET &indat(OBS=1);
CALL symputx("var_label",vlabel(&var.),'L');
RUN;
DATA _km_temp_indat;
SET &indat.;
PhUSE 2013
13
ATTRIB _km_temp_group_var LABEL="&var_label.";
_km_temp_group_var = "&var_label. for all records";
RUN;
%LET group_var = _km_temp_group_var;
%END;
/* Check number of distinct values for strata */
%LOCAL _check_strata;
PROC SQL NOPRINT;
SELECT count(DISTINCT &group_var) INTO :_check_strata
FROM _km_temp_indat ;
QUIT;
PROC LIFETEST DATA=_km_temp_indat METHOD=KM outsurv= _km_temp_LTEstimates
;
TIME &var. * &censor.(&censor_value.);
STRATA &group_var.;
/*output the equality tests over strata for anno_ds=AUTO */
%IF &group_var. NE _km_temp_group_var AND &_check_strata. GE 2 %THEN %DO;
ODS OUTPUT HomTests=stats;
%END;
RUN;
DATA _km_temp_surv;
SET _km_temp_LTEstimates;
RETAIN prevsurv;
IF ~missing(survival) THEN DO;
surv=survival;
END;
ELSE DO;
surv=prevsurv;
END;
IF ~missing(survival) THEN prevsurv = survival;
IF _censor_ = &censor_value. THEN cencsurv = surv;
RUN;
/*Tick_list*/
/*x axis:*/
%IF &x_tick_list. = AUTO %THEN %DO;
%LET x_tick_list=;
PROC SQL NOPRINT;
SELECT max(&var.) INTO :x_tick_max
FROM _km_temp_surv;
QUIT;
PROC SQL NOPRINT;
SELECT min(&var.) INTO :x_tick_min
FROM _km_temp_surv;
QUIT;
%LET x_tick_by = %sysevalf((&x_tick_max.-&x_tick_min.)/10);
DATA _NULL_;
LENGTH tick_list $1000;
DO i = &x_tick_min. TO &x_tick_max. BY &x_tick_by.;
tick_list = catx(' ',tick_list,i);
END;
CALL symputx('x_tick_list',tick_list,'L');
RUN;
%END;
%ELSE %DO;
%IF %length(&x_tick_list.) > 0 %THEN %DO;
%PUT %str(IN)FO: Defined by user x tick list will be used.;
%LET x_tick_min= %scan(&x_tick_list.,1,%str( ));
%LET x_tick_max= %scan(&x_tick_list.,-1,%str( ));
%END;
%ELSE %DO;
%IF %length(&x_tick_min.) > 0 %THEN %DO;
%END;
%ELSE %DO;
%PUT %STR(ERR)OR: Neither x_tick_min nor x_tick_list is defined! Please define
one of these parameters.;
%GOTO ERR_IN_MACRO ;
%END;
PhUSE 2013
14
%IF %length(&x_tick_max.) > 0 %THEN %DO;
%END;
%ELSE %DO;
%PUT %STR(ERR)OR: Neither x_tick_max nor x_tick_list is defined! Please define
one of these parameters.;
%GOTO ERR_IN_MACRO ;
%END;
%IF %length(&x_tick_by.) > 0 %THEN %DO;
%IF %length(&x_tick_min.) > 0 AND %length(&x_tick_max.) > 0 %THEN %DO;
DATA _NULL_;
LENGTH tick_list $1000;
DO i = &x_tick_min. TO &x_tick_max. BY &x_tick_by.;
tick_list = catx(' ',tick_list,i);
END;
CALL symputx('x_tick_list',tick_list,'L');
RUN;
%END;
%END;
%ELSE %DO;
%PUT %STR(ERR)OR: Neither x_tick_by nor x_tick_list is defined! Please define
one of these parameters.;
%GOTO ERR_IN_MACRO ;
%END;
%END;
%END;
/*y axis:*/
%IF &y_tick_list. = AUTO %THEN %DO;
%LET y_tick_list = 0 0.1 0.2 0.3 0.4 0.5 0.6 0.7 0.8 0.9 1;
%LET y_tick_min= %scan(&y_tick_list.,1,%str( ));
%LET y_tick_max= %scan(&y_tick_list.,-1,%str( ));
%END;
%ELSE %DO;
%IF %length(&y_tick_list.) > 0 %THEN %DO;
%PUT %str(IN)FO: Defined by user y tick list will be used.;
%LET y_tick_min= %scan(&y_tick_list.,1,%str( ));
%LET y_tick_max= %scan(&y_tick_list.,-1,%str( ));
%END;
%ELSE %DO;
%IF %length(&y_tick_min.) > 0 %THEN %DO;
%END;
%ELSE %DO;
%PUT %STR(ERR)OR: Neither y_tick_min nor y_tick_list is defined! Please define
one of these parameters.;
%GOTO ERR_IN_MACRO ;
%END;
%IF %length(&y_tick_max.) > 0 %THEN %DO;
%END;
%ELSE %DO;
%PUT %STR(ERR)OR: Neither y_tick_max nor y_tick_list is defined! Please define
one of these parameters.;
%GOTO ERR_IN_MACRO ;
%END;
%IF %length(&y_tick_by.) > 0 %THEN %DO;
%IF %length(&y_tick_min.) > 0 AND %length(&y_tick_max.) > 0 %THEN %DO;
DATA _NULL_;
LENGTH tick_list $1000;
DO i = &y_tick_min. TO &y_tick_max. BY &y_tick_by.;
tick_list = catx(' ',tick_list,i);
OUTPUT;
END;
CALL symputx('y_tick_list',tick_list,'L');
RUN;
%END;
%END;
%ELSE %DO;
%PUT %STR(ERR)OR: Neither y_tick_by nor y_tick_list is defined! Please define
one of these parameters.;
%GOTO ERR_IN_MACRO;
%END;
%END;
%END;
PhUSE 2013
15
/*Set offset*/
%LOCAL x_viewmax;
%LET x_viewmax=%sysevalf(&x_tick_max. + (&x_tick_max. - &x_tick_min.)*0.05);
%LOCAL y_viewmax;
%LET y_viewmax=%sysevalf(&y_tick_max. + (&y_tick_max. - &y_tick_min.)*0.05);
/*Censor markers and line patterns*/
/*Count number of distinct group vars*/
%LOCAL num_group_var;
PROC SQL NOPRINT;
SELECT count(DISTINCT(&group_var.)) INTO :num_group_var
FROM _km_temp_surv;
QUIT;
%IF &censor_markers. = AUTO %THEN %DO;
/* Set the default censor markers*/
%LET censor_markers = %sysfunc(repeat(circle plus X triangle square asterisk diamond,
%sysevalf(%sysfunc(ceil(&num_group_var./7)))));
%END;
%LOCAL number_of_censor_markers;
%LET number_of_censor_markers = %sysfunc(countw(&censor_markers., %str( )));
%IF %sysevalf(&number_of_censor_markers. < &num_group_var.) %THEN %DO;
%PUT %STR(ERR)OR: Number of defined censor markers is lower than number of groups.;
%GOTO ERR_IN_MACRO ;
%END;
%ELSE %DO;
%LOCAL i_censor_markers;
DATA _NULL_;
%DO i_censor_markers=1 %TO &number_of_censor_markers.;
CALL symputx("censor_marker_&i_censor_markers.",
"%scan(&censor_markers.,&i_censor_markers.,%str( ))",'L');
%END;
RUN;
%END;
%IF &line_patterns. = AUTO %THEN %DO;
/* Set the default line patterns*/
%LET line_patterns =
%sysfunc(repeat(1 4 8 5 14 26 15 20 41 42 2,
%sysevalf(%sysfunc(ceil(&num_group_var./11)))));
%END;
%LOCAL number_of_line_patterns;
%LET number_of_line_patterns = %sysfunc(countw(&line_patterns., %str( )));
%IF %sysevalf(&number_of_line_patterns. < &num_group_var.) %THEN %DO;
%PUT %STR(ERR)OR: Number of defined line patterns is lower than number of groups.;
%GOTO ERR_IN_MACRO ;
%END;
%ELSE %DO;
%LOCAL i_line_patterns;
DATA _NULL_;
%DO i_line_patterns=1 %TO &number_of_line_patterns.;
CALL symputx("line_pattern_&i_line_patterns.",
"%scan(&line_patterns.,&i_line_patterns.,%str( ))",'L');
%END;
RUN;
%END;
/*Get label of a group variable to assign it in a title of a legend*/
DATA _NULL_;
SET _km_temp_surv(OBS=1);
CALL symputx("group_var_label",vlabel(&group_var.),'L');
RUN;
/*Create figure template*/
PROC TEMPLATE;
PhUSE 2013
16
/* Create new style to present markers and lines in a user defined way */
DEFINE STYLE Styles.temp_groups;
parent=Styles.LISTING;
STYLE ColorStyles / "c1" = BLACK;
STYLE FillStyles / "f1" = BLACK;
%LOCAL i_group;
%DO i_group=1 %TO &num_group_var.;
replace GraphData&i_group. /
MarkerSymbol="&&censor_marker_&i_group.."
LineStyle=&&line_pattern_&i_group..
Color = FillStyles("f1") ContrastColor = ColorStyles("c1");
%END;
END;
DEFINE STATGRAPH temp/ STORE=work.temp_graph;
BEGINGRAPH
%IF &annotate. EQ YES AND &anno_ds. = AUTO AND &_check_strata. GE 2 %THEN %DO;
/ pad=( right=40%)
%END;
;
/* titles*/
%IF %eval(&_max_tit.>0) %THEN %DO;
%DO i_macro_var=1 %TO &_max_tit.;
ENTRYTITLE halign=left textattrs=graphvaluetext "&&tit&i_macro_var.." ;
%END;
%END;
/* footnotes*/
%IF %eval(&_max_foot.>0) %THEN %DO;
%DO i_macro_var=1 %TO &_max_foot.;
ENTRYFOOTNOTE halign=left textattrs=graphvaluetext "&&foot&i_macro_var.." ;
%END;
%END;
LAYOUT OVERLAY /
XAXISOPTS=( LABEL="&x_label." TYPE=linear
linearopts=( tickvaluelist=(&x_tick_list.)
viewmin=&x_tick_min.
viewmax=&x_viewmax. ) )
YAXISOPTS=( LABEL="&y_label." TYPE=linear
linearopts=( tickvaluelist=(&y_tick_list.)
viewmin=&y_tick_min.
viewmax=&y_viewmax. ) )
X2AXISOPTS=( display=none TYPE=auto )
Y2AXISOPTS=( display=none TYPE=auto );
STEPPLOT X=&var. Y=surv / primary=true Group=&group_var.
Justify=Left NAME="STEP";
SCATTERPLOT X=&var. Y=cencsurv/ Group=&group_var. NAME="SCATTER";
%IF &merged_legend. = YES %THEN %DO;
MergedLegend "STEP" "SCATTER" /
title="&group_var_label." across=1 valign=bottom;
%END;
%ELSE %DO;
DiscreteLegend "STEP" "SCATTER"/
title="&group_var_label." across=2 down=&num_group_var.
valign=bottom order=columnmajor;
%END;
%IF &annotate EQ YES %THEN %DO;
Annotate;
%END;
ENDLAYOUT;
ENDGRAPH;
END;
RUN;
ODS PATH work.temp_graph(READ) sashelp.tmplmst(READ) sasuser.templat(READ);
/*Set path to the directory where figure will be stored*/
ODS LISTING GPATH="&file_path." IMAGE_DPI=300 STYLE=temp_groups;
PhUSE 2013
17
/*Set graphical options*/
ODS GRAPHICS / RESET IMAGEFMT = &figure_format.
BORDER = OFF
HEIGHT = 600px
WIDTH = 800px
/* filename*/
IMAGENAME = "&filename.";
%IF &annotate.=YES AND
(&group_var. = _km_temp_group_var OR &_check_strata. LT 2) %THEN %DO;
%PUT %STR(IN)FO:AUTO annotation is used only if the group_var is set.;
%LET annotate= NO;
%END;
%IF &annotate.=NO %THEN %DO;
%PUT Annotation not used;
%END;
%IF &annotate.=YES AND &anno_ds. = AUTO %THEN %DO;
%ANNOTATE_AUTO:
DATA _km_temp_anno;
SET work.stats END=_last_;
LENGTH x1space $ 11 y1space $ 11 anchor $ 8
label $ 15 textsize 8 width 8 JUSTIFY $ 8;
textsize=8.5;
size+(-5);
RETAIN function 'text' x1space 'wallpercent'
y1space 'wallpercent' anchor 'center';
width=15;
x1=110.5;
y1=90+size;
label=put(test, $10.);
OUTPUT;
x1=123;
label=put(ChiSq, best6.4);
OUTPUT;
x1=139;
label=put(ProbChiSq, best6.4);
OUTPUT;
IF (_last_) THEN DO; /* Add the column headers */
y1space = 'wallpercent';
width = 20; /* make the textbox wider to prevent wrapping */
anchor = 'topright';
textweight='bold';
y1 = 95;
x1=115.5;
label="Test";
OUTPUT;
x1=127;
label="ChiSq";
OUTPUT;
x1=143;
label="ProbChiSq";
OUTPUT;
END;
RUN;
%LET anno_ds=_km_temp_anno;
%END;
%ELSE %DO;
%IF %sysfunc(exist(&anno_ds))=0 AND &anno_ds. NE AUTO
AND &annotate. EQ YES %THEN %DO;
%PUT %STR(IN)FO: Annotation dataset not specified or does not exist. AUTO will be
used.;
%LET anno_ds=AUTO;
%GOTO annotate_auto;
%END;
%END;
/*Create figure*/
PhUSE 2013
18
PROC SGRENDER DATA=_km_temp_surv TEMPLATE=temp %IF &annotate EQ YES %THEN %DO;
sganno=&anno_ds %END;;
RUN;
/*Clean up*/
ODS PATH reset;
PROC TEMPLATE;
DELETE temp/ STORE=work.temp_graph;
RUN;
%GOTO FINISH;
%ERR_IN_MACRO:
%PUT - &SYSMACRONAME.: Macro is aborted due to errors.;
%FINISH:
/*Clean up*/
PROC DATASETS LIBRARY=work NODETAILS NOLIST NOWARN;
DELETE _km_temp:;
QUIT;
%MEND km_plot;
![CROSS-VALIDATlON OF PURPOSE-IN-LIFETEST BASED FRANKL… v24 n1/Purpose-In-Life_Test... · CROSS-VALIDATlONOF PURPOSE-IN-LIFETEST BASED ON FRANKL'S CONCEPTSl] AMES C. CRUMBAUGH Veterans](https://img.pdfslide.us/doc/110x75/5a80d6e17f8b9a9d308ca835/cross-validatlon-of-purpose-in-lifetest-based-frankl-v24-n1purpose-in-lifetestcross-validatlonof.jpg)