Embed Size (px)
Citation preview

A ROAD TO RECOVERY | i
A ROAD TO RECOVERYA STATE OF THE NATION REPORT FROM THE SALVATION ARMY
ii | A ROAD TO RECOVERY
ISBN 978-0-9582975-4-7 (Paperback)
ISBN 978-0-95829675-1-6 (Electronic)
Authorised and approved by Commissioner Donald C. Bell, Territorial Commander,
as an official publication of The Salvation Army New Zealand, Fiji and Tonga Territory.
“A Road to Recovery” was produced by The Salvation Army Social Policy and Parliamentary Unit,
16b Bakerfield Place, Manukau City 2104, New Zealand.
Director: Major Campbell Roberts
Manager: Major Ian Kilgour
This Report is available for viewing or download from:
www.salvationarmy.org.nz/socialpolicy
The Salvation Army Social Policy and Parliamentary Unit would like to thank community partner
Duncan Cotterill Lawyers for their financial assistance with the production of this report.
A ROAD TO RECOVERY | iii
A ROAD TO RECOVERYA STATE OF THE NATION REPORT FROM THE SALVATION ARMY
Alan Johnson
Senior Policy Analyst
The Salvation Army Social Policy and Parliamentary Unit
February 2010
iv | A ROAD TO RECOVERY
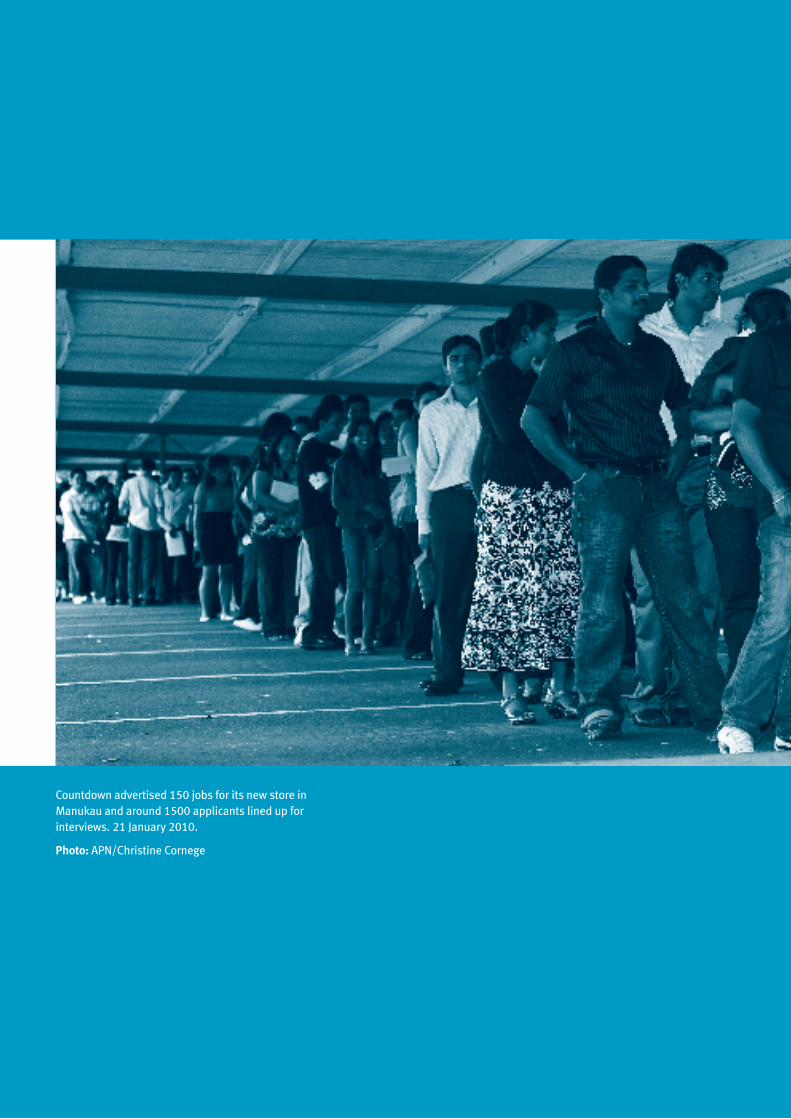
Countdown advertised 150 jobs for its new store in Manukau and around 1500 applicants lined up for interviews. 21 January 2010.
Photo: APN/Christine Cornege

A ROAD TO RECOVERY | v
“In some respects, recessions and economic
downturns are the medicine of the market …
But if we learn nothing from a recession and
if our behaviours don’t change, the value
of all that suffering and disappointment is
lost. This is the real danger here and now in
New Zealand.”
FOREWORD A ROAD TO RECOVERY
“God rescues the needy from the words
of the wicked and the fist of the mighty.
The poor are filled with hope,
and injustice is silenced.”
JOB 5:15–16 CONTEMPORARY ENGLISH VERSION
“God, grant me the serenity
to accept the things I cannot change;
courage to change the things I can;
and wisdom to know the difference.”
REINHOLD NIEBUHR THE SERENITY PRAYER
WE WELCOME YOUR FEEDBACK
PO Box 76249, Manukau City 2104
salvationarmy.org.nz/socialpolicy
Phone (09) 261 0883
Mobile 027 450 6944
Fax (09) 262 4103
SOCIAL POLICY AND
PARLIAMENTARY UNIT
NEW ZEALAND, FIJI
& TONGA TERRITORY
vi | A ROAD TO RECOVERY
FOREWORD
A year ago the world to most New Zealanders
probably looked bleaker than it does today.
Twelve months ago we had the reality of falling
property prices and rising unemployment,
mortgagee sales and bankruptcies. Today,
while thousands of people queue for a few
dozen jobs, house prices have bounced back to
record levels. Some New Zealanders are doing
well and some are struggling.
A Road to Recovery is The Salvation Army’s
third annual ‘State of the Nation Report’. As
with previous reports this report attempts
to track social progress across five areas of
interest: the position and progress of New
Zealand’s children, crime and punishment, the
working lives and incomes of New Zealanders,
social hazards, and housing.
This report is a one-to-five-year review of key
indicators against which we might measure
social progress or social decline. As in previous
years, these indicators show mixed results:
in some areas, outcomes are improving, in
others, the trends don’t look very positive. And
perhaps most disappointing of all: in some
areas, nothing has changed and the same
discouraging picture remains.
On a positive note, there are signs that as
a country we have become less tolerant of
violence in the home, especially violence
towards children. There are signs we are
gambling less and heeding the call not to drive
drunk. Our infant mortality rate has fallen,
the number of pre-schoolers enrolled in early
childhood education has risen, students from
poorer schools are succeeding more, and there
are fewer unwanted teenage pregnancies.
But there is no denying that the recession is
taking a social toll. Unemployment is at a five-
year high, gains made over the past five years
in reducing child poverty have probably been
lost, and there are signs of a widening income
gap between the well paid and the poorly paid.
Most discouraging is the inevitable rise in our
prison population and the high cost of running
our prisons. Re-offending and re-imprisonment
rates remain stubbornly high, and the public
debate around violent crime is not only
misdirected but is adding to the problem.
In many ways, New Zealand has weathered the
economic storm of the global recession well.
Our banking system has not been seriously
corrupted by foolish lending, and dairy export
prices have recovered. Interest rates have
eased, the New Zealand dollar is softer and
there is little inflationary pressure in the
economy. Predictions of economic decline
appear to have been overstated; it even seems
feasible to talk of an economic recovery.
But an economic recovery of any sort should
not be seen as the answer to our prayers. An
economic recovery where Australian-owned
banks recover their profitability and where
agribusinesses maintain their international
competitiveness may have little, if anything, to
offer struggling Kiwi families. A recovery where
there are high house prices and no new jobs is
of little social value.
In some respects, recessions and economic
downturns are the medicine—or more
accurately perhaps, the surgical interventions
—of the market. They are part of what
A ROAD TO RECOVERY | vii
Austrian economist Joseph Schumpeter called
“creative destruction”. Among other things,
such downturns weed out weak businesses,
revealing and punishing foolish financial
decisions. They serve as lessons on how to
behave with money and what not to do in
our financial lives. But if we learn nothing
from a recession and if our behaviours don’t
change, the value of all that suffering and
disappointment is lost. This is the real danger
here and now in New Zealand.
For example, much of the economic growth of
the past decade has been consumption driven,
and much of this consumption has been debt
financed. Over the past ten years our current
account deficit has averaged 6% of GDP, which,
in effect, means that we have spent $1.06
for every $1 we as a country earned from the
world. This deficit was largely financed by
debt: between 2000 and 2009 our foreign debt
rose by $130 billion. Much of this debt went
into housing rather than into more productive
forms of investment.
Yet despite this folly, The Treasury in its Half
Year Economic and Fiscal Update 2009 is
predicting that more of the same is likely
to drive the expected recovery—initially, at
least. While such an outcome is not within
the influence of The Treasury or the wider
Government at present, its acceptance in fairly
neutral terms as being inevitable and not
undesirable points to a lack of imagination.
If our economic recovery relies on us spending
more, borrowing more and building more
beach houses, we have learned little from the
recession or the suffering and fear it brought.
A real danger here is that not only will the
recovery not lead us to reflect on our past
follies and lack of imagination, but neither will
it lead us to repair the damage done by the
recession. Some of this damage is catalogued
in this report. It can be seen in such statistics
as rising levels of child poverty, growing
dependence on food banks, and a youth
unemployment rate that has hit 26%.
Government has intervened in appropriate
ways to minimise the cost and damage of the
recession, but has spent heavily and borrowed
heavily to do so. It will take some time for us to
dig our way out of the hole of debt created by
this spending—perhaps as long as a decade.
Recovery will come at a cost, restricting the
choices of what else we might do as a society.
For this reason there is now, more than ever,
a pressing need to ensure that sacrifices are
shared evenly and that present choices are
exercised fairly, with an eye to the future.
Government has some difficult choices to make
over the next one or two years. These choices
will not be made easier if we as a national
community fail to accept the need for change.
One necessary change is for more attention
to be paid to the needs of the young and the
vulnerable in our society. Let us hope that we
have both the imagination and generosity of
spirit to acknowledge this.
Major Campbell Roberts
Director, The Salvation Army Social
Policy and Parliamentary Unit

viii | A ROAD TO RECOVERY
A ROAD TO RECOVERY | 1
Our Children 3
Crime and Punishment 15
Work and Incomes 25
Social Hazards 35
Housing 41
Endnotes 48
CONTENTS
2 | A ROAD TO RECOVERY
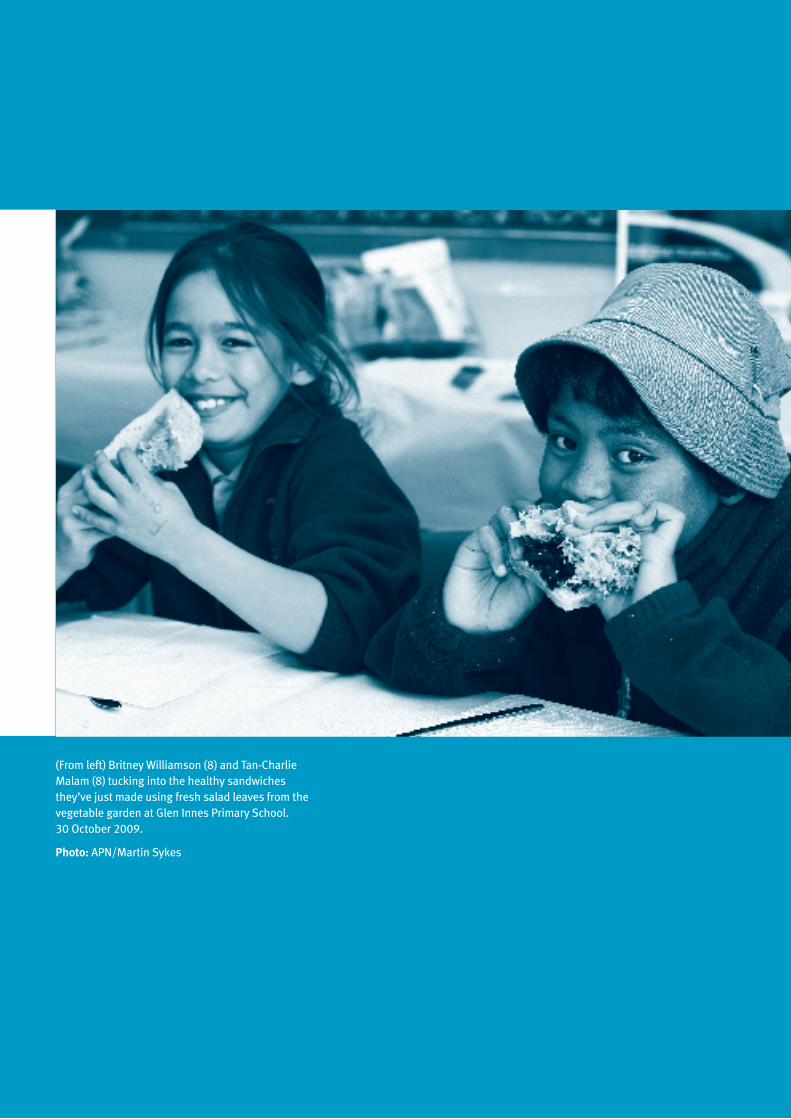
(From left) Britney Williamson (8) and Tan-Charlie Malam (8) tucking into the healthy sandwiches they’ve just made using fresh salad leaves from the vegetable garden at Glen Innes Primary School. 30 October 2009.
Photo: APN/Martin Sykes
A ROAD TO RECOVERY | 3
The well-worn cliché that children are our
future is not always borne out by the priority
we afford children in our social spending and
other resource allocations. By around 2022
New Zealanders aged over 65 will outnumber
those aged under 15 for the first time in our
history. This demographic milestone is not
unexpected, but it does pose major challenges
for us as a society as we consider the relative
priorities of our social spending. An aging
society that ignores the needs of the young
and focuses more heavily on the needs of
the elderly runs the risk of undermining the
basis of its prosperity, which is, of course, the
productivity and goodwill of its citizens.
Given the demographic and economic
challenge of supporting an aging population,
the potential inherent in each child is too
valuable to waste. Such waste is already
apparent in the gaps in opportunities and
outcomes that exist between the children of
middle New Zealand and those of our poorest
families and communities. There are mixed
signs around this gap. Some signs suggest
that the gap is closing, while others suggest
that it is in danger of widening. What is certain,
however, is that now is not the time to become
complacent in the allocation of efforts and
resources to guard the wellbeing of New
Zealand’s most vulnerable children.
CHILD POVERTY RATES BEGIN TO RISE AGAIN
2009 saw the publication by Ministry of Social
Development of ‘Household Incomes in New
Zealand: Trends in Indicators of Inequality
and Hardship 1982 to 2008’.1 This report
is an update of poverty measurement work
undertaken by the Ministry, which is based on
Statistics New Zealand’s Household Economic
Survey (HES). The HES is a household income
survey, so poverty indicators derived from
it are income based and measure poverty
in relative income terms. For example, a
household is said to be living in poverty if its
income is less than half the medium income
of similar-sized households. The Ministry of
Social Development complements income-
based poverty measures with what might be
termed experiential-based ones that allow
people to describe their living standards
perhaps in terms of the possessions they have
and activities they can take part in.2 Although
these measure different things, there is a
consistency in the estimates of poverty that
these two approaches come up with.3
The levels of poverty identified in any poverty
measurement programme are often subject
to dispute because of the assumptions that
are required and the definitions that need to
be accepted to make any progress. The actual
quantum of relative poverty identified in any
poverty measurement exercise is, however,
only part of the social policy value to be gained
from such an exercise. Poverty measurement
also provides insights into poverty trends
OUR CHILDREN
4 | A ROAD TO RECOVERY
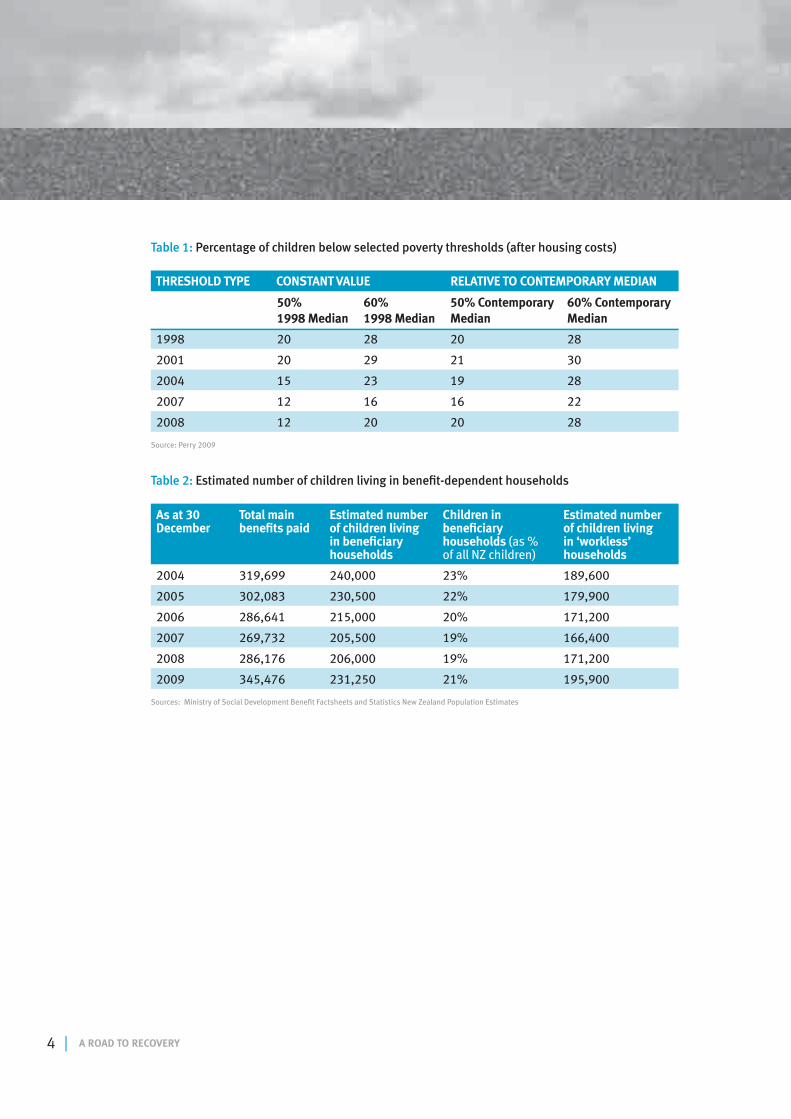
Table 2: Estimated number of children living in benefit-dependent households
As at 30 December
Total main benefits paid
Estimated number of children living in beneficiary households
Children in beneficiary households (as % of all NZ children)
Estimated number of children living in ‘workless’ households
2004 319,699 240,000 23% 189,600
2005 302,083 230,500 22% 179,900
2006 286,641 215,000 20% 171,200
2007 269,732 205,500 19% 166,400
2008 286,176 206,000 19% 171,200
2009 345,476 231,250 21% 195,900
Sources: Ministry of Social Development Benefit Factsheets and Statistics New Zealand Population Estimates
Source: Perry 2009
50% 1998 Median
60% 1998 Median
50% Contemporary Median
60% Contemporary Median
1998 20 28 20 28
2001 20 29 21 30
2004 15 23 19 28
2007 12 16 16 22
2008 12 20 20 28
Table 1: Percentage of children below selected poverty thresholds (after housing costs)
THRESHOLD TYPE CONSTANT VALUE RELATIVE TO CONTEMPORARY MEDIAN
A ROAD TO RECOVERY | 5
(are things becoming better or worse?), into
the incidence of poverty (who is most likely to
be poor?) and into the depth of poverty (how
poor are the poor?).
Analysis of the 2008 Household Economic
Survey by Brian Perry provides such insights,
including that:
• poverty probably increased slightly during
2008 after several years of decline (Table 1)
• 20% of New Zealand children (or around
216,000 individuals) were estimated to live
in relative poverty based on 60% of median
income pegged to 1998 incomes and after
taking account of housing costs; this figure
is significantly less than the nearly 303,000
children or 29% of the child population
living in relative poverty in 2001
• 49% of single-parent households were
judged to be living in relative poverty
according to the same measure (60%
of median income at constant value
after housing costs); 12% of two-parent
households were also living in relative
poverty4
• 10% of children living in households with
one or more full-time workers were said
to be living in relative poverty (under the
same measure), as were 61% of children
in households without a full-time worker,
and 69% of children living in “workless”
households
In summary, children living with one parent
and relying on a welfare benefit for their main
or only source of income are most likely to live
in relative poverty. This is an unsurprising but
unnecessary result. It is unsurprising because
relative income poverty measures will tend
to measure the gap between market incomes
(which statistically will always provide most
of the household incomes against which
median are measured) and incomes based on
transfer payments such as welfare benefits and
Superannuation. Given that welfare benefits
are usually increased annually in line with the
rate of inflation, and that wages and salaries in
particular are determined both by supply and
demand in the labour market and minimum
wage legislation, it is quite likely that a gap
between benefits and market incomes will
emerge. In addition, if benefit rates are set
with little or no thought to any objective of
poverty reduction but on the basis of providing
a barely adequate income with an appreciable
income gap between those in work and those
not,5 then it is likely that welfare benefits
become synonymous with relative poverty.
As a more immediate indicator of changes in
levels of child poverty The Salvation Army has
estimated the number of children living on
benefits, including those living in households
without any supplementary income. Such
income might be gained through part-time
work. Households without supplementary
income may correspond with the “workless”
households of the Household Economic Survey
and Brian Perry’s analysis. These estimates are
provided in Table 2.
Table 2 indicates the impact of the recession
on the number of children likely to be living in
6 | A ROAD TO RECOVERY
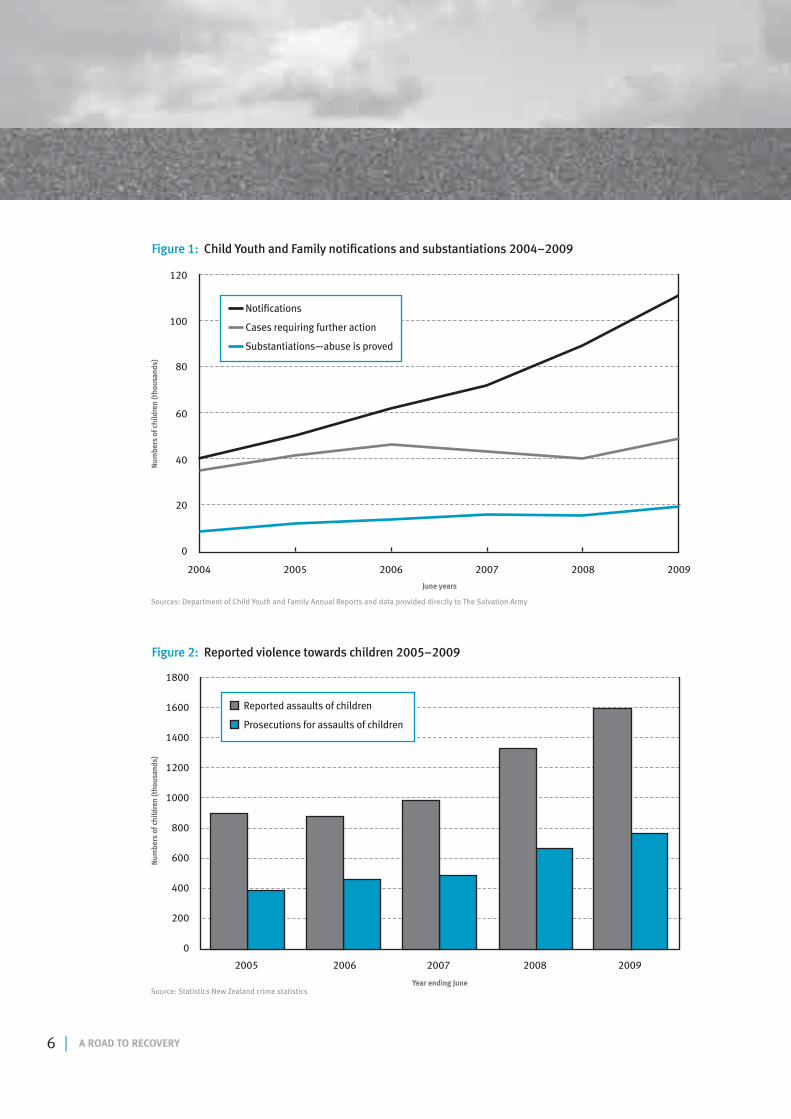
Figure 2: Reported violence towards children 2005–2009
0
200
400
600
800
1000
1200
1400
1600
1800
Num
bers
of c
hild
ren
(tho
usan
ds)
Year ending June
20062005 20082007 2009
Reported assaults of children
Prosecutions for assaults of children
0
20
40
60
80
100
120
Num
bers
of c
hild
ren
(tho
usan
ds)
2004 20062005 20082007 2009
Notifications
Cases requiring further action
Substantiations —abuse is proved
Figure 1: Child Youth and Family notifications and substantiations 2004–2009
June years
Sources: Department of Child Youth and Family Annual Reports and data provided directly to The Salvation Army
Source: Statistics New Zealand crime statistics
A ROAD TO RECOVERY | 7
Cases where some form of child abuse or
neglect has been proven or substantiated
have, however, increased steadily over the
past five years, mainly because of these new
Police reporting practices. Substantiated cases
increased a massive 131% between 2004
and 2009, and totalled 19,596 in 2009. There
was a 20% increase in substantiated cases
between 2008 and 2009 alone. The majority
of the recent growth in substantiated cases
is due to proven emotional abuse associated
with children witnessing violence within their
families or households.
VIOLENCE AND CHILDREN
Reported violence towards children rose 20%
between 2008 and 2009 to 1600 reported
assaults. This figure is nearly 80% higher than
the 900 reported assaults five years earlier
(in 2005). Of the reported assaults, Police
resolved 78% and prosecuted offenders in
62% of cases. These rates of resolution and
prosecution are consistent with previous years.
This consistency suggests that the increased
reporting is not due to trivial complaints
brought about through the 2007 repeal of
Section 59 of the Crimes Act, which removed
any legal defence for assaulting a child. This
conclusion is consistent with the Police’s own
assessment that the “amendment has had
minimal impact on police activity”. 7
Rates of violent offending by young teenagers
have fallen for the first time in nine years,
although violent offending by females has
risen, albeit from a low base. Trends in rates
of violent offending by males are reported in
households entirely dependent on benefits.
This is now higher than five years ago during
the period of declining unemployment, and
grew 14% in the year to December 2009. While
the recession has added over 50,000 people to
welfare lines6 in just 12 months (to December
2009), fewer people on benefits seem to
have been able to secure even part-time
employment. For example, in December 2004,
21% of people receiving a Domestic Purposes
Benefit reported supplementary income. By
December 2009, this had shrunk
to just 15%.
CHILDREN AT RISK
Child Youth and Family (CYF) is the State’s
child protection agency, which is responsible,
among other things, for protecting children
from harm and neglect under the Children,
Young Persons and their Families Act. In the
year to June 2009, CYF received over 110,000
referrals for possible child neglect or abuse.
This figure was 24% higher than the previous
year and 171% higher than five years earlier.
A significant policy change is most
likely behind the bulk of this increase in
notifications. For at least two years it has been
common practice for Police to advise CYF of
cases where they have attended a domestic
violence incident where children have been
present. This practice is probably the reason
for the sharp increase in notifications,
particularly since 2007, alongside the more
modest but still unfortunate increase in the
number of notifications judged to require
further action.
8 | A ROAD TO RECOVERY
300
350
400
450
500
550
600
650
700
Enro
lmen
ts in
lice
nsed
cen
tres
per
100
0 ch
ildre
n ag
ed u
nder
5
As at July
2004 20062005 20082007 2009
Maori Non-Maori
Source: Ministry of Education Education Counts website and Statistics New Zealand population estimates
Figure 3: Rates of enrolment in licensed early childhood education 2004–2009
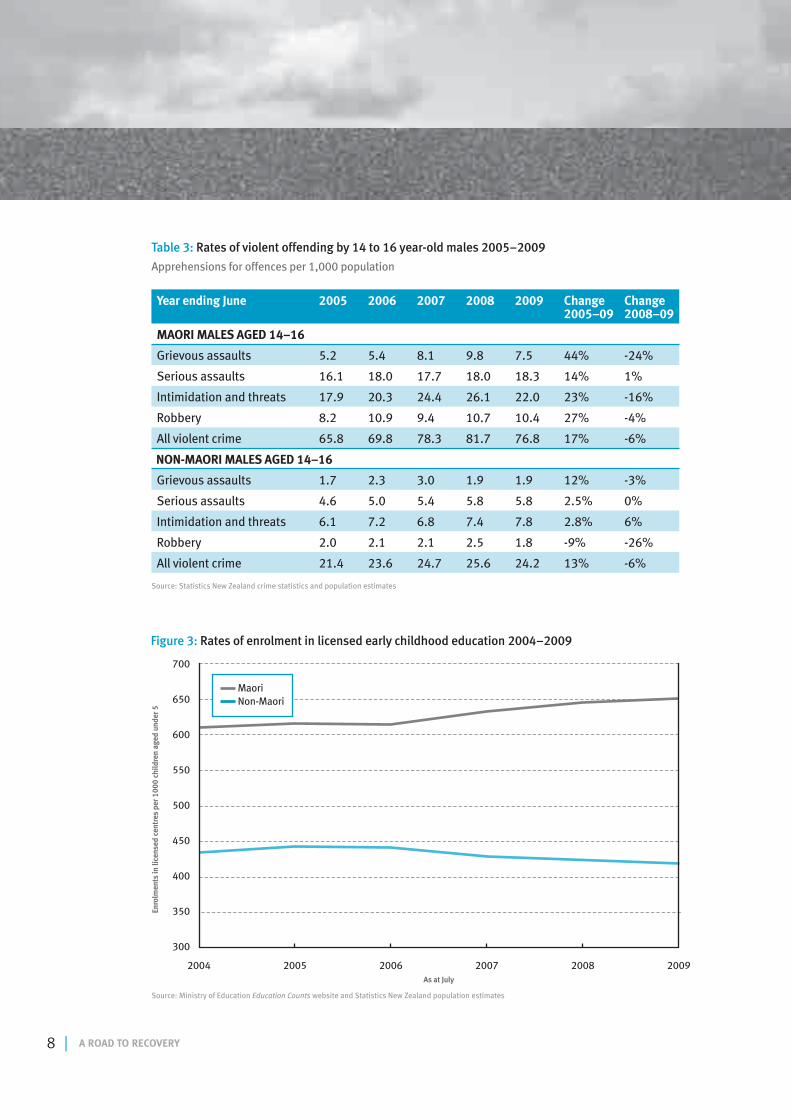
Table 3: Rates of violent offending by 14 to 16 year-old males 2005–2009
Apprehensions for offences per 1,000 population
Year ending June 2005 2006 2007 2008 2009 Change 2005–09
Change 2008–09
MAORI MALES AGED 14–16
Grievous assaults 5.2 5.4 8.1 9.8 7.5 44% -24%
Serious assaults 16.1 18.0 17.7 18.0 18.3 14% 1%
Intimidation and threats 17.9 20.3 24.4 26.1 22.0 23% -16%
Robbery 8.2 10.9 9.4 10.7 10.4 27% -4%
All violent crime 65.8 69.8 78.3 81.7 76.8 17% -6%
Grievous assaults 1.7 2.3 3.0 1.9 1.9 12% -3%
Serious assaults 4.6 5.0 5.4 5.8 5.8 2.5% 0%
Intimidation and threats 6.1 7.2 6.8 7.4 7.8 2.8% 6%
Robbery 2.0 2.1 2.1 2.5 1.8 -9% -26%
All violent crime 21.4 23.6 24.7 25.6 24.2 13% -6%
Source: Statistics New Zealand crime statistics and population estimates
NON-MAORI MALES AGED 14–16
A ROAD TO RECOVERY | 9
Table 3, and shows an overall 6% drop in the
rate of reported violent offending by 14- to
16-year-old males. This decline has come from
both Maori and non-Maori youth populations.
Against this decline in male violent offending,
violent offending by females aged 14 to 16
has risen by around 12%, with this growth in
offending across all ethnic groups. In 2005,
there were 11.5 apprehensions for violence for
every 1000 females aged 14 to 16. By 2008,
this rate of offending had risen to 14.5. It rose
further to 16.2 in the year to June 2009.
MAORI EARLY CHILDHOOD EDUCATION ENROLMENT RATE CONTINUES TO FALL
The trend of falling rates of enrolment of
Maori pre-schoolers continued during 2009,
with Maori children having just 65% of the
enrolment rate of non-Maori and just over
70% of the enrolment for non-Maori children
in the targeted three- and four-year-old age
group. The Maori enrolment rate in licensed
early childhood education centres fell slightly
between 2008 and 2009 from 42.5% to 42.0%
and from 43.6% in 2004. At the same time,
non-Maori enrolment has risen from 61.3%
in 2004 to 64.6% in 2007 to 65.1% in 2008.
These trends are illustrated in Figure 3.
Both Government policy and educational
thinking targets the three- and four-year-old
age group for access to early educational
opportunity. The resulting delivery of this
policy is, however, demonstrably unfair
towards Maori children. In July 2009, 73% of
Maori three- and four-year-olds were attending
a licensed early childhood education facility,
compared with almost all non-Maori children
of the same age.8
Ironically, while the percentage of Maori
children enrolled in early childhood education
has fallen, the number of Maori pre-schoolers
actually enrolled in licensed centres grew
nearly 4% during 2008/09 to 36,118 children.
This figure is nearly 10% higher than in 2004.
For the population overall, total enrolments
grew 2.2% during 2008/09 to 180,910
children, which is nearly 11% more than the
163,085 pre-schoolers enrolled in 2004.
The main reason for the anomaly between
enrolment rates and enrolments for Maori
children is the apparently high Maori birth
rate. Over the five years to June 2009, the
Maori population of pre-schoolers grew
nearly 13%, while that for non-Maori grew
at a more modest 4%9. Because the number
of Maori children is growing faster than the
number of enrolments in early childhood
education, the Maori enrolment rate is falling.
This trend poses considerable challenges as
to where early childhood education centres
to cater for Maori children will be placed
and by whom. Simply relying on the current
provision models, which is largely driven by
private sector investment, may not necessarily
address the early education needs of Maori
children and their whanau. On a positive note,
during 2008/09, enrolments in Kohanga Reo
rose by 123 children to 9,288, reversing a six-
year trend of declines.
10 | A ROAD TO RECOVERY
0%
10%
20%
30%
40%
50%
60%
70%
80%
90%
% o
f Yea
r 11
stud
ents
reac
hing
NCE
A Le
vel 1
Decile of secondary school
1 2 3 4 5 6 7 8 9 10
2008
2004
Figure 4: Rates of student achievement across secondary schools 2004–2008
Table 4: NCEA Level 1/Year 11 achievement gaps 2004–2008
2004 2007 2008
Decile 1 secondary schools 30.2% 43.6% 43.2%
Decile 10 secondary schools 76.6% 78.1% 76.4%
Achievement gap between Decile 1 and 10 46.4% 34.4% 33.1%
Decile 1, 2 and 3 secondary schools 37.1% 47.6% 49.5%
Decile 8, 9 and 10 secondary schools 72.1% 75.6% 75.0%
Achievement gap between Decile 1–3 and Decile 8–10 35.0% 27.9% 25.4%
PASS RATES
Source: National Qualifications Authority website
A ROAD TO RECOVERY | 11
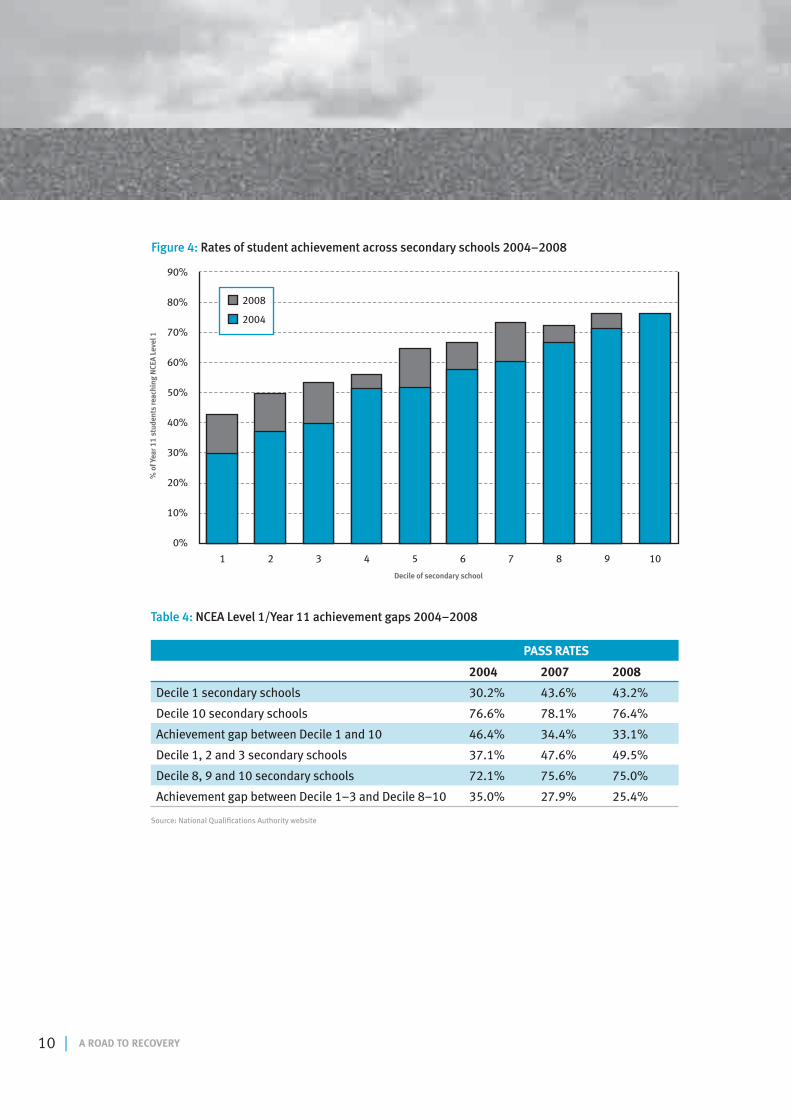
NCEA ACHIEVEMENT GAPS CONTINUE TO NARROW
Recent improvements in rates of academic
achievement by students from low-decile
secondary schools were sustained during
2008. While students from poorer schools
(deciles 1, 2 and 3) have pass rates that are
much lower than those of students from
wealthier schools (deciles 8, 9 and 10), this
gap has narrowed since 2004. NCEA results
for the 2008 academic year have consolidated
these gains, as shown in Figure 4 and Table 4
for NCEA Level 1 pass rates by Year 11
students.10 A similar improvement is also
apparent in NCEA Level 3 pass rates by Year
13 students. Although achievement gaps have
narrowed, they remain regrettably large. The
Level 1/Year 11 pass rate at the poorest 30%
of secondary schools is still only two-thirds of
that of the wealthiest 30% of schools. More
regrettably, the Level 3/Year 13 pass rate at
decile 1 to 3 high schools is still only half that
of decile 8 to 10 schools.
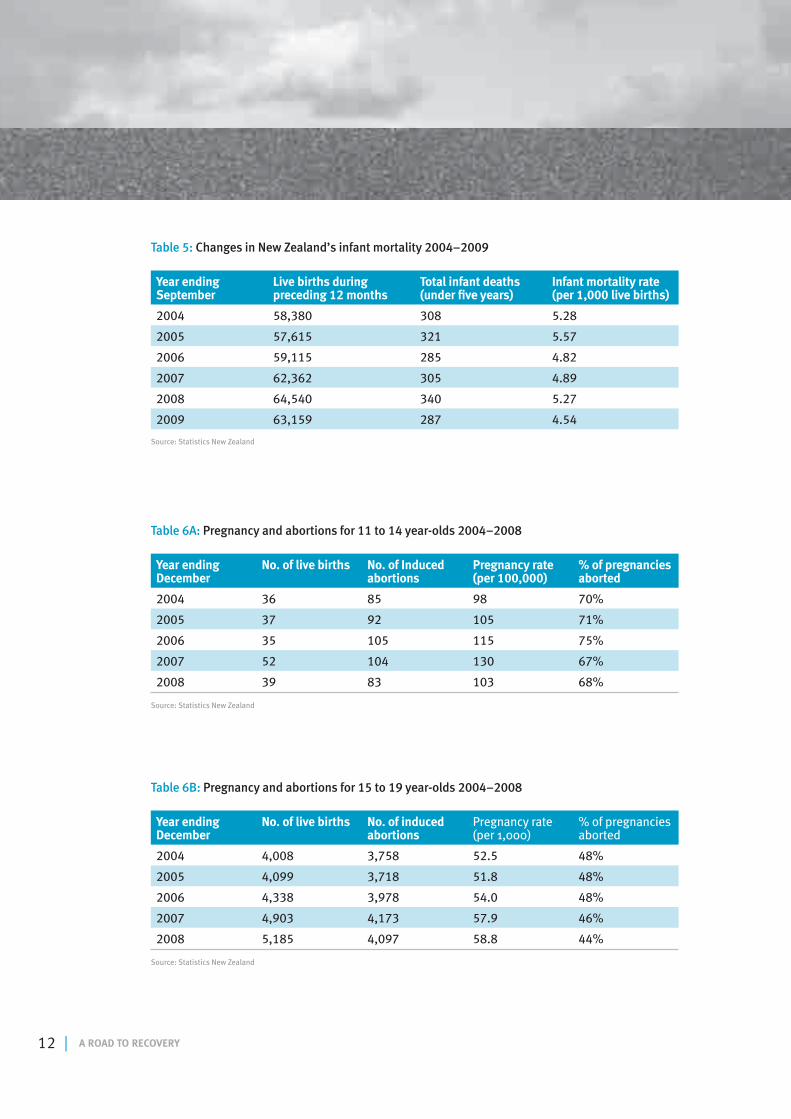
INFANT MORTALITY RATE IMPROVES
New Zealand’s infant mortality rate improved
slightly during 2008/09 to stand at an
equivalent of 4.54 deaths per 1000 live
births (see Table 5). During the same period,
however, Maori infant mortality rates (for
June years) rose slightly to 8.49 (deaths per
1000 live births). The Maori infant mortality
rate is over twice that of non-Maori, which at
3.96 (deaths per 1000 live births) is almost
unchanged from two years prior.
By comparison, Australia’s infant mortality
rate was 4.2 (2007 figures), while the United
Kingdom’s was 4.8 (2007) and the United
States was 6.7 (2006).11 The infant mortality
rate in many countries in Africa exceeds 100.
FEWER PREGNANCIES AMONGST YOUNG TEENAGERS
The number of young teenagers having
abortions or giving birth fell to the lowest
rate in four years. In 2008, 39 11- to 14-year-
olds gave birth, with a further 83 receiving
abortions, meaning that the pregnancy rate for
females in this age group dropped to 103 per
100,00012 of abortions (see Table 6A).
Against this decline in pregnancy rates for
young teenagers there appears to have been
a significant increase in pregnancy rates for
older teenage women aged between 15 and
19. In 2008, there were nearly 59 pregnancies
per 1000 women aged 15 to 19 years, a slight
increase from the rate of 58 in 2007 and 52
in 2005 (see Table 6B). While there has been
an overall increase in birth rates since 2006,
the number of births to teenage mothers has
increased at a still faster rate. In 2004, births
to teenage mothers represented 6.9% of all
live births, while by 2008 this proportion
had risen to 8.1%. By comparison, births to
teenage mothers in Australia represent just
4.2% of births.13
The declining proportion of teenage
pregnancies that end in induced abortions
(from 48% in 2004 to 44% in 2008) is an
encouraging trend and probably points to
fewer unwanted pregnancies.
12 | A ROAD TO RECOVERY
Table 6B: Pregnancy and abortions for 15 to 19 year-olds 2004–2008
Year ending December
No. of live births No. of induced abortions
Pregnancy rate (per 1,000)
% of pregnancies aborted
2004 4,008 3,758 52.5 48%
2005 4,099 3,718 51.8 48%
2006 4,338 3,978 54.0 48%
2007 4,903 4,173 57.9 46%
2008 5,185 4,097 58.8 44%
Source: Statistics New Zealand
Table 5: Changes in New Zealand’s infant mortality 2004–2009
Year ending September
Live births during preceding 12 months
Total infant deaths (under five years)
Infant mortality rate (per 1,000 live births)
2004 58,380 308 5.28
2005 57,615 321 5.57
2006 59,115 285 4.82
2007 62,362 305 4.89
2008 64,540 340 5.27
2009 63,159 287 4.54
Source: Statistics New Zealand
Table 6A: Pregnancy and abortions for 11 to 14 year-olds 2004–2008
Year ending December
No. of live births No. of Induced abortions
Pregnancy rate (per 100,000)
% of pregnancies aborted
2004 36 85 98 70%
2005 37 92 105 71%
2006 35 105 115 75%
2007 52 104 130 67%
2008 39 83 103 68%
Source: Statistics New Zealand
A ROAD TO RECOVERY | 13
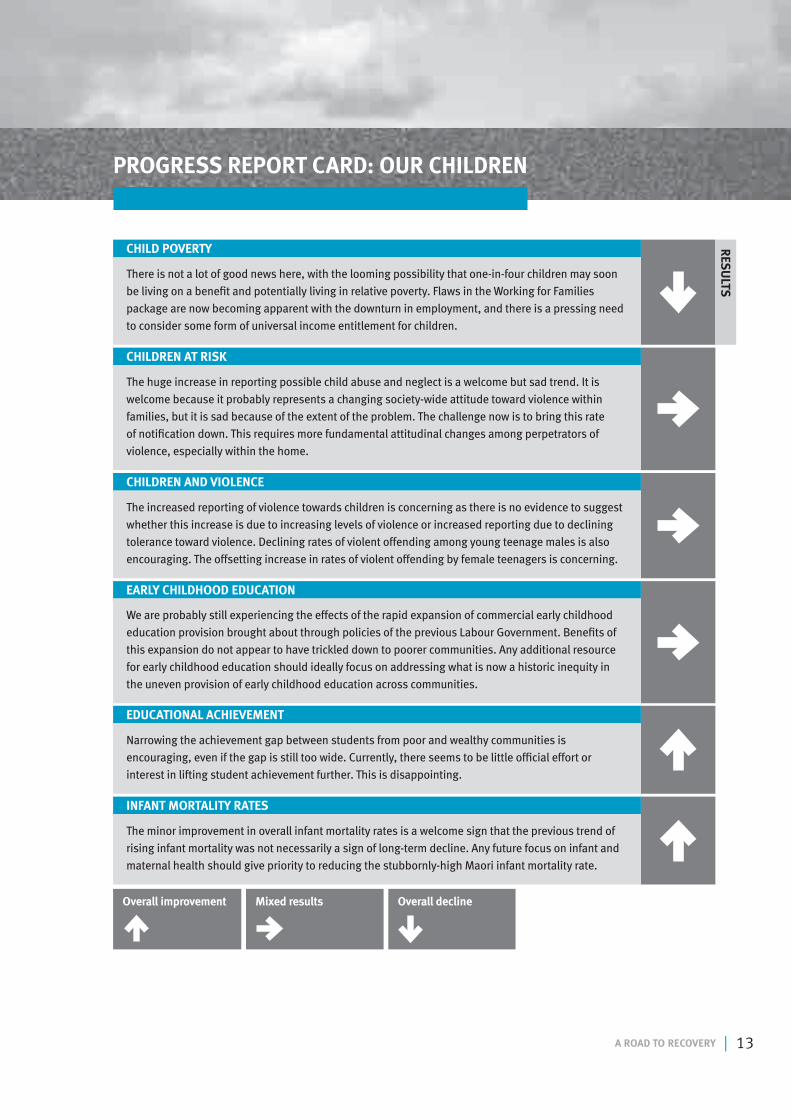
PROGRESS REPORT CARD: OUR CHILDREN
Narrowing the achievement gap between students from poor and wealthy communities is
encouraging, even if the gap is still too wide. Currently, there seems to be little official effort or
interest in lifting student achievement further. This is disappointing.
EDUCATIONAL ACHIEVEMENT
The minor improvement in overall infant mortality rates is a welcome sign that the previous trend of
rising infant mortality was not necessarily a sign of long-term decline. Any future focus on infant and
maternal health should give priority to reducing the stubbornly-high Maori infant mortality rate.
INFANT MORTALITY RATES
The huge increase in reporting possible child abuse and neglect is a welcome but sad trend. It is
welcome because it probably represents a changing society-wide attitude toward violence within
families, but it is sad because of the extent of the problem. The challenge now is to bring this rate
of notification down. This requires more fundamental attitudinal changes among perpetrators of
violence, especially within the home.
CHILDREN AT RISK
The increased reporting of violence towards children is concerning as there is no evidence to suggest
whether this increase is due to increasing levels of violence or increased reporting due to declining
tolerance toward violence. Declining rates of violent offending among young teenage males is also
encouraging. The offsetting increase in rates of violent offending by female teenagers is concerning.
CHILDREN AND VIOLENCE
We are probably still experiencing the effects of the rapid expansion of commercial early childhood
education provision brought about through policies of the previous Labour Government. Benefits of
this expansion do not appear to have trickled down to poorer communities. Any additional resource
for early childhood education should ideally focus on addressing what is now a historic inequity in
the uneven provision of early childhood education across communities.
EARLY CHILDHOOD EDUCATION
There is not a lot of good news here, with the looming possibility that one-in-four children may soon
be living on a benefit and potentially living in relative poverty. Flaws in the Working for Families
package are now becoming apparent with the downturn in employment, and there is a pressing need
to consider some form of universal income entitlement for children.
CHILD POVERTY RES
ULTS
Overall improvement Overall declineMixed results

14 | A ROAD TO RECOVERY
Daisy Fau Tanuvasa is a female prison officer at the women’s prison in Wiri, Auckland. 4 June 2009.
Photo: APN/Greg Bowker
A ROAD TO RECOVERY | 15
It seems that an important social experiment
commenced in New Zealand around 2002
with Parliament passing the Sentencing Act.
This Act ushered in a new way of thinking
about crime and punishment. It created the
expectation that offenders would face harsher
penalties and longer sentences and that, as
a result, our communities and homes would
be safer. Since 2002, New Zealand’s prison
population has grown by over 40%, our rate of
imprisonment has increased by 21% and the
number of people serving community-based
sentences has more than doubled. Yet despite
this tougher stance on crime, the rate of violent
offending has increased by 10% since 2002.
Political responses to these trends have
regrettably been more of the same. During
2009, Parliament considered at least seven
pieces of legislation14 that, it might be argued,
sought to make the criminal justice system
more punitive. Furthermore, little attention
has been paid to the rising cost of this more
punitive approach. For example, the financial
cost of running the Department of Corrections
rose 64% in inflation-adjusted terms between
2004 and 2009. It is likely to top $1 billion for
the first time during 2009/10.15
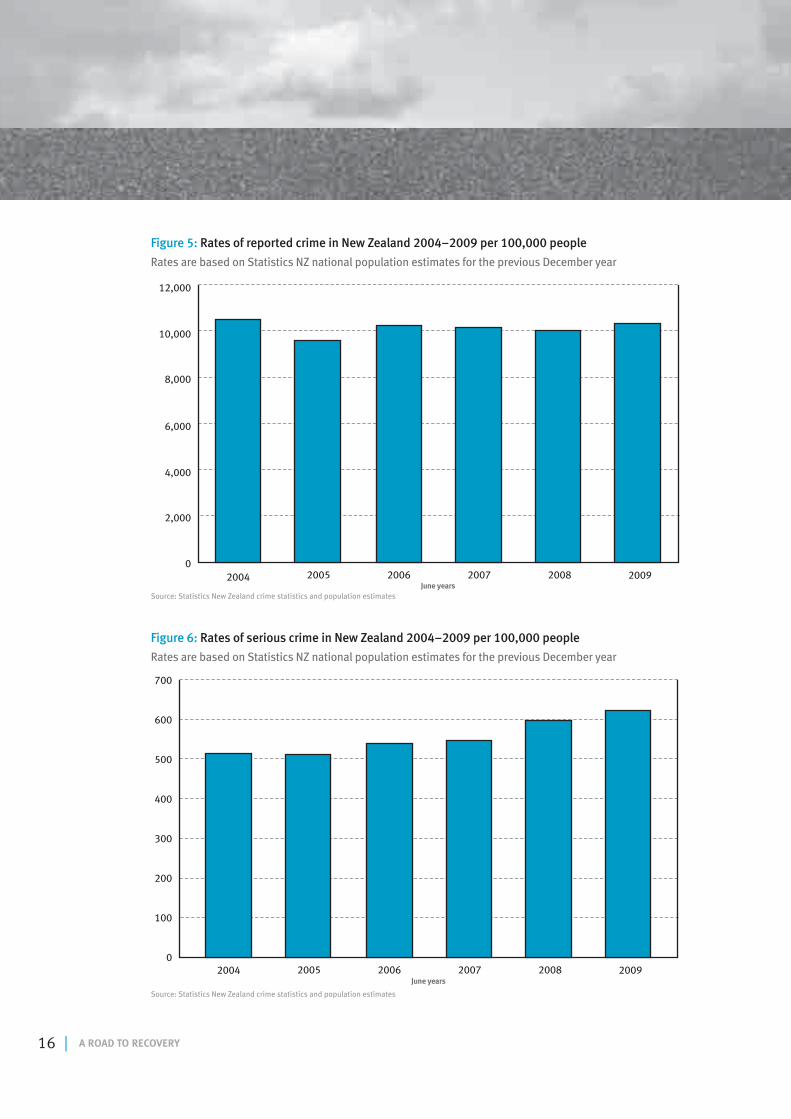
SLIGHT INCREASE IN OVERALL CRIME RATES
For the year to 30 June 2009, 442,540 crimes
were reported to Police, an increase of nearly
4% from the previous year but slightly less
than the 447,146 crimes reported in the
record year of 2002/03. As a rate per 100,000
people, New Zealand’s reported crime rate
rose slightly from 10,086 crimes per 100,000
people in 2007/08 to 10,361/100,000 people
in 2008/09 (see Figure 5 for trends). Five years
previously, in 2003/04, the rate was slightly
higher at 10,580 crimes for every 100,000
New Zealanders.
Police managed to resolve 47.9% of these
reported crimes, a modest improvement on the
resolution rate of 47.0% for the previous year
and significantly better than the rate of 45.1%
five years previously, in 2003/04.
Generally, Police resolution has consistently
risen across all types of crime. Some types,
however, have a greater chance of being
resolved because they receive priority
attention (such as very serious crimes), or
because they are the result of Police operations
(such as with drug busts), or because the
offender is known to the victim (as with
domestic violence). Other types, especially
those of burglary and theft, which account for
about 40% of all reported crime, have a very
low chance of being solved (typically 20-25%),
mainly because the offender is most often not
known to the victim and because these crimes
do not receive Police priority.
CRIME AND PUNISHMENT
16 | A ROAD TO RECOVERY
0
2,000
4,000
6,000
8,000
10,000
12,000
2004June years
20062005 20082007 2009
Figure 5: Rates of reported crime in New Zealand 2004–2009 per 100,000 people
Rates are based on Statistics NZ national population estimates for the previous December year
Source: Statistics New Zealand crime statistics and population estimates
100
0
200
300
400
500
600
700
2004
Figure 6: Rates of serious crime in New Zealand 2004–2009 per 100,000 people
Rates are based on Statistics NZ national population estimates for the previous December year
Source: Statistics New Zealand crime statistics and population estimates
June years20062005 20082007 2009
A ROAD TO RECOVERY | 17
Perhaps unsurprisingly, the types of crime with
low rates of resolution are those accounting
for a declining share of total reported crime.
For example, in the year to 30 June 2000,
burglaries and thefts accounted for 46% of
all reported crime and 22% of resolved crime,
while by 2009, burglaries and thefts make up
less than 40% of all reported crime and just
17% of resolved crime. During this decade,
reported crime rose a modest 2.4%, while
reported burglaries and thefts declined 12%.
The New Zealand Safety and Crime Survey
200616 reported that only 36% of respondents
who had been victims of a crime bothered to
report it to Police, while a similar result of a
40% reporting rate came from a similar survey
in 2001. Nearly half of those failing to report
a crime said it was too trivial to report, while
one-third felt that “the Police could not have
done anything, would not have been bothered,
or were too busy to attend to the matter”.
When crimes were ranked according to the
seriousness of the offence, only half of the
most serious crime was reported, while just
17% of the least serious crime was reported.
A follow-up Safety and Crime Survey was
undertaken by the Ministry of Justice in early
2009. The results are expected to be published
during 2010.
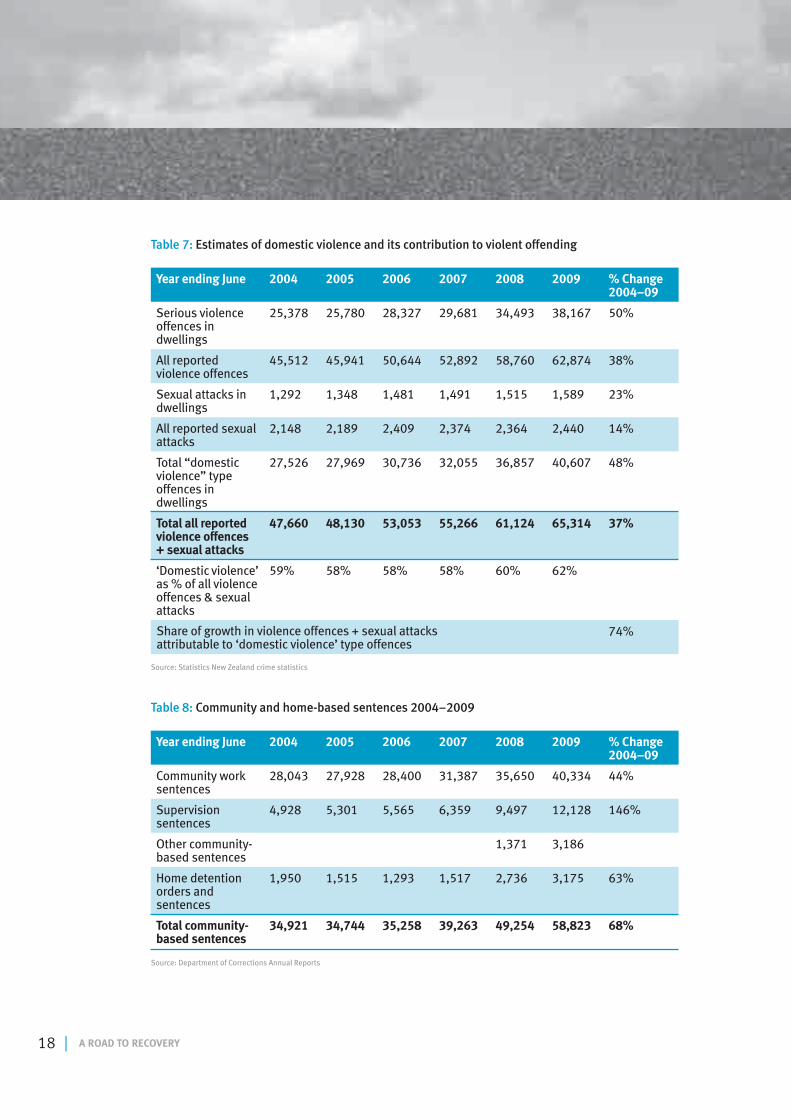
DOMESTIC VIOLENCE IS DRIVING HIGHER RATES OF SERIOUS CRIME
Rates of serious crime, those involving serious
violence or sexual attacks,17 rose over the 12
months to June 2009 to 625 crimes for every
100,000 people, an increase of 5% above the
rate of 597 per 100,000 in 2007/08 and 22%
more than the rate of 513 offences for every
100,000 in 2003/04 (see Figure 6 for trends).
Perhaps as much as three-quarters of this
increase may be due to increased reporting of
family or domestic violence.
Domestic violence is not reported as a separate
category of offending, although Police do
record domestic incidents separately and
at some future time this information may be
released by them18. As a proxy for domestic
violence, we have analysed crime data by
the location of offending and made the
assumption that offences of a violent or sexual
nature that take place in a dwelling are most
likely to be cases of domestic violence.19
Table 7 reports this contribution and is based
on crime data reported by Statistics New
Zealand. As this table shows, you are more
likely to be a victim of violence in your home
than anywhere else.
Table 7 offers some welcome news, which
is the impact of the “It’s not OK” campaign
against family violence. This campaign
commenced in September 2007. The resulting
increasing level of reporting of domestic
violence is apparent in the figures in Table 3 for
the 2008 and 2009 years.
18 | A ROAD TO RECOVERY
Year ending June 2004 2005 2006 2007 2008 2009 % Change 2004–09
Serious violence offences in dwellings
25,378 25,780 28,327 29,681 34,493 38,167 50%
All reported violence offences
45,512 45,941 50,644 52,892 58,760 62,874 38%
Sexual attacks in dwellings
1,292 1,348 1,481 1,491 1,515 1,589 23%
All reported sexual attacks
2,148 2,189 2,409 2,374 2,364 2,440 14%
Total “domestic violence” type offences in dwellings
27,526 27,969 30,736 32,055 36,857 40,607 48%
Total all reported violence offences + sexual attacks
47,660 48,130 53,053 55,266 61,124 65,314 37%
‘Domestic violence’ as % of all violence offences & sexual attacks
59% 58% 58% 58% 60% 62%
74%
Table 7: Estimates of domestic violence and its contribution to violent offending
Share of growth in violence offences + sexual attacks attributable to ‘domestic violence’ type offences
Source: Statistics New Zealand crime statistics
Year ending June 2004 2005 2006 2007 2008 2009 % Change 2004–09
Community work sentences
28,043 27,928 28,400 31,387 35,650 40,334 44%
Supervision sentences
4,928 5,301 5,565 6,359 9,497 12,128 146%
Other community-based sentences
1,371 3,186
Home detention orders and sentences
1,950 1,515 1,293 1,517 2,736 3,175 63%
Total community-based sentences
34,921 34,744 35,258 39,263 49,254 58,823 68%
Table 8: Community and home-based sentences 2004–2009
Source: Department of Corrections Annual Reports
A ROAD TO RECOVERY | 19
GROWTH IN COMMUNITY-BASED SENTENCES CONTINUES UNABATED
Community-based sentences, which include
various forms of home detention, grew by
nearly 20% during 2008/09. This growth
is on the back of 25% growth during the
previous year. For the year to June 2008,
58,823 community sentences were being or
had been served, including nearly 3200 home
detentions. These trends are reported in detail
in Table 8.
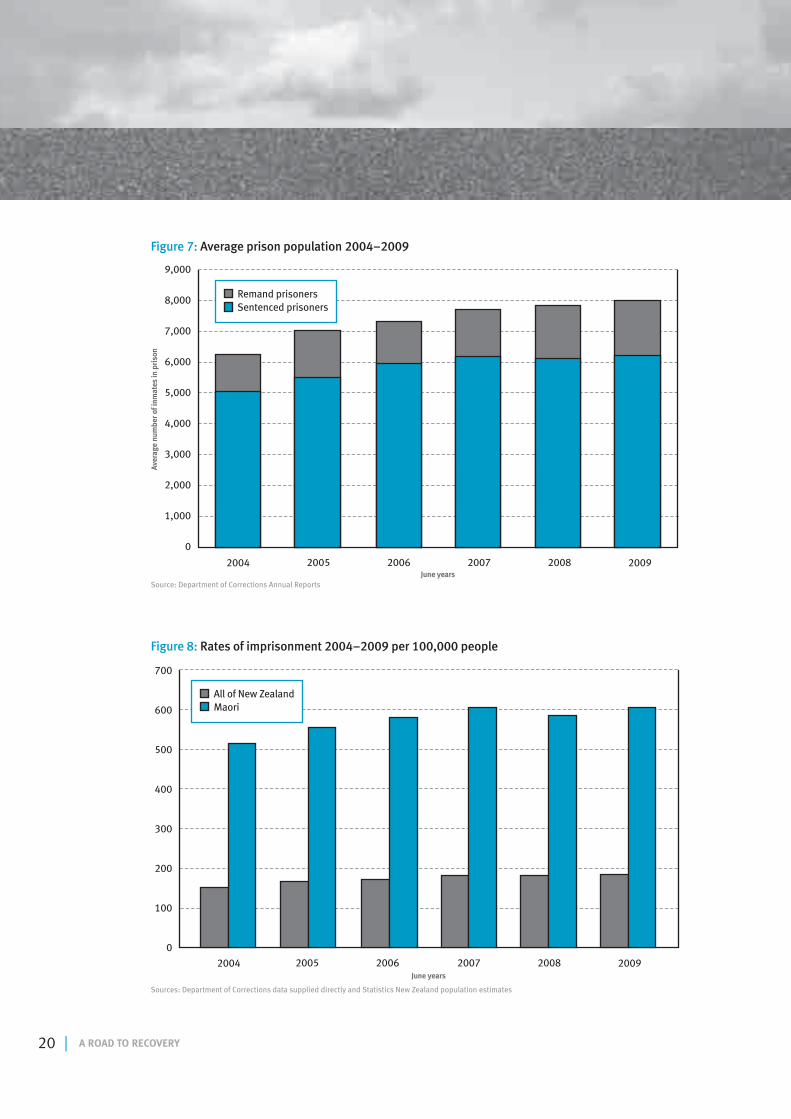
MINOR INCREASE IN PRISONER POPULATION
The average prison population exceeded 8000
for the first time during 2008/09 (see Figure 7
for trends). The average number of inmates
held in New Zealand’s prisons during 2008/09
was 8012, of whom 6227 were sentenced
prisoners and 1787 were held on remand.20
95% of prisoners were male, 49% were
Maori.21 The average number of prisoners in
2008/09 was 2% higher than for the previous
year and 29% higher than in 2003/04.
As in previous years, the remand prisoner
population has grown at a faster rate than
the sentenced prisoner muster. The remand
prisoner population rose 4% over the year
to June 2009 and has risen 55% since 2004.
The current growth in New Zealand’s prison
population is consistent with Department
of Correction’s forecasts that the number of
prisoners will exceed 9000 by early 2011 and
that by this time, the country’s prisons and
police cells will be at full capacity.22
Consistent with these modest increases in
the national prison muster is the outcome
that imprisonment rates have stabilised
for the overall population, although there
appears to have been a slight increase in
Maori imprisonment rates. For 2008/09 the
imprisonment rate for the total New Zealand
population was 186 prisoners per 100,000
people, up 1% on the 2007/08 figure of
184 but an increase of nearly 22% over the
2003/04 rate of 152 prisoners per 100,000
people.
Maori are 5.6 times more likely to be
imprisoned than non-Maori, and they
consistently account for nearly half the prison
population despite the fact that Maori make
up just 15% of the national population. Maori
imprisonment rates appear to have risen
slightly over 2008/09, from a rate of 585
prisoners per 100,000 people in 2007/08
to 604 in 2008/09 (see Figure 8 for trends).
This latest figure is slightly less than the
historical high of 607 prisoners per 100,000
people in 2006/07, but is 17% higher than
the imprisonment rate of 514 per 100,000 in
2003/04.
Because 95% of prisoners are male, the
male imprisonment rate is nearly twice these
population-wide rates and stands at 1163
prisoners per 100,000 people for Maori males
and 214 per 100,000 for non-Maori males.
20 | A ROAD TO RECOVERY
0
1,000
2,000
3,000
4,000
5,000
6,000
7,000
8,000
9,000
Aver
age
num
ber o
f inm
ates
in p
riso
n
June years2004 20062005 20082007 2009
Remand prisoners Sentenced prisoners
Figure 7: Average prison population 2004–2009
Source: Department of Corrections Annual Reports
100
0
200
300
400
500
600
700
June years
2004 20062005 20082007 2009
All of New Zealand Maori
Figure 8: Rates of imprisonment 2004–2009 per 100,000 people
Sources: Department of Corrections data supplied directly and Statistics New Zealand population estimates
A ROAD TO RECOVERY | 21
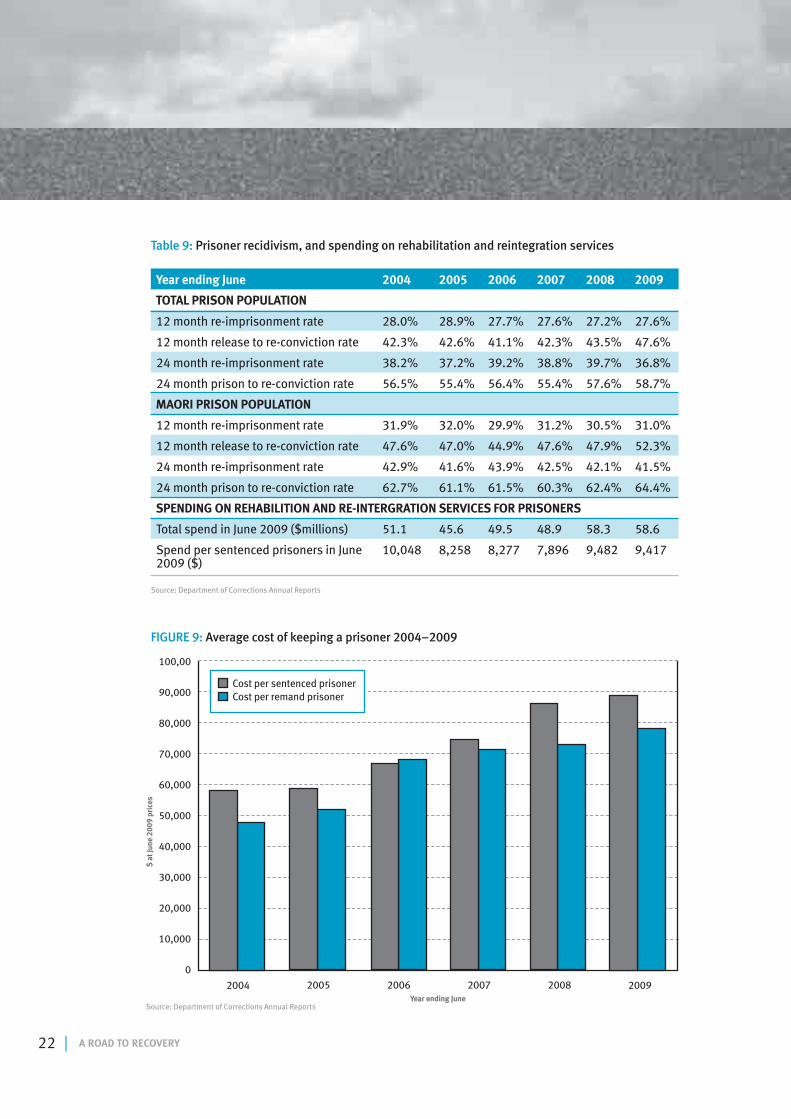
NO PROGRESS ON REDUCING RE-OFFENDING
Perhaps the most discouraging aspect of the
whole criminal justice system is the complete
lack of progress in reducing rates of prisoner
re-offending. Nearly half of released prisoners
will re-offend within 12 months of their
release, while over one-third will be back in
prison within two years of their release. Rates
of re-offending and re-imprisonment are higher
for Maori than for non-Maori. These rates
have changed little over the past five years, as
illustrated in Table 9.
THE COST OF LOCKING PEOPLE UP CONTINUES TO RISE
During 2009/10, the cost of running the
Department of Corrections will exceed $1
billion for the first time. In inflation-adjusted
terms, the cost of the penal system rose
64% in the five years to June 2009. This cost
increase is as a result of increased prisoner
and offender numbers as well as the increasing
cost of locking someone up. The trends in
prisoner costs for both sentenced and remand
prisoners is shown in Figure 9.
The average cost of keeping remand prisoners
was $78,117 in 2008/09, an increase (in
inflation-adjusted terms) of 7% over the
previous year and an increase of nearly 63%
over the previous five years. Average costs for
sentenced prisoners rose a more modest 3%
in real terms during 2008/09 to $89,016 per
prisoner, although this cost is still 53% more
than the equivalent cost back in 2004/05.23
22 | A ROAD TO RECOVERY
10,000
0
20,000
30,000
40,000
50,000
60,000
70,000
80,000
90,000
100,00
$ at
June
200
9 pr
ices
Year ending June
2004 20062005 20082007 2009
Cost per sentenced prisoner Cost per remand prisoner
FIGURE 9: Average cost of keeping a prisoner 2004–2009
Source: Department of Corrections Annual Reports
Year ending June 2004 2005 2006 2007 2008 2009
12 month re-imprisonment rate 28.0% 28.9% 27.7% 27.6% 27.2% 27.6%
12 month release to re-conviction rate 42.3% 42.6% 41.1% 42.3% 43.5% 47.6%
24 month re-imprisonment rate 38.2% 37.2% 39.2% 38.8% 39.7% 36.8%
24 month prison to re-conviction rate 56.5% 55.4% 56.4% 55.4% 57.6% 58.7%
12 month re-imprisonment rate 31.9% 32.0% 29.9% 31.2% 30.5% 31.0%
12 month release to re-conviction rate 47.6% 47.0% 44.9% 47.6% 47.9% 52.3%
24 month re-imprisonment rate 42.9% 41.6% 43.9% 42.5% 42.1% 41.5%
24 month prison to re-conviction rate 62.7% 61.1% 61.5% 60.3% 62.4% 64.4%
Total spend in June 2009 ($millions) 51.1 45.6 49.5 48.9 58.3 58.6
Spend per sentenced prisoners in June 2009 ($)
10,048 8,258 8,277 7,896 9,482 9,417
Table 9: Prisoner recidivism, and spending on rehabilitation and reintegration services
TOTAL PRISON POPULATION
MAORI PRISON POPULATION
SPENDING ON REHABILITION AND RE-INTERGRATION SERVICES FOR PRISONERS
Source: Department of Corrections Annual Reports
A ROAD TO RECOVERY | 23
PROGRESS REPORT CARD: CRIME AND PUNISHMENT
While the figures showing increasing rates of violent offending appear discouraging, increased rates
of reporting of domestic violence is no doubt the underlying cause for this. Continuing Government
support for the “It’s not OK” campaign makes sense and is encouraging.
SERIOUS CRIME
Although rates of reported crime remain static, the extent of unreported crime and rising community
indifference to non-violent crime are sources of some concern.
OVERALL CRIME
The modest increase in prisoner numbers during 2008/09 may just be a temporary lull in a most
discouraging trend. The continuing rapid increase in community-based sentences should be raising
questions over the viability of the current approach, but regrettably it isn’t.
IMPRISONMENT AND SENTENCING
When you always do what you have always done, you always get what you always got. The case for a
major overhaul of prison programmes is apparent, with little visible political commitment to change.
RECIDIVISM
RES
ULTS
Overall improvement Overall declineMixed results
24 | A ROAD TO RECOVERY
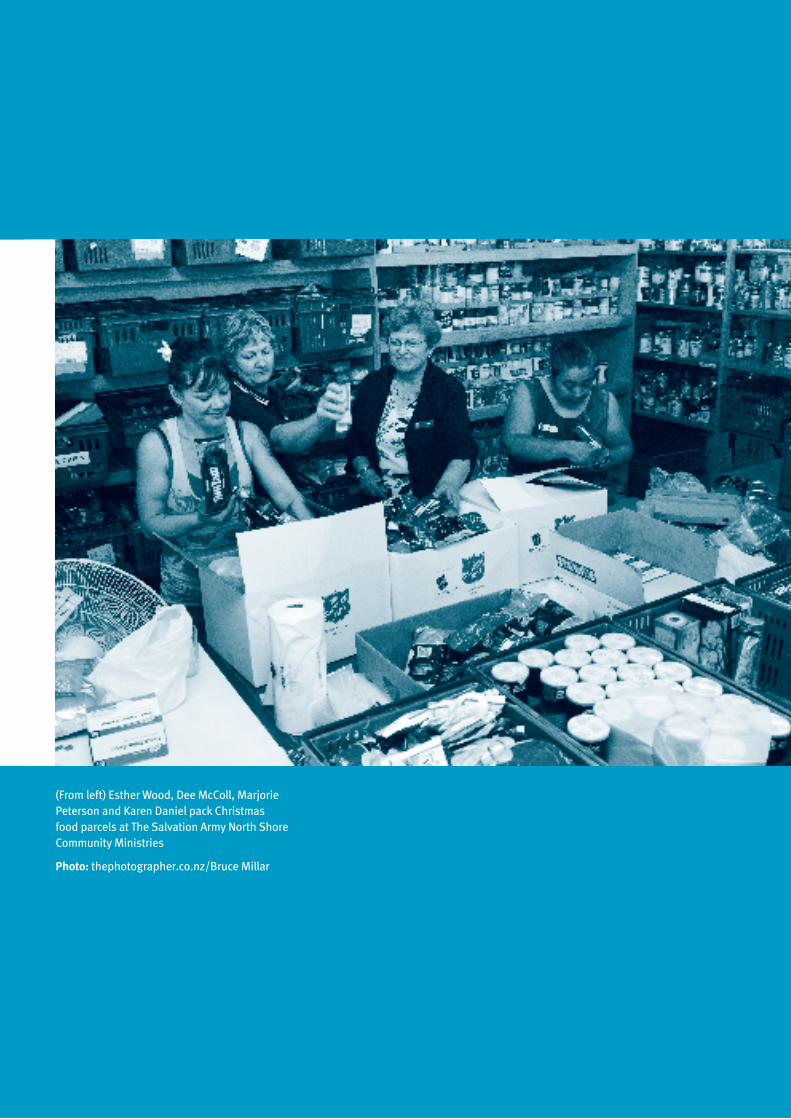
(From left) Esther Wood, Dee McColl, Marjorie Peterson and Karen Daniel pack Christmas food parcels at The Salvation Army North Shore Community Ministries
Photo: thephotographer.co.nz/Bruce Millar
A ROAD TO RECOVERY | 25
The recession has taken its toll on job
numbers, on families’ working lives and on
household incomes. Two years ago, New
Zealanders were probably in danger of
working too much and, by doing so, sacrificing
their home lives. Today, it seems that some
households are doing all right, that some are
working harder and that some are not working
at all. As a result, there are emerging signs of
a growing gap between the well-off and those
who have few resources to fall back on.
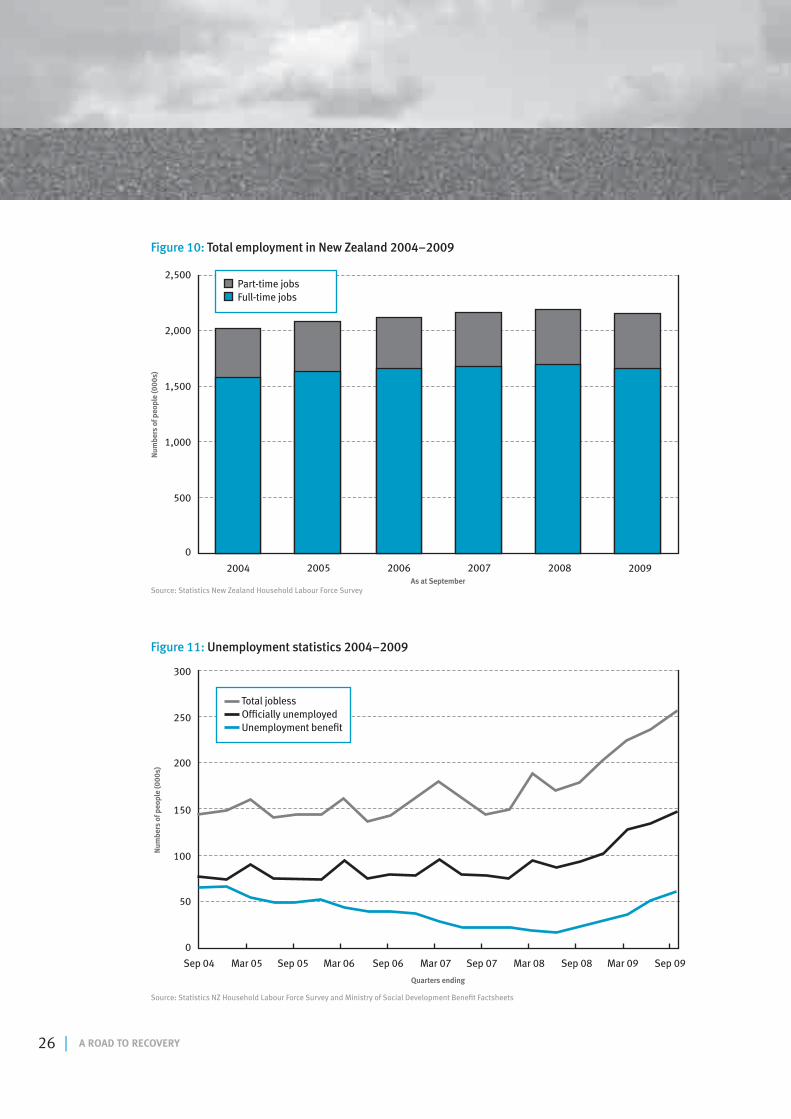
TOTAL EMPLOYMENT DROPS BY 40,000 JOBS
The impact of the recession is being witnessed
in the decline of the labour market and the
shedding of over 40,000 jobs in the year to
30 September 2009. Over half these jobs
were lost in Auckland; two-thirds of them in
manufacturing.
At the end of September 2009, New Zealand
had a total of 2.154 million jobs, 23% of which
were part-time (see Figure 10). This figure is
1.8% lower than a year previously, although
there were still 6.5% more jobs in late 2009
than five years earlier in 2004. While there
are more jobs than five years ago, there are,
of course, more people looking for them, with
the working age population growing nearly 8%
over the five years to September 2009.
As might be expected in any economic
slowdown, the job market has shrunk in a
number of ways in addition to the simple loss
of jobs. More workers are working part time,
while some people of working age are falling
out of the workforce, perhaps because of
difficulties in finding work. For example, the
proportion of people in part-time work rose to
23.1% in September 2009, up from 22.5% a
year earlier and from 21.9% five years earlier.
It is doubtful that this trend towards more
part-time work is voluntary; Statistics New
Zealand’s Household Labour Force Survey
reports that the number of people who are
underemployed (those who would work more
hours if they could) increased from 82,000 in
September 2008 to 122,000 in September
2009.24
Labour force participation rates generally
follow the fortunes of the labour market, with
participation rates rising when there is a lot
of work available and falling when times get
tough. As expected, participation rates have
fallen as jobs have become scarcer, with
the overall seasonally-adjusted rate falling
from 68.6% in September 2008 to 68.0% in
September 2009. This fall in participation is
not evenly distributed across the workforce,
with the participation rate of males falling
faster (75.6% in September 2008 to 74.1% in
September 2009) than that of females (62.5%
in September 2008 to 62.3% a year later.
Distribution of the unemployment burden
is especially skewed towards younger age
groups. For example, the participation rates
for 15- to 19-year-olds fell 3% from 51.4% in
September 2008 to 48.4% in September 2009,
while that for 45- to 49-year-olds fell just 0.7%
from 87.1% to 86.4% over the same period.
Youth unemployment has, in fact, risen quite
alarmingly, from just under 16% in September
2008 to over 25% in September 2009.
WORK AND INCOMES
26 | A ROAD TO RECOVERY
0
500
1,000
1,500
2,000
2,500
Num
bers
of p
eopl
e (0
00s)
As at September
2004 20062005 20082007 2009
Part-time jobs Full-time jobs
Figure 10: Total employment in New Zealand 2004–2009
Source: Statistics New Zealand Household Labour Force Survey
0
50
100
150
200
250
300
Num
bers
of p
eopl
e (0
00s)
Quarters ending
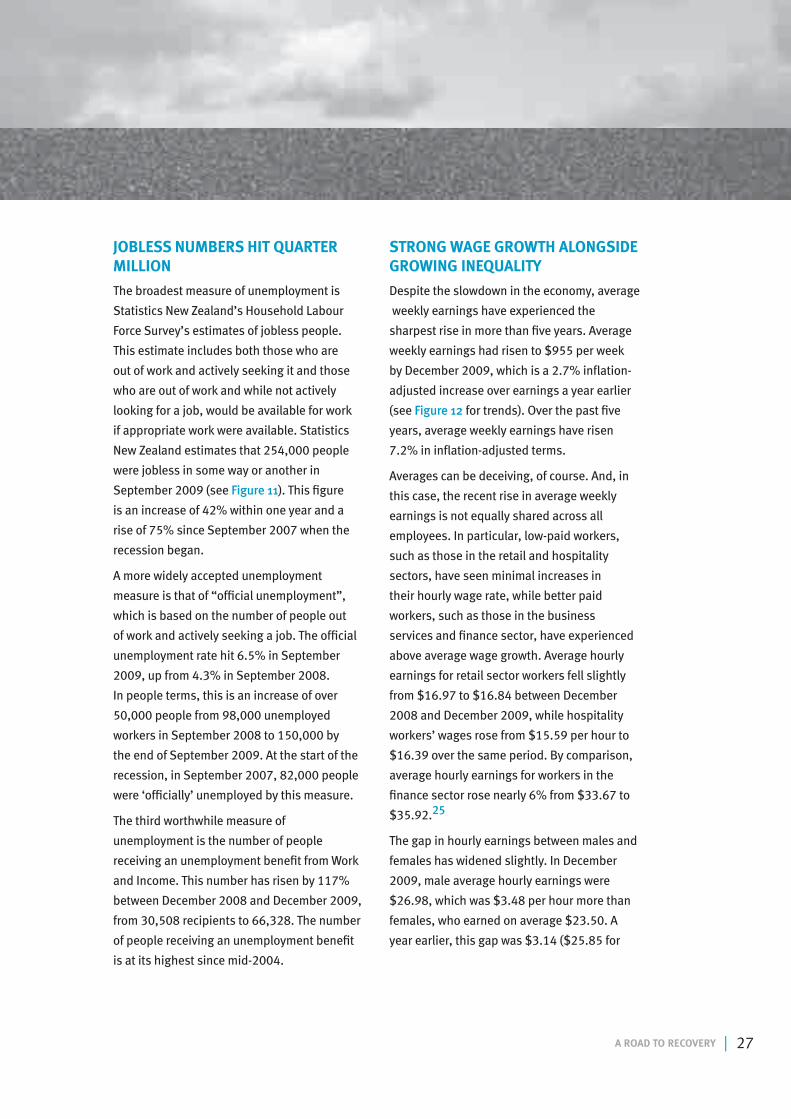
Sep 04 Sep 06Mar 05 Mar 07 Sep 08Sep 05 Sep 07 Mar 09Mar 06 Mar 08 Sep 09
Total jobless Officially unemployed Unemployment benefit
Figure 11: Unemployment statistics 2004–2009
Source: Statistics NZ Household Labour Force Survey and Ministry of Social Development Benefit Factsheets
A ROAD TO RECOVERY | 27
JOBLESS NUMBERS HIT QUARTER MILLION
The broadest measure of unemployment is
Statistics New Zealand’s Household Labour
Force Survey’s estimates of jobless people.
This estimate includes both those who are
out of work and actively seeking it and those
who are out of work and while not actively
looking for a job, would be available for work
if appropriate work were available. Statistics
New Zealand estimates that 254,000 people
were jobless in some way or another in
September 2009 (see Figure 11). This figure
is an increase of 42% within one year and a
rise of 75% since September 2007 when the
recession began.
A more widely accepted unemployment
measure is that of “official unemployment”,
which is based on the number of people out
of work and actively seeking a job. The official
unemployment rate hit 6.5% in September
2009, up from 4.3% in September 2008.
In people terms, this is an increase of over
50,000 people from 98,000 unemployed
workers in September 2008 to 150,000 by
the end of September 2009. At the start of the
recession, in September 2007, 82,000 people
were ‘officially’ unemployed by this measure.
The third worthwhile measure of
unemployment is the number of people
receiving an unemployment benefit from Work
and Income. This number has risen by 117%
between December 2008 and December 2009,
from 30,508 recipients to 66,328. The number
of people receiving an unemployment benefit
is at its highest since mid-2004.
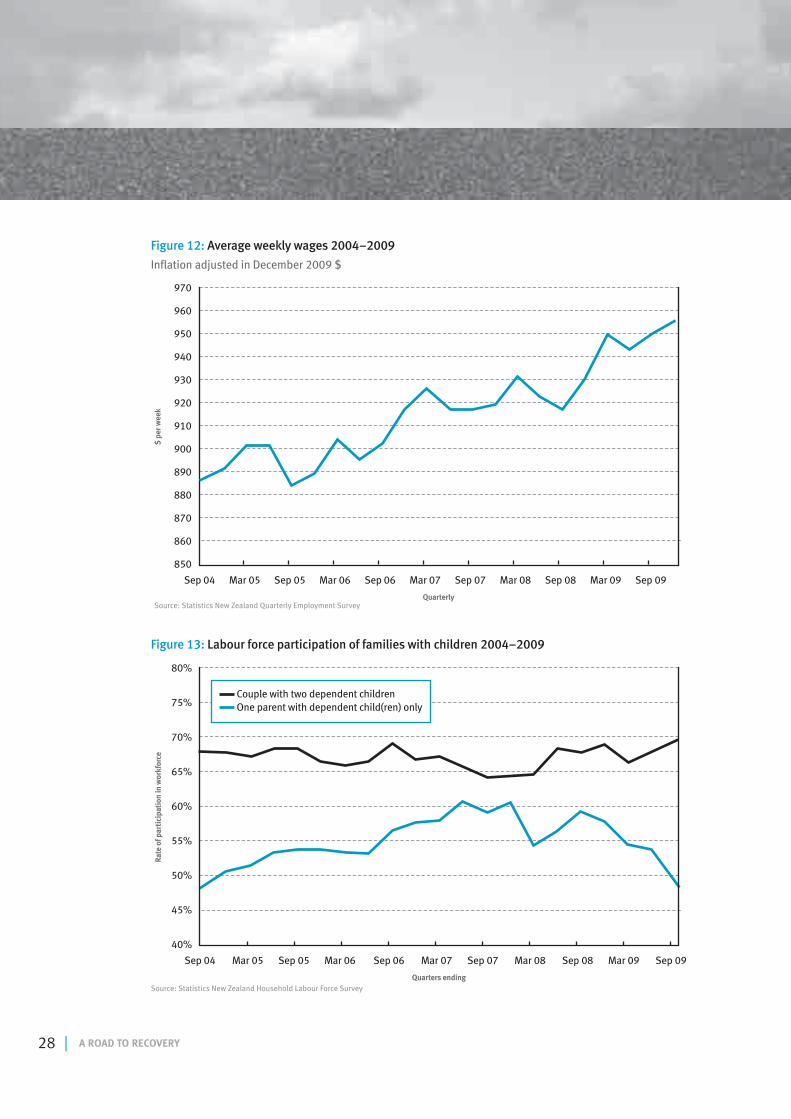
STRONG WAGE GROWTH ALONGSIDE GROWING INEQUALITY
Despite the slowdown in the economy, average
weekly earnings have experienced the
sharpest rise in more than five years. Average
weekly earnings had risen to $955 per week
by December 2009, which is a 2.7% inflation-
adjusted increase over earnings a year earlier
(see Figure 12 for trends). Over the past five
years, average weekly earnings have risen
7.2% in inflation-adjusted terms.
Averages can be deceiving, of course. And, in
this case, the recent rise in average weekly
earnings is not equally shared across all
employees. In particular, low-paid workers,
such as those in the retail and hospitality
sectors, have seen minimal increases in
their hourly wage rate, while better paid
workers, such as those in the business
services and finance sector, have experienced
above average wage growth. Average hourly
earnings for retail sector workers fell slightly
from $16.97 to $16.84 between December
2008 and December 2009, while hospitality
workers’ wages rose from $15.59 per hour to
$16.39 over the same period. By comparison,
average hourly earnings for workers in the
finance sector rose nearly 6% from $33.67 to
$35.92.25
The gap in hourly earnings between males and
females has widened slightly. In December
2009, male average hourly earnings were
$26.98, which was $3.48 per hour more than
females, who earned on average $23.50. A
year earlier, this gap was $3.14 ($25.85 for
28 | A ROAD TO RECOVERY
40%
45%
50%
55%
60%
65%
70%
75%
80%
Rate
of p
arti
cipa
tion
in w
orkf
orce
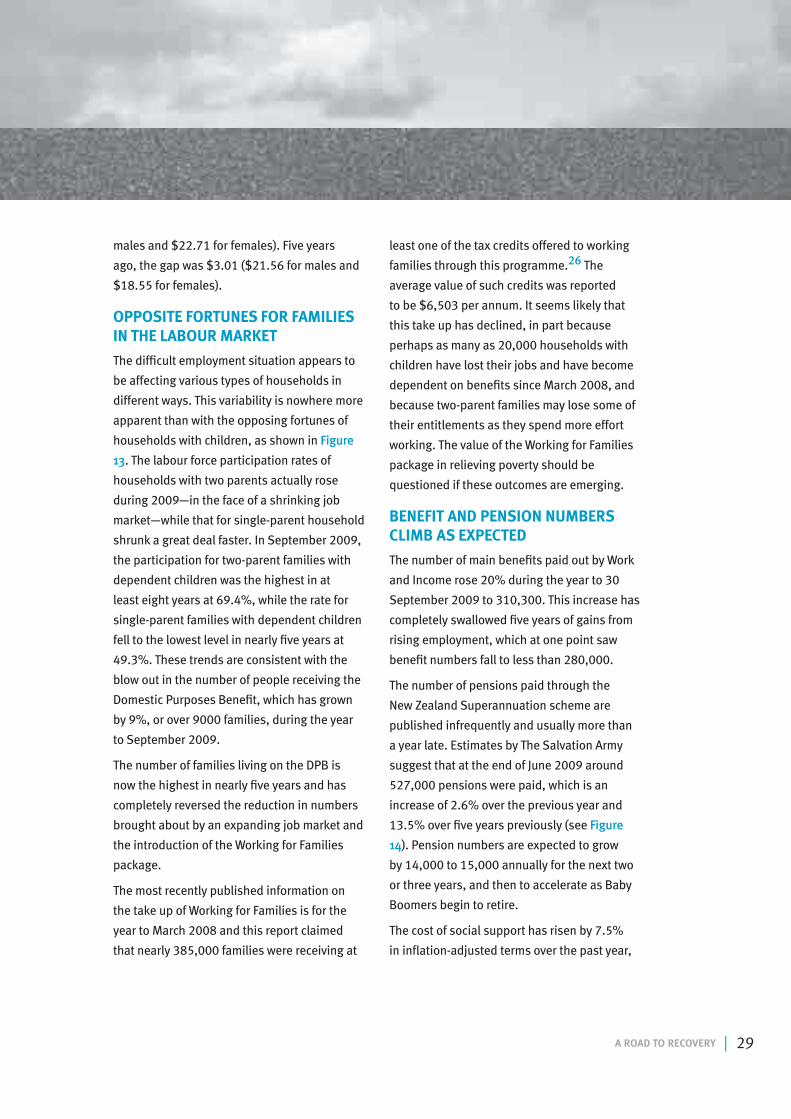
Quarters ending
Sep 04 Sep 06Mar 05 Mar 07 Sep 08Sep 05 Sep 07 Mar 09Mar 06 Mar 08 Sep 09
Couple with two dependent children One parent with dependent child(ren) only
Figure 13: Labour force participation of families with children 2004–2009
Source: Statistics New Zealand Household Labour Force Survey
850
860
870
880
890
900
910
920
930
940
950
960
970
$ pe
r wee
k
Quarterly
Sep 04 Sep 06Mar 05 Mar 07 Sep 08Sep 05 Sep 07 Mar 09Mar 06 Mar 08 Sep 09
Figure 12: Average weekly wages 2004–2009
Inflation adjusted in December 2009 $
Source: Statistics New Zealand Quarterly Employment Survey
A ROAD TO RECOVERY | 29
males and $22.71 for females). Five years
ago, the gap was $3.01 ($21.56 for males and
$18.55 for females).
OPPOSITE FORTUNES FOR FAMILIES IN THE LABOUR MARKET
The difficult employment situation appears to
be affecting various types of households in
different ways. This variability is nowhere more
apparent than with the opposing fortunes of
households with children, as shown in Figure
13. The labour force participation rates of
households with two parents actually rose
during 2009—in the face of a shrinking job
market—while that for single-parent household
shrunk a great deal faster. In September 2009,
the participation for two-parent families with
dependent children was the highest in at
least eight years at 69.4%, while the rate for
single-parent families with dependent children
fell to the lowest level in nearly five years at
49.3%. These trends are consistent with the
blow out in the number of people receiving the
Domestic Purposes Benefit, which has grown
by 9%, or over 9000 families, during the year
to September 2009.
The number of families living on the DPB is
now the highest in nearly five years and has
completely reversed the reduction in numbers
brought about by an expanding job market and
the introduction of the Working for Families
package.
The most recently published information on
the take up of Working for Families is for the
year to March 2008 and this report claimed
that nearly 385,000 families were receiving at
least one of the tax credits offered to working
families through this programme.26 The
average value of such credits was reported
to be $6,503 per annum. It seems likely that
this take up has declined, in part because
perhaps as many as 20,000 households with
children have lost their jobs and have become
dependent on benefits since March 2008, and
because two-parent families may lose some of
their entitlements as they spend more effort
working. The value of the Working for Families
package in relieving poverty should be
questioned if these outcomes are emerging.
BENEFIT AND PENSION NUMBERS CLIMB AS EXPECTED
The number of main benefits paid out by Work
and Income rose 20% during the year to 30
September 2009 to 310,300. This increase has
completely swallowed five years of gains from
rising employment, which at one point saw
benefit numbers fall to less than 280,000.
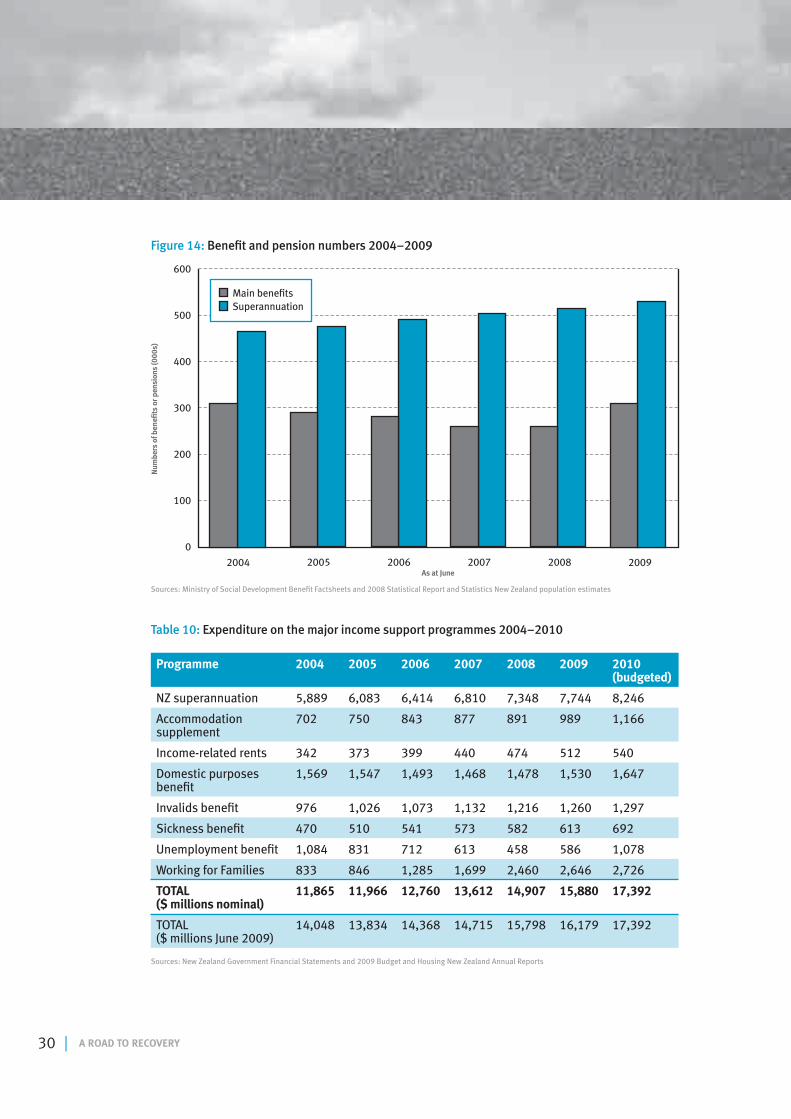
The number of pensions paid through the
New Zealand Superannuation scheme are
published infrequently and usually more than
a year late. Estimates by The Salvation Army
suggest that at the end of June 2009 around
527,000 pensions were paid, which is an
increase of 2.6% over the previous year and
13.5% over five years previously (see Figure
14). Pension numbers are expected to grow
by 14,000 to 15,000 annually for the next two
or three years, and then to accelerate as Baby
Boomers begin to retire.
The cost of social support has risen by 7.5%
in inflation-adjusted terms over the past year,
30 | A ROAD TO RECOVERY
100
0
200
300
400
500
600
Num
bers
of b
enefi
ts o
r pen
sion
s (0
00s)
As at June2004 20062005 20082007 2009
Main benefits Superannuation
Figure 14: Benefit and pension numbers 2004–2009
Sources: Ministry of Social Development Benefit Factsheets and 2008 Statistical Report and Statistics New Zealand population estimates
Programme 2004 2005 2006 2007 2008 2009 2010 (budgeted)
NZ superannuation 5,889 6,083 6,414 6,810 7,348 7,744 8,246
Accommodation supplement
702 750 843 877 891 989 1,166
Income-related rents 342 373 399 440 474 512 540
Domestic purposes benefit
1,569 1,547 1,493 1,468 1,478 1,530 1,647
Invalids benefit 976 1,026 1,073 1,132 1,216 1,260 1,297
Sickness benefit 470 510 541 573 582 613 692
Unemployment benefit 1,084 831 712 613 458 586 1,078
Working for Families 833 846 1,285 1,699 2,460 2,646 2,726
TOTAL ($ millions nominal)
11,865 11,966 12,760 13,612 14,907 15,880 17,392
TOTAL ($ millions June 2009)
14,048 13,834 14,368 14,715 15,798 16,179 17,392
Table 10: Expenditure on the major income support programmes 2004–2010
Sources: New Zealand Government Financial Statements and 2009 Budget and Housing New Zealand Annual Reports
A ROAD TO RECOVERY | 31
mainly as a result of the recession and ongoing
financial commitment to long-standing
polices such as those around retirement
incomes and housing support. Table 10
reports Government’s historic or budgeted
expenditures on key income and social
support programmes. The expenditure on
these programmes during the 2009/10 fiscal
year is expected to be almost $17.4 billion,
7.5% more in inflation-adjusted terms than for
the previous year and 25% more (in inflation
adjusted terms) than in 2004/05.
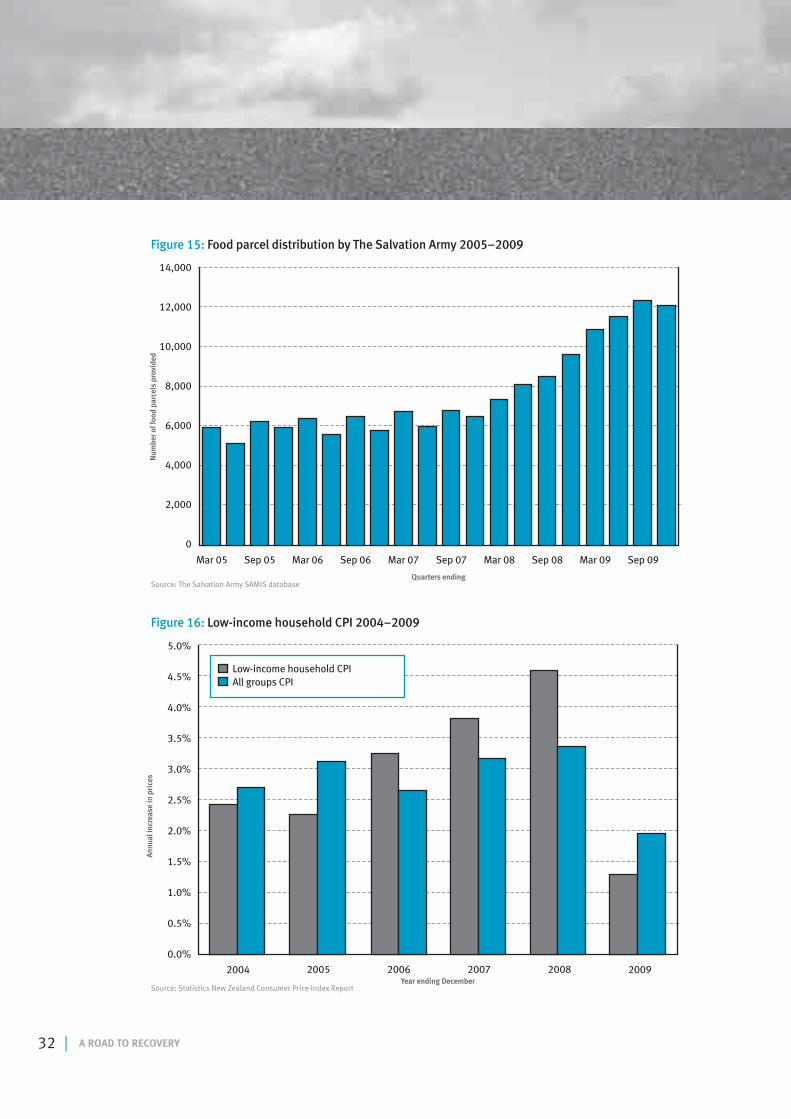
GROWTH IN FOOD PARCEL DEMAND CONTINUES UNCHECKED
Growth in demand for food parcels through
The Salvation Army’s network of food banks
grew by nearly 40% during 2009. For the year
to 30 December 2009, nearly 47,000 food
parcels were provided to over 25,000 families
through the Army’s 48 Community Ministries
centres (see Figure 15). This number of food
parcels is 39% more than provided in 2008,
when 33,700 food parcels assisted 19,330
families. The 2008 figures were themselves
quite exceptional; they represented a 29%
growth on the previous year.
This growth in demand has occurred across
the whole country, with all suburbs and towns
showing similar levels of increase. However,
the Army’s South Auckland Community
Ministry, which by itself accounts for nearly
one-fifth of the food parcels provided
nationally, saw demand spike during the
December 2009 quarter, when it provided
more than 200 food parcels per week. Two
years earlier this Community Ministry centre
was providing less than 100 parcels per week.
COSTS FACING LOW-INCOME HOUSEHOLDS EASE
The Consumer Price Index (CPI) fell 0.2% in the
December 2009 quarter on the back of lower
food prices and relatively weak price pressure
across other categories of goods and services.
An overall price decline for the quarter resulted
in an annual CPI increase of just below 2%.
The Salvation Army’s low-income household
CPI, which uses a different expenditure
weighting to that of the CPI, suggests that
annual price increases faced by low-income
households was less than the overall CPI for
2009. The low-income household CPI shows
a 1.3% increase for the year to December,
which follows a 4.6% increase for the previous
12 months (see Figure 16). The low-income
household CPI indicates that over the past five
years, prices for low-income households have
risen by 16%, which is only slightly more
than the 15% increase in the main CPI for the
same period.
32 | A ROAD TO RECOVERY
0
2,000
4,000
6,000
8,000
10,000
12,000
14,000
Num
ber o
f foo
d pa
rcel
s pr
ovid
ed
Quarters ending
Sep 06Mar 05 Mar 07 Sep 08Sep 05 Sep 07 Mar 09Mar 06 Mar 08 Sep 09
Figure 15: Food parcel distribution by The Salvation Army 2005–2009
Source: The Salvation Army SAMIS database
0.5%
0.0%
1.0%
1.5%
2.0%
2.5%
3.0%
3.5%
4.0%
4.5%
5.0%
Annu
al in
crea
se in
pri
ces
Year ending December2004 20062005 20082007 2009
Low-income household CPI All groups CPI
Figure 16: Low-income household CPI 2004–2009
Source: Statistics New Zealand Consumer Price Index Report
A ROAD TO RECOVERY | 33
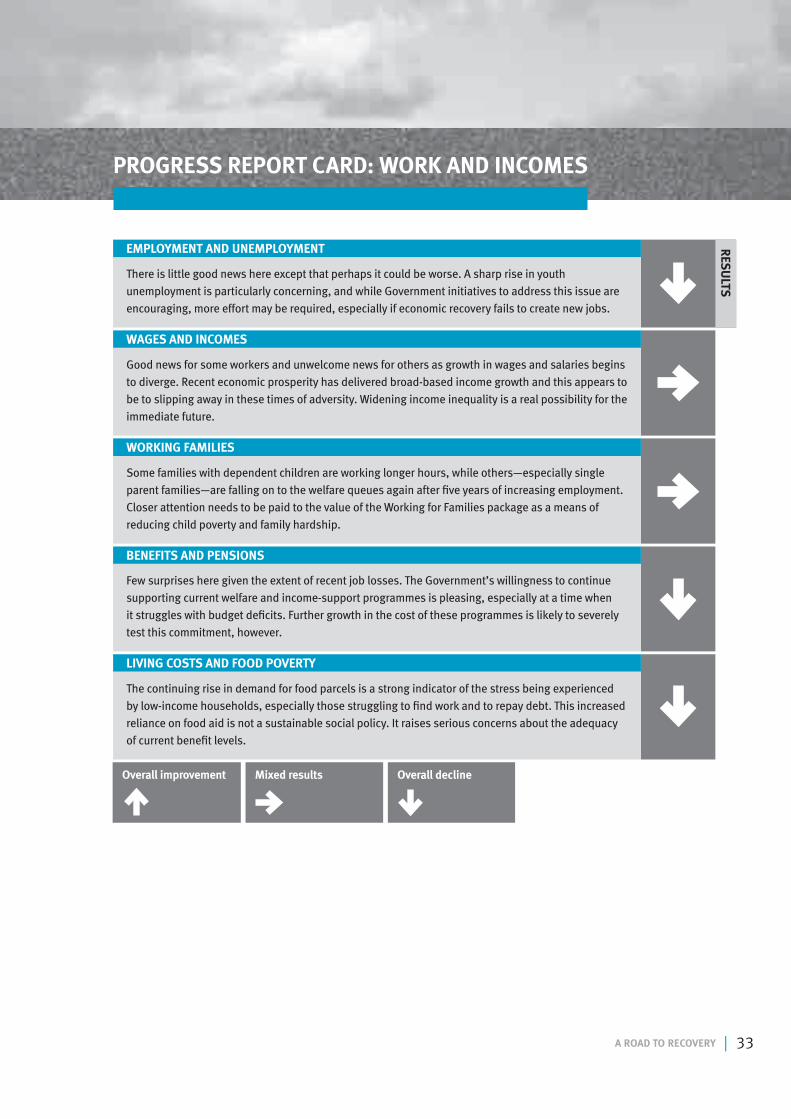
PROGRESS REPORT CARD: WORK AND INCOMES
There is little good news here except that perhaps it could be worse. A sharp rise in youth
unemployment is particularly concerning, and while Government initiatives to address this issue are
encouraging, more effort may be required, especially if economic recovery fails to create new jobs.
EMPLOYMENT AND UNEMPLOYMENT RES
ULTS
The continuing rise in demand for food parcels is a strong indicator of the stress being experienced
by low-income households, especially those struggling to find work and to repay debt. This increased
reliance on food aid is not a sustainable social policy. It raises serious concerns about the adequacy
of current benefit levels.
LIVING COSTS AND FOOD POVERTY
Good news for some workers and unwelcome news for others as growth in wages and salaries begins
to diverge. Recent economic prosperity has delivered broad-based income growth and this appears to
be to slipping away in these times of adversity. Widening income inequality is a real possibility for the
immediate future.
WAGES AND INCOMES
Some families with dependent children are working longer hours, while others—especially single
parent families—are falling on to the welfare queues again after five years of increasing employment.
Closer attention needs to be paid to the value of the Working for Families package as a means of
reducing child poverty and family hardship.
WORKING FAMILIES
Few surprises here given the extent of recent job losses. The Government’s willingness to continue
supporting current welfare and income-support programmes is pleasing, especially at a time when
it struggles with budget deficits. Further growth in the cost of these programmes is likely to severely
test this commitment, however.
BENEFITS AND PENSIONS
Overall improvement Overall declineMixed results
34 | A ROAD TO RECOVERY
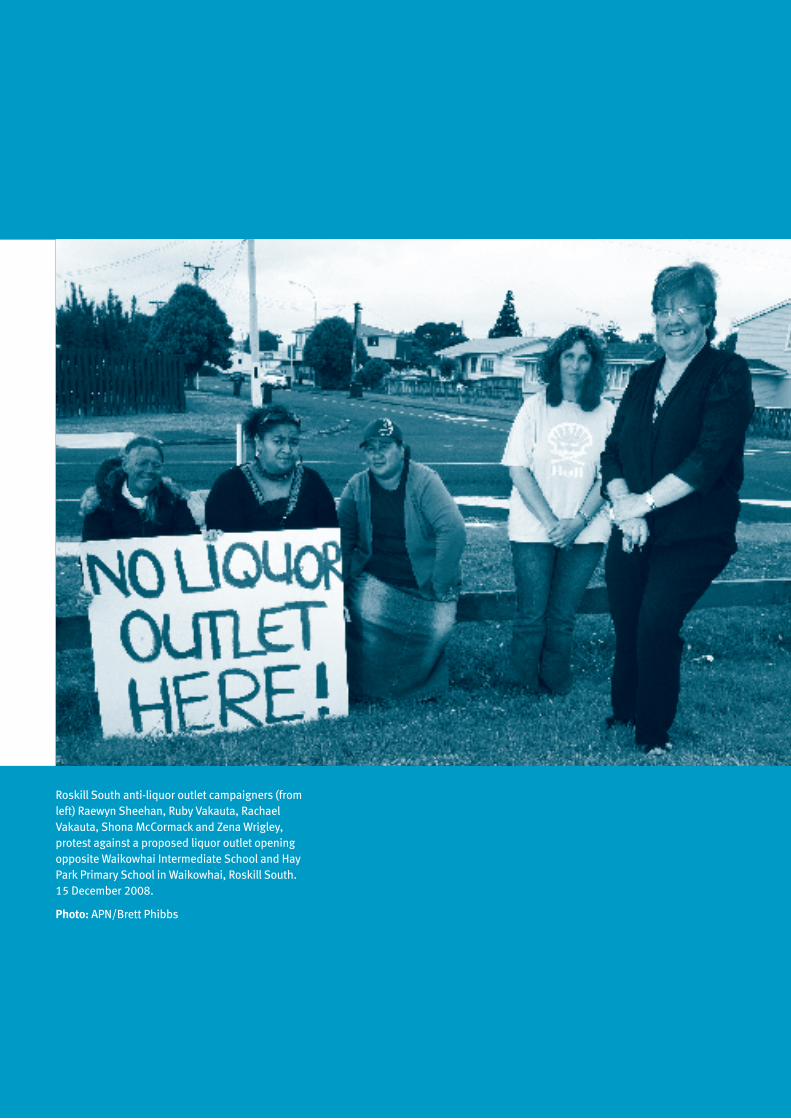
Roskill South anti-liquor outlet campaigners (from left) Raewyn Sheehan, Ruby Vakauta, Rachael Vakauta, Shona McCormack and Zena Wrigley, protest against a proposed liquor outlet opening opposite Waikowhai Intermediate School and Hay Park Primary School in Waikowhai, Roskill South. 15 December 2008.
Photo: APN/Brett Phibbs
A ROAD TO RECOVERY | 35
SOCIAL HAZARDS
Social hazards are a selective set of activities
that are potentially harmful both to individuals
and, through them, to the neighbourhoods and
communities they are part of. These activities
are accepted, or perhaps informally condoned,
by communities on the basis of individual
choice and the limited potential for individual
harm. Most often there are social limits on
these activities to ensure that any potential for
harm is managed. In this report we consider
three types of social hazards: alcohol, illicit
drugs and gambling.
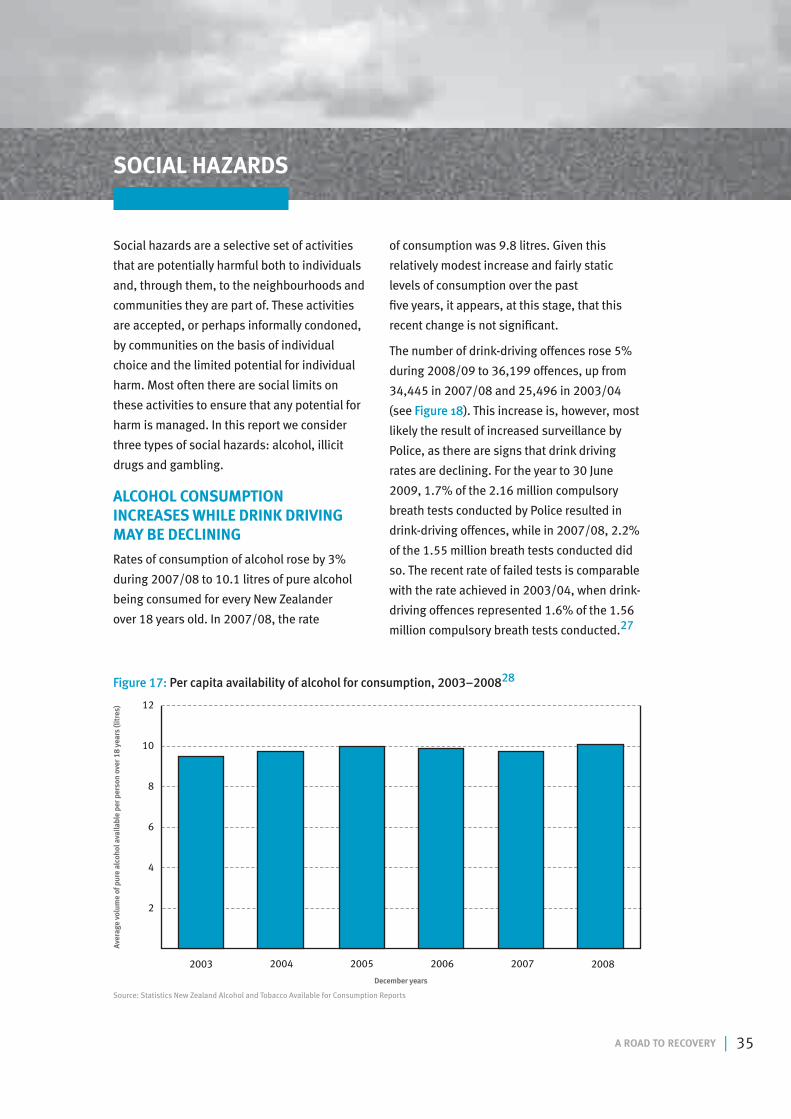
ALCOHOL CONSUMPTION INCREASES WHILE DRINK DRIVING MAY BE DECLINING
Rates of consumption of alcohol rose by 3%
during 2007/08 to 10.1 litres of pure alcohol
being consumed for every New Zealander
over 18 years old. In 2007/08, the rate
of consumption was 9.8 litres. Given this
relatively modest increase and fairly static
levels of consumption over the past
five years, it appears, at this stage, that this
recent change is not significant.
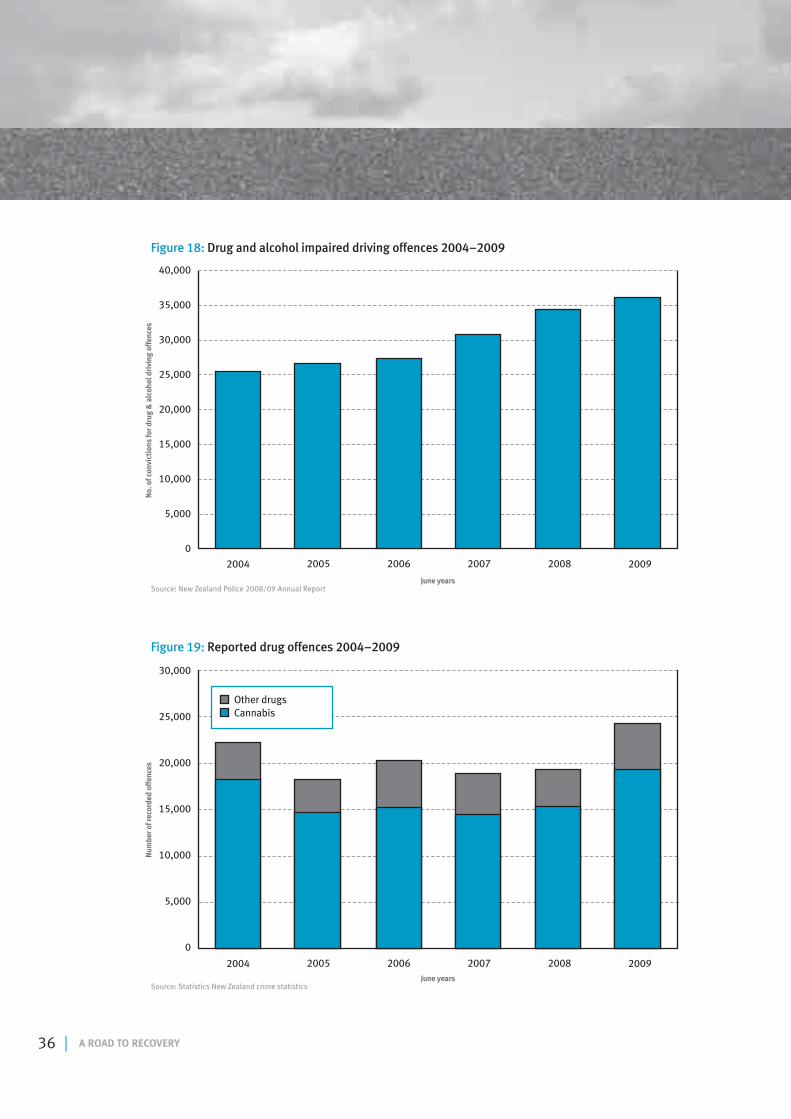
The number of drink-driving offences rose 5%
during 2008/09 to 36,199 offences, up from
34,445 in 2007/08 and 25,496 in 2003/04
(see Figure 18). This increase is, however, most
likely the result of increased surveillance by
Police, as there are signs that drink driving
rates are declining. For the year to 30 June
2009, 1.7% of the 2.16 million compulsory
breath tests conducted by Police resulted in
drink-driving offences, while in 2007/08, 2.2%
of the 1.55 million breath tests conducted did
so. The recent rate of failed tests is comparable
with the rate achieved in 2003/04, when drink-
driving offences represented 1.6% of the 1.56
million compulsory breath tests conducted.27
2
4
6
8
10
12
Aver
age
volu
me
of p
ure
alco
hol a
vaila
ble
per p
erso
n ov
er 1
8 ye
ars
(litr
es)
December years
2003 20052004 20072006 2008
Figure 17: Per capita availability of alcohol for consumption, 2003–200828
Source: Statistics New Zealand Alcohol and Tobacco Available for Consumption Reports
36 | A ROAD TO RECOVERY
5,000
0
10,000
15,000
20,000
25,000
30,000
35,000
40,000
No.
of c
onvi
ctio
ns fo
r dru
g &
alc
ohol
dri
ving
offe
nces
June years
2004 20062005 20082007 2009
Figure 18: Drug and alcohol impaired driving offences 2004–2009
Source: New Zealand Police 2008/09 Annual Report
0
5,000
10,000
15,000
20,000
25,000
30,000
Num
ber o
f rec
orde
d of
fenc
es
June years
2004 20062005 20082007 2009
Other drugs Cannabis
Figure 19: Reported drug offences 2004–2009
Source: Statistics New Zealand crime statistics
A ROAD TO RECOVERY | 37
DRUG-RELATED CRIME INCREASES
Drug-related crime increased by 26% during
2008/09 for both cannabis and non-cannabis
drugs. In total, 19,246 cannabis-related
offences were recorded for the year to 30
June 2009, of which just under half, or 9131
offences, were for personal use or possession
for personal use only (see Figure 19). Non-
cannabis drug offences totalled 5002 for
2008/09, an increase of 26% over 2007/08
and of a similar scale to the number of such
offences in 2005/06. Without a reliably-
reported measure of the relative priority that
Police give to drug-related operations, it is
difficult to determine if this significant increase
in drug-related crime is due to increased
levels of criminal activity or better and more
comprehensive surveillance by Police. Police
appear to have given additional emphasis to
cannabis control during 2008/09 through their
National Cannabis Crime Operation. This may
account for the increases during 2008/09.
Police have begun reporting on a voluntary
survey of arrested offenders that provides
some useful insights into the prevalence
of drug use among offenders and the
contribution drug use has made to their
offending. This survey, known as the Arrestee
Drug Abuse Monitoring Survey, is conducted
at four police stations. The survey indicates
that 91% of arrestees have consumed alcohol
in the 12 months prior to their arrest, 80%
had consumed cannabis and 31% had used
methamphetamines. 80% of respondents
using alcohol reported that their alcohol use
had contributed to their offending, while 68%
of methamphetamine users reported that the
drug had contributed to their offending, and
36% of cannabis users attributed cannabis use
to their offending.29
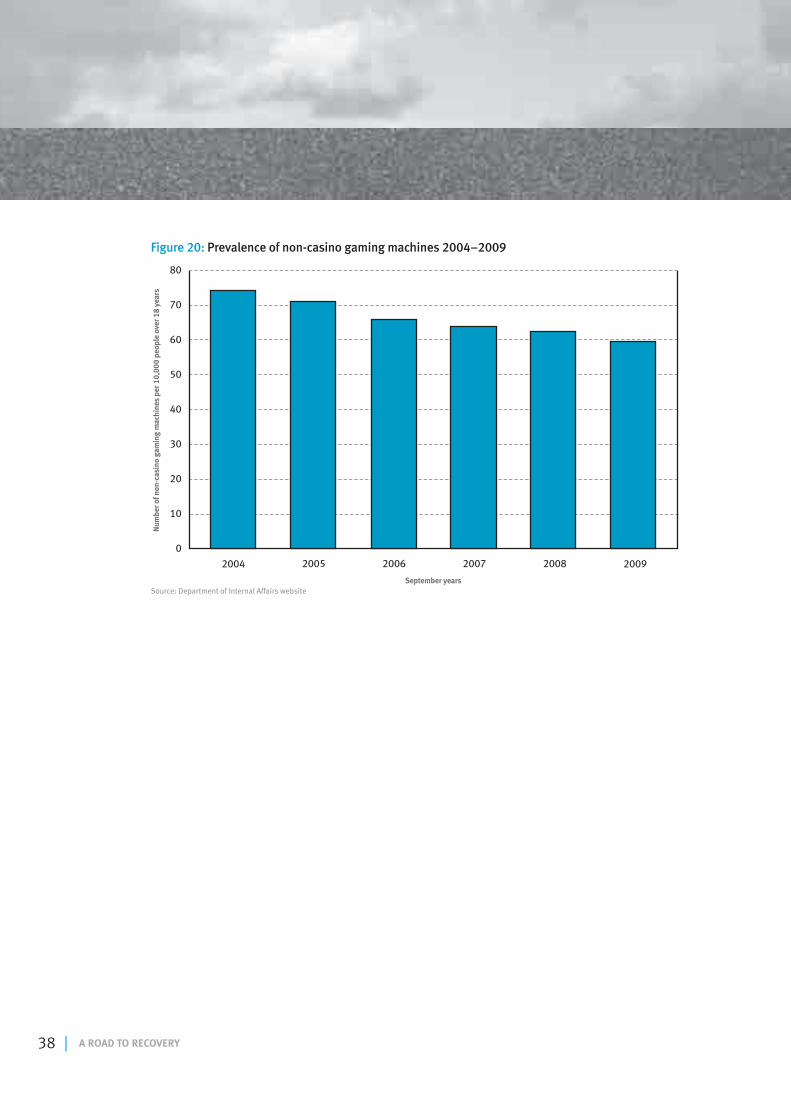
GAMBLING LOSSES CONTINUE TO DECLINE
In 2009, adult New Zealanders, on average,
lost $630 by gambling, of which around $85
will be at the TAB or races, $275 will be on
the “pokies” (non-casino gaming machines),
$150 will be at the casino, and $120 will be
in lotteries such as Lotto and Big Wednesday.
These amounts are around 20% less than the
per-capita losses incurred in 2004, when an
average of $787 per adult was gambled away,
including nearly $400 on “pokies”.
The declining fortunes of the pokies industry
has continued during 2009, with the fifth
straight year of decline in revenues (i.e,
gambling losses by machine users) and in
gaming machine numbers. Pokies or non-
casino gaming machines is still the largest
source of gambling losses by far, accounting
for nearly 44% of the $2 billion that New
Zealanders lost in gambling during 2009.
Pokies’ share of this gambling take has,
however, declined steadily from 2004, when
the machines took nearly 51 cents of every
dollar lost. Over the same period, the
prevalence of gaming machines in New
Zealand’s pubs and clubs has dropped from
74 machines for every 10,000 adults in 2004
to 60 machines in late 2009 (see Figure 20).
38 | A ROAD TO RECOVERY
10
0
20
30
40
50
60
70
80
Num
ber o
f non
-cas
ino
gam
ing
mac
hine
s pe
r 10,
000
peop
le o
ver 1
8 ye
ars
September years
2004 20062005 20082007 2009
Figure 20: Prevalence of non-casino gaming machines 2004–2009
Source: Department of Internal Affairs website
A ROAD TO RECOVERY | 39
PROGRESS REPORT CARD: SOCIAL HAZARDS
The recent small increase in rates of consumption does not yet spell out a trend towards higher levels
of drinking. The reduced incidence of drink driving is encouraging.
ALCOHOL
An encouraging sign is that the sharp increase in drug-related crime is most likely the result of
more effective Police surveillance through their National Cannabis Crime Operation and other anti-
drug campaigns.
DRUG-RELATED CRIME
The continuing reduction in gambling losses is encouraging, and the reduced prevalence of non-
casino gaming machines is another welcome trend.
GAMBLING
RES
ULTS
Overall improvement Overall declineMixed results
40 | A ROAD TO RECOVERY
Builder Fred Van Der Sanoe goes over the plans with Daniel and Leah McCurdy who have bought a new house in Avondale, Auckland, valued at $445,000. They have to provide $312,000 and the rest is provided by the charitable New Zealand Housing Foundation and Auckland City Council through a shared equity scheme. 7 August 2009.
Photo: APN/Dean Purcell
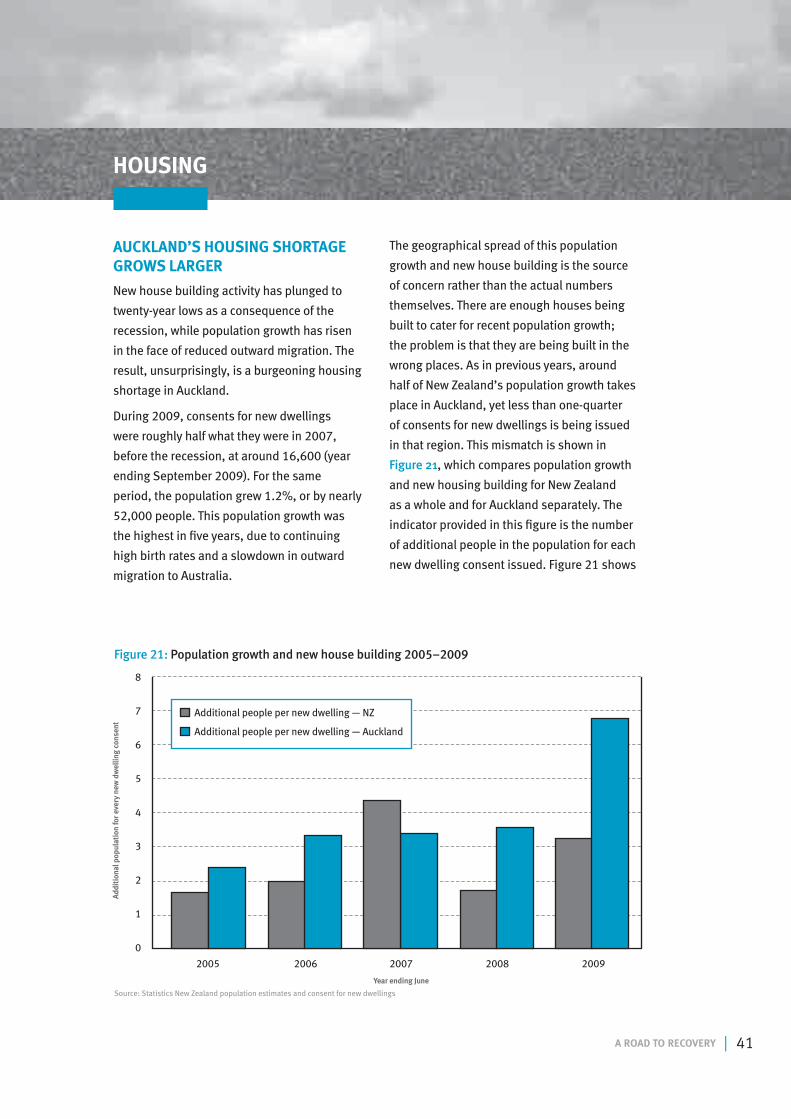
A ROAD TO RECOVERY | 41
AUCKLAND’S HOUSING SHORTAGE GROWS LARGER
New house building activity has plunged to
twenty-year lows as a consequence of the
recession, while population growth has risen
in the face of reduced outward migration. The
result, unsurprisingly, is a burgeoning housing
shortage in Auckland.
During 2009, consents for new dwellings
were roughly half what they were in 2007,
before the recession, at around 16,600 (year
ending September 2009). For the same
period, the population grew 1.2%, or by nearly
52,000 people. This population growth was
the highest in five years, due to continuing
high birth rates and a slowdown in outward
migration to Australia.
The geographical spread of this population
growth and new house building is the source
of concern rather than the actual numbers
themselves. There are enough houses being
built to cater for recent population growth;
the problem is that they are being built in the
wrong places. As in previous years, around
half of New Zealand’s population growth takes
place in Auckland, yet less than one-quarter
of consents for new dwellings is being issued
in that region. This mismatch is shown in
Figure 21, which compares population growth
and new housing building for New Zealand
as a whole and for Auckland separately. The
indicator provided in this figure is the number
of additional people in the population for each
new dwelling consent issued. Figure 21 shows
HOUSING
0
1
2
3
4
5
6
7
8
Addi
tion
al p
opul
atio
n fo
r eve
ry n
ew d
wel
ling
cons
ent
Year ending June
2005 20072006 20092008
Additional people per new dwelling — NZ
Additional people per new dwelling — Auckland
Figure 21: Population growth and new house building 2005–2009
Source: Statistics New Zealand population estimates and consent for new dwellings
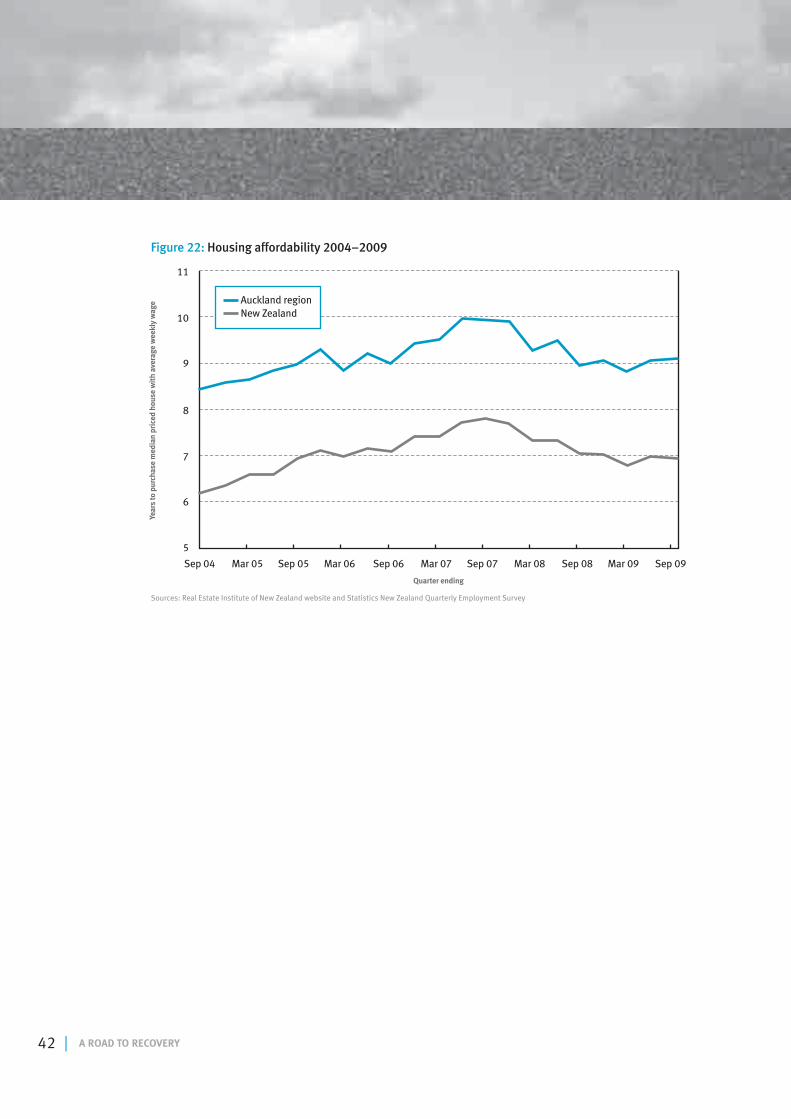
42 | A ROAD TO RECOVERY
Figure 22: Housing affordability 2004–2009
5
6
7
8
9
10
11
Year
s to
pur
chas
e m
edia
n pr
iced
hou
se w
ith
aver
age
wee
kly
wag
e
Quarter ending
Sep 04 Sep 06Mar 05 Mar 07 Sep 08Sep 05 Sep 07 Mar 09Mar 06 Mar 08 Sep 09
Auckland region New Zealand
Sources: Real Estate Institute of New Zealand website and Statistics New Zealand Quarterly Employment Survey
A ROAD TO RECOVERY | 43
the recent deterioration in this indicator,
especially for Auckland, where the number
of additional people for every new house has
risen from 3.6 people per house to 6.8 people
between 2008 and 2009 (June years). The
situation has deteriorated for the rest of New
Zealand as well, although it does not appear to
be concerning at this stage.
Auckland’s housing shortage is especially
acute in South Auckland, where in Manukau
City one new house is being built for every
14 new residents and where the cumulative
housing shortage of the past three year now
exceeds 3000 houses. During 2008/09, the
whole Auckland region was short over 4100
houses, 1400 of which were in Manukau City
and 1300 in Auckland City.
IMPROVEMENTS IN HOUSING AFFORDABILITY ARE STALLED
House prices recovered during 2009 and
have now, more or less, climbed back to the
levels they reached in mid-2007, before the
recession. The median house price for New
Zealand stands at around $345,000 and at
$450,000 for the Auckland region.30 Modest
wage and salary growth during 2009 has
contributed to growing incomes for some
households, and these improvements have
meant that housing for working households
has become relatively more affordable since
the peak of the housing boom in mid-2007.
The affordability measure of years of work
required to purchase the median-priced
house has shown little change over the past
12 months (see Figure 22). It will take seven
years of work at the average wage to purchase
the median-priced New Zealand house, and
over nine years to purchase the median-
priced Auckland house. These indicators have
improved from the peaks of 2007, where the
ratios were 7.8 years for the median-priced
house nationally and nearly 10 years in the
case of Auckland.
The recession has, of course, brought about
a shift in monetary policies, which has seen
interest rates fall to historical lows in efforts by
governments and central banks to soften the
impact of weakening demand. For example,
New Zealand’s Reserve Bank has reduced
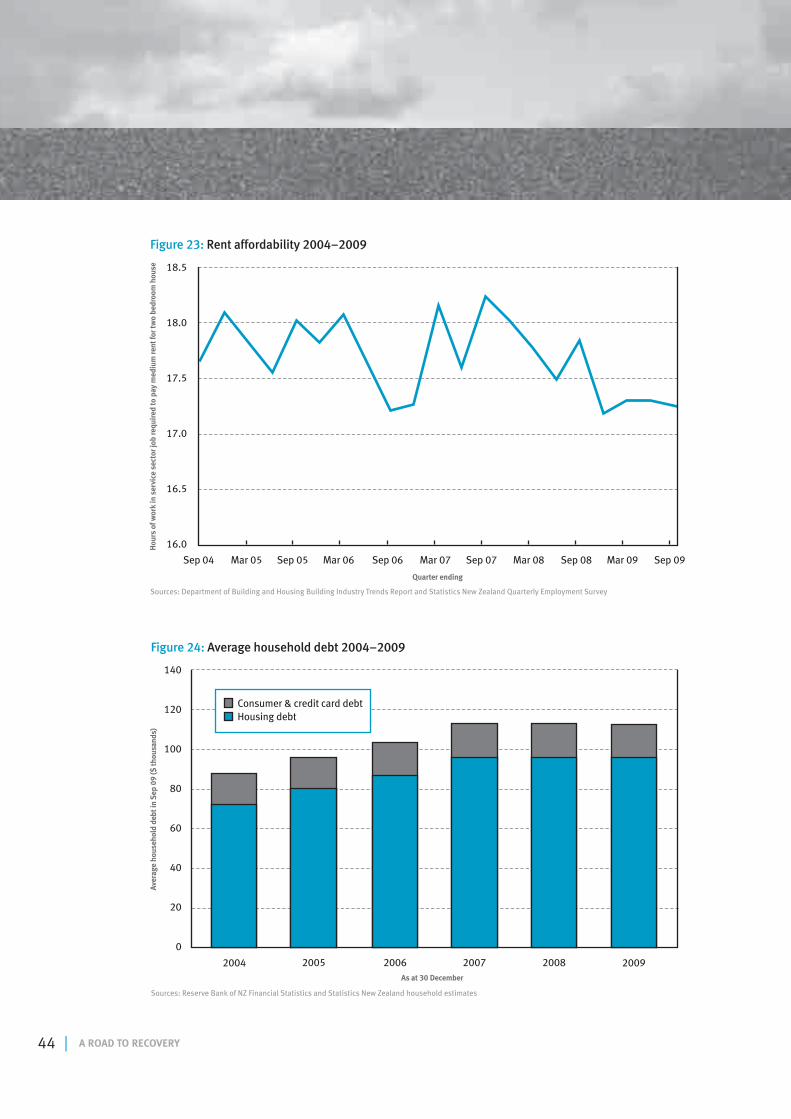
44 | A ROAD TO RECOVERY
0
20
40
60
80
100
120
140
Aver
age
hous
ehol
d de
bt in
Sep
09
($ th
ousa
nds)
As at 30 December
2004 20062005 20082007 2009
Consumer & credit card debt Housing debt
Figure 24: Average household debt 2004–2009
Sources: Reserve Bank of NZ Financial Statistics and Statistics New Zealand household estimates
16.0
16.5
17.0
17.5
18.0
18.5
Hou
rs o
f wor
k in
ser
vice
sec
tor j
ob re
quir
ed to
pay
med
ium
rent
for t
wo
bedr
oom
hou
se
Quarter ending
Sep 04 Sep 06Mar 05 Mar 07 Sep 08Sep 05 Sep 07 Mar 09Mar 06 Mar 08 Sep 09
Figure 23: Rent affordability 2004–2009
Sources: Department of Building and Housing Building Industry Trends Report and Statistics New Zealand Quarterly Employment Survey
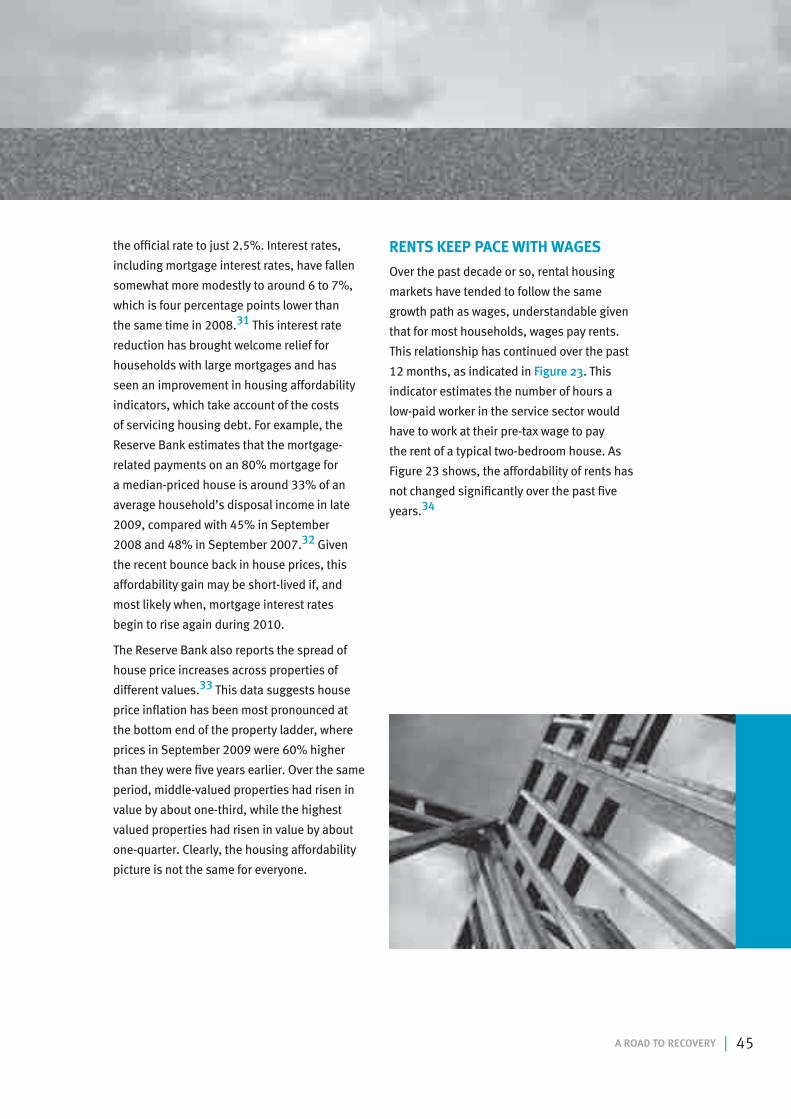
A ROAD TO RECOVERY | 45
the official rate to just 2.5%. Interest rates,
including mortgage interest rates, have fallen
somewhat more modestly to around 6 to 7%,
which is four percentage points lower than
the same time in 2008.31 This interest rate
reduction has brought welcome relief for
households with large mortgages and has
seen an improvement in housing affordability
indicators, which take account of the costs
of servicing housing debt. For example, the
Reserve Bank estimates that the mortgage-
related payments on an 80% mortgage for
a median-priced house is around 33% of an
average household’s disposal income in late
2009, compared with 45% in September
2008 and 48% in September 2007.32 Given
the recent bounce back in house prices, this
affordability gain may be short-lived if, and
most likely when, mortgage interest rates
begin to rise again during 2010.
The Reserve Bank also reports the spread of
house price increases across properties of
different values.33 This data suggests house
price inflation has been most pronounced at
the bottom end of the property ladder, where
prices in September 2009 were 60% higher
than they were five years earlier. Over the same
period, middle-valued properties had risen in
value by about one-third, while the highest
valued properties had risen in value by about
one-quarter. Clearly, the housing affordability
picture is not the same for everyone.
RENTS KEEP PACE WITH WAGES
Over the past decade or so, rental housing
markets have tended to follow the same
growth path as wages, understandable given
that for most households, wages pay rents.
This relationship has continued over the past
12 months, as indicated in Figure 23. This
indicator estimates the number of hours a
low-paid worker in the service sector would
have to work at their pre-tax wage to pay
the rent of a typical two-bedroom house. As
Figure 23 shows, the affordability of rents has
not changed significantly over the past five
years.34
46 | A ROAD TO RECOVERY
HOUSING-RELATED DEBT RISES SLIGHTLY
Average household debt fell slightly over 2009
on the back of reduced consumer-related and
credit card debt. Against this slight fall, overall
housing-related debt rose by 0.5% in inflation-
adjusted terms, despite the reduction in
house prices and a general slowdown in the
housing market.
At the end of September 2009, New Zealand’s
households owed nearly $166 billion for
housing, a further $12 billion to banks on
consumer loans and nearly $5 billion on credit
cards. Overall, household debt rose 2.3%
in nominal terms over the year to the end of
September 2009. Adjusting for inflation and
population growth, average household debt
fell slightly by 0.3% to around $112,750 per
household. Of this debt, $96,000 was housing-
related debt, 0.5% more than the previous
year and 32% more than at September 2004
(see Figure 24).
The good news on the debt front is that it
appears that Kiwi households are avoiding
consumer and credit card debt. During
the year to 30 September 2009, average
household consumer and credit card debt fell
5% in inflation-adjusted terms to $16,800
per household. This is a reduction of around
$900 per household. However, taken over a
longer timeframe, the average New Zealand
household still owed 11% more on consumer
durables, cars and credit cards in September
2009 than five years previously.
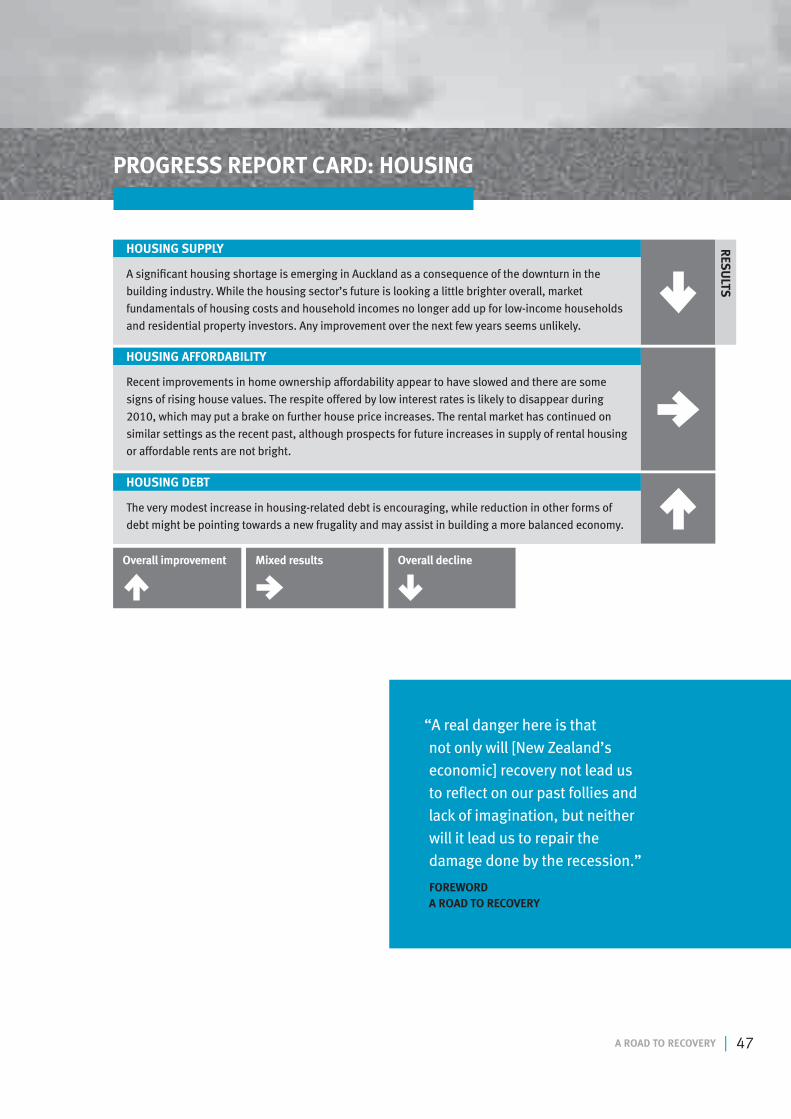
A ROAD TO RECOVERY | 47
“A real danger here is that not only will [New Zealand’s economic] recovery not lead us to reflect on our past follies and lack of imagination, but neither will it lead us to repair the damage done by the recession.”
FOREWORD A ROAD TO RECOVERY
PROGRESS REPORT CARD: HOUSING
Overall improvement Overall declineMixed results
A significant housing shortage is emerging in Auckland as a consequence of the downturn in the
building industry. While the housing sector’s future is looking a little brighter overall, market
fundamentals of housing costs and household incomes no longer add up for low-income households
and residential property investors. Any improvement over the next few years seems unlikely.
HOUSING SUPPLY
Recent improvements in home ownership affordability appear to have slowed and there are some
signs of rising house values. The respite offered by low interest rates is likely to disappear during
2010, which may put a brake on further house price increases. The rental market has continued on
similar settings as the recent past, although prospects for future increases in supply of rental housing
or affordable rents are not bright.
HOUSING AFFORDABILITY
The very modest increase in housing-related debt is encouraging, while reduction in other forms of
debt might be pointing towards a new frugality and may assist in building a more balanced economy.
HOUSING DEBT
RES
ULTS
48 | A ROAD TO RECOVERY
1 Perry, B. (2009), Household Incomes in New Zealand: Trends
in Indicators of Inequality and Hardship 1982 to 2008,
Ministry of Social Development, Wellington; available at
www.msd.govt.nz/about-msd-and-our-work/publications-
resources/monitoring/household-incomes/index.html
2 See the background on the New Zealand Livings Standards
survey and research at www.msd.govt.nz/about-msd-and-our-
work/publications-resources/monitoring/living-standards/
index.html
3 See Perry (2009) Table K p.128 for a comparison between the
HES based estimates and the Economic Living Standards Index
(ESLI) of the New Zealand Living Standards survey.
4 See Perry (2009) Table 10.1 p.165.
5 This income gap was in fact the intent of the benefit cuts of
1991.
6 Between September 2008 and September 2009, the number
of people receiving an unemployment benefit grew by 37,387
people to 60,660. Additionally, over the same period the
numbers receiving the DPB rose 9185 to 107,658 people,
the numbers claiming a sickness benefit increased 8176 to
56,384 and the numbers in receipt of an invalid’s benefit
rose 1397 to 85,015 people. Source: Ministry of Social;
Development’s Benefit Factsheets available at www.msd.
govt.nz/about-msd-and-our-work/publications-resources/
statistics/benefit/2009-national-benefit-factsheets.html
7 See p.1 of “5th review of police activity since the enactment of
the Crimes(substituted section 59) Amendment Act 2007”
available at www.police.govt.nz/sites/default/files/resources
/latest/S59%205th%20review%20web%20report.pdf
8 These enrolment rates are based on the total enrolments
reported by the Ministry of Education and Statistics New
Zealand’s population estimates for the relevant age cohorts.
The enrolment rate for non-Maori 3 to 4-year-olds was nearly
104% in 2009, suggesting that a substantial number of
children are enrolled in at least two facilities.
9 Statistics New Zealand Population Estimates report that
between June 2004 and June 2009 the Maori population aged
under five increased by 11,290 to 99,420 children, while the
non-Maori under five population grew by just 10,830 children
to 264,140. These estimates don’t agree with birth statistics,
which suggest that around 22–23% of births are recorded
as Maori.
10 The indicators used in these comparisons are the proportion
of Year 11 students achieving NCEA Level 1 and the proportion
of Year 13 students achieving NCEA Level 3. Commonly
reported pass rates include the achievements by older
students—for example, Year 12 students who achieve Level 1,
most likely on their second attempt. The pass rates for
Decile 10 secondary schools have been adjusted to omit
the participation and achievements of students from four
secondary schools, that do not fully participate in the NCEA
assessment regime and as a consequence have relatively
low pass rates. Source: New Zealand Qualifications Authority
website at www.nzqa.govt.nz/qualifications/ssq/statistics/
statsreports.do
11 See OECD Health Statistics at www.oecd.org/document/16/0,
3343,en_2649_34631_2085200_1_1_1_1,00.html
12 These estimates of pregnancy rates exclude pregnancies
which aborted naturally.
13 See Australian birth statistics at the Australian Bureau of
Statistics website at www.ausstats.abs.gov.au/Ausstats/
subscriber.nsf/0/A92CC3C50D320CA2CA25766A00124D19/
$File/33010do006_2008.xls
14 These pieces of legislation include four Bills amending the
Sentencing Act 2002 to make belonging to a criminal gang
an aggravating factor in sentencing, to confiscate cars from
boy racers, to confiscate instruments used in committing a
crime, and to require offenders to pay a restitution levy to their
victims. In addition, there was an amendment to the Crimes
Act 1961 increasing the penalty for being part of a criminal
gang from five to ten years imprisonment and an amendment
to the Criminal Investigations Act 1995 extending police
powers to compulsorily take bodily samples from people
arrested for certain crimes. Also considered was the “three
strikes” Bill of the Act Party, known as the Sentencing and
Parole Reform Bill.
15 For the 2003/04 financial year, total expenditure by
Department of Corrections was $496 million and for the
2008/09 year this had risen to $962 million. Source:
Department of Corrections Annual Reports; Vote Corrections
in the 2009/10 Budget provided for operational expenditure
of $1.0654 billion with a further $402 million in capital
expenditure. See these estimates at www.treasury.govt.nz/
budget/2009/estimates
16 See Mayhew, P and Reilly, J (2007) The New Zealand Crime
and Safety Survey 2006, Ministry of Justice available at www.
justice.govt.nz/publications/globalpublications/k/New%20
ENDNOTES
A ROAD TO RECOVERY | 49
Zealand%20Crime%20and%20Safety%20Survey%20
2006%20-%20Key%20findings%20report
17 For the purposes of discussion, serious crime is defined here
as homicide, kidnapping and abduction, robbery, grievous
assault, serious assault, and sexual attacks.
18 The Police 2008/09 Annual Report provides three somewhat
confusing indicators of the levels of domestic violence that
they respond to. It reports that in 2008/09 Police responded
to 42,437 incidents of family violence compared to 43,307
such incidents in 2007/08. These incident responses resulted
in 48,389 recorded offences in 2008/09 (43,238 in 2007/08)
although Police acknowledge, somewhat unhelpfully, that not
all these offences are violence-related. Police also report that
they attended 36,586 domestic disputes in 2008/09, down
from the 39,357 they attended in 2007/08 and the 37,443
attended in 2006/07. See New Zealand Police 2008/09
Annual Report p.33 and p.94.
19 The obvious exception within this assumption is that of home
invasion type attacks, where a person is attacked by an
unknown person in their own home. The prevalence of such
attacks are not reported but are not thought to be a significant
proportion of violence and sexual offending in private
dwellings (probably <5%). For the sake of this discussion
domestic violence is defined as all homicides, grievous
assaults, serious assaults, common assaults, threats and
intimidation, and sexual attacks that take place in a dwelling.
20 This data has been taken from various Annual Reports of the
Departments of Corrections. For the most recent data see
pages 95 to 99 of the Departments 2008/09 Annual Report,
which is available at www.corrections.govt.nz/news-and-
publications/statutory-reports/annual-reports.html
21 The proportion of prisoners who are Maori is based on
information provided directly by Department of Corrections
and is for sentenced prisoners only. For the year to 30 June
2009, 49.2% of sentenced prisoners were Maori. This
proportion has remained fairly, stable at around 49% to 50%,
since 2004.
22 See the Department of Correction’s Briefing for the Incoming
Minister November 2008, Figure 4 p.23, which is available at
www.corrections.govt.nz/news-and-publications/statutory-
reports/briefing-for-the-incoming-minister-2008/executive-
summary.html
23 These estimates are based on Department of Corrections
Annual Reports and its reported costs of operating various
types of custodial services. These estimates are average costs
based on the total cost of the custodial services divided by the
average number of prisoners being held. Clearly, the cost of
some custodial services such as maximum security are more
than the cost of other services.
24 See Table 11 of Statistics New Zealand’s Household
Labour Force Survey spreadsheet at www.stats.govt.nz/
browse_for_stats/work_income_and_spending/employment/
householdlabourforcesurveyestimatedworkagepopulation_
mrsep09qtr.aspx
25 See Table 9, Quarterly Employment Survey December 2009
—Statistics New Zealand
26 See the Inland Revenue Department’s website at www.ird.
govt.nz/aboutir/external-stats/working-for-families-tax-
credits/
27 Data source: New Zealand Police 2008/09 Annual Report
p. 40 & p. 95.
28 Data source: Statistics New Zealand at http://search.stats.
govt.nz/search?w=alcohol
29 See New Zealand Police 2008/09 Annual report, p. 9.
30 Data source Real Estate Institute of New Zealand website at
www.reinz.org.nz/reinz/public/market-information/market-
information_home.cfm
31 See data file for the Reserve Bank’s Financial Stability Report,
November 2009 at www.rbnz.govt.nz/finstab/fsreport/
fsr_nov2009_data.xls spreadsheet sheet “Data 3.11”
32 See RBNZ Financial Stability Report, November 2009, Figure
3.14 and accompanying data at the above website address.
33 See Reserve Bank Financial Stability Report data file at the
above website—worksheet “Data D1”
34 This indicator is based on median rent estimates from the
Department of Building and Housing’s Building Industry
Trends Report and from Statistics New Zealand’s Quarterly
Employment Survey’s estimates of ordinary time earnings in
the hospitality sector.
50 | A ROAD TO RECOVERY
ABOUT THE AUTHOR
Alan Johnson BTP, MPhil (Hons)
Alan Johnson is a Senior Policy Analyst at The
Salvation Army Social Policy and Parliamentary
Unit. Alan has an academic background in
town planning and economics and has lectured
at the University of Auckland and Unitec,
in planning, economics and social policy.
He has extensive policy and management
experience in both the local government and
community sectors, with a particular interest
in housing, urban economics and community
development. Alan served as a Manakau
City Councillor for fourteen years and as a
director of the Counties Manakau District
Health Board for three years. He lives in South
Auckland and is active in that community on
issues around education, sport and housing.

A ROAD TO RECOVERY | 51

52 | A ROAD TO RECOVERY
The Salvation Army Social Policy and Parliamentary Unit
New Zealand, Fiji & Tonga Territory
PO Box 76-075, Manukau City 2104, New Zealand
Phone (09) 261 0883 | Fax (09) 262 4103 | salvationarmy.org.nz/socialpolicy