Embed Size (px)
Citation preview

A Review on Equations of StateApplicable to Polymers and
Complex Systems
J.W.Kang, J.H.Lee, K.-P. Yoo and C.S.Lee
Paper presented for PPEPPD 2001, May 20-25, Kurashiki
Department of Chemical EngineeringKorea Univeristy
Sogang University

Motivation
Increasing demands of EOS models for various process conditions and complex systems
– Supercritical conditions and high pressure systems– Phase equilibria of polymers – Phase equilibria of associating mixtures (alcohols, acids)– Simultaneous representation of VLE and HE
EOS approach provides integrated approach covering wider range of process conditions and various properties
Characteristics and understanding of each EOS models are important for various applications.

Three Classes of EOS Models
Based on Semi-Classical Partition Function
– Cubic Equation of State and Other van-der Waals based EOS• Soave-Redlich-Kwong (1972), Peng-Robinson EOS (1976)• Mixing Rules proposed by Huron-Vidal (1979) , Michelsen (1990) and
Wong-Sandler (1992)
– Radial Distribution Function Approaches• PHCT (1978), PACT (1985)• SAFT (Huang and Radosz, Chapman, 1990)
Based on Lattice Statistics
– Sanchez-Lacomb (1976)– Panayiotou-Vera (1981)– NLF -EOS proposed by You,Yoo and Lee (1993)– Hydrogen Boding proposed by Veytzman (1990) + Lattice EOS
• Panayiotou-Sanchez (1991), NLF-HB EOS (Yeom et. al., 1999)

Three Classes of EOS Models – Historical Review
Lattice Statistics Semiclassical PatitionFunction
GuggenheimQuasichemical
van der Waals
Sanchez-Lacombe
Panyiotou andVera
NLF EOSYou et. al
Victorov-Smirnova
VeytzmanStatistics
Panayioto-Sanchez NLF-HB
Redlich-Kwong
SRK PR
Huron-Vidal
Wong-Sandler
Dahl-Michelsen
Carnahan-Starling
Alder
PHCT
PACT
Wertheim
SAFT

EOS Models Selected for Comparison
Peng-Robinson Equation of State with Wong-Sandler Mixing Rule (PR-WS)
– Peng and Robinson (1976) : EOS – Wong and Sandler (1992) : Mixing Rule– Mathias and Copeman (1983) : a(T) law
Statistically Associated Fluid Model (SAFT)
– Huang and Radosz, Chapman (1990)
Nonrandom Lattice Fluid EOS with Hydrogen Bonding (NFL-HB)
– You, Yoo and Lee (1993)– Yeom, Yoo and Lee (1999)

Comparison
Number of pure and mixture parameters Procedure to obtain pure component parameters and binary
interaction parameters
Pure component properties (vapor pressure and liquid density) Binary VLE calculation of various mixtures Polymer solubility calculation
Computation time Sensitivity of VLE calculation with respect to binary interaction
parameters (robustness)

Peng-Robinson EOS with Wong-Sanler Mixing Rule (PR-WS EOS)
EOS
))(()(
bVbVRTVTa
bVVZ
σε ++−
−=
a(T) law)()( TaTa cα=
235.03
25.02
5.01 ])1()1()1(1[ RRR TCTCTC −+−+−+=α
Mixing Rule
),Phigh ,(),bar 1,()bar, 1,( iex
iex
iex xTAxPTAxPTG ≈=≈=
−=
−==
RTab
RTa
bxxTBxxTxB ijijjiijjii )(),(
)1(21
ijjj
jjii
iiij
ij kRTa
bRTab
RTa
b −
−+
−=−
Generalized form of Cubic
EOS
Mathias-Copeman a(T)
law (1983)
Wong-Sanldler mixing rule
(1992)

Chain Term
EOS
Statistical Associating Fluid Theory (SAFT)
assocdispchainhs ZZZZZ ++++= 1
−−+
−+
−= 3
3
323
23
21
3
30
)1()3(
)1(3
16
ξξξ
ξξξ
ξξξ
ρπ Ahs N
Z =i
kiiiAk drxN )()6/( ρπξ
−=i iiichain dLrxZ )()1( )32342)(1(
322432)(32
32
223233
2323
22
233
22
3223
ξξξξξξξξξξξξξξξξ
iii
iiiii ddd
dddddL−+++−−
−+++−+=
( ) ( ) =n m
mcp
nnmdisp kTumDrZ 33 // ξξ
( )( )[ ] ∂∂−= ρρ /2/1/1 ii SSiassoc XXxZ
( ) 11
−
+=j Y ij
YjA
S
j
ji WXxNX ρ
Hard Sphere Term
Dispersion Term
Association Term
Carnahan and Starling (1969)
Chapman (1990)
Based on Alder (1972)Chen and Kreglewski (1977)
Based on Wertheim (1984)Chapm;an (1990)
Residual Contribution
EOS
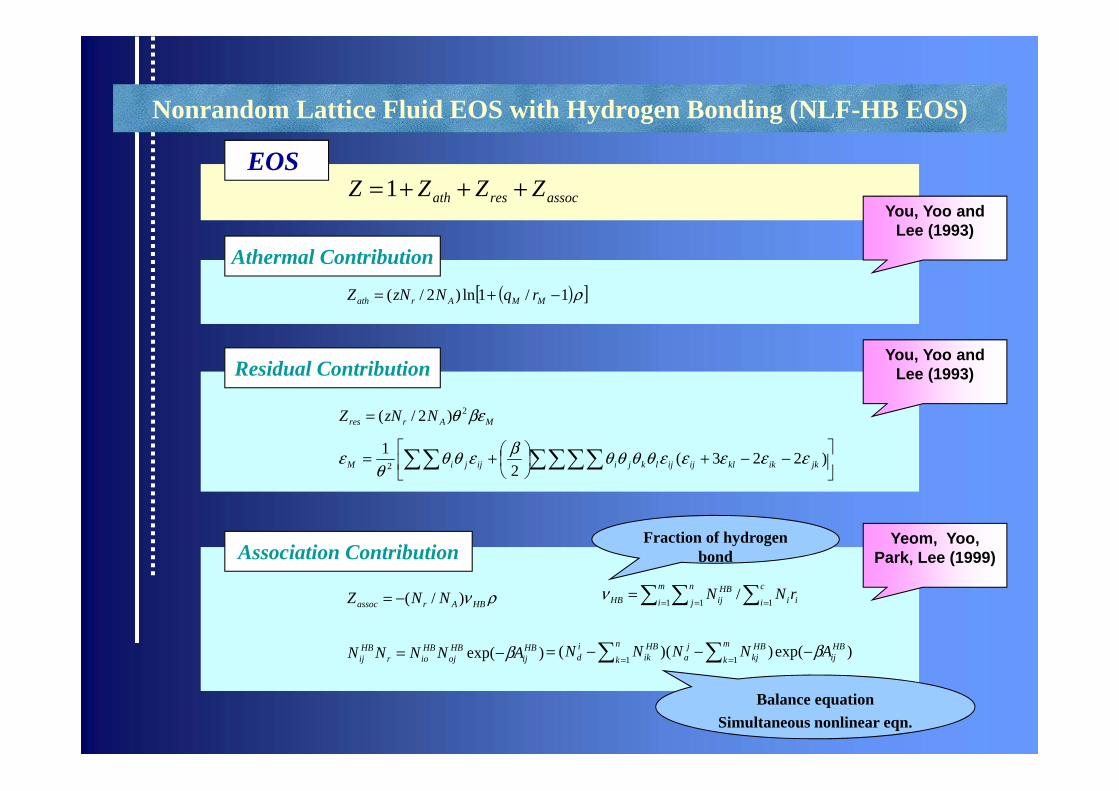
Nonrandom Lattice Fluid EOS with Hydrogen Bonding (NLF-HB EOS)
assocresath ZZZZ +++=1
( )[ ]ρ1/1ln)2/( −+= MMArath rqNzNZ
MArres NzNZ βεθ 2)2/(=
ρν HBArassoc NNZ )/(−= = = == m
i
n
j
c
i iiHBijHB rNN
1 1 1/ν
)exp( HBij
HBoj
HBior
HBij ANNNN β−= )exp()()(
11HBij
m
kHBkj
ja
n
kHBik
id ANNNN β−−−= ==
Athermal Contribution
Association Contribution
−−+
+= )223(
21
2 jkikklijijlkjiijjiM εεεεεθθθθβεθθθ
ε
You, Yoo and Lee (1993)
You, Yoo and Lee (1993)
Yeom, Yoo, Park, Lee (1999)
Fraction of hydrogen bond
Balance equation Simultaneous nonlinear eqn.

Comparison – pure component parameters
EOS Models Parameters T Dependency Procedure To Get Parameters
* Non-specific interaction
PR-WS ai , biai Dependent bi Independent
Using critical const. and vapor pressure
SAFT Independent Using vapor pressure and liquid density
NLF-HB Dependent Using vapor pressure and liquid density
* Specific interaction (Hydrogen bonding)
PR-WS - - -
SAFT IndependentRequired for individual species and additional bond formation
NLF-HB Independent Depends on the type of hydrogen bond
er iii ,,, σε
iiir ε,
jiji YSYS κε ,
HBHB SU ,

Comparison – mixing rule and binary interaction parameters
PR-WS SAFT NLF-HB
Basis of MixingRule
No. of BinaryParameters
Procedure
CrossAssociation
Based on quadratic composition dependence of Bij
Vdw / VF mixing ruleResults are affected bythe choice of mixing rule
Do not require empirical mixing rule
2 (UNIQUAC)3 (NRTL)kij calculated
1 (kij) 1 (kij)
Global Optimization of DP and DY
Global Optimization of DP and DY
Fit activity coeff. (obtain kij )
Additional crossassociation parameters (2)
0 Can be assumed(2)

Procedures for Wong-Sandler Mixing Rule
Controlled Optimization – Using VLE data – Using existing activity model parameters (DDB or UNIFAC, …) – Using infinite dilution activity coefficient
Global Optimization – Optimization of Gibbs free energy model parameter and kij value – Can violate the basic assumption
For given activity coefficient parameters , adjust kij to match following underlying assumption of Wong-Sandler mixing rule
),Phigh ,(),bar 1,()bar, 1,( iex
iex
iex xTAxPTAxPTG ≈=≈=

Sample Calculation – PR-WS can be inconsistent
Plot of Excess Helmholtz energy for hexane + hexanol system
Composition of Hexane
0.0 0.2 0.4 0.6 0.8 1.0
Exce
ss H
elm
holtz
Ene
rgy
(J/m
ol)
0.0
0.1
0.2
0.3
0.4
0.5
1 bar1000 bar1.D7 bar1.D9 bar
Plot of Excess Helmholtz energy for methane + butane system
Composition of Methane
0.0 0.2 0.4 0.6 0.8 1.0
Exce
ss H
elm
holtz
Ene
rgy
(J/m
ol)
0.00
0.05
0.10
0.15
0.20
0.25
0.30
0.35
0.40
1 bar1000 bar1.D5 bar1.D9 bar
Controlled optimization Global optimizationFit A12 and A21
Adjust k12 using AE=GEFit A12 , A21 and k12
GE (at low P) are unavailable formixtures of light gases at high P

Experimental Data for Comparison
Source No. of Data
Vapor pressureLiquid denisty
KDB(http::/thermo.korea.ac.kr/kdb)
Total 58 Components
VLE data Electronic
version of DDB
34 systems82 set
1321 points
Polymer Solubility
Hao et al. (DECHEMA)
4 systems18 sets
205 points

Vapor Pressure Error
Fig.1 Comparison of vapor pressure error for three EOS models.
Vap
or P
ress
ure
Err
or (%
)
0
1
2
3
PR with MC a(T) lawSAFTNLF-HB
n-Alkanen-Alkene
n-AlkynesMethyl Alkane
Cycloalkane
Aromatics
Alcohols
PR-MC SAFT NLF-HBAverage % Error 0.27 2.11 0.67
SAFT data not available
−=i
iicalc
i PPPDP 2exp2exp /)((%)
•PR-MC is most accurate with 3 T dependent parameters•SAFT is most inaccurate due to T independent parameters

Liquid Density Error
Fig.2 Comparison of saturated liquid density error for three EOS models.
Liqu
id D
ensi
ty E
rror
(%)
-5
0
5
10
15PR with MC a(T) lawSAFTNLF-HB
n-Alkanen-Alkene
n-AlkynesMethyl Alkane
Cycloalkane
Aromatics
Alcohols
PR-MC SAFT NLF-HBAverage % Error 5.27 3.19 0.19
−=i
iicalciD 2exp2exp /)((%) ρρρρ
•NLF-HB is most accurate with 3 T dependent size parameters•PR-MC is most inaccurate because liquid density data were not fitted

Classification of components and objective function for VLE comparison
NONPOLAR COMPONENTS (NP)– Non-hydrogen bonding, low dipole moments– Methane, ethane, …
ASSOCIATING COMPONENTS (AS)– Self hydrogen bonding components– Alcohols, acid, amines, …
NON-ASSOCIATING COMPONENTS (NA)– Do not form self-association, weakly polar– Can form cross-association – Ketone, ether, ester, aldehyde,…
−+−=i
iicalciii
calci yyyPPPOBJF 2exp2exp2exp2exp /)(/)(
100/)(1(%) expexp ×−= i
iicalc
i PPPN
DP
−=i
icalci NyyDY /exp

System Index : VLE for NP + NP System at low P
NP + NP : Hexane + n-Alkane Systems– C7 : Hexane + Heptane – C8 : Hexane + Octane – C10 : Hexane + Decane – C12 : Hexane + Dodecane – C16 : Hexane + Hexadecane

VLE of NP + NP System at low P (hexane + n-alkane)
Fig.3 Comparison of error in bubble pressure calculation for NP + NP systems at low P (hexane + n-alkane)
C6 C8 C10 C12
Per
cent
err
or in
bub
ble
P c
alcu
latio
n
0
1
2
3
PRSAFTNLF
Fig.4 Comparison of error in bubble point compostion calculation for NP + NP systems at low P (hexane + n-alkane)
C6 C8 C10 C12
Abs
olut
e er
ror i
n bu
bble
poi
nt c
ompo
sitio
n
0.000
0.002
0.004
0.006
0.008
0.010
0.012
PR SAFTNLF
PR SAFT NLF
DP(%) DY DP(%) DY DP(%) DY
Average 0.52 0.005 1.69 0.006 0.55 0.007
•All three EOS model shows good agreements with data (DP < 1-2 %, DY < 0.01) •Although SAFT seems most inaccurate, most error is due to inaccuracy in the pure component vapor pressure

System Index : VLE for NP + AS System at low P
NP + AS : hexane + 1-alkanol– OL1 : hexane + methanol – OL2 : hexane + ethanol – OL3 : hexane + 1-propanol – OL4 : hexane + 1-butanol – OL5 : hexane + 1-pentanol – OL6 : hexane + 1-hexanol – OL7 : hexane + 1-heptanol

VLE of NP + AS System at low P (hexane + 1-alkanol)
Fig.5 Comparison of error in bubble pressure calculation for NP + AS systems at low P (hexane + 1-alkanol)
OL1 OL2 OL3 OL4 OL5 OL6 OL7
Per
cent
err
or in
bub
ble
P c
alcu
latio
n
0
1
2
3
4
5
PR-WSSAFTNLF-HB
Fig.6 Comparison of error in bubble point compostion calculation for NP + AS systems at low P (hexane + 1-alkanol)
OL1 OL2 OL3 OL4 OL5 OL6 OL7
Abs
olut
e er
ror i
n bu
bble
poi
nt c
ompo
sitio
n
0.000
0.005
0.010
0.015
0.020
0.025
0.030
0.035
PR-WSSAFTNLF-HB
PR-WS SAFT NLF-HB
DP(%) DY DP(%) DY DP(%) DY
Average 1.89 0.009 1.36 0.008 1.37 0.009
•All three EOS model shows good agreements with data (DP < 1-2 %, DY < 0.01) •NLF-HB EOS shows better performance as the molecular weight of 1-alkanol becomes larger

System Index : VLE of NA + NA System at low P
NA + NA : Mixtures of ketone, ether, ester – DEE293 : acetone + diethyl ether at 293.15 K– DEE303 : acetone + diethyl ether at 303.15 K– MA308 : acetone + methyl acetate at 308.15 K– MA328 : acetone + methyl acetate at 328.15 K
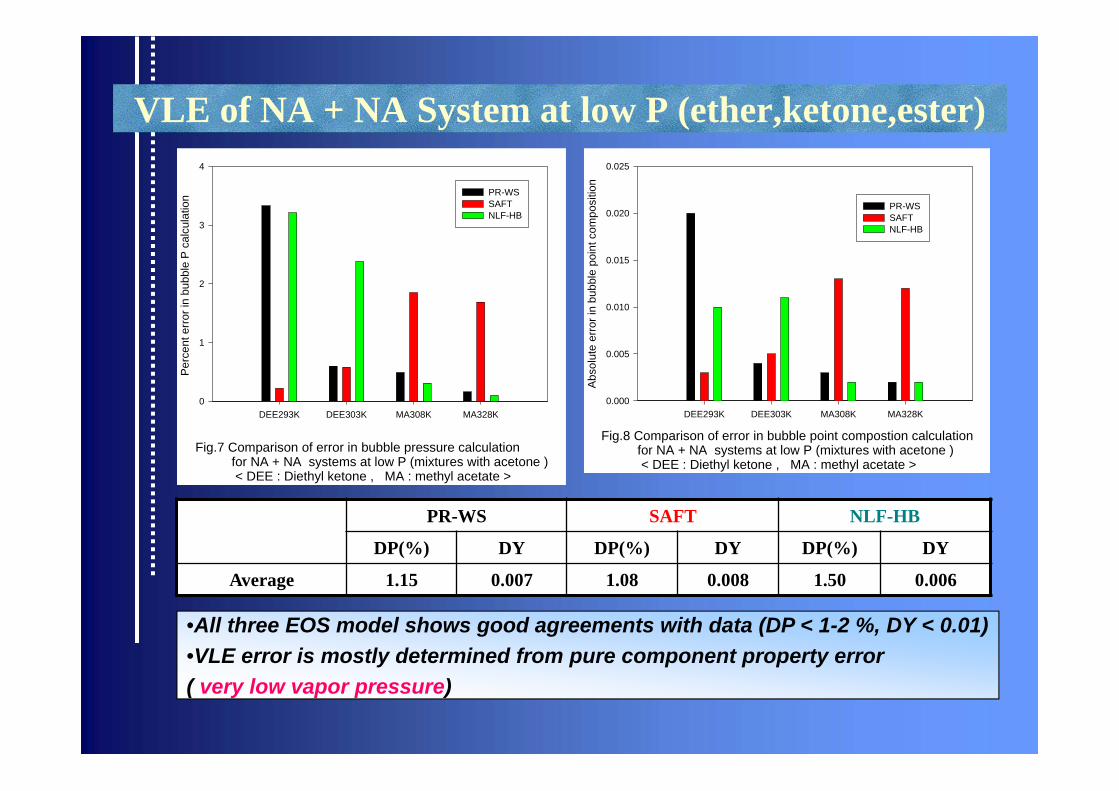
VLE of NA + NA System at low P (ether,ketone,ester)
Fig.7 Comparison of error in bubble pressure calculation for NA + NA systems at low P (mixtures with acetone ) < DEE : Diethyl ketone , MA : methyl acetate >
DEE293K DEE303K MA308K MA328K
Per
cent
err
or in
bub
ble
P c
alcu
latio
n
0
1
2
3
4
PR-WSSAFTNLF-HB
Fig.8 Comparison of error in bubble point compostion calculation for NA + NA systems at low P (mixtures with acetone ) < DEE : Diethyl ketone , MA : methyl acetate >
DEE293K DEE303K MA308K MA328K
Abs
olut
e er
ror i
n bu
bble
poi
nt c
ompo
sitio
n
0.000
0.005
0.010
0.015
0.020
0.025
PR-WSSAFTNLF-HB
PR-WS SAFT NLF-HB
DP(%) DY DP(%) DY DP(%) DY
Average 1.15 0.007 1.08 0.008 1.50 0.006
•All three EOS model shows good agreements with data (DP < 1-2 %, DY < 0.01) •VLE error is mostly determined from pure component property error ( very low vapor pressure)

System Index : VLE of NA + AS System at low P
NA + AS : ketone,ether, ester + 1-alkanol – 1 : acetone + methanol at 298.15 K – 2 : acetone + methanol at 328.15 K – 3 : acetone + ethanol at 305.15 K – 4 : acetone + ethanol at 32815 K – 5 : diethyl ether + methanol at 303.15 K – 6 : diethyl ether + ethanol at 298.15 K – 7 : diethyl ether + ethanol at 313.15 K – 8 : methyl acetate + methanol at 298.15 K – 9 : methyl acetate + methanol at 308.15 K – 10 : methyl acetate + ethanol at 323.15 K – 11 : methyl acetate + ethanol at 333.15 K

VLE of NA+AS System at low P (1-alcohol + ketone,ether,esters)
Fig.9 Comparison of error in bubble pressure calculation for AS + NA systems at low P
1 2 3 4 5 6 7 8 9 10 11
Per
cent
err
or in
bub
ble
P c
alcu
latio
n
0
1
2
3
4
5
6
7
PR-WSSAFTNLF-HB
Fig.10 Comparison of error in bubble point compostion calculation for AS + NA systems at low P
1 2 3 4 5 6 7 8 9 10 11
Abs
olut
e er
ror i
n bu
bble
poi
nt c
ompo
sitio
n
0.00
0.01
0.02
0.03
0.04
PR-WSSAFTNLF-HB
PR-WS SAFT NLF-HB
DP(%) DY DP(%) DY DP(%) DY
Average 0.89 0.005 3.62 0.022 1.77 0.011
• SAFT and NLF-HB require additional parameters for cross-association • While SAFT seems most inaccurate, the result can be further optimized using more refined cross-association parameters.• NLF-HB shows good performance despite the simplification that cross associationenergies are the same as those of self association of alcohols

System index : VLE of AS+AS systems at low P
AS + AS : mixtures of water, alcohol, acid– A : water + methanol at 298.15 K– B : water + methanol at 308.15 K– C : water + methanol at 323.15 K– D : water + methanol at 373.15 K– E : water + methanol at 423.15 K– F : water + ethanol at 298.15 K– G : water + ethanol at 312.91 K– H : water + ethanol at 347.94 K– I : water + ethanol at 413.15 K– J : water + 1-propanol at 303.15 K– K : water + 1-propanol at 333.15 K– L : water + 1-propanol at 352.95 K– M : water + acetic acid at 293.15 K– N : water + acetic acid at 298.15 K– O : water + acetic acid at 303.15 K

VLE of AS + AS System at low P (mixtures of water,alcohol, acid)
Fig.12 Comparison of error in bubble point compostion calculation for AS + AS systems at low P (water, alcohol,acids)
A B C D E F G H I J K L M N O
Abs
olut
e er
ror i
n bu
bble
poi
nt c
ompo
sitio
n
0.00
0.01
0.02
0.03
0.04
0.05
PR-WSSAFTNLF-HB
Fig.11 Comparison of error in bubble pressure calculation for AS + AS systems at low P (water, alcohol,acids)
A B C D E F G H I J K L M N O
Per
cent
err
or in
bub
ble
P c
alcu
latio
n
0
1
2
3
4
5
6
PR-WSSAFTNLF-HB
PR-WS SAFT NLF-HB
DP(%) DY DP(%) DY DP(%) DY
Average 1.84 0.011 2.12 0.016 1.35 0.012
• All three EOS model shows good agreements with data (DP < 1-2 %, DY < 0.01) • NLF-HB shows good result for water + acid systems using the extended hydrogen bonding theory (Park, Kang, Yoo and Lee , 2001)

Extended hydrogen bonding theory for dimers
Extended lattice statistics considering dimerization for acids
Presented at PPEPPD 2001 symposium (poster session)
New partition function proposed for dimerization
Generalized treatment of dimerization and normal association
!)!2(!!
1110
1
11 HNDD
DNN
Ng H=

VLE of water + acetic acid system
Fig.4 Comparison of Experimental Result with Caculation for Water + Acetic Acid System
Mole fraction of water
0.0 0.2 0.4 0.6 0.8 1.0
Pre
ssur
e / k
Pa
1.0
1.5
2.0
2.5
3.0
3.5
4.0
4.5
5.0
PR-WS
SAFT
NLF-HB
•Very complex behavior of system
-Self Association (water)-Dimerization (acid)-Cross Assocation (acid-water)
• NLF-HB shows most accurate result using new extended HB theory
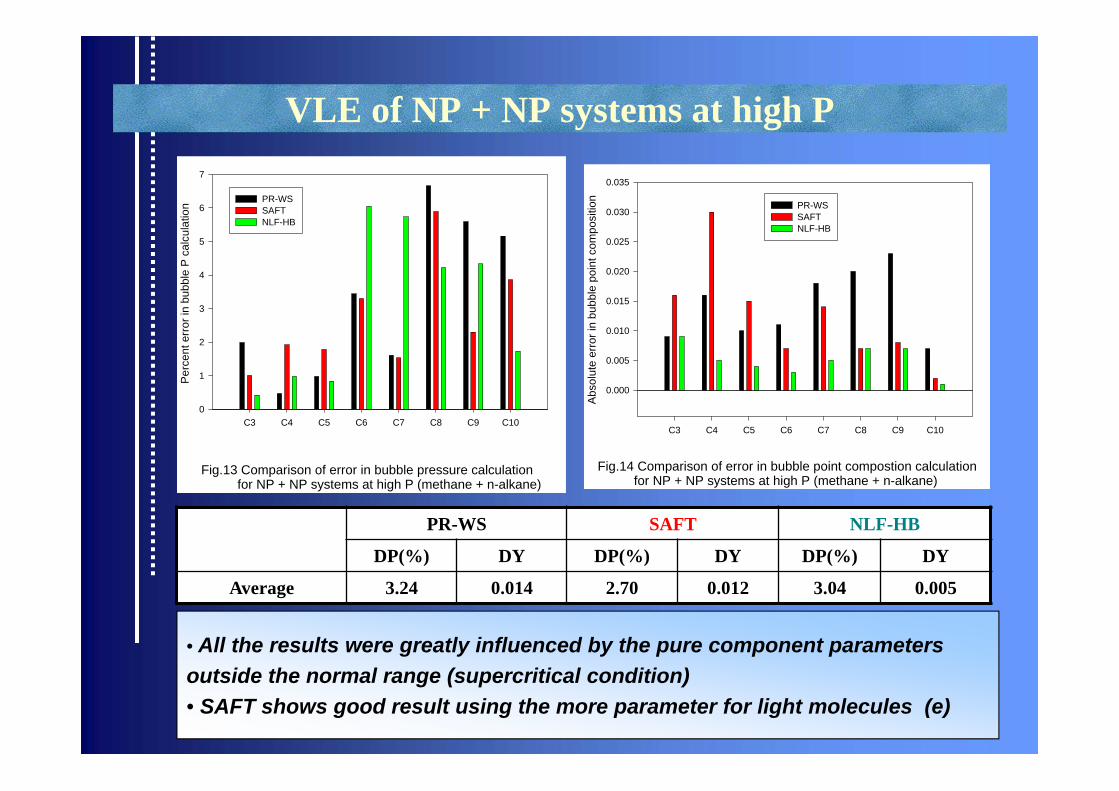
VLE of NP + NP systems at high P
Fig.13 Comparison of error in bubble pressure calculation for NP + NP systems at high P (methane + n-alkane)
C3 C4 C5 C6 C7 C8 C9 C10
Per
cent
err
or in
bub
ble
P c
alcu
latio
n
0
1
2
3
4
5
6
7
PR-WSSAFTNLF-HB
Fig.14 Comparison of error in bubble point compostion calculation for NP + NP systems at high P (methane + n-alkane)
C3 C4 C5 C6 C7 C8 C9 C10
Abs
olut
e er
ror i
n bu
bble
poi
nt c
ompo
sitio
n
0.000
0.005
0.010
0.015
0.020
0.025
0.030
0.035
PR-WSSAFTNLF-HB
PR-WS SAFT NLF-HB
DP(%) DY DP(%) DY DP(%) DY
Average 3.24 0.014 2.70 0.012 3.04 0.005
• All the results were greatly influenced by the pure component parameters outside the normal range (supercritical condition) • SAFT shows good result using the more parameter for light molecules (e)

NP + AS systems at high P (CO2 + alcohol)
Fig.15 Comparison of error in bubble pressure calculation for NP + AS systems at high P (carbon dioxide + alcohol) < A: CO2 + methanol / B : CO2 + ethanol >
A1 A2 A3 A4 A5 B1 B2 B3 B4
Per
cent
err
or in
bub
ble
P c
alcu
latio
n
0
2
4
6
8
PR-WSSAFTNLF-HB
Fig.16 Comparison of error in bubble point compostion calculation for NP + AS systems at high P (carbon dioxide + alcohol) < A: CO2 + methanol / B : CO2 + ethanol >
A1 A2 A3 A4 A5 B1 B2 B3 B4
Abs
olut
e er
ror i
n bu
bble
poi
nt c
ompo
sitio
n
0.00
0.02
0.04
0.06
0.08
PR-WSSAFTNLF-HB
PR-WS SAFT NLF-HB
DP(%) DY DP(%) DY DP(%) DY
Average 3.98 0.011 3.72 0.019 3.28 0.012
• Similar trend as the previous slideCalculation failed for PR-WS •SAFT and NLF-HB shows inaccurate result

Polymer Solubility for NP + NP mixtures
Fig.17 Comparison of activity calculation result for NP (solvent) + NP (polymer) systems < A : benzene + PS / B: benzene + PIB >
A1 A2 A3 A4 A5 A6 A7 A8 B1 B2 B3 B4 B5
Per
cent
erro
r in
activ
ity c
oeffi
cien
t
0
1
2
3
4
5
6
PR-WSSAFTNLF-HB
PR-WS SAFT NLF-HBAverage % Error 1.90 2.08 1.81
• All three EOS model shows good agreement with data

Polymer solubility for AS + NA mixtures
Fig.17 Comparison of activity calculation result for NP + NA systems < A : benzene + PVA / B: DEK + PP>
A1 A2 B1 B2
Per
cent
erro
r in
activ
ity c
oeffi
cien
t
0
5
10
15
20
25
PR-WSSAFTNLF-HB
PR-MC SAFT NLF-HBAverage % Error - 13.6 15.8
• Calculation failed for PR-WS •SAFT and NLF-HB shows inaccurate result

Polymer solubility calculations using PR-WS EOS
Result of Orbey and Sandler (AIChE J. 1994)
– kij value range : 0.77 to 0.97 for NP + NP systems
kij value failed to match underlying assumption within meaningful range (-1 to 1) of binary parameters for NP + AS polymer solubility
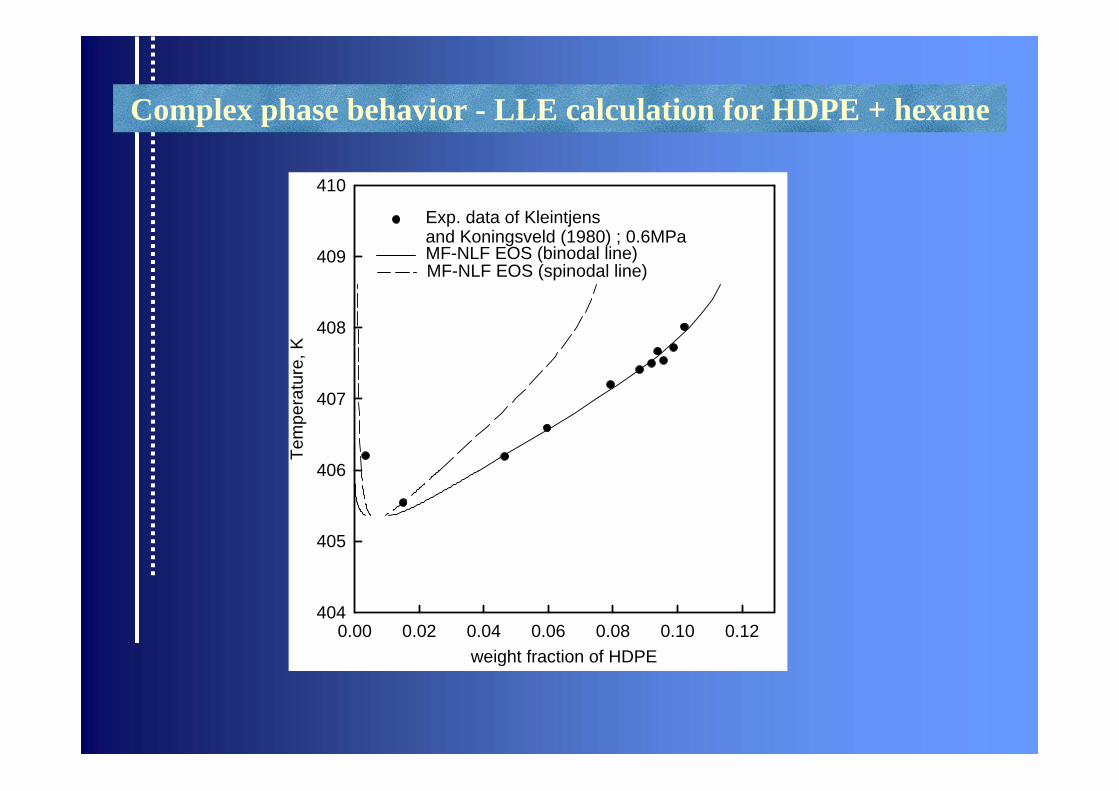
Complex phase behavior - LLE calculation for HDPE + hexane
weight fraction of HDPE0.00 0.02 0.04 0.06 0.08 0.10 0.12
Tem
pera
ture
, K
404
405
406
407
408
409
410
Exp. data of Kleintjens and Koningsveld (1980) ; 0.6MPaMF-NLF EOS (binodal line)MF-NLF EOS (spinodal line)

Complex phase behavior – LLE of PB + PS blends
Mole fraction of PBD0.0 0.2 0.4 0.6 0.8 1.0
Tem
pera
ture
, K
340
350
360
370
380
390
400
410
420
430Data of Rostami and Walsh (1985)
101.3 kPa 101.3 MPaCal'd by MF-NLF EOS
MF-NLF EOS (binodal line)101.3 kPa 101.3 MPa
MF-NLF EOS (spinodal line)101.3 kPa 101.3 MPa

Phase behavior of water + decane system
Mole fraction of water, x1
0.0 0.2 0.4 0.6 0.8 1.0
P (M
Pa)
0
5
10
15
20
25
30
573.2 K593.2 K
573.2 K593.2 K
Exp. data [15]
Calc'd by NLF EOS

Computational Aspects
PVT Behavior Computation speed Remark
PR-WS Simple Fast Can violate basic assumption using some parameter sets.
SAFT Complex Slow(10 times NLF-HB)
Extra computation time for balance eqn. solving when two or
more types of association
NLF-HBRelatively
simpleRelatively fast
(4 time PR-WS)
Extra computation time for balance eqn. solving when two or
more types of association

Sensitivity of Binary Interaction Parameters
System EOS Temperature dP/dKij dY/dKijHexane + Hexadecane PR-WS 293.15 0.04 0.00003
NLF-HB 293.15 0.62 0.00152SAFT 293.15 0.57 0.00092
Hexane + 1-Hexanol PR-WS 293.15 0.30 0.02600NLF-HB 293.15 0.69 0.08100SAFT 293.15 0.69 0.00699
Methanol + Water PR-WS 298.15 0.22 1.52000NLF-HB 298.15 0.15 1.09000SAFT 298.15 0.26 1.91000
ij
ijij
ij
ij
ijij
ij
kkyky
dkdY
kkPkP
dkdP
02.0)99.0()01.1(
02.0)99.0()01.1(
11 −=
−= • All the EOS model have small
derivatives with respect to paramters -> robust behavior of binary interaction parameters

Error increase due to T difference in VLE sets
T(deg.C)
Kij
PR-WS SAFT NLF-HB
DP DY DP DY DP DY
25 Optimum 1.82 0.0044 1.33 0.002 1.14 0.003
75 Optimum 2.97 0.0177 1.74 0.010 2.92 0.012
75 Value at 25 deg.C 3.27 0.0151 3.85 0.023 2.99 0.019
Increase in error 0.30 -0.0026 2.11 0.013 0.07 0.007
• System : n-Hexane + 1- Propanol
• All three EOS models do not significantly affected by the temperature dependency of parameters•Among 3 EOS models, SAFT EOS is most sensitive for this specific system

Conclusion
Pure Properties (58 comp.s) and VLE (82 isotherms) were compared for PR-WS, SAFT and NLF-HB EOS.
For pure components, NLF-HB gives best result due to temperature dependent pure component parameters.
For VLE calculation most EOS considered showed similar degree of prediction.
For AS + AS systems, new extended HB model shows better result than the other two EOS models
For computational aspect, PR-WS EOS is fast and easy, while SAFT is most complex and time-consuming.
All three EOS model showed robust result with respect to change in interaction parameters

Kyong Hoe Ru - Pavillion
Faces of Ancient Korean
Korea-Japan 2002 World Cup(who will be the winner ?)
Ancient statue Bodhisattva (A.D. 6 to 7 )

![Lecture on Intrinsically conducting polymers on textiles [EN] · Conducting polymers • Intrinsically conducting polymers (ICPs) are π-conjugated organic polymers able to conduct](https://img.pdfslide.us/doc/110x75/5f07a9317e708231d41e19a9/lecture-on-intrinsically-conducting-polymers-on-textiles-en-conducting-polymers.jpg)
![Laurence W. McKeen, PhD - Pentasil Used in Medical Devices.pdf · of branched polymers include star polymers, comb polymers, brush polymers, dendronized polymers [1], ladders, and](https://img.pdfslide.us/doc/110x75/5fd30108783da00f76371237/laurence-w-mckeen-phd-pentasil-used-in-medical-devicespdf-of-branched-polymers.jpg)


![[1] Molecular Weight Determination of Peptides and Proteins ......applicable to peptides and proteins (Yates, 1998), DNA and RNA (Gross, 2000), glycoconjugates, and synthetic polymers](https://img.pdfslide.us/doc/110x75/6117a0978e142443633884cf/1-molecular-weight-determination-of-peptides-and-proteins-applicable-to.jpg)