Embed Size (px)
Citation preview
International Journal of Engineering Research and Technology. ISSN 0974-3154, Volume 13, Number 12 (2020), pp. 4666-4678
© International Research Publication House. http://www.irphouse.com
4666
A Review of Methods Used to Determine the Overall Stiffness of Unitary
Automotive Body Structures
M. Matsimbi A,*, P. K. NziuA, L. M. MasuA, M. MaringaB
A Department of Mechanical Engineering, Vaal University of Technology, South Africa.
B Department of Mechanical and Mechatronics Engineering, Central University of Technology, South Africa.
ORCID: 0000-0002-5899-0700 (PK Nziu), 0000-0002-8544-6321(Prof LM Masu)
ABSTRACT
A review of the methods that are used to determine the overall
stiffness of automotive body structures was conducted. The
review showed that the overall stiffness of body structures is
affected by the geometry of the body structure as well as the
material used to build the body structure. However, only a
limited amount of literature was found that demonstrated how
the stiffness behaviour of the body structure is affected by the
change in geometry or material. It was also found that the
deformation and applied load are directly proportional for body
structures that are deformed within the elastic range. However,
most of the studies have demonstrated this occurrence by
considering the loads that are way less than the approximate,
real-life running loads. Therefore, there is a need to study the
effects of different materials as well as different geometries on
the overall stiffness of body structures when considering the
approximate real-life load cases, particularly during the early
stages of the development of new vehicle body structures.
Keywords: Automotive body structures, stiffness, bending
stiffness, torsion stiffness.
1. INTRODUCTION
From the mid-1930s, the need for developing body structures
of passenger vehicles that have reasonable strength and
stiffness with minimal weight in shortened development cycles
has been well recognized (Swallow, 1939; Booth, 1939;
Bastow, 1946; Campbell, 1955; Costin & Phipps, 1965; Cooke,
1965; Fenton, 1976; Brown, et al., 2002; Cavazzuti, et al.,
2011). These requirements have not only led to the unification
of the chassis frame and the body shell (Swallow, 1939) but,
also to the proposals of methods that can be used to model and
study the behaviour of body structures under different loading
conditions. The objective of these proposed methods is to
determine the performance characteristics of body structures
such as strength and stiffness with relatively fast turnaround
time, particularly during the early stages of the design process.
The body structure of a motor vehicle includes the chassis
frame and the body shell (Morello, et al., 2011). The chassis
frame is the main assembly on which all the mechanical
components such as the powertrain, suspension, transmission
and steering systems as well as the body shell, characterized by
the relevant and concentrated forces – are mounted (Garrett, et
al., 2001; Linton, 2002; Morello, et al., 2011). The body shell
is the container for carrying the occupants in comfort and safety
as well as luggage safely and without damage (Garrett, et al.,
2001), and it can be mounted on the chassis frame or be unitized
with it, as in modern vehicles (Morello, et al., 2011). The body
structure is designed to fulfil several functions including the
following (Linton, 2002; Kumar, et al., 2016; Seward, 2014;
Barton & Fieldhouse, 2018):
(i) It must safely carry the maximum load due to the weight
of the engine, occupants, fuel tank, drivetrain, and all
subsystems of the vehicle,
(ii) It should be able to hold all components together while
driving,
(iii) It should be able to protect the occupants against
external impact, and also minimise the risk of injury to
the other road users during impact.
While fulfilling these requirements, the body structure should
have sufficient levels of strength and stiffness so that it can
withstand various static and dynamic road loads (Brown, et al.,
2002) without suffering from fatigue failure or any other forms
of material failure (Barton & Fieldhouse, 2018). The strength
of a body structure refers to the maximum running road loads
that the body structure can carry without failure (Leckie &
Bello, 2009) and is applied to deformation within the elastic
range. The stiffness of a body structure on the other hand, is the
ability of the body structure to resist flexing or twisting when
subjected to running road loads (Sampo, et al., 2010; Leckie &
Bello, 2009). The running road loads that are encountered in
practice include the following (Gawande, et al., 2018; Brown,
et al., 2002; Happian-Smith, 2002):
(i) The weight of the occupants, luggage, body, engine, fuel
tank, radiator, drivetrain, and all subsystems of the
vehicle,
(ii) The vertical symmetric and asymmetric loads due to
uneven ground,
(iii) The lateral loading owing to cornering, nudging a kerb,
or steering of the vehicle,
(iv) The fore and aft loading due to braking, acceleration or
deceleration, towing, jacking or obstacles,
(v) The torque loading that is transmitted from the
transmission system and the driveline of the engine.
These running road loads induce static as well as dynamic
stresses and deflections due to the dynamic inertia loads as well
as the masses of passengers and various components (Morello,
International Journal of Engineering Research and Technology. ISSN 0974-3154, Volume 13, Number 12 (2020), pp. 4666-4678
© International Research Publication House. http://www.irphouse.com
4667
et al., 2011). These deflections are proportional to the
properties of the body structure such as the overall bending and
torsion stiffness. The stiffness of a body structure has an
important influence on the performance characteristics of the
vehicle, through vehicle dynamics and ride comfort (Wood, et
al., 2014; George & Riley, 2002; Law, et al., 1998; Crocombe,
et al., 2010), even on the load carrying capacity of vehicles (Na,
et al., 2015). Vehicle dynamics includes factors such as
acceleration or deceleration, handling as well as noise (Pang,
2019; Wang, et al., 2014; Pang, et al., 2010; Coox, et al., 2012).
Other performance parameters are harshness, steering, and
vibration (Masini, et al., 2004; Brown, et al., 2002; Danielsson,
et al., 2016) and the ability to absorb energy during impact
(Masini, et al., 2004). Adequate stiffness of the body structure
also help to prevent issues such as squeak, and rattle and allows
the suspension of the vehicle to work efficiently and
predictably (Kavarana & Rediers, 2001; Pang, 2019).
It is, therefore, important to minimize these deflections since
excessive deflections may lead to insufficient stiffness that can
result in unacceptable vibrations (Brown, et al., 2002; Yan, et
al., 2018) which can cause the strength of the structural joints
to weaken (Yan, et al., 2018; Masini, et al., 2004) as well as
causing issues such as under or oversteering of the vehicle
(Muley, et al., 2018; Sampo, et al., 2010). Practical examples
of very large deflections or insufficient stiffness include issues
such as when the floor plan deflects under the passenger’s feet
or when doors fail to open or close satisfactorily when the
vehicle is parked on uneven ground (Happian-Smith, 2002;
Brown, et al., 2002). Very large deformations may also cause
the windscreen and the backlight glass to crack (Chen, et al.,
2012). The body structure that has insufficient stiffness may
also be sensitive to fatigue phenomena (Hazimi, et al., 2018;
Sampo, et al., 2010). Therefore, it is important to ensure that
deflections due to running road loads are not so large as to
impair the functions of vehicles (Brown, et al., 2002; Chen, et
al., 2012), and to ensure that the body structure is rigid enough
to avoid such practical examples and to ensure a high quality
performance of the overall vehicle (Pang, 2019).
The stiffness k of a body structure is defined as the ability of
the body structure to resist deformation Δ when subjected to
load P (Leckie & Bello, 2009). Alternatively, this is defined by
the slope (k = P/Δ) of the graph of the load versus deformation
and only applies to body structures that are loaded within the
elastic range (Brown, et al., 2002). There are usually two
different kinds of stiffnesses that are used as benchmarks when
assessing the structural performance of vehicles, particularly
during the initial stages of the design process. These stiffnesses
are referred to as overall stiffnesses of a body structure and
arise primarily from bending loads and are known as the
bending stiffness, and torsion loads and are known as the
torsion stiffness. These two types of stiffnesses, namely
bending and torsion are briefly described hereunder.
Bending stiffness kb, is defined as the relationship between the
symmetrical transverse (bending) deflection Δ of a point near
the centre of the wheelbase and the factored static loads P of
the body structure. This can also be expressed by relating the
maximum deflection of the body structure to a single,
symmetrically applied load along the centreline of the
wheelbases (Brown, et al., 2002). This is usually determined by
relating the deflections of the door apertures of the side frame
of the body structure to the applied bending loads (Chen, et al.,
2012). The bending stiffness mostly affects the door apertures
of the side frame as well as the floor panels (Happian-Smith,
2002).
Torsion Stiffness kt, is defined as the relationship between the
torsion induced angle of twist θ of the body structure (measured
between the front and rear suspension mounting points) and the
pure torsion load T about the longitudinal axis of the body
structure (Brown, et al., 2002). Alternatively, the torsion
stuffiness of a body structure relates the angle of twist of the
body structure to an applied pure torsion load which is applied
on the suspension towers at either the front or rear axles, as
equal and opposite couples (Chen, et al., 2012). Low values of
torsion stiffness mostly affect the doors when the vehicle is
parked on uneven ground such as when one wheel is on a kerb
(Happian-Smith, 2002) as well as the cornering behavior of a
vehicle, when each wheel experiences different vertical loads
(Ardigo, et al., 2012). The torsion stiffness is also affected by
windscreen and the backlight glass. The torsion stiffness can be
reduced by approximately 40% when the glass is removed
(Webb, 1984; Happian-Smith, 2002).
The bending and torsion load cases apply completely different
local loads to individual component of a vehicle body structure
(Brown, et al., 2002). The torsion stiffness has a detrimental
effect on the handling characteristics of vehicles (Happian-
Smith, 2002) and several studies found that the torsion load
case is the most difficult to design for (Mohd Nor, et al., 2016;
Brown, et al., 2002; Kirioka, 1965; Cooke, 1965), and therefore
the torsion stiffness is often used as a benchmark (Brown, et al.,
2002) to indicate the structural efficiency of the vehicle body
structure.
Since the mid-1930s, researchers have often used three
techniques to analyse and determine the stiffness of body
structures, namely; experimental, analytical and numerical
techniques. The goal of this paper is to present an overview of
these three methods, with specific interests in how they are used
to determine the bending and torsion stiffnesses of unitary
automotive body structures. The following section, section 2,
discusses these techniques.
2. DETERMINATION OF THE OVERALL STIFFNESS OF
BODY STRUCTURES
The analysis and determination of the overall stiffness of body
structures consist of supporting the body structure at the
suspension mounting points, loading it at selected points, and
recording the resulting deformations at the point of application
of the load. The graph of the applied load versus deformation
is then plotted and the stiffness of the body structure is
determined as the slope of this graph. Experiments found that
the load is directly proportional to the displacement and that the
torsion increases linearly with the angle of twist, both for elastic
deformation (Swallow, 1939; Scott & Antonsson, 1998; Tebby,
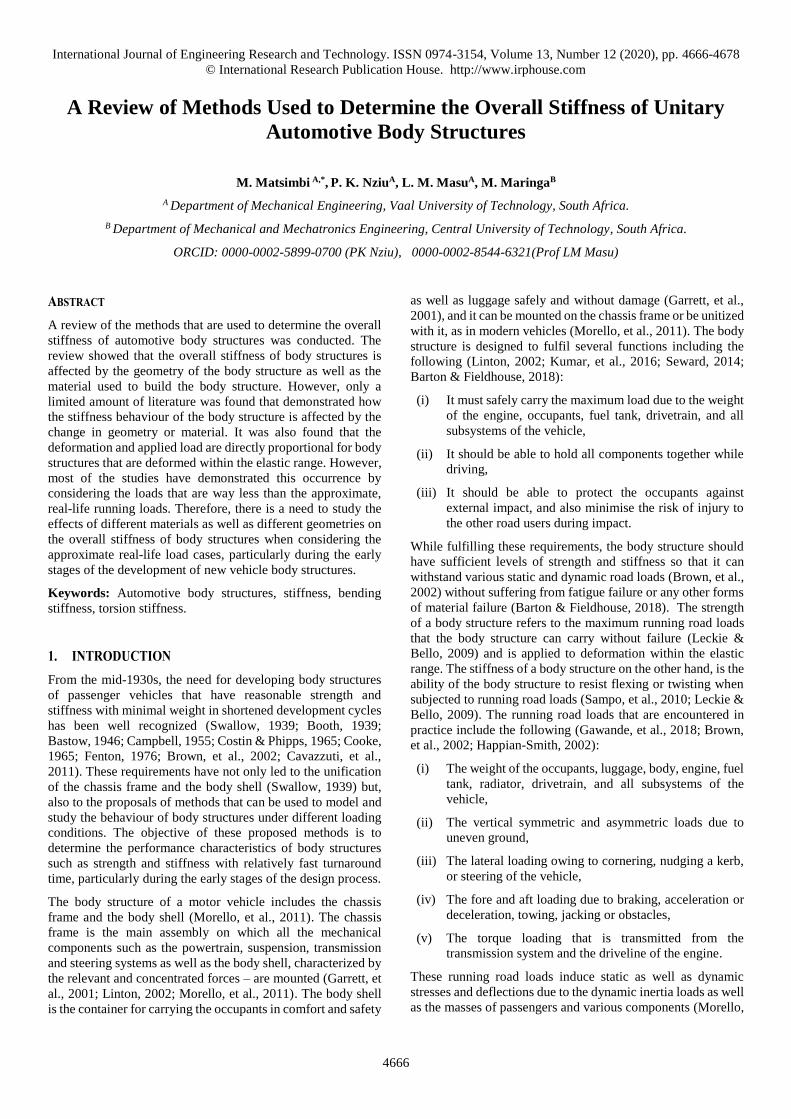
et al., 2011; Mohd Nor, et al., 2016; Chen, et al., 2012). Figure
1 shows typical testing diagrams that are used to determine the
overall stiffness of body structures. Figure 1(a) depicts a
International Journal of Engineering Research and Technology. ISSN 0974-3154, Volume 13, Number 12 (2020), pp. 4666-4678
© International Research Publication House. http://www.irphouse.com
4668
bending load case, whereas, Figure 1(b) and (c) depict pure
torsion load cases. Although reasonable values of stiffness are
desirable, there is usually a weight penalty that can result in
increasing the stiffness of body structures. Therefore, a
consideration that is paramount during the preliminary stage of
the design process is that of the stiffness to weight ratio
parameter (Cooke, 1965; Barton & Fieldhouse, 2018).
(a) Bending stiffness setup
(b) Torsion stiffness setup
(c) Torsion stiffness setup
Figure 1 The testing diagrams of the stiffness of body
structures for (a) bending, (b) torsion with equal and
opposite loads and (c) torsion applied on one of an axle –
courtesy (Pang, 2019; Barton & Fieldhouse, 2018)
Here, the symbol F stands for the vertical load applied on both
the left- and right-hand rocker sills in the case of bending, L the
wheelbase, P the applied load, W the track width, θ the angle of
twist and δ the vertical displacement both for the torsion load.
The symbols W, θ, and δ are shown in Figure 1(c). Figure 1(b)
is common in analytical and numerical tests while Figure 1(c)
is more common in empirical tests. However, both
configurations should yield similar results for the same
magnitude of torque imposed in a body structure.
The following subsection, subsection 2.1. discusses the
analysis and determination of the bending and torsion stiffness
using experimental techniques. The setup for measuring
bending deflections is similar to the setup shown in Figure 1(a)
and the setup for measuring angles of twist is similar to the
setup shown in Figure 1(a) and (b).
3. EXPERIMENTAL TECHNIQUES
In experimental techniques, vehicle body structures are usually
scaled down and be modelled using materials such as balsa
wood or plastic (Adams, 1993; Mohd Nor, et al., 2016;
Thompson, et al., 1998), particularly during the early stages of
the design process. However, the actual vehicle body structure
is used during the testing phase of the design process (Swallow,
1939; Kirioka, 1965; Podkowski, et al., 2019; Barton &
Fieldhouse, 2018). During the testing process, the body
structure is subjected to either bending or torsion load in order
to examine its behavior. However, these tests can only be
carried out on an existing body structure or using models during
the rapid prototyping stage of the design process (Podkowski,
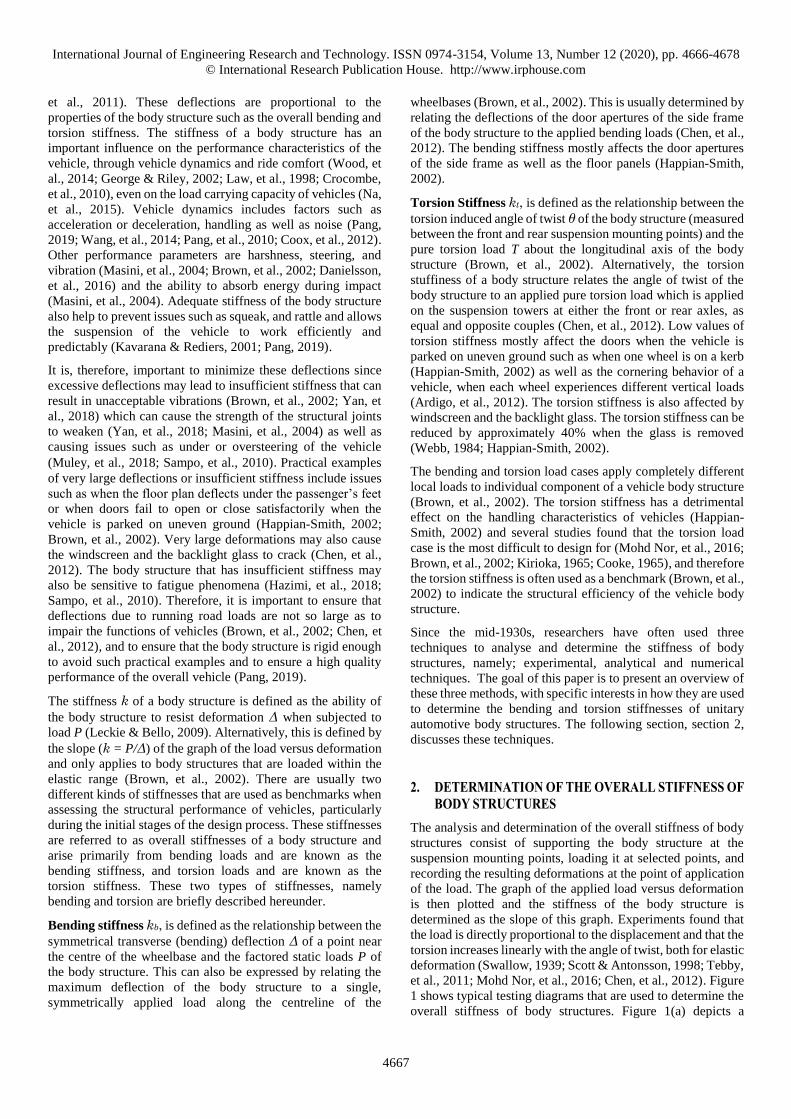
et al., 2019; Swallow, 1939; Thompson, et al., 1998). Figure 2
shows the empirical setup for stiffness testing of an integral
body structure as well as the triangulated space frame.
(a) Bending setup
(b) Torsion setup
(c) Triangulated space frame
Figure 2 Empirical setup for stiffness testing of an integral
body structure (a) bending and (b) torsion and (c) torsion
of a triangulated space frame – courtesy (Magalhães &
Agostinho, 2004; Scott & Antonsson, 1998; Barton &
Fieldhouse, 2018)
International Journal of Engineering Research and Technology. ISSN 0974-3154, Volume 13, Number 12 (2020), pp. 4666-4678
© International Research Publication House. http://www.irphouse.com
4669
The formula used to determine the bending stiffness using the
experimental techniques is discussed hereunder.
Bending stiffness – for bending behaviour, testing consists of
fixing the body structure to rigid beams running along the
length and width of the body structure, the latter at the front and
rear axles and subjecting it to a concentrated load at a location
close to the rear mounting points of the front seats. Using
dynamometers or displacement sensors, the bending resistance
is measured in Newtons for each millimeter of transverse
displacement that is obtained (Pang, 2019; Swallow, 1939). For
the passenger vehicle, the bending stiffness is determined for
deflections up till the acceptable limits of deflection of the side
frame door apertures (Happian-Smith, 2002).
The bending behaviour of a body structure loaded and
restrained as described above is given by Equation 1 thus:
𝑘𝑏 =𝐹
δ𝑚𝑎𝑥 (1)
𝑤ℎ𝑒𝑟𝑒 δ𝑚𝑎𝑥 =δ𝑙𝑚𝑎𝑥+δ𝑟𝑚𝑎𝑥
2−
δ𝑓𝑟+δ𝑓𝑙+δ𝑟𝑙+δ𝑟𝑟
2 (2)
Here the symbol kb represents the bending stiffness, F the
applied load, δmax the maximum deflection, δlmax and δrmax the
maximum deflections of the left and right sides rocker sills,
respectively, δfr and δfl the deflections of the right and left sides
of the front mounting points, respectively; and δrl and δrr the
deflections of the left and right sides of the rear mounting
points, respectively (Pang, 2019).
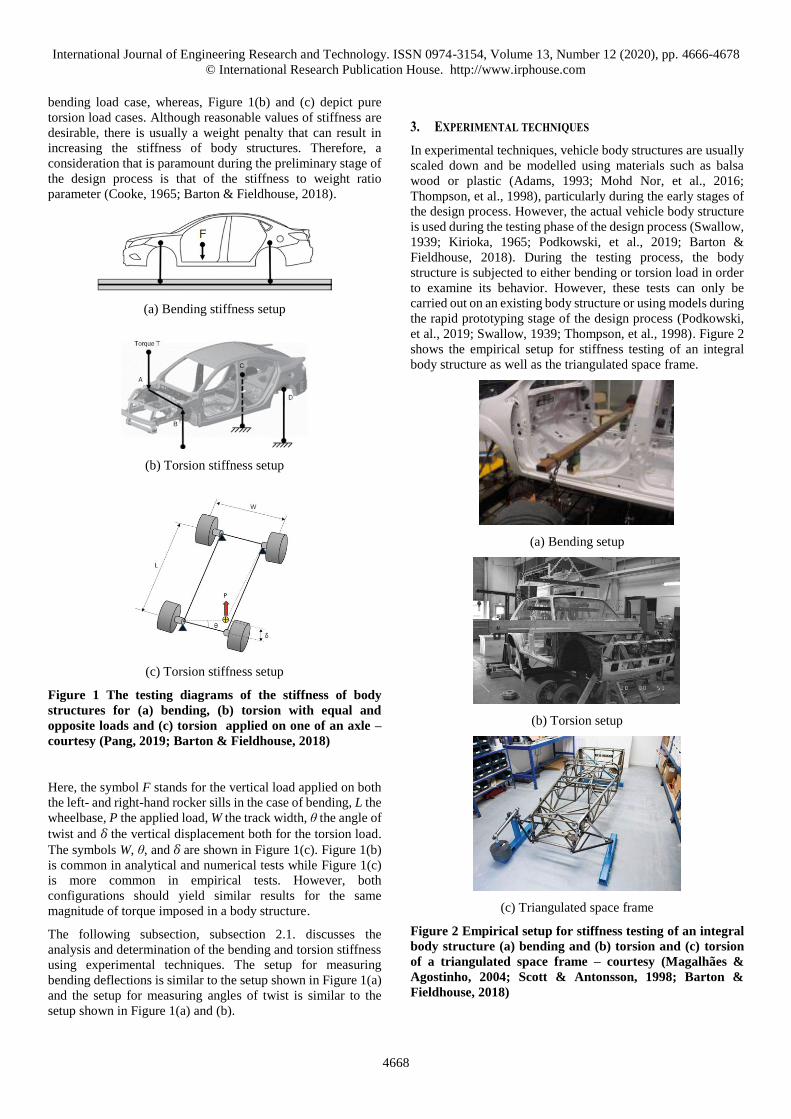
Scott and Antonsson (1998) and Mohd Nor et al. (2016)
separately performed empirical bending stiffness tests on the
body structure of the passenger vehicle shown in Figure 2(b),
and on a plastic Simple Structural Surfaces (SSS) model of the
passenger vehicle, respectively. The bending stiffness of this
body structure was found to be 2500 N/mm. The results of load
versus deflection for the test that was conducted by Scott and
Antonson (1998) are shown in Figure 3, and the results of load
versus deflection for the test that was conducted by Mohd Nor
et al. (2016) are shown in Figure 4.
Figure 3 Bending values of load versus deflection results
for the body structure shown in Figure 2(b) – courtesy
(Scott & Antonsson, 1998)
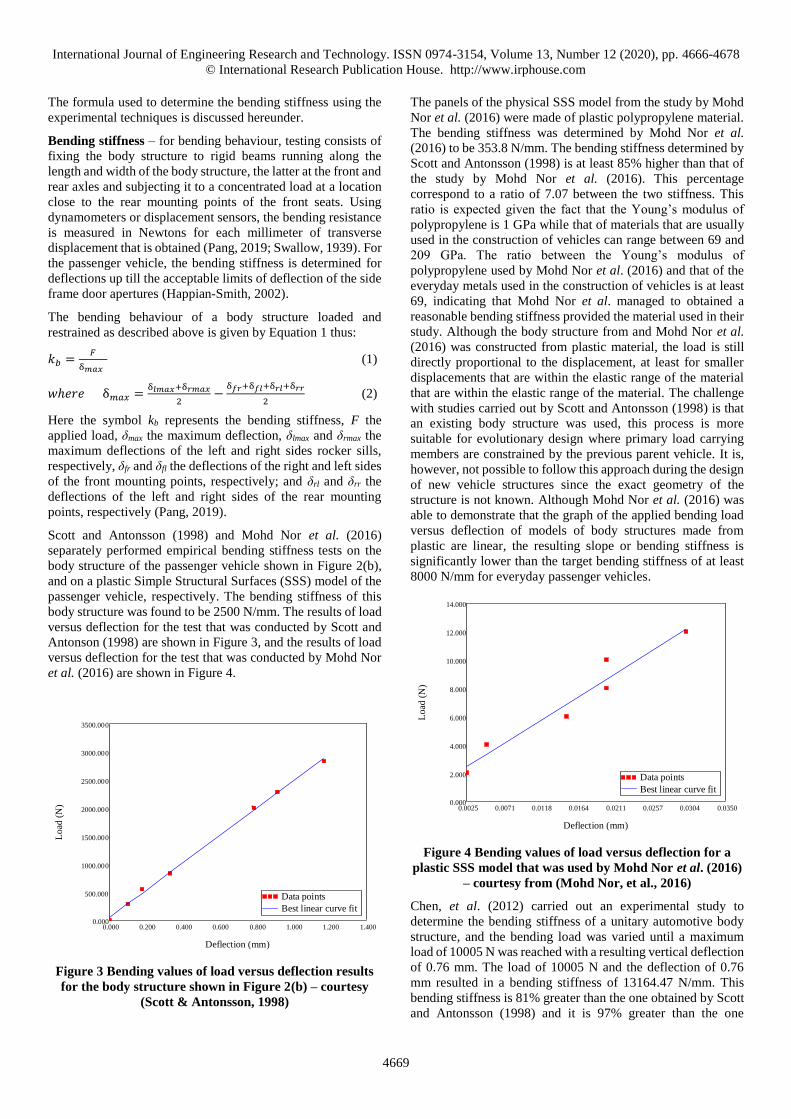
The panels of the physical SSS model from the study by Mohd
Nor et al. (2016) were made of plastic polypropylene material.
The bending stiffness was determined by Mohd Nor et al.
(2016) to be 353.8 N/mm. The bending stiffness determined by
Scott and Antonsson (1998) is at least 85% higher than that of
the study by Mohd Nor et al. (2016). This percentage
correspond to a ratio of 7.07 between the two stiffness. This
ratio is expected given the fact that the Young’s modulus of
polypropylene is 1 GPa while that of materials that are usually
used in the construction of vehicles can range between 69 and
209 GPa. The ratio between the Young’s modulus of
polypropylene used by Mohd Nor et al. (2016) and that of the
everyday metals used in the construction of vehicles is at least
69, indicating that Mohd Nor et al. managed to obtained a
reasonable bending stiffness provided the material used in their
study. Although the body structure from and Mohd Nor et al.
(2016) was constructed from plastic material, the load is still
directly proportional to the displacement, at least for smaller
displacements that are within the elastic range of the material
that are within the elastic range of the material. The challenge
with studies carried out by Scott and Antonsson (1998) is that
an existing body structure was used, this process is more
suitable for evolutionary design where primary load carrying
members are constrained by the previous parent vehicle. It is,
however, not possible to follow this approach during the design
of new vehicle structures since the exact geometry of the
structure is not known. Although Mohd Nor et al. (2016) was
able to demonstrate that the graph of the applied bending load
versus deflection of models of body structures made from
plastic are linear, the resulting slope or bending stiffness is
significantly lower than the target bending stiffness of at least
8000 N/mm for everyday passenger vehicles.
Figure 4 Bending values of load versus deflection for a
plastic SSS model that was used by Mohd Nor et al. (2016)
– courtesy from (Mohd Nor, et al., 2016)
Chen, et al. (2012) carried out an experimental study to
determine the bending stiffness of a unitary automotive body
structure, and the bending load was varied until a maximum
load of 10005 N was reached with a resulting vertical deflection
of 0.76 mm. The load of 10005 N and the deflection of 0.76
mm resulted in a bending stiffness of 13164.47 N/mm. This
bending stiffness is 81% greater than the one obtained by Scott
and Antonsson (1998) and it is 97% greater than the one
0.000 0.200 0.400 0.600 0.800 1.000 1.200 1.4000.000
500.000
1000.000
1500.000
2000.000
2500.000
3000.000
3500.000
Data points
Best linear curve fit
Deflection (mm)
Lo
ad (
N) 0.0025 0.0071 0.0118 0.0164 0.0211 0.0257 0.0304 0.0350
0.000
2.000
4.000
6.000
8.000
10.000
12.000
14.000
Data points
Best linear curve fit
Deflection (mm)
Load
(N
)

International Journal of Engineering Research and Technology. ISSN 0974-3154, Volume 13, Number 12 (2020), pp. 4666-4678
© International Research Publication House. http://www.irphouse.com
4670
obtained by Mohd Nor et al. (2016). Although the bending
stiffness obtained by Chen, et al. (2012) is very high compared
to the one obtained by Scott and Antonsson (1998) and even
much higher compared to the obtained by Mohd Nor et al.
(2016), this bending stiffness is within the target bending
stiffness values of every day passenger vehicles and luxury
vehicles of 8000 N/mm to 20000 N/mm. Similar to the studies
carried out by Scott and Antonsson (1998), the challenge with
the studies carried out by Chen, et al. (2012) is an existing body
structure was used and therefore not suitable of new vehicle
designs.
The formula used to determine the torsion stiffness using the
experimental techniques is discussed hereunder.
Torsion stiffness - for torsion behaviour, testing consists of
fixing the body structure to a rigid transverse beam at the
centreline of the rear axle and twisting it by means of a pivoted
transverse beam bolted to it at the centre of the front axle. Using
spring dynamometers or displacement sensors, the torsional
resistance of the body structure is measured in Nm for each
degree of twist that is obtained (Swallow, 1939; Pang, 2019).
The torsion behaviour of a body structure that is loaded and
restrained as described above is given by Equation 3 thus:
𝑘𝑡 =𝑇
θ (3)
𝑤ℎ𝑒𝑟𝑒 𝑇 = {|Rr|+|Rl|
2} Ls (4)
𝑎𝑛𝑑 𝜃 =|δr|+|δl|
Ls (5)
Here the symbol kt represents the torsion stiffness, T the
applied torque, Rr and Rl the right and left side reaction forces,
respectively; Ls the lateral distance between the mounting
points of the front axle, δr and δl the deflections of the right and
left sides of the front mounting points, respectively, and are
determined using dial gauges, sensors or dynamometers, and θ
the angle of twist due to these deflections and the lateral
distance between the mounting points of the front axle (Tebby,
et al., 2011; Thompson, et al., 1998).
A study by Swallow (1939) showed that it is possible to
increase the overall torsion stiffness of the body structure by at
least 50% while at the same time achieving at least 16% in
structural weight savings by substituting the separate chassis-
frame by a fully unitary construction, while leaving the vehicles
largely identical. Figure 5 shows a comparative study of the
torsion stiffness tests of the two body structures represented by
a 1938 model of a separate body shell and chassis-frame
construction and the 1939 model of a fully unitized
construction.
It was noted that the torsion stiffness rose from 934 Nm/deg.
(689 lbft/deg.) for the partially unitized construction to 3390
Nm/deg. (2500 lbft/deg.) for the fully unitized construction of
body structures. The unusually large hysteresis effect visible in
the loading and unloading curve of the partially unitized
construction was due to slippage on the mounting points
between the body shell and the chassis frame (Brown, et al.,
2002). Two things can also be observed from Figure 5. The first
is that, the torque is directly proportional to the angle of twist
for elastic deformation, that is, the torque-deflection
relationship is linear with a zero constant for both the partially
and fully unitized body structure, at least for elastic range
relationship. Another observation is that, since both vehicles
are largely identical, then the subassemblies of components of
body structures has a significant impact on the torsional
stiffness of the body structure. The study by Swallow (1939)
showed that the torsion stiffness of a body structure is mostly
affected by its geometry, however, this study also considered
existing vehicle body structures.
Another experimental study to determine the torsion stiffness
of a unitary automotive body structure was carried out by Chen,
et al. (2012). They varied the torque from 1020 to 4080 with
steps of 1020 until the maximum angle of twist of 0.49 ° was
reached at the front of the body structure. The results of the
graph of torque versus the angle of twist for the study carried
out by Chen, et al. (2012) are shown in Figure 6. The overall
torsion stiffness of the body structure was then calculated to be
8674.34 N-m/deg. The torsion stiffness obtained by Chen, et al.
(2012) is 61% greater than the one obtained by Swallow (1939).
However, the mass of the unitary body structure used by Chen,
et al. (2012) was not provided and therefore, it is not possible
to compare the stiffness to weight ratio of the body structure
used by Chen, et al. (2012) and the one used by Swallow
(1939). However, the torsion stiffness obtained by Chen, et al.
(2012) falls within the target stiffness values for typical
passenger vehicles of 8000 to 10000 Nm/deg. The study by
Chen, et al. (2012) demonstrated that the applied torsion is still
directly proportional to the angle of twist for actually vehicle
body structures and serves as a good basis for validation of
other studies, but cannot be used to predict the torsion stiffness
of new vehicle structures as it was shown by Swallow (1939)
that the geometry of a body structure can significantly affect its
torsion stiffness and therefore, the torsion stiffness of body
structures can vary significantly depending on their geometries.
Figure 5 Torsion stiffness tests comparison of steel unitary
chassis and steel body and chassis bolted together car body
structures of 1938 and 1939 models, respectively –
courtesy (Swallow, 1939; Brown, et al., 2002)
International Journal of Engineering Research and Technology. ISSN 0974-3154, Volume 13, Number 12 (2020), pp. 4666-4678
© International Research Publication House. http://www.irphouse.com
4671
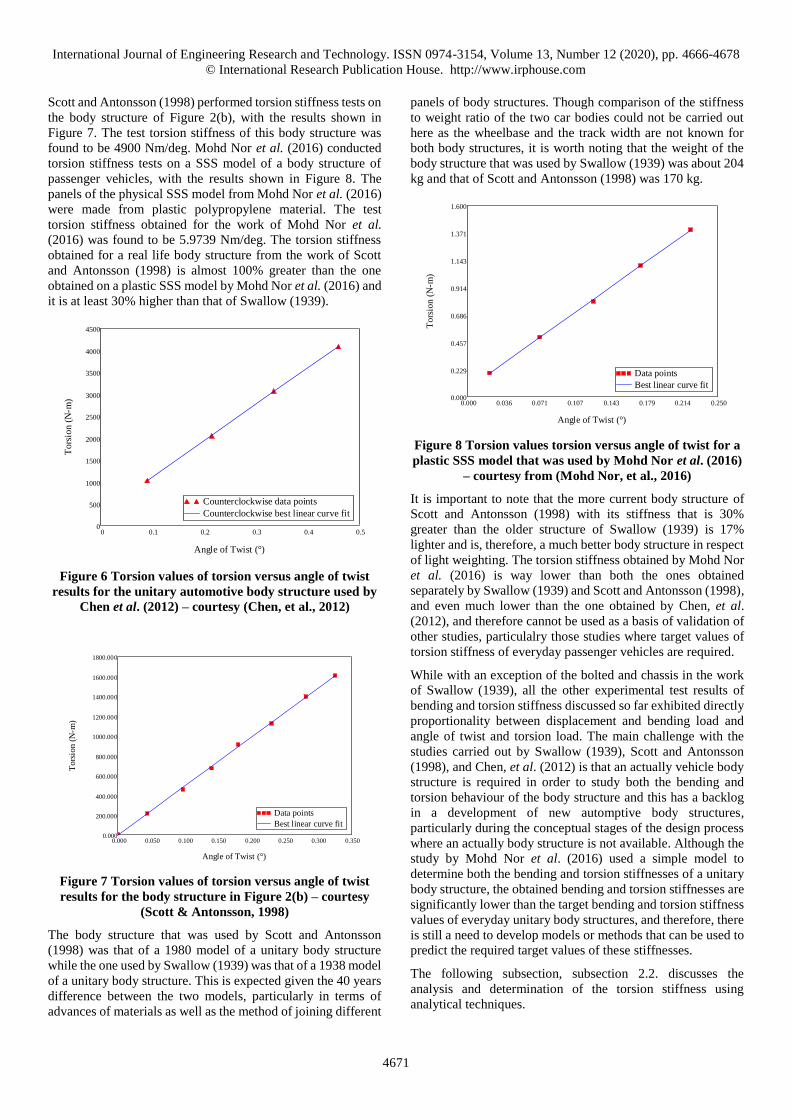
Scott and Antonsson (1998) performed torsion stiffness tests on
the body structure of Figure 2(b), with the results shown in
Figure 7. The test torsion stiffness of this body structure was
found to be 4900 Nm/deg. Mohd Nor et al. (2016) conducted
torsion stiffness tests on a SSS model of a body structure of
passenger vehicles, with the results shown in Figure 8. The
panels of the physical SSS model from Mohd Nor et al. (2016)
were made from plastic polypropylene material. The test
torsion stiffness obtained for the work of Mohd Nor et al.
(2016) was found to be 5.9739 Nm/deg. The torsion stiffness
obtained for a real life body structure from the work of Scott
and Antonsson (1998) is almost 100% greater than the one
obtained on a plastic SSS model by Mohd Nor et al. (2016) and
it is at least 30% higher than that of Swallow (1939).
Figure 6 Torsion values of torsion versus angle of twist
results for the unitary automotive body structure used by
Chen et al. (2012) – courtesy (Chen, et al., 2012)
Figure 7 Torsion values of torsion versus angle of twist
results for the body structure in Figure 2(b) – courtesy
(Scott & Antonsson, 1998)
The body structure that was used by Scott and Antonsson
(1998) was that of a 1980 model of a unitary body structure
while the one used by Swallow (1939) was that of a 1938 model
of a unitary body structure. This is expected given the 40 years
difference between the two models, particularly in terms of
advances of materials as well as the method of joining different
panels of body structures. Though comparison of the stiffness
to weight ratio of the two car bodies could not be carried out
here as the wheelbase and the track width are not known for
both body structures, it is worth noting that the weight of the
body structure that was used by Swallow (1939) was about 204
kg and that of Scott and Antonsson (1998) was 170 kg.
Figure 8 Torsion values torsion versus angle of twist for a
plastic SSS model that was used by Mohd Nor et al. (2016)
– courtesy from (Mohd Nor, et al., 2016)
It is important to note that the more current body structure of
Scott and Antonsson (1998) with its stiffness that is 30%
greater than the older structure of Swallow (1939) is 17%
lighter and is, therefore, a much better body structure in respect
of light weighting. The torsion stiffness obtained by Mohd Nor
et al. (2016) is way lower than both the ones obtained
separately by Swallow (1939) and Scott and Antonsson (1998),
and even much lower than the one obtained by Chen, et al.
(2012), and therefore cannot be used as a basis of validation of
other studies, particulalry those studies where target values of
torsion stiffness of everyday passenger vehicles are required.
While with an exception of the bolted and chassis in the work
of Swallow (1939), all the other experimental test results of
bending and torsion stiffness discussed so far exhibited directly
proportionality between displacement and bending load and
angle of twist and torsion load. The main challenge with the
studies carried out by Swallow (1939), Scott and Antonsson
(1998), and Chen, et al. (2012) is that an actually vehicle body
structure is required in order to study both the bending and
torsion behaviour of the body structure and this has a backlog
in a development of new automptive body structures,
particularly during the conceptual stages of the design process
where an actually body structure is not available. Although the
study by Mohd Nor et al. (2016) used a simple model to
determine both the bending and torsion stiffnesses of a unitary
body structure, the obtained bending and torsion stiffnesses are
significantly lower than the target bending and torsion stiffness
values of everyday unitary body structures, and therefore, there
is still a need to develop models or methods that can be used to
predict the required target values of these stiffnesses.
The following subsection, subsection 2.2. discusses the
analysis and determination of the torsion stiffness using
analytical techniques.
0 0.1 0.2 0.3 0.4 0.50
500
1000
1500
2000
2500
3000
3500
4000
4500
Counterclockwise data points
Counterclockwise best linear curve fit
Angle of Twist (°)
Tors
ion (
N-m
)
0.000 0.050 0.100 0.150 0.200 0.250 0.300 0.3500.000
200.000
400.000
600.000
800.000
1000.000
1200.000
1400.000
1600.000
1800.000
Data points
Best linear curve fit
Angle of Twist (°)
To
rsio
n (
N-m
)
0.000 0.036 0.071 0.107 0.143 0.179 0.214 0.2500.000
0.229
0.457
0.686
0.914
1.143
1.371
1.600
Data points
Best linear curve fit
Angle of Twist (°)T
ors
ion (
N-m
)
International Journal of Engineering Research and Technology. ISSN 0974-3154, Volume 13, Number 12 (2020), pp. 4666-4678
© International Research Publication House. http://www.irphouse.com
4672
4. ANALYTICAL TECHNIQUES
Analytical techniques use procedures such algebra, calculus,
differential equations as well as partial differential equations to
solve problems through equations (Gerald & Wheatley, 2004).
The solutions that arise are referred to as exact solutions. Some
of the theories or methods that are used to derive analytical
solutions for analysing body structures include the theorem of
virtual work or unit load (Argyris & Kelsey, 1960). Other
methods include the method of matrix force (Kirioka, 1965),
flexure, instability and theory of plastic collapse, St Venant
theory of torsion (Fenton, 1976), as well as the strain-energy
method (Cooke, 1965).
The method of virtual work as well as the methods of flexure
and instability are often used to analyse the side members of
body structures. The theory of plastic collapse is often used to
analyse the front-end structure of vehicles due to requirements
of plastic deformation. The accuracy of the solutions that are
obtained from these methods depends on the assumptions that
have been made in each case.
These methods include the derivation of complex formulae that
must be used at each stage or the use of matrices that must be
built largely by hand. This is rather time-consuming and may
lead to errors and therefore, more automatic methods must be
sought for use when analysing body structures instead (Fenton,
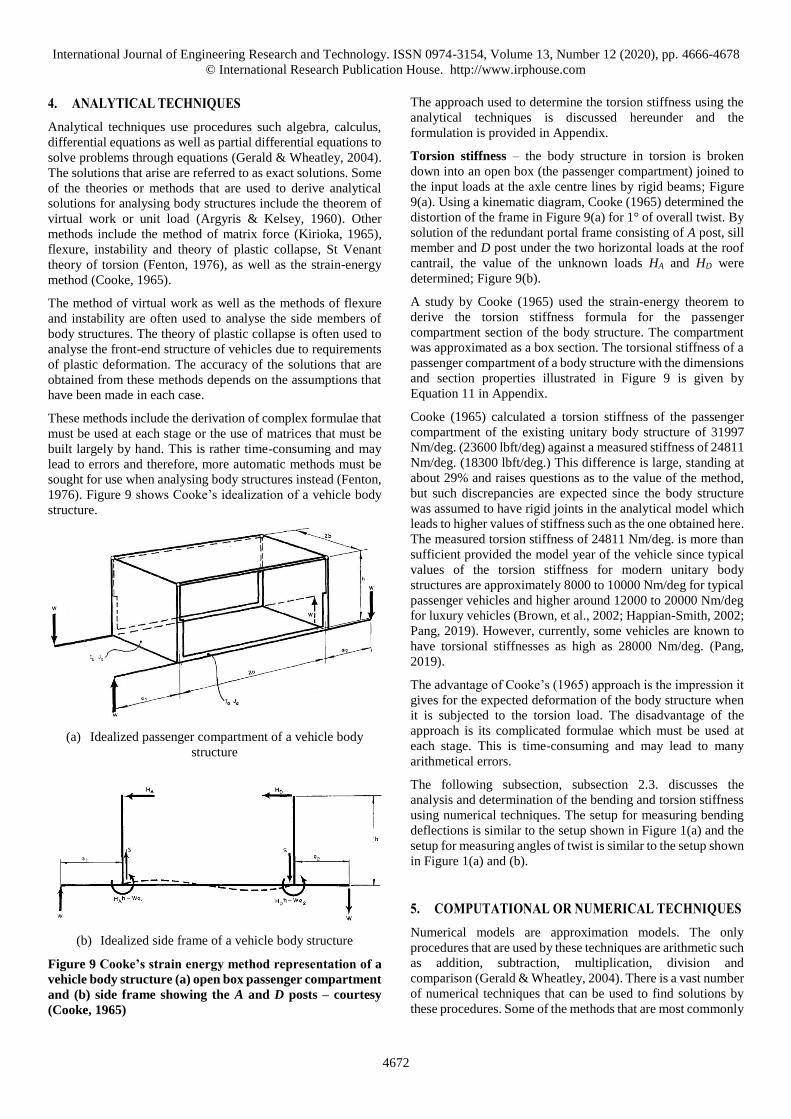
1976). Figure 9 shows Cooke’s idealization of a vehicle body
structure.
(a) Idealized passenger compartment of a vehicle body
structure
(b) Idealized side frame of a vehicle body structure
Figure 9 Cooke’s strain energy method representation of a
vehicle body structure (a) open box passenger compartment
and (b) side frame showing the A and D posts – courtesy
(Cooke, 1965)
The approach used to determine the torsion stiffness using the
analytical techniques is discussed hereunder and the
formulation is provided in Appendix.
Torsion stiffness – the body structure in torsion is broken
down into an open box (the passenger compartment) joined to
the input loads at the axle centre lines by rigid beams; Figure
9(a). Using a kinematic diagram, Cooke (1965) determined the
distortion of the frame in Figure 9(a) for 1° of overall twist. By
solution of the redundant portal frame consisting of A post, sill
member and D post under the two horizontal loads at the roof
cantrail, the value of the unknown loads HA and HD were
determined; Figure 9(b).
A study by Cooke (1965) used the strain-energy theorem to
derive the torsion stiffness formula for the passenger
compartment section of the body structure. The compartment
was approximated as a box section. The torsional stiffness of a
passenger compartment of a body structure with the dimensions
and section properties illustrated in Figure 9 is given by
Equation 11 in Appendix.
Cooke (1965) calculated a torsion stiffness of the passenger
compartment of the existing unitary body structure of 31997
Nm/deg. (23600 lbft/deg) against a measured stiffness of 24811
Nm/deg. (18300 lbft/deg.) This difference is large, standing at
about 29% and raises questions as to the value of the method,
but such discrepancies are expected since the body structure
was assumed to have rigid joints in the analytical model which
leads to higher values of stiffness such as the one obtained here.
The measured torsion stiffness of 24811 Nm/deg. is more than
sufficient provided the model year of the vehicle since typical
values of the torsion stiffness for modern unitary body
structures are approximately 8000 to 10000 Nm/deg for typical
passenger vehicles and higher around 12000 to 20000 Nm/deg
for luxury vehicles (Brown, et al., 2002; Happian-Smith, 2002;
Pang, 2019). However, currently, some vehicles are known to
have torsional stiffnesses as high as 28000 Nm/deg. (Pang,
2019).
The advantage of Cooke’s (1965) approach is the impression it
gives for the expected deformation of the body structure when
it is subjected to the torsion load. The disadvantage of the
approach is its complicated formulae which must be used at
each stage. This is time-consuming and may lead to many
arithmetical errors.
The following subsection, subsection 2.3. discusses the
analysis and determination of the bending and torsion stiffness
using numerical techniques. The setup for measuring bending
deflections is similar to the setup shown in Figure 1(a) and the
setup for measuring angles of twist is similar to the setup shown
in Figure 1(a) and (b).
5. COMPUTATIONAL OR NUMERICAL TECHNIQUES
Numerical models are approximation models. The only
procedures that are used by these techniques are arithmetic such
as addition, subtraction, multiplication, division and
comparison (Gerald & Wheatley, 2004). There is a vast number
of numerical techniques that can be used to find solutions by
these procedures. Some of the methods that are most commonly
International Journal of Engineering Research and Technology. ISSN 0974-3154, Volume 13, Number 12 (2020), pp. 4666-4678
© International Research Publication House. http://www.irphouse.com
4673
used to find numerical solutions to partial differential equations
include finite element method (FEM), finite difference method
(FDM), boundary element method (BEM) as well as the finite
volume method (FVM) (Venkateshan & Swaminathan, 2014).
Each one of these methods is more suitable for certain
applications than others. For instance, one advantage the FEM
has over FDMs is the relative ease with which boundary
conditions of the problem are handled (Burden & Faires, 2011).
The FEM is now an extremely sophisticated tool for solving
numerous engineering and mathematical physics problems and
is widely used in practically all branches of engineering for the
analysis of structures, solids, and fluids (Fagan, 1992; Bathe,
2014). In the automotive industry, the structural integrity and
performance targets of any new vehicle design is thoroughly
analysed and evaluated with finite element models, possibly
years before the first prototype is built (Fagan, 1992). Some of
the commercial Finite Element Analysis (FEA) packages
include ABAQUS, ANSYS, Altair, ALGOR, and
MSC/Nastran (Rao, 2018; Gerald & Wheatley, 2004). The FEA
offers a fast and less expensive approach toward the modelling
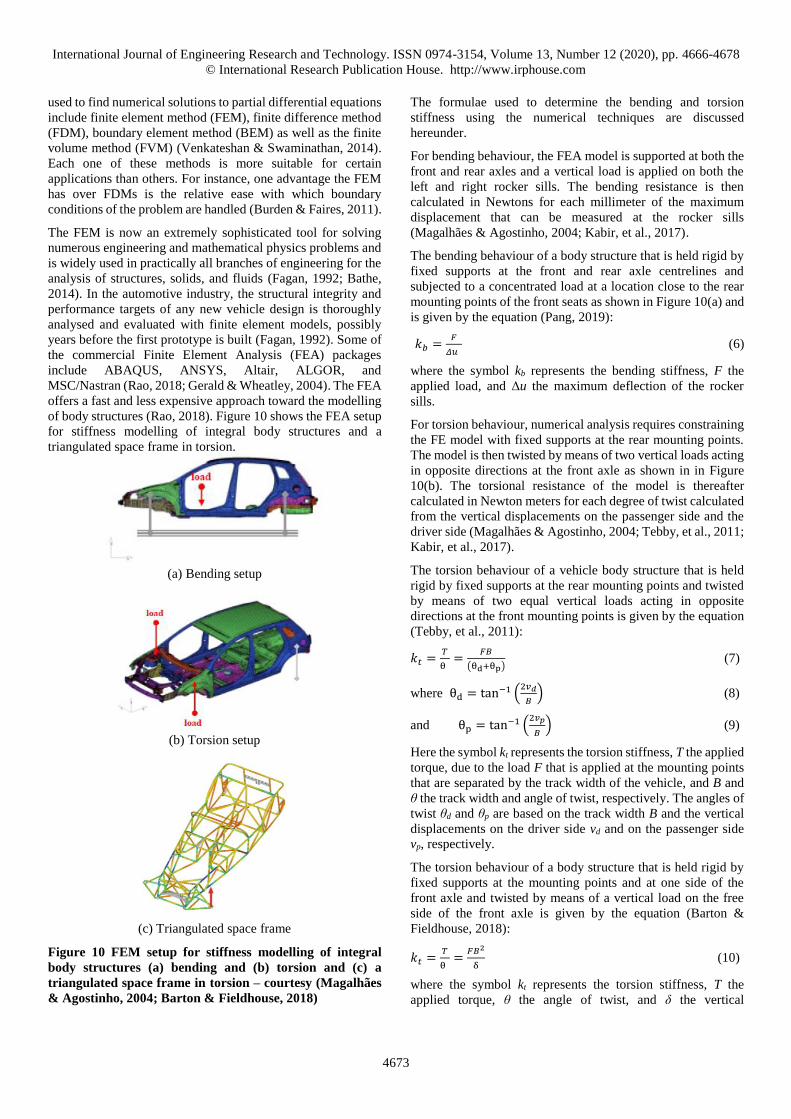
of body structures (Rao, 2018). Figure 10 shows the FEA setup
for stiffness modelling of integral body structures and a
triangulated space frame in torsion.
(a) Bending setup
(b) Torsion setup
(c) Triangulated space frame
Figure 10 FEM setup for stiffness modelling of integral
body structures (a) bending and (b) torsion and (c) a
triangulated space frame in torsion – courtesy (Magalhães
& Agostinho, 2004; Barton & Fieldhouse, 2018)
The formulae used to determine the bending and torsion
stiffness using the numerical techniques are discussed
hereunder.
For bending behaviour, the FEA model is supported at both the
front and rear axles and a vertical load is applied on both the
left and right rocker sills. The bending resistance is then
calculated in Newtons for each millimeter of the maximum
displacement that can be measured at the rocker sills
(Magalhães & Agostinho, 2004; Kabir, et al., 2017).
The bending behaviour of a body structure that is held rigid by
fixed supports at the front and rear axle centrelines and
subjected to a concentrated load at a location close to the rear
mounting points of the front seats as shown in Figure 10(a) and
is given by the equation (Pang, 2019):
𝑘𝑏 =𝐹
𝛥𝑢 (6)
where the symbol kb represents the bending stiffness, F the
applied load, and Δu the maximum deflection of the rocker
sills.
For torsion behaviour, numerical analysis requires constraining
the FE model with fixed supports at the rear mounting points.
The model is then twisted by means of two vertical loads acting
in opposite directions at the front axle as shown in in Figure
10(b). The torsional resistance of the model is thereafter
calculated in Newton meters for each degree of twist calculated
from the vertical displacements on the passenger side and the
driver side (Magalhães & Agostinho, 2004; Tebby, et al., 2011;
Kabir, et al., 2017).
The torsion behaviour of a vehicle body structure that is held
rigid by fixed supports at the rear mounting points and twisted
by means of two equal vertical loads acting in opposite
directions at the front mounting points is given by the equation
(Tebby, et al., 2011):
𝑘𝑡 =𝑇
θ =
𝐹𝐵
(θd+θp) (7)
where θd = tan−1 (2𝑣𝑑
𝐵) (8)
and θp = tan−1 (2𝑣𝑝
𝐵) (9)
Here the symbol kt represents the torsion stiffness, T the applied
torque, due to the load F that is applied at the mounting points
that are separated by the track width of the vehicle, and B and
θ the track width and angle of twist, respectively. The angles of
twist θd and θp are based on the track width B and the vertical
displacements on the driver side vd and on the passenger side
vp, respectively.
The torsion behaviour of a body structure that is held rigid by
fixed supports at the mounting points and at one side of the
front axle and twisted by means of a vertical load on the free
side of the front axle is given by the equation (Barton &
Fieldhouse, 2018):
𝑘𝑡 =𝑇
θ =
𝐹𝐵2
δ (10)
where the symbol kt represents the torsion stiffness, T the
applied torque, θ the angle of twist, and δ the vertical
International Journal of Engineering Research and Technology. ISSN 0974-3154, Volume 13, Number 12 (2020), pp. 4666-4678
© International Research Publication House. http://www.irphouse.com
4674
displacement measured on the point of application of the
torque.
Tebby et al. (2011) used two different numerical methods on
an integral vehicle body structure that was simplified using the
SSS method to determine its torsion stiffness. The structure was
made of aluminium and consisted of 18 panels with each panel
having a uniform surface thickness of 2 mm. The overall weight
of the body structure was approximately 37 kg. They found that
the torsion stiffness of the vehicle body structure was 52.36
Nm/deg. (3000 Nm/rad) when using the force method while the
displacement method yielded a value of 46.89 Nm/deg. (2686.6
Nm/rad.). These values are too low to be of any practical
benefits; they are at least 98% lower than those of Scott and
Antonsson (1998). However, both these values are at least 87%
higher than those from Mohd Nor et al. (2016). The SSS model
of Tebby et al. (2011) weighed 37 kg which is much lower than
the masses of the actual body structures that were used by
Swallow (1939) and Scott and Antonsson (1998), and the
weight of 37 kg serves as justification for these low torsion
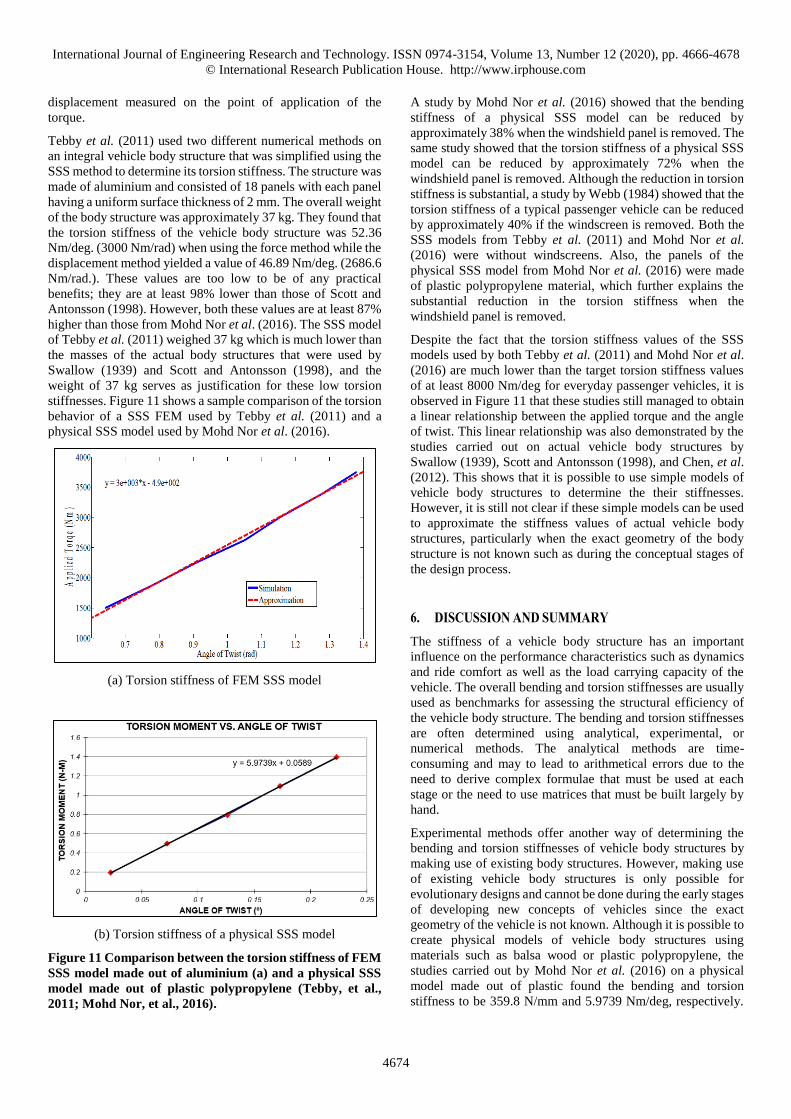
stiffnesses. Figure 11 shows a sample comparison of the torsion
behavior of a SSS FEM used by Tebby et al. (2011) and a
physical SSS model used by Mohd Nor et al. (2016).
(a) Torsion stiffness of FEM SSS model
(b) Torsion stiffness of a physical SSS model
Figure 11 Comparison between the torsion stiffness of FEM
SSS model made out of aluminium (a) and a physical SSS
model made out of plastic polypropylene (Tebby, et al.,
2011; Mohd Nor, et al., 2016).
A study by Mohd Nor et al. (2016) showed that the bending
stiffness of a physical SSS model can be reduced by
approximately 38% when the windshield panel is removed. The
same study showed that the torsion stiffness of a physical SSS
model can be reduced by approximately 72% when the
windshield panel is removed. Although the reduction in torsion
stiffness is substantial, a study by Webb (1984) showed that the
torsion stiffness of a typical passenger vehicle can be reduced
by approximately 40% if the windscreen is removed. Both the
SSS models from Tebby et al. (2011) and Mohd Nor et al.
(2016) were without windscreens. Also, the panels of the
physical SSS model from Mohd Nor et al. (2016) were made
of plastic polypropylene material, which further explains the
substantial reduction in the torsion stiffness when the
windshield panel is removed.
Despite the fact that the torsion stiffness values of the SSS
models used by both Tebby et al. (2011) and Mohd Nor et al.
(2016) are much lower than the target torsion stiffness values
of at least 8000 Nm/deg for everyday passenger vehicles, it is
observed in Figure 11 that these studies still managed to obtain
a linear relationship between the applied torque and the angle
of twist. This linear relationship was also demonstrated by the
studies carried out on actual vehicle body structures by
Swallow (1939), Scott and Antonsson (1998), and Chen, et al.
(2012). This shows that it is possible to use simple models of
vehicle body structures to determine the their stiffnesses.
However, it is still not clear if these simple models can be used
to approximate the stiffness values of actual vehicle body
structures, particularly when the exact geometry of the body
structure is not known such as during the conceptual stages of
the design process.
6. DISCUSSION AND SUMMARY
The stiffness of a vehicle body structure has an important
influence on the performance characteristics such as dynamics
and ride comfort as well as the load carrying capacity of the
vehicle. The overall bending and torsion stiffnesses are usually
used as benchmarks for assessing the structural efficiency of
the vehicle body structure. The bending and torsion stiffnesses
are often determined using analytical, experimental, or
numerical methods. The analytical methods are time-
consuming and may to lead to arithmetical errors due to the
need to derive complex formulae that must be used at each
stage or the need to use matrices that must be built largely by
hand.
Experimental methods offer another way of determining the
bending and torsion stiffnesses of vehicle body structures by
making use of existing body structures. However, making use
of existing vehicle body structures is only possible for
evolutionary designs and cannot be done during the early stages
of developing new concepts of vehicles since the exact
geometry of the vehicle is not known. Although it is possible to
create physical models of vehicle body structures using
materials such as balsa wood or plastic polypropylene, the
studies carried out by Mohd Nor et al. (2016) on a physical
model made out of plastic found the bending and torsion
stiffness to be 359.8 N/mm and 5.9739 Nm/deg, respectively.
International Journal of Engineering Research and Technology. ISSN 0974-3154, Volume 13, Number 12 (2020), pp. 4666-4678
© International Research Publication House. http://www.irphouse.com
4675
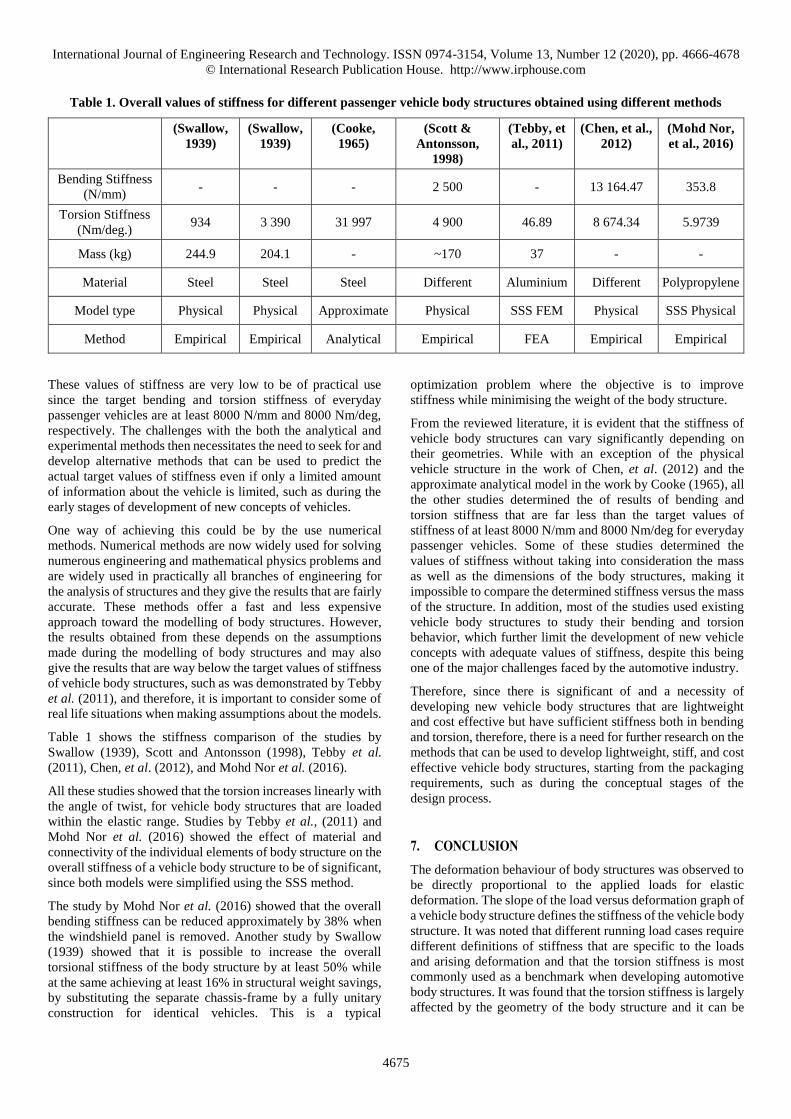
Table 1. Overall values of stiffness for different passenger vehicle body structures obtained using different methods
(Swallow,
1939)
(Swallow,
1939)
(Cooke,
1965)
(Scott &
Antonsson,
1998)
(Tebby, et
al., 2011)
(Chen, et al.,
2012)
(Mohd Nor,
et al., 2016)
Bending Stiffness
(N/mm) - - - 2 500 - 13 164.47 353.8
Torsion Stiffness
(Nm/deg.) 934 3 390 31 997 4 900 46.89 8 674.34 5.9739
Mass (kg) 244.9 204.1 - ~170 37 - -
Material Steel Steel Steel Different Aluminium Different Polypropylene
Model type Physical Physical Approximate Physical SSS FEM Physical SSS Physical
Method Empirical Empirical Analytical Empirical FEA Empirical Empirical
These values of stiffness are very low to be of practical use
since the target bending and torsion stiffness of everyday
passenger vehicles are at least 8000 N/mm and 8000 Nm/deg,
respectively. The challenges with the both the analytical and
experimental methods then necessitates the need to seek for and
develop alternative methods that can be used to predict the
actual target values of stiffness even if only a limited amount
of information about the vehicle is limited, such as during the
early stages of development of new concepts of vehicles.
One way of achieving this could be by the use numerical
methods. Numerical methods are now widely used for solving
numerous engineering and mathematical physics problems and
are widely used in practically all branches of engineering for
the analysis of structures and they give the results that are fairly
accurate. These methods offer a fast and less expensive
approach toward the modelling of body structures. However,
the results obtained from these depends on the assumptions
made during the modelling of body structures and may also
give the results that are way below the target values of stiffness
of vehicle body structures, such as was demonstrated by Tebby
et al. (2011), and therefore, it is important to consider some of
real life situations when making assumptions about the models.
Table 1 shows the stiffness comparison of the studies by
Swallow (1939), Scott and Antonsson (1998), Tebby et al.
(2011), Chen, et al. (2012), and Mohd Nor et al. (2016).
All these studies showed that the torsion increases linearly with
the angle of twist, for vehicle body structures that are loaded
within the elastic range. Studies by Tebby et al., (2011) and
Mohd Nor et al. (2016) showed the effect of material and
connectivity of the individual elements of body structure on the
overall stiffness of a vehicle body structure to be of significant,
since both models were simplified using the SSS method.
The study by Mohd Nor et al. (2016) showed that the overall
bending stiffness can be reduced approximately by 38% when
the windshield panel is removed. Another study by Swallow
(1939) showed that it is possible to increase the overall
torsional stiffness of the body structure by at least 50% while
at the same achieving at least 16% in structural weight savings,
by substituting the separate chassis-frame by a fully unitary
construction for identical vehicles. This is a typical
optimization problem where the objective is to improve
stiffness while minimising the weight of the body structure.
From the reviewed literature, it is evident that the stiffness of
vehicle body structures can vary significantly depending on
their geometries. While with an exception of the physical
vehicle structure in the work of Chen, et al. (2012) and the
approximate analytical model in the work by Cooke (1965), all
the other studies determined the of results of bending and
torsion stiffness that are far less than the target values of
stiffness of at least 8000 N/mm and 8000 Nm/deg for everyday
passenger vehicles. Some of these studies determined the
values of stiffness without taking into consideration the mass
as well as the dimensions of the body structures, making it
impossible to compare the determined stiffness versus the mass
of the structure. In addition, most of the studies used existing
vehicle body structures to study their bending and torsion
behavior, which further limit the development of new vehicle
concepts with adequate values of stiffness, despite this being
one of the major challenges faced by the automotive industry.
Therefore, since there is significant of and a necessity of
developing new vehicle body structures that are lightweight
and cost effective but have sufficient stiffness both in bending
and torsion, therefore, there is a need for further research on the
methods that can be used to develop lightweight, stiff, and cost
effective vehicle body structures, starting from the packaging
requirements, such as during the conceptual stages of the
design process.
7. CONCLUSION
The deformation behaviour of body structures was observed to
be directly proportional to the applied loads for elastic
deformation. The slope of the load versus deformation graph of
a vehicle body structure defines the stiffness of the vehicle body
structure. It was noted that different running load cases require
different definitions of stiffness that are specific to the loads
and arising deformation and that the torsion stiffness is most
commonly used as a benchmark when developing automotive
body structures. It was found that the torsion stiffness is largely
affected by the geometry of the body structure and it can be
International Journal of Engineering Research and Technology. ISSN 0974-3154, Volume 13, Number 12 (2020), pp. 4666-4678
© International Research Publication House. http://www.irphouse.com
4676
reduced by approximately 40% when a windshield frame is
missing. In addition, it was noted that the material that was used
to develop body structures has a significant impact on both the
weight and the torsion stiffness of body structures.
Although the studies have shown that the load is directly
proportional to the deformation of the body structure for
vehicle body structures that are deformed within the elastic
range, none of the studies has considered the approximate, real
life, running load cases when demonstrating this occurrence.
Therefore, a study that focuses in determining the overall
stiffness of a unitary automotive body structure during the
preliminary stages of the design process, taking into account
the approximate, real life, running load cases, the mass of the
body structure as well as different materials and different
geometries still need to be conducted.
ACKNOWLEDGEMENTS
This research work was supported by Vaal University of
Technology. The authors wish to thank the department of
Mechanical Engineering at Vaal University of Technology for
facilitating this work.
REFERENCES
[1] Adams, H., 1993. Chassis Design, Building & Tuning for
High Performance Handling: Chassis Engineering. New
York: Berkely Publishing Group.
[2] Ardigo, A., Cheli, F. & Geluk, T., 2012. Study on the
influence of the car body structure flexibility on handling
performance and forces distribution with CAE methods:
Master Thesis, Milano: Polotecnico di Milano.
[3] Argyris, J. & Kelsey, S., 1960. Energy Theorems and
Structural Analysis. 1st ed. s.l.:Butterworth.
[4] Barton, D. & Fieldhouse, J., 2018. Automotive Chassis
Engineering, Cham: Springer Internation Publishing AG.
[5] Bastow, D., 1946. Car Chassis Frame Design. Proc. IAE,
Volume XL, pp. 147-165.
[6] Bathe, K., 2014. Finite Element Procedures. 2nd ed.
Watertown, MA, United States of America: Prentice Hall,
Pearson Education, Inc.
[7] Booth, A., 1939. Factory Experimental Work and its
Equipment. Proc. IAE, Volume XXXIII, pp. 503-546.
[8] Brown, J., Robertson, A. & Serpento, S., 2002. Motor
Vehicle Structures: Concepts and Fundamentals. 1st ed.
Oxford, MA 01801-2041: Butterworth-Heinemann.
[9] Burden, R. & Faires, J., 2011. Numerical Analysis. 9th ed.
Canada: Brooks/Cole, Cengage Learning.
[10] Campbell, C., 1955. The sports car: its design and
performance, s.l.: Bentley Editor.
[11] Cavazzuti, M. et al., 2011. High performance automotive
chassis design: a topology optimization based approach*.
Structural and Multidisciplanary Optimization,
44(https://doi.org/10.1007/s00158-010-0578-7), pp. 45-
56.
[12] Chen, S. et al., 2012. Experimental Analysis of Static
Stiffness for Vehicle Body in White. Applied Mechanics
and Materials, Volume 248, pp. 69-73.
[13] Cooke, C., 1965. Torsional Stiffness Analysis of Car
Bodies. Proc Instn Mech Engrs 1965-66, Patent No. 2A,
No. 1.
[14] Coox, L. et al., 2012. Numerical assessment of the impact
of vehicle body stiffness on handling performance. s.l.,
PROCEEDINGS OF ISMA2012-USD2012.
[15] Costin, M. & Phipps, D., 1965. Racing and Sports Car
Chassis Design. 2nd ed. London: B.T. Batsford Ltd.
[16] Crocombe, A., Sampe, E. & Somiotti, A., 2010. Chassis
Torsional Stiffness: Analysis of the Influence on Vehicle
Dynamics. s.l., SAE 2 010 World Congress & Exhibition.
[17] Danielsson, O. et al., 2016. Influence of Body Stiffness on
Vehicle Dynamics Characteristics. s.l., 10.1201/b21185-
7.
[18] Fagan, M., 1992. Finite Element Analysis Theory and
Practice. Edinburgh: Pearson Education Limited.
[19] Fenton, J., 1976. Handbook of Automotive Design
Analysis. Plymouth: Butterworth & Co. (Publishers) Ltd..
[20] Garrett, T., ewton, K. & Steeds, W., 2001. The Motor
Vehicle. 13th ed ed. MA 08101-2041: Butterworth-
Heinemann.
[21] Gawande, S., Muley, A. & Yerrawar, R., 2018.
Optimization of Torsional Stiffness for Heavy
Commercial Vehicle Chassis Frame. Automotive
Innovation, Volume 1, pp. 352-361.
[22] George, A. & Riley, W., 2002. Design, Analysis and
Testing of a Formula SAE Car Chassis. SAE Motorsports
Engineering Conference and Exhibition.
[23] Gerald, C. & Wheatley, P., 2004. Applied Numerical
Analysis. 7th ed. MA: Pearson - Addison Wesley.
[24] Happian-Smith, J., 2002. An Intoduction to Modern
Vehicle Design. 1st ed. MA 01801-2041: Butterworth-
Heinemann.
[25] Hazimi, H. et al., 2018. Vertical Bending Strength and
Torsional Rigidity Analysis of Formula Student Car
Chassis. Online: 09 February 2018, AIP Conference
Proceedings 1931, 030050 (2018);
https://doi.org/10.1063/1.5024109.
[26] Kabir, M., Izanloo, M. & Khalkhali, A., 2017. Concept
design of Vehicle Structure for the purpose of computing
torsional and bending stiffness. International Journal of
Automotive Engineering, 7(2), pp. 2372-2376.
[27] Kavarana, K. & Rediers, B., 2001. Squeak and Rattle -
State of the Art and Beyond. s.l., Defiance Testing &
Engineering, Troy, Michigan, Sound and Vibration/April.
[28] Kirioka, K., 1965. An Analysis of Body Structures,
International Journal of Engineering Research and Technology. ISSN 0974-3154, Volume 13, Number 12 (2020), pp. 4666-4678
© International Research Publication House. http://www.irphouse.com
4677
Detroit, Paper 979A: SAE Automotive Congress.
[29] Kumar, G., Mohan & Yadav, G., 2016. Design and
analysis of a 3-wheleer integrated monocoque chassis.
International Journal of Scientific and Technological
Research, 5(5), pp. 0984-0989.
[30] Law, E., Raju, S., Soni, P. & Thompson, L., 1998. The
effects of chassis flexibility on roll stiffness of a Winston
cup car. s.l., Motorsports Engineering Conference
Proceedings.
[31] Leckie, F. & Bello, D., 2009. Strength and Stiffness of
Engineering Systems, New York: Springer
Science+Business Media.
[32] Linton, W., 2002. Analysis of Torsional Stiffness and
Design Improvement Study of a Kit Car Prototype, s.l.:
Cranfield University.
[33] Magalhães, M. & Agostinho, A., 2004. Comparison
Between Finite Elements Model and Experimental
Results for Static Stiffness and Normal Vibration Modes
on a Unibody Vehicle. SAE Technical Paper Series 2004-
01-3351.
[34] Masini, A., Taraborrelli, L., Feraboli, A. & Pivetti, P.,
2004. Development of Carbon/Expoxy Structural
Components for a Topless High Performance Vehicle.
American Society for Composites / American Society for
Testing And Materials Committee D30: Nineteenth
Technical Conference, pp. 2002-2012.
[35] Mohd Nor, M., Noordin, A., Ruzali, M. & Hussen, M.,
2016. Development of Vehicle Model Test for Road
Loading Analysis of Sedan Model, Malaysia: IOP Conf.
Series: Materials Science and Engineering 160 012014.
[36] Morello, L., Rossini, L., Pia, G. & Tonoli, A., 2011. The
Automotive Body. Volume I: Components Design.
Volume 1 ed. s.l.:Springer.
[37] Muley, A., Gawande, S. & Yerawar, R., 2018. Analysis
of the Cross Member Designs Used For Improving the
Tensional Stiffness of Heavy Commercial Vehicle Chassis
Frame. s.l., 7th National conference on Recent
Developments In Mechanical Engineering RDME-2018.
[38] Na, J., Yuan, Z. & Gao, J., 2015. A Novel Method for
Bending Stiffness Evaluation of Bus Body. Advances in
Mechanical Engineering. doi: 10.1155/2014/278192..
[39] Pang, J., 2019. Noise and Vibration Control in
Automotive Bodies. 1st ed. China Machine Press: John
Wiley & Sons Ltd.
[40] Pang, S., Guan, X. & Zhan, J., 2010. Research of chassis
torsional stiffness on vehicle handling performence. s.l.,
WASE International Conference on Information
Engineering.
[41] Podkowski, K., Małczuk, A., Stasiak, A. & Pawlak, M.,
2019. Testing of the Torsional Stiffness of the Passenger
Car Frame and Its Validation by means of Finite Element
Analysis. The Archives of Automotive Engineering –
Archiwum Motoryzacji, 85(3), pp. 83-101.
[42] Rao, S., 2018. The Finite Element Method in
Engineering. 6th ed. Oxford: Butterworth-Heinemann.
[43] Sampo, E., Sorniotti, A. & Crocombe, A., 2010. Chassis
Torsional Stiffness: Analysis of the Influence on Vehicle
Dynamics. SAE 2010 World Congress & Exhibition, 09
January.
[44] Scott, M. & Antonsson, E., 1998. Preliminary Vehicle
Structure Design Application. 10th International
Conference on Design Theory and Methodology, pp. 183-
204.
[45] Seward, D., 2014. Race car design. Great Britain::
Palgrave.
[46] Swallow, W., 1939. Unification of Body and Chassis
Frame, pp. 431–475: Proc. IAE, Vol. XXXIII.
[47] Tebby, S., Esmailzadeh, E. & Barari, A., 2011.
Comparison of Numerical Methods for Determining
Torsion Stiffness of Automotive Chassis. Proceedings of
the ASME 2011 International Design Engineering
Technical Conferences & Computers and Information in
Engineering Conference, 28-31 August, pp. 1-9.
[48] Thompson, L., Lampert, J. & Law, E., 1998. Design of a
Twist Fixture to Measure the Torsional Stiffness of a
Winston Cup Chassis. Dearborn, Michigan, Motorsports
Engineering Conceference and Exposition, Volume 1:
Design and Safety (P-340/1).
[49] Thompson, L., Raju, S. & Law, H., 1998. Design of a
Winston Cup Chassis for Torsional Stiffness. Dearborn,
Michigan, Motorsports Engineering Conference and
Exposition, November 16-19, 1998.
[50] Venkateshan, S. & Swaminathan, P., 2014.
Computational Methods in Engineering. 1st ed. Oxford:
Elsevier.
[51] Wang, M. et al., 2014. Body Structure Static-Dynamic
Analysis and Optimization of a Commercial Vehicle. Key
Engineering Materials, Volume 621, pp. 40-406.
[52] Webb, G., 1984. Torsional stiffness of passenger cars,
s.l.: C172/84, I.Mech.E.
[53] Wood, I., Barari, A. & Esmailzadeh, E., 2014. Using
Simple Structural Beam Model to Optimize for Bending
Stiffness and Vibration in Automotive Structures.
Proceedings of the International Mechanical
Engineering Congress and Exposition IMECE2014, 14-
20 November.
[54] Yan, H. et al., 2018. Analysis and Research of Stiffness
Based on Body-in-White NVH. s.l., Journal of Physics:
Conf. Series 1087 (2018) 042078.
International Journal of Engineering Research and Technology. ISSN 0974-3154, Volume 13, Number 12 (2020), pp. 4666-4678
© International Research Publication House. http://www.irphouse.com
4678
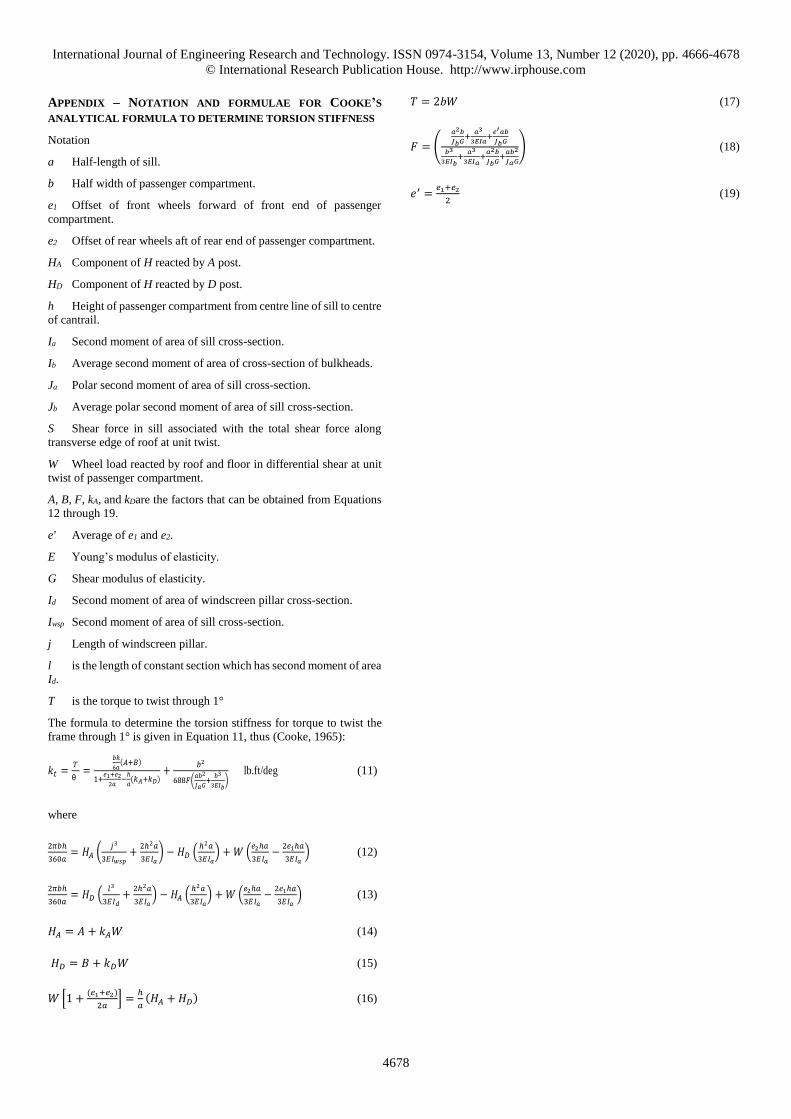
APPENDIX – NOTATION AND FORMULAE FOR COOKE’S
ANALYTICAL FORMULA TO DETERMINE TORSION STIFFNESS
Notation
a Half-length of sill.
b Half width of passenger compartment.
e1 Offset of front wheels forward of front end of passenger
compartment.
e2 Offset of rear wheels aft of rear end of passenger compartment.
HA Component of H reacted by A post.
HD Component of H reacted by D post.
h Height of passenger compartment from centre line of sill to centre
of cantrail.
Ia Second moment of area of sill cross-section.
Ib Average second moment of area of cross-section of bulkheads.
Ja Polar second moment of area of sill cross-section.
Jb Average polar second moment of area of sill cross-section.
S Shear force in sill associated with the total shear force along
transverse edge of roof at unit twist.
W Wheel load reacted by roof and floor in differential shear at unit
twist of passenger compartment.
A, B, F, kA, and kDare the factors that can be obtained from Equations
12 through 19.
e' Average of e1 and e2.
E Young’s modulus of elasticity.
G Shear modulus of elasticity.
Id Second moment of area of windscreen pillar cross-section.
Iwsp Second moment of area of sill cross-section.
j Length of windscreen pillar.
l is the length of constant section which has second moment of area
Id.
T is the torque to twist through 1°
The formula to determine the torsion stiffness for torque to twist the
frame through 1° is given in Equation 11, thus (Cooke, 1965):
𝑘𝑡 =𝑇
θ =
𝑏ℎ
6𝑎(𝐴+𝐵)
1+𝑒1+𝑒2
2𝑎−
ℎ
𝑎(𝑘𝐴+𝑘𝐷)
+𝑏2
688𝐹(𝑎𝑏2
𝐽𝑎𝐺+
𝑏3
3𝐸𝐼𝑏) lb.ft/deg (11)
where
2𝜋𝑏ℎ
360𝑎= 𝐻𝐴 (
𝑗3
3𝐸𝐼𝑤𝑠𝑝+
2ℎ2𝑎
3𝐸𝐼𝑎) − 𝐻𝐷 (
ℎ2𝑎
3𝐸𝐼𝑎) + 𝑊 (
𝑒2ℎ𝑎
3𝐸𝐼𝑎−
2𝑒1ℎ𝑎
3𝐸𝐼𝑎) (12)
2𝜋𝑏ℎ
360𝑎= 𝐻𝐷 (
𝑙3
3𝐸𝐼𝑑+
2ℎ2𝑎
3𝐸𝐼𝑎) − 𝐻𝐴 (
ℎ2𝑎
3𝐸𝐼𝑎) + 𝑊 (
𝑒2ℎ𝑎
3𝐸𝐼𝑎−
2𝑒1ℎ𝑎
3𝐸𝐼𝑎) (13)
𝐻𝐴 = 𝐴 + 𝑘𝐴𝑊 (14)
𝐻𝐷 = 𝐵 + 𝑘𝐷𝑊 (15)
𝑊 [1 +(𝑒1+𝑒2)
2𝑎] =
ℎ
𝑎(𝐻𝐴 + 𝐻𝐷) (16)
𝑇 = 2𝑏𝑊 (17)
𝐹 = (
𝑎2𝑏
𝐽𝑏𝐺+
𝑎3
3𝐸𝐼𝑎+
𝑒′𝑎𝑏
𝐽𝑏𝐺
𝑏3
3𝐸𝐼𝑏+
𝑎3
3𝐸𝐼𝑎+
𝑎2𝑏
𝐽𝑏𝐺+
𝑎𝑏2
𝐽𝑎𝐺
) (18)
𝑒′ =𝑒1+𝑒2
2 (19)