Embed Size (px)
Citation preview

N A T I O N A L A S S O C I A T I O N O FR E G U L A T O R Y U T I L I T YC O M M I S S I O N E R S
RESOURCEADEQUACYPRIMERforSTATEREGULATORS
July 2021
[i]
RESOURCE ADEQUACY
PRIMER for STATE
REGULATORS
National Association of Regulatory
Utility Commissioners
Copyright 2021 The National Association of Regulatory Utility Commissioners
Layout & Editing Produced by the NARUC Department of Communications and Public
Affairs
[ii]
Contributors/Authors
• Judith Williams Jagdmann – Chairman | Virginia State Corporation Commission
• John W. Betkoski, III – Vice-Chairman | Connecticut Public Utilities Regulatory
Authority
• Talina R. Mathews – Commissioner | Kentucky Public Service Commission
• Ann Rendahl – Commissioner | Washington State Utilities and Transportation
Commission
• Matthew Schuerger – Commissioner | Minnesota Public Utilities Commission
• Ted J. Thomas – Chairman | Arkansas Public Service Commission
• Elliott J. Nethercutt – Principal Researcher | National Regulatory Research Institute
• Additional Contributions
o California Public Utilities Commission
o California Independent System Operator
o New York Independent System Operator
o North American Electric Reliability Corporation
o Texas Reliability Entity

[iii]
Table of Contents
Preface 1
Introduction 1
I. Resource Adequacy Overview 2
Electricity 101 2
Resource Adequacy 5
Regulatory Authorities 9
II. State and Market Approaches to Resource Adequacy
Error! Bookmark not defined.
ERCOT 13
CAISO/EIM . 20
ISO-NE 28
MISO 32
PJM 35
NYISO 41
SPP 47
Non-Market Western Interconnection 49
Non-Market Eastern Interconnection (Southeast) 55
III. Current and Emerging Issues 59
Measuring Resource Adequacy with an Evolving Resource Mix and Changing Demand
Characteristics 59
The Interplay between Regional and State Planning 61
[1]
Preface
This primer was developed by the National Association of Regulatory Utility Commissioners
(NARUC) and is intended to be used as an aid to state commissioners, their staff, and the
regulatory community to provide a basic explanation of resource adequacy practices throughout
the United States. This document is not intended to provide any recommendations for actions,
decisions, or opinions.
Introduction
This primer provides an overview of resource adequacy and why it is foundational to reliable
electric service. Part I provides basic information about the electricity system, including
generation, transmission, distribution, and operational practices (i.e., balancing supply and
demand). Readers will also gain an understanding of the key metrics used to evaluate resource
adequacy, including a background on resource planning, reserve margins, and the
responsibilities of state and federal regulators. Part II describes how the state function of resource
adequacy is applied in both market and non-market areas throughout the country. Although the
resource adequacy practices and processes for each market and non-market area are varied and
can be complicated, the intent of this section is to provide a high-level view for comparison and
discussion. This section also explores how resource adequacy metrics are evolving to more
accurately measure reliability as the generation mix continues to transform to include increasing
intermittent resources and regions experience extreme weather events. Part III identifies current
and emerging resource adequacy issues and proceedings, including the interplay between states
and wholesale market rules. This primer represents a snapshot in time and does not offer policy
recommendations on recent events that implicate resource adequacy or on the many resource
adequacy issues currently under active consideration.

[2]
I. Resource Adequacy Overview The electric power grid is the backbone of America’s economy and is essential to delivering
electricity to households across the country. The grid requires coordination, collaboration, and
oversight between users, owners, and operators to maintain a system with a high level of
reliability. The resource mix in the United States continues to include increasing amounts of
variable generation (wind and solar), batteries, energy efficiency, distributed generation, and
evolving technologies. Further, in many areas the shape of electricity demand has changed due
to the interaction of renewable resources, conservation, electric vehicles, electrification, and
demand response, as well as the increased frequency of extreme weather events. These
developments mean that ensuring adequate resources are available to serve the electricity needs
of American households and businesses has perhaps never been more challenging. This section
introduces important principles and participants in resource adequacy at the federal, regional,
state, and local level, beginning with a basic overview of the foundational elements of the electric
system in the United States.
Electricity 101
Generating Electricity
Electricity is the flow of electrons. It is a secondary energy source because it is produced by
converting primary sources of energy such as coal, natural gas, nuclear energy, solar energy, and
wind energy, into electrical power.1
Electric power systems are real-time energy delivery systems, meaning that power is generated,
delivered – sometimes over great distances – and consumed in essentially the same instant of
time. There are no other delivery systems with this distinctive characteristic. Generators produce
electricity as the demand calls for it. Protection systems on the electric grid constantly monitor
system frequency. If there is not enough generation to meet load, system frequency falls, and
electric load is automatically removed from the system in stages, referred to as load shedding,
until balance is restored. Load shedding occurs rarely and is intended to avoid massive system
blackouts. Electric system planning and operation must take into account the real-time nature of
the system to maintain reliability.
1 Federal Energy Regulatory Commission, Energy Primer: A Handbook of Energy Market Basics, Staff Report, April 2020, https://www.ferc.gov/sites/default/files/2020-06/energy-primer-2020_Final.pdf, p. 35.
[3]
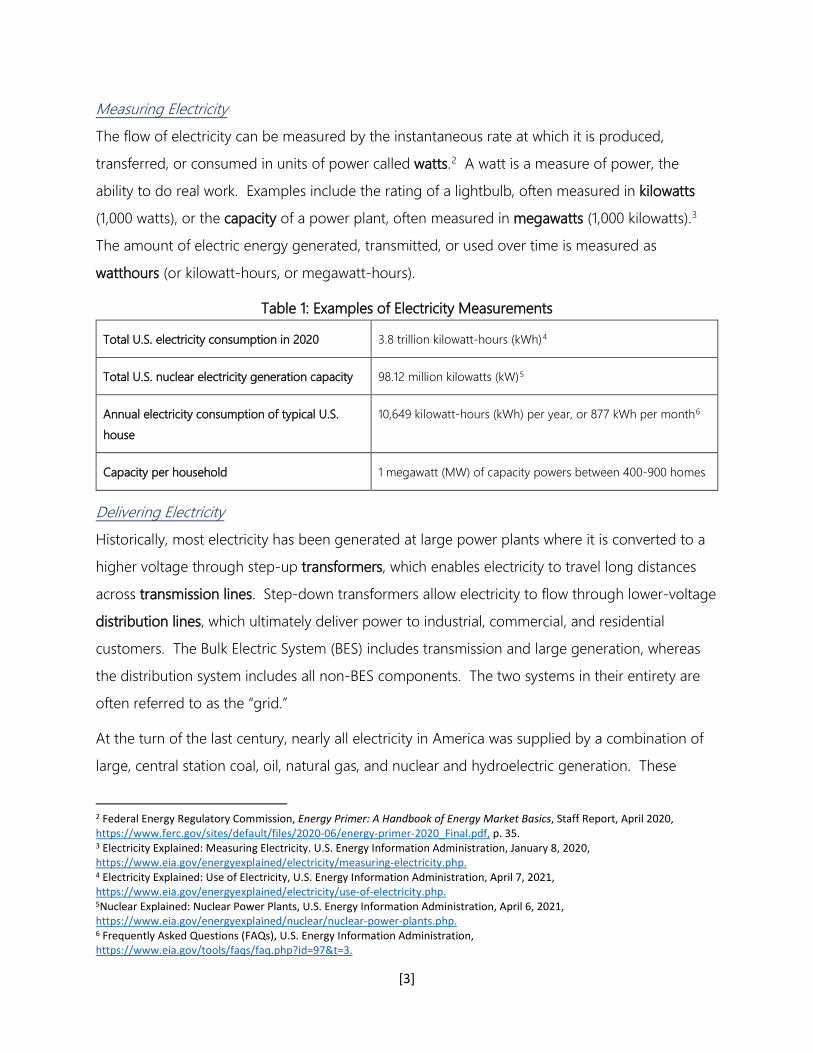
Measuring Electricity
The flow of electricity can be measured by the instantaneous rate at which it is produced,
transferred, or consumed in units of power called watts.2 A watt is a measure of power, the
ability to do real work. Examples include the rating of a lightbulb, often measured in kilowatts
(1,000 watts), or the capacity of a power plant, often measured in megawatts (1,000 kilowatts).3
The amount of electric energy generated, transmitted, or used over time is measured as
watthours (or kilowatt-hours, or megawatt-hours).
Table 1: Examples of Electricity Measurements
Total U.S. electricity consumption in 2020 3.8 trillion kilowatt-hours (kWh)4
Total U.S. nuclear electricity generation capacity 98.12 million kilowatts (kW)5
Annual electricity consumption of typical U.S.
house
10,649 kilowatt-hours (kWh) per year, or 877 kWh per month6
Capacity per household 1 megawatt (MW) of capacity powers between 400-900 homes
Delivering Electricity
Historically, most electricity has been generated at large power plants where it is converted to a
higher voltage through step-up transformers, which enables electricity to travel long distances
across transmission lines. Step-down transformers allow electricity to flow through lower-voltage
distribution lines, which ultimately deliver power to industrial, commercial, and residential
customers. The Bulk Electric System (BES) includes transmission and large generation, whereas
the distribution system includes all non-BES components. The two systems in their entirety are
often referred to as the “grid.”
At the turn of the last century, nearly all electricity in America was supplied by a combination of
large, central station coal, oil, natural gas, and nuclear and hydroelectric generation. These
2 Federal Energy Regulatory Commission, Energy Primer: A Handbook of Energy Market Basics, Staff Report, April 2020, https://www.ferc.gov/sites/default/files/2020-06/energy-primer-2020_Final.pdf, p. 35. 3 Electricity Explained: Measuring Electricity. U.S. Energy Information Administration, January 8, 2020, https://www.eia.gov/energyexplained/electricity/measuring-electricity.php. 4 Electricity Explained: Use of Electricity, U.S. Energy Information Administration, April 7, 2021, https://www.eia.gov/energyexplained/electricity/use-of-electricity.php. 5Nuclear Explained: Nuclear Power Plants, U.S. Energy Information Administration, April 6, 2021, https://www.eia.gov/energyexplained/nuclear/nuclear-power-plants.php. 6 Frequently Asked Questions (FAQs), U.S. Energy Information Administration, https://www.eia.gov/tools/faqs/faq.php?id=97&t=3.
[4]
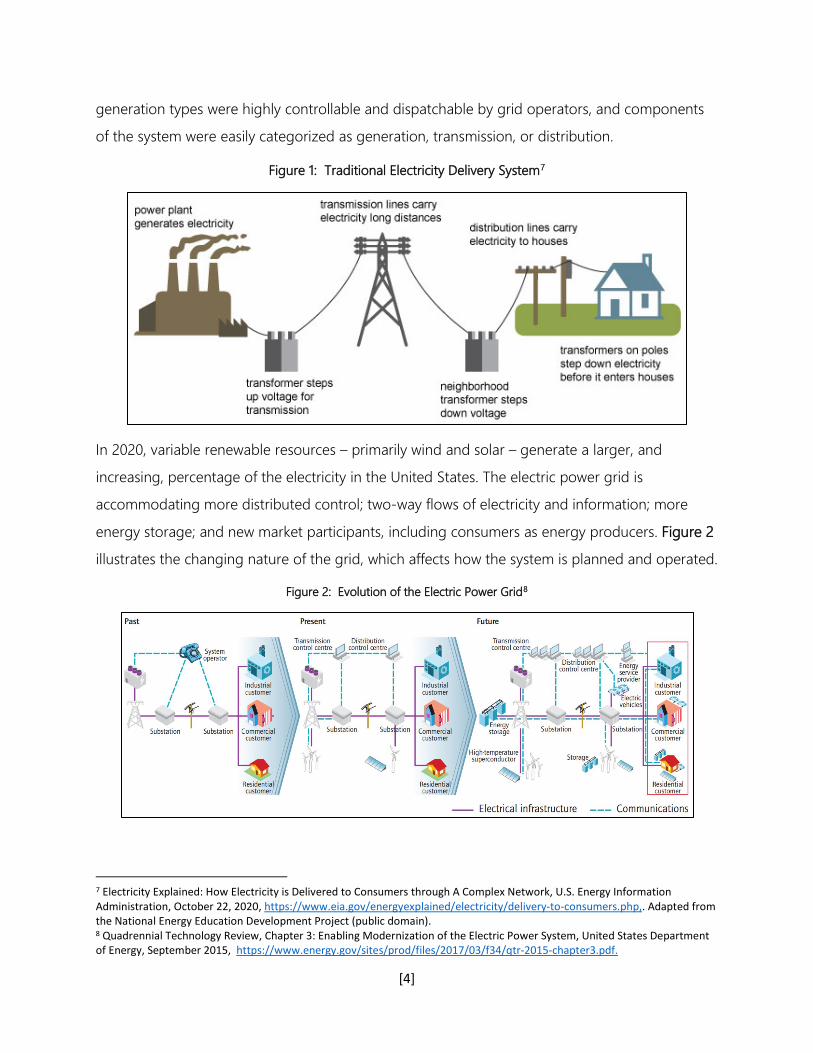
generation types were highly controllable and dispatchable by grid operators, and components
of the system were easily categorized as generation, transmission, or distribution.
Figure 1: Traditional Electricity Delivery System7
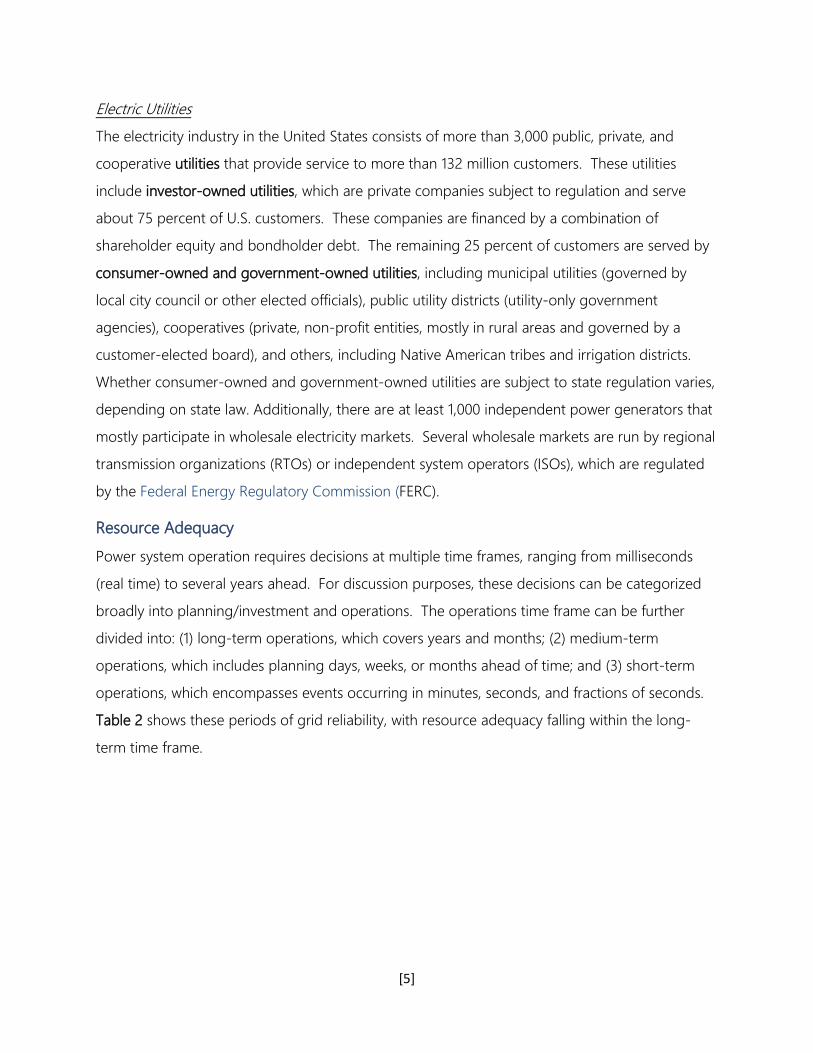
In 2020, variable renewable resources – primarily wind and solar – generate a larger, and
increasing, percentage of the electricity in the United States. The electric power grid is
accommodating more distributed control; two-way flows of electricity and information; more
energy storage; and new market participants, including consumers as energy producers. Figure 2
illustrates the changing nature of the grid, which affects how the system is planned and operated.
Figure 2: Evolution of the Electric Power Grid8
7 Electricity Explained: How Electricity is Delivered to Consumers through A Complex Network, U.S. Energy Information Administration, October 22, 2020, https://www.eia.gov/energyexplained/electricity/delivery-to-consumers.php,. Adapted from the National Energy Education Development Project (public domain). 8 Quadrennial Technology Review, Chapter 3: Enabling Modernization of the Electric Power System, United States Department of Energy, September 2015, https://www.energy.gov/sites/prod/files/2017/03/f34/qtr-2015-chapter3.pdf.
[5]
Electric Utilities
The electricity industry in the United States consists of more than 3,000 public, private, and
cooperative utilities that provide service to more than 132 million customers. These utilities
include investor-owned utilities, which are private companies subject to regulation and serve
about 75 percent of U.S. customers. These companies are financed by a combination of
shareholder equity and bondholder debt. The remaining 25 percent of customers are served by
consumer-owned and government-owned utilities, including municipal utilities (governed by
local city council or other elected officials), public utility districts (utility-only government
agencies), cooperatives (private, non-profit entities, mostly in rural areas and governed by a
customer-elected board), and others, including Native American tribes and irrigation districts.
Whether consumer-owned and government-owned utilities are subject to state regulation varies,
depending on state law. Additionally, there are at least 1,000 independent power generators that
mostly participate in wholesale electricity markets. Several wholesale markets are run by regional
transmission organizations (RTOs) or independent system operators (ISOs), which are regulated
by the Federal Energy Regulatory Commission (FERC).
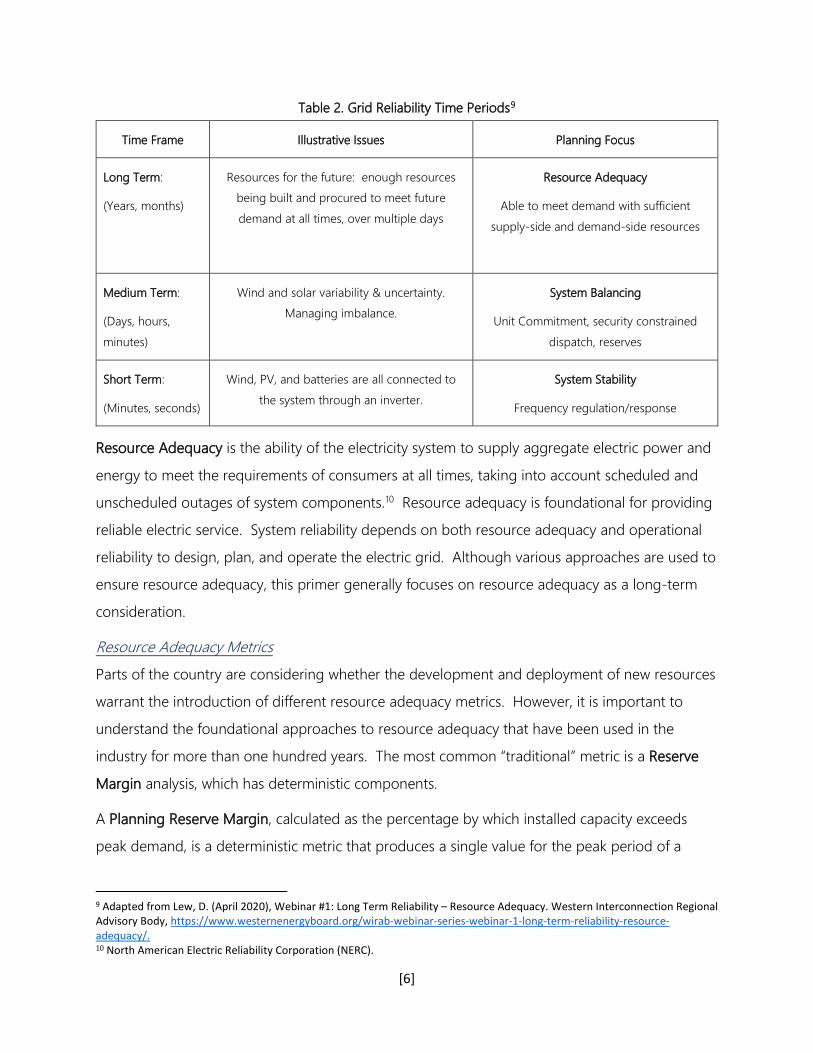
Resource Adequacy
Power system operation requires decisions at multiple time frames, ranging from milliseconds
(real time) to several years ahead. For discussion purposes, these decisions can be categorized
broadly into planning/investment and operations. The operations time frame can be further
divided into: (1) long-term operations, which covers years and months; (2) medium-term
operations, which includes planning days, weeks, or months ahead of time; and (3) short-term
operations, which encompasses events occurring in minutes, seconds, and fractions of seconds.
Table 2 shows these periods of grid reliability, with resource adequacy falling within the long-
term time frame.
[6]
Table 2. Grid Reliability Time Periods9
Time Frame Illustrative Issues Planning Focus
Long Term:
(Years, months)
Resources for the future: enough resources
being built and procured to meet future
demand at all times, over multiple days
Resource Adequacy
Able to meet demand with sufficient
supply-side and demand-side resources
Medium Term:
(Days, hours,
minutes)
Wind and solar variability & uncertainty.
Managing imbalance.
System Balancing
Unit Commitment, security constrained
dispatch, reserves
Short Term:
(Minutes, seconds)
Wind, PV, and batteries are all connected to
the system through an inverter.
System Stability
Frequency regulation/response
Resource Adequacy is the ability of the electricity system to supply aggregate electric power and
energy to meet the requirements of consumers at all times, taking into account scheduled and
unscheduled outages of system components.10 Resource adequacy is foundational for providing
reliable electric service. System reliability depends on both resource adequacy and operational
reliability to design, plan, and operate the electric grid. Although various approaches are used to
ensure resource adequacy, this primer generally focuses on resource adequacy as a long-term
consideration.
Resource Adequacy Metrics
Parts of the country are considering whether the development and deployment of new resources
warrant the introduction of different resource adequacy metrics. However, it is important to
understand the foundational approaches to resource adequacy that have been used in the
industry for more than one hundred years. The most common “traditional” metric is a Reserve
Margin analysis, which has deterministic components.
A Planning Reserve Margin, calculated as the percentage by which installed capacity exceeds
peak demand, is a deterministic metric that produces a single value for the peak period of a
9 Adapted from Lew, D. (April 2020), Webinar #1: Long Term Reliability – Resource Adequacy. Western Interconnection Regional Advisory Body, https://www.westernenergyboard.org/wirab-webinar-series-webinar-1-long-term-reliability-resource-adequacy/. 10 North American Electric Reliability Corporation (NERC).
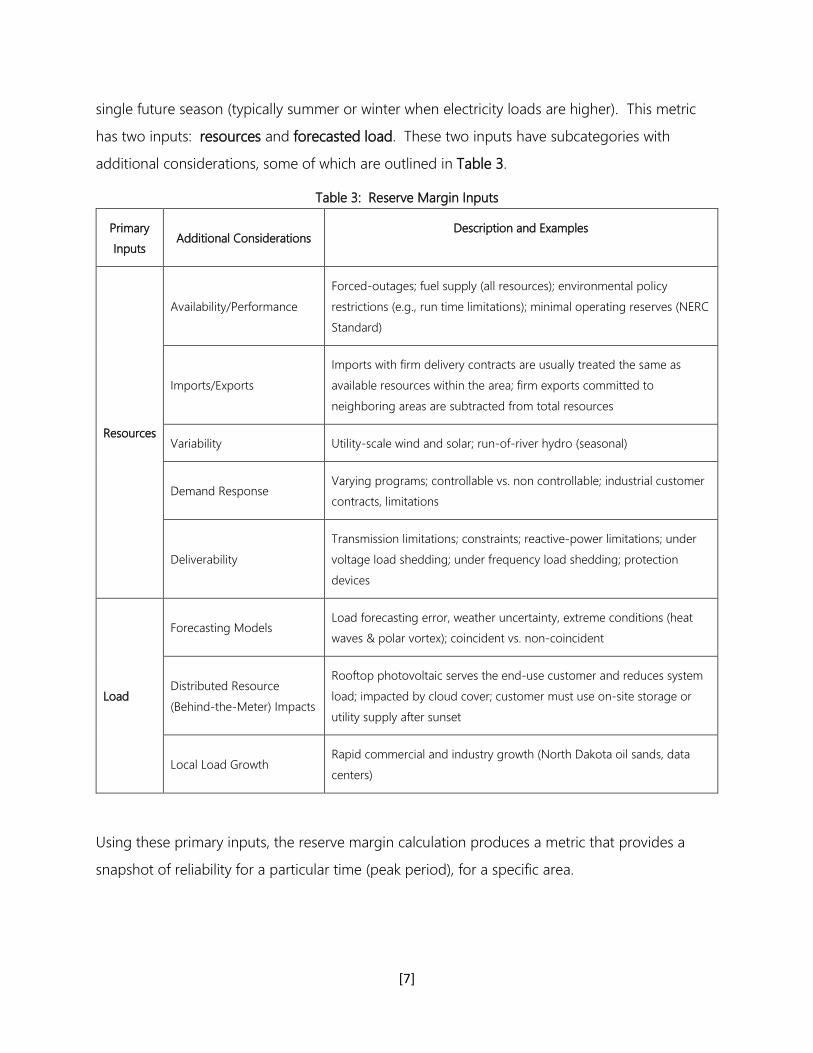
[7]
single future season (typically summer or winter when electricity loads are higher). This metric
has two inputs: resources and forecasted load. These two inputs have subcategories with
additional considerations, some of which are outlined in Table 3.
Table 3: Reserve Margin Inputs
Primary
Inputs Additional Considerations
Description and Examples
Resources
Availability/Performance
Forced-outages; fuel supply (all resources); environmental policy
restrictions (e.g., run time limitations); minimal operating reserves (NERC
Standard)
Imports/Exports
Imports with firm delivery contracts are usually treated the same as
available resources within the area; firm exports committed to
neighboring areas are subtracted from total resources
Variability Utility-scale wind and solar; run-of-river hydro (seasonal)
Demand Response Varying programs; controllable vs. non controllable; industrial customer
contracts, limitations
Deliverability
Transmission limitations; constraints; reactive-power limitations; under
voltage load shedding; under frequency load shedding; protection
devices
Load
Forecasting Models Load forecasting error, weather uncertainty, extreme conditions (heat
waves & polar vortex); coincident vs. non-coincident
Distributed Resource
(Behind-the-Meter) Impacts
Rooftop photovoltaic serves the end-use customer and reduces system
load; impacted by cloud cover; customer must use on-site storage or
utility supply after sunset
Local Load Growth Rapid commercial and industry growth (North Dakota oil sands, data
centers)
Using these primary inputs, the reserve margin calculation produces a metric that provides a
snapshot of reliability for a particular time (peak period), for a specific area.
[8]
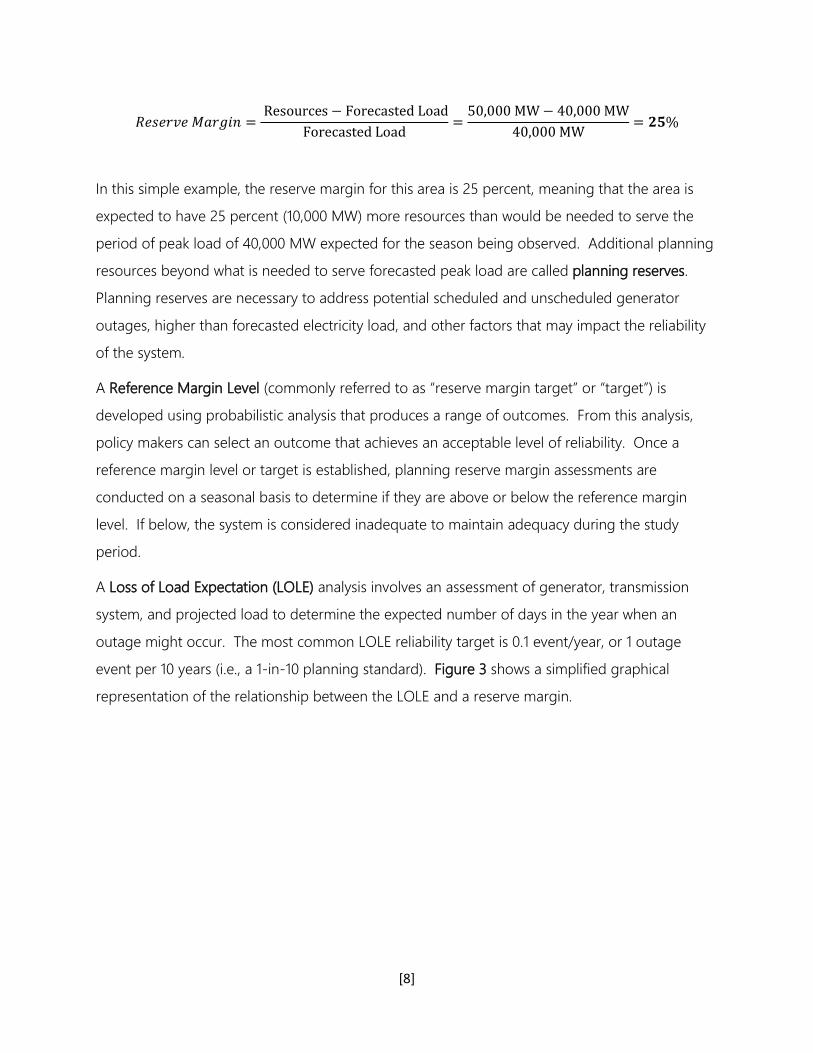
𝑅𝑅𝑅𝑅𝑅𝑅𝑅𝑅𝑅𝑅𝑅𝑅𝑅𝑅 𝑀𝑀𝑀𝑀𝑅𝑅𝑀𝑀𝑀𝑀𝑀𝑀 = Resources − Forecasted Load
Forecasted Load=
50,000 MW− 40,000 MW40,000 MW
= 𝟐𝟐𝟐𝟐%
In this simple example, the reserve margin for this area is 25 percent, meaning that the area is
expected to have 25 percent (10,000 MW) more resources than would be needed to serve the
period of peak load of 40,000 MW expected for the season being observed. Additional planning
resources beyond what is needed to serve forecasted peak load are called planning reserves.
Planning reserves are necessary to address potential scheduled and unscheduled generator
outages, higher than forecasted electricity load, and other factors that may impact the reliability
of the system.
A Reference Margin Level (commonly referred to as “reserve margin target” or “target”) is
developed using probabilistic analysis that produces a range of outcomes. From this analysis,
policy makers can select an outcome that achieves an acceptable level of reliability. Once a
reference margin level or target is established, planning reserve margin assessments are
conducted on a seasonal basis to determine if they are above or below the reference margin
level. If below, the system is considered inadequate to maintain adequacy during the study
period.
A Loss of Load Expectation (LOLE) analysis involves an assessment of generator, transmission
system, and projected load to determine the expected number of days in the year when an
outage might occur. The most common LOLE reliability target is 0.1 event/year, or 1 outage
event per 10 years (i.e., a 1-in-10 planning standard). Figure 3 shows a simplified graphical
representation of the relationship between the LOLE and a reserve margin.

[9]
Additional metrics include loss of load hours (LOLH),
which projects the total number of hours when load
will not be met and expected unserved energy, which
projects the amount of electricity demand in MWh that
load will not be met. These probabilistic metrics,
especially LOLE, are the most common approaches
used by various entities involved in industry planning.
The LOLE forms the basis of calculating how much a
particular generator, or group of generators, contribute
towards planning reserves, which is called the effective
load carrying capability (ELCC). The ELCC measures the
contribution of a generator (or generator type) to the
overall resource adequacy of the system.
Regulatory Applications of Resource Adequacy
Resource adequacy is an important driver in regulatory decisions – primarily at the state level.
For example, when a commission reviews a rate case that involves resource procurement (e.g., a
utility building a new power plant), its regulatory decisions can be informed by an examination of
the system’s overall resource adequacy. Moreover, resource adequacy can serve an important
role to guide utility resource planning and investment decisions.
Regulatory Authorities
The Role of Regulatory Authorities
Many government entities and industry participants share the common objective for a reliable,
safe, and affordable electric system that serves all customers. In general, states are responsible
for resource adequacy in siting of electric facilities, establishing retail electric rates, and
overseeing the reliability of the distribution system.11 As economic regulators, state commissions
review and approve utility investment proposals that have long-term impacts on overall reliability
of both local distribution grids and the bulk regional system. These responsibilities, together with
the rapidly evolving grid and new emerging technologies, require state commissions to actively
11 FERC has expanded its wholesale market jurisdiction over some aspects of the distribution system, including the market participation of distributed energy and storage resources. See FERC Order 2222 (https://www.ferc.gov/news-events/news/ferc-opens-wholesale-markets-distributed-resources-landmark-action-breaks-down)
Figure 3: Loss of Load Expectation vs.
Reserve Margins
[10]
consider and evaluate reliability risks – often informed by ongoing work by the North American
Electric Reliability Corporation (NERC) and the Regional Entities – including resource adequacy,
interconnection standards, and transmission grid planning, as well as cyber and physical security.
FERC is an independent federal agency that regulates, among other things, “the transmission of
electric energy in interstate commerce and…the sale of electric energy at wholesale in interstate
commerce.”12 FERC has approved the creation of Regional Transmission Organizations (RTOs)
and Independent System Operators (ISOs), whose market and operational activities FERC
regulates. FERC approved the establishment of these organizations to provide non-
discriminatory access to transmission. These entities are responsible for independently operating
a region's electricity grid, administering the region's wholesale electricity markets, providing
reliability planning for the region's bulk electricity system, and overseeing short-term reliability.
NERC was designated by FERC as the Electric Reliability Organization (ERO) in 2005, responsible
for establishing and enforcing mandatory reliability standards for entities across the industry,
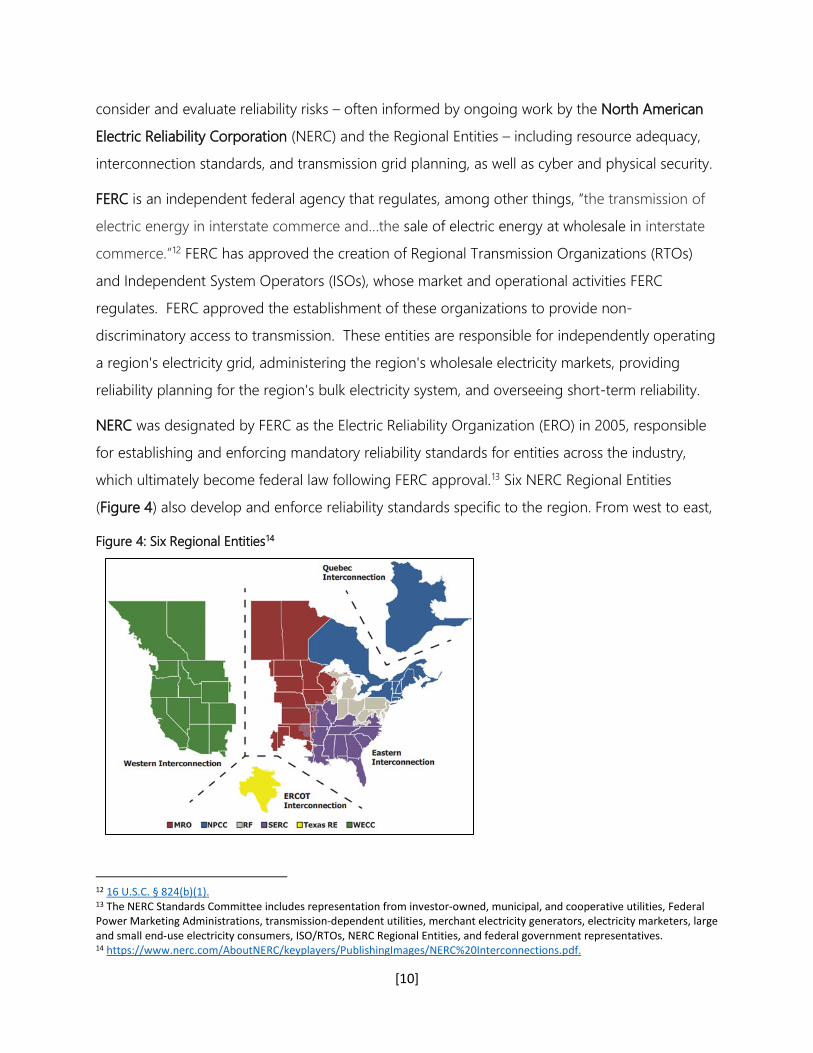
which ultimately become federal law following FERC approval.13 Six NERC Regional Entities
(Figure 4) also develop and enforce reliability standards specific to the region. From west to east,
Figure 4: Six Regional Entities14
12 16 U.S.C. § 824(b)(1). 13 The NERC Standards Committee includes representation from investor-owned, municipal, and cooperative utilities, Federal Power Marketing Administrations, transmission-dependent utilities, merchant electricity generators, electricity marketers, large and small end-use electricity consumers, ISO/RTOs, NERC Regional Entities, and federal government representatives. 14 https://www.nerc.com/AboutNERC/keyplayers/PublishingImages/NERC%20Interconnections.pdf.
[11]
these regional entities include:
• Western Electric Coordinating Council (WECC)
• Texas Reliability Entity (Texas RE)
• Midwest Reliability Organization (MRO)
• Southeast Electric Reliability Council (SERC)
• ReliabilityFirst (RF)
• Northeast Power Coordinating Council (NPCC)
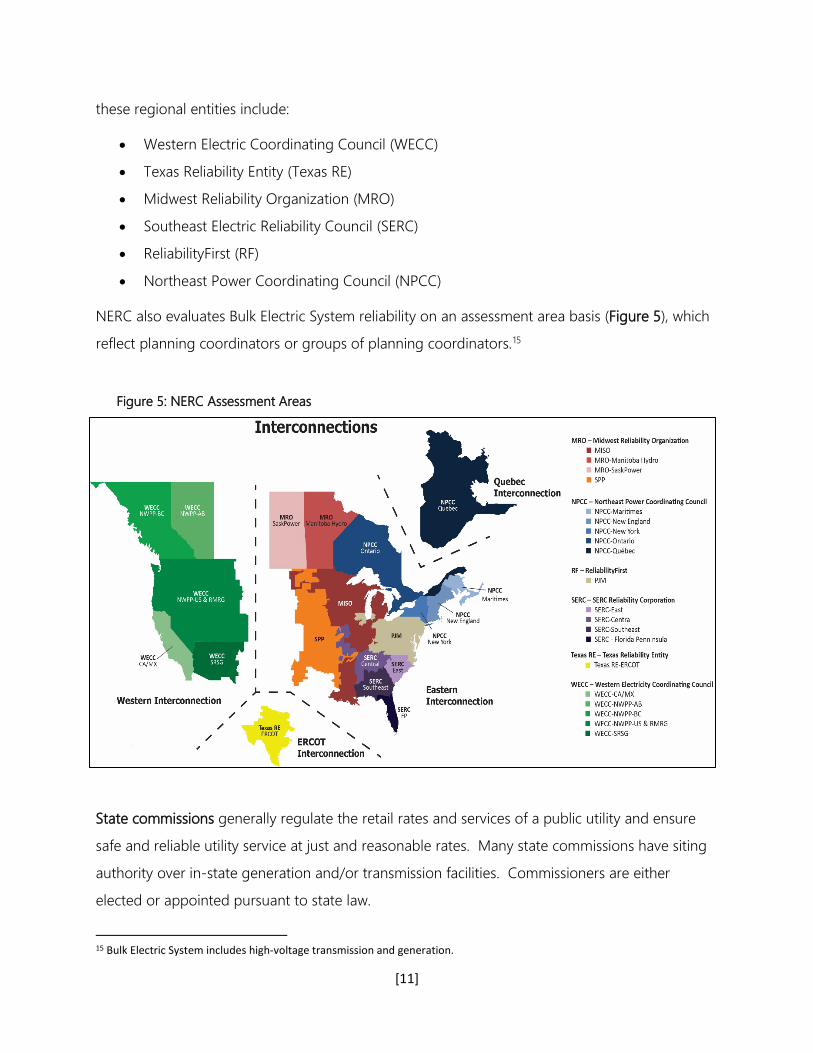
NERC also evaluates Bulk Electric System reliability on an assessment area basis (Figure 5), which
reflect planning coordinators or groups of planning coordinators.15
State commissions generally regulate the retail rates and services of a public utility and ensure
safe and reliable utility service at just and reasonable rates. Many state commissions have siting
authority over in-state generation and/or transmission facilities. Commissioners are either
elected or appointed pursuant to state law.
15 Bulk Electric System includes high-voltage transmission and generation.
Figure 5: NERC Assessment Areas

[12]
State legislatures develop policy that can impact different entities throughout the industry (e.g.,
requirements for generators) or require changes to the state’s resource mix (e.g., renewable
portfolio standards).

[13]
II. State and Market Approaches to Resource Adequacy
ERCOT
The Electric Reliability Council of Texas (ERCOT) is a single-
state independent system operator (ISO) that manages the
flow of electric power to more than 26 million Texas
customers (approximately 75 percent of the land area and 90
percent of the state’s electric load). ERCOT’s grid is
asynchronous to the larger Eastern and Western
Interconnections, with limited DC ties to the East and Mexico.
As a membership-based 501(c)(4) nonprofit corporation,
ERCOT also manages power flows for more than 46,500 miles
of transmission lines and over 710 generation units. ERCOT runs a competitive wholesale bulk-
power market and performs financial settlements, and administers retail switching for 8 million
premises in competitive choice areas.
ERCOT is governed by a board of directors and subject to oversight by the Public Utility
Commission of Texas (PUCT) and the Texas legislature. Its membership includes consumers,
cooperatives, generators, power marketers, retail electric providers, investor-owned utilities (IOUs),
transmission and distribution providers, and municipally owned electric utilities.
The grid operator has four primary responsibilities:16
1. Maintaining system reliability;
2. Facilitating a competitive wholesale market;
3. Facilitating a competitive retail market;17 and
4. Ensuring open access to transmission.
The PUCT maintains jurisdiction over activities conducted by ERCOT and performs regulatory
functions for electric transmission and distribution utilities across the state. Vertically integrated
electric utilities within Texas, but outside of the ERCOT system, are also regulated by the PUCT.18
FERC regulatory authority in Texas is limited to bulk electric system reliability, chiefly through
16ERCOT Fact Sheet, June 2021, http://www.ercot.com/content/wcm/lists/219736/ERCOT_Fact_Sheet_6.1.21.pdf. 17 ERCOT Market Structure, January 2019, http://www.ercot.com/content/wcm/lists/190192/Market_Structure_OnePager_FINAL_Revised.pdf. 18 As used in this primer, the term “vertically integrated utilities” generally refers to utilities that own generation, transmission, and distribution.
Figure 6: ERCOT Footprint

[14]
application of NERC Reliability Standards, and does not apply to power markets. The PUCT is
involved in multi-state efforts to implement wholesale electric competitive market structures and
transmission planning in the Southwest Power Pool (SPP) and Midcontinent Independent System
Operator (MISO) areas, which are connected to the Eastern Interconnection.19 (Far west Texas is in
the Western Interconnection and served primarily by El Paso Electric, but is also under PUCT
jurisdiction.)
Market Structure
The Texas Legislature deregulated the retail electric market in 1999 to promote retail competition
that allows consumers to choose their energy supplier. When this occurred, generators,
transmission and distribution companies, and electric retailers began to operate independently
from one another, with the exception of municipally owned utilities and cooperatives who remain
vertically integrated. Currently, 75 percent of ERCOT’s load is served by competitive-choice
customers.20 ERCOT is also unique in that it only runs energy and ancillary services markets, and
unlike other ISO/RTOs, does not administer a capacity market.
There is no mandated planning reserve margin for ERCOT. A target reserve margin of 13.75
percent for peak demand is used in NERC assessments. ERCOT still conducts extensive studies of
reserve outlook and the PUCT is considering incorporation of economic or market-based
equilibrium reserve margins determined in recent studies.
Entities Involved in Resource Adequacy and Planning
ERCOT staff handles the bulk of analysis with skilled staff developing system-wide studies, load
forecasts and other analysis.
The stakeholder Technical Advisory Committee (TAC), supported by its Wholesale Market
Subcommittee (WMS) and Reliability Operations Subcommittee (ROS), each with additional
workgroups and task forces, is responsible for providing policy recommendations to the ERCOT
board of directors. WMS and its Supply Adequacy Working Group are primarily responsible for
stakeholder input into resource adequacy matters. The Reliability and Operations Subcommittee
(ROS) is responsible for developing, reviewing, and maintaining planning and operating criteria for
the ERCOT system.
19 Public Utility Commission of Texas, About the PUCT, http://www.puc.texas.gov/agency/about/mission.aspx. 20 ERCOT Fact Sheet, June 2021, http://www.ercot.com/content/wcm/lists/219736/ERCOT_Fact_Sheet_6.1.21.pdf.
[15]
The ROS and WMS also review ERCOT protocol revisions and performs protocol-required reviews
of ancillary service provisions and commercially significant constraints.21
The Planning Working Group (PLWG) reports to the ROS and is responsible for the review of
planning guides to identify any needed improvements to criteria, processes, and data provision
requirements for grid studies.
The Regional Planning Group (RPG) reports to TAC and provides a forum on issues related to
planning the ERCOT system for reliable and efficient operation. The RPG includes a process for
developing and reviewing the Long-Term System Assessment (LTSA), which evaluates the potential
needs of the ERCOT high-voltage (345 kilovolt) system 10-15 years into the future and provides a
scenario-based view of long-term needs across a range of possible future generation expansion
scenarios. Information from the LTSA is fed into the ERCOT 1-10 year planning process to inform
transmission project decisions that meet the ERCOT reliability and economic criteria.
Resource Adequacy and Planning Processes
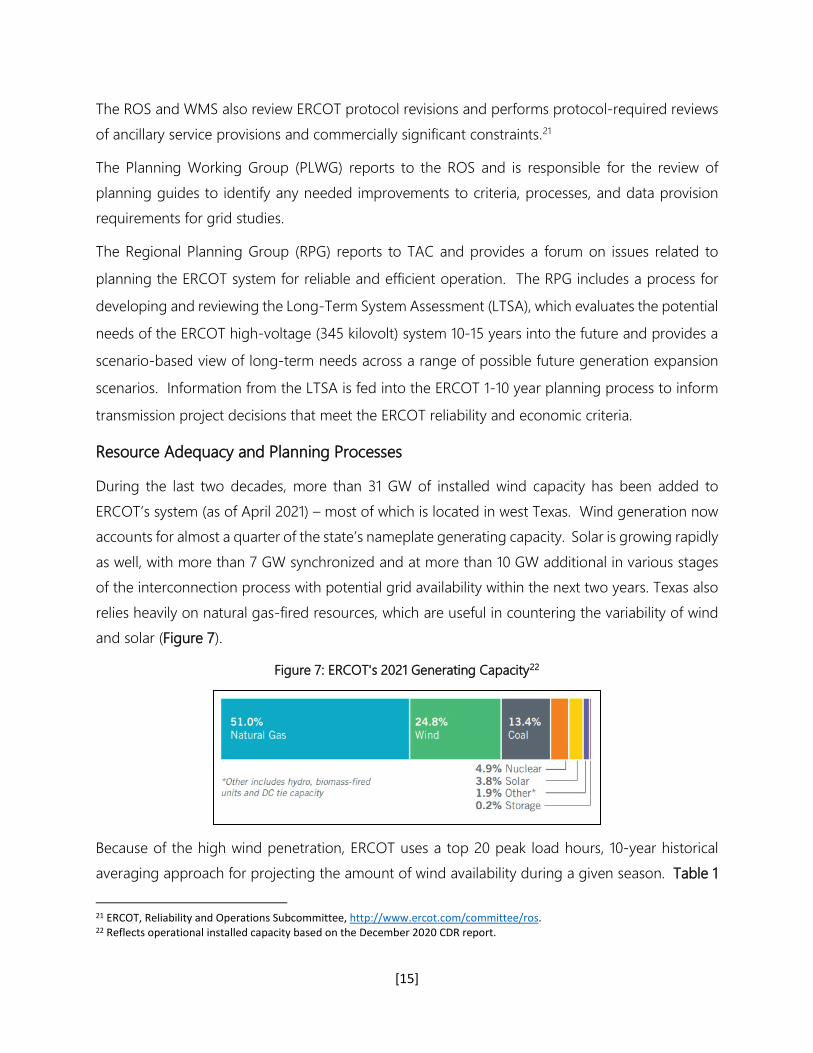
During the last two decades, more than 31 GW of installed wind capacity has been added to
ERCOT’s system (as of April 2021) – most of which is located in west Texas. Wind generation now
accounts for almost a quarter of the state’s nameplate generating capacity. Solar is growing rapidly
as well, with more than 7 GW synchronized and at more than 10 GW additional in various stages
of the interconnection process with potential grid availability within the next two years. Texas also
relies heavily on natural gas-fired resources, which are useful in countering the variability of wind
and solar (Figure 7).
Figure 7: ERCOT's 2021 Generating Capacity22
Because of the high wind penetration, ERCOT uses a top 20 peak load hours, 10-year historical
averaging approach for projecting the amount of wind availability during a given season. Table 1
21 ERCOT, Reliability and Operations Subcommittee, http://www.ercot.com/committee/ros. 22 Reflects operational installed capacity based on the December 2020 CDR report.
[16]
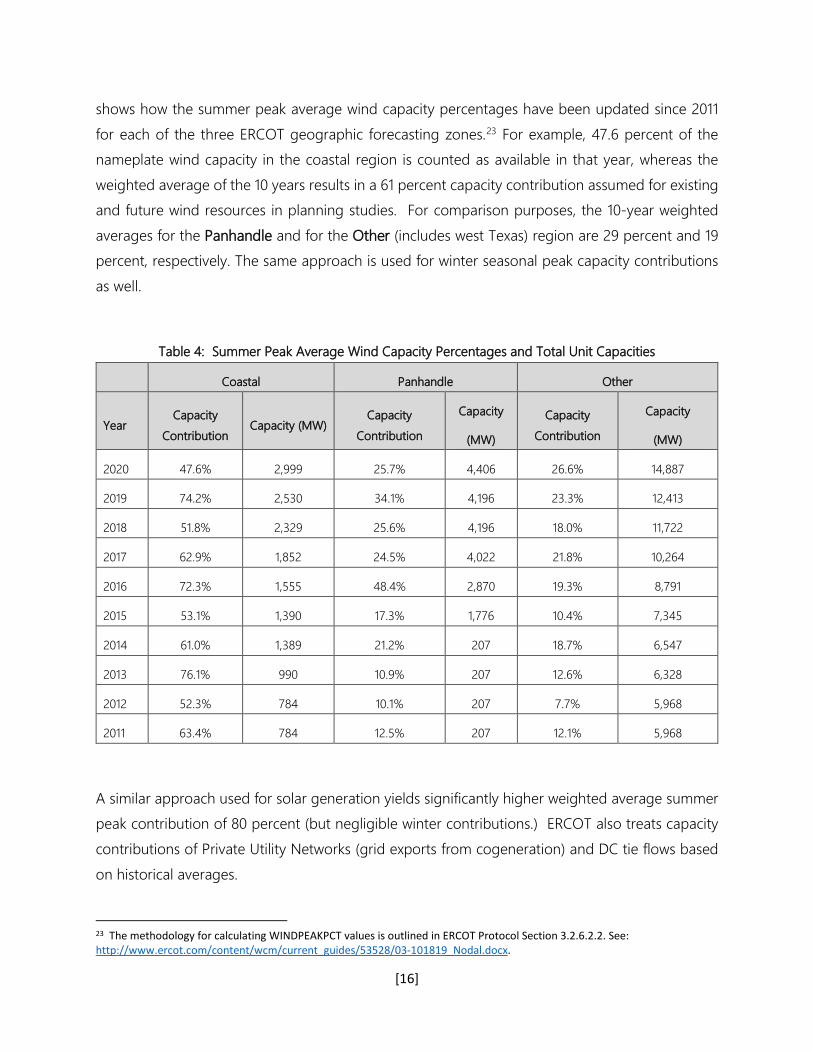
shows how the summer peak average wind capacity percentages have been updated since 2011
for each of the three ERCOT geographic forecasting zones.23 For example, 47.6 percent of the
nameplate wind capacity in the coastal region is counted as available in that year, whereas the
weighted average of the 10 years results in a 61 percent capacity contribution assumed for existing
and future wind resources in planning studies. For comparison purposes, the 10-year weighted
averages for the Panhandle and for the Other (includes west Texas) region are 29 percent and 19
percent, respectively. The same approach is used for winter seasonal peak capacity contributions
as well.
Table 4: Summer Peak Average Wind Capacity Percentages and Total Unit Capacities
Coastal Panhandle Other
Year Capacity
Contribution Capacity (MW)
Capacity
Contribution
Capacity
(MW)
Capacity
Contribution
Capacity
(MW)
2020 47.6% 2,999 25.7% 4,406 26.6% 14,887
2019 74.2% 2,530 34.1% 4,196 23.3% 12,413
2018 51.8% 2,329 25.6% 4,196 18.0% 11,722
2017 62.9% 1,852 24.5% 4,022 21.8% 10,264
2016 72.3% 1,555 48.4% 2,870 19.3% 8,791
2015 53.1% 1,390 17.3% 1,776 10.4% 7,345
2014 61.0% 1,389 21.2% 207 18.7% 6,547
2013 76.1% 990 10.9% 207 12.6% 6,328
2012 52.3% 784 10.1% 207 7.7% 5,968
2011 63.4% 784 12.5% 207 12.1% 5,968
A similar approach used for solar generation yields significantly higher weighted average summer
peak contribution of 80 percent (but negligible winter contributions.) ERCOT also treats capacity
contributions of Private Utility Networks (grid exports from cogeneration) and DC tie flows based
on historical averages.
23 The methodology for calculating WINDPEAKPCT values is outlined in ERCOT Protocol Section 3.2.6.2.2. See: http://www.ercot.com/content/wcm/current_guides/53528/03-101819_Nodal.docx.

[17]
Resource Adequacy Assessments
ERCOT conducts and releases Seasonal Assessments of Resource Adequacy (SARA) reports for the
spring, summer, fall, and winter. The reports use a deterministic approach to examine impacts of
potential variables that may affect the performance of installed resources to meet ERCOT’s peak
electrical demand. This resource adequacy analysis accounts for projected load and resources on
a normalized basis and to determine adequate reserves (resources in excess of peak demand, on
a normalized basis) to cover the uncertainty in the forecasted peak demand, as well as potential
resources availability (forced outages) to meet a probabilistic reliability standard (i.e., reserve
margin).24
The SARA report is intended to examine a range of resource adequacy outcomes and serve as a
planning tool for electric utility entities within Texas. The report also includes scenarios that
examine a combination of extreme weather, high peak loads, low wind and solar output, high
generator outages, and other conditions. The scenarios are based on historic ranges of the
parameter values or known changes expected in the near-term. These scenarios support the
"extreme weather" resource adequacy assessment requirement established by PUCT rule
25.362(i)(2)(H).
ERCOT developed a drought risk monitoring tool to screen for potential drought-related impacts
to generation resources. The tool predicts whether water supplies used by generation resources in
the ERCOT region are at risk of reaching levels requiring closer monitoring over the next 6 to 18
months, based on the most recent reservoir and lake levels from the Texas Water Development
Board (TWDB) and historical trends in water usage. The documents available in this section include
summaries of the results of this analysis, documentation of the tool methodology, and other related
reports.
Emerging Issues
In its most recent LTSA, ERCOT identified the following key findings:25
1. Significant growth in solar and wind resources was found across all five scenarios: The
share of demand served by coal and natural gas generation declined throughout the 15
years in each of the five scenarios due to coal and natural gas generation retirements and
demand growth over the study period. Retired coal and natural gas generation was
24 ERCOT, Resource Adequacy, http://www.ercot.com/gridinfo/resource. 25 ERCOT, 2020 Long-Term System Assessment, http://www.ercot.com/content/wcm/key_documents_lists/89026/2020_LTSA_Report.zip.
[18]
replaced by solar, wind, new natural gas generation, and battery energy storage. The share
of wind and solar generation increased in all five scenarios, driven by solar and wind
capacity additions.
2. Growth in renewable resources and electric vehicle adoption lead to a shift in scarcity hours
to later in the day in both summer and winter months: Scarcity hours shifted to later in the
day across all five scenarios. The Current Trends, Renewable Mandate, and High Industrial
Load scenarios saw scarcity hours from 7 to 10 p.m. in both summer and winter months by
2035, whereas the High Battery Energy Storage scenario experienced an extension of
scarcity hours until 11 p.m. in the same timeframe. Factors influencing the shift in scarcity
hours include: (a.) Increased adoption of electric vehicles could result in a significant shift
in hourly demand profiles. This observation was also noted in the 2018 LTSA; (b.) The drop
in solar production experienced in late evening hours can result in a high ramping rate for
net load. High net load ramping conditions will likely become more frequent and severe as
solar penetration increases.
3. The scale and location of wind and solar generation additions are dependent on sufficient
transmission capacity between resource-rich regions and demand centers: Comparing the
results of capacity expansion and retirement analysis for two iterations of the Current
Trends scenario, the Renewable Mandate scenario, and the Existing Transmission
Constraints scenario provided insight into the potential impacts of transmission limitations
on new generation development. Two iterations of capacity expansion and retirement
analysis, and transmission expansion analysis were conducted for the Current Trends
scenario. The purpose of the iterative process was to account for the impacts of (a.)
transmission constraints on the timing, location, and capacity of new resources and (b.)
resource siting on the need for transmission improvements.
4. Holistic solutions addressing both regional transfer limits and local constraints closer to
urban demand centers are required to accommodate large-scale renewable generation
transfers: ERCOT identified the need for additional transmission paths from West Texas to
demand centers. However, it was also observed that the full benefit of additional transfer
paths cannot be realized without also addressing local constraints closer to customer
demand. Holistic solutions addressing both regional transfer limits and local constraints are
required if large-scale renewable generation transfers are to be accommodated.
ERCOT has conducted probabilistic analysis to look at periods other than peak hour, as the
characteristics of renewable generation may shift risks. Capacity contributions from distributed

[19]
energy resources and battery energy storage are not yet significant but growth is steady and work
has begun to collect data, establish performance characteristics and incorporate into planning, as
well as establish market rules.
Besides these observations, the extreme winter condition emergencies in February 2021 in ERCOT
will be considered in future analyses of reliability and adequacy and the scenarios that must be
considered. This winter event also resulted in the enactment of state legislation.26
26 See, e.g., Tx. S.B. 3, 87 Leg., R.S. (2021), https://capitol.texas.gov/BillLookup/History.aspx?LegSess=87R&Bill=SB3.
[20]
CAISO/EIM
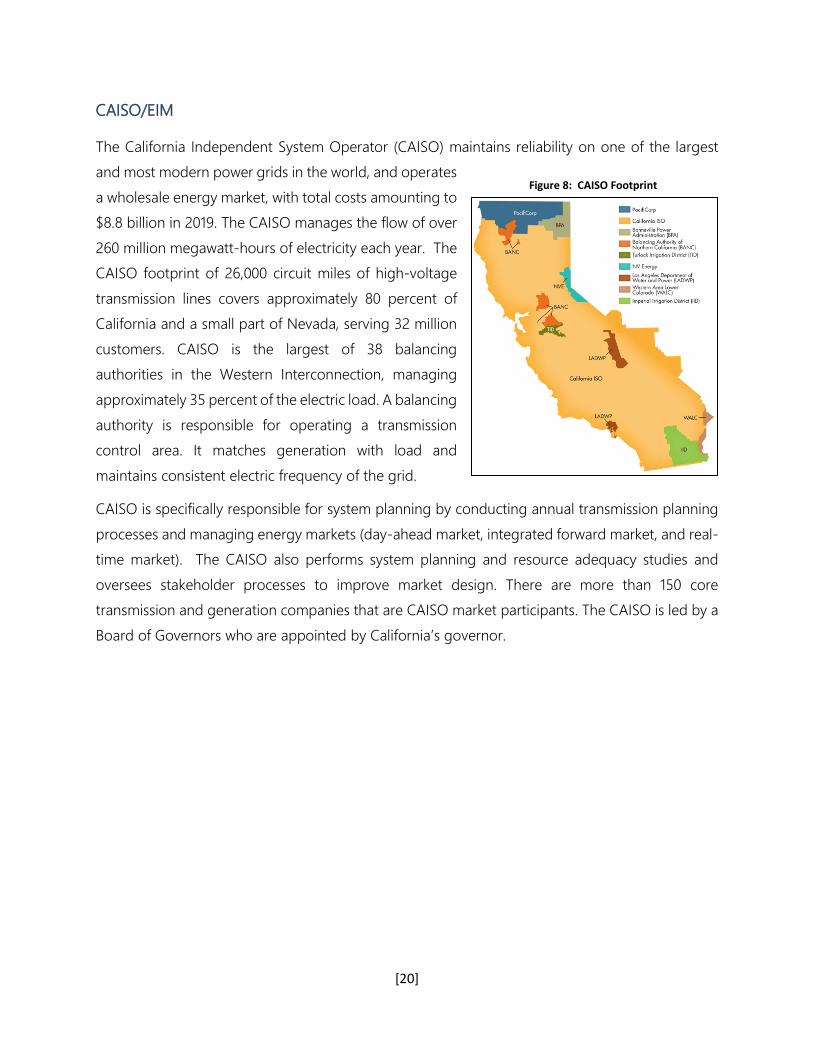
The California Independent System Operator (CAISO) maintains reliability on one of the largest
and most modern power grids in the world, and operates
a wholesale energy market, with total costs amounting to
$8.8 billion in 2019. The CAISO manages the flow of over
260 million megawatt-hours of electricity each year. The
CAISO footprint of 26,000 circuit miles of high-voltage
transmission lines covers approximately 80 percent of
California and a small part of Nevada, serving 32 million
customers. CAISO is the largest of 38 balancing
authorities in the Western Interconnection, managing
approximately 35 percent of the electric load. A balancing
authority is responsible for operating a transmission
control area. It matches generation with load and
maintains consistent electric frequency of the grid.
CAISO is specifically responsible for system planning by conducting annual transmission planning
processes and managing energy markets (day-ahead market, integrated forward market, and real-
time market). The CAISO also performs system planning and resource adequacy studies and
oversees stakeholder processes to improve market design. There are more than 150 core
transmission and generation companies that are CAISO market participants. The CAISO is led by a
Board of Governors who are appointed by California’s governor.
Figure 8: CAISO Footprint
[21]
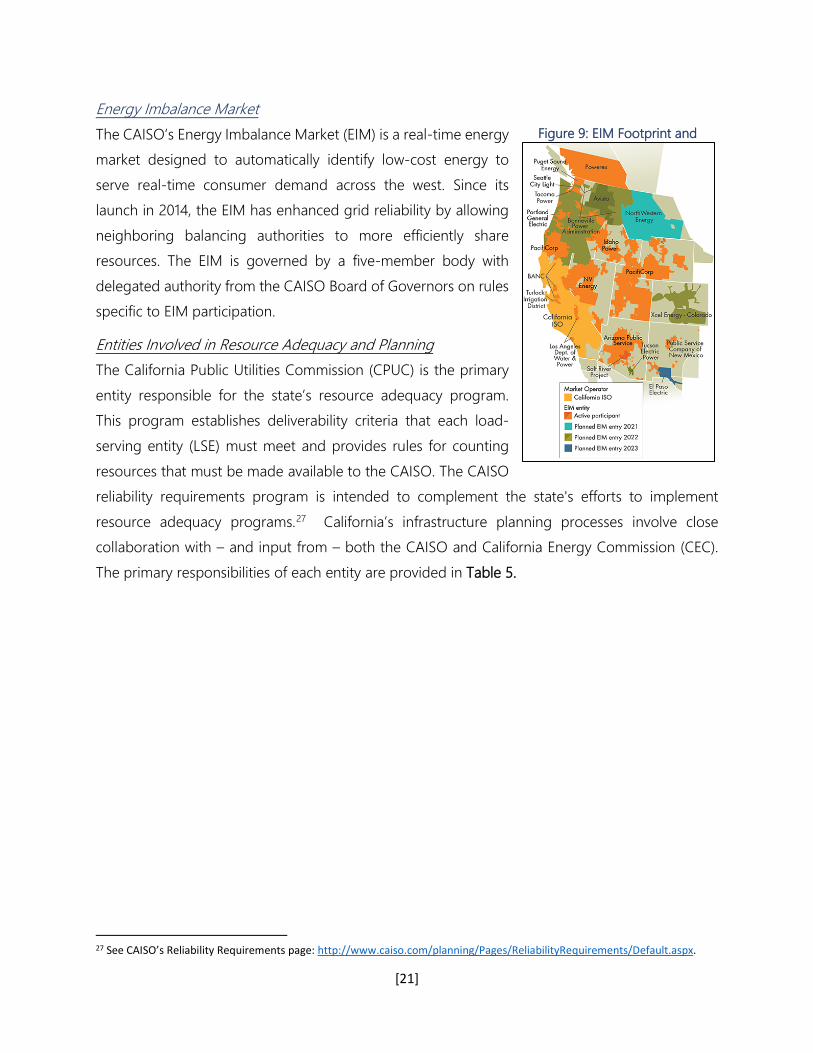
Energy Imbalance Market
The CAISO’s Energy Imbalance Market (EIM) is a real-time energy
market designed to automatically identify low-cost energy to
serve real-time consumer demand across the west. Since its
launch in 2014, the EIM has enhanced grid reliability by allowing
neighboring balancing authorities to more efficiently share
resources. The EIM is governed by a five-member body with
delegated authority from the CAISO Board of Governors on rules
specific to EIM participation.
Entities Involved in Resource Adequacy and Planning
The California Public Utilities Commission (CPUC) is the primary
entity responsible for the state’s resource adequacy program.
This program establishes deliverability criteria that each load-
serving entity (LSE) must meet and provides rules for counting
resources that must be made available to the CAISO. The CAISO
reliability requirements program is intended to complement the state's efforts to implement
resource adequacy programs.27 California’s infrastructure planning processes involve close
collaboration with – and input from – both the CAISO and California Energy Commission (CEC).
The primary responsibilities of each entity are provided in Table 5.
27 See CAISO’s Reliability Requirements page: http://www.caiso.com/planning/Pages/ReliabilityRequirements/Default.aspx.
Figure 9: EIM Footprint and
[22]
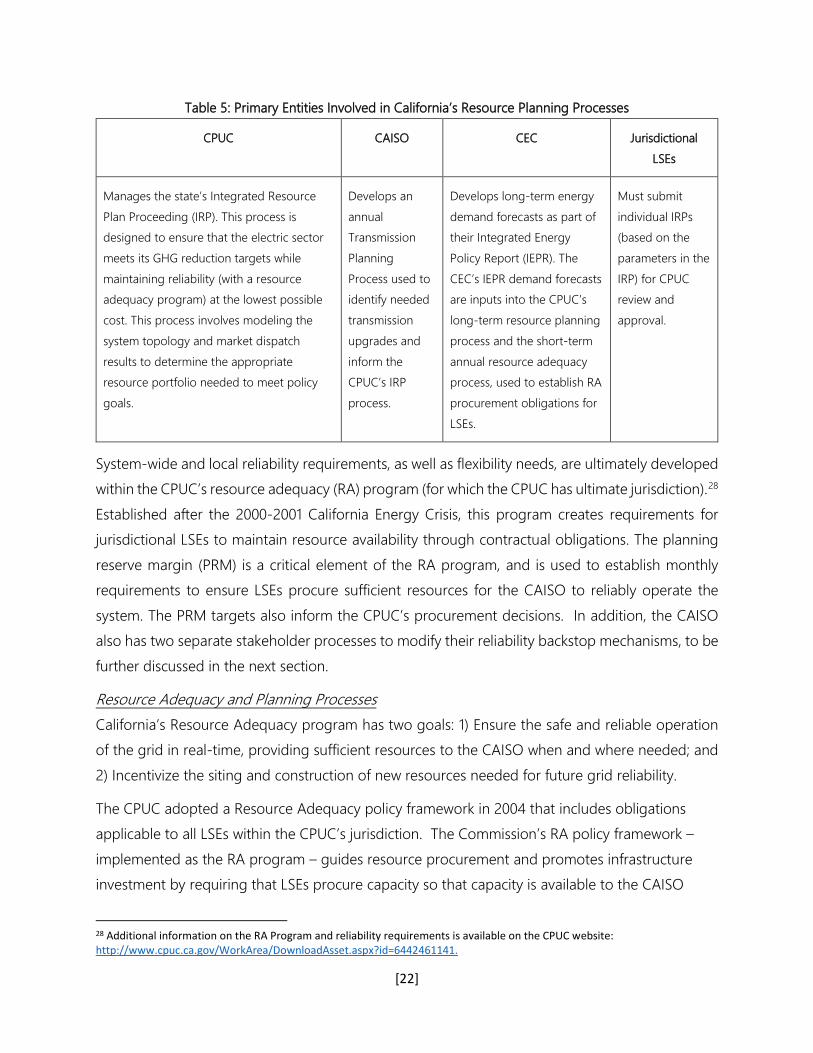
Table 5: Primary Entities Involved in California’s Resource Planning Processes
CPUC CAISO CEC Jurisdictional
LSEs
Manages the state’s Integrated Resource
Plan Proceeding (IRP). This process is
designed to ensure that the electric sector
meets its GHG reduction targets while
maintaining reliability (with a resource
adequacy program) at the lowest possible
cost. This process involves modeling the
system topology and market dispatch
results to determine the appropriate
resource portfolio needed to meet policy
goals.
Develops an
annual
Transmission
Planning
Process used to
identify needed
transmission
upgrades and
inform the
CPUC’s IRP
process.
Develops long-term energy
demand forecasts as part of
their Integrated Energy
Policy Report (IEPR). The
CEC’s IEPR demand forecasts
are inputs into the CPUC’s
long-term resource planning
process and the short-term
annual resource adequacy
process, used to establish RA
procurement obligations for
LSEs.
Must submit
individual IRPs
(based on the
parameters in the
IRP) for CPUC
review and
approval.
System-wide and local reliability requirements, as well as flexibility needs, are ultimately developed
within the CPUC’s resource adequacy (RA) program (for which the CPUC has ultimate jurisdiction).28
Established after the 2000-2001 California Energy Crisis, this program creates requirements for
jurisdictional LSEs to maintain resource availability through contractual obligations. The planning
reserve margin (PRM) is a critical element of the RA program, and is used to establish monthly
requirements to ensure LSEs procure sufficient resources for the CAISO to reliably operate the
system. The PRM targets also inform the CPUC’s procurement decisions. In addition, the CAISO
also has two separate stakeholder processes to modify their reliability backstop mechanisms, to be
further discussed in the next section.
Resource Adequacy and Planning Processes
California’s Resource Adequacy program has two goals: 1) Ensure the safe and reliable operation
of the grid in real-time, providing sufficient resources to the CAISO when and where needed; and
2) Incentivize the siting and construction of new resources needed for future grid reliability.
The CPUC adopted a Resource Adequacy policy framework in 2004 that includes obligations
applicable to all LSEs within the CPUC’s jurisdiction. The Commission’s RA policy framework –
implemented as the RA program – guides resource procurement and promotes infrastructure
investment by requiring that LSEs procure capacity so that capacity is available to the CAISO
28 Additional information on the RA Program and reliability requirements is available on the CPUC website: http://www.cpuc.ca.gov/WorkArea/DownloadAsset.aspx?id=6442461141.

[23]
when and where needed. The CPUC’s RA program contains three distinct requirements,
described in Table 6, with corresponding annual and monthly filings that are evaluated by the
CPUC staff for accuracy and completeness.
Under state and federal rules, the CPUC is empowered to set the RA requirements for its
jurisdictional LSEs, which include investor-owned utilities, community choice aggregators, and
energy service providers. Collectively, these jurisdictional entities represent 90 percent of the load
within the CAISO service territory.
Table 6: Resource Adequacy Requirements
Requirements Inputs Annual Filing Monthly Filing
System RA Each LSE and CEC-
adjusted forecast,
plus a 15%
planning reserve
margin
LSE must demonstrate procurement of
90% of the obligation for the five summer
months of the coming compliance year
LSE must demonstrate
procurement of 100%
of their monthly obligation
Local RA Annual CAISO
study (1-in-10
weather year and
planning for the
most stringent
contingency –
which is under
review in the
CPUC’s RA
proceeding).
For its three-year forward obligation,
each LSE must demonstrate procurement
of 100% of the obligation for each month
of compliance years one and two and
50% of the obligation for year three.
Beginning with the 2023 compliance year,
Central Procurement Entities will assume
primary responsibility for local capacity
procurement in the PG&E and SCE
service territories.
In all months, LSE must
demonstrate compliance with
100% of their obligation. From
July to December, LSE must
demonstrate procurement
of their revised (due to load
migration) local RA obligation.
Beginning with the 2023
compliance year, Central
Procurement Entities will assume
primary responsibility for local
capacity procurement in the
PG&E and SCE service
territories.
Flexible RA Annual CAISO
study that
examines ramp
rates.
LSE must demonstrate procurement of
90% of obligation for each month of
coming compliance year
LSE must demonstrate
procurement of 100% of their
monthly obligation
System and Local RA requirements were established in 2004 and 2006, respectively; however,
Flexible RA was introduced in 2015 to address growing system variability and ramping needs.
The changing resource mix, both in-front-of (utility-scale wind and solar) and behind-the-meter
(e.g., rooftop solar), have created a need for additional LSE requirements aimed at preventing
too much variability – particularly during the evening ramps. Solar output from distributed

[24]
resources (in aggregate) offsets what would otherwise be higher system loads. However, solar
output rapidly declines after the sun sets, creating a steep increase in demand (ramp) that must
be served by other resources on the CAISO system. During the same period, residential electricity
demand also increases, as customers return home from work and use more appliances during
the late-afternoon and early-evening (especially air conditioning). This load pattern, often
referred to as the duck curve (and more recently referred to as “net-load ramps”) is exacerbated
by the long, narrow, north-south geographic orientation of the state.
Resource Adequacy Resources
The CPUC develops Qualifying Capacity (QC) values to determine the capacity of each resource
eligible to be counted toward meeting the requirements listed in Table 6. The CPUC-adopted QC
counting conventions in Table 7 depend on resource output limitations during periods of peak
electricity demand and vary by resource type:29
Table 7: Qualifying Capacity as RA Resources
Resource Type Examples and Attributes Qualifying Capacity Counting Conventions Based On…
Dispatchable Natural gas
Hydroelectric (optional)
Maximum output of the generator when operating at full capacity—
known as the Pmax
External
Operating
Constraints
Geothermal
Hydroelectric (optional)
Historical production
Combined Heat
& Power (CHP)
Biomass: can bid into
the day-ahead market,
but are not fully
dispatchable
Historical MW amount bid or self-scheduled into the CAISO’s day-
ahead market
Wind & Solar Variable/intermittent in
nature
Statistical model examining resource contributions to addressing
loss of load events. This method is known as the effective load
carrying capability (ELCC).30
Demand
Response
Demand Response
Programs
Historical performance
29 For additional information, see page 15 of the Final Root Cause Analysis: http://www.caiso.com/Documents/Final-Root-Cause-Analysis-Mid-August-2020-Extreme-Heat-Wave.pdf. 30 ELCC approach has reduced the amount of qualifying capacity for these resources by approximately 80% (for example: a solar or wind resource that can produce 100 MW at the maximum output level would have a QC of 20 MW for meeting the CPUC’s RA program). For additional information, see CPUC, D.19-06-026, Decision Adopting Local Capacity Obligations for 2020-2022, Adopting Flexible Capacity Obligations for 2020, and Refining the Resource Adequacy Program, June 27, 2019, http://docs.cpuc.ca.gov/PublishedDocs/Published/G000/M309/K463/309463502.PDF.
[25]
CAISO RA Program Requirements
The fundamental benefit of California’s RA program is that resources with RA contracts have a
Must Offer Obligation (MOO) into one or more CAISO markets. The CAISO also has RA filing
requirements that generally synchronize with CPUC requirements and that are outlined in the
CAISO Tariff and Business Practice Manuals.31 These include the requirement that LSEs submit
RA and supply plans to CAISO as part of the year-ahead and month-ahead RA processes.
The CAISO maintains two backstop procurement processes that affect the RA program directly
by reducing the total capacity that LSEs must procure themselves:
1. Reliability Must Run (RMR) designations: CAISO may designate a resource as RMR
capacity to meet reliability needs.
2. Capacity Procurement Mechanism (CPM) designations: This is the “final step” of the RA
process. If individual LSEs do not meet their capacity requirements and if all LSEs
collectively do not meet a requirement, CAISO may designate CPM capacity through an
auction process.
Emerging Issues – Evolving Resource Adequacy with Extreme Weather and Growing System
Variability
The CPUC has introduced longer-term efforts to enhance resource adequacy approaches in
California, including a June 2020 order that initiated a review of the PRM target range,
authorizing the commission’s Energy Division to facilitate a working group to develop a set of
assumptions for use in a loss-of-load-expectation study.
In response to two rotating outages in the CAISO footprint on August 14 and 15, 2020, CAISO,
CPUC, and CEC released a Final Root Cause Analysis, which identifies some of the contributing
factors and provides recommendations.32 The CPUC also opened an Emergency Reliability
rulemaking (R.20-11-003) to make more resources available on an expedited basis to prevent a
recurrence of blackouts if the western United States experiences extremely high temperature,
sustained weather events in the summer of 2021. This rulemaking identifies efforts underway to
ensure sufficient resources are available to meet California’s summer 2021 electricity demand,
including:
31 CAISO Tariff: http://www.caiso.com/rules/Pages/Regulatory/Default.aspx; CAISO Business practice manuals: http://www.caiso.com/rules/Pages/BusinessPracticeManuals/Default.aspx. 32 Final Root Cause Analysis: Mid-August 2020 Extreme Heat Wave - January 13, 2021, http://www.caiso.com/Documents/CAISO-CPUC-CEC-Issue-Preliminary-Report-Causes-August-Rotating-Outages.pdf.
[26]
• Increased Overall Utility Procurement Requirements: To help ensure enough electricity
resources are available to serve customers during times of peak and net peak energy use,
the CPUC ordered utilities to procure a minimum of an additional 2.5 percent of
resources for all customers in their territories, representing an effective increase of the
planning reserve margin from the existing 15 percent to 17.5 percent.
• New Demand Response Programs: Demand-side resources, such as demand response,
are a critical element of the CPUC’s plan to ensure reliability. To lower energy demand
during the peak and net peak usage hours during a grid emergency, the CPUC ordered
PG&E, SCE, and SDG&E to pilot an Emergency Load Reduction Program that would give
demand response providers and other companies providing new services to manage
electricity demand, the ability to demonstrate how their innovative programs can support
the grid. The pilot program will compensate customers for voluntarily reducing demand
on the power system when called upon to do so by the CAISO in the event of a grid
emergency. This program will serve as a layer of insurance on top of existing resource
adequacy plans and will give grid operators a new tool among the existing demand
management programs to address unexpected power system conditions.
• Improved Rate Plans to Encourage Conservation: The CPUC ordered utilities to modify
their Critical Peak Pricing programs, which charge a higher price for electricity
consumption during peak hours on selected days. The CPUC ordered several
modifications to the Critical Peak Pricing programs to ensure the program is more
effective and responsive to the critical three hours of a grid emergency, including shifting
the Critical Peak Pricing event window for residential and non-residential customers to the
hours of 4 p.m. to 9 p.m., increasing the maximum number of Critical Peak Pricing events
allowed per year, and providing customer education with a focus on increasing
participation.
• Improved Existing Demand Response Programs: The CPUC ordered modifications to
existing demand response programs to expand participation, including temporarily
allowing year-round enrollment in utility “interruptible programs” that allow for industrial
and large commercial customers to pay a lower rate in exchange for allowing the utility to
curtail their energy usage when energy demand is high and the reliability of the electric
grid is threatened. The CPUC also increased demand response program enrollment
incentives to attract new customers and allow SDG&E to expand and enhance its AC
Saver program by allowing residential net energy metering customers to enroll, as well as

[27]
incentivizing smart thermostat manufacturers to increase the number of participating
thermostats.
• Flex Alert: The CPUC reinstated the Flex Alert paid media program to educate consumers
about the positive impacts of conservation, help customers understand grid conditions, and
inform customers of the need to conserve when energy demand is high.
CAISO is also implementing 2021 summer readiness efforts, proactively working with its partners
and stakeholders to identify challenges and solutions for reliably decarbonizing the grid, and to
raise public awareness about the electricity system needs.33 Among other initiatives, this involves
market enhancements to address:34
1. Export, load, and wheeling priorities;
2. EIM coordination and resource sufficiency test review;
3. Import market incentives during tight system conditions;
4. Real-time scarcity price enhancements;
5. Reliability demand response dispatch and real-time price impacts;
6. Management of storage resources during tight system conditions; and
7. Open Access and Same-Time Information System reporting and interconnection process
enhancements.
33 CAISO 2021 Summer Readiness website: http://www.caiso.com/about/Pages/News/SummerReadiness.aspx#summerstakeholder. 34 CAISO February Summer Readiness Update: http://www.caiso.com/Documents/Presentation-2021SummerReadinessUpdateCall-Feb25-2021.pdf.

[28]
ISO-NE
ISO New England Inc. (ISO-NE) is an independent, non-profit RTO headquartered in Holyoke,
Massachusetts, serving Connecticut, Maine, Massachusetts, New Hampshire, Rhode Island, and
Vermont. ISO-NE was created in 1997 by FERC, as a replacement for the New England Power Pool,
which was created in 1971.
ISO-NE oversees the operation of New England’s bulk electric power system and transmission lines,
including electricity generated and transmitted by its member utilities, as well as by Hydro-Quebec,
NB Power, the New York Power Authority and utilities in New York State, when the need arises.
ISO-NE is responsible for reliably operating New England's 32,000 megawatt [MW] (43,000,000 hp)
bulk electric power generation and transmission system. One of its major duties is to provide tariffs
for the prices, terms, and conditions of the energy supply in New England.
ISO New England's stated mission is to protect the health of New England's economy and the well-
being of its people by ensuring the constant availability of electricity, both today and for future
generations. ISO New England ensures the day-to-day reliable operation of New England's bulk
electric generation and transmission system, oversees the administration of the region's wholesale
electricity markets, and manages comprehensive, regional planning processes.
The ISO-NE grid does not extend to remote parts of eastern and northern Maine in Washington
and Aroostook Counties. In these areas, residents receive their electricity from Canadian providers
such as NB Power and Hydro-Quebec.
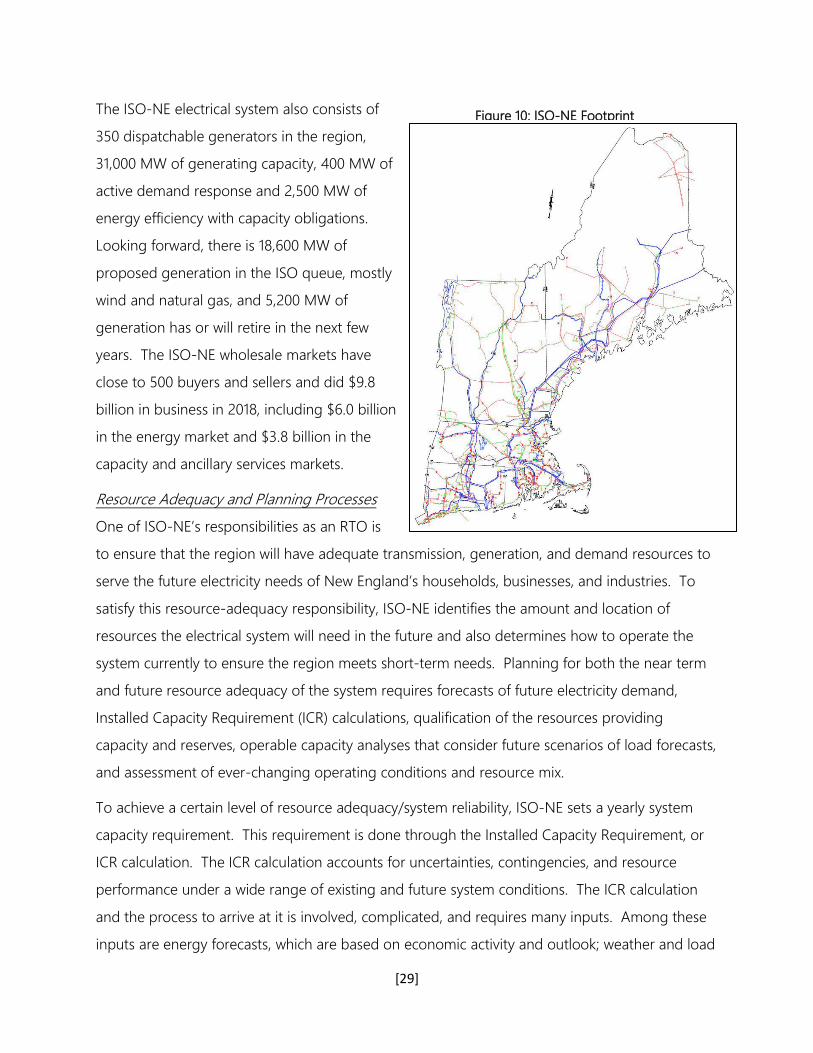
The ISO-NE power grid footprint (Figure 10) consists of 9,000 miles of high-voltage transmission
lines (115 kV and above) and 13 transmission interconnections to power systems in New York and
Eastern Canada. Since 2002, $10.6 billion has been invested in the grid to strengthen transmission
system reliability. In 2018, 17 percent of the region’s energy needs were met by imports.
[29]
The ISO-NE electrical system also consists of
350 dispatchable generators in the region,
31,000 MW of generating capacity, 400 MW of
active demand response and 2,500 MW of
energy efficiency with capacity obligations.
Looking forward, there is 18,600 MW of
proposed generation in the ISO queue, mostly
wind and natural gas, and 5,200 MW of
generation has or will retire in the next few
years. The ISO-NE wholesale markets have
close to 500 buyers and sellers and did $9.8
billion in business in 2018, including $6.0 billion
in the energy market and $3.8 billion in the
capacity and ancillary services markets.
Resource Adequacy and Planning Processes
One of ISO-NE’s responsibilities as an RTO is
to ensure that the region will have adequate transmission, generation, and demand resources to
serve the future electricity needs of New England’s households, businesses, and industries. To
satisfy this resource-adequacy responsibility, ISO-NE identifies the amount and location of
resources the electrical system will need in the future and also determines how to operate the
system currently to ensure the region meets short-term needs. Planning for both the near term
and future resource adequacy of the system requires forecasts of future electricity demand,
Installed Capacity Requirement (ICR) calculations, qualification of the resources providing
capacity and reserves, operable capacity analyses that consider future scenarios of load forecasts,
and assessment of ever-changing operating conditions and resource mix.
To achieve a certain level of resource adequacy/system reliability, ISO-NE sets a yearly system
capacity requirement. This requirement is done through the Installed Capacity Requirement, or
ICR calculation. The ICR calculation accounts for uncertainties, contingencies, and resource
performance under a wide range of existing and future system conditions. The ICR calculation
and the process to arrive at it is involved, complicated, and requires many inputs. Among these
inputs are energy forecasts, which are based on economic activity and outlook; weather and load
Figure 10: ISO-NE Footprint

[30]
patterns; residential, industrial, and commercial demand; historical and projected energy
efficiency; distributed generation, especially photovoltaics; and pending or proposed legislation,
regulation, and standards. The ICR calculation also takes into consideration expected demand
reductions as informed by an energy-efficiency forecast, including projected demand response
resources associated with energy efficiency measures and distributed generation.
In short, the ICR is a measure of the installed resources projected to be necessary to meet both
ISO-NE’s and the Northeast Power Coordination Council’s reliability standards for satisfying the
region’s peak demand forecast while maintaining required operating reserves.
For ISO-NE, one of the keys to achieving and maintaining resource adequacy is the Forward
Capacity Market (FCM). This market, through the Forward Capacity Auction (FCA), purchases
capacity obligations three years out and is used to secure the needed level of capacity by
augmenting other market revenues. The ICR is calculated as part of the FCM and used as an
input into the FCA for each capacity commitment period (CCP). In addition, ISO New England
calculates other requirements for New England and its various subregions (capacity zones) to
ensure that all parts of the New England region have adequate reliability. These requirements,
along with ICR, are considered the ICR and Related values and include Hydro-Québec
Interconnection Capability Credits (HQICCs), Net ICR (ICR minus HQICCs), local sourcing
requirement (LSR) for import-constrained capacity zones, maximum capacity limit (MCL) for
export-constrained capacity zones, and marginal reliability impact (MRI) capacity demand curves
for the system and capacity zones.
With these requirements in place, the FCM is the vehicle ISO-NE uses to help ensure resource
adequacy through bids made in the FCA from generators, demand resources, and imports. The
objective is to procure enough capacity to meet New England’s forecasted ICR or demand three
years in advance, provide compensation for the capacity cost of generation, import, or demand
resource, and attract new resources to constrained regions. Every resource that participates in
the FCM needs to be qualified by ISO-NE.
Existing or Emerging Issues or Risks
ISO-NE’s ability to meet resource adequacy efficiently is becoming challenging on several fronts.
These challenges have intensified as flattening electricity demand, resource constraints and
bottlenecks, low natural gas prices, and preferences for non-emitting technologies push less
[31]
efficient power plants to retire or result in redundant resources in the region. These challenges
are driven by market forces, policy clashes, and current market constructs – including low natural
gas prices, constrained winter natural gas supply, economic pressure on dispatchable generation
by low cost (or low variable cost) non-dispatchable generation, and state policy objectives.
Much of the current activity and challenges revolve around efforts to align the market design with
state policy objectives. This activity has led to the development of, and contention over, a number
of market proposals or constructs such as: the minimum offer price rule and a two-step auction
known as the Competitive Auctions with Subsidized Policy Resources; and the winter reliability
program and the Energy Security Improvements (ESI) proposal addressing the need for balancing
resources.

[32]
MISO
Under MISO’s resource adequacy construct, electric utilities, referred to as load-serving entities
(LSEs), are responsible for demonstrating or procuring sufficient resources with oversight by
States and their relevant electric retail regulators. MISO’s resource adequacy construct
recognizes and supports the independent authority of state regulators for resource adequacy.
States have the authority to determine how resource adequacy needs are met by LSEs within
their state and maintain decision-making authority over the amount and types of resources that
are necessary to accomplish these objectives. MISO’s role is to provide transparency and to
support and facilitate shared resource adequacy goals through its processes.
MISO and LSEs ensure the footprint is resource adequate by establishing requirements to meet a
reserve margin above peak load expectations. LSEs demonstrate sufficient resources for the
coming planning year by either a fixed resource adequacy plan or by purchasing from the annual
MISO planning resource auction.35 Reserve margin requirements consider both: (1) a regional
requirement (i.e., the total amount of capacity needed to meet the reliability standard); and (2) a
local requirement (i.e., the amount of the total capacity that must be located within each local
resource zone). MISO works with market participants to establish a planning reserve margin (or
PRM), which defines the quantity of resources required by each LSE above its peak load to
reliably meet demand when considering risk factors such as generator forced outages and
weather uncertainty. MISO’s planning reserve margin is a percentage of the forecast coincident
peak load and is based on a loss-of-load expectation (or LOLE) of 1 day in 10 years. This
percentage is then used to determine how much capacity (in megawatts) each LSE needs to meet
its regional needs. This is how each LSE’s planning reserve margin requirement (or PRMR) is
established.
The locational component of MISO’s resource adequacy construct is addressed through the
identification of local resource zones, which are then used to define local resource requirements
throughout the footprint. For each of these zones, a local clearing requirement is defined and
accounts for limits on the transmission system’s ability to reliably import capacity from other
zones to ensure sufficient resources are available within each zone to meet its demand at non-
coincident peak conditions.
35 See, e.g., MISO’s Resource Adequacy Tariff provisions, Module E-1.
[33]
MISO determines the capacity value of resources using different methods. Under the current
annual construct, most resources are accredited using unforced capacity based on a rolling
three-year equivalent demand forced outage rate that excludes causes outside of management
control, planned outages, and de-rates. Wind resources are accredited using annual system-
wide Effective Load Carrying Capacity (ELCC) analysis and allocating a value to individual wind
resources based on their performance over the 8 highest gross peaks in the prior 15 years.
Demand resources are accredited based on adding transmission losses and the load’s share of
the planning reserve margin requirement to their verified curtailment capacity with a recent
enhancement in 2020 to better align demand resource accreditation with availability by reflecting
number of calls and lead-time attributes. All resources must demonstrate their effective
deliverability in order to achieve their full accredited value.
For LSEs that choose to demonstrate their resource adequacy by voluntarily participating in
MISO’s annual planning resource auction, the auction is conducted each April for the planning
year that starts the subsequent June 1. The auction selects the least-cost set of planning
resources necessary to meet both regional and local requirements for each locational resource
zone, considering transmission limits, to provide price signals that reflect the location of
resources. For LSEs that choose not to use the auction process, they may demonstrate resource
adequacy through submission of a fixed resource adequacy plan or paying a capacity deficiency
charge to “buy out” of their obligations. Owing to the largely vertically integrated nature of
MISO and state resource adequacy processes, a significant portion of the total regional
requirements are met through fixed resource adequacy plans and self-schedules (e.g., 95 percent
in the 2020/21 Planning Year). Hence, MISO’s auction is often described as a “residual auction.”
In addition, MISO partners with the Organization of MISO States (OMS) to conduct a survey to
provide a view into the region’s supply and demand balance in future years. The results of each
annual OMS-MISO survey reflect a 5-year point-in-time forecasted range of supply/demand
balance outcomes that may occur based on potential actions taken by MISO states, LSEs, and
independent resources owners to retire, suspend, or build generation resources.
Emerging Issues
Each year, there are significant changes to the resource portfolio that MISO and its members rely
on to maintain reliable operations. MISO has experienced heightened risk of capacity

[34]
insufficiency in all seasons. General trends recently have included additional retirements of
dispatchable fossil fuel resources in MISO and growing reliance on renewable generation, energy
market imports, and emergency-only demand response. It is becoming increasingly difficult and
complex for any given LSE or state to gauge the reliability impacts of their plans on the region
and for MISO to ensure regional capabilities are sufficient.
Since 2017, MISO has been working to better align capacity and planning requirements with
operations. Early efforts focused on improving situational awareness by improving transparency
and refining resource availability requirements. Now MISO is working with stakeholders to
design a resource adequacy construct that increases granularity from a summer-based annual
construct to a seasonal construct so that MISO can better account for and mitigate availability
risks that occur throughout the year. Enhanced loss-of-load-expectation modeling methods are
being used to better reflect seasonality of resources in developing seasonal requirements. If
approved, accreditation methods would be revised to reflect resource availability when MISO
needs it the most within seasons. The auction process would also be modified to align with the
seasonal approach, combined with seasonal day-ahead performance obligations to enable
flexibility of seasonal operations of resources.
Many factors impact resources’ availability and the ability to accurately forecast availability,
especially with the increasing complexity of the evolving resource portfolio. Realizing this
limitation, MISO is pursuing improvements to pair improved loss-of-load-expectation modelling
assumptions with resource accreditation that is based primarily on historical availability during
times of greatest need. Under a current MISO proposal, a resource’s accreditation would be
based primarily on its real-time offers during identified resource adequacy hours in the same
season, averaged across the previous three years. This approach creates incentives for resources
to be available when needed the most.

[35]
PJM
PJM Interconnection, LLC, is an RTO and balancing authority that serves all or parts of Delaware,
the District of Columbia, Illinois, Indiana, Kentucky, Maryland, Michigan, New Jersey, North
Carolina, Ohio, Pennsylvania, Tennessee, Virginia, and West Virginia. Some electric utilities in
PJM are restructured (that is, subject to retail competition), whereas others are vertically
integrated. PJM’s peak load in 2020 was 144,266 megawatts on July 20.
Based on the forecasted demand of its utilities and competitive providers that serve customer
load (collectively, “load-serving entities”), PJM conducts day-ahead energy auctions to select and
commit adequate resources to provide energy to the electric grid for the following day. Follow-
up spot energy auctions are then conducted to dispatch the most economic energy needed to
reliably balance actual load in real time. All resources with bids at or below the energy clearing
price receive the clearing price. Figure 11 illustrates that the quantity and type of resources
economically dispatched in PJM’s energy markets changes during the day.36
Figure 11. PJM Hourly Energy Illustration
36 See, e.g., PJM’s Operating Agreement, Schedule 1. For the subjects discussed in this summary document, PJM’s governing documents contain many technical details that are necessarily omitted herein. The source for all pictures in this section is PJM, which has provided permission for their use.
[36]
In addition, to ensure enough resources bid into its energy market to satisfy the demand of its
region, PJM uses a centralized capacity auction coupled with the option for load serving entities
to remove themselves from the auction process. The process and requirements for the capacity
auction37 and the opt-out38 are approved and regulated by FERC.
Reliability Pricing Model Auctions
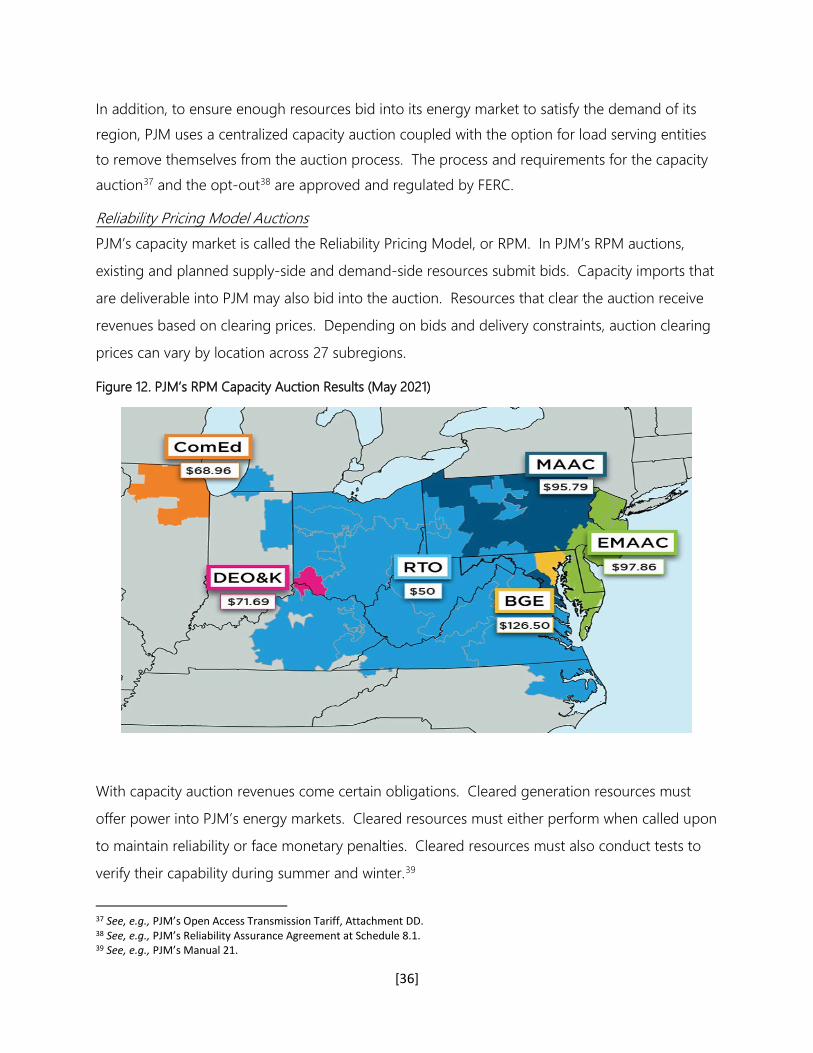
PJM’s capacity market is called the Reliability Pricing Model, or RPM. In PJM’s RPM auctions,
existing and planned supply-side and demand-side resources submit bids. Capacity imports that
are deliverable into PJM may also bid into the auction. Resources that clear the auction receive
revenues based on clearing prices. Depending on bids and delivery constraints, auction clearing
prices can vary by location across 27 subregions.
Figure 12. PJM’s RPM Capacity Auction Results (May 2021)
With capacity auction revenues come certain obligations. Cleared generation resources must
offer power into PJM’s energy markets. Cleared resources must either perform when called upon
to maintain reliability or face monetary penalties. Cleared resources must also conduct tests to
verify their capability during summer and winter.39
37 See, e.g., PJM’s Open Access Transmission Tariff, Attachment DD. 38 See, e.g., PJM’s Reliability Assurance Agreement at Schedule 8.1. 39 See, e.g., PJM’s Manual 21.
[37]
PJM’s auctions are run annually to procure capacity requirements for all load in the footprint that
is not removed through the opt-out process. Capacity commitments for cleared resources are
for the year that begins three years after the auction. In the three years between the auction and
the committed year, other auctions also are conducted to allow load serving entities to make
incremental capacity sales or purchases.
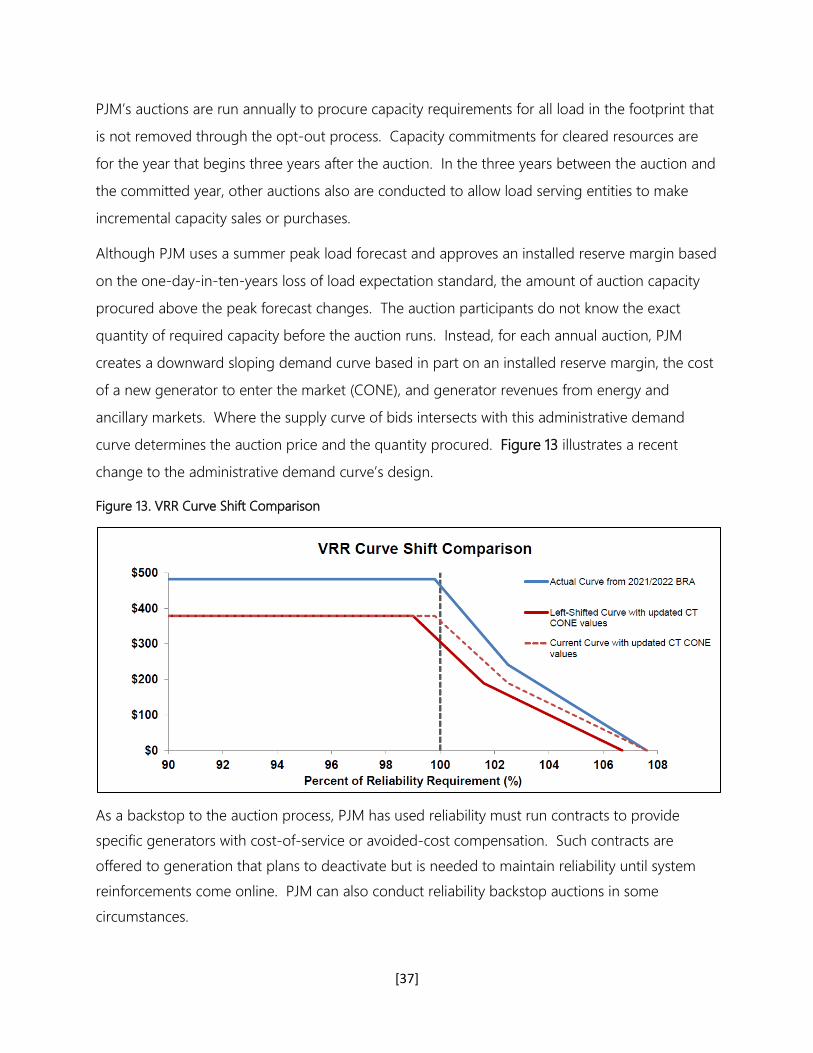
Although PJM uses a summer peak load forecast and approves an installed reserve margin based
on the one-day-in-ten-years loss of load expectation standard, the amount of auction capacity
procured above the peak forecast changes. The auction participants do not know the exact
quantity of required capacity before the auction runs. Instead, for each annual auction, PJM
creates a downward sloping demand curve based in part on an installed reserve margin, the cost
of a new generator to enter the market (CONE), and generator revenues from energy and
ancillary markets. Where the supply curve of bids intersects with this administrative demand
curve determines the auction price and the quantity procured. Figure 13 illustrates a recent
change to the administrative demand curve’s design.
Figure 13. VRR Curve Shift Comparison
As a backstop to the auction process, PJM has used reliability must run contracts to provide
specific generators with cost-of-service or avoided-cost compensation. Such contracts are
offered to generation that plans to deactivate but is needed to maintain reliability until system
reinforcements come online. PJM can also conduct reliability backstop auctions in some
circumstances.

[38]
Auction Opt-Out: the Fixed Resource Requirement
To opt out of PJM’s RPM auction process, a load-serving entity may use a Fixed Resource
Requirement, or FRR, plan. Under this alternative, the load-serving entity must demonstrate to
PJM that it has enough resources to cover all its projected load plus a reserve requirement. For
its opt-out plan, the FRR entity can use resources that are owned or contracted, existing or
planned, supply-side or demand-side. Like auction-cleared resources, resources included in an
opt-out plan are also subject to monetary penalties if they fail to perform when called on to
maintain reliability.
By electing to opt out, an FRR entity removes its entire load and the specified resources from
PJM’s capacity market auctions. However, an FRR entity and the resources in its plan continue to
participate in other PJM markets. Such an entity may return to the auction process after five
years.

[39]
Capacity Value
For RPM auctions and the FRR opt-out, PJM determines the capacity values of generation based
on the unforced capacity of a resource. For most types of generation, PJM uses a test of the
unit’s maximum summer performance, de-rated by the expected forced outages (or EFORd) of
the unit. For wind and solar units, PJM uses historical performance. Table 8 summarizes the
methodologies used for generation and demand-side resources.40
Table 8: Capacity Value Summary
Resource Type Rated Installed Capacity
(ICAP)
Unforced Capacity (UCAP) Conversion
Thermal
(i.e., natural gas, steam-
powered units)
Summer Net Capability
(i.e., maximum
dependable output)
ICAP *(1-EFORd)
Limited Duration* Lesser of Summer Net
Capability or 10-hour
Rule
Same as Thermal Units
Hydro with Storage*/
Other Intermittent*
Summer Net Capability Same as Thermal Units
Demand Response/
Energy Efficiency
Nominated Value Nominated Value* (1 + The Forecasted
Pool Requirement)
Wind & Solar* N/A Historical Performance (368-hour, 3-year
historic performance on the summer
peak)
Emerging Issues
Aspects of PJM’s resource adequacy construct that are under active consideration or in litigation
include administratively established capacity auction bid floors. If resources submit bids below an
applicable bid floor, such bids are administratively adjusted up to the floor. In general, the bid
40 See, e.g., PJM’s Manuals 18 and 21. PJM has proposed replacing the methodologies for the asterisked resources with a statistical model that examines resource contributions to addressing loss of load events. This method is known as the effective load carrying capability (or ELCC), as noted elsewhere.
[40]
floor historically has applied only to new natural gas generation, but FERC recently expanded
such bid floors to more types of resources. This decision currently is on appeal.41
PJM’s capacity auction bid cap rules are also under revision. FERC found PJM’s existing rate
unjust and unreasonable, and established further proceedings to set an appropriate replacement
rate. FERC directed parties to propose alternative methods for market power review and
mitigation in the capacity market.42
Additionally, FERC recently changed – from a historical to a projected basis – the energy and
ancillary market revenues PJM uses to draw the annual auction’s demand curve (described
above).43 PJM has also sought approval of its proposed Effective Load Carrying Capability
methodology, or ELCC, to change how the capacity of variable, limited duration, and
combination resources are valued in the capacity auction and opt-out processes.44
In early 2021, PJM convened capacity market workshops with its stakeholders and FERC
conducted a technical conference on resource adequacy. After PJM’s workshops concluded, the
chairman of the PJM Board of Directors, on behalf of the PJM Board, requested that PJM
stakeholders advance discussions about modifying the capacity auction bid floors through an
accelerated stakeholder process to try and achieve stakeholder consensus in time for PJM to
potentially file proposed changes with FERC by late July.
41 Illinois Commerce Commission et al. v. FERC, No. 20-1645 et al. (7th Cir.). 42 Independent Market Monitor for PJM v. PJM Interconnection, L.L.C., No. EL19-47-00, 174 FERC ¶ 61,212 (Mar. 18, 2021). 43 See, e.g., PJM Interconnection L.L.C., No. EL19-58, 171 FERC ¶ 61,153 (May 21, 2020). 44 See, e.g., PJM Interconnection L.L.C., No. ER21-278 et al., 175 FERC ¶ 61,084 (Apr. 30, 2021). While this order rejected PJM’s proposal because of a proposed transition mechanism, the order also restarted paper hearing procedures on this issue.
[41]
NYISO
The New York Independent System Operator (NYISO), which began operating in 1999, is a not-
for-profit corporation primarily regulated by FERC.45 The NYISO is governed jointly by market
participants and an independent board of directors. The organization’s primary responsibility is
to operate the bulk electric system, administer wholesale electricity markets, and conduct system
planning for the state of New York. The creation of the NYISO resulted in reliability and economic
benefits, as well as improved system efficiency with a shift toward cleaner sources of generation.
The mission of the NYISO, in collaboration with its stakeholders, is to serve the public interest and
provide benefit to consumers by:
• Maintaining and enhancing regional reliability
• Operating open, fair, and competitive wholesale electricity markets
• Planning the power system for the future
• Providing factual information to policymakers, stakeholders, and investors in the power
system
The NYISO is responsible for managing the electricity flow across more than 11,000 miles of high-
voltage transmission lines. This also involves balancing the supply of resources with the demand
needs throughout the state. The NYISO markets must be designed and operated in accordance
with the federal policy of open and non-discriminatory access to the grid.
45 NYISO 2019 Annual Report, p. 6.

[42]
Figure 11: NYISO System Map and Energy Mix (Upstate vs. Downstate)46
Entities Involved in Resource Adequacy and Planning
Processes and standards for system reliability are executed through the NYISO’s coordination
efforts with transmission owners, the New York State Reliability Council (NYSRC), the New York
State Public Service Commission (NYPSC), the Northeast Power Coordinating Council (NPCC), and
NERC.
Capacity Market
In addition to energy and ancillary service markets, the NYISO has an Installed Capacity (ICAP)
market to promote resource adequacy by establishing a forum for the buying and selling of
capacity through competitive auctions. These auctions are conducted on a seasonal and monthly
basis. In this market, buyers act in the interest of the consumers to minimize costs, while suppliers
and investors benefit from transparent locational pricing and signals that reward or penalize
depending on availability and performance. The NYISO planning processes also involve the
development of generator deactivation studies and periodic assessments for both resource
adequacy and transmission system needs to identify reliability risks.
46 NYISO and Grid Reliability, 2021 p. 12. NYISO Power Trends 2020, 2020, p. 9.

[43]
One critical element of the capacity market is the New York State installed reserve margin (IRM),
developed annually by the NYSRC, with input from the NYISO, and subject to final approval from
FERC and the NYPSC. The reserve margin establishes a level of available capacity beyond the
forecasted demand to address extreme weather conditions and other system impacts. Re-
evaluating the reserve margin annually allows for adjustments to reflect changes in demand,
supply, and transmission capability.
Regional Coordination
Importing and exporting energy from neighboring states is an important component of the
NYISO’s resource mix. Access to a larger pool of resources can provide reliability benefits and
strengthen market competition. Accordingly, imports into the New York system must meet
specific market rules that are similar to those for in-state resources.
Planning Criteria
The NYISO uses a probabilistic analysis to evaluate resource adequacy against a 0.1 days per year
loss-of-load expectation (LOLE) criterion. The NYISO also provides significant support to the
NYSRC, which conducts an annual IRM study. This study determines the IRM for the upcoming
capability year (May 1 through April 30) and is used to quantify the capacity required to meet the
NPCC and NYSRC resource adequacy criterion of a LOLE of no greater than 0.1 days per year.
The IRM for the 2020-2021 capability year is 18.9 percent of the forecasted NYCA peak load (all
values in the IRM calculation are based upon full installed capacity values of resources). The IRM
has varied historically between 15 and 18.9 percent.47
Planning Process
The NYISO has a Comprehensive System Planning Process (CSPP) that includes a 10-year needs
forecast, which is developed to allow developers and investors to assess and assume the risks of
investing in new resources needed (Figure 15). Additionally, a reliability assessment is conducted
every two years to examine system needs 10 years into the future. A corresponding Reliability
Needs Assessment (RNA)48 is also developed to address any potential risks (e.g., insufficient
resources, transmission deficiencies) identified in the biennial study. A new 2020–2021 Reliability
Planning Process cycle started in January 2020 with its 2020 RNA, which assesses the system for
resource adequacy and transmission security out to 2030. The 2020 RNA also includes a scenario
that assumes 70 percent renewable energy by 2030.
47 NERC 2020 Long-Term Reliability Assessment, p. 93. 48 NYISO Document Library.

[44]
The NYISO also conducts an annual area review of resource adequacy of New York’s bulk power
system as required by the NPCC. Specifically, a comprehensive review of resource adequacy for
the upcoming five years is required every three years. In the two interim years between these
comprehensive reviews, each Planning Coordinator49 conducts an annual interim review of
resource adequacy that will cover, at a minimum, the remaining years of the five-year period
studied in the comprehensive review of resource adequacy.
Figure 15: The NYISO’s Comprehensive System Planning Process (CSPP)50
The NYISO works with stakeholders and other interested parties to develop the RNA, which sets
the foundation of the Comprehensive Reliability Plan (CRP). The RNA study period examines year
4 through year 10 of a study period (e.g., 2024-2030) to provide the NYISO with adequate time
to respond with additional transmission or generation. The NYISO Board reviews the RNA, along
with any unresolved reliability needs, which are usually address with market-based solutions, or
by designating one or more responsible Transmission Owners (TOs) to develop regulated
backstop solutions. During this process, other interested parties are also invited to propose
alternative solutions.
49 NERC Defines Planning Coordinator in its Functional Model as: “The responsible entity that coordinates and integrates transmission Facilities and service plans, resource plans, and Protection System,” p. 7. 50 2020 Reliability Needs Assessment, p. 7.

[45]
The NYISO’s Reliability Planning Process also provides important information to the market
participants, as well as state and federal policymakers. For informational purposes, this RNA report
reviews activities relating to the status and potential impacts of environmental regulatory
programs, as well as areas of transmission congestion on the system.51
New York Public Service Commission
The NYPSC is the public utilities commission of the state of New York that regulates and oversees
the electric, gas, water, and telecommunication industries.52 Among other authorities, the NYPSC
is responsible for the following, all of which impact resource adequacy:
• Transmission Facilities: The commission must issue a Certificate of Environmental
Compatibility and Public Need prior to the operation and construction of an electric
transmission line — a "major utility transmission facility" — in the state.53
• Generation Facilities: The Siting Board on Electric Generation Siting and the Environment
reviews and certifies projects with proposed capabilities larger than 25 MW.54 A board is
comprised from one member from each of the following: the NYPSC, the Department of
Health, the Department of Environmental Conservation, NYSERDA, and the Empire State
Development Corporation.55
• Reviewing Service Interruptions: The commission is responsible for investigating utility
service disruptions.
Gold Book
The resource adequacy and transmission studies in the RNA are developed using data that is
published annually in the NYISO’s Load & Capacity Data Report, commonly referred to as the “Gold
Book.”56 The Gold Book publishes 30 years of projections for energy and peak forecasts for each
NYISO Load Zone. Generating capacity projections are provided for 10 years ahead. Additionally,
the Gold Book includes:
51 2020 Reliability Needs Assessment, p. 8, https://www.nyiso.com/documents/20142/2248793/2020-RNAReport-Nov2020.pdf/64053a7b-194e-17b0-20fb-f2489dec330d. 52 The department's regulations are compiled in title 16 of the New York Codes, Rules and Regulations and include regulatory authority over 49 electric utilities, as well as some authority over the NYISO. See List of Electric Utilities Regulated by the PSC, https://www3.dps.ny.gov/W/PSCWeb.nsf/All/03627EFC626529EE85257687006F39CD?OpenDocument. 53 This is pursuant to Article VII of the Public Service Law. Part 102 siting may be utilized in cases when electric transmission lines can be built outside of a complete transmission siting process. 54 Siting Board on Electric Generation Siting and the Environment, https://www3.dps.ny.gov/W/PSCWeb.nsf/All/1392EC6DD904BBC285257F4E005BE810?OpenDocument. 55 Article 10 (passed into law by the governor in 2011) provides additional detail on the siting of generation. See Members of the Siting Board on Electric Generation Siting and the Environment, https://www3.dps.ny.gov/W/PSCWeb.nsf/All/12B735036AC1324A85257E200054A993?OpenDocument. 56 NYISO 2021 Load & Capacity Data ("Gold Book"), https://www.nyiso.com/documents/20142/2226333/2021-Gold-Book-Final-Public.pdf/b08606d7-db88-c04b-b260-ab35c300ed64.
[46]
• Historical and forecast seasonal peak demand, energy usage, energy efficiency,
electrification, and other distributed energy resources and load-modifying impacts;
• Existing and proposed generation and other capacity resources; and
• Existing and proposed transmission facilities.
Emerging Issues
The NYISO releases a Power Trends report on an annual basis to identify various factors shaping
New York’s complex electric system. The report also provides important information and
unbiased analysis to examine the current electric system, as well as emerging issues and potential
actions needed to address future risks. Finally, the report offers the NYISO’s perspective on the
electric system in response to current or proposed public policy initiatives that may impact or
accelerate system changes.
The most recent 2020 Power Trends report identified the following emerging issues:
• State of the Grid: The COVID-19 pandemic has added complexity and uncertainty to this
forecasting efforts, with energy consumption levels and patterns that are harder to project.
The NYISO has responded by revising its annual energy consumption forecasts downward.
• Public Policy and the Grid: The NYISO is constantly examining federal, state, and local policy
initiatives and working with stakeholders to modify market rules accordingly.
• Competitive Markets for a Grid in Transition: Competitive wholesale electricity markets
continue to create an incentive-based approach to achieve state policy goals. The NYISO
is actively engaging stakeholders and policymakers to address the ongoing system
changes, including continued deployment of renewable energy, storage, and DERs.
• Planning for a Grid in Transition: To address various public policy goals, the NYISO has
modified planning processes. On the transmission side, the system needs have been
enhanced to address changing flows as new technologies and resource types are added.
The interconnection process also continues to evolve in order to facilitate changes in the
composition of the power grid.
Enhancing Grid Resilience: This includes potential reliability challenges associated with the risk of
fuel disruptions. The NYISO identified these risks through a Fuel & Energy Security Initiative and
will continue to monitor evolving fuel security needs. The NYISO has also developed a
comprehensive program for addressing cyber and physical security risks that builds on existing
standards and guidelines. The NYISO has also established a business continuity model and

[47]
disaster recovery program to safeguard information systems and maintain contingency plans in
the event of an emergency.
SPP
Southwest Power Pool, Inc. (SPP) is
an RTO: a not-for-profit corporation
mandated by the FERC to ensure reliable
supplies of power, adequate transmission
infrastructure and competitive wholesale
electricity prices on behalf of its members.
SPP oversees the bulk electric system and
administers a wholesale power market on
behalf of a diverse group of electric utilities.
SPP manages the electric grid across 17
central and western U.S. states and provides energy services on a contract basis to customers in
both the Eastern and Western Interconnections.
Reliability is SPP’s top priority, and it is intertwined with other functions that collectively support
both reliability and economic benefits. A component of SPP’s operations and reliability functions
is resource adequacy: the program by which it works with load-responsible entities (LREs) to
ensure that they can meet their load obligations.
Entities Involved in Resource Adequacy
LREs are responsible for ensuring they have access to enough generating capacity to meet their
load obligations. They must also satisfy planning reserve margin (PRM) obligations to ensure
available capacity is sufficient to serve load at times of peak demand. They must demonstrate
compliance with these requirements by identifying their owned resources in a submission as
required by SPP’s tariff or by procuring the capacity through bilateral contracts.
Aspects of these resource adequacy requirements (RAR) are defined in SPP’s Open Access
Transmission Tariff, Planning Criteria, and Business Practices. SPP’s bylaws grant its Regional State
Committee (RSC) — made of retail regulatory commissioners in the SPP region — authority to
Figure 12: SPP Service Territory
[48]
determine its approach to resource adequacy. SPP’s board of directors, stakeholders, and staff
all also play a role in the governance path of its resource adequacy program.
Resource Adequacy Overview
An individual LRE’s RAR are equal to its summer-season net peak demand plus its PRM
requirement. If an LRE fails to meet its RAR, SPP will charge them a deficiency payment based on
their capacity shortfall. SPP’s tariff similarly requires LREs to maintain sufficient capacity for the
winter season but does not require a deficiency payment penalty for non-compliance with winter
requirements.
SPP determines its planning reserve margin through a probabilistic loss-of-load expectation
(LOLE) study. The LOLE study calculates SPP’s ability to reliably serve its balancing authority
area’s forecasted peak demand, and it is based on inputs and assumptions SPP develops with
input from stakeholders. SPP performs an LOLE study at least every two years, although it may
do so more often if it determines additional studies are needed. Currently, SPP ensures the
applicable planning year’s LOLE does not exceed one day in 10 years, or 0.1 day per year. SPP
assigns its PRM to every LRE in its balancing authority area and does not apply zonal or local
requirements.
SPP is implementing new accreditation policies for wind, solar and storage resources that will go
into effect in the 2023 summer season. These new policies are based on the Effective Load
Carrying Capacity (ELCC) methodology, which determines accreditation based on historical
performance and capacity value. There is also an effort underway to define a methodology that
accredits conventional resources based on past performance. Demand response resources are
treated as a load reducers, and SPP validates the level of reduction based on requirements
defined in its governing documents.57 All resources must demonstrate that capacity submitted for
resource adequacy is available by meeting the appropriate qualification requirements.
SPP continuously looks to mature its resource adequacy policies, which were first implemented in
2017. This includes, but is not limited to, addressing outages, accreditation, changes in resource
mix, and researching seasonal assessment needs. Due to retirements of conventional resources,
SPP is seeing a decrease in the capacity headroom it has maintained in past years. This is driving
57 SPP Business Practice (Section 8000), SPP Planning Criteria (Section 7.1), SPP Tariff (Attachment AA).
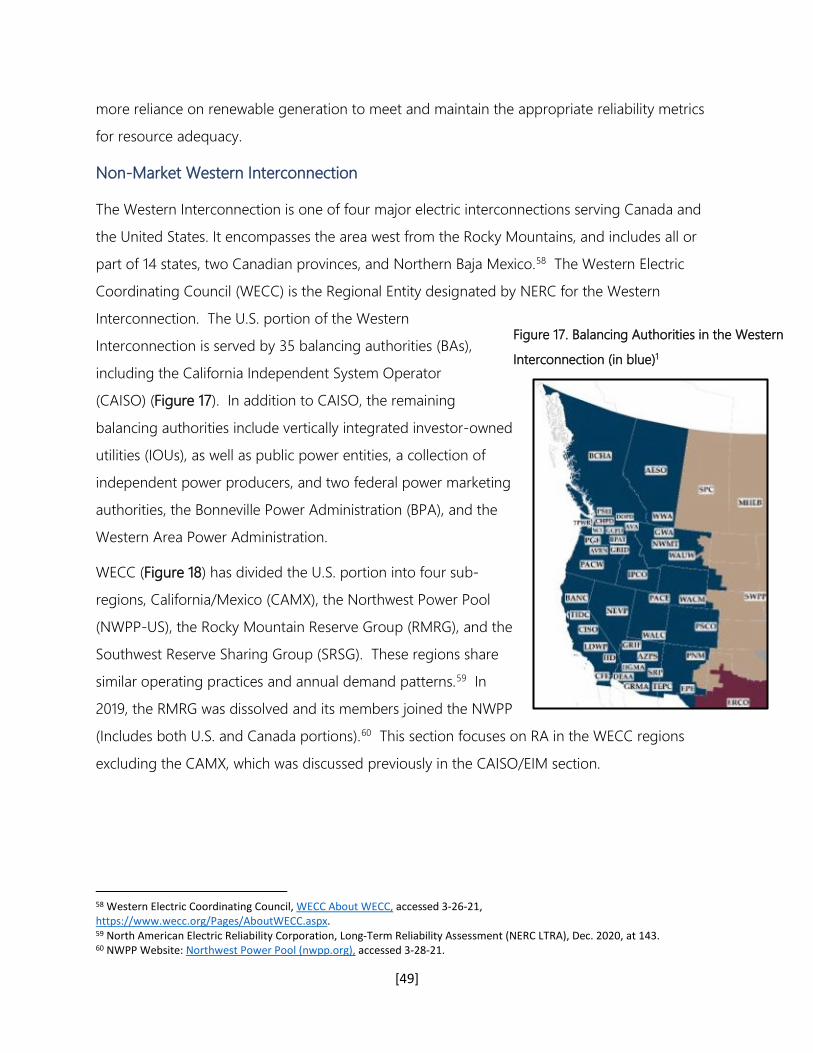
[49]
more reliance on renewable generation to meet and maintain the appropriate reliability metrics
for resource adequacy.
Non-Market Western Interconnection
The Western Interconnection is one of four major electric interconnections serving Canada and
the United States. It encompasses the area west from the Rocky Mountains, and includes all or
part of 14 states, two Canadian provinces, and Northern Baja Mexico.58 The Western Electric
Coordinating Council (WECC) is the Regional Entity designated by NERC for the Western
Interconnection. The U.S. portion of the Western
Interconnection is served by 35 balancing authorities (BAs),
including the California Independent System Operator
(CAISO) (Figure 17). In addition to CAISO, the remaining
balancing authorities include vertically integrated investor-owned
utilities (IOUs), as well as public power entities, a collection of
independent power producers, and two federal power marketing
authorities, the Bonneville Power Administration (BPA), and the
Western Area Power Administration.
WECC (Figure 18) has divided the U.S. portion into four sub-
regions, California/Mexico (CAMX), the Northwest Power Pool
(NWPP-US), the Rocky Mountain Reserve Group (RMRG), and the
Southwest Reserve Sharing Group (SRSG). These regions share
similar operating practices and annual demand patterns.59 In
2019, the RMRG was dissolved and its members joined the NWPP
(Includes both U.S. and Canada portions).60 This section focuses on RA in the WECC regions
excluding the CAMX, which was discussed previously in the CAISO/EIM section.
58 Western Electric Coordinating Council, WECC About WECC, accessed 3-26-21, https://www.wecc.org/Pages/AboutWECC.aspx. 59 North American Electric Reliability Corporation, Long-Term Reliability Assessment (NERC LTRA), Dec. 2020, at 143. 60 NWPP Website: Northwest Power Pool (nwpp.org), accessed 3-28-21.
Figure 17. Balancing Authorities in the Western
Interconnection (in blue)1

[50]
Resource Adequacy and Planning Processes
Outside of California, there is no single or common RA
standard or process for BAs in the WECC: states in the non-
California WECC regions are responsible for determining the
RA standard or method for jurisdictional utilities, and many
state commissions choose to allow each utility to
independently establish its RA method through integrated
resource plans (IRPs) or other planning or modelling
processes.61 Depending on its statutory authority, the state
commission may approve or simply acknowledge the IRP,
and thus the RA methodology, of a utility.62
Under state IRP processes, utilities develop 20-year plans
every two to four years, and engage in stakeholder processes to discuss forecasting, modeling
and analysis of demand, resources, and the utilities’ preferred portfolio over the next 10-20 years,
including consideration of any specific state-mandated analysis. IRP stakeholders include
commission staff; residential, commercial and industrial customer advocates; environmental
advocates; and interested citizens.
Utility BAs generally meet their resource needs through owned generation, bilateral contracts,
and short-term firm market purchases, or Front Office Transactions (FOTs) for physical power.
Many utilities currently rely on FOTs to meet a portion of their peak load, and IRPs identify the
volume of short-term purchases on which the utility relies.63
In addition to RA analyses and planning conducted by utilities and other BAs, several
organizations in the West conduct RA analyses, but have no authority to require BAs to
61 Some state public utility commissions have authority only over IOUs, whereas other states do have jurisdiction over publicly owned utilities. 62 For example, in Washington state, the Washington Utilities and Transportation Commission, which only has jurisdiction over IOUs, does not approve, but only acknowledges an electric IOU’s IRP. Revised Code of Washington (RCW) 19.280.040. 63 Resource Adequacy in the Pacific Northwest, Energy & Environmental Economics (E3 Study), March 2019, at 7; Florio, Mike, Sharing Power Among the Pacific Coast States, published by Gridworks, Jan. 2018 (Gridworks), at 4.
Figure 18: WECC Regions
[51]
incorporate their findings and analyses.64 The Northwest Power and Conservation Council
(Council), an organization created by the 1980 Northwest Power Act, prepares a regional power
plan covering the four-state region of the Columbia River Basin – Montana, Idaho, Oregon and
Washington. The Council must prepare a 20-year plan every five years, but conducts an RA
analysis annually.65 The Pacific Northwest Utilities Conference Committee (PNUCC), a committee
of investor-owned and consumer-owned utilities and independent power producers, develops a
Northwest Regional Forecast, which includes an analysis of RA studies prepared in the region,
and works with the Council’s Resource Adequacy Committee.66 Finally, WECC also conducts an
RA analysis of each of four sub-regions, and recently produced a Western Assessment of
Resource Adequacy to complement NERC’s Long-Term Reliability Assessment.67
The Northwest Power Pool (NWPP) provides a number of services to its members across the
NWPP-US region, but both the NWPP and the Southwest Reserve Sharing Group are NERC
registered entities whose members or participants share contingency reserves to maximize
generator dispatch efficiency.68 69 Although contingency reserve programs do not constitute an
RA plan or process, sharing contingency reserves reduces the costs of compliance with certain
NERC balancing standards, and increases reliability across the Western Interconnection. Recently,
many of NWPP’s members have joined together to form a Resource Adequacy Program,
discussed more fully below.
Planning Processes
Utilities in the non-CAISO WECC regions use a variety of methods to establish RA targets and to
set planning reserve margins (PRM).70 Their methods generally fall into one of two methods;
deterministic or probabilistic.
64 Carvallo, Zhang, Leibowicz, Carr, Galbraith and Larsen, Implications of a Resource Adequacy Program on Utility Integrated Resource Planning, Lawrence Berkeley National Laboratory, Nov. 2020 (LBNL Study) at 6-7. 65 Northwest Power and Conservation Council Website: About | Northwest Power and Conservation Council (nwcouncil.org), accessed on 3-28-21. 66 PNUCC Website: Member Agenda – Pacific Northwest Utilities Conference Committee (pnucc.org), accessed on 3-28-21, https://www.pnucc.org/about-pnucc/work-plan/. 67 WECC, Western Assessment of Resource Adequacy Report (WARA), Dec. 18, 2020. 68 NWPP Website: Northwest Power Pool, accessed 3-28-21, https://www.nwpp.org/about/purpose/. 69 SRSG Website: HOME | srsg, accessed 3-28-21, https://www.srsg.org/. 70 Gridworks, at 4; LBNL Study at 9; Exploring a Resource Adequacy Program for the Pacific Northwest, Energy & Environmental Economics, prepared for Northwest Power Pool, Published December 2019 (RA Program Study), at 17-18: Northwest Power Pool, accessed 3-29-21, https://www.nwpp.org/resources/?page=2&.
[52]
Deterministic methods plan for the single peak hour and add a fixed PRM to the generation
necessary to meet the peak hour. Deterministic PRM standards are based on historical and
expected loads and resources at peak.71 Most deterministic PRMs run from 13 to 17 percent of
total peak generation need.
The probabilistic method is somewhat more common than the deterministic method. The
probabilistic approach includes variations in load, generation performance and outage
assumptions, weather and other factors in an hourly model that runs thousands of repetitions of
the target year to produce a distribution of outcomes. As necessary, resources are added to the
model to reach the desired RA standard. Most BAs use loss of load probability (LOLP) as the
metric for measuring their RA standard. The Council has adopted a 5 percent LOLP RA criterion,
and many BAs in the NWPP-US region have adopted this standard for setting a target.72
Some utilities are exploring the use of additional metrics in their RA standard. In addition to
LOLP, many utilities are using metrics such as LOLE and expected unserved energy (EUE).73
Unfortunately, because there is no agreed upon RA modeling methodology in the non-CAISO
WECC regions, it is often difficult to compare RA targets across utilities, even when BAs use the
same metric, and even more difficult where different planning metrics are used.74
Existing and Emerging Issues
Recent assessments by the Council, WECC, and independent analyses conducted for entities in
the Western Interconnection have identified near- and long-term RA concerns for the region.
Although the West has been long on capacity for years, these assessments found that the region
could become capacity constrained as soon as 2020 or 2021.75 This change is prompted by a
combination of factors: utility reliance on FOTs to meet peak conditions; changes in the electric
resource mix, including the reduction of dispatchable generation in the region (retirement of
71 Gridworks, at 3; WECC WARA at 4; E3 Study at 4-5; LBNL Study at 7-9. 72 Northwest Power and Conservation Council Website: Resource Adequacy | Northwest Power and Conservation Council, accessed 3-28-21, nwcouncil.org. 73 Gridworks at 3; LBNL Study at 7-19; NERC Probabilistic Adequacy and Measures Technical Reference Report, Final, April, 2018. 74 LBNL Study at 9. 75 Gridworks at 4; E3 Study at 36; NWPCC Seventh Power Plan Website: Seventh Power Plan | Northwest Power and Conservation Council (nwcouncil.org) Published Feb. 25, 2016 (accessed 3-29-21); RA Program Study at 19-20.

[53]
coal-fired generation) and growth in solar and wind resources; changes in hydroelectric
generation due to climate change; and increased uncertainty of the shape of demand.76
In response to these studies, the members of the Northwest Power Pool came together in the
summer of 2019 to review the resource adequacy posture of the region and consider next
steps.77 In October 2019, the NWPP members announced their intent to develop a Regional
Resource Adequacy Program.78 Since that time, the NWPP and its members have convened a
steering committee of funding members, a Stakeholder Advisory Committee, and developed a
plan to implement an RA Program by spring 2022.79 In August 2020, the NWPP hired the
Southwest Power Pool, Inc., to serve as the RA Program Developer.80
Under the currently proposed design, the program will measure RA on a collective utility basis to
determine a single RA and then determine each utility’s short- or long-term position. The single
RA standard, determined on a wide-area footprint, should lower each BA’s PRM and allow for the
standardization of capacity products to enable utilities to trade, on a bilateral basis, a common
capacity product. Each BA will need to make a forward showing of sufficient resources to meet
the single RA standard for two binding seasons, summer and winter. The program will monitor
each utility’s RA position from 7 months ahead to the day ahead of the operating day to ensure
that no leaning occurs.81
76 E3 Study, at 1. 77RA Program Study, at 10, 41. 78 NWPP Website/Resources: Northwest Power Pool, nwpp.org.
81 NWPP Resource Adequacy Public Webinar, Jan. 29, 2021: Northwest Power Pool, accessed 4-13-21, nwpp.org.
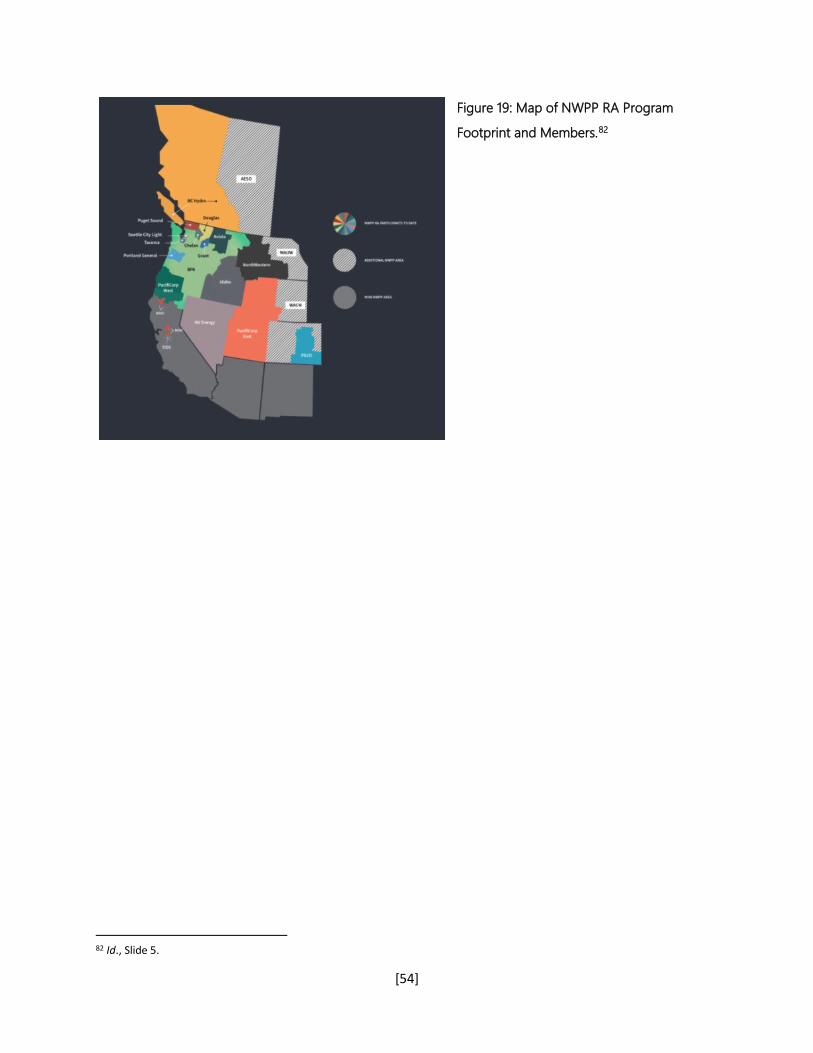
[54]
Figure 19: Map of NWPP RA Program
Footprint and Members.82
82 Id., Slide 5.
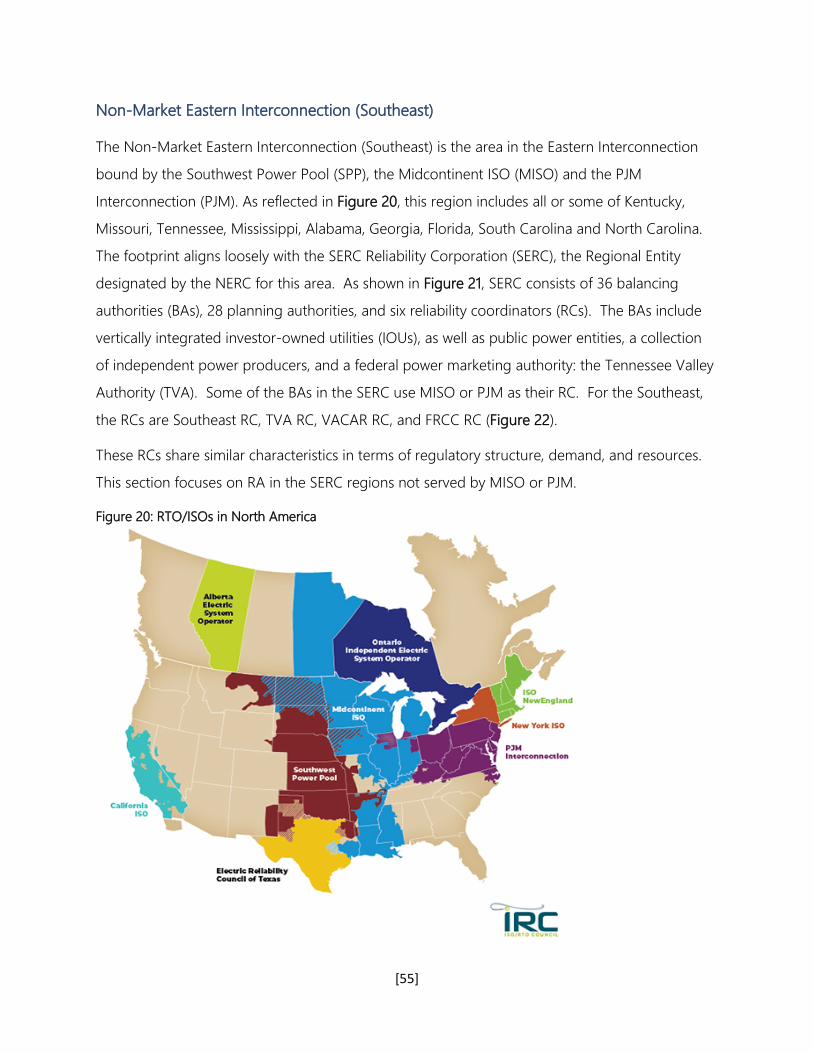
[55]
Non-Market Eastern Interconnection (Southeast)
The Non-Market Eastern Interconnection (Southeast) is the area in the Eastern Interconnection
bound by the Southwest Power Pool (SPP), the Midcontinent ISO (MISO) and the PJM
Interconnection (PJM). As reflected in Figure 20, this region includes all or some of Kentucky,
Missouri, Tennessee, Mississippi, Alabama, Georgia, Florida, South Carolina and North Carolina.
The footprint aligns loosely with the SERC Reliability Corporation (SERC), the Regional Entity
designated by the NERC for this area. As shown in Figure 21, SERC consists of 36 balancing
authorities (BAs), 28 planning authorities, and six reliability coordinators (RCs). The BAs include
vertically integrated investor-owned utilities (IOUs), as well as public power entities, a collection
of independent power producers, and a federal power marketing authority: the Tennessee Valley
Authority (TVA). Some of the BAs in the SERC use MISO or PJM as their RC. For the Southeast,
the RCs are Southeast RC, TVA RC, VACAR RC, and FRCC RC (Figure 22).
These RCs share similar characteristics in terms of regulatory structure, demand, and resources.
This section focuses on RA in the SERC regions not served by MISO or PJM.
Figure 20: RTO/ISOs in North America

[56]
Figure 22: Reliability Coordinators in North America
Figure 21: Reliability Organizations in North America

[57]
Resource Adequacy and Planning Processes
As in the area of the Western Interconnection not served by an organized market, there is no
single or common RA standard or process for BAs in the Southeast. States in this region have
maintained retail jurisdiction and are responsible for determining the RA standard or method for
jurisdictional utilities. Most state commissions allow each jurisdictional utility to independently
establish its RA method through integrated resource plans (IRPs) or other planning or modelling
processes. Depending on its statutory authority, the state commission may approve or simply
acknowledge the IRP, and thus the RA methodology, of a utility. For example, the Kentucky
Public Service Commission (KYPSC) has jurisdiction over both IOUs and rural electric cooperatives
and reviews the utility’s IRPs. The KYPSC receives a staff report with recommendations. Although
the KYPSC does not rule on a utility’s IRP, there are hearings and opportunities for intervention in
these proceedings. In other states, commission jurisdiction may not extend to municipal utilities,
cooperative distribution cooperatives, TVA distribution cooperatives, and/or independent power
producers.
Under state IRP processes, utilities develop multi-year plans every two to four years, and engage
in stakeholder processes to discuss forecasting, modeling and analysis of demand, resources, and
the utilities’ preferred portfolio over the next 10-20 years, including consideration of any specific
state-mandated analysis. IRP stakeholders include commission staff; residential, commercial, and
industrial customer advocates; environmental advocates; and interested citizens.
Utility BAs generally meet their resource needs through owned generation, bilateral contracts,
and Purchase Power Agreements (PPAs) for physical power. Many utilities currently rely on PPAs
to meet a portion of their peak load, and IRPs identify the volume of short-term purchases on
which the utility relies.
In addition to state requirements, other entities weigh in on resource adequacy. TVA has its own
IRP process, which should ensure adequate resources for its direct serve customers and
distribution cooperatives. SERC conducts a RA analysis of each of its four subregions and
produces its yearly resource assessment. SERC uses a target 15 percent planning reserve margin
(PRM) above peak load. For the summer of 2021, for example, all of the subregions in the SERC
region have resources far in excess of the target PRM.
[58]
Planning Processes
Utilities and Bas in the region use a variety of methods to establish RA targets and to set
planning reserve margins. These generally fall into one of two methods: deterministic or
probabilistic. Deterministic methods, such as those used by SERC in its yearly resource
assessment, generally plan for the single peak hour and add a fixed PRM to the generation
necessary to meet the peak hour. Deterministic PRM standards are based on historical and
expected loads and resources at peak. For the subregions in SERC, all have target PRMs of 15
percent.
Individual utilities typically use a probabilistic method in their analysis for the IRPs. The
probabilistic approach includes variations on load, generation performance and outage
assumptions, weather and other factors in an hourly model that runs thousands of repetitions of
the target year to produce a distribution of outcomes. As necessary, resources are added to the
model to reach the desired RA standard. Most BAs use loss of load probability (LOLP) as the
metric for measuring their RA standard. SERC also considers a probabilistic model of resource
adequacy in its yearly assessment and reports any concerns as a part of that process.
Existing and Emerging Issues
As evidenced by the most recent NERC Summer Reliability Assessment, there is not a present
concern about resource adequacy in the non-RTO Southeast, with planning reserve margins for
the subregions easily exceeding 15 percent above peak load target. A number of questions arise
about the impact of policy changes on future resource adequacy in the region. For example, as
utilities and states adopt and move toward a carbon limited future, what does this mean for
reliance upon coal and natural gas generation in meeting resource adequacy standards? What
alternatives are available and how is resource adequacy impacted by integration of more
intermittent resources? Is there transmission sufficient to move the power to the load?

[59]
There is currently a filing pending at FERC to establish a Southeast Energy Exchange Market
(SEEM). As defined in the filing, SEEM would not be an energy market in the same way that
MISO and PJM have energy and capacity markets, or an energy imbalance market like the
Western EIM offered by CAISO or the Western EIS offered by SPP. It is a “bulletin board” that lets
members know that there is available transmission capacity 15 minutes ahead. This proposal has
not been approved by FERC; thus, it would be premature to discuss its impact on resource
adequacy in the SERC region.

[60]
III. Current and Emerging Issues
Measuring Resource Adequacy with an Evolving Resource Mix and Changing Demand
Characteristics
During the last two decades, there have been significant and ongoing changes to the resource
mix and usage patterns on the U.S. power system. These changes have caused consideration,
and in some cases, adoption of additional approaches for assessing resource adequacy to
capture the characteristics of more variable resources (wind and solar generation) on the system,
increased participation of demand-side resources, and more extreme events (weather, supply
interruptions, etc.). During this time, the share of dispatchable generation has decreased
significantly. Additionally, forecasting electricity usage (or demand) has become more
complicated due to changing load profiles, behind-the-meter resources, and increasing
occurrences of extreme weather events. Some have questioned if traditional load forecasting
methods based on historic averages of seasonal extremes capture these trends and the ongoing
electrification of space and water heating.
The evolving resource mix throughout the country – particularly in areas such as California – can
impact the timing of the net peak and create challenges in maintaining system reliability.
Specifically, behind-the-meter and front-of-meter (utility-scale) solar generation tends to decline
at a faster rate than demand decreases. Ensuring that there are sufficient resources available to
serve load during the net peak period and other potential periods of system strain could require
more comprehensive resource adequacy analysis.
NERC introduced a task force in 2014 to develop methods to create Sufficiency Guidelines to
examine system needs for some of these services, including frequency response, generation
ramping, and voltage capabilities. These guidelines established approaches for monitoring and
measuring reliability services and incent planning and mitigation activities to address potential
reliability issues on a timely basis.83
83 Additional information on NERC’s Essential Reliability Services Task Force is available here: https://www.nerc.com/comm/Other/Pages/Essential-Reliability-Services-Task-Force-(ERSTF).aspx.

[61]
Increasing deployment of variable renewables, energy storage, flexible load, hybrid, and other
resources point toward updating resource adequacy assessments, where appropriate. 84 To date,
resource adequacy has focused on adding up supply side capacity (MW), and accounting for
availability, to meet defined system requirements. In the future, the assessment of resource
adequacy may shift to a broader set of metrics, moving from ‘How many MW do we need?’ to
‘What resources do we need to provide the full set of required services under a wide range of
possible futures?’
Enhancements to resource adequacy will be important for policymakers, regulators, and system
planners and operators to consider. This will involve ongoing information sharing efforts
between federal, state, and local jurisdictional that are involved in resource decisions and
corresponding reliability impacts.
The Interplay between Regional and State Planning
The Ongoing Tension between FERC Capacity Market Rules and State Generation Policies
For more than a century, states have enacted and implemented policies to support the
construction and operation of electric generation resources. Some of these policies are broad
(e.g., cost-of-service rates) and some are targeted to specific resource types (e.g., zero emission
credits).
Also longstanding is FERC’s jurisdiction over “the transmission of electric energy in interstate
commerce” and “the sale of electric energy at wholesale in interstate commerce.”85 However, the
emergence of RTOs/ISOs has increased the federal regulatory presence in the electric industry.
With this increasing federal involvement and the enactment of new state policies, many courts
have been asked to resolve disputes about the jurisdictional line between FERC and the states.86
The constitutionality of some state generation policies has been challenged in recent years.
84 Depending on a location’s specific circumstances and needs, elements for consideration could include: modeling chronological
operations; quantifying size, frequency, duration, and timing of relevant metrics; and assessing the capabilities of transmission and
neighboring grids. Additional metrics could examine the value to consumers of the electricity not supplied. 85 16 U.S.C. § 824(b) (1935). 86 See, e.g., New York v. FERC, 535 U.S. 1 (2002).

[62]
Some of these state laws have been upheld as constitutional,87 whereas others have been held
unconstitutional.88
An ongoing issue involves the extent to which FERC can establish wholesale market rules in ways
that negatively impact and potentially frustrate state generation policies. In exercising its
authority over RTO/ISO capacity markets, several recent FERC rulings have changed market rules
in response to state generation policies.89
For example, FERC has found that state policies, to the extent they subsidize resources that
participate in PJM’s capacity markets, are producing unjust and unreasonable wholesale rates by
suppressing auction prices.90 For the stated purpose of protecting the capacity market’s integrity,
FERC expanded the applicability of an auction bid floor from new natural gas generation to
existing and new resources benefitting from state subsidies. Expanding the bid floor’s application
increases the likelihood that generators supported by state policies will not clear an auction and,
consequently, could not be used to satisfy capacity obligations. This FERC decision is on
appeal.91 This issue was also a topic during FERC’s March 23-24, 2021, technical conference on
resource adequacy, and continuing PJM stakeholder discussions.
87 Electric Power Supply Ass’n v. Star, 904 F.3d 518 (7th Cir. 2018), cert. denied 139 S.Ct. 1547 (2019); Coalition for Competitive Electricity v. Zibelman, 906 F.3d 41 (2nd Cir. 2018), cert. denied 139 S.Ct. 1547 (2019). 88 See, e.g., Hughes v. Talen Energy Mktg., 136 S. Ct. 1288 (2016); PPL Energyplus v. Solomon, 766 F.3d 241 (3d Cir. 2014). 89 See, e.g., Calpine Corp. v. PJM Interconnection, L.L.C., 169 FERC ¶ 61,239 (2019); New York Independent System Operator, Inc., 170 FERC ¶ 61,121 (2020). 90 See, e.g., Calpine Corp. v. PJM Interconnection L.L.C., 163 FERC ¶ 61,236 (2018). 91 Illinois Commerce Commission v. FERC, Case No. 20-1645 (7th Cir.) (consolidated with other petitions for review).