Embed Size (px)
Citation preview
A reporting framework for ecosystem-based
assessment of Australian prawn trawl fisheries: a Spencer Gulf prawn trawl fishery case study
S. Mayfield, G.J. Ferguson, R.C. Chick, C.D. Dixon and C. Noell
Final Report to the Fisheries Research and Development Corporation
FRDC Project No. 2011/062
ISBN: 978-1-921563-70-6
December 2014
2
This report may be cited as:
Mayfield, S., Ferguson, G.J., Chick, R.C., Dixon, C.D. and Noell, C. (2014). A
reporting framework for ecosystem-based assessment of Australian prawn trawl
fisheries: a Spencer Gulf prawn trawl fishery case study. Final report to the Fisheries
Research and Development Corporation. Prepared by the South Australian Research
and Development Institute (Aquatic Sciences), Adelaide. FRDC Project No.
2011/062. 74pp.
Date: 12 December 2014
Published by: South Australia Research and Development Institute
© Copyright Fisheries Research and Development Corporation and South Australian
Research and Development Institute, 2014
This work is copyright. Except as permitted under the Copyright Act 1968 (Cth), no
part of this publication may be reproduced by any process, electronic or otherwise,
without the specific written permission of the copyright owners. Information may not
be stored electronically in any form whatsoever without such permission.
Disclaimer
The authors warrant that they have taken all reasonable care in producing this report.
The report has been through the SARDI internal review process, and has been
formally approved for release by the Research Chief, Aquatic Sciences. Although all
reasonable efforts have been made to ensure quality, SARDI does not warrant that
the information in this report is free from errors or omissions. SARDI does not accept
any liability for the contents of this report or for any consequences arising from its
use or any reliance placed upon it. Material presented in these Administrative
Reports may later be published in formal peer-reviewed scientific literature.
The information, opinions and advice contained in this document may not relate, or
be relevant, to a reader’s particular circumstances. Opinions expressed by the
authors are the individual opinions expressed by those persons and are not
necessarily those of the publisher, research provider or the FRDC.
The Fisheries Research and Development Corporation plans, invests in and
manages fisheries research and development throughout Australia. It is a statutory
authority within the portfolio of the federal Minister for Agriculture, Fisheries and
Forestry, jointly funded by the Australian Government and the fishing industry.
ISBN: 978-1-921563-70-6
3
CONTENTS
1 ACKNOWLEDGEMENTS ......................................................................................... 8
2 EXECUTIVE SUMMARY ......................................................................................... 9
3 INTRODUCTION .................................................................................................. 11
3.1 Background ............................................................................................... 11
3.2 Overview of the South Australian Spencer Gulf Prawn Fishery ................. 14
3.2.1 Description of the fishery .................................................................... 14
3.2.2 Legislative framework ........................................................................ 18
3.2.3 Reporting requirements ...................................................................... 19
3.2.4 Current initiatives to reduce ecological impact .................................... 19
3.2.5 Spencer Gulf Environment ................................................................. 21
3.3 Project approach ....................................................................................... 26
4 OBJECTIVES...................................................................................................... 27
5 METHODOLOGY ................................................................................................. 28
5.1 Ecological assessment framework ............................................................ 28
5.2 Spencer Gulf Prawn Fishery case study .................................................... 28
5.2.1 Scope of this study ............................................................................. 29
5.2.2 Data and information sources ............................................................ 30
5.2.3 Data analysis and information synthesis ............................................ 30
6 RESULTS AND DISCUSSION ................................................................................ 34
6.1 Information available for ecological assessment of the SGPF ................ 34
6.2 Implementing ecosystem-based assessment in the SGPF .................... 55
7 CONCLUSION .................................................................................................... 63
8 IMPLICATIONS ................................................................................................... 64
9 RECOMMENDATIONS .......................................................................................... 64
10 FURTHER DEVELOPMENT ................................................................................... 64
11 EXTENSION AND ADOPTION ................................................................................ 65
12 PROJECT MATERIALS DEVELOPED....................................................................... 65
13 APPENDICES ..................................................................................................... 66
13.1 Intellectual property ............................................................................... 66
13.2 Staff ....................................................................................................... 66
13.3 References ............................................................................................ 66
13.4 Report distribution list ............................................................................ 74
4
LIST OF FIGURES
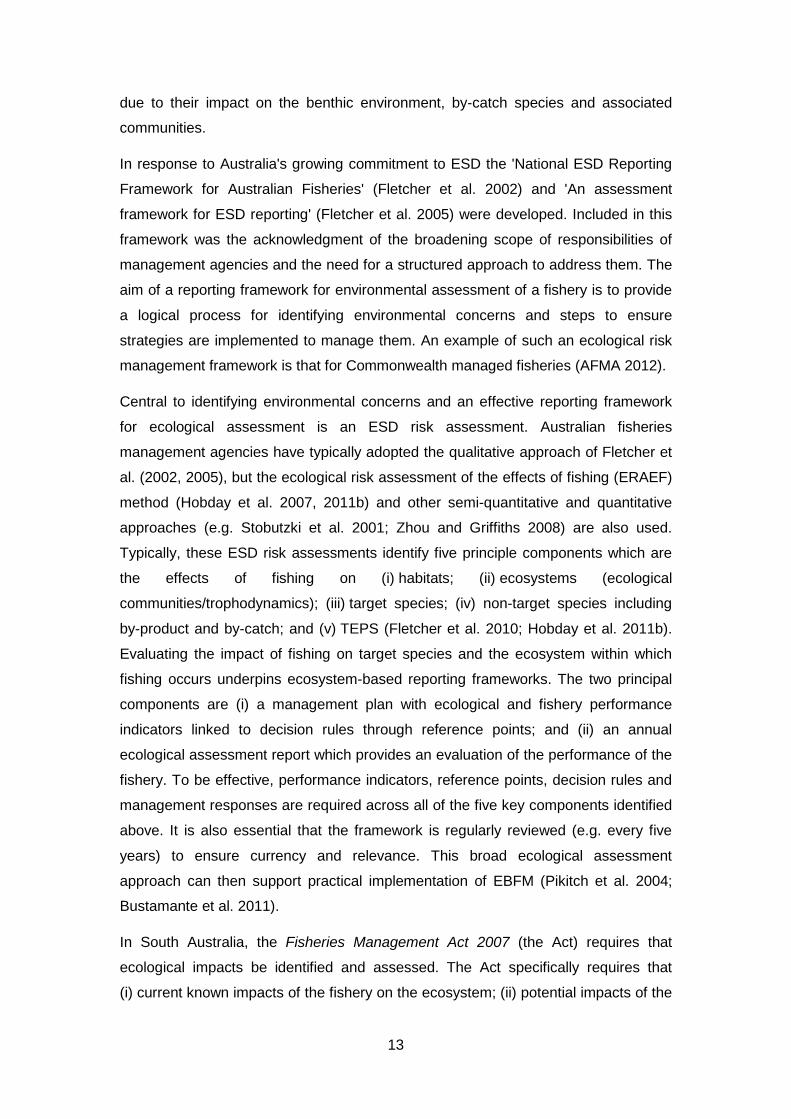
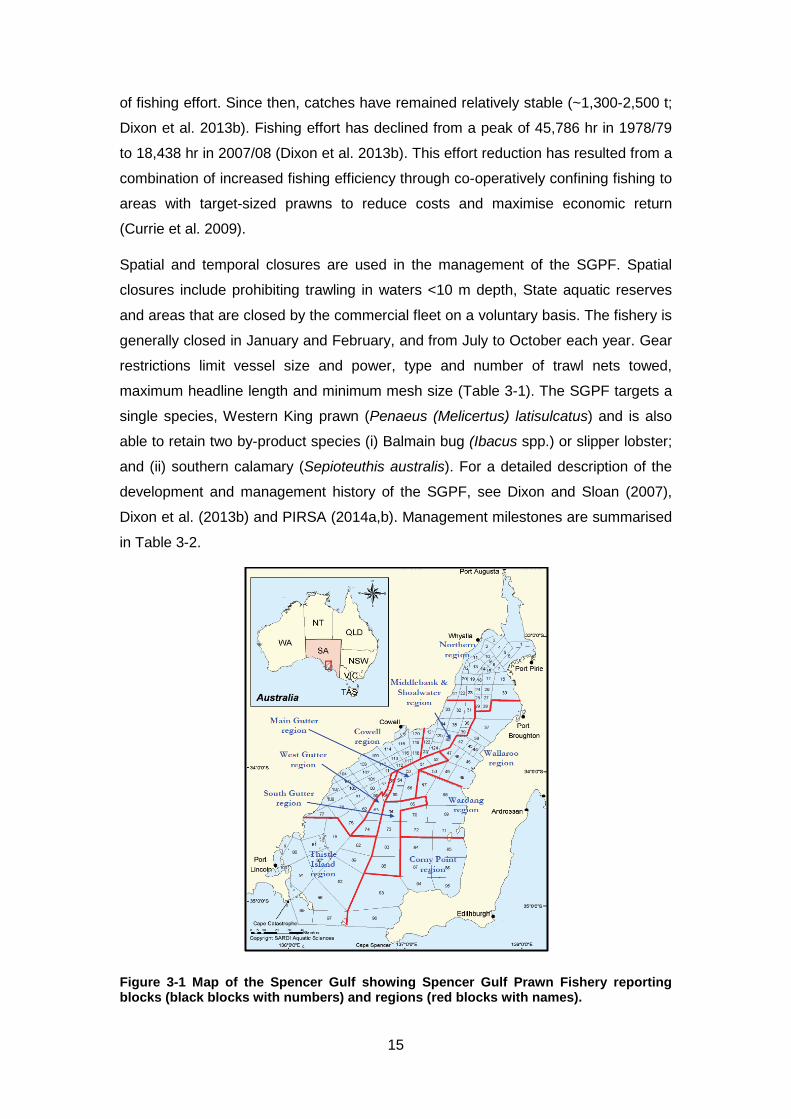
Figure 3-1 Map of the Spencer Gulf showing Spencer Gulf Prawn Fishery reporting blocks (black blocks with numbers) and regions (red blocks with names).
15
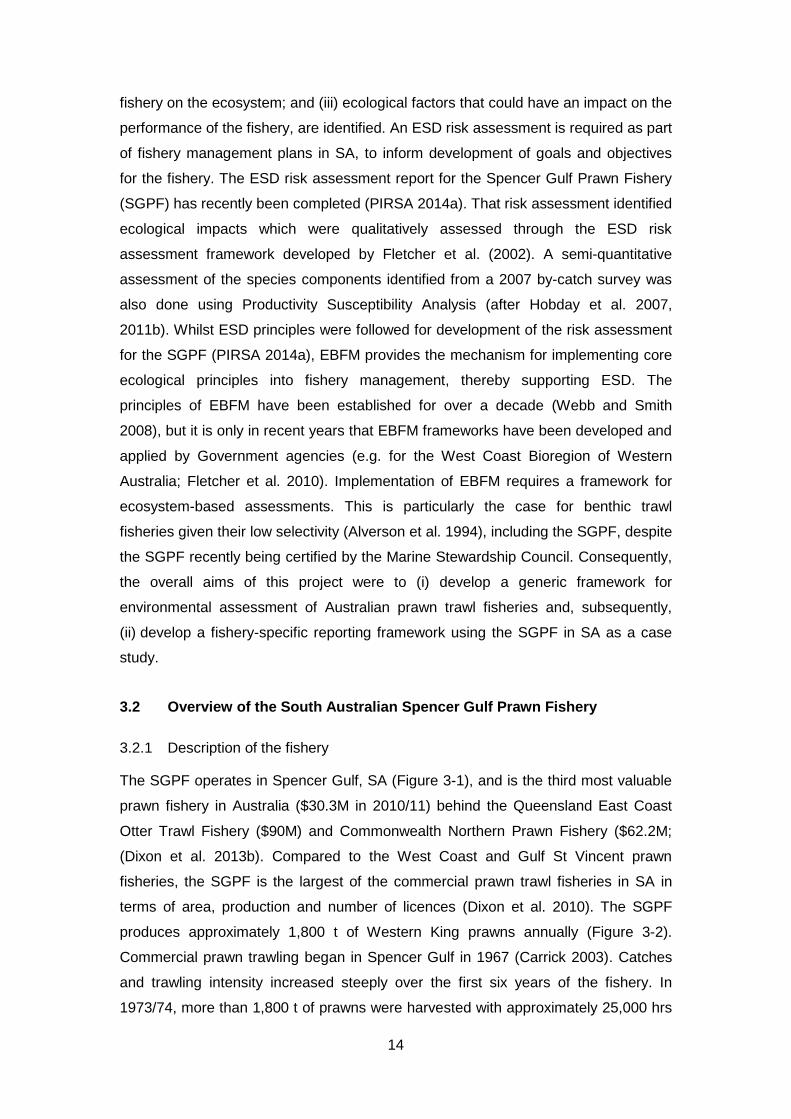
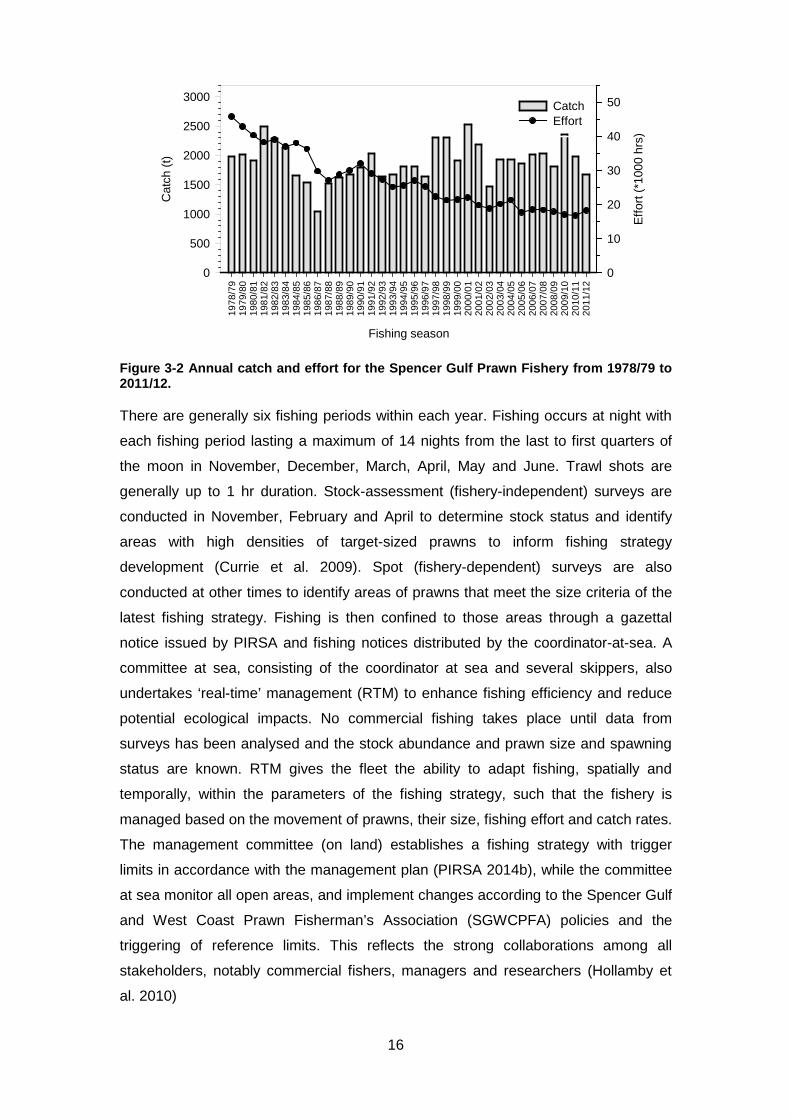
Figure 3-2 Annual catch and effort for the Spencer Gulf Prawn Fishery from 1978/79 to 2011/12.
16
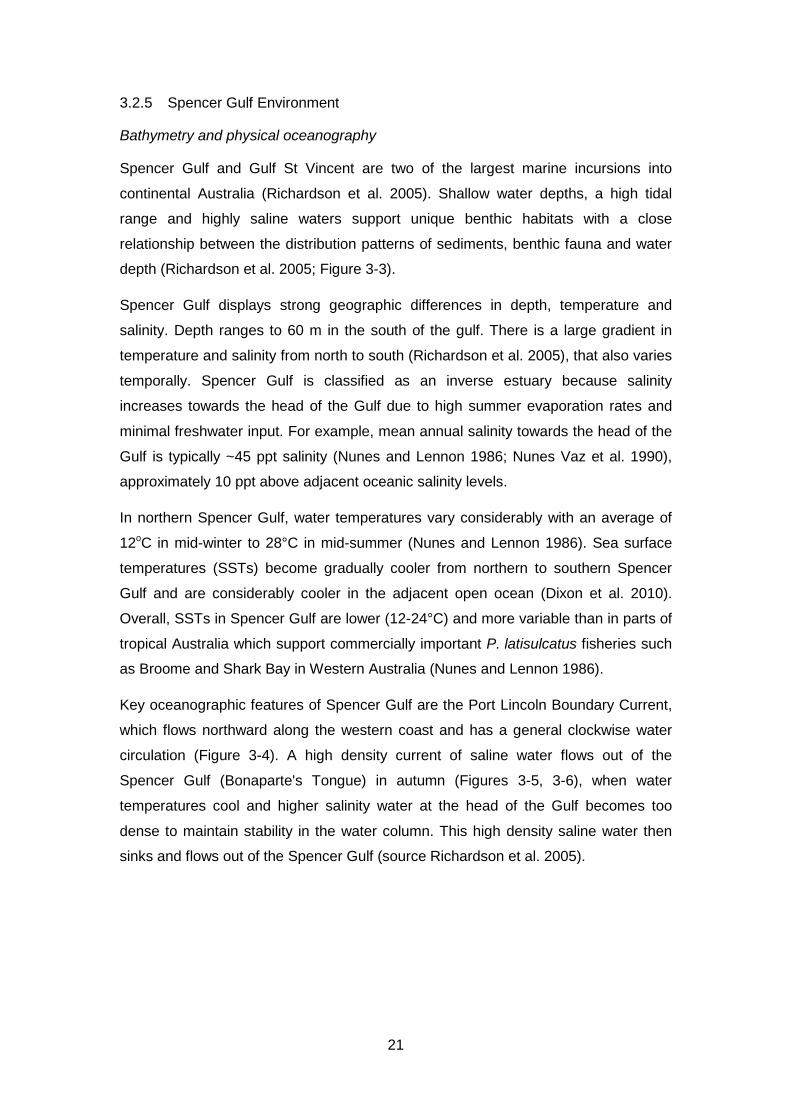
Figure 3-3 Bathymetry of Spencer Gulf (source Richardson et al. 2005, left panel) and average monthly sea surface temperature (SST oC) throughout the Spencer Gulf and Gulf St. Vincent. IS = Investigator Straight; BP = Backstairs Passage, between 2002-2007 (right panels, source: Tanner and Volkman 2009).
22
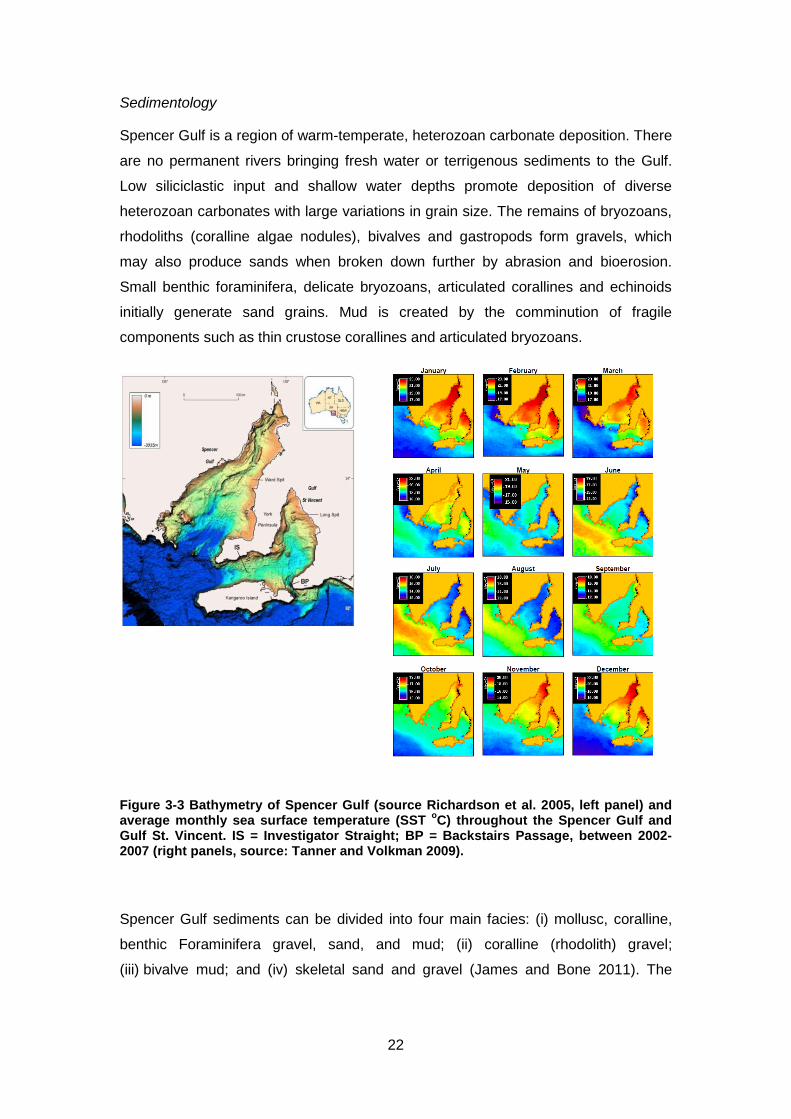
Figure 3-4 Key oceanographic features of Spencer Gulf and Gulf St. Vincent. In Spencer Gulf, light blue arrows (gross net flow) show the Port Lincoln Boundary Current (PLBC) which flows northwards along the western coast and the overall clockwise circulation. Large grey arrow shows high density saline water (Bonaparte’s Tongue) which flows out of Spencer Gulf in the austral autumn (source Richardson et al. 2005).
23
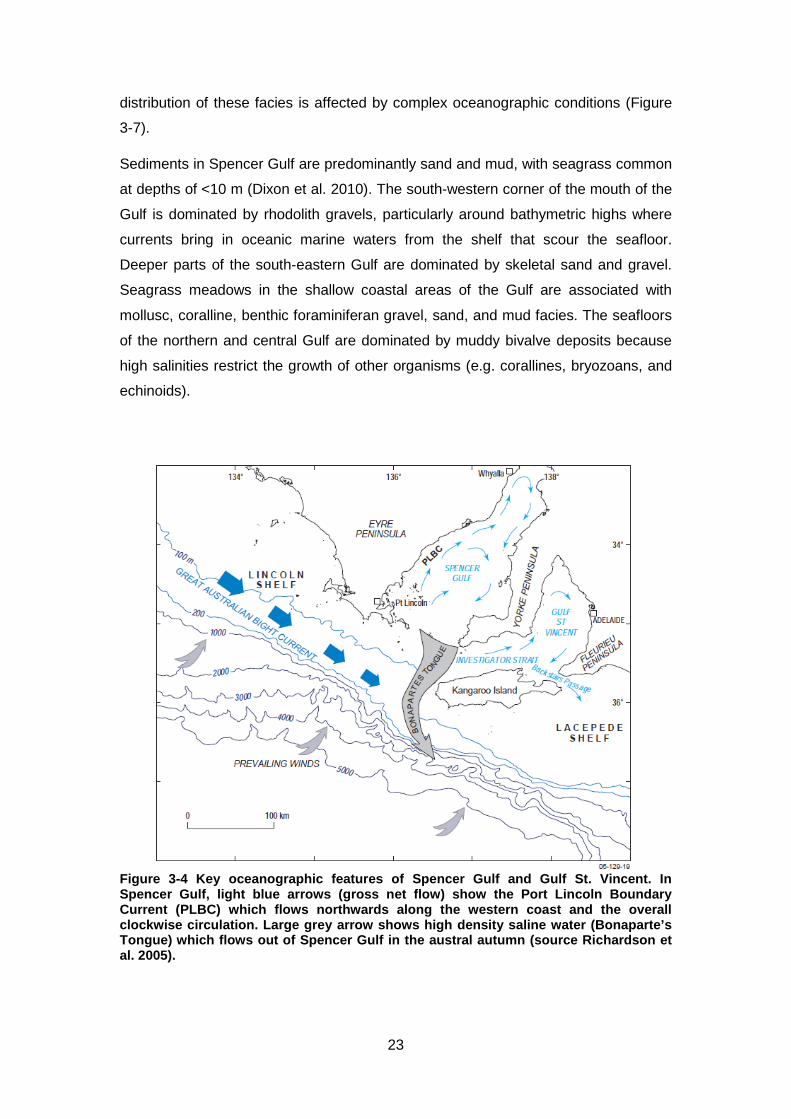
Figure 3-5 Aerial view of isohaline contours (maximum salinity) and Bonaparte's Tongue in southern Spencer Gulf during the austral autumn (source Richardson et al. 2005).
24
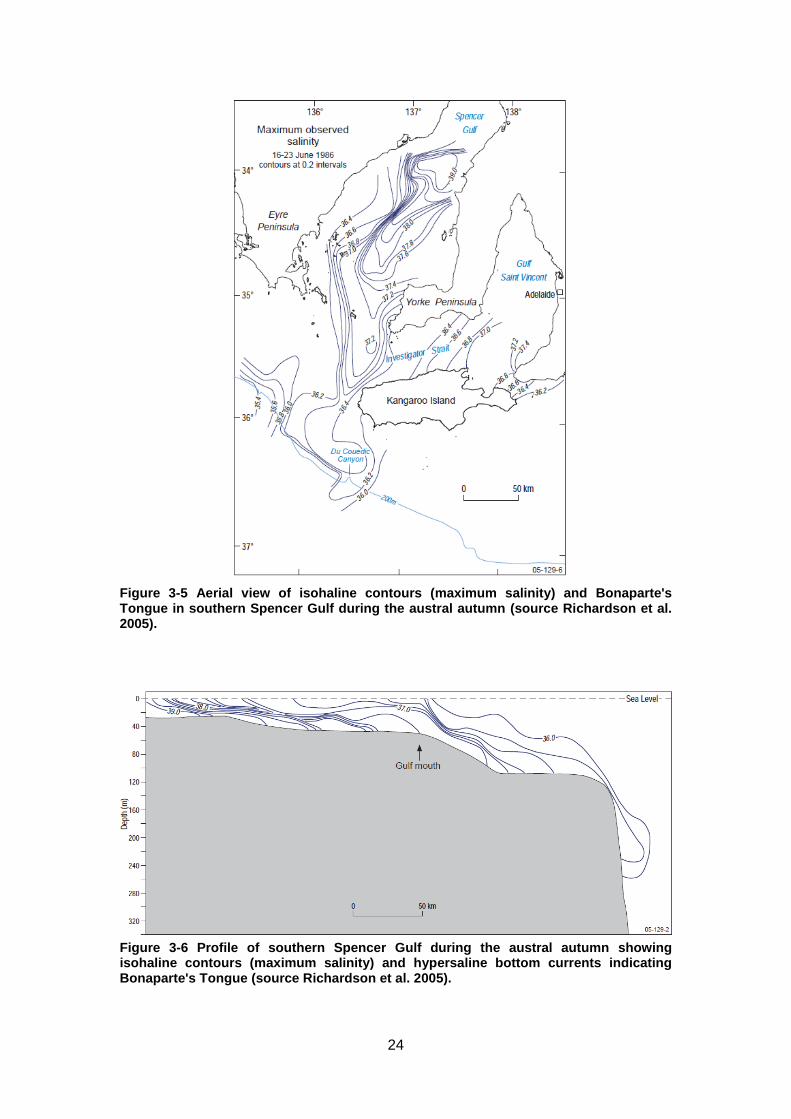
Figure 3-6 Profile of southern Spencer Gulf during the austral autumn showing isohaline contours (maximum salinity) and hypersaline bottom currents indicating Bonaparte's Tongue (source Richardson et al. 2005).
24
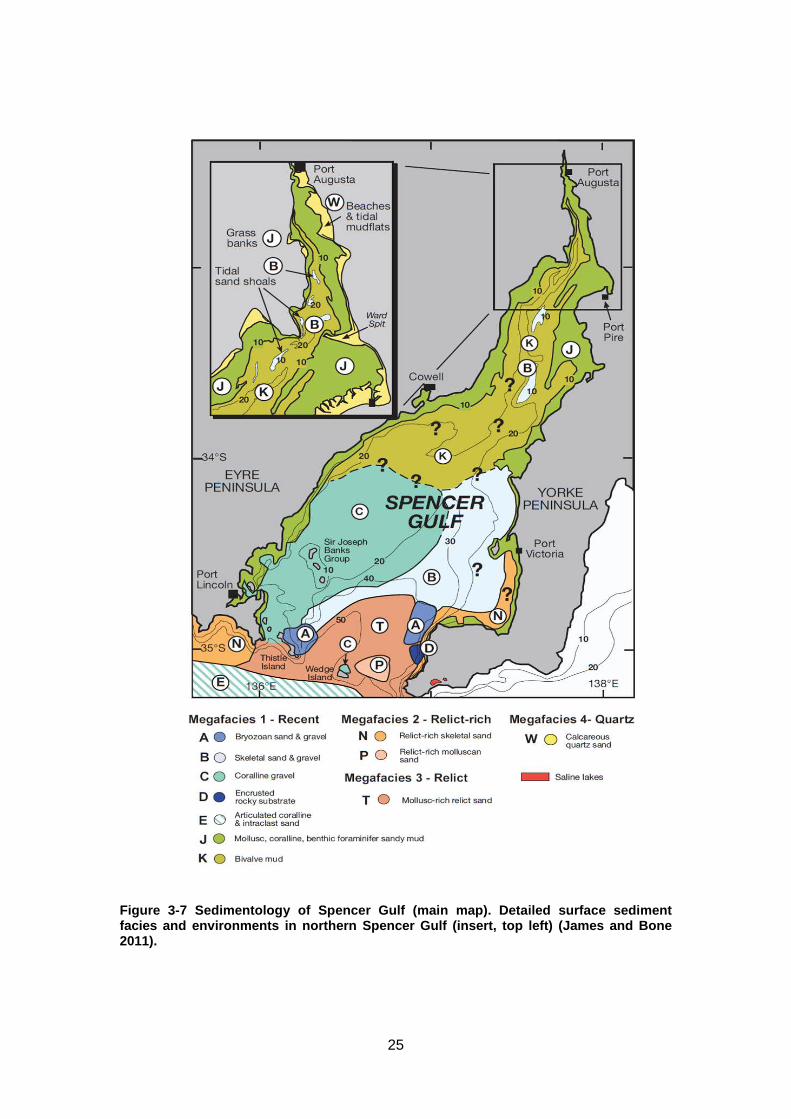
Figure 3-7 Sedimentology of Spencer Gulf (main map). Detailed surface sediment facies and environments in northern Spencer Gulf (insert, top left) (James and Bone 2011).
25
Figure 6-1 Map of Spencer Gulf with annual trawl intensity contours from 2002/03 to 2011/12. Hashed areas represent voluntary closures within the SGPF.
38
Figure 6-2 Map of Spencer Gulf with cumulative trawl intensity contours for three time periods (i) 2002/03-2006/07; (ii) 2007/08-2011/12 and (iii) 2002/03-2011/02. Hashed areas represent voluntary closures within the SGPF.
39
Figure 6-3 Spatial distribution of fishing effort from 1990/91 to 2012/13. COW – Cowell, CPT – Corny Point, GUT – Gutter, MBK – Middle Bank, NTH – North, SGU – South Gutter, THI – Thistle, WAL – Wallaroo, WAR – Wardang and WGU – West Gutter. Refer Figure 3-1 for location.
40
Figure 6-4 Spatial distribution of habitat forming species groups from the 2007 by-catch survey (Currie et al. 2009) overlaid on trawl intensity contours (10-year average trawl intensity, 2002/03 to 2011/12).
43
Figure 6-5 Retained catches of southern calamary by the SGPF from 2002/03 to 2011/12.
48
Figure 6-6 Retained catches of Balmain bug from the SGPF from 2002/03 to 2011/12. Black arrow indicates size limit introduction.
48
Figure 6-7 Distribution and abundance of the by-product species southern calamary (a, top) and Balmain bug (b, bottom) from the by-catch survey in 2007 (Currie et al. 2009) and by-product survey in 2008/09 (Roberts and Steer 2010) overlaid on areas of differing trawl intensities (10-year average trawl intensity, 2002/03 to 2011/12).
49
Figure 6-8 Distribution and abundance of giant cuttlefish, King George whiting and blue 51
5
swimmer crabs from the by-catch survey in 2007 (Currie et al. 2009) overlayed on areas of differing trawl intensities (10-year average trawl intensity, 2002/03 to 2011/12).
Figure 6-9 A. Annual total number of TEPS caught (bars) and the proportion released alive (dashed line) from the SGPF since 2007; B. number of TEPS caught per thousand hours of effort and; C. number of TEPS caught per tonne of reported prawn catch in the SGPF.
52
Figure 6-10 Distribution and total reported number of TEPS (bubble size, total no./trawl shot), in 2009/10, 2010/11 and 2011/12 (Wildlife Interaction Logbooks), overlaid on areas of differing trawl intensity (10-year average trawl intensity, 2002/03 to 2011/12). Note: the number and location of survey sites differs through time.
52
Figure 6-11 Comparison of the standardised catch rate of syngnathid species (all species) across years and months from FI surveys. Error bars represent +/- 1 standard error of the mean.
53
Figure 6-12 FI survey data - Comparison of the standardised catch rate for syngnathid species (all taxa) from FI surveys within Spencer Gulf averaged over three fishing years. Error bars represent +/- 1 standard error of the mean.
53
Figure 6-13 Distribution and abundance of syngnathids in Spencer Gulf from fishery assessment surveys during 2009 to 2012, overlayed on the areas of differing trawl intensity (10-year average trawl intensity, 2002/03 to 2011/12).
54
Figure 6-14 Schematic showing the key components of an ecosystem based reporting framework for the Spencer Gulf Prawn Fishery, including indicative performance indicators and reference points.
62
6
LIST OF TABLES
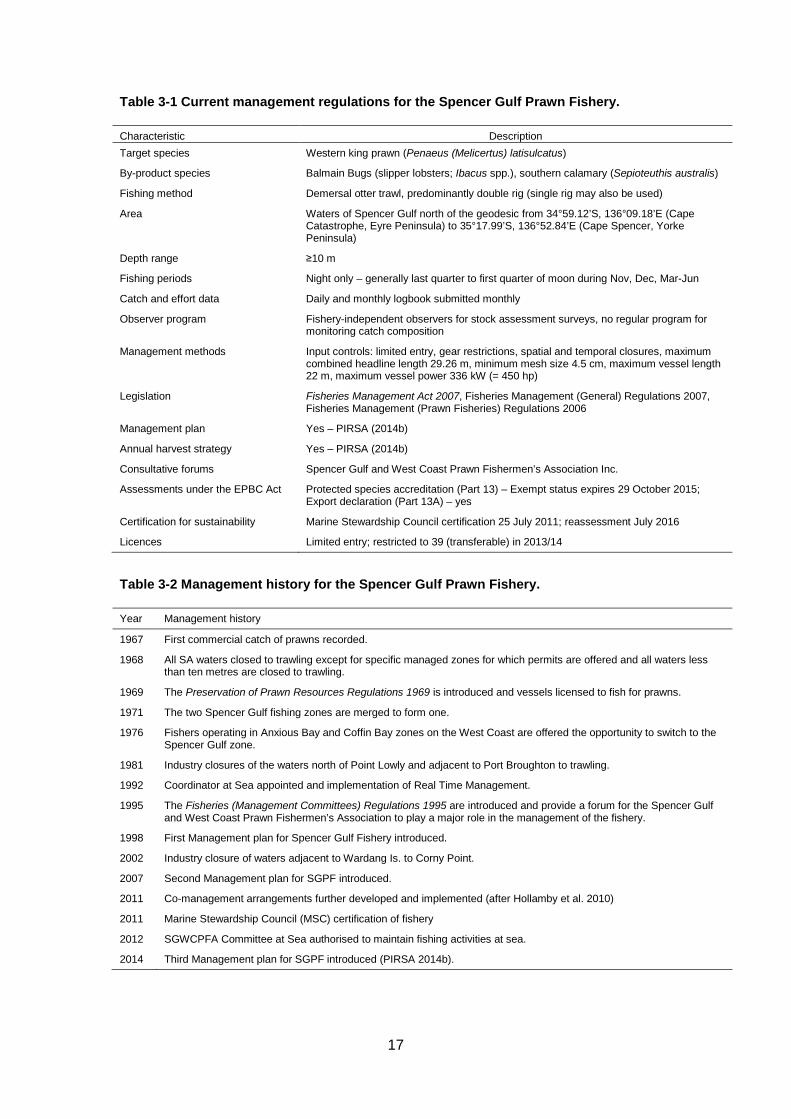
Table 3-1 Current management regulations for the Spencer Gulf Prawn Fishery. 17
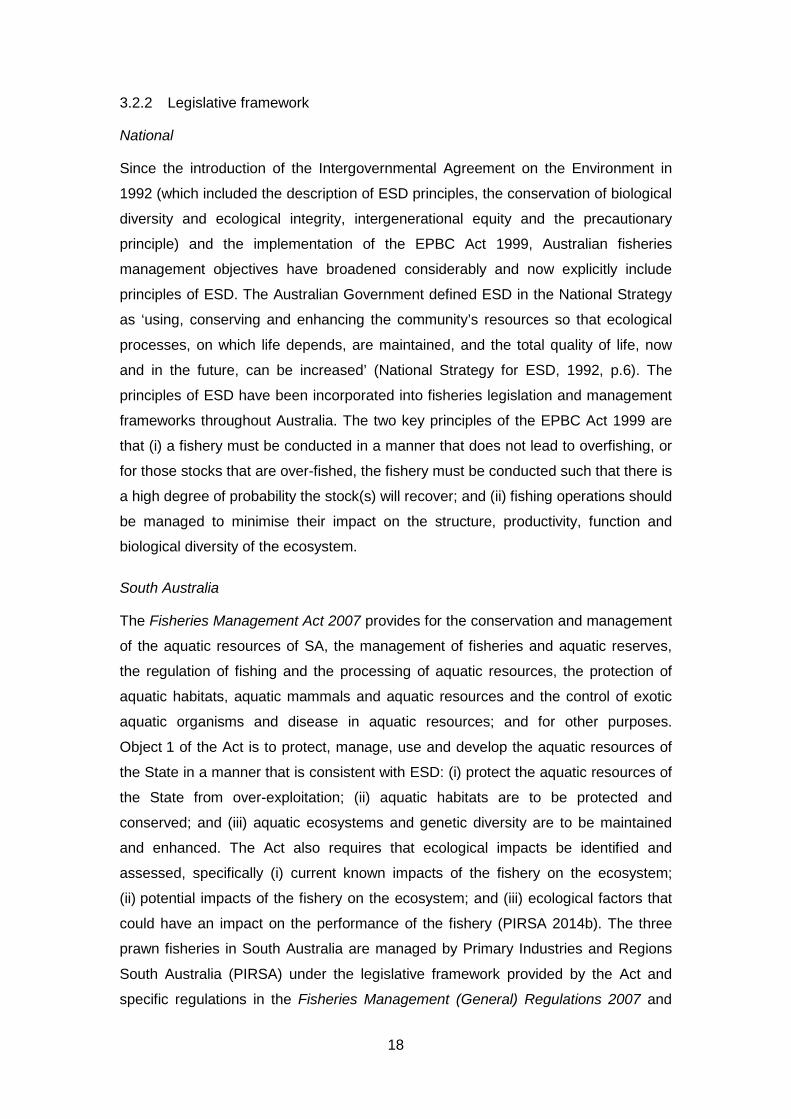
Table 3-2 Management history for the Spencer Gulf Prawn Fishery. 17
Table 5-1 Ecological values and objectives relevant to the Spencer Gulf Prawn Fishery.
29
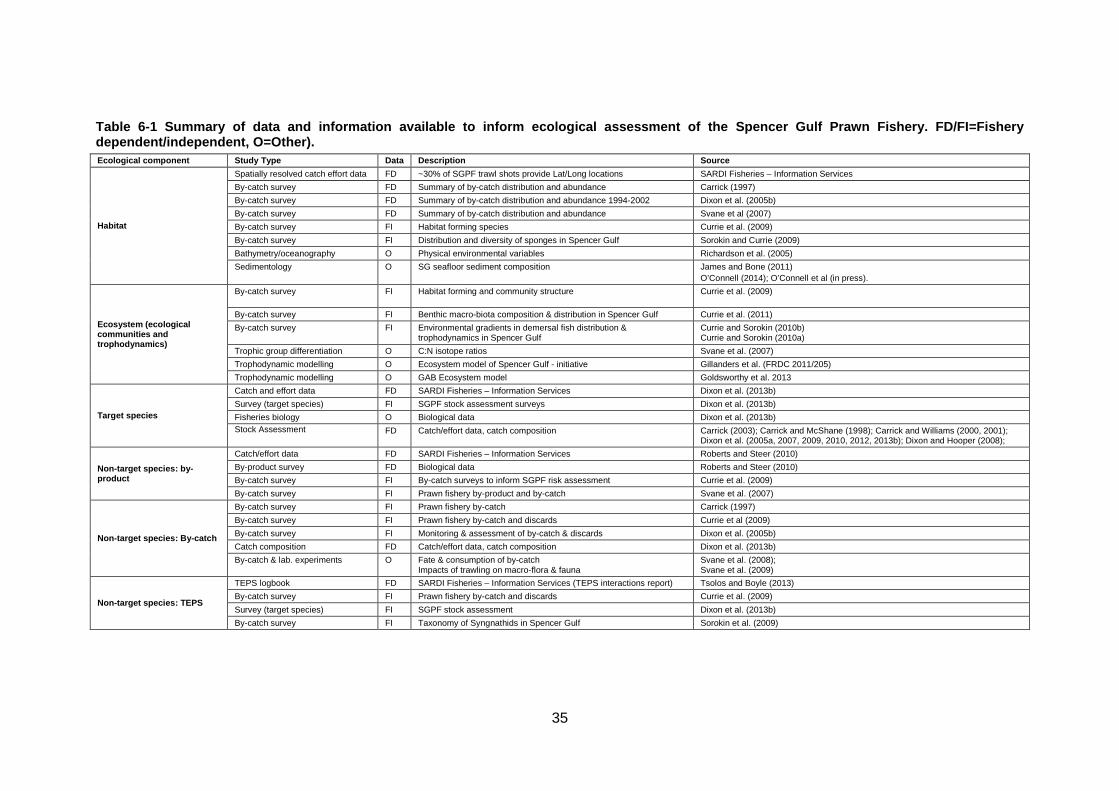
Table 6-1 Summary of data and information available to inform ecological assessment of the Spencer Gulf Prawn Fishery. FD/FI=Fishery dependent/independent, O=Other).
35
Table 6-2 Estimated total area (ha) of the Spencer Gulf exposed to four levels of trawl intensity from 2002/03 to 2011/12.
37
Table 6-3 Estimates of area (% total area) of Spencer Gulf trawled by the SGPF for four categories of trawl intensity from 2002/03-2011/12.
37
Table 6-4 Estimates of area (% total area) of Spencer Gulf trawled by the SGPF for four categories of trawl intensity from 2002/03-2011/12.
42
Table 6-5 ESD risk areas, performance indicators and limit reference points for the Spencer Gulf Prawn Fishery (PIRSA 2014b).
46
Table 6-6 Mean abundance (no./ha) of the by-product species southern calamary and Balmain bug (from Currie et al. 2009) aggregated by areas of differing trawl intensities (10-year average trawl intensity, 2002/03 to 2011/12) (i) voluntary spatial closures; (ii) no trawling (0 hrs); (ii) low (0.001-1 hr/km2) and (iii) combined medium and high (>1 hr/km2).
48
Table 6-7 The abundance (±SE) of syngnathids captured and released during fishery-assessment surveys in November, February and April of 2010, 2011 and 2012 (no data available for April 2012).
54
Table 6-8 Potential (denoted in italics) ecological performance assessment for the Spencer Gulf Prawn Fishery: performance indicators, reference points and associated data requirements. * indicates current management plan (PIRSA 2014b).
60
Table 6-9 Potential (denoted in italics) ecological performance assessment for the Spencer Gulf Prawn Fishery: analysis of data and performance indicator robustness and potential management responses. * indicates current management plan (PIRSA 2014b).
61
7
ABBREVIATIONS
CCSA Conservation Council of South Australia
eNGO environmental non-government organisation
DSEWPaC Department of Sustainability, Environment, Water, Population and
Communities
EBFM ecosystem-based fisheries management
EPBC Act Environment Protection and Biodiversity Conservation Act (1999)(Cth)
ERAEF ecological risk assessment of the effects of fishing
ESD ecologically sustainable development
FHA Fishery Habitat Area
FRDC Fisheries Research and Development Corporation
MSC Marine Stewardship Council
PIRSA Primary Industries and Regions South Australia
SARDI South Australian Research and Development Institute
SGPF Spencer Gulf Prawn Fishery
SGWCPFA Spencer Gulf and West Coast Prawn Fisherman's Association
TEPS threatened, endangered and protected species
8
1 ACKNOWLEDGEMENTS
This project was funded by the Fisheries Research and Development Corporation
(FRDC). The South Australian Research and Development Institute (SARDI) and
Spencer Gulf and West Coast Prawn Fisherman's Association (SGWCPFA) provided
substantial ‘in-kind’ contributions.
We thank the SGWCPFA, especially members of the Management Committee and
the Research Sub-committee for their support of this project. Simon Clark (Executive
Officer, SGWCPFA) provided valuable discussions on all aspects of this project and
significantly contributed to our understanding of the data and the Spencer Gulf Prawn
Fishery (SGPF).
We also thank Richard Banks and Kevin Stokes (Assessors, Marine Stewardship
Council (MSC)) for their feedback during the MSC audit of the SGPF in 2013. In
particular, they are thanked for their contribution to discussions on minimum
threshold of by-catch data for assessment of several by-catch and TEP species.
SARDI staff provided data services and library support. In particular, Angelo Tsolos
provided fishery catch and effort information, and Annie Sterns provided publishing
support. We also thank Laura O’Connell and Noel James for providing information on
the seafloor characteristics of Spencer Gulf. Staff in the Fisheries and Aquaculture
division of Primary Industries and Regions South Australia (PIRSA) provided support
and advice throughout the project, with particular contributions from Annabel Jones
and Brad Milic.
We also acknowledge valuable advice contributed to this project by Rick Fletcher
(Department of Fisheries, Western Australia) and Alistair Hobday (Commonwealth
Scientific Industrial Research Organisation).
FRDC staff provided considerable support. We are particularly grateful for the
management of this project provided by Carolyn Stewardson.
Annabel Jones (PIRSA Fisheries and Aquaculture), Simon Clark (SGWCPFA),
Kathryn Warhurst (Conservation Council of SA (CCSA)) and three FRDC reviewers
provided many useful comments to improve this document. This report was reviewed
by Dr Jason Tanner and Dr Mike Steer (SARDI) and formally approved for release by
Dr Qifeng Ye.
9
2 EXECUTIVE SUMMARY
This Tactical Research Fund Project has been undertaken by SARDI Aquatic
Sciences in response to the Spencer Gulf Prawn Fishery’s (SGPF) need for an
ecosystem-based reporting framework to support ongoing Marine Stewardship
Council (MSC) certification. We reviewed the relevant literature to identify an
appropriate reporting framework, assessed the data available for the SGPF, and its
suitability for use in ecological assessment, developed a conceptual ecosystem-
based assessment framework for the fishery and highlighted the research required
(i.e. knowledge gaps) for full implementation. The approach developed would be of
use to other prawn trawl fisheries that were seeking a transition from target-species
to ecosystem-based assessments to underpin ecosystem-based fisheries
management (EBFM) and ecologically sustainable development (ESD).
There is worldwide recognition of the need to move beyond single-species fisheries
management to a more comprehensive understanding of the impacts on the
ecosystem in which fisheries operate. ESD concepts were expanded into a global
action plan at the UN Conference on Environment and Development in Rio de
Janeiro in 1992 and ratified by countries including Australia, leading to the National
Strategy for ESD and the Commonwealth Environment Protection and Biodiversity
Conservation Act 1999 (EPBC Act 1999). EBFM facilitates ESD and has been
recognised worldwide as having the potential to provide a mechanism for integration
of ecosystem attributes into fisheries management. For EBFM to be effective,
development of appropriate frameworks to integrate ecological and target species
data are required.
Prawn fisheries are an important contributor to Australian fisheries production
(17,000 t valued at $266 million in 2011/12; Skirtun et al. 2013). Given the evolving
need to manage fisheries in a more ecologically sensitive manner, there has been
increased environmental awareness of the biological impacts of trawling. Whilst
these impacts are difficult to assess because of the complexity of the biological
communities and frequent limited understanding of their variability, there is an
opportunity to establish a framework for ecosystem-based assessment of the SGPF
that could be broadly adopted across benthic prawn trawl fisheries in Australia.
The SGPF operates in Spencer Gulf in South Australia (SA), produces approximately
1,800 t of Western King prawns annually, and is the third most valuable prawn fishery
in Australia ($30.3M in 2010/11) behind the Queensland East Coast Otter Trawl
Fishery ($90M) and Commonwealth Northern Prawn Fishery ($62.2M).
10
The overall aim of this project was to develop an environmental reporting framework
for Australian prawn trawl fisheries using the SGPF in SA as a case study. Our
approach included (i) a review of relevant literature to identify an appropriate
reporting framework; (ii) a review of data available for the SGPF, and its suitability for
use in ecological assessment; (iii) development of an ecosystem-based assessment
framework for the SGPF including identification and development of potential
performance indicators; and (iv) the research required (i.e. knowledge gaps) to fully
develop the necessary ecological performance indicators for full implementation.
Despite the substantial, diverse, often long-term data sets available for the SGPF,
most of the data have been collected for stock assessment of the target species. This
resulted in development of a conceptual, rather than a complete ecological
assessment framework. Implementing ecological assessment in the SGPF requires
further development of relevant performance indicators and reference points across
each of the five key ecological components identified as important for fishery
management – (i) habitats; (ii) ecosystems (ecological communities/trophodynamics);
(iii) target species; (iv) non-target species including by-product and by-catch; and
(v) threatened, endangered or protected species (TEPS) – and the development of a
framework linking ecological and target species assessments (with decision rules to
drive management decision making through the formal management plan for the
fishery). While some potential performance indicators, reference points and decision
rules have been developed through this project, successful implementation
necessitates that these should be developed collaboratively. This process should
include at least Primary Industries and Regions SA (PIRSA) Fisheries and
Aquaculture, Spencer Gulf and West Coast Prawn Fishermen’s Association
(SGWCPFA), SARDI and the Conservation Council of SA (CCSA) and needs to
recognise the considerable spatial and temporal (both inter-annual and seasonal)
variation evident in the five key components across Spencer Gulf and the numerous
potential impacts on the Spencer Gulf environment (e.g. other fisheries, aquaculture,
shipping, harbours and wharfs, pollutants, climate change).
11
3 INTRODUCTION
3.1 Background
There is worldwide recognition of the need to move beyond single-species fisheries
management to a more comprehensive understanding of the impacts on the
ecosystem in which fisheries operate (Hilborn 2011). Following recognition of the
interrelationships between continued economic and social development and the
health of the environment at the 1972 United Nations (UN) Conference on the
Human Environment in Stockholm, there was a substantial shift in the public
perception of the potential impacts of human activities on the environment (Fletcher
2002). Release of the UN World Commission on the Environment and Development
(WCED) report ‘(WCED 1987)’ which defined sustainable development as “to meet
the needs of the present without compromising the ability of future generations to
meet their own needs” (WCED 1987) led to a major change in international policy
(Fletcher 2002).
Sustainable development concepts were expanded into a global action plan at the
UN Conference on Environment and Development in Rio de Janeiro in 1992 and
ratified by countries including Australia (Fletcher 2002). In 1992, the Australian and
State governments agreed to endorse environmentally sustainable development,
leading to the National Strategy for ecologically sustainable development (ESD; CofA
1992). The National ESD Strategy provides the major policy document for
sustainable development in Australia and defines ESD as “using, conserving and
enhancing the community’s resources so that ecological processes, on which life
depends are maintained, and the total quality of life, now and in the future, can be
increased” (CofA 1992).
In Australia, all three levels of government (local, State, and Commonwealth) have
agreed to implement ESD for all activities under their jurisdiction using ‘whole of
ecosystem‘ and ‘bioregional approaches’ based on ecosystem boundaries rather
than sectoral and jurisdictional boundaries (Fletcher et al. 2011). For the past
decade, the management of Australian fisheries has used an ecosystem-based
approach (Fletcher et al. 2002) which was designed to meet the legislative changes
and policy initiatives introduced at both the State and Commonwealth level, following
proclamation of the Commonwealth Environment Protection and Biodiversity
Conservation Act 1999 (EPBC Act 1999). The two key principles of the EPBC Act
1999 relevant to fisheries management are that (i) a fishery must be conducted in a
12
manner that does not lead to overfishing, or for those stocks that are over-fished, the
fishery must be conducted such that there is a high degree of probability the stock(s)
will recover; and (ii) fishing operations should be managed to minimise their impact
on the structure, productivity, function and biological diversity of the ecosystem.
Requirements for ecologically sustainable management of fisheries under the EPBC
Act 1999 (and other Acts) are implemented through the principles of ESD and
associated risk assessments of individual fisheries, for which the processes are well
described in Fletcher et al. (2002, 2005).
Ecosystem-based fisheries management (EBFM) is an operational extension of ESD
and has been recognised worldwide as having the potential to provide a mechanism
for integration of ecosystem attributes into fisheries management (FAO 1995, 2003;
Pikitch et al. 2004). Fletcher (2006) defined EBFM as the assessment and
management of all impacts and outcomes related to any commercial, recreational,
charter, customary, or ‘no take’ sector operating within an ecosystem or bioregion.
For EBFM to be effective, development of appropriate frameworks to integrate
ecological and target-species data are required.
Prawn fisheries are an important contributor to Australian fisheries production. In
2010/11, Australian prawn fisheries were worth $266 million, placing them third in
value after rock lobster ($384 million) and salmon aquaculture ($513M; Skirtun et al.
2013). In terms of volume, Australian prawn fisheries (22,537 t) were third after
Australian sardine (41,319 t) and salmon aquaculture (73,989 t; Skirtun et al. 2013).
Annual production of Australian trawl fisheries remained relatively stable from
2001/02 to 2011/12, with only a slight decline attributed to lower unit price (Skirtun et
al. 2013). Wild-caught prawn fisheries are managed under State and Commonwealth
jurisdictions with most production from Queensland, Western Australia and South
Australia (Skirtun et al. 2013).
Whilst it has been recognised worldwide that there is an urgent need to manage
fisheries in a more ecologically sensitive manner (Pitcher et al. 2009), and there has
been increased environmental awareness on the biological impacts of trawling
(Jennings and Kaiser 1998; Thrush and Dayton 2002), these impacts are difficult to
assess because of the complexity of the biological communities involved and limited
understanding of their variability (Messeih et al. 1991). Depending on habitat types
and associated species, the environmental impacts of benthic trawl fisheries can be
highly variable in nature and may require greater attention than other fishing methods
13
due to their impact on the benthic environment, by-catch species and associated
communities.
In response to Australia's growing commitment to ESD the 'National ESD Reporting
Framework for Australian Fisheries' (Fletcher et al. 2002) and 'An assessment
framework for ESD reporting' (Fletcher et al. 2005) were developed. Included in this
framework was the acknowledgment of the broadening scope of responsibilities of
management agencies and the need for a structured approach to address them. The
aim of a reporting framework for environmental assessment of a fishery is to provide
a logical process for identifying environmental concerns and steps to ensure
strategies are implemented to manage them. An example of such an ecological risk
management framework is that for Commonwealth managed fisheries (AFMA 2012).
Central to identifying environmental concerns and an effective reporting framework
for ecological assessment is an ESD risk assessment. Australian fisheries
management agencies have typically adopted the qualitative approach of Fletcher et
al. (2002, 2005), but the ecological risk assessment of the effects of fishing (ERAEF)
method (Hobday et al. 2007, 2011b) and other semi-quantitative and quantitative
approaches (e.g. Stobutzki et al. 2001; Zhou and Griffiths 2008) are also used.
Typically, these ESD risk assessments identify five principle components which are
the effects of fishing on (i) habitats; (ii) ecosystems (ecological
communities/trophodynamics); (iii) target species; (iv) non-target species including
by-product and by-catch; and (v) TEPS (Fletcher et al. 2010; Hobday et al. 2011b).
Evaluating the impact of fishing on target species and the ecosystem within which
fishing occurs underpins ecosystem-based reporting frameworks. The two principal
components are (i) a management plan with ecological and fishery performance
indicators linked to decision rules through reference points; and (ii) an annual
ecological assessment report which provides an evaluation of the performance of the
fishery. To be effective, performance indicators, reference points, decision rules and
management responses are required across all of the five key components identified
above. It is also essential that the framework is regularly reviewed (e.g. every five
years) to ensure currency and relevance. This broad ecological assessment
approach can then support practical implementation of EBFM (Pikitch et al. 2004;
Bustamante et al. 2011).
In South Australia, the Fisheries Management Act 2007 (the Act) requires that
ecological impacts be identified and assessed. The Act specifically requires that
(i) current known impacts of the fishery on the ecosystem; (ii) potential impacts of the
14
fishery on the ecosystem; and (iii) ecological factors that could have an impact on the
performance of the fishery, are identified. An ESD risk assessment is required as part
of fishery management plans in SA, to inform development of goals and objectives
for the fishery. The ESD risk assessment report for the Spencer Gulf Prawn Fishery
(SGPF) has recently been completed (PIRSA 2014a). That risk assessment identified
ecological impacts which were qualitatively assessed through the ESD risk
assessment framework developed by Fletcher et al. (2002). A semi-quantitative
assessment of the species components identified from a 2007 by-catch survey was
also done using Productivity Susceptibility Analysis (after Hobday et al. 2007,
2011b). Whilst ESD principles were followed for development of the risk assessment
for the SGPF (PIRSA 2014a), EBFM provides the mechanism for implementing core
ecological principles into fishery management, thereby supporting ESD. The
principles of EBFM have been established for over a decade (Webb and Smith
2008), but it is only in recent years that EBFM frameworks have been developed and
applied by Government agencies (e.g. for the West Coast Bioregion of Western
Australia; Fletcher et al. 2010). Implementation of EBFM requires a framework for
ecosystem-based assessments. This is particularly the case for benthic trawl
fisheries given their low selectivity (Alverson et al. 1994), including the SGPF, despite
the SGPF recently being certified by the Marine Stewardship Council. Consequently,
the overall aims of this project were to (i) develop a generic framework for
environmental assessment of Australian prawn trawl fisheries and, subsequently,
(ii) develop a fishery-specific reporting framework using the SGPF in SA as a case
study.
3.2 Overview of the South Australian Spencer Gulf Prawn Fishery
3.2.1 Description of the fishery
The SGPF operates in Spencer Gulf, SA (Figure 3-1), and is the third most valuable
prawn fishery in Australia ($30.3M in 2010/11) behind the Queensland East Coast
Otter Trawl Fishery ($90M) and Commonwealth Northern Prawn Fishery ($62.2M;
(Dixon et al. 2013b). Compared to the West Coast and Gulf St Vincent prawn
fisheries, the SGPF is the largest of the commercial prawn trawl fisheries in SA in
terms of area, production and number of licences (Dixon et al. 2010). The SGPF
produces approximately 1,800 t of Western King prawns annually (Figure 3-2).
Commercial prawn trawling began in Spencer Gulf in 1967 (Carrick 2003). Catches
and trawling intensity increased steeply over the first six years of the fishery. In
1973/74, more than 1,800 t of prawns were harvested with approximately 25,000 hrs
15
of fishing effort. Since then, catches have remained relatively stable (~1,300-2,500 t;
Dixon et al. 2013b). Fishing effort has declined from a peak of 45,786 hr in 1978/79
to 18,438 hr in 2007/08 (Dixon et al. 2013b). This effort reduction has resulted from a
combination of increased fishing efficiency through co-operatively confining fishing to
areas with target-sized prawns to reduce costs and maximise economic return
(Currie et al. 2009).
Spatial and temporal closures are used in the management of the SGPF. Spatial
closures include prohibiting trawling in waters <10 m depth, State aquatic reserves
and areas that are closed by the commercial fleet on a voluntary basis. The fishery is
generally closed in January and February, and from July to October each year. Gear
restrictions limit vessel size and power, type and number of trawl nets towed,
maximum headline length and minimum mesh size (Table 3-1). The SGPF targets a
single species, Western King prawn (Penaeus (Melicertus) latisulcatus) and is also
able to retain two by-product species (i) Balmain bug (Ibacus spp.) or slipper lobster;
and (ii) southern calamary (Sepioteuthis australis). For a detailed description of the
development and management history of the SGPF, see Dixon and Sloan (2007),
Dixon et al. (2013b) and PIRSA (2014a,b). Management milestones are summarised
in Table 3-2.
Figure 3-1 Map of the Spencer Gulf showing Spencer Gulf Prawn Fishery reporting blocks (black blocks with numbers) and regions (red blocks with names).
16
Figure 3-2 Annual catch and effort for the Spencer Gulf Prawn Fishery from 1978/79 to 2011/12.
There are generally six fishing periods within each year. Fishing occurs at night with
each fishing period lasting a maximum of 14 nights from the last to first quarters of
the moon in November, December, March, April, May and June. Trawl shots are
generally up to 1 hr duration. Stock-assessment (fishery-independent) surveys are
conducted in November, February and April to determine stock status and identify
areas with high densities of target-sized prawns to inform fishing strategy
development (Currie et al. 2009). Spot (fishery-dependent) surveys are also
conducted at other times to identify areas of prawns that meet the size criteria of the
latest fishing strategy. Fishing is then confined to those areas through a gazettal
notice issued by PIRSA and fishing notices distributed by the coordinator-at-sea. A
committee at sea, consisting of the coordinator at sea and several skippers, also
undertakes ‘real-time’ management (RTM) to enhance fishing efficiency and reduce
potential ecological impacts. No commercial fishing takes place until data from
surveys has been analysed and the stock abundance and prawn size and spawning
status are known. RTM gives the fleet the ability to adapt fishing, spatially and
temporally, within the parameters of the fishing strategy, such that the fishery is
managed based on the movement of prawns, their size, fishing effort and catch rates.
The management committee (on land) establishes a fishing strategy with trigger
limits in accordance with the management plan (PIRSA 2014b), while the committee
at sea monitor all open areas, and implement changes according to the Spencer Gulf
and West Coast Prawn Fisherman’s Association (SGWCPFA) policies and the
triggering of reference limits. This reflects the strong collaborations among all
stakeholders, notably commercial fishers, managers and researchers (Hollamby et
al. 2010)
Fishing season
1978
/79
1979
/80
1980
/81
1981
/82
1982
/83
1983
/84
1984
/85
1985
/86
1986
/87
1987
/88
1988
/89
1989
/90
1990
/91
1991
/92
1992
/93
1993
/94
1994
/95
1995
/96
1996
/97
1997
/98
1998
/99
1999
/00
2000
/01
2001
/02
2002
/03
2003
/04
2004
/05
2005
/06
2006
/07
2007
/08
2008
/09
2009
/10
2010
/11
2011
/12
Cat
ch (t
)
0
500
1000
1500
2000
2500
3000
Effo
rt (*
1000
hrs
)
0
10
20
30
40
50CatchEffort
17
Table 3-1 Current management regulations for the Spencer Gulf Prawn Fishery.
Characteristic Description Target species Western king prawn (Penaeus (Melicertus) latisulcatus)
By-product species Balmain Bugs (slipper lobsters; Ibacus spp.), southern calamary (Sepioteuthis australis)
Fishing method Demersal otter trawl, predominantly double rig (single rig may also be used)
Area Waters of Spencer Gulf north of the geodesic from 34°59.12’S, 136°09.18’E (Cape Catastrophe, Eyre Peninsula) to 35°17.99’S, 136°52.84’E (Cape Spencer, Yorke Peninsula)
Depth range ≥10 m
Fishing periods Night only – generally last quarter to first quarter of moon during Nov, Dec, Mar-Jun
Catch and effort data Daily and monthly logbook submitted monthly
Observer program Fishery-independent observers for stock assessment surveys, no regular program for monitoring catch composition
Management methods Input controls: limited entry, gear restrictions, spatial and temporal closures, maximum combined headline length 29.26 m, minimum mesh size 4.5 cm, maximum vessel length 22 m, maximum vessel power 336 kW (= 450 hp)
Legislation Fisheries Management Act 2007, Fisheries Management (General) Regulations 2007, Fisheries Management (Prawn Fisheries) Regulations 2006
Management plan Yes – PIRSA (2014b)
Annual harvest strategy Yes – PIRSA (2014b)
Consultative forums Spencer Gulf and West Coast Prawn Fishermen’s Association Inc.
Assessments under the EPBC Act Protected species accreditation (Part 13) – Exempt status expires 29 October 2015; Export declaration (Part 13A) – yes
Certification for sustainability Marine Stewardship Council certification 25 July 2011; reassessment July 2016
Licences Limited entry; restricted to 39 (transferable) in 2013/14
Table 3-2 Management history for the Spencer Gulf Prawn Fishery.
Year Management history
1967 First commercial catch of prawns recorded.
1968 All SA waters closed to trawling except for specific managed zones for which permits are offered and all waters less than ten metres are closed to trawling.
1969 The Preservation of Prawn Resources Regulations 1969 is introduced and vessels licensed to fish for prawns.
1971 The two Spencer Gulf fishing zones are merged to form one.
1976 Fishers operating in Anxious Bay and Coffin Bay zones on the West Coast are offered the opportunity to switch to the Spencer Gulf zone.
1981 Industry closures of the waters north of Point Lowly and adjacent to Port Broughton to trawling.
1992 Coordinator at Sea appointed and implementation of Real Time Management.
1995 The Fisheries (Management Committees) Regulations 1995 are introduced and provide a forum for the Spencer Gulf and West Coast Prawn Fishermen’s Association to play a major role in the management of the fishery.
1998 First Management plan for Spencer Gulf Fishery introduced.
2002 Industry closure of waters adjacent to Wardang Is. to Corny Point.
2007 Second Management plan for SGPF introduced.
2011 Co-management arrangements further developed and implemented (after Hollamby et al. 2010)
2011 Marine Stewardship Council (MSC) certification of fishery
2012 SGWCPFA Committee at Sea authorised to maintain fishing activities at sea.
2014 Third Management plan for SGPF introduced (PIRSA 2014b).
18
3.2.2 Legislative framework
National
Since the introduction of the Intergovernmental Agreement on the Environment in
1992 (which included the description of ESD principles, the conservation of biological
diversity and ecological integrity, intergenerational equity and the precautionary
principle) and the implementation of the EPBC Act 1999, Australian fisheries
management objectives have broadened considerably and now explicitly include
principles of ESD. The Australian Government defined ESD in the National Strategy
as ‘using, conserving and enhancing the community’s resources so that ecological
processes, on which life depends, are maintained, and the total quality of life, now
and in the future, can be increased’ (National Strategy for ESD, 1992, p.6). The
principles of ESD have been incorporated into fisheries legislation and management
frameworks throughout Australia. The two key principles of the EPBC Act 1999 are
that (i) a fishery must be conducted in a manner that does not lead to overfishing, or
for those stocks that are over-fished, the fishery must be conducted such that there is
a high degree of probability the stock(s) will recover; and (ii) fishing operations should
be managed to minimise their impact on the structure, productivity, function and
biological diversity of the ecosystem.
South Australia
The Fisheries Management Act 2007 provides for the conservation and management
of the aquatic resources of SA, the management of fisheries and aquatic reserves,
the regulation of fishing and the processing of aquatic resources, the protection of
aquatic habitats, aquatic mammals and aquatic resources and the control of exotic
aquatic organisms and disease in aquatic resources; and for other purposes.
Object 1 of the Act is to protect, manage, use and develop the aquatic resources of
the State in a manner that is consistent with ESD: (i) protect the aquatic resources of
the State from over-exploitation; (ii) aquatic habitats are to be protected and
conserved; and (iii) aquatic ecosystems and genetic diversity are to be maintained
and enhanced. The Act also requires that ecological impacts be identified and
assessed, specifically (i) current known impacts of the fishery on the ecosystem;
(ii) potential impacts of the fishery on the ecosystem; and (iii) ecological factors that
could have an impact on the performance of the fishery (PIRSA 2014b). The three
prawn fisheries in South Australia are managed by Primary Industries and Regions
South Australia (PIRSA) under the legislative framework provided by the Act and
specific regulations in the Fisheries Management (General) Regulations 2007 and
19
Fisheries Management (Prawn Fisheries) Regulations 2006 which are subordinate to
the Act.
In 2014, the management plan for the SGPF (PIRSA 2014b) was implemented under
the Fisheries Management Act 2007 to provide a strategic policy framework for the
ecologically sustainable management of the fishery. The management plan aims to
achieve outcomes consistent with broader Government objectives for the
management of the marine environment. Policy drivers addressed by the
management plan include (i) the National Strategy for ESD; (ii) the precautionary
principle, as set out in the Intergovernmental Agreement on the Environment (1982);
and (iii) the EPBC Act 1999. To achieve this, the management plan provides a formal
harvest strategy for the fishery that includes decision rules that guide harvest
strategy development for each fishing period within each season (PIRSA 2014b).
3.2.3 Reporting requirements
Under the prescribed regulations, licence holders in the SGPF are required to
provide daily and monthly catch and effort data to SARDI Aquatic Sciences through
logbook returns. Data provided in the logbook returns includes licence information,
date(s), number of shots, fishing location (i.e. block number), trawl start and end time
(providing trawl duration), trawl depth, GPS location of the mid-point of three trawl
shots per night (first, middle (approximately 4th), last), trawl speed, a count of the
number of prawns from a 7 kg sample (termed bucket count), frozen catch by size
grade, catch processed in brine, retained by-product and water temperature. As part
of the requirement under the EPBC Act 1999, licensed fishers must also report any
interactions of their fishing activity with threatened, endangered and protected
species (TEPS) to PIRSA Fisheries and Aquaculture and the Commonwealth’s
Department of the Environment. Since 2007, licence holders have reported
interactions of their fishing activity with TEPS to PIRSA Fisheries and Aquaculture
using the ‘Wildlife Interaction Identification Guide and Logbook’ which are recorded
against the corresponding catch and effort logbook number. Both forms are returned
to SARDI Aquatic Sciences for collation and reporting purposes.
3.2.4 Current initiatives to reduce ecological impact
Since inception, the SGPF has implemented management practices that have
substantially moderated the ecological impact of this fishery on Spencer Gulf, thereby
contributing towards the principals of ESD and EBFM. Two of these – the hopper
system and closed areas – were established to directly reduce impacts of the fishery
20
on the ecology of Spencer Gulf. Other initiatives, implemented to improve prawn
quality (and thus price) and/or fishing efficiency have indirectly reduced the impact of
this fishery. These include ‘crab bags’, improved net designs and effort reduction.
The hopper system enables the total catch to be maintained in a ‘wet well’ with
continuous water flow that efficiently separates by-catch from prawns. This system is
supported by the use of ‘crab bags’, which contain the macro faunal by-catch.
Collectively, these (i) prevent small by-catch species from being crushed; and
(ii) enable the larger by-catch to be immediately returned to the marine environment,
thereby likely improving the survival rates of the majority of species, particularly
crabs, large fish, rays and sharks.
There are two areas that have been permanently closed to prawn trawling by the
SGWCPFA. These are located at Wardang Island (established 2002) and Port
Broughton (established 1981; see Table 5-2). Both were established to protect the
benthic environment, including complex sponge beds, and juveniles of commercially
important species, with the former also providing substantial protection to
syngnathids. Two additional closures have been implemented seasonally since 1981
(Point Lowly and Cowell). These areas support sensitive benthic and syngnathid
populations, along with typically being dominated by small prawns.
Although net size and mesh are controlled through regulation, the most effective nets
have the foot line bouncing on or ‘tickling’ the muddy habitats. Development of lighter
chains, which have replaced heavier designs that dug into the sea floor, allows them
to be rigged to tumble across the muddy substrate. This reduces the volume of by-
catch. In addition, periodic evaluation of the effectiveness of by-catch reduction
devices has been undertaken (e.g. Dixon et al. 2014; Kennelly 2014).
Several initiatives have combined to reduce fishing effort (Table 5-2), which has
substantially reduced the fishery’s potential impact on the Spencer Gulf environment.
These include (i) fishing strategies concentrating fishing activity into areas with
target-sized prawns, based on fishery-independent and spot surveys; (ii) relatively
short trawl-shot duration; and (iii) long-term reductions in the number of nights fished.
Notably, the number of nights fished has reduced from ~240 in the 1970s to ~50
since the 2000s.
21
3.2.5 Spencer Gulf Environment
Bathymetry and physical oceanography
Spencer Gulf and Gulf St Vincent are two of the largest marine incursions into
continental Australia (Richardson et al. 2005). Shallow water depths, a high tidal
range and highly saline waters support unique benthic habitats with a close
relationship between the distribution patterns of sediments, benthic fauna and water
depth (Richardson et al. 2005; Figure 3-3).
Spencer Gulf displays strong geographic differences in depth, temperature and
salinity. Depth ranges to 60 m in the south of the gulf. There is a large gradient in
temperature and salinity from north to south (Richardson et al. 2005), that also varies
temporally. Spencer Gulf is classified as an inverse estuary because salinity
increases towards the head of the Gulf due to high summer evaporation rates and
minimal freshwater input. For example, mean annual salinity towards the head of the
Gulf is typically ~45 ppt salinity (Nunes and Lennon 1986; Nunes Vaz et al. 1990),
approximately 10 ppt above adjacent oceanic salinity levels.
In northern Spencer Gulf, water temperatures vary considerably with an average of
12oC in mid-winter to 28°C in mid-summer (Nunes and Lennon 1986). Sea surface
temperatures (SSTs) become gradually cooler from northern to southern Spencer
Gulf and are considerably cooler in the adjacent open ocean (Dixon et al. 2010).
Overall, SSTs in Spencer Gulf are lower (12-24°C) and more variable than in parts of
tropical Australia which support commercially important P. latisulcatus fisheries such
as Broome and Shark Bay in Western Australia (Nunes and Lennon 1986).
Key oceanographic features of Spencer Gulf are the Port Lincoln Boundary Current,
which flows northward along the western coast and has a general clockwise water
circulation (Figure 3-4). A high density current of saline water flows out of the
Spencer Gulf (Bonaparte's Tongue) in autumn (Figures 3-5, 3-6), when water
temperatures cool and higher salinity water at the head of the Gulf becomes too
dense to maintain stability in the water column. This high density saline water then
sinks and flows out of the Spencer Gulf (source Richardson et al. 2005).
22
Sedimentology
Spencer Gulf is a region of warm-temperate, heterozoan carbonate deposition. There
are no permanent rivers bringing fresh water or terrigenous sediments to the Gulf.
Low siliciclastic input and shallow water depths promote deposition of diverse
heterozoan carbonates with large variations in grain size. The remains of bryozoans,
rhodoliths (coralline algae nodules), bivalves and gastropods form gravels, which
may also produce sands when broken down further by abrasion and bioerosion.
Small benthic foraminifera, delicate bryozoans, articulated corallines and echinoids
initially generate sand grains. Mud is created by the comminution of fragile
components such as thin crustose corallines and articulated bryozoans.
Figure 3-3 Bathymetry of Spencer Gulf (source Richardson et al. 2005, left panel) and average monthly sea surface temperature (SST oC) throughout the Spencer Gulf and Gulf St. Vincent. IS = Investigator Straight; BP = Backstairs Passage, between 2002-2007 (right panels, source: Tanner and Volkman 2009).
Spencer Gulf sediments can be divided into four main facies: (i) mollusc, coralline,
benthic Foraminifera gravel, sand, and mud; (ii) coralline (rhodolith) gravel;
(iii) bivalve mud; and (iv) skeletal sand and gravel (James and Bone 2011). The
23
distribution of these facies is affected by complex oceanographic conditions (Figure
3-7).
Sediments in Spencer Gulf are predominantly sand and mud, with seagrass common
at depths of <10 m (Dixon et al. 2010). The south-western corner of the mouth of the
Gulf is dominated by rhodolith gravels, particularly around bathymetric highs where
currents bring in oceanic marine waters from the shelf that scour the seafloor.
Deeper parts of the south-eastern Gulf are dominated by skeletal sand and gravel.
Seagrass meadows in the shallow coastal areas of the Gulf are associated with
mollusc, coralline, benthic foraminiferan gravel, sand, and mud facies. The seafloors
of the northern and central Gulf are dominated by muddy bivalve deposits because
high salinities restrict the growth of other organisms (e.g. corallines, bryozoans, and
echinoids).
Figure 3-4 Key oceanographic features of Spencer Gulf and Gulf St. Vincent. In Spencer Gulf, light blue arrows (gross net flow) show the Port Lincoln Boundary Current (PLBC) which flows northwards along the western coast and the overall clockwise circulation. Large grey arrow shows high density saline water (Bonaparte’s Tongue) which flows out of Spencer Gulf in the austral autumn (source Richardson et al. 2005).
24
Figure 3-5 Aerial view of isohaline contours (maximum salinity) and Bonaparte's Tongue in southern Spencer Gulf during the austral autumn (source Richardson et al. 2005).
Figure 3-6 Profile of southern Spencer Gulf during the austral autumn showing isohaline contours (maximum salinity) and hypersaline bottom currents indicating Bonaparte's Tongue (source Richardson et al. 2005).
25
Figure 3-7 Sedimentology of Spencer Gulf (main map). Detailed surface sediment facies and environments in northern Spencer Gulf (insert, top left) (James and Bone 2011).
26
Relationships between bathymetry, physical oceanography, sedimentology and Western King prawns
In South Australia, juvenile Western King prawns occur predominantly on inter-tidal
sand- and mud-flats, generally located between shallow seagrass beds and
mangroves (Kangas and Jackson 1997; Tanner and Deakin 2001). In Spencer Gulf,
seagrass habitats are common at depths <10 m where trawling does not occur
(Currie and Sorokin 2010a). Juvenile abundance is significantly greater in the mid-
intertidal zone compared to lower and upper zones of the Gulf (Roberts et al. 2005).
Dixon et al. (2013b) divided the Spencer Gulf coastline into Fisheries Habitat Areas
(FHA 20, 23, 25-37, Thorny Passage to Formby Bay) following Bryars (2003). Of 12
identified habitat types, ‘tidal flats’ and ‘mangrove forests’ were assessed as
appropriate juvenile prawn habitat. The percentage of coast (by length) that
comprised juvenile habitat was estimated from the FHA maps and satellite images for
two definitions of juvenile habitat (tidal flat only, combination of tidal flat and
mangrove forest) (Bryars 2003; Dixon et al. 2013b). Juvenile habitat comprised
992 km (51%) of the Spencer Gulf coastline when all tidal flats were considered, and
245 km (25%) when only areas with adjacent tidal flats and mangrove forests were
considered (Dixon et al. 2013b). The largest areas of juvenile prawn nursery habitat
occurred in far northern Spencer Gulf, Germein Bay and False Bay (Dixon et al.
2013b). These results were supported by previous studies of juvenile prawn
abundance in Spencer Gulf (Roberts et al. 2005). Dixon et al. (2013b) postulated that
production in South Australia’s prawn fisheries was related to the area of juvenile
habitat.
3.3 Project approach
The overall aims of this project were to develop a generic framework for ecological
assessment of Australian trawl fisheries and, subsequently, to develop a fishery-
specific reporting framework using the Spencer Gulf Prawn Fishery (SGPF) in South
Australia (SA) as a case study. To achieve these we first reviewed relevant literature
to identify an appropriate generic reporting framework. Once the generic framework
was established, we reviewed the literature and data available for the SGPF to
develop an ecological reporting framework to inform ecological assessment for this
fishery. This included identification and development of potential performance
indicators and an outline of the research required (i.e. knowledge gaps) for full
implementation of an ecological reporting framework for this fishery.
27
4 OBJECTIVES
1. Develop a reporting framework for environmental assessment of Australian
trawl fisheries following the principles of ecosystem-based fisheries
management;
By using the Spencer Gulf Prawn Trawl Fishery as a case study:
2. Collate and analyse existing data/information to address the environmental
impacts of prawn trawling on: benthic habitats; trophodynamics; target
species; and non-target species including by-catch/by-product and
threatened, endangered and protected species;
3. Integrate existing data on trawl tracks using GIS to produce a continuous
contour map representing the ecological foot-print of prawn trawl activities in
Spencer Gulf;
4. Identify and prioritise future research to support ecosystem-based fisheries
management.
28
5 METHODOLOGY
5.1 Ecological assessment framework
A review of the available literature, including relevant legislation, was conducted to
develop a conceptual reporting framework. The key literature included the EPBC Act
1999, ‘National ESD Reporting Framework for Australian Fisheries: The 'How To'
Guide for Wild Capture Fisheries’ (Fletcher et al. 2002), 'An assessment framework
for ESD reporting' (Fletcher et al. 2005), the ecological risk management framework
for Commonwealth managed fisheries (Hobday et al. 2007, 2011b; AFMA 2012), and
alternative semi-quantitative and quantitative approaches (e.g. Stobutzki et al. 2001;
Zhou and Griffiths 2008; Astles et al. 2009) including the regional assessment and
planning tools developed in Western Australia (Fletcher et al. 2010; Fletcher et al.
2011). This approach was taken to ensure the developed generic framework was
consistent with the ecosystem approach to fisheries (FAO 2003) and similar to that
applied to ESD assessments in Australia. It was supplemented by reviewing
information on the potential environmental impacts of Australian trawl fisheries (e.g.
Svane 2003; 2005; Svane et al. 2007; 2008; 2009; Currie et al. 2009; 2011; Currie
and Sorokin 2010a,b), and other projects that have developed ecological
performance indicators for trawl (Bustamante et al. 2011; Piasente et al. 2012) and
finfish (Goldsworthy et al. 2011; Hall and Wise 2011) fisheries.
5.2 Spencer Gulf Prawn Fishery case study
The SGPF was chosen as a case study for the development of a fishery-specific
reporting framework. Relevant data and information were obtained from the previous
and current management plans, stock assessments, published literature, SARDI
databases, grey literature and student projects. This search included identification
and summation of the data/information available for the fishery and its suitability for
yielding performance indicators for ecosystem-based assessment of the SGPF. The
example performance indicators identified were used to convert the conceptual
reporting framework for ecological assessment of prawn trawl fisheries to a potential,
more specific framework for the SGPF.
29
5.2.1 Scope of this study
The spatial extent of this study was constrained to the area of Spencer Gulf in SA
where the SGPF operates (i.e. Cape Catastrophe, Eyre Peninsula, 34o59.12’S,
136o09.18’E to Cape Spencer, Yorke Peninsula, 34o17.99’S, 136o52.84’E; Figure
3-1). Excluded were the two areas where prawn trawling is prohibited: (i) waters <10
m depth; and (ii) aquatic reserves which have prohibitions on fishing. Locations of
these reserves are described in the Act.
The study considered contributions of the fishery to ecological wellbeing which
included (i) retained species; (ii) non-retained species; and (iii) the general
ecosystem. Specifically, the scope of the ecological assessment encompasses and
comprises the five ecological assets (components) identified in the ESD risk
assessment and the supporting ecological risk assessment of the effects of fishing
(ERAEF; PIRSA 2014a). Thus, this ecological assessment framework spans the
potential impacts of the SGPF on (i) habitats; (ii) the ecosystem (ecological
communities and trophodynamics); (iii) target and non-target species; (iv) by-product
and by-catch and; (v) TEPS. This is consistent with the ecological values and
objectives of the SGPF from PIRSA (2014b) which are outlined in Table 5-1.
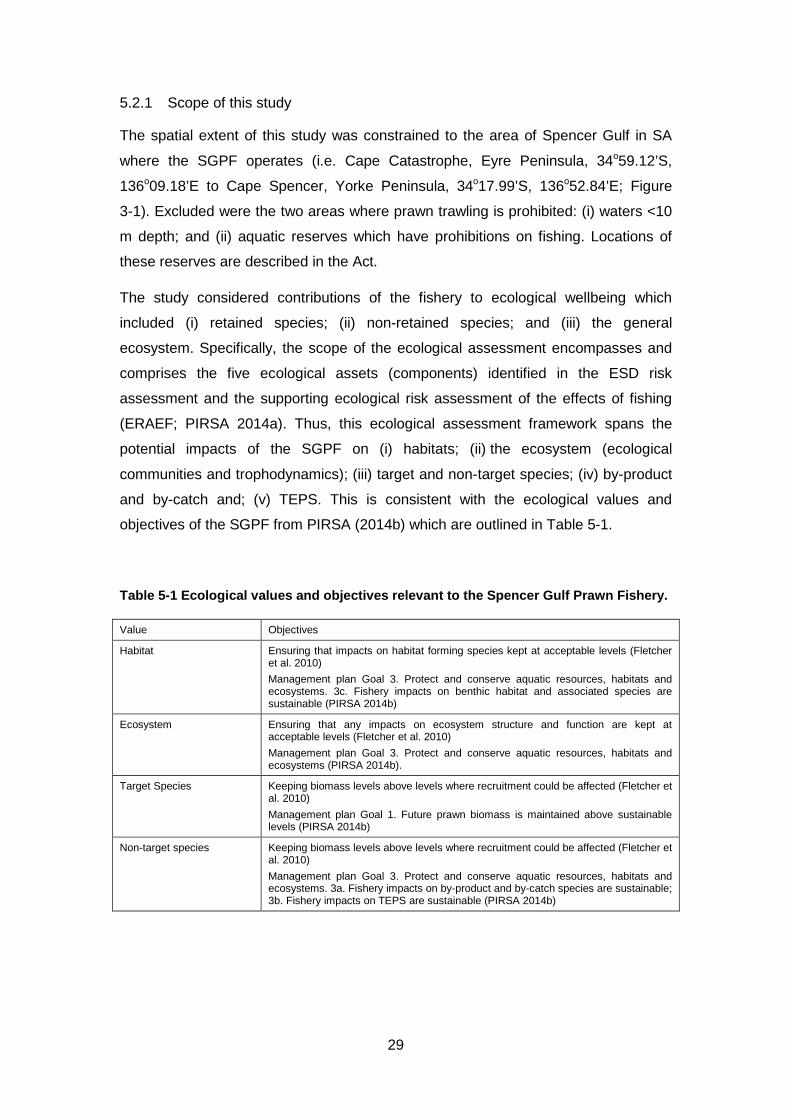
Table 5-1 Ecological values and objectives relevant to the Spencer Gulf Prawn Fishery.
Value Objectives
Habitat Ensuring that impacts on habitat forming species kept at acceptable levels (Fletcher et al. 2010) Management plan Goal 3. Protect and conserve aquatic resources, habitats and ecosystems. 3c. Fishery impacts on benthic habitat and associated species are sustainable (PIRSA 2014b)
Ecosystem Ensuring that any impacts on ecosystem structure and function are kept at acceptable levels (Fletcher et al. 2010) Management plan Goal 3. Protect and conserve aquatic resources, habitats and ecosystems (PIRSA 2014b).
Target Species Keeping biomass levels above levels where recruitment could be affected (Fletcher et al. 2010) Management plan Goal 1. Future prawn biomass is maintained above sustainable levels (PIRSA 2014b)
Non-target species Keeping biomass levels above levels where recruitment could be affected (Fletcher et al. 2010) Management plan Goal 3. Protect and conserve aquatic resources, habitats and ecosystems. 3a. Fishery impacts on by-product and by-catch species are sustainable; 3b. Fishery impacts on TEPS are sustainable (PIRSA 2014b)
30
5.2.2 Data and information sources
Data and information for ecological assessment of the SGPF were obtained from
numerous sources. These included (i) historical catch, effort and fishing-location data
from commercial logbooks provided by fishers to SARDI; (ii) the management plan
for the SGPF (PIRSA 2014b) and stock assessment reports (e.g. Dixon et al. 2013b);
(iii) estimates of retained weights of non-target species (i.e. southern calamary and
Balmain bug; after Roberts and Steer 2010); (iv) prawn (and by-product) distribution,
abundance and population length structure from fishery-independent surveys; (v)
interactions of the SGPF with TEPS reported by fishers via the TEPS logbook to
SARDI (after Tsolos and Boyle 2013); and (vi) estimates of by-catch from fishery-
independent surveys (Dixon et al. 2005b; Svane 2003; Svane et al. 2007; Currie et
al. 2009). Collectively, these sources were used to identify the data and information
available for ecological assessment of the SGPF.
5.2.3 Data analysis and information synthesis
5.2.3.1 Habitat
In the absence of data and information on the composition and distribution of habitat
types across Spencer Gulf in waters >10 m depth (e.g. sediment type, bottom cover,
sessile species), we used the location and intensity of fishing effort as an index of the
potential impact of the SGPF on the Spencer Gulf habitats. Using ArcGIS software,
the point density interpolation method was used to map (i) annual trawl intensity
(hr/km2) for each fishing season from 2002/03 to 2011/12; and (ii) mean annual trawl
intensity (hr/km2) for the combined fishing seasons of 2002/03-2006/07, 2007/08-
2011/12 and 2002/03-2011/12 from the fishing location (i.e. GPS location at the mid-
point from approximately 30% of annual trawl shots) provided by fishers in the
commercial logbooks. The first two time periods were selected to undertake five-year
comparisons while the entire 10-year period was selected as an historic baseline
because fishing effort was relatively stable from 2002/03 to 2011/12 (Table 5-2). GPS
coordinates that were either on land or within the 0-10 m depth stratum (where
trawling is prohibited) were treated as errors and removed from the dataset using
ArcGIS software. This resulted in an 18% reduction of the number of shots from the
original GPS data. To confirm remaining GPS coordinates reflected fishing location,
the resultant maps were qualitatively evaluated against reported catch and effort data
and validated by commercial fishers.
The filtered data were used to determine the trawling intensity categories of 'no
fishing', and 'low', ‘medium' and 'high' 'intensity'. Trawl path polygons were
31
constructed from the width of the trawl (i.e. 19.45 m, which assumes a net spread
factor of 0.75; after Carrick 1996), and the distance trawled (determined from trawl
speed and duration). As there was no information available on direction of the trawl
paths, all trawl shots were assumed to have a north-south orientation. For each given
period, the sum of the areas of all polygons multiplied by a scaling factor [(total
number of trawl shots)/(number of shots with GPS coordinates)] provided an estimate
of the cumulative area trawled. The actual area of the gulf trawled requires that the
overlap of trawl shots is taken into account. Thus, using the Dissolve Tool in ArcGIS,
all trawl path polygons were combined into a single, multi-part polygon, the area of
which was multiplied by the scaling factor to calculate the area fished. Effort data
were aggregated into four levels of trawl intensity (i) no fishing; (ii) low (0.1-1 h.km2);
(iii) medium (1.001-10 h.km2); (iv) and high (>10 h.km2). To prevent potentially
spurious GPS data from biasing the spatial extent of ‘low’ intensity trawling, areas
with very low trawling intensities (< 0.1 hr/km2) were included in the 'no fishing'
category. This threshold was increased for the five (< 0.5 hr/km2) and 10-year (< 1.0
hr/km2) distribution maps to account for cumulative effects. This resulted in a more
representative distribution of trawling undertaken by the fishery. These spatially
resolved effort data were used to quantify two potential performance indicators for
ecological assessment. These were (i) area of high trawl intensity; and
(ii) percentage of the area of no and low trawl intensity subsequently trawled. In
addition, data on the abundance of habitat forming, by-catch species (after Currie et
al. 2009) were overlaid onto the 10-year maps of trawl intensity with the medium and
high trawl intensity areas combined.
Subsequently, reported fishing effort from commercial logbooks was used to
determine the effort in each fishing block over the period 1990/91 to 2012/13. While
these data lack the spatial resolution of the GPS data, they enable the time series of
information on fishing location to be extended.
5.2.3.2 Ecosystem
Data relating to the interaction between the SGPF and Spencer Gulf ecosystem were
difficult to obtain and primarily restricted to those from the fishery-independent by-
catch study undertaken in 2007 (Currie et al. 2009). The analyses of these data and
identification of any potential performance indicators is described in the remaining
components of Section 6.2.3.
32
5.2.3.3 Target species
Data and information on the catch, effort and catch-composition data, fishery-
independent surveys, biology of Western King prawns and stock assessment and
management of the target species were obtained from the management plan for the
fishery (Dixon and Sloan 2007) and stock assessments. Data are synthesised,
integrated and analysed regularly in publically-available stock assessments for the
SGPF (e.g. Dixon et al. 2013b), that inform management arrangements for the
sustainable use of this resource underpinned by the guidelines in the management
plan for the fishery (PIRSA 2014b), so they have not been reproduced in this report.
Rather, a summary of the available data and information are provided in Section 7.
5.2.3.4 Non-target species: by-product and by-catch
By-product
There are three sources of by-product (i.e. southern calamary and Balmain bug) data
for the SGPF. These are (i) logbook data provided by commercial fishers;
(ii) abundance estimates from the single by-catch survey in 2007 (Currie et al. 2009);
and (iii) abundance estimates from the study of by-product in the SGPF (samples
from November 2008, February 2009 and March 2009; Roberts and Steer 2010).
Logbooks include estimates of the catch of the two permitted by-product species.
These data, which were available from 2002/03 to 2011/12, were aggregated by
fishing season to determine the total annual catches of each species (after Roberts
and Steer 2010). These long-term data were used to quantify two potential
performance indicators for ecological assessment. These were (i) mean annual catch
of southern calamary; and (ii) mean annual catch of Balmain bug. Subsequently,
abundance estimates of southern calamary and Balmain bug from Currie et al.
(2009) and Roberts and Steer (2010) were overlaid onto the 10-year map of trawl
intensity with the medium and high trawl intensity areas combined. Whilst this
provided a visual representation of the spatial overlap between prawn trawl intensity
and the abundance of by-product species during four time periods, the limited time
series of the by-product abundance data prevented identification of any additional
potential performance indicators for ecological assessment.
By-catch
The primary sources of data on by-catch in the SGPF are Svane et al. (2007) and
Currie et al. (2009). As by-catch in the SGPF potentially comprises many species
(Currie et al. 2009), species-specific analyses in this report were constrained to giant
33
cuttlefish, blue swimmer crabs and King George whiting. The first of these is an
iconic species and the last two are commercially important. Abundance estimates for
these three species from Currie et al. (2009) were overlaid onto the 10-year map of
trawl intensity with the medium and high trawl intensity areas combined. Whilst this
provided a visual representation of the spatial overlap between prawn trawl intensity
and the abundance of by-catch species, the limited time series of the by-catch
abundance data prevented identification of any additional potential performance
indicators for ecological assessment. Data from Svane et al. (2007) were spatially
limited and, consequently, omitted from these analyses.
5.2.3.5 Non-target species: threatened, endangered and protected species (TEPS)
The primary data on interactions of the SGPF with TEPS are derived from the
logbooks provided by commercial fishers (since 2009/10) and fishery-independent
surveys (2007; 2010/11-2012/13). The logbook data were aggregated by fishing
season to determine the total annual TEPS interactions (after Tsolos and Boyle
2013), and the interaction locations were overlaid onto the 10-year map of trawl
intensity with the medium and high trawl intensity areas combined, to provide a visual
representation of the spatial overlap between prawn trawl intensity and TEPS
interactions. The fishery-independent survey data were used to quantify syngnathid
catch rates spatially (i.e. by fishing region) and temporally. The analyses were
restricted to this species group because over 99% of TEPS interactions involve
syngnathids (Currie et al. 2009).
34
6 RESULTS AND DISCUSSION
6.1 Information available for ecological assessment of the SGPF
There are substantial, diverse, often long-term data sets available for the SGPF
(Table 6-1). Whilst most of the data have been collected for stock assessment of the
target species, there have also been several studies that directly or indirectly provide
data to support an environmental assessment of the SGPF against the remaining
four key components. For example, studies have quantified levels of (i) by-product;
(ii) by-catch; and (iii) interactions with TEPS. Several research projects have been
conducted to obtain information on the impacts of prawn trawling in Spencer Gulf,
including the fates and consequences of discarded by-catch (Svane 2003, 2005;
Svane et al. 2007, 2008; Currie et al. 2009), and the impacts of trawling on benthic
habitats and species assemblages (Svane et al. 2009). Nevertheless, there are few
data and limited information for ecological assessment of the SGPF against the
component ‘ecosystem’. This deficiency is being addressed in two ways (i) an FRDC-
funded project (FRDC 2011/205) that is developing an ecosystem model for Spencer
Gulf; and (ii) repeating the gulf-wide, 2007 by-catch survey (after Currie et al. 2009),
which will provide a platform for inter-annual comparisons. Both of these will be
informed by the studies of Carrick (1997), Svane (2003) and Svane et al. (2007).
The recent ESD risk assessment and ERAEF for the SGPF (PIRSA 2014a) used the
qualitative method of Fletcher et al. (2002). The target species (Western King prawn)
was medium risk, by-product species Balmain bug and southern calamary were low
risk and by-catch species (collectively) were high risk. Regardless of their risk
ranking, the species components of the SGPF were assessed further in the ERAEF
(Hobday et al. 2007, 2011b). Following stakeholder consideration, across all retained
and non-retained components, 23 out of 195 species were assessed further for the
purposes of considering management arrangements to mitigate risks These were
categorised as high risk species, or low/medium risk species where there were
strong divergent views, uncertainty in the information considered by a stakeholder
panel or a species of special interest (PIRSA 2014). For example, blue swimmer
crabs were considered a species of interest due to their high abundance in the by-
catch and their importance to the commercial blue swimmer crab fishery that
operates in Spencer Gulf. For 20 of these 23 species, management arrangements
were considered to be sufficient to mitigate any potential risk to those species
(PIRSA 2014). The exceptions were (i) tiger pipefish; (ii) coastal stingaree; and
(iii) giant cuttlefish (PIRSA 2014) for which mitigation strategies were developed.
35
Table 6-1 Summary of data and information available to inform ecological assessment of the Spencer Gulf Prawn Fishery. FD/FI=Fishery dependent/independent, O=Other). Ecological component Study Type Data Description Source
Habitat
Spatially resolved catch effort data FD ~30% of SGPF trawl shots provide Lat/Long locations SARDI Fisheries – Information Services By-catch survey FD Summary of by-catch distribution and abundance Carrick (1997) By-catch survey FD Summary of by-catch distribution and abundance 1994-2002 Dixon et al. (2005b) By-catch survey FD Summary of by-catch distribution and abundance Svane et al (2007) By-catch survey FI Habitat forming species Currie et al. (2009) By-catch survey FI Distribution and diversity of sponges in Spencer Gulf Sorokin and Currie (2009) Bathymetry/oceanography O Physical environmental variables Richardson et al. (2005) Sedimentology O SG seafloor sediment composition James and Bone (2011)
O’Connell (2014); O’Connell et al (in press).
Ecosystem (ecological communities and trophodynamics)
By-catch survey FI Habitat forming and community structure Currie et al. (2009)
By-catch survey FI Benthic macro-biota composition & distribution in Spencer Gulf Currie et al. (2011) By-catch survey FI Environmental gradients in demersal fish distribution &
trophodynamics in Spencer Gulf Currie and Sorokin (2010b) Currie and Sorokin (2010a)
Trophic group differentiation O C:N isotope ratios Svane et al. (2007) Trophodynamic modelling O Ecosystem model of Spencer Gulf - initiative Gillanders et al. (FRDC 2011/205) Trophodynamic modelling O GAB Ecosystem model Goldsworthy et al. 2013
Target species
Catch and effort data FD SARDI Fisheries – Information Services Dixon et al. (2013b) Survey (target species) FI SGPF stock assessment surveys Dixon et al. (2013b) Fisheries biology O Biological data Dixon et al. (2013b) Stock Assessment FD Catch/effort data, catch composition Carrick (2003); Carrick and McShane (1998); Carrick and Williams (2000, 2001);
Dixon et al. (2005a, 2007, 2009, 2010, 2012, 2013b); Dixon and Hooper (2008);
Non-target species: by-product
Catch/effort data FD SARDI Fisheries – Information Services Roberts and Steer (2010) By-product survey FD Biological data Roberts and Steer (2010) By-catch survey FI By-catch surveys to inform SGPF risk assessment Currie et al. (2009) By-catch survey FI Prawn fishery by-product and by-catch Svane et al. (2007)
Non-target species: By-catch
By-catch survey FI Prawn fishery by-catch Carrick (1997) By-catch survey FI Prawn fishery by-catch and discards Currie et al (2009) By-catch survey FI Monitoring & assessment of by-catch & discards Dixon et al. (2005b) Catch composition FD Catch/effort data, catch composition Dixon et al. (2013b) By-catch & lab. experiments O Fate & consumption of by-catch
Impacts of trawling on macro-flora & fauna Svane et al. (2008); Svane et al. (2009)
Non-target species: TEPS
TEPS logbook FD SARDI Fisheries – Information Services (TEPS interactions report) Tsolos and Boyle (2013) By-catch survey FI Prawn fishery by-catch and discards Currie et al. (2009) Survey (target species) FI SGPF stock assessment Dixon et al. (2013b) By-catch survey FI Taxonomy of Syngnathids in Spencer Gulf Sorokin et al. (2009)
36
6.1.1 Habitat
Data and information for ecological assessment against the component ‘habitat’ were
available from (i) logbook catch and effort data (SARDI); (ii) by-catch surveys
(Carrick 1997, Svane 2003; Dixon et al. 2005b, Svane et al. 2007, Currie et al. 2009);
(iii) sponge distribution and diversity (Sorokin and Currie 2009); (iii) Spencer Gulf
bathymetry and oceanography (Richardson et al. 2005); and (iv) sedimentology of
Spencer Gulf (James and Bone 2011; O’Connell 2014; O’Connell et al. in press;
Table 6-1).
Spatial distribution of fishing effort
The spatial distribution of fishing effort was used to map trawl intensity for each
fishing season (2002/03 to 2011/12; Figure 6-1) and the three combined fishing
season periods of 2002/03-2006/07, 2007/08-2011/12 and 2002/03-2011/12 (Figure
6-2) according to four trawl-intensity categories (no fishing; low, medium and high
intensity). The maps show that trawl intensities were generally consistent among
fishing seasons and, consequently, the maps of the aggregated fishing seasons were
similar to those of the individual fishing seasons (Figures 6-1, 6-2). Most trawling
occurred north of Corny Point in mid- to upper-Spencer Gulf with the highest trawl
intensities adjacent to Wallaroo. Medium trawl intensities occurred around the high
intensity region adjacent Wallaroo and also in southern Spencer Gulf, adjacent Corny
Point. Notably, however, these maps fail to capture the reduction in fishing effort in
the northern, more ecologically sensitive, areas of Spencer Gulf from 1999/2000 that
are evident in Figure 6-3, but for which no GPS data were available. The total area
available to the SGPF for prawn trawling (excluding waters <10 m depth) is
1,619,119 ha (1,619 km2), which represents 72% of the total area of Spencer Gulf
below the high-water mark (2,236 km2). From 2002/03 to 2011/12, and based on
point-density interpolation of GPS data, the total area of medium (estimated range:
219,819-310,356 ha) and high (estimated range: 27,713-46,575 ha) intensity trawling
were relatively stable, while the percentage of the available trawling area that was
not fished ranged from 34-52% (Tables 6-2, 6-3; Figures 6-1, 6-2). There was a slight
increasing trend in the area of low intensity trawling during this period (estimated
range: 513,719-674,025 ha). Notably, over the decade from 2002/03 to 2011/12, high
intensity trawling was estimated to have occurred over no more than 3% of the
available trawl area (Table 6-3).
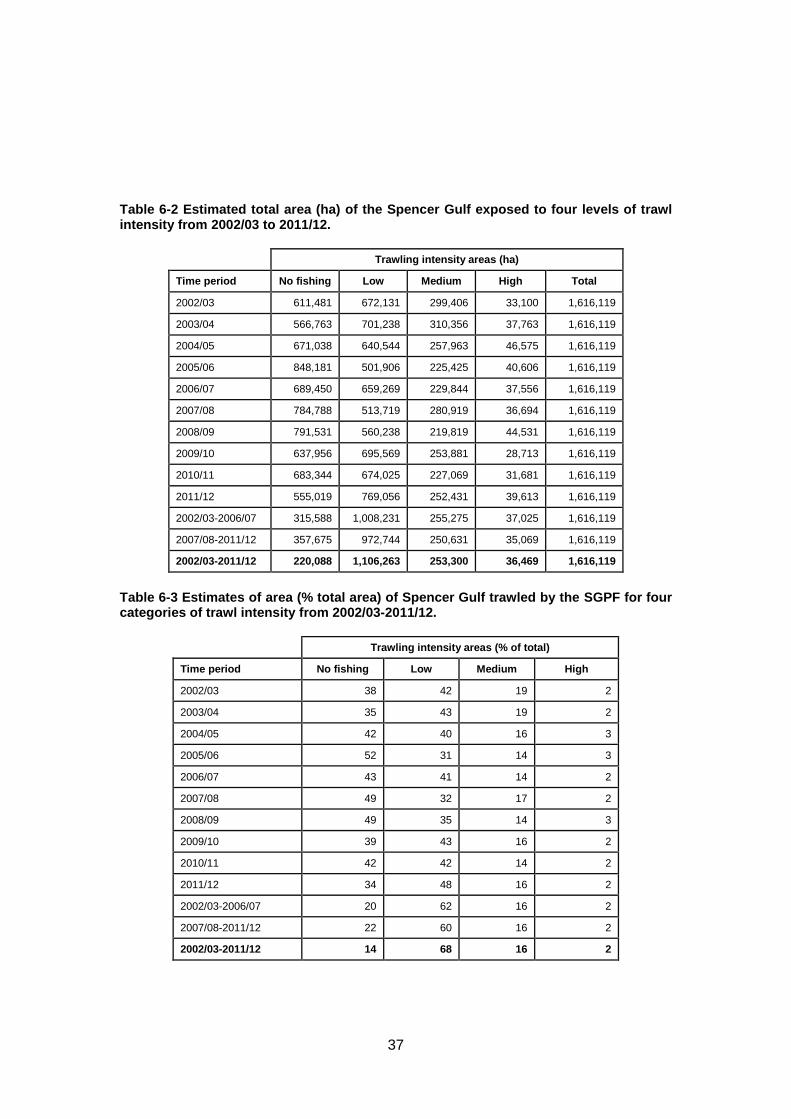
37
Table 6-2 Estimated total area (ha) of the Spencer Gulf exposed to four levels of trawl intensity from 2002/03 to 2011/12.
Trawling intensity areas (ha)
Time period No fishing Low Medium High Total
2002/03 611,481 672,131 299,406 33,100 1,616,119
2003/04 566,763 701,238 310,356 37,763 1,616,119
2004/05 671,038 640,544 257,963 46,575 1,616,119
2005/06 848,181 501,906 225,425 40,606 1,616,119
2006/07 689,450 659,269 229,844 37,556 1,616,119
2007/08 784,788 513,719 280,919 36,694 1,616,119
2008/09 791,531 560,238 219,819 44,531 1,616,119
2009/10 637,956 695,569 253,881 28,713 1,616,119
2010/11 683,344 674,025 227,069 31,681 1,616,119
2011/12 555,019 769,056 252,431 39,613 1,616,119
2002/03-2006/07 315,588 1,008,231 255,275 37,025 1,616,119
2007/08-2011/12 357,675 972,744 250,631 35,069 1,616,119
2002/03-2011/12 220,088 1,106,263 253,300 36,469 1,616,119
Table 6-3 Estimates of area (% total area) of Spencer Gulf trawled by the SGPF for four categories of trawl intensity from 2002/03-2011/12.
Trawling intensity areas (% of total)
Time period No fishing Low Medium High
2002/03 38 42 19 2
2003/04 35 43 19 2
2004/05 42 40 16 3
2005/06 52 31 14 3
2006/07 43 41 14 2
2007/08 49 32 17 2
2008/09 49 35 14 3
2009/10 39 43 16 2
2010/11 42 42 14 2
2011/12 34 48 16 2
2002/03-2006/07 20 62 16 2
2007/08-2011/12 22 60 16 2
2002/03-2011/12 14 68 16 2
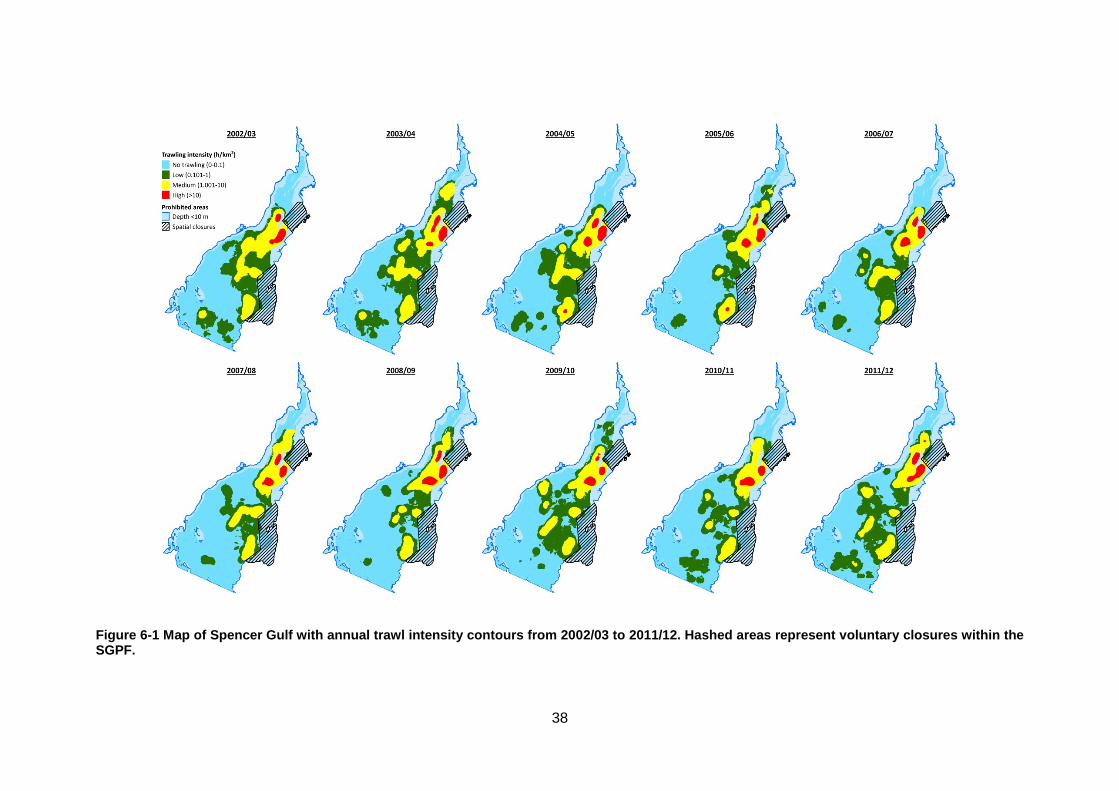
38
Figure 6-1 Map of Spencer Gulf with annual trawl intensity contours from 2002/03 to 2011/12. Hashed areas represent voluntary closures within the SGPF.
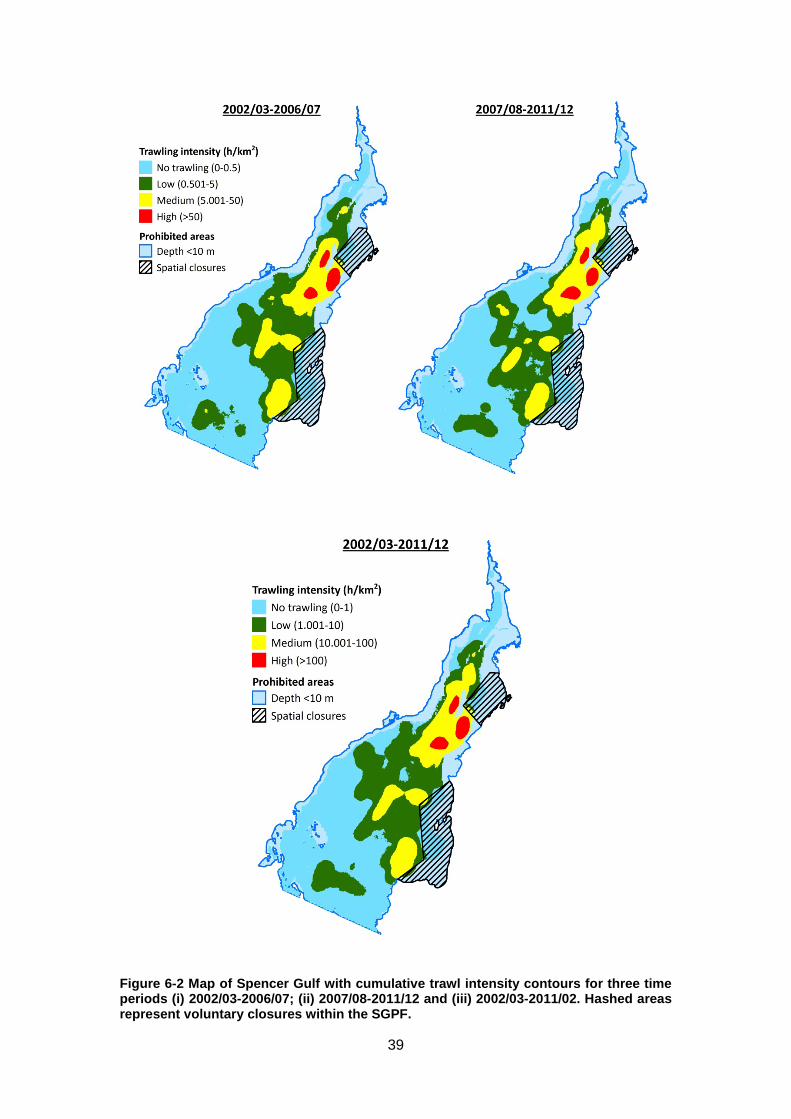
39
Figure 6-2 Map of Spencer Gulf with cumulative trawl intensity contours for three time periods (i) 2002/03-2006/07; (ii) 2007/08-2011/12 and (iii) 2002/03-2011/02. Hashed areas represent voluntary closures within the SGPF.
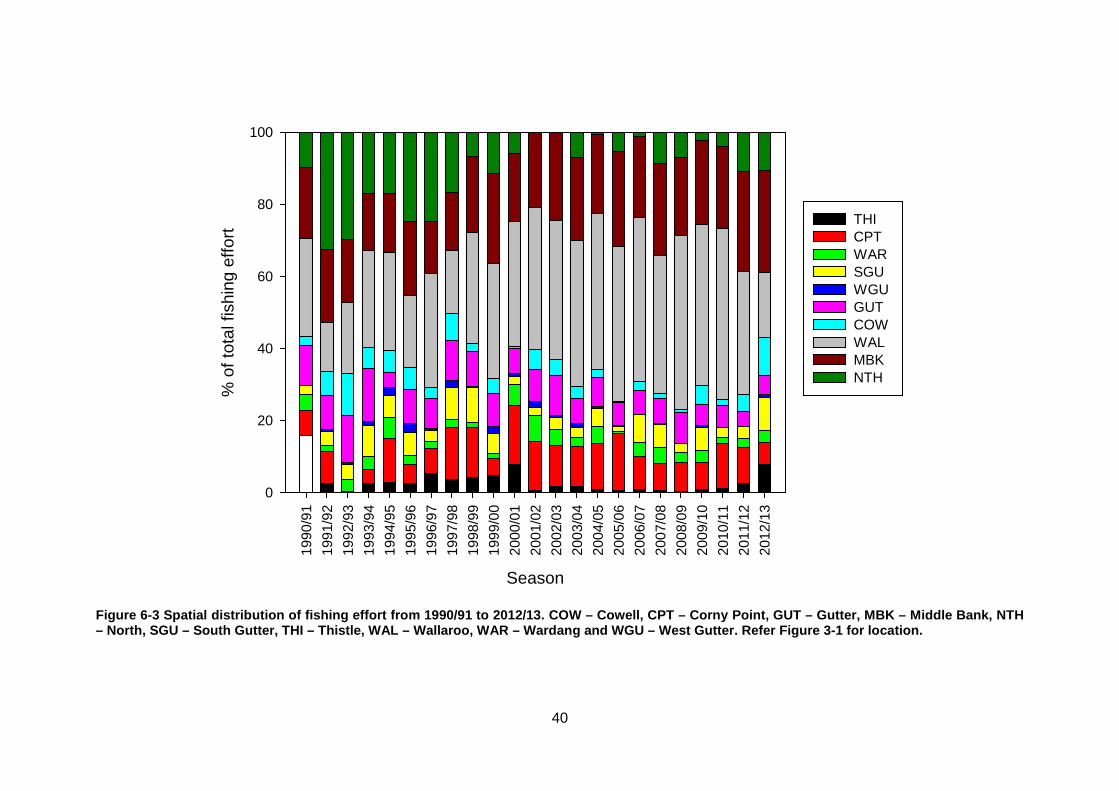
40
Figure 6-3 Spatial distribution of fishing effort from 1990/91 to 2012/13. COW – Cowell, CPT – Corny Point, GUT – Gutter, MBK – Middle Bank, NTH – North, SGU – South Gutter, THI – Thistle, WAL – Wallaroo, WAR – Wardang and WGU – West Gutter. Refer Figure 3-1 for location.
Season
1990
/91
1991
/92
1992
/93
1993
/94
1994
/95
1995
/96
1996
/97
1997
/98
1998
/99
1999
/00
2000
/01
2001
/02
2002
/03
2003
/04
2004
/05
2005
/06
2006
/07
2007
/08
2008
/09
2009
/10
2010
/11
2011
/12
2012
/13
% o
f tot
al fi
shin
g ef
fort
0
20
40
60
80
100
THI CPT WAR SGU WGU GUT COW WAL MBK NTH
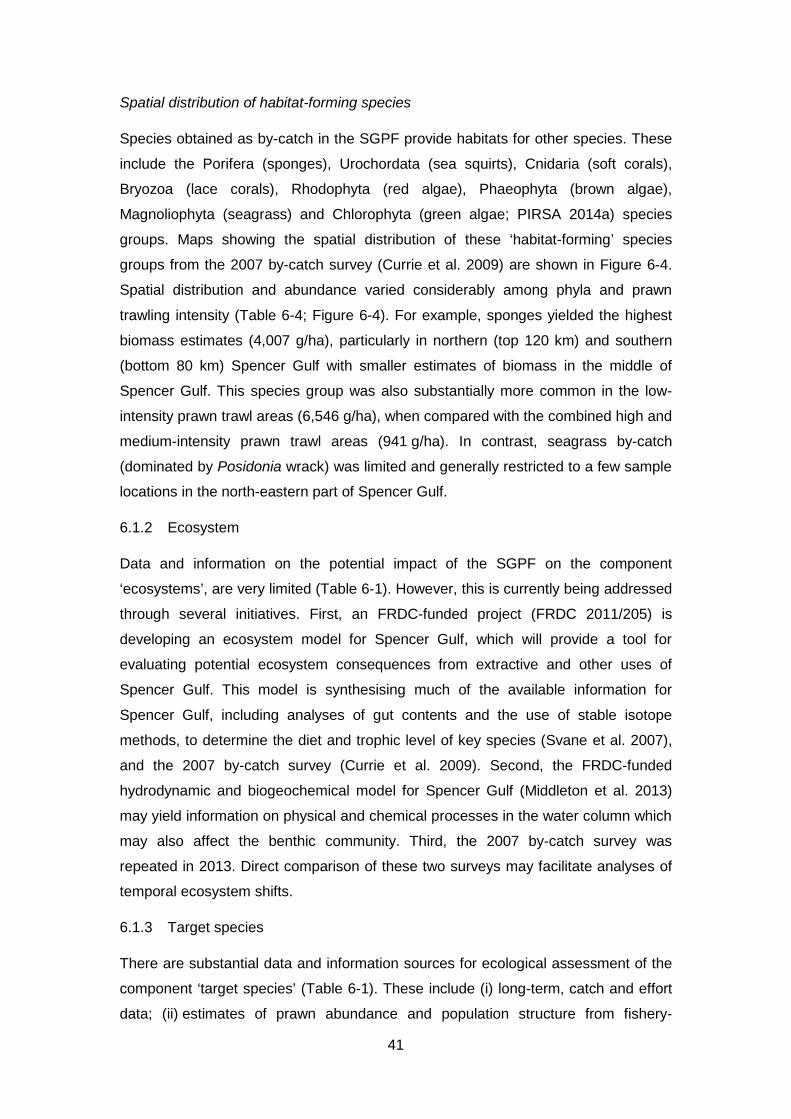
41
Spatial distribution of habitat-forming species
Species obtained as by-catch in the SGPF provide habitats for other species. These
include the Porifera (sponges), Urochordata (sea squirts), Cnidaria (soft corals),
Bryozoa (lace corals), Rhodophyta (red algae), Phaeophyta (brown algae),
Magnoliophyta (seagrass) and Chlorophyta (green algae; PIRSA 2014a) species
groups. Maps showing the spatial distribution of these ‘habitat-forming’ species
groups from the 2007 by-catch survey (Currie et al. 2009) are shown in Figure 6-4.
Spatial distribution and abundance varied considerably among phyla and prawn
trawling intensity (Table 6-4; Figure 6-4). For example, sponges yielded the highest
biomass estimates (4,007 g/ha), particularly in northern (top 120 km) and southern
(bottom 80 km) Spencer Gulf with smaller estimates of biomass in the middle of
Spencer Gulf. This species group was also substantially more common in the low-
intensity prawn trawl areas (6,546 g/ha), when compared with the combined high and
medium-intensity prawn trawl areas (941 g/ha). In contrast, seagrass by-catch
(dominated by Posidonia wrack) was limited and generally restricted to a few sample
locations in the north-eastern part of Spencer Gulf.
6.1.2 Ecosystem
Data and information on the potential impact of the SGPF on the component
‘ecosystems’, are very limited (Table 6-1). However, this is currently being addressed
through several initiatives. First, an FRDC-funded project (FRDC 2011/205) is
developing an ecosystem model for Spencer Gulf, which will provide a tool for
evaluating potential ecosystem consequences from extractive and other uses of
Spencer Gulf. This model is synthesising much of the available information for
Spencer Gulf, including analyses of gut contents and the use of stable isotope
methods, to determine the diet and trophic level of key species (Svane et al. 2007),
and the 2007 by-catch survey (Currie et al. 2009). Second, the FRDC-funded
hydrodynamic and biogeochemical model for Spencer Gulf (Middleton et al. 2013)
may yield information on physical and chemical processes in the water column which
may also affect the benthic community. Third, the 2007 by-catch survey was
repeated in 2013. Direct comparison of these two surveys may facilitate analyses of
temporal ecosystem shifts.
6.1.3 Target species
There are substantial data and information sources for ecological assessment of the
component ‘target species’ (Table 6-1). These include (i) long-term, catch and effort
data; (ii) estimates of prawn abundance and population structure from fishery-
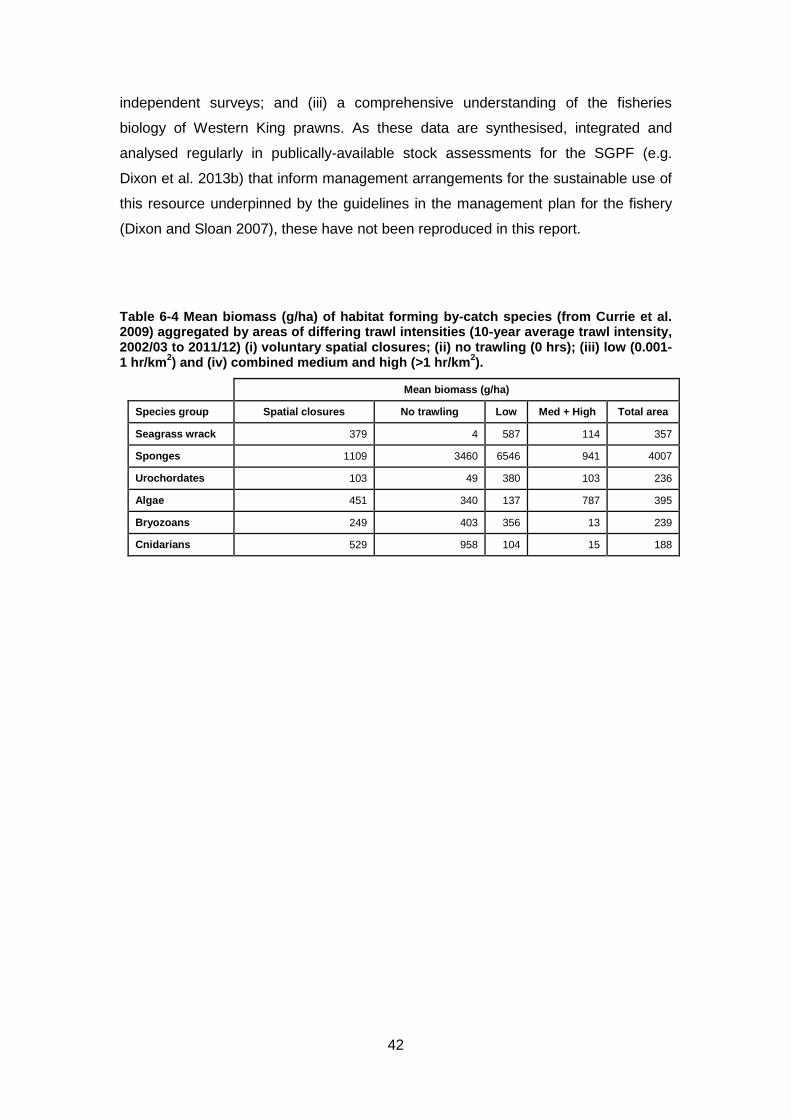
42
independent surveys; and (iii) a comprehensive understanding of the fisheries
biology of Western King prawns. As these data are synthesised, integrated and
analysed regularly in publically-available stock assessments for the SGPF (e.g.
Dixon et al. 2013b) that inform management arrangements for the sustainable use of
this resource underpinned by the guidelines in the management plan for the fishery
(Dixon and Sloan 2007), these have not been reproduced in this report.
Table 6-4 Mean biomass (g/ha) of habitat forming by-catch species (from Currie et al. 2009) aggregated by areas of differing trawl intensities (10-year average trawl intensity, 2002/03 to 2011/12) (i) voluntary spatial closures; (ii) no trawling (0 hrs); (iii) low (0.001-1 hr/km2) and (iv) combined medium and high (>1 hr/km2).
Mean biomass (g/ha)
Species group Spatial closures No trawling Low Med + High Total area
Seagrass wrack 379 4 587 114 357
Sponges 1109 3460 6546 941 4007
Urochordates 103 49 380 103 236
Algae 451 340 137 787 395
Bryozoans 249 403 356 13 239
Cnidarians 529 958 104 15 188
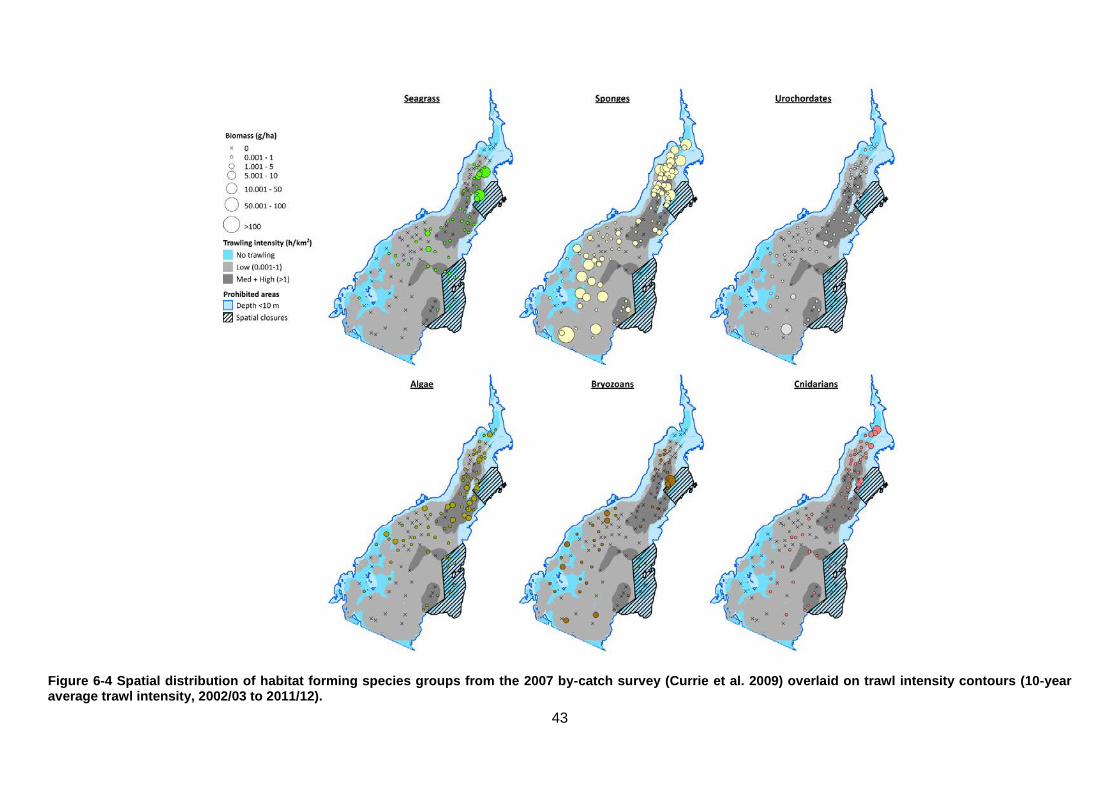
43
Figure 6-4 Spatial distribution of habitat forming species groups from the 2007 by-catch survey (Currie et al. 2009) overlaid on trawl intensity contours (10-year average trawl intensity, 2002/03 to 2011/12).
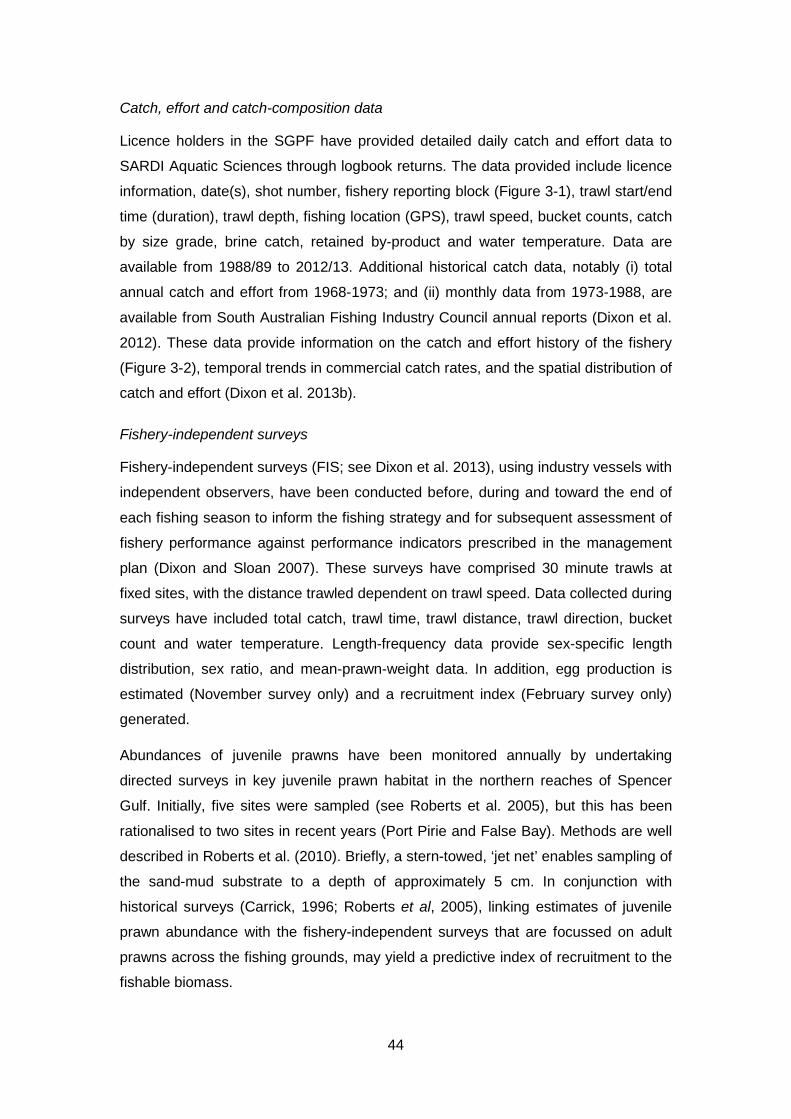
44
Catch, effort and catch-composition data
Licence holders in the SGPF have provided detailed daily catch and effort data to
SARDI Aquatic Sciences through logbook returns. The data provided include licence
information, date(s), shot number, fishery reporting block (Figure 3-1), trawl start/end
time (duration), trawl depth, fishing location (GPS), trawl speed, bucket counts, catch
by size grade, brine catch, retained by-product and water temperature. Data are
available from 1988/89 to 2012/13. Additional historical catch data, notably (i) total
annual catch and effort from 1968-1973; and (ii) monthly data from 1973-1988, are
available from South Australian Fishing Industry Council annual reports (Dixon et al.
2012). These data provide information on the catch and effort history of the fishery
(Figure 3-2), temporal trends in commercial catch rates, and the spatial distribution of
catch and effort (Dixon et al. 2013b).
Fishery-independent surveys
Fishery-independent surveys (FIS; see Dixon et al. 2013), using industry vessels with
independent observers, have been conducted before, during and toward the end of
each fishing season to inform the fishing strategy and for subsequent assessment of
fishery performance against performance indicators prescribed in the management
plan (Dixon and Sloan 2007). These surveys have comprised 30 minute trawls at
fixed sites, with the distance trawled dependent on trawl speed. Data collected during
surveys have included total catch, trawl time, trawl distance, trawl direction, bucket
count and water temperature. Length-frequency data provide sex-specific length
distribution, sex ratio, and mean-prawn-weight data. In addition, egg production is
estimated (November survey only) and a recruitment index (February survey only)
generated.
Abundances of juvenile prawns have been monitored annually by undertaking
directed surveys in key juvenile prawn habitat in the northern reaches of Spencer
Gulf. Initially, five sites were sampled (see Roberts et al. 2005), but this has been
rationalised to two sites in recent years (Port Pirie and False Bay). Methods are well
described in Roberts et al. (2010). Briefly, a stern-towed, ‘jet net’ enables sampling of
the sand-mud substrate to a depth of approximately 5 cm. In conjunction with
historical surveys (Carrick, 1996; Roberts et al, 2005), linking estimates of juvenile
prawn abundance with the fishery-independent surveys that are focussed on adult
prawns across the fishing grounds, may yield a predictive index of recruitment to the
fishable biomass.
45
Biology of Western King prawns
The biology of the target species, Western King prawns (Penaeus (Melicertus)
latisulcatus) is well described in Dixon et al. (2013b). Information available
encompasses distribution and taxonomy, stock structure, reproductive biology
including size at maturity and fecundity, growth rates, natural mortality estimates and
movement patterns.
Stock assessment and management
There have been twelve assessments of the prawn resource that supports the SGPF
(Carrick and McShane 1998; Carrick and Williams 2000, 2001; Carrick 2003; Dixon
and Hooper 2008; Dixon et al. 2005a, 2007, 2009, 2010, 2012, 2013b; Noell et al.
2014). Stock assessments synthesise information available for the fishery, assess
the status of the resource, and comment on the performance of the fishery with
respect to biological performance indicators and reference points. From 2004, stock
assessments have also documented the biology and management of Western King
prawn and, since 2007, assessments have explicitly addressed the suite of
performance indicators prescribed in the relevant management plan (Dixon and
Sloan 2007). More recent assessment reports have also undertaken spatial and
temporal analyses to link survey data with subsequent commercial catches.
The new management plan for the fishery (PIRSA 2014b) is a comprehensive
document describing the evolution of the SGPF, the legislative and regulatory
framework and the management arrangements, including the first ecological
performance indicators (Table 6-5). While this approach reflects a preliminary
outcome from this project, there is a need to review these performance indicators
and reference points to ensure their quantification and linkage to decision rules in
subsequent management plans for the fishery.
6.1.4 Non-target species: by-product and by-catch
Non-target species comprise by-product and by-catch. By-product species are not
targeted, but may be retained. Two species, southern calamary and Balmain bug, are
permitted by-product in the SGPF. In contrast, by-catch comprises species that are
incidentally caught during prawn trawling, which must be discarded. By-catch of
TEPS is considered in Section 6.2.1.5.
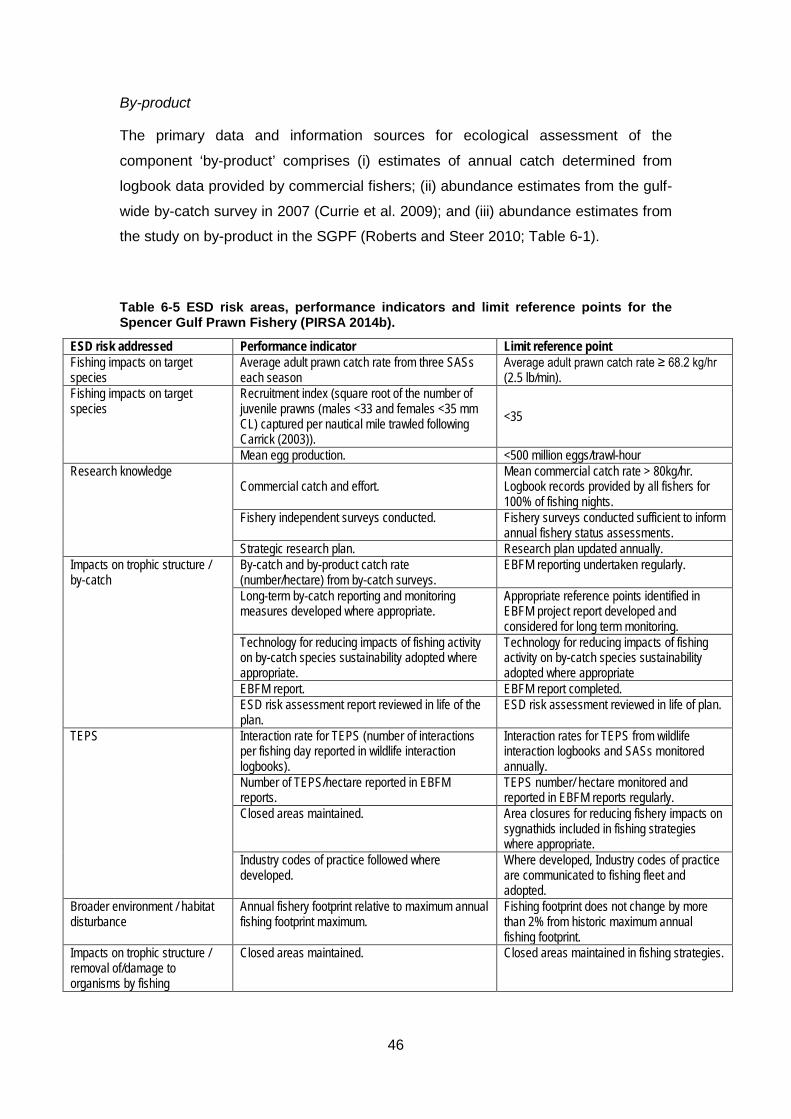
46
By-product
The primary data and information sources for ecological assessment of the
component ‘by-product’ comprises (i) estimates of annual catch determined from
logbook data provided by commercial fishers; (ii) abundance estimates from the gulf-
wide by-catch survey in 2007 (Currie et al. 2009); and (iii) abundance estimates from
the study on by-product in the SGPF (Roberts and Steer 2010; Table 6-1).
Table 6-5 ESD risk areas, performance indicators and limit reference points for the Spencer Gulf Prawn Fishery (PIRSA 2014b).
ESD risk addressed Performance indicator Limit reference point Fishing impacts on target species
Average adult prawn catch rate from three SASs each season
Average adult prawn catch rate ≥ 68.2 kg/hr (2.5 lb/min).
Fishing impacts on target species
Recruitment index (square root of the number of juvenile prawns (males <33 and females <35 mm CL) captured per nautical mile trawled following Carrick (2003)).
<35
Mean egg production. <500 million eggs/trawl-hour Research knowledge
Commercial catch and effort. Mean commercial catch rate > 80kg/hr. Logbook records provided by all fishers for 100% of fishing nights.
Fishery independent surveys conducted. Fishery surveys conducted sufficient to inform annual fishery status assessments.
Strategic research plan. Research plan updated annually. Impacts on trophic structure / by-catch
By-catch and by-product catch rate (number/hectare) from by-catch surveys.
EBFM reporting undertaken regularly.
Long-term by-catch reporting and monitoring measures developed where appropriate.
Appropriate reference points identified in EBFM project report developed and considered for long term monitoring.
Technology for reducing impacts of fishing activity on by-catch species sustainability adopted where appropriate.
Technology for reducing impacts of fishing activity on by-catch species sustainability adopted where appropriate
EBFM report. EBFM report completed. ESD risk assessment report reviewed in life of the plan.
ESD risk assessment reviewed in life of plan.
TEPS Interaction rate for TEPS (number of interactions per fishing day reported in wildlife interaction logbooks).
Interaction rates for TEPS from wildlife interaction logbooks and SASs monitored annually.
Number of TEPS/hectare reported in EBFM reports.
TEPS number/ hectare monitored and reported in EBFM reports regularly.
Closed areas maintained. Area closures for reducing fishery impacts on sygnathids included in fishing strategies where appropriate.
Industry codes of practice followed where developed.
Where developed, Industry codes of practice are communicated to fishing fleet and adopted.
Broader environment / habitat disturbance
Annual fishery footprint relative to maximum annual fishing footprint maximum.
Fishing footprint does not change by more than 2% from historic maximum annual fishing footprint.
Impacts on trophic structure / removal of/damage to organisms by fishing
Closed areas maintained. Closed areas maintained in fishing strategies.
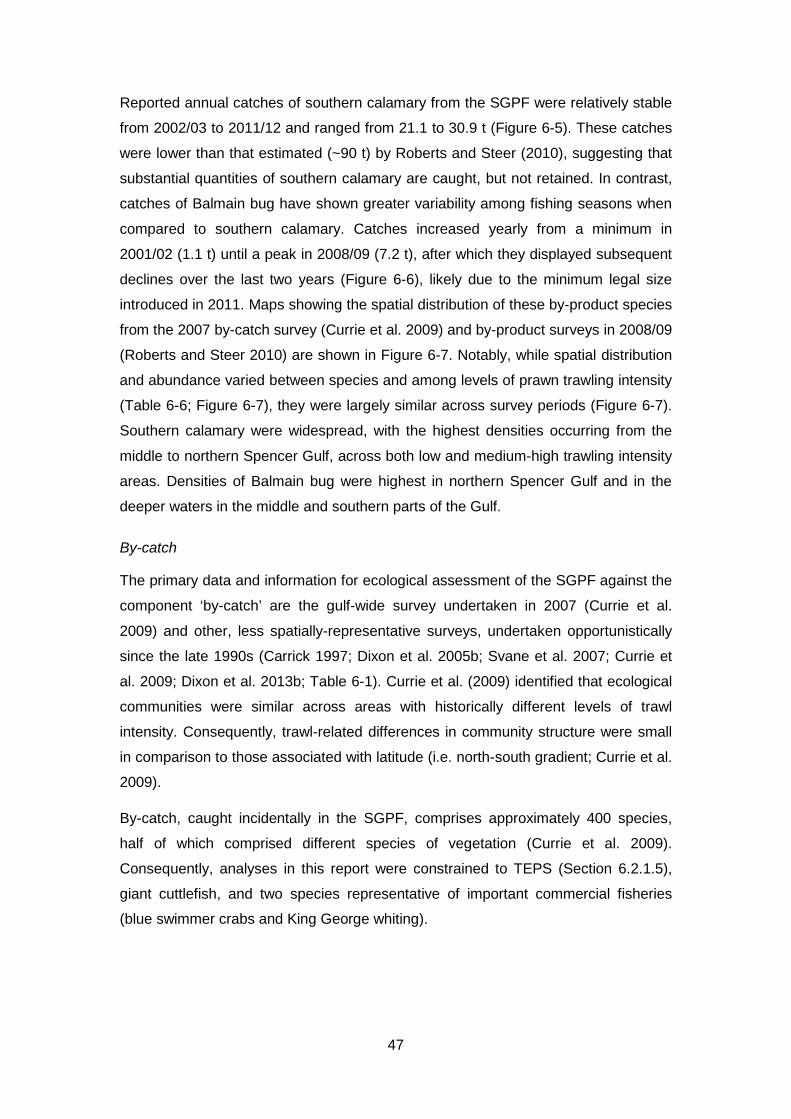
47
Reported annual catches of southern calamary from the SGPF were relatively stable
from 2002/03 to 2011/12 and ranged from 21.1 to 30.9 t (Figure 6-5). These catches
were lower than that estimated (~90 t) by Roberts and Steer (2010), suggesting that
substantial quantities of southern calamary are caught, but not retained. In contrast,
catches of Balmain bug have shown greater variability among fishing seasons when
compared to southern calamary. Catches increased yearly from a minimum in
2001/02 (1.1 t) until a peak in 2008/09 (7.2 t), after which they displayed subsequent
declines over the last two years (Figure 6-6), likely due to the minimum legal size
introduced in 2011. Maps showing the spatial distribution of these by-product species
from the 2007 by-catch survey (Currie et al. 2009) and by-product surveys in 2008/09
(Roberts and Steer 2010) are shown in Figure 6-7. Notably, while spatial distribution
and abundance varied between species and among levels of prawn trawling intensity
(Table 6-6; Figure 6-7), they were largely similar across survey periods (Figure 6-7).
Southern calamary were widespread, with the highest densities occurring from the
middle to northern Spencer Gulf, across both low and medium-high trawling intensity
areas. Densities of Balmain bug were highest in northern Spencer Gulf and in the
deeper waters in the middle and southern parts of the Gulf.
By-catch
The primary data and information for ecological assessment of the SGPF against the
component ‘by-catch’ are the gulf-wide survey undertaken in 2007 (Currie et al.
2009) and other, less spatially-representative surveys, undertaken opportunistically
since the late 1990s (Carrick 1997; Dixon et al. 2005b; Svane et al. 2007; Currie et
al. 2009; Dixon et al. 2013b; Table 6-1). Currie et al. (2009) identified that ecological
communities were similar across areas with historically different levels of trawl
intensity. Consequently, trawl-related differences in community structure were small
in comparison to those associated with latitude (i.e. north-south gradient; Currie et al.
2009).
By-catch, caught incidentally in the SGPF, comprises approximately 400 species,
half of which comprised different species of vegetation (Currie et al. 2009).
Consequently, analyses in this report were constrained to TEPS (Section 6.2.1.5),
giant cuttlefish, and two species representative of important commercial fisheries
(blue swimmer crabs and King George whiting).
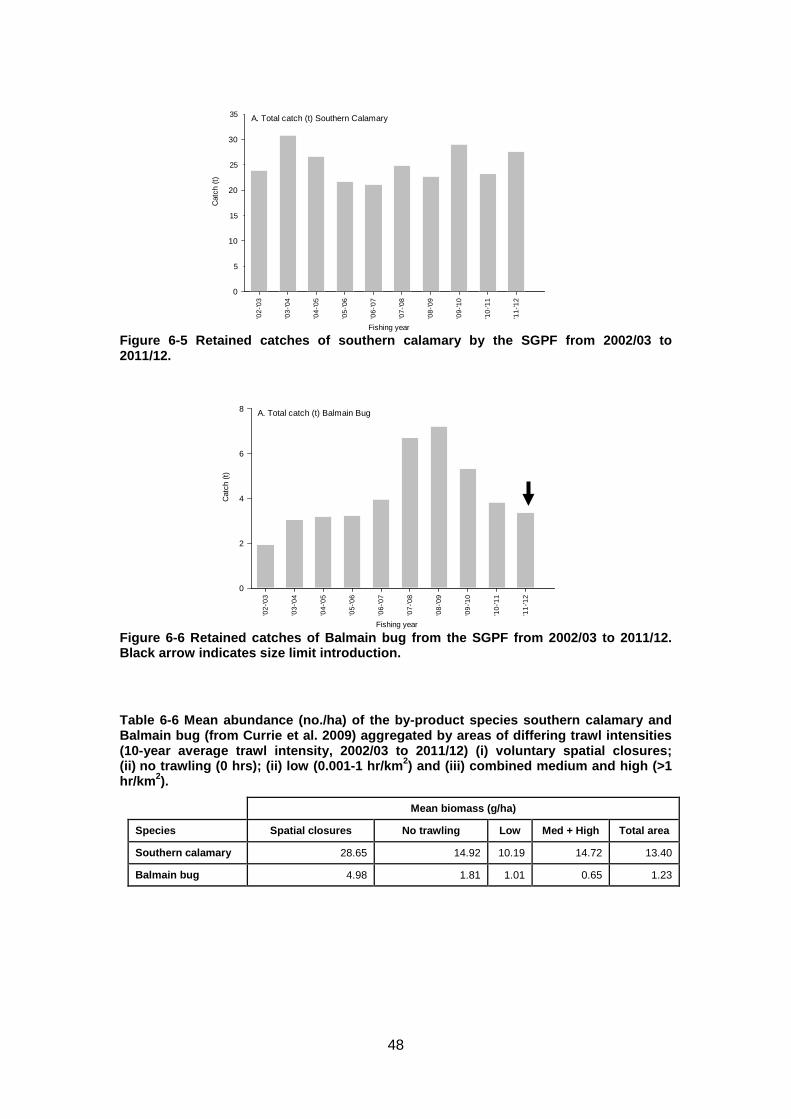
48
Figure 6-5 Retained catches of southern calamary by the SGPF from 2002/03 to 2011/12.
Figure 6-6 Retained catches of Balmain bug from the SGPF from 2002/03 to 2011/12. Black arrow indicates size limit introduction.
Table 6-6 Mean abundance (no./ha) of the by-product species southern calamary and Balmain bug (from Currie et al. 2009) aggregated by areas of differing trawl intensities (10-year average trawl intensity, 2002/03 to 2011/12) (i) voluntary spatial closures; (ii) no trawling (0 hrs); (ii) low (0.001-1 hr/km2) and (iii) combined medium and high (>1 hr/km2).
Mean biomass (g/ha)
Species Spatial closures No trawling Low Med + High Total area
Southern calamary 28.65 14.92 10.19 14.72 13.40
Balmain bug 4.98 1.81 1.01 0.65 1.23
Fishing year
'02-
'03
'03-
'04
'04-
'05
'05-
'06
'06-
'07
'07-
'08
'08-
'09
'09-
'10
'10-
'11
'11-
'12
Cat
ch (t
)
5
15
25
35
0
10
20
30
A. Total catch (t) Southern Calamary
Fishing year
'02-
'03
'03-
'04
'04-
'05
'05-
'06
'06-
'07
'07-
'08
'08-
'09
'09-
'10
'10-
'11
'11-
'12
Cat
ch (t
)
0
2
4
6
8
A. Total catch (t) Balmain Bug
C
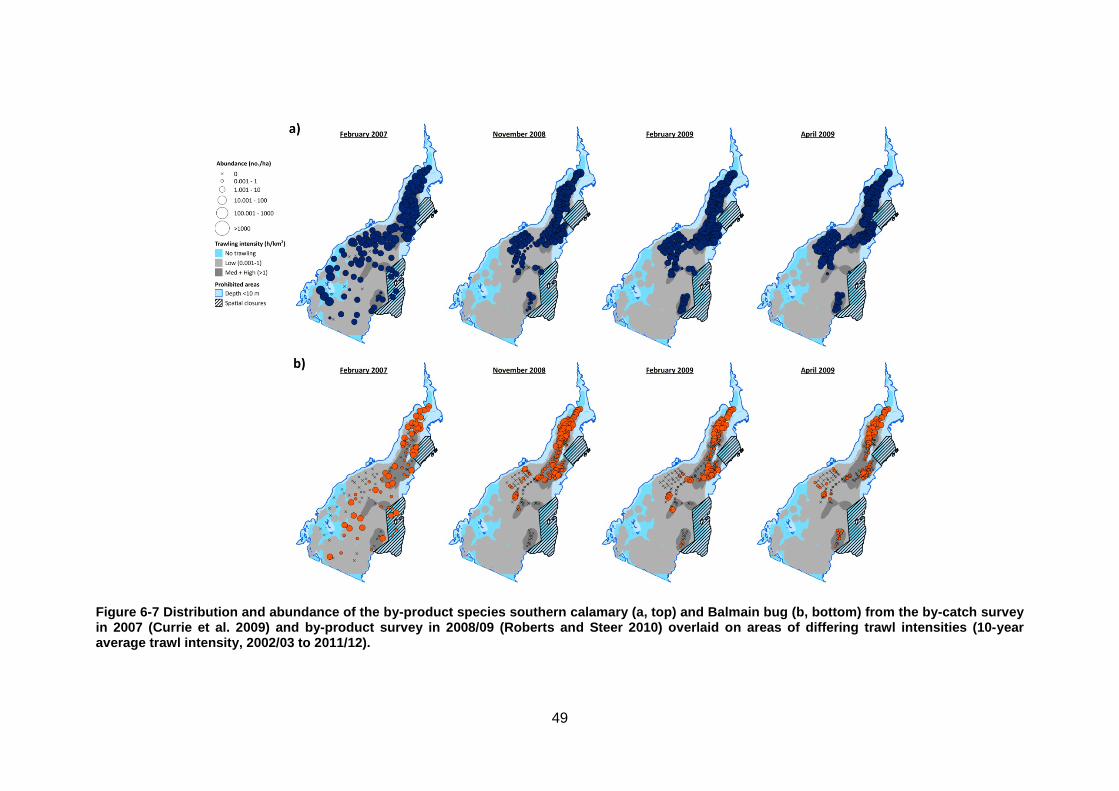
49
Figure 6-7 Distribution and abundance of the by-product species southern calamary (a, top) and Balmain bug (b, bottom) from the by-catch survey in 2007 (Currie et al. 2009) and by-product survey in 2008/09 (Roberts and Steer 2010) overlaid on areas of differing trawl intensities (10-year average trawl intensity, 2002/03 to 2011/12).
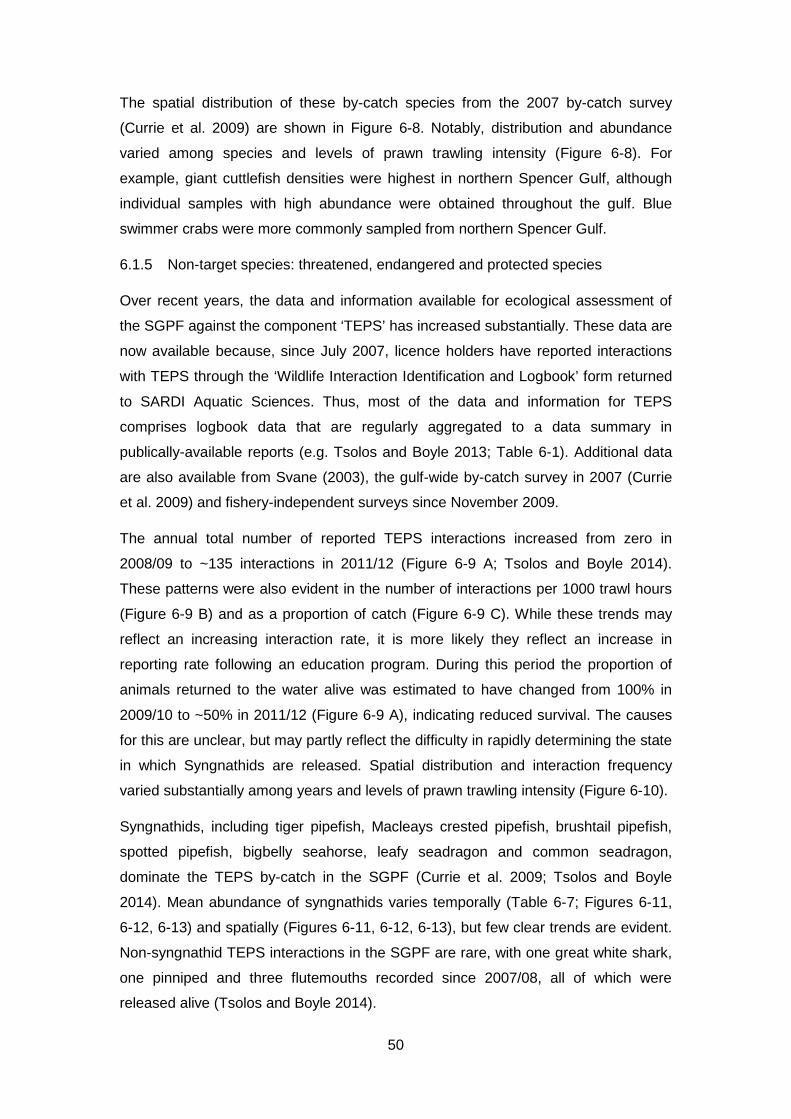
50
The spatial distribution of these by-catch species from the 2007 by-catch survey
(Currie et al. 2009) are shown in Figure 6-8. Notably, distribution and abundance
varied among species and levels of prawn trawling intensity (Figure 6-8). For
example, giant cuttlefish densities were highest in northern Spencer Gulf, although
individual samples with high abundance were obtained throughout the gulf. Blue
swimmer crabs were more commonly sampled from northern Spencer Gulf.
6.1.5 Non-target species: threatened, endangered and protected species
Over recent years, the data and information available for ecological assessment of
the SGPF against the component ‘TEPS’ has increased substantially. These data are
now available because, since July 2007, licence holders have reported interactions
with TEPS through the ‘Wildlife Interaction Identification and Logbook’ form returned
to SARDI Aquatic Sciences. Thus, most of the data and information for TEPS
comprises logbook data that are regularly aggregated to a data summary in
publically-available reports (e.g. Tsolos and Boyle 2013; Table 6-1). Additional data
are also available from Svane (2003), the gulf-wide by-catch survey in 2007 (Currie
et al. 2009) and fishery-independent surveys since November 2009.
The annual total number of reported TEPS interactions increased from zero in
2008/09 to ~135 interactions in 2011/12 (Figure 6-9 A; Tsolos and Boyle 2014).
These patterns were also evident in the number of interactions per 1000 trawl hours
(Figure 6-9 B) and as a proportion of catch (Figure 6-9 C). While these trends may
reflect an increasing interaction rate, it is more likely they reflect an increase in
reporting rate following an education program. During this period the proportion of
animals returned to the water alive was estimated to have changed from 100% in
2009/10 to ~50% in 2011/12 (Figure 6-9 A), indicating reduced survival. The causes
for this are unclear, but may partly reflect the difficulty in rapidly determining the state
in which Syngnathids are released. Spatial distribution and interaction frequency
varied substantially among years and levels of prawn trawling intensity (Figure 6-10).
Syngnathids, including tiger pipefish, Macleays crested pipefish, brushtail pipefish,
spotted pipefish, bigbelly seahorse, leafy seadragon and common seadragon,
dominate the TEPS by-catch in the SGPF (Currie et al. 2009; Tsolos and Boyle
2014). Mean abundance of syngnathids varies temporally (Table 6-7; Figures 6-11,
6-12, 6-13) and spatially (Figures 6-11, 6-12, 6-13), but few clear trends are evident.
Non-syngnathid TEPS interactions in the SGPF are rare, with one great white shark,
one pinniped and three flutemouths recorded since 2007/08, all of which were
released alive (Tsolos and Boyle 2014).
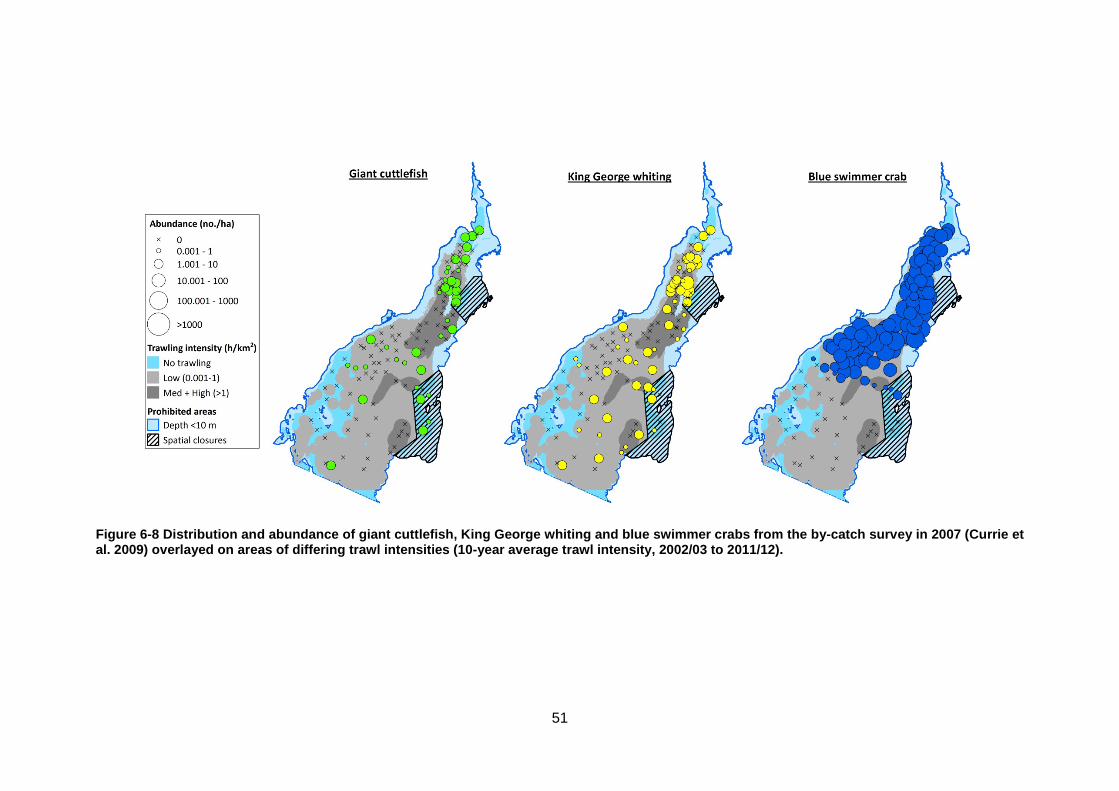
51
Figure 6-8 Distribution and abundance of giant cuttlefish, King George whiting and blue swimmer crabs from the by-catch survey in 2007 (Currie et al. 2009) overlayed on areas of differing trawl intensities (10-year average trawl intensity, 2002/03 to 2011/12).
52
Figure 6-9 A. Annual total number of TEPS caught (bars) and the proportion released alive (dashed line) from the SGPF since 2007; B. number of TEPS caught per thousand hours of effort and; C. number of TEPS caught per tonne of reported prawn catch in the SGPF.
Figure 6-10 Distribution and total reported number of TEPS (bubble size, total no./trawl shot), in 2009/10, 2010/11 and 2011/12 (Wildlife Interaction Logbooks), overlaid on areas of differing trawl intensity (10-year average trawl intensity, 2002/03 to 2011/12). Note: the number and location of survey sites differs through time.
Fishing year
2008/09 2009/10 2010/11 2011/12
Num
ber p
er 1
000
traw
l hou
rs
0
2
4
6
8
Fishing year2008/09 2009/10 2010/11 2011/12
Tota
l num
ber
0
20
40
60
80
100
120
140
Pro
porti
on re
leas
ed a
live
0.0
0.2
0.4
0.6
0.8
1.0
0
Fishing year
2008/09 2009/10 2010/11 2011/12
Num
ber p
er to
nne
0.00
0.02
0.04
0.06
0.08
0.10
0 0
A.
B. C.
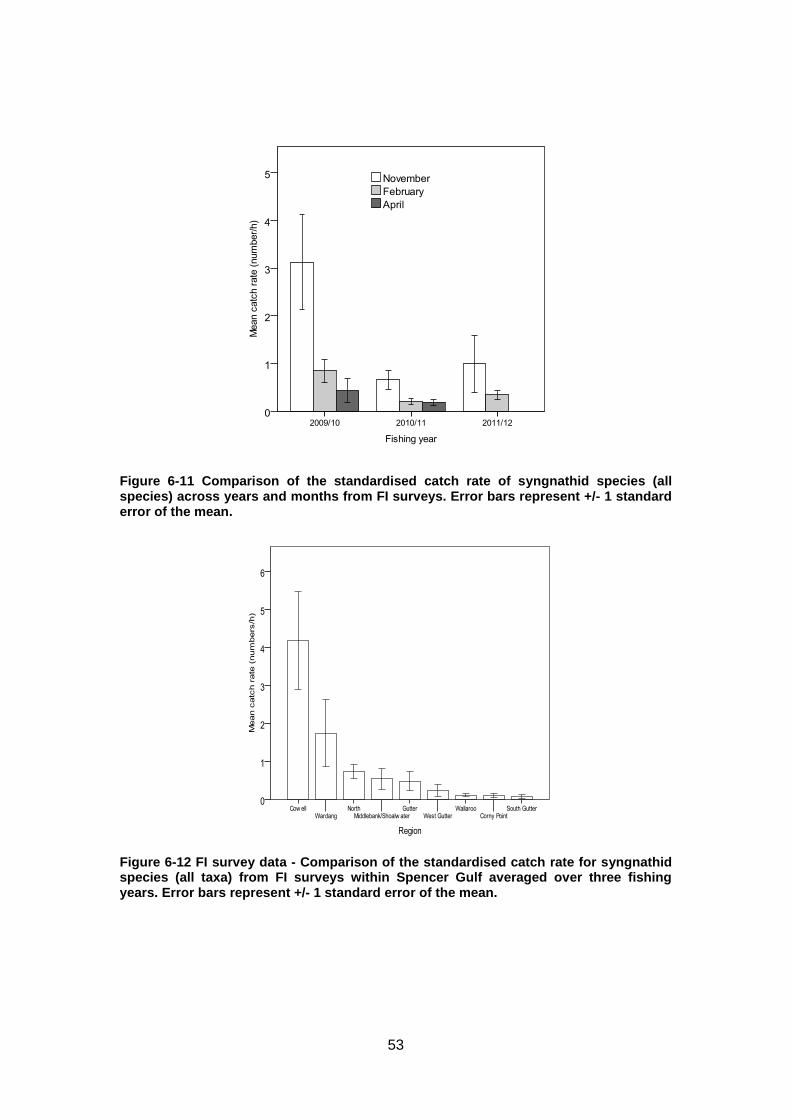
53
Figure 6-11 Comparison of the standardised catch rate of syngnathid species (all species) across years and months from FI surveys. Error bars represent +/- 1 standard error of the mean.
Figure 6-12 FI survey data - Comparison of the standardised catch rate for syngnathid species (all taxa) from FI surveys within Spencer Gulf averaged over three fishing years. Error bars represent +/- 1 standard error of the mean.
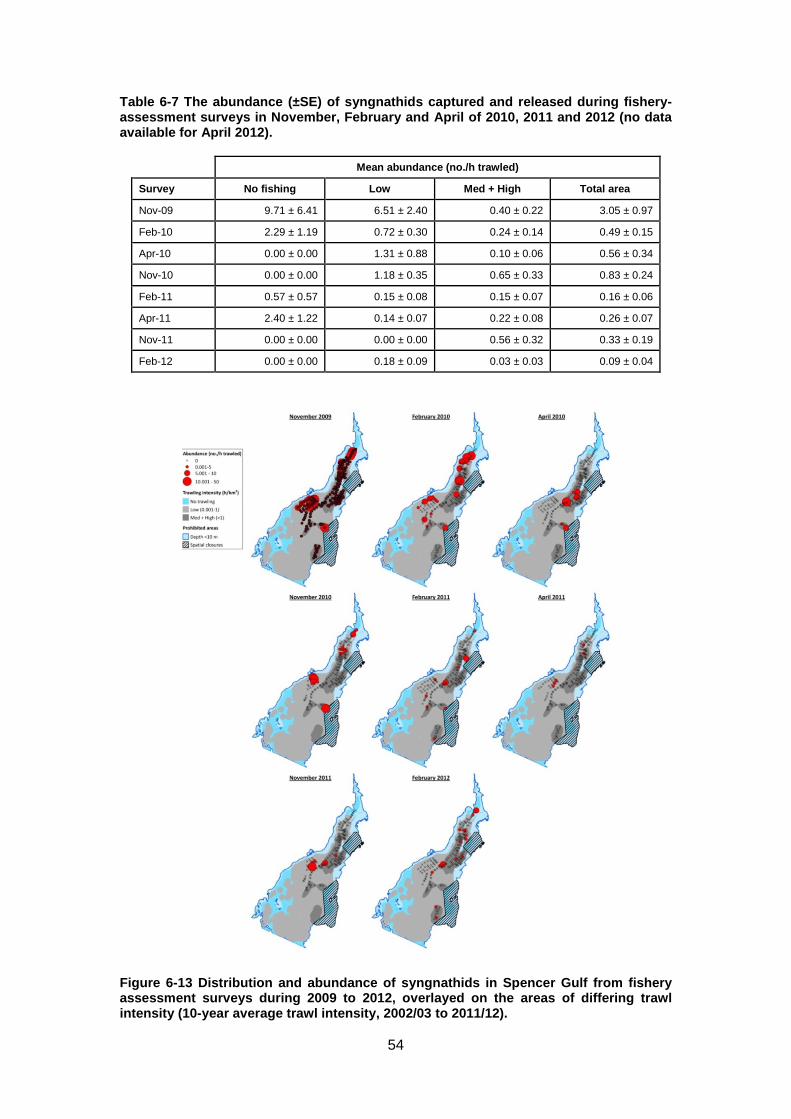
54
Table 6-7 The abundance (±SE) of syngnathids captured and released during fishery-assessment surveys in November, February and April of 2010, 2011 and 2012 (no data available for April 2012).
Mean abundance (no./h trawled)
Survey No fishing Low Med + High Total area
Nov-09 9.71 ± 6.41 6.51 ± 2.40 0.40 ± 0.22 3.05 ± 0.97
Feb-10 2.29 ± 1.19 0.72 ± 0.30 0.24 ± 0.14 0.49 ± 0.15
Apr-10 0.00 ± 0.00 1.31 ± 0.88 0.10 ± 0.06 0.56 ± 0.34
Nov-10 0.00 ± 0.00 1.18 ± 0.35 0.65 ± 0.33 0.83 ± 0.24
Feb-11 0.57 ± 0.57 0.15 ± 0.08 0.15 ± 0.07 0.16 ± 0.06
Apr-11 2.40 ± 1.22 0.14 ± 0.07 0.22 ± 0.08 0.26 ± 0.07
Nov-11 0.00 ± 0.00 0.00 ± 0.00 0.56 ± 0.32 0.33 ± 0.19
Feb-12 0.00 ± 0.00 0.18 ± 0.09 0.03 ± 0.03 0.09 ± 0.04
Figure 6-13 Distribution and abundance of syngnathids in Spencer Gulf from fishery assessment surveys during 2009 to 2012, overlayed on the areas of differing trawl intensity (10-year average trawl intensity, 2002/03 to 2011/12).
55
6.2 Implementing ecosystem-based assessment in the SGPF
Implementation of ecological assessments in the SGPF requires an operational plan
(e.g. FAO 2011) with the key steps to include (1) identification of relevant
performance indicators and reference points across each of the five key components
– (i) habitats; (ii) ecosystem (ecological communities/trophodynamics); (iii) target
species; (iv) non-target species including by-product and by-catch; and (v) TEPS; (2)
development of a framework linking annual ecological and stock assessments with
decision rules to drive management decision making embedded in the management
plan for the fishery (Figure 6-14; Table 6-8; Table 6-9); and considering an
appropriate time period for review. Whilst these performance indicators, reference
points and the reporting framework should be developed collaboratively, involving at
least PIRSA Fisheries and Aquaculture, SGWCPFA, SARDI Aquatic Sciences and
the CCSA, analyses of the data and information available for the SGPF undertaken
in this report provide guidance and direction to support this process. These analyses
also highlight where data are currently inadequate to formulate these performance
indicators.
When generating performance indicators and reference points, and determining the
management decisions following ecological assessments against them, there are
several factors that need consideration. First, there is considerable spatial and
temporal (both inter-annual and within season) variation evident in the five key
components across Spencer Gulf. Consequently, it is important to explicitly consider
this variability when evaluating the robustness of performance indicators and
reference points. Second, the uncertainty in the available data and robustness of the
selected performance indicators should be acknowledged. For example, the degree
to which the periodic reporting of fishing location data (i.e. GPS) influences the
spatial distribution of high-, medium- and low-intensity trawling areas requires formal
evaluation. Third, it is necessary to recognise that the Spencer Gulf environment is
potentially impacted by a range of diverse activities including fisheries (e.g. abalone,
blue swimmer crab, snapper, sardine), other aquatic industries (e.g. aquaculture,
shipping, harbours, wharfs), pollutants (e.g. from coastal industries) and weather
(e.g. climate change; Steer et al. 2013). As undertaking an ecological assessment of
the SGPF may yield performance indicator values outside of the established
reference points, it will be important to evaluate whether this reflects an impact from
the SGPF, another factor on the Spencer Gulf environment or a cumulative effect
(FRDC project 2011/205). The need for this evaluation is likely to be greatest for
those performance indicators related to by-product, by-catch and TEPS.
56
Implementation of bioregional plans (Fletcher et al. 2010) in support of ecosystem
based management (Webb and Smith 2008) and/or integrated ocean management
may yield a long-term, integrated approach to resolving this issue.
6.2.1 Habitat
There are several potential performance indicators for assessing the component
‘habitat’ (encompassing habitat forming and sessile species) including (i) area of
high-intensity trawling; (ii) expansion of high-trawling intensity into areas of Spencer
Gulf with historically low levels of trawl intensity; and (iii) increases/continued trawling
effort in areas of Spencer Gulf that have either not been trawled or received only low
levels of trawl intensity (i.e. overlap; Table 6-2). There are, however, several
difficulties with these approaches.
Firstly, there are several different ways in which these performance indicators could
be calculated, and it is not yet evident which method may be the most appropriate.
For example, for the area of high trawling intensity, it may be appropriate to use the
data from 2002/03 to 2011/12 to determine suitable reference points. The largest
area of high-intensity fishing, 46,600 ha in 2004/05, could be used as an upper limit
reference point. In contrast, development of a performance indicator based on an
expansion of high-intensity trawling into those areas of the Gulf across which trawl
effort has been traditionally much lower is more difficult because of the alternative
estimation methods. Secondly, none of these performance indicators captures the
overlap of prawn trawling with different habitat types (e.g. yet-to-be identified rare,
important or sensitive) or the degree to which different trawled habitats are able to
‘recover’. Consequently, while it is likely that development of performance indicators
for the key component ‘habitat’ will need to consider these current deficiencies, one
of the key limitations will probably be the availability of suitable data (but see Hobday
et al. 2011a; James and Bone 2011; O’Connell 2014; O’Connell et al. in press; Table
6-1). If these data were to become available, this would alleviate the need to use the
location and intensity of fishing effort as an index of the potential impact of the SGPF
on the Spencer Gulf habitats. Thirdly, the use of each of these approaches is
influenced by (i) fishing location (GPS) not being recorded for each trawl shot;
(ii) data selection rules applied to eliminate likely spurious data; (iii) definition of no
and low trawling intensity; and (4) challenge of identifying the extent of fishery
overlap with environmental variables and associated long-term impact given the
ecological dynamics of the species/habitats involved and the methods used by the
fishery. The degree to which periodic reporting of fishing location affects
57
interpretation of these potential performance indicators is poorly understood. While it
is unlikely that the high-intensity trawl areas would be affected by reporting
frequency, the low-intensity trawl areas (strongly influenced by reporting frequency),
which may contain some of the more ecologically sensitive areas of Spencer Gulf,
could change substantially. It is also not clear if the recording of fishing location
occurs systematically, or is biased to the recording of GPS positions when vessels
move among areas. There are also problems with the accuracy of the data. For
example, numerous reported fishing locations occur on land, in waters shallower than
10 m where prawn trawling is prohibited, or sporadically across Spencer Gulf outside
of established trawl areas. In addition, to account for the potential bias on the spatial
extent of ‘low’ intensity trawling, areas with very low trawling intensities were included
in the 'no fishing' category. While this likely resulted in a more representative
distribution of trawling undertaken by the fishery, as validated by commercial fishers
and the catch distribution data, the spatial extent of trawling in Spencer Gulf is
strongly influenced by the definitions of no and low trawling. Consequently, the
uncertainty associated with these data and their use needs to be resolved for the
utility of these potential performance indicators to be fully evaluated. One way to do
this would be to have the fishing fleet record the start, centre and finish GPS points
for an entire fishing run and then to use bootstrapping techniques to examine the
sources of error around the current data. This approach, and the elimination of
current errors, would be facilitated by adoption of the integrated electronic catch and
effort log currently pending.
6.2.2 Ecosystem
Based on the available data and information, it was not possible to identify any
potential performance indicators for ecological assessment against the component
‘ecosystem’. There are, however, several approaches underway that are likely to
yield suitable performance indicators. These include the current FRDC-funded
project that is developing a trophodynamic model for Spencer Gulf (FRDC 2011/205)
and direct comparisons between the 2007 and 2013 gulf-wide by-catch surveys.
Whilst rapid assessments such as the ratio of prawn catch to by-catch may be
suitable, alternative performance indicators such as (i) species richness indices;
(ii) mean trophic level; and (iii) fishery-in-balance models (Hall and Wise 2011;
Hobday et al. 2011a) are more likely to be suitable for ecological assessment against
the component ‘ecosystem’. However, each of these methods requires a time series
58
of species-specific abundance (numbers or weights) data, with such data currently
available only for 2007 (Currie et al. 2009).
Broad indicators of diversity, such as species richness, evenness and dominance,
may provide a convenient summary of changes in catch species assemblages over
time (Hall and Wise 2011). Because species richness indices may be affected to
varying extents by the most, or least, abundant species, Hill’s numbers which uses a
suite of indices to account for limitations and biases in using a single index (Hill
1973), has proven useful for estimating species richness and diversity for
investigating fishery impacts on fish assemblages (Rice 2000; Ferguson et al. 2013).
Whilst broad indicators of diversity may indicate changes in species assemblages,
they do not provide an indication of the nature of the change. Additionally, such
indices are sensitive to sample size and spatial/temporal trends may be affected by
changes in catch per unit effort (CPUE), fishing effort (Hall and Wise 2011) and the
hydrodynamics of Spencer Gulf (Middleton et al. 2013). For this reason, other
ecosystem-based indicators developed for use with fishery data, such as mean
trophic level, mean maximum length and fishery-in-balance (Pauly et al. 1998;
Christensen 2000; Pauly and Palomares 2005; Zhang et al. 2009; Ramos et al. 2011)
indices may provide more robust performance indicators for ecosystems (Hall and
Wise 2011). For example, mean trophic level has been explored (management
simulations) as a performance indicator to inform ecological assessment of the
Northern Prawn Fishery (Bustamante et al. 2011).
6.2.3 Target species
Given that the indicators for assessing performance of the SGPF are prescribed in
the management plan (PIRSA 2014b), it was considered both inappropriate and
beyond the scope of this project to consider alternative performance indicators for
ecological assessment against the component ‘target species’.
6.2.4 Non-target species: by-product and by-catch
By-product
The most obvious potential performance indicator for assessing the component ‘by-
product’ is total annual catch (Table 6-8), for which it may be appropriate to use the
reported catch data from 2002/03 to 2011/12 to determine suitable reference points
(e.g. maximum annual catch as an upper limit reference point; Figures 6-5, 6-6).
However, use of this performance indicator may be influenced by several factors
including only the retained catch being reported. For example, if all the calamary
59
catch was retained (e.g. due to a change in price), then reported catches would
increase without any potential impact on the population. In addition, implementation
and/or changes to minimum legal sizes can influence catch levels. Consequently,
‘external’ influences on performance indicators need to be considered during
development and implementation. It is also likely to be necessary to develop a by-
product performance indicator based on the relative abundance of southern calamary
and Balmain bugs, perhaps supported by data obtained from fishery-independent
surveys. This approach would also need to consider seasonal variations in
abundance that are evident in the current data (Roberts and Steer 2010; Figures 6-5,
6-6).
By-catch
Based on the available data and information, one of the most suitable potential
performance indicators for ecological assessment against the component ‘by-catch’
is likely to be temporal change in bycatch species composition. Current application is,
however, limited because spatially-resolved data on by-catch are only currently
available from the 2007 (Currie et al. 2009) and 2013 (SARDI unpublished data) by-
catch surveys and suitable performance indicators are likely to require a long-term
data set (>5 replicates). In addition, there is a need to consider developing species-
specific performance indicators, particularly for iconic (e.g. giant cuttlefish), any high-
risk and other commercially-important (e.g. snapper, King George whiting, blue
swimmer crabs) species. These performance indicators will also require long-term
data, although the large number of current projects focussed on giant cuttlefish in
Spencer Gulf (e.g. FRDC 2011/054, 2013/010, 2013/032 and 2013/052) may yield
suitable performance indicators for this species in the short-term. For the remainder,
suitable approaches could include (1) determining the validity of using ‘fishery
footprint’ as a proxy for ecological assessment against the component ‘by-catch’;
(2) increasing the frequency of the gulf-wide by-catch survey (e.g.
biennially/triennially, based on a cost-benefit analysis) to reduce the overall time
period required to establish a baseline – followed by less frequent surveys (e.g. every
5 years); (3) developing daily and/or fishery-independent (i.e. the three stock
assessment surveys) reporting systems for the iconic, any high-risk and other
commercially-important species. The latter would help to resolve the current limitation
on the seasonality of the data and once available, should be evaluated for their
suitability as indicator species for the broader by-catch assessment.
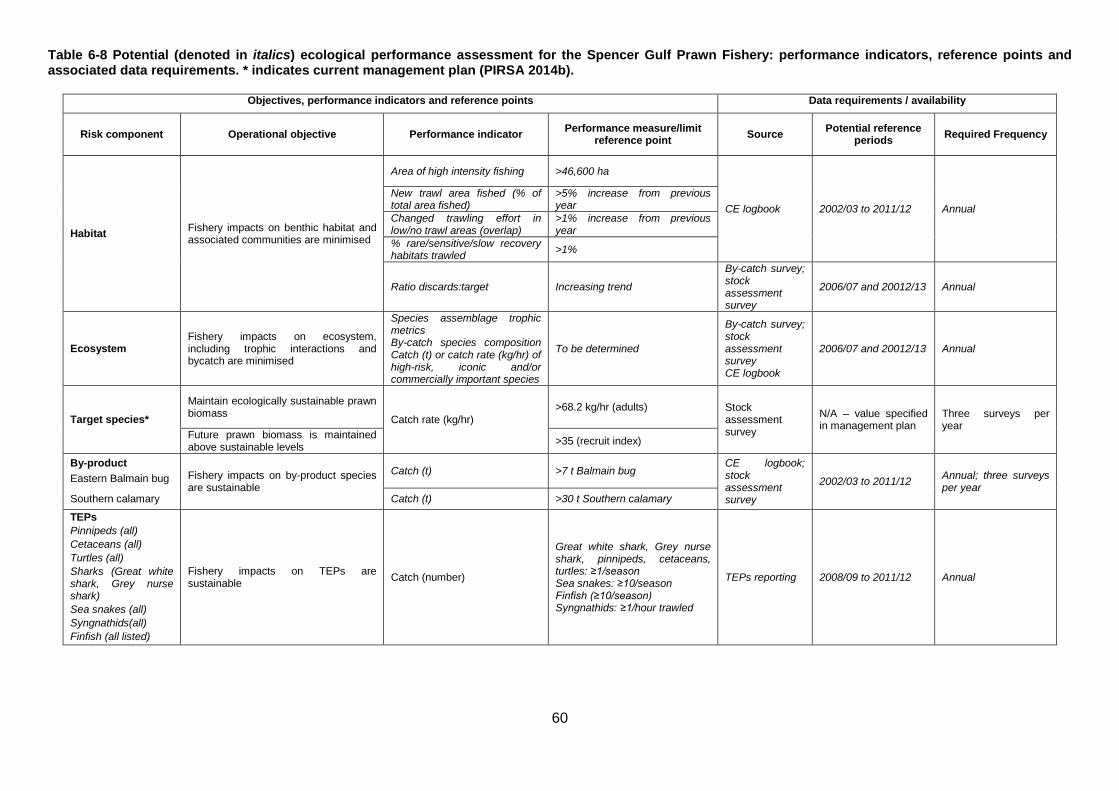
60
Table 6-8 Potential (denoted in italics) ecological performance assessment for the Spencer Gulf Prawn Fishery: performance indicators, reference points and associated data requirements. * indicates current management plan (PIRSA 2014b).
Objectives, performance indicators and reference points Data requirements / availability
Risk component Operational objective Performance indicator Performance measure/limit reference point Source Potential reference
periods Required Frequency
Habitat Fishery impacts on benthic habitat and associated communities are minimised
Area of high intensity fishing >46,600 ha
CE logbook 2002/03 to 2011/12 Annual New trawl area fished (% of total area fished)
>5% increase from previous year
Changed trawling effort in low/no trawl areas (overlap)
>1% increase from previous year
% rare/sensitive/slow recovery habitats trawled >1%
Ratio discards:target Increasing trend
By-catch survey; stock assessment survey
2006/07 and 20012/13 Annual
Ecosystem Fishery impacts on ecosystem, including trophic interactions and bycatch are minimised
Species assemblage trophic metrics By-catch species composition Catch (t) or catch rate (kg/hr) of high-risk, iconic and/or commercially important species
To be determined
By-catch survey; stock assessment survey CE logbook
2006/07 and 20012/13 Annual
Target species* Maintain ecologically sustainable prawn biomass Catch rate (kg/hr)
>68.2 kg/hr (adults) Stock assessment survey
N/A – value specified in management plan
Three surveys per year
Future prawn biomass is maintained above sustainable levels >35 (recruit index)
By-product Eastern Balmain bug Fishery impacts on by-product species
are sustainable Catch (t) >7 t Balmain bug
CE logbook; stock assessment survey
2002/03 to 2011/12 Annual; three surveys per year
Southern calamary Catch (t) >30 t Southern calamary
TEPs Pinnipeds (all) Cetaceans (all) Turtles (all) Sharks (Great white shark, Grey nurse shark) Sea snakes (all) Syngnathids(all) Finfish (all listed)
Fishery impacts on TEPs are sustainable Catch (number)
Great white shark, Grey nurse shark, pinnipeds, cetaceans, turtles: ≥1/season Sea snakes: ≥10/season Finfish (≥10/season) Syngnathids: ≥1/hour trawled
TEPs reporting 2008/09 to 2011/12 Annual
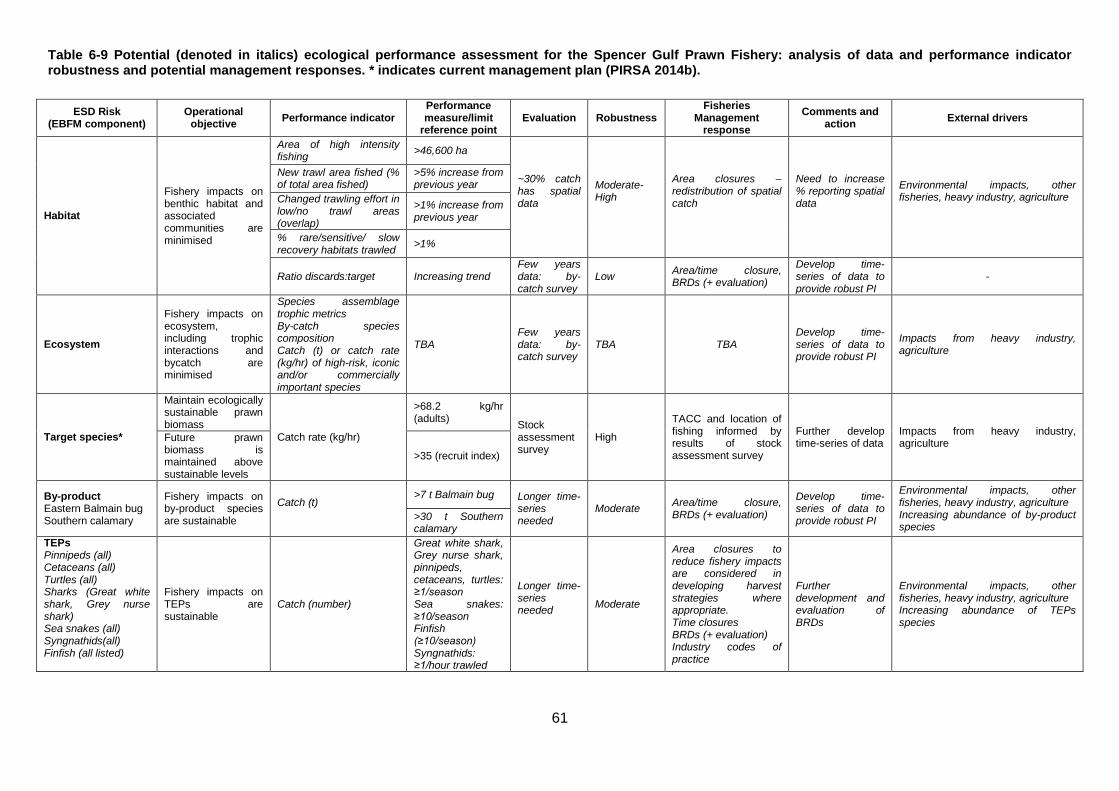
61
Table 6-9 Potential (denoted in italics) ecological performance assessment for the Spencer Gulf Prawn Fishery: analysis of data and performance indicator robustness and potential management responses. * indicates current management plan (PIRSA 2014b).
ESD Risk (EBFM component)
Operational objective Performance indicator
Performance measure/limit
reference point Evaluation Robustness
Fisheries Management
response Comments and
action External drivers
Habitat
Fishery impacts on benthic habitat and associated communities are minimised
Area of high intensity fishing >46,600 ha
~30% catch has spatial data
Moderate-High
Area closures –redistribution of spatial catch
Need to increase % reporting spatial data
Environmental impacts, other fisheries, heavy industry, agriculture
New trawl area fished (% of total area fished)
>5% increase from previous year
Changed trawling effort in low/no trawl areas (overlap)
>1% increase from previous year
% rare/sensitive/ slow recovery habitats trawled >1%
Ratio discards:target Increasing trend Few years data: by-catch survey
Low Area/time closure, BRDs (+ evaluation)
Develop time-series of data to provide robust PI
-
Ecosystem
Fishery impacts on ecosystem, including trophic interactions and bycatch are minimised
Species assemblage trophic metrics By-catch species composition Catch (t) or catch rate (kg/hr) of high-risk, iconic and/or commercially important species
TBA Few years data: by-catch survey
TBA TBA Develop time-series of data to provide robust PI
Impacts from heavy industry, agriculture
Target species*
Maintain ecologically sustainable prawn biomass
Catch rate (kg/hr)
>68.2 kg/hr (adults) Stock
assessment survey
High
TACC and location of fishing informed by results of stock assessment survey
Further develop time-series of data
Impacts from heavy industry, agriculture Future prawn
biomass is maintained above sustainable levels
>35 (recruit index)
By-product Eastern Balmain bug Southern calamary
Fishery impacts on by-product species are sustainable
Catch (t)
>7 t Balmain bug Longer time-series needed
Moderate Area/time closure, BRDs (+ evaluation)
Develop time-series of data to provide robust PI
Environmental impacts, other fisheries, heavy industry, agriculture Increasing abundance of by-product species
>30 t Southern calamary
TEPs Pinnipeds (all) Cetaceans (all) Turtles (all) Sharks (Great white shark, Grey nurse shark) Sea snakes (all) Syngnathids(all) Finfish (all listed)
Fishery impacts on TEPs are sustainable
Catch (number)
Great white shark, Grey nurse shark, pinnipeds, cetaceans, turtles: ≥1/season Sea snakes: ≥10/season Finfish (≥10/season) Syngnathids: ≥1/hour trawled
Longer time-series needed
Moderate
Area closures to reduce fishery impacts are considered in developing harvest strategies where appropriate. Time closures BRDs (+ evaluation) Industry codes of practice
Further development and evaluation of BRDs
Environmental impacts, other fisheries, heavy industry, agriculture Increasing abundance of TEPs species
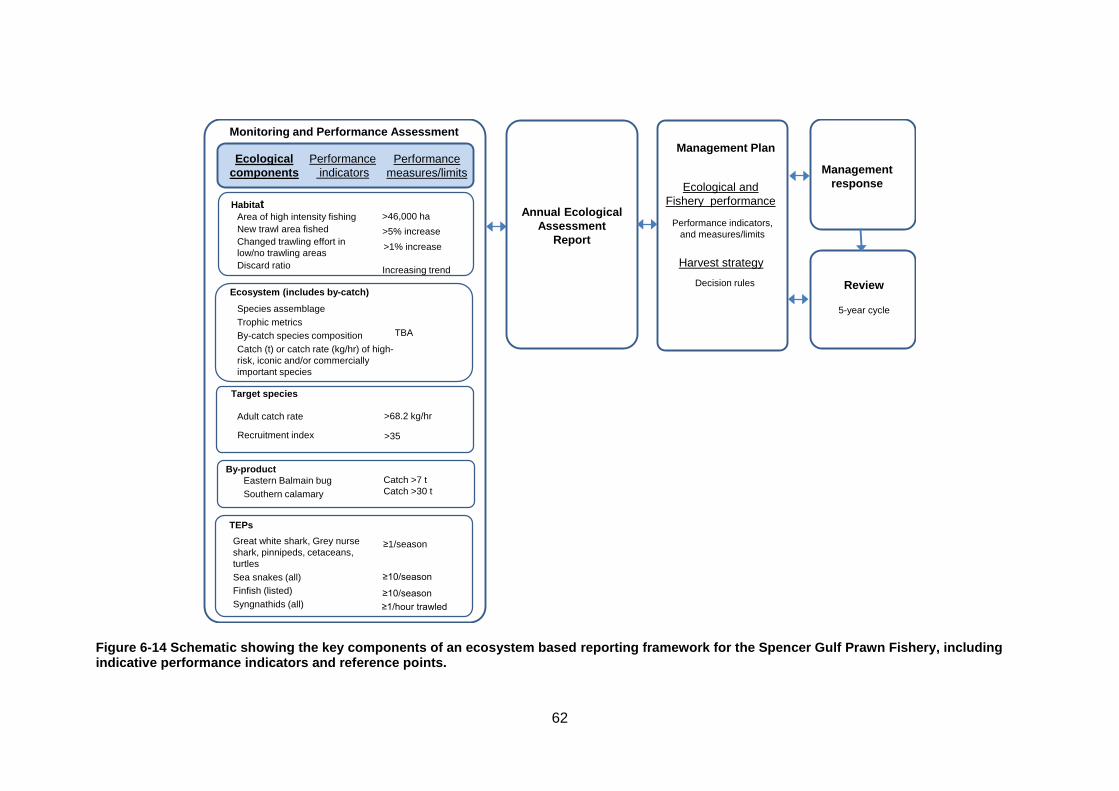
62
Figure 6-14 Schematic showing the key components of an ecosystem based reporting framework for the Spencer Gulf Prawn Fishery, including indicative performance indicators and reference points.
Monitoring and Performance Assessment
Target species
Habitat
Ecosystem (includes by-catch)
By-product
TEPs
Performanceindicators
Management Plan
Management response
Harvest strategy
Performance indicators, and measures/limits
Ecological andFishery performance
Ecological components
Performance measures/limits
Area of high intensity fishingNew trawl area fishedChanged trawling effort in low/no trawling areasDiscard ratio
>46,000 ha
Great white shark, Grey nurse shark, pinnipeds, cetaceans, turtlesSea snakes (all)Finfish (listed)Syngnathids (all)
≥1/season
Eastern Balmain bugSouthern calamary
Catch >7 t Catch >30 t
Species assemblageTrophic metricsBy-catch species composition Catch (t) or catch rate (kg/hr) of high-risk, iconic and/or commercially important species
TBA
Adult catch rate
Annual Ecological Assessment
Report
Review
5-year cycle
Decision rules
>5% increase >1% increase
Increasing trend
≥10/season
≥10/season ≥1/hour trawled
>68.2 kg/hr
Recruitment index >35
63
6.2.5 Non-target species: TEPS
As with by-product, the most obvious potential performance indicator for assessing
the component ‘TEPS’ is the number of interactions per fishing season. For those
species with which the SGPF has historically had little interaction, such as pinnipeds,
cetaceans and turtles (i.e. ‘large-bodied’ TEPS), an upper limit of one interaction per
year may provide a suitable reference point. In contrast, a different approach is likely
to be required for syngnathids which dominate the TEPS by-catch in this fishery. For
example, it may be more appropriate to use a performance indicator linking the
reported interactions and fishing effort (e.g. number per hr trawled), or to use the
stock assessment surveys as the data source for this component. However, use of
such an abundance-based measure needs to consider spatial and temporal
variability in the catch rates of syngnathids (see Table 6-7; Figures 6-11, 6-12, 6-13).
7 CONCLUSION
This FRDC Tactical Research Fund Project had four objectives: (i) develop a
reporting framework for environmental assessment of Australian trawl fisheries
following the principles of ecosystem-based fisheries management; and then, using
the SGPF as a case study, to (ii) collate and analyse existing data/information to
address the environmental impacts of prawn trawling on: benthic habitats;
trophodynamics; target species; and non-target species including by-catch/by-
product and threatened, endangered and protected species; (iii) integrate existing
data on trawl tracks using GIS to produce a continuous contour map representing the
ecological foot-print of prawn trawl activities in Spencer Gulf; and (iv) identify and
prioritise future research to support ecosystem-based fisheries management. These
objectives have been achieved through a review of the relevant literature to identify
an appropriate reporting framework, assessment of the data available for the SGPF,
and its suitability for use in ecological assessment, GIS mapping of fishing effort and
development of a conceptual ecosystem-based assessment framework for the
fishery including identification and development of potential performance indicators,
reference points and decision rules. The approach developed here would be of use
to other prawn trawl fisheries that were seeking a transition from target-species to
ecosystem-based assessments, perhaps initially through a national workshop. The
tool developed here will assist EBFM and ESD, and satisfy a MSC certification
condition.
64
8 IMPLICATIONS
This project has yielded a conceptual framework and some indicative performance
indicators, reference points and decision rules to support ecosystem-based
assessment of the SGPF. However, the overall costs of implementing ecosystem-
based assessment of the SGPF are unknown, but could be substantial.
There is an opportunity for this approach to be further developed and implemented in
conjunction with the next management plan review. However, despite considerable
data for the fishery, there were several ESD risk components for which data were
limited, impeding performance indicator identification. Consequently, implementation
will require data that are currently unavailable and analyses that were beyond the
scope of this study. For example, if a change in ‘fishery footprint’ is an inappropriate
surrogate measure, it may be necessary to (1) increase the frequency of the gulf-
wide by-catch survey (e.g. biennially/triennially) to reduce the overall time period
required to establish a baseline – followed by less frequent surveys (e.g. every 5
years); and/or (2) develop daily and/or fishery-independent (i.e. the three stock
assessment surveys) reporting systems for the iconic, any high-risk and other
commercially-important species.
9 RECOMMENDATIONS
It is recommended that the data (and their associated limitations), potential
performance indicators and the conceptual ecological assessment framework
developed in this project for the SGPF be further developed in a collaboration among
PIRSA Fisheries and Aquaculture, SGWCPFA, SARDI Aquatic Sciences, and the
CCSA over the next five years and be considered for incorporation into future
management plans for the SGPF. This will almost certainly require collection of
additional data and conduct of a cost-benefit analysis. The need for these data, and
cost-effective methods to obtain them should be formally considered as part of this
implementation strategy.
10 FURTHER DEVELOPMENT
The management plan for the SGPF has recently been revised (PIRSA 2014b). The
framework for ecosystem-based assessment of the SGPF outlined in this report
(Section 6) can be further developed and considered for inclusion in future
management plans for the fishery. This would likely be aided through a national
65
workshop to evaluate reporting and analytical frameworks to support management
decisions across bottom trawling fisheries.
11 EXTENSION AND ADOPTION
During the course of this project, there have been numerous discussions with
stakeholders. For example, the draft report was presented to the Research Sub-
committee of the SGWCPFA in January 2014 which includes the CCSA, and the
Management Committee in March 2014. Subsequently, the Research Sub-committee
and Management Committee were provided copies of the draft report for their
comments which were included in subsequent versions. This report has been widely
distributed (see Appendix 13.4) with recipients including the Australian Council of
Prawn Fisheries, South Australian Spencer Gulf, Gulf St Vincent and West Coast
prawn fisheries, Northern Prawn fishery, prawn fisheries of Western Australia and the
MSC assessors.
12 PROJECT MATERIALS DEVELOPED
The primary output from this project is this final report. Other minor outputs include
copies of presentations provided to the SGWCPFA and MSC assessors.
66
13 APPENDICES
13.1 Intellectual property
This research is for the public domain. The report and any resulting manuscripts are
intended for wide dissemination and promotion. All data and statistics presented
conform to confidentiality arrangements.
13.2 Staff
Project staff
Dr Cameron Dixon (SARDI)
Dr Stephen Mayfield (SARDI)
Dr Greg Ferguson (SARDI)
Dr Rowan Chick (SARDI)
Dr Craig Noell (SARDI)
Dr Daniel Gorman (SARDI)
PIRSA staff
Brad Milic
Dr Annabel Jones
Spencer Gulf and West Coast Prawn Fishermen’s Association
Simon Clark (Executive Officer)
13.3 References
AFMA (2012) Ecological Risk Management Report for the Northern Prawn Fishery - Tiger and Banana Prawn Sub-fisheries. 25 pp.
Alverson, D. L., M. H. Freeberg, S. A. Murawski and J. G. Pope (1994) A global assessment of fisheries by-catch and discards. FAO Fisheries Technical Paper 339, FAO, Rome. 233 pp.
Astles, K. L., M. G. Holloway, A. Steffe, M. Green, C. Ganassin and P. J. Gibbs (2006) An ecological method for qualitative risk assessment and its use in the management of fisheries in New South Wales, Australia. Fisheries Research 82(1-3): 290-303.
67
Astles, K. L., P. J. Gibbs, A. S. Steffe and M. Green (2009) A qualitative risk-based assessment of impacts on marine habitats and harvested species for a data deficient wild capture fishery. Biological Conservation 142(11): 2759-2773.
Bryars, S. (2003) An inventory of important coastal fisheries habitats in South Australia Primary Industries and Resources South Australia Adelaide.
Bustamante, R. H., C. M. Dichmont, N. Ellis, S. Griffiths, W. A. Rochester, M. A. Burford, P. C. Rothlisberg, Q. Dell, M. Tonks, H. Lozano-Montes, R. Deng, T. Wassenberg, T. A. Okey, A. Revill, T. van der Velde, C. Moeseneder, S. Cheers, A. Donovan, T. Taranto, J. Salini, G. Fry, S. Tickell, R. Pascual, F. Smith and E. Morello (2011) Effects of trawling on the benthos and biodiversity: development and delivery of a spatially-explicit management framework for the Northern Prawn Fishery. FRDC Project 2005/050. Cleveland, Australia, 382 pp.
Carrick, N. (1996) Key factors that affect prawn recruitment and implications to harvesting prawn stocks. Final Report to FRDC. FRDC Project 91/3 South Australian Research and Development Institute, Adelaide, 50 pp.
Carrick, N. (1997) A preliminary assessment of the by-catch from the Spencer Gulf Prawn Fishery. South Australian Fisheries Assessment Series 97/02, South Australian Research and Development Institute (Aquatic Sciences), 57 pp.
Carrick, N. A. and P. McShane (1998) Spencer Gulf and West Coast prawns. Fishery Assessment Report to PIRSA. South Australian Fisheries Assessment Series 98/8, South Australian Research and Development Institute (Aquatic Sciences), Adelaide.
Carrick, N. A. and H. Williams (2000) Spencer Gulf and West Coast prawns. Fishery Assessment Report to PIRSA. South Australian Fisheries Assessment Series 00/08, South Australian Research and Development Institute (Aquatic Sciences), Adelaide.
Carrick, N. A. and H. Williams (2001) Spencer Gulf and West Coast prawns. Fishery Assessment Report to PIRSA. South Australian Fisheries Assessment Series 01/08, South Australian Research and Development Institute (Aquatic Sciences), Adelaide.
Carrick, N. A. (2003) Spencer Gulf Prawn (Melicertus latisulcatus) Fishery. Fishery Assessment Report to PIRSA Fisheries. South Australian Research and Development Institute (Aquatic Sciences), Adelaide.
Christensen, V. (2000) Indicators for marine ecosystems affected by fisheries. Marine and Freshwater Research 51(5): 447-450.
CofA (1992) (Commonwealth of Australia) The National Strategy for Ecologically Sustainable Development. AGPS, Canberra.
Currie, D. R., C. D. Dixon, S. D. Roberts, G. E. Hooper, S. J. Sorokin and T. M. Ward (2009) Fishery-independent by-catch survey to inform risk assessment of the Spencer Gulf Prawn Trawl Fishery. Report to PIRSA Fisheries. South Australian Research and Development Institute (Aquatic Sciences) Publication No. F2009/000369-1. SARDI Research Report Series No. 390, Adelaide, 121 pp.
Currie, D. R. and S. J. Sorokin (2010a) The distribution and trophodynamics of demersal fish from Spencer Gulf. Transactions of the Royal Society of South Australia 134(2): 198-227.
Currie, D. R. and S. J. Sorokin (2010b) A preliminary evaluation of the distribution and trophodynamics of demersal fish from Spencer Gulf / report to the South Australian Department for Environment and Heritage. SARDI Research Report Series No. 424, SARDI Publication No. F2010/000088-1 South Australian Research and Development Institute (Aquatic Sciences), Adelaide, 179 pp.
68
Currie, D. R., C. D. Dixon, S. D. Roberts, G. E. Hooper, S. J. Sorokin and T. M. Ward (2011) Relative importance of environmental gradients and historical trawling effort in determining the composition and distribution of benthic macro-biota in a large inverse estuary. Fisheries Research 107(1-3): 184-195.
Dixon, C., S. Clark and W. Hill (2014) South Australian prawn fisheries improving environmental practices. Caring for Our Country Investment Project OC13-00090. 27 pp.
Dixon, C., J. Raptis, D. Gorman, S. Roberts, G. Hooper, N. Bicknell, S. Sorokin, R. Newman, C. Noell, T. Benediktsson, J. Saint and W. Hill (2013a) A collaborative approach to novel by-catch research for rapid development, extension and adoption into a commercial trawl fishery. SARDI Research Report Series No. 643, SARDI Publication No. F2012/000250-1 South Australian Research and Development Institute (Aquatic Sciences), Adelaide, 47 pp.
Dixon, C. D., S. D. Roberts and T. M. Ward (2005a) Spencer Gulf prawn Penaeus (Melicertus) latisulcatus fishery. Fishery Assessment Report to PIRSA Fisheries. RD03/0079-3 South Australian Research and Development Institute (Aquatic Sciences), Adelaide.
Dixon, C. D., I. Svane and T. M. Ward (2005b) Monitoring and assessment of by-catch and by-product species of the Spencer Gulf Prawn fishery. Report to PIRSA. South Australian Research and Development Institute (Aquatic Sciences). Publication No. RD 04/0249. SARDI Research Report Series No. 102, 62 pp.
Dixon, C. D., S. D. Roberts and G. E. Hooper (2007) Spencer Gulf prawn Penaeus (Melicertus) latisulcatus fishery 2006/07. Fishery Assessment Report to PIRSA Fisheries. RD03/0079-4 South Australian Research and Development Institute (Aquatic Sciences), Adelaide.
Dixon, C. D. and S. Sloan (2007) Management plan for the South Australian Spencer Gulf Prawn Fishery. The South Australian Fisheries Management Series. Paper No. 54., Primary Industries and Resources South Australia, Adelaide.
Dixon, C. D. and G. E. Hooper (2008) Spencer Gulf prawn Penaeus (Melicertus) latisulcatus fishery 2006/07. Fishery Assessment Report to PIRSA Fisheries. SARDI Research Report Series No. 322, RD03/0070-2 South Australian Research and Development Institute (Aquatic Sciences), Adelaide.
Dixon, C. D., G. E. Hooper and S. D. Roberts (2009) Spencer Gulf prawn Penaeus (Melicertus) latisulcatus fishery 2007/08. Fishery Assessment Report to PIRSA Fisheries. SARDI Research Report Series No. 511, SARDI Publication No. F2007/000770-3 South Australian Research and Development Institute (Aquatic Sciences), Adelaide.
Dixon, C. D., G. E. Hooper and S. D. Roberts (2010) Spencer Gulf prawn Penaeus (Melicertus) latisulcatus fishery 2008/09. Fishery Assessment Report to PIRSA Fisheries. South Australian Research and Development Institute (Aquatic Sciences), Adelaide, 114 pp.
Dixon, C. D., G. E. Hooper and P. Burch (2012) Spencer Gulf Prawn Penaeus (Melicertus) latisulcatus fishery 2010/11. Fishery Assessment Report to PIRSA Fisheries & Aquaculture. Research Report Series No. 603, SARDI Publication No. F2007/000770-5 South Australian research and Development Institute, Adelaide, 118.
Dixon, C. D., C. J. Noell and G. E. Hooper (2013b) Spencer Gulf Prawn Penaeus (Melicertus) latisulcatus fishery 2011/12. Fishery Assessment Report to PIRSA Fisheries & Aquaculture. Research Report Series No. 685, SARDI Publication No.
69
F2007/000770-6 South Australian research and Development Institute, Adelaide, 115.
EPBC_Act. (1999) Environment Protection and Biodiversity Conservation Act., EPBC Act, Commonwealth of Australia, Canberra, Australia.
FAO (1995) Code of conduct for responsible fisheries. Food and Agriculture Organisation of the United Nations, Rome, 41 pp.
FAO (2003) Fisheries management 2. The ecosystem approach to fisheries: FAO technical guidelines for responsible fisheries. Food and Agriculture Organisiation of the United nations, Rome, 112 pp.
FAO (2011). Toolbox Activity 4.1 - Develop an operational plan and monitor its progress. http://www.fao.org/fishery/eaf-net/topic/166259/en accessed 29 October 2014.
Ferguson, G. J., T. M. Ward, Q. Ye, M. C. Geddes and B. M. Gillanders (2013) Impacts of drought, flow regime, and fishing on the fish assemblage in southern Australia's largest temperate estuary. Estuaries and Coasts 36(4): 737-753.
Fletcher, W. J. (2002) Policy for the implementation of ecologically sustainable development for fisheries and aquaculture within Western Australia., Fisheries Management Paper No. 157 Department of Fisheries, Western Australia., Perth, Australia, 70 pp.
Fletcher, W. J., J. Chesson, F. M., K. J. Sainsbury, T. Hundloe, A. D. M. Smith and B. Whitworth (2002) National ESD Reporting Framework for Australian Fisheries: The ‘How To’ Guide for Wild Capture Fisheries. FRDC Project 2000/145. Canberra, Australia, 120 pp.
Fletcher, W. J. (2005) Application of qualitative risk assessment methodology to prioritize issues for fisheries management. ICES Journal of Marine Science 62(8): 1576-1587.
Fletcher, W. J., J. Chesson, K. J. Sainsbury, T. J. Hundloe and M. Fisher (2005) A flexible and practical framework for reporting on ecologically sustainable development for wild capture fisheries. Fisheries Research 71(2): 175-183.
Fletcher, W. J. (2006) Frameworks for managing marine resources in Australia through ecosystem approaches: do they fit together and are they useful? . Bulletin of Marine Science 78(3): 691-704.
Fletcher, W. J., J. Shaw, S. J. Metcalf and D. J. Gaughan (2010) An Ecosystem Based Fisheries Management framework: the efficient, regional-level planning tool for management agencies. Marine Policy 34(6): 1226-1238.
Fletcher, W. J., J. Shaw, D. J. Gaughan and S. J. Metcalf (2011) Ecosystem based fisheries managment case study report West Coast Bioregion. Fisheries Research Report No. 225 Govenment of Western Australia, Department of Fisheries, Perth, 111 pp.
FRDC 2011/205 Spencer Gulf Research Initiative: development of an ecosystem model for fisheries and aquaculture.
FRDC 2013/010 Giant Australian Cuttlefish in South Australian waters.
FRDC 2013/032 Surveying, searching and promoting cuttlefish spawning activity in northern Spencer Gulf.
Garcia, S. M. and D. J. Staples (2000) Sustainability reference systems and indicators for responsible marine capture fisheries: a review of concepts and elements for a set of guidelines. Marine and Freshwater Research 51: 385-426.
70
Goldsworthy, S.D., B. Page, P. J. Rogers, C. A. Bulman, A. Wiebkin, L. J. McLeay, L. Einoder, A. M. M. Baylis, M. Braley, R. Caines, K. Dalye, C. Huveneers, K. Peters, A. D. Lowther and T. M. Ward (2013) Trophodynamics of the eastern Great Australian Bight ecosystem: Ecological change associated with the growth of Australia’s largest fishery. Ecological Modelling 255: 38– 57.
Goldsworthy, S. D., B. Page, P. Rogers and T. W. Ward (2011) Establishing ecosystem-based management for the South Australian Sardine Fishery: developing ecological performance indicators and reference points to assess the need for ecological allocations. Final Report to the Fisheries Research and Development Corporation. SARDI Research Report Series 529, Report No. F2010/000863-1 South Australian Research and Development Institute, Adelaide, 173pp.
Hall, N. G. and B. S. Wise (2011) Development of an ecosystem approach to the monitoring and management of Western Australian fisheries Department of Fisheries, Western Australia, 112 pp.
Hilborn, R. (2011) Future directions in ecosystem based fisheries management: A personal perspective. Fisheries Research 108: 235-239.
Hill, M. O. (1973) Diversity and evenness: a unifying notation and its consequences. Ecology 54: 427-432.
Hobday, A. J., C. Bulman, A. Williams and M. Fuller (2011a) Ecological risk assessment for effects of fishing on habitats and communities. FRDC report 2009/029. CSIRO Marine and Atmospheric Research, Hobart.
Hobday, A. J., A. D. M. Smith, H. Webb, R. Daley, S. Wayte, C. Bulman, J. Dowdney, A. Williams, M. Sporcic, J. Dambacher, M. Fuller and T. Walker (2007) Ecological risk assessment for the effects of fishing: Methodology. Report R04/1072 for the Australian Fisheries Management Authority. CSIRO, Canberra.
Hobday, A. J., A. D. M. Smith, I. C. Stobutzki, C. Bulman, R. Daley, J. M. Dambacher, R. A. Deng, J. Dowdney, M. Fuller, D. Furlani, S. P. Griffiths, D. Johnson, R. Kenyon, I. A. Knuckey, S. D. Ling, R. Pitcher, K. J. Sainsbury, M. Sporcic, T. Smith, C. Turnbull, T. I. Walker, S. E. Wayte, H. Webb, A. Williams, B. S. Wise and S. Zhou (2011b) Ecological risk assessment for the effects of fishing. Fisheries Research 108 (2-3): 372-384.
Hollamby, K.E., P. E. McShane, S. Sloan and J. Brook (2010) Competition to collaboration: exploring co-management models for the Spencer Gulf Prawn Fishery. FRDC Final Report 2007/025, Adelaide, 105 pp.
James, N. P. and Y. Bone (2011) Neritic carbonate sediments in a temperate realm. Berlin, Springer.
Jennings, S. and M. J. Kaiser (1998) The effects of fishing on marine ecosystems. Advances in Marine Biology 34: 203-314.
Kangas, M. and B. Jackson (1997) Sampling juvenile Penaeus latisulcatus Kishinouye with a water-jet net compared with a beam-trawl: spatial and temporal variation and nursery area in Gulf St Vincent, South Australia. Marine and Freshwater Research 49: 517-523.
Kennelly, S. J. (2014) By-catch reduction devices (BRDs) to reduce the incidental catch of cuttlefish in the Spencer Gulf prawn trawl fishery. FRDC Final Report 2013/052, Cronulla, 47 pp.
Messeih, S. N., T. W. Rowell, D. L. Peer and P. J. Cranford (1991) The effects of trawling, dredging and ocean dumping on the eastern Canadian continental shelf seabed. Continental Shelf Research 11: 1237-1263.
71
Metcalf, S. J., D. J. Gaughan and J. Shaw (2009) Conceptual models for Ecosystem Based Fisheries Management (EBFM) in Western Australia. Fisheries Research Report No. 194, Department of Fisheries, Western Australia, 42 pp.
Middleton, J., M. Doubell, C. James, J. Luick and P. van Ruth (2013) PIRSA Initiative II: Carrying capacity of Spencer Gulf: hydrodynamic and biogeochemical measurement modelling and performance modelling. FRDC Final Report 2009/046, Adelaide, 107 pp.
Noell, C. J., Hooper, G. E. and C. L. Beckman (2014) Spencer Gulf prawn Penaeus (Melicertus) latisulcatus fishery 2012/13. Fishery Assessment Report to PIRSA Fisheries and Aquaculture. SARDI Research Report Series No. 788, F2007/000770-7. South Australian Research and Development Institute (Aquatic Sciences), Adelaide.
Nunes, R. A. and G. W. Lennon (1986) Physical property distributions and seasonal trends in Spencer Gulf, South Australia: an inverse estuary. Australian Journal of Marine and Freshwater Research 37(1): 39-53.
Nunes Vaz, R. A., G. W. Lennon and D. G. Bowers (1990) Physical behaviour of a large, negative or inverse estuary. Continental Shelf Research 10(3): 277-304.
O'Connell, L. G. (2014) Sedimentology and Oceaonographic Controls on Temperate, Shallow-water Carbonate Deposition: Spencer Gulf, South Australia. PhD thesis, Queen's University, Kingston, Ontario, Canada.
O’Connell, L. G., N. P. James, M. Doubell, J. F. Middleton, J. Luick, D. R. Currie and Y. Bone (in press) Oceanographic controls on shallow-water temperate carbonate sedimentation: Spencer Gulf, South Australia. Sedimentology.
Pauly, D., V. Christensen, J. Dalsgaard, R. Froese and J. F. Torres (1998) Fishing down marine food webs. Science 279: 860-863.
Pauly, D. and M. L. Palomares (2005) Fishing down marine food web: it is far more pervasive than we thought. Bulletin of Marine Science 76 (2): 197-211.
Piasente, M., B. Stanley and S. Hall (2012) Assessing discards using onboard electronic monitoring in the Northern Prawn Fishery. FRDC Project 2009/076, Australian Fisheries Management Authority 59pp.
Pikitch, E. K., C. Santora, E. A. Babcock, A. Bakun, R. Bonfil, D. O. Conover, P. Dayton, P. Doukakis, D. Fluharty, B. Heneman, E. D. Houde, J. Link, P. A. Livingston, M. Mangel, M. K. McAllister, J. Pope and K. J. Sainsbury (2004) Ecosystem-Based Fishery Management. Science 305(5682): 346-347.
PIRSA (2014a) ESD risk assessment of South Australia's Spencer Gulf Prawn Fishery. Primary Industries and Regions South Australia (Fisheries and Aquaculture), Adelaide. 86 pp.
PIRSA (2014b) Management plan for the commercial South Australian Spencer Gulf prawn fishery. Primary Industries and Regions South Australia (Fisheries and Aquaculture), Adelaide. 81pp.
Pitcher, T. J., D. Kalikoski, K. Short, D. Varkey and G. Pramod (2009) An evaluation of progress in implementing ecosystem-based management of fisheries in 33 countries. Marine Policy 33(2): 223-232.
Ramos, S., I. Vazquez-Rowe, I. Artetxe, M. T. Moreira, G. Feijoo and J. Zufía (2011) Environmental assessment of the Atlantic mackerel (Scomber scombrus) season in the Basque Country. Increasing the timeline delimitation in fishery LCA studies International Journal of Life Cycle Assessment 16(7): 599-610.
72
Rice, J. C. (2000) Evaluating fishery impacts using metrics of community structure. ICES Journal of Marine Science 57: 682-688.
Richardson, L., E. Mathews and A. Heap (2005) Geomorphology and Sedimentology of the South Western Planning Area of Australia: review and synthesis of relevant literature in support of Regional Marine Planning. Geoscience Australia, Record 2005/17. 124 pp.
Roberts, S. D., C. D. Dixon and T. M. Ward (2005) Assessment of juvenile prawn (Meticercus latisulcatus) surveys in Spencer Gulf, South Australia. SARDI Research Report Series No. 95, RD04/0211-2 South Australian Research and Development Institute (Aquatic Sciences), Adelaide.
Roberts, S. D. and M. A. Steer (2010) By-product assessment in the Spencer Gulf Prawn Fishery with an emphasis on developing management options for Balmain bugs. . Aouth Australian Research and Development Institute (Aquatic Sciences), Adelaide, 48 pp.
Skirtun, M., P. Sahlqvist and S. Vieira (2013) Australian Fisheries Statistics 2012. FRDC project 2010/208, Canberra, 106 pp.
Sorokin, S. J., R. M. Connolly and D. R. Currie (2009) Syngnathids of the Spencer Gulf - morphometrics and isotopic signatures South Australian Research and Development Institute (Aquatic Sciences), Adelaide, 30 pp.
Sorokin, S. J. and D. R. Currie (2009) The distributionand diversity of sponges in Spencer Gulf. Report to the Nature Foundation SA Inc., SARDI Research Report Series No. 334 SARDI Aquatic Sciences Publication No. F2008/00153-1 South Australian Research and Development Institute (Aquatic Sciences), Adelaide, 20 pp.
Steer, M. A. and K. Hall (2005) Estimated abundance and biomass of the unique spawning aggregation of the giant Australian cuttlefish (Sepia apama) in northern Spencer Gulf, South Australia. Report to Coastal Protection Branch, Department for Environment and Heritage, South Australia., RD 05/0012-1 South Australian Research and Development Institute (Aquatic Sciences), Adelaide.
Steer, M. A., S. Gaylard and M. Loo (2013) Monitoring and relative biomass of South Australia's Giant Cuttlefish breeding population. Fisheries Research and Development Corporation. TRF Project 2011/054. South Australian Research and Development Institute, Publication No. F2013/0000074-1. SARDI Research Report Series No. 684.
Stobutzki, I., M. Miller and D. Brewer (2001) Sustainability of fishery bycatch: a process for assessing highly diverse and numerous bycatch. Environmental Conservation 28(02): 167-181.
Svane, I. (2003) Prawn fishery by-catch and discard: fates and consequences for a marine ecosystem. South Australian Research and Development Institute (Aquatic Sciences), Adelaide, 130 pp.
Svane, I. (2005) Occurrence of dolphins and seabirds and their consumption of by-catch during trawling in Spencer Gulf. Fisheries Research 76: 317-327.
Svane, I., K. Rodda and P. Thomas (2007) Prawn fishery by-catch and discards: marine ecosystem analysis - population effects. Fisheries Research and Development Corporation. Project 2003/023. South Australian Research and Development Institute, Aquatic Sciences Publication No. RD 03-0132. SARDI Research Report Series No. 199, 418 pp.
Svane, I., S. Roberts and T. Saunders (2008) Fate and consumption of discarded by-catch in the Spencer Gulf prawn fishery, South Australia. Fisheries Research 90(1–3): 158-169.
73
Svane, I., Z. Hammet and P. Lauer (2009) Impacts of trawling on benthic macro-fauna and -flora of the Spencer Gulf prawn fishing grounds. Estuarine, Coastal and Shelf Science 82: 621-631.
Tanner, J. E. and S. Deakin (2001) Active habitat selection for sand by juvenile Western King prawns, Meticercus latisulcatus (Kishinouye) Journal of Experimental Marine Biology and Ecology 261: 199-209.
Tanner, J. E. and J. E. Volkman (2009) Aquafin CRC - Southern Bluefin Tuna Aquaculture Subprogram: Risk and response - Understanding the Tuna Farming Environment. Technical report, Aquafin CRC Project 4.6, FRDC project 2005/059. SARDI Publication No F2008/000646-46-1, SARDI Research Report Series No 344 Aquafin CRC, Fisheries Research and Development Institute and South Australian Research and Development Institute, Adelaide, 287pp.
Thrush, S. F. and P. K. Dayton (2002) Disturbance to marine benthic habitats by trawling and dredging: implications for marine biodiversity. Annual Review of Ecology and Systematics 33: 449-473.
Tsolos, A. and M. Boyle (2013) Interactions with Threatened, Endangered or Protected Species in South Australian Managed Fisheries - 2009/10, 2010/11, and 2011/12. Report to PIRSA Fisheries and Aquaculture. SARDI Research Report Series No. 682, SARDI Publication No. F2009/000544-3 South Australian Research and Development Institute (Aquatic Sciences), Adelaide, 46 pp.
WCED (1987) Our Common Future: Report of the World Commission on Environment and Development. Zhang, C. I., S. Kim, D. Gunderson, R. Marasco, J. B. Leec, H. W. Park and J. H. Lee (2009) An ecosystem-based fisheries assessment approach for Korean fisheries. Fisheries Research 100(1): 26-41.
Webb, H. and A. Smith (2008) Review of the scope, assessment methods and management responses for fisheries ESD and EBFM in Australia. FRDC Final Report 2004/101, Hobart, 387 pp.
Zhou, S. J. and S. P. Griffiths (2008) Sustainability Assessment for Fishing Effects (SAFE): A new quantitative ecological risk assessment method and its application to elasmobranch bycatch in an Australian trawl fishery. Fisheries Research 91(1): 56-68.
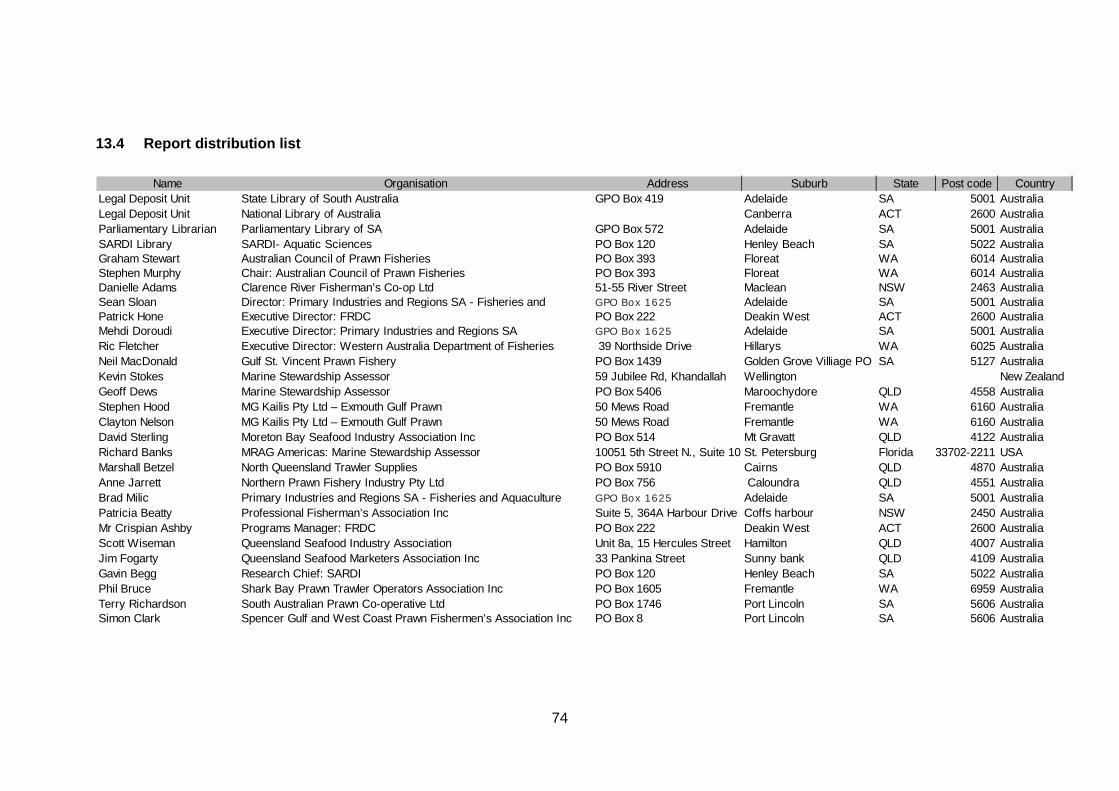
74
13.4 Report distribution list
Name Organisation Address Suburb State Post code CountryLegal Deposit Unit State Library of South Australia GPO Box 419 Adelaide SA 5001 AustraliaLegal Deposit Unit National Library of Australia Canberra ACT 2600 AustraliaParliamentary Librarian Parliamentary Library of SA GPO Box 572 Adelaide SA 5001 AustraliaSARDI Library SARDI- Aquatic Sciences PO Box 120 Henley Beach SA 5022 AustraliaGraham Stewart Australian Council of Prawn Fisheries PO Box 393 Floreat WA 6014 AustraliaStephen Murphy Chair: Australian Council of Prawn Fisheries PO Box 393 Floreat WA 6014 AustraliaDanielle Adams Clarence River Fisherman’s Co-op Ltd 51-55 River Street Maclean NSW 2463 AustraliaSean Sloan Director: Primary Industries and Regions SA - Fisheries and GPO Box 1625 Adelaide SA 5001 AustraliaPatrick Hone Executive Director: FRDC PO Box 222 Deakin West ACT 2600 AustraliaMehdi Doroudi Executive Director: Primary Industries and Regions SA GPO Box 1625 Adelaide SA 5001 AustraliaRic Fletcher Executive Director: Western Australia Department of Fisheries 39 Northside Drive Hillarys WA 6025 AustraliaNeil MacDonald Gulf St. Vincent Prawn Fishery PO Box 1439 Golden Grove Villiage PO SA 5127 AustraliaKevin Stokes Marine Stewardship Assessor 59 Jubilee Rd, Khandallah Wellington New ZealandGeoff Dews Marine Stewardship Assessor PO Box 5406 Maroochydore QLD 4558 AustraliaStephen Hood MG Kailis Pty Ltd – Exmouth Gulf Prawn 50 Mews Road Fremantle WA 6160 AustraliaClayton Nelson MG Kailis Pty Ltd – Exmouth Gulf Prawn 50 Mews Road Fremantle WA 6160 AustraliaDavid Sterling Moreton Bay Seafood Industry Association Inc PO Box 514 Mt Gravatt QLD 4122 AustraliaRichard Banks MRAG Americas: Marine Stewardship Assessor 10051 5th Street N., Suite 105St. Petersburg Florida 33702-2211 USAMarshall Betzel North Queensland Trawler Supplies PO Box 5910 Cairns QLD 4870 AustraliaAnne Jarrett Northern Prawn Fishery Industry Pty Ltd PO Box 756 Caloundra QLD 4551 AustraliaBrad Milic Primary Industries and Regions SA - Fisheries and Aquaculture GPO Box 1625 Adelaide SA 5001 AustraliaPatricia Beatty Professional Fisherman’s Association Inc Suite 5, 364A Harbour Drive Coffs harbour NSW 2450 AustraliaMr Crispian Ashby Programs Manager: FRDC PO Box 222 Deakin West ACT 2600 AustraliaScott Wiseman Queensland Seafood Industry Association Unit 8a, 15 Hercules Street Hamilton QLD 4007 AustraliaJim Fogarty Queensland Seafood Marketers Association Inc 33 Pankina Street Sunny bank QLD 4109 AustraliaGavin Begg Research Chief: SARDI PO Box 120 Henley Beach SA 5022 AustraliaPhil Bruce Shark Bay Prawn Trawler Operators Association Inc PO Box 1605 Fremantle WA 6959 AustraliaTerry Richardson South Australian Prawn Co-operative Ltd PO Box 1746 Port Lincoln SA 5606 AustraliaSimon Clark Spencer Gulf and West Coast Prawn Fishermen’s Association Inc PO Box 8 Port Lincoln SA 5606 Australia