Embed Size (px)
Citation preview
1
A Report on Performance Analysis of
Textiles Company in Bangladesh
Naiem Md Riyadh
Id# 114 143 011
Major: BBA in AIS
Supervisor:
Dr. James Bakul Sarker
Associate Professor
School of Business & Economics
United International University
Date of Submission
05 January 2019
2
Letter of Transmittal
1st January, 2019
Dr. James Bakul Sarker
Associate Professor
School of Business & Economics
United International University
Dear Sir,
It is an honor and great pleasure for me to present my project report on “Performance Analysis of
Selected textiles companies of Bangladesh”. This report was assigned to me for the incomplete
fulfillment of the requirement of Accounting & Information System (AIS), Under BBA program
of United International University.
The analysis I conducted increase my knowledge to make an executive report. This report has
given me an extraordinary experience that might have vast uses in the future endeavors.
I sincerely hope that it would be able to satisfy your expectations. I respect your collaboration
and I think you will call upon me with any queries cause by this report.
Thanking you and looking forward to receive your gracious approval of my submission.
Yours Obediently,
………………......
Naiem Md Riyadh
114 143 011
BBA in AIS
3
Acknowledgement
At first, I offer millions of sincere thanks to almighty Allah for his kindness on me in completing
this report. I am also thankful to my supervisor Dr. James Bakul Sarker. The success and final
consequence of this project required a lot of guidance and assistance from my supervisor Dr.
James Bakul Sarker. I am extremely privileged to have this up and completion of my project. All
that I have done is only due to such supervision and assistance and I would not forget to express
gratitude toward him.
4
Table of Contents
Executive Summary…………………………………………………………………………..5
Chapter – 1: Introduction…………………………………………………………………….6
Chapter – 2: Organizational Background and Industry perspective…………………………8
Chapter – 3: Objective of the Study………………………………………………......…….13
Chapter – 4: Methodology of the study………………………………………………….…15
Chapter – 5: Literature Review…………………………………………………………..…18
Chapter – 6: Collection of data and analysis of financial statement…………………….….23
Chapter – 7: Performance analysis of selected textiles companies of Bangladesh…………48
Chapter – 8: Conclusion……………………………………………………………………..62
Reference……………………………………………………………………………………64
5
Executive Summary
This report applies performance evaluation of selected Textiles Company in Bangladesh. Here
we select four textiles company (Argon Denims Ltd., Envoy Textiles Ltd., Malek Spanning
miles Ltd, And Shasha Denims Ltd.). This company’s financial statement analyzed and studied
thoroughly to understand company’s financial performance. That financial statement incorporate
with balance sheet, income statement. The main data collection from the annual financial reports
on those four selected textiles company’s in 2012 to 2017. Different financial ratio are consider
such as liquidity ratios, leverage ratio, coverage ratios, profitability ratios, activity ratios finally
measure the best performance between four companies. The mathematical calculations was
establish for ratio analysis between those four companies from 2012 to 2017. The most important
factors for this performance evaluation is graphical analysis and comparisons between those four
companies financial ratio analysis.
6
Chapter -1
Introduction
7
Introduction This chapter gives an introduction to this report. A general introductory part of the report is
intended to introduce two specific dimensions of the project report: Introduction to the topic in
hand and a brief introduction of the organization.
Performance analysis of a company is generally related to how efficiently a company can use it
assets, shareholder equity and liability, revenue and expenses. Financial ratio analysis is one of
the important tools of performance analysis, In order to determine the financial position of the
textiles company and to make a decision of how efficient the textiles company, its operation and
management and how well the company has been able to use its resources and earn profit. We
used ratio analysis for easily measurement of liquidity position, asset management condition,
profitability and market value and debt coverage situation of the textiles company for
performance analysis. It analysis the company utilized of its assets and control of its expenses
and determines the coverage of liquid assets to short-term liabilities. It measures textiles
companies overall efficiency and performance. It also used to analysis the textiles companies’
previous financial performance and to establish the future trend of financial position.
We select four textiles companies in Bangladesh. We discuss and analysis this companies
performance and there condition by comparing between them. For this we choose Argon Denims
Ltd, Envoy Textiles Ltd, Malek Spinning Milles Ltd, and Shasha Denims Ltd. This are the most
famous company in Bangladesh. They are in top position among all national, multination, private
and public textiles companies of Bangladesh. Their mission is to produce and provide quality
product to people around the world, maintain strongly ethical standard in business operation also
ensuring benefit to the shareholder, stakeholder, and society.
8
Chapter – 2
Organizational Background and
Industry Perspective
9
Organizational Background and Industry Perspective
Argon Denims Ltd
Argon Denims Ltd was incorporated as a Private Limited Company on July 13, 2006 under the
Companies Act 1994 to produce Denim Fabrics. The commercial operations of the company
started in March, 2008. The factory is situated at Sreepur in Gazipur district of Bangladesh.
The Company mainly produces medium and premium range denim fabrics in various weights
ranging from 4.5 Oz to 13 Oz. The annual production capacity will reach a mark of 18 million
yards by December 2012.
Fabrics in 100% cotton, Cotton Stretch, Cotton Polyester and Cotton Polyester Stretch are made
in optics like Slub, Crosshatch, Mixed counts and Regular with various weaves like Plain, Twill,
Broken twill and Herringbone offered in different finishes like pre shrunk, flat, over dyed and
coated.
Our dyeing line is equipped for Light and Dark Indigo, Sulphur Black, SBIT, IBST with casts
and colors.
State-of-the-art water effluent treatment and sewage treatment plant ensures environment
friendly operations; we are accredited with Oeko-Tex and Organic Content Standard certificates.
Advanced production equipment’s, strict quality control systems, robust sample development
capability and well established design and marketing network contribute to our growing
reputation in this industry. More and more branded enterprises appear in our customer’s list.
VISION
To establish the company as the most admired institution in the textile industry of Bangladesh by
producing and supplying quality products to customers at affordable prices while following an
ethical business process so that the stakeholders and society at large are benefitted.
MISSION
To gain market leadership in the denim fabric manufacturing industry within 2 years.
Use innovation and speed as the driving factor for Progress.
To produce various type of premium denim fabrics for global retailers and brands.
To be a good corporate citizen
Ensure environment friendly and ethical process flow
OBJECTIVES
To grow continuously & ensure a fair return by giving at least 20% dividends.
To ensure that the return on investment is above the industry norm.
To ensure development of skills and human resources.
To contribute significantly to the national economy.
10
Envoy Textiles Limited (ETL)
Envoy Textiles Limited (ETL) is a manufacturer of high quality fashion denim in Bangladesh,
located at Bhaluka, Mymensingh. Introducing rope dyeing denim for the first time in the country,
ETL has been designed with a combination of superior man, machinery and management. The
factory is built over 50 acres of land with an annual production capacity of 20 million meter.
ETL is doubling its denim capacity from 20 million meters to 40 million meter per annum. The
additional capacity will be available from March, 2013 onwards. The project is a 100 percent
export-oriented unit consisting of the state-of-the-art machineries from world's best sources
including USA, Japan, Korea, Italy, India etc.
ETL views business as a customer satisfying process and aims to be the market leader through
excellence in product quality, offering high value added diversified products, formulating
customer friendly service policy and providing one stop solution for our business partners to get
high quality denim fabrics and garments.
ETL is the pioneer Textile unit which started exporting denim fabric from Bangladesh. It is the
first time in export history of Bangladesh, that denim has been exported to countries like USA,
Germany, Italy, Turkey, India, Nepal, Srilanka and Egypt from ETL. It has won the National
Export Trophy (Gold) for the year 2009 -10.
ETL has become a public listed company in 2012.ETL Major Buyers are Marks & Spencer, UK,
H & M, Sweden. Walmart, USA, Carrefour, France, Tema, Turkey, VF Asia, USA, ZARA,
GAP, TESCO, DEBENHAMS etc.
VISION
To achieve a global dominance through:
To become a vertically integrated manufacturer for fabric & garments
Excellence in product quality
Diversify products through continuous product innovation
Customer orientation and cost effectiveness
Malek Spinning Mills Limited
Malek Spinning Mills Limited, together with its subsidiaries, manufactures and sells yarns in
Bangladesh and internationally. The company provides carded and combed, polyester, cotton,
and open end yarns, as well as garments, and knit and denim fabrics. It offers its products to the
local denim fabric and garments manufacturers. The company also produces and sells T-shirts,
polo shirts, jersey knits, leggings, hooded jackets, ladies lingerie, and men’s boxers. Malek
Spinning Mills Limited was incorporated in 1989 and is headquartered in Dhaka, Bangladesh.
11
Shasha Denims Ltd
Since its establishment in 1996 Shasha Denims Limited (SDL) has started to march with vigor
from 2000 and now it is one of the leading denim fabric producers in Bangladesh. The Company
is suitably located at Dhaka Export Processing Zone (DEPZ) with the best available
infrastructural facility. It is a professionally and most modern computerized SLASHER
DYEING technology SDL is able to give valued customers the managed and technically sound
organization and its plant is fully integrated with state of the Art technology and machinery from
Switzerland, Germany, Belgium and USA. Besides, with the best real classical Indigo Denim.
Over the years, the company has been researching for technology which can enable the company
to produce quality denim clothes that are not manufactured by any denim manufacturer in
Bangladesh. The Company produces denim fabrics weighing from 4oz/yd2 to 15oz/yd2. It is a
deemed exporter and eventually serves the EU and Australian Markets. Present production
capacity is 21.6 million yards per year. Most of the customers are world renowned and in many
of cases SDL is the only nominated supplier for them from Bangladesh. Shasha Denims Limited
makes fabrics for Marks & Spencer, Zara, C&A, Cotton on, Target Australia, George, New
Look, Tesco, Best seller, Jack&Jones, Dressman, Gina tricot, LPP, Kiabi and so on and deliver
the largest quantity from Bangladesh.
As part of continuous endeavor of this operational excellence SDL is going to establish a new
plant in DEPZ extension area with top of the line latest technology which will lead to increase
the production capacity by 9.6 million yards annually. It is estimated that the cost of the new
plant would be more or less Tk.175.00 crore. As per plan it is expected that yearly revenue
would be increased by thirty percent after the completion of the new plant.
Vision
To be a prime denim manufacturer in the Country through maintaining best quality and
commitment.
Mission
To continue endeavors for development towards satisfaction of existing customers
through quality denim products with innovations and
To expand business by increasing capacity of production using IPO fund and become
premier denim producer of the country.
Objectives
To give emphasis on continuous development endeavors and value addition to become a
leading denim producer and holding its position in the country.
To regular expansion of the project with advanced technology.
To protect shareholders’ interest as well as maximize the wealth of the organization.
To maintain a congenial working environment.
To practice good governance in every sphere of activities covering full disclosures and
reporting to shareholders
12
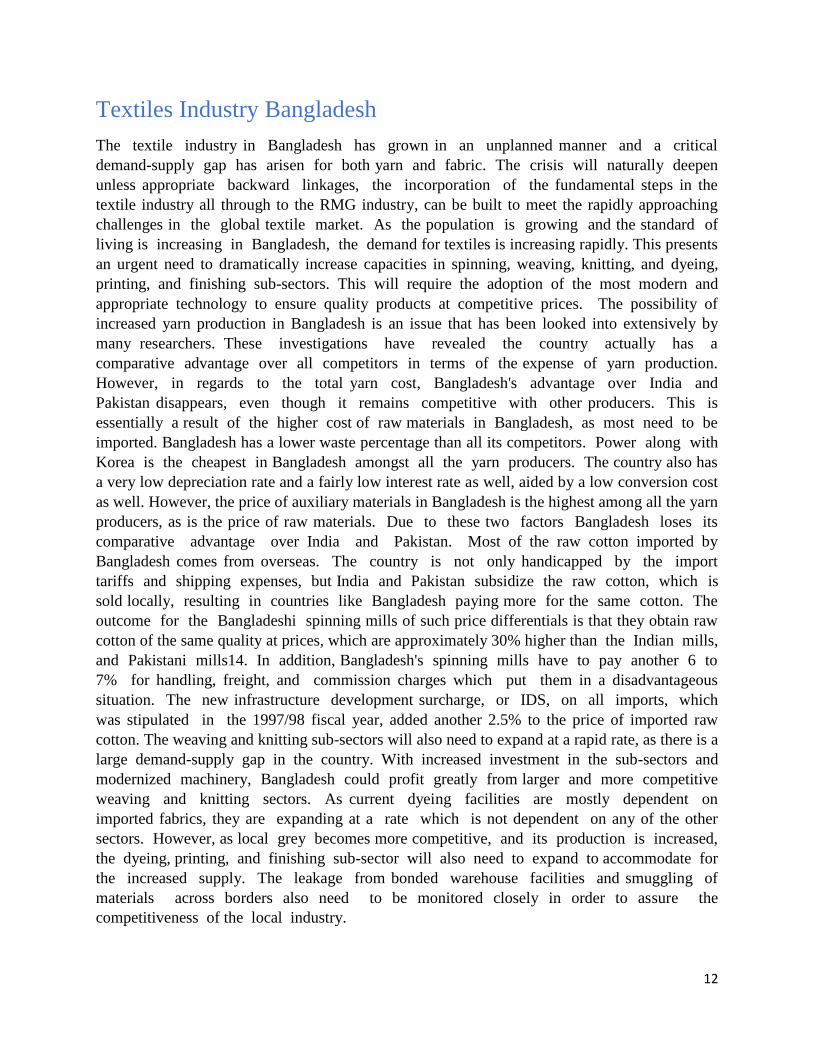
Textiles Industry Bangladesh
The textile industry in Bangladesh has grown in an unplanned manner and a critical
demand-supply gap has arisen for both yarn and fabric. The crisis will naturally deepen
unless appropriate backward linkages, the incorporation of the fundamental steps in the
textile industry all through to the RMG industry, can be built to meet the rapidly approaching
challenges in the global textile market. As the population is growing and the standard of
living is increasing in Bangladesh, the demand for textiles is increasing rapidly. This presents
an urgent need to dramatically increase capacities in spinning, weaving, knitting, and dyeing,
printing, and finishing sub-sectors. This will require the adoption of the most modern and
appropriate technology to ensure quality products at competitive prices. The possibility of
increased yarn production in Bangladesh is an issue that has been looked into extensively by
many researchers. These investigations have revealed the country actually has a
comparative advantage over all competitors in terms of the expense of yarn production.
However, in regards to the total yarn cost, Bangladesh's advantage over India and
Pakistan disappears, even though it remains competitive with other producers. This is
essentially a result of the higher cost of raw materials in Bangladesh, as most need to be
imported. Bangladesh has a lower waste percentage than all its competitors. Power along with
Korea is the cheapest in Bangladesh amongst all the yarn producers. The country also has
a very low depreciation rate and a fairly low interest rate as well, aided by a low conversion cost
as well. However, the price of auxiliary materials in Bangladesh is the highest among all the yarn
producers, as is the price of raw materials. Due to these two factors Bangladesh loses its
comparative advantage over India and Pakistan. Most of the raw cotton imported by
Bangladesh comes from overseas. The country is not only handicapped by the import
tariffs and shipping expenses, but India and Pakistan subsidize the raw cotton, which is
sold locally, resulting in countries like Bangladesh paying more for the same cotton. The
outcome for the Bangladeshi spinning mills of such price differentials is that they obtain raw
cotton of the same quality at prices, which are approximately 30% higher than the Indian mills,
and Pakistani mills14. In addition, Bangladesh's spinning mills have to pay another 6 to
7% for handling, freight, and commission charges which put them in a disadvantageous
situation. The new infrastructure development surcharge, or IDS, on all imports, which
was stipulated in the 1997/98 fiscal year, added another 2.5% to the price of imported raw
cotton. The weaving and knitting sub-sectors will also need to expand at a rapid rate, as there is a
large demand-supply gap in the country. With increased investment in the sub-sectors and
modernized machinery, Bangladesh could profit greatly from larger and more competitive
weaving and knitting sectors. As current dyeing facilities are mostly dependent on
imported fabrics, they are expanding at a rate which is not dependent on any of the other
sectors. However, as local grey becomes more competitive, and its production is increased,
the dyeing, printing, and finishing sub-sector will also need to expand to accommodate for
the increased supply. The leakage from bonded warehouse facilities and smuggling of
materials across borders also need to be monitored closely in order to assure the
competitiveness of the local industry.
13
Chapter – 3
Objectives of the Study
14
Objectives of the Study
Primary Objective
To accomplish the partial requirement of BBA Program from school of business &
economics, United International University. Major in Accounting & Information System
(AIS).
Secondary Objective
To understand the Past Performance of companies because past performance is a good
indicator of future performance.
To understand of current position, financial statement analysis shows the current position
of the company in terms of the types of assets owned by a business firm and the different
liabilities due against the company.
To understand the prediction of profitability and growth prospects of the company.
To understand the prediction of bankruptcy and failure.
To understand the operational efficiency of the management of a company.
15
Chapter – 4
Methodology of the study
16
Methodology of the study This chapter describes the collection procedure of the data, types of data, sample size, sampling
technique or procedure, scope etc. that is explained as below;
Types of data
Here we can work with two kind of data;
Primary data: when data are collect from the origin that means the soul authority of data.
Example collect data from directly to company authority is primary data.
Secondary data: when data are collect from secondary source, for example if data are collect by
one person and used by another person it is called secondary source of data.
In this project report we work with secondary data.
Data collection Process
Main source of data for our project report are annual report of Argon Denims Ltd., Envoy
Textiles Ltd., Malek Spanning miles Ltd, And Shasha Denims Ltd from 2012 to 2017. Annual
report is the best source of our project report because when evaluate the ratio analysis for any
company. From this annual report we work with financial statement like balance sheet and
income statement data. Beside that we also collect data from companies’ website, financial
companies website like lankabangla etc.
Sample size
For this report we are work with annual report of 4 textiles company and there financial
statement and income statement from 2012 to 2017.
Sampling technique and procedure
For this report we use many technique and procedure. Here we discuss how we analysis data, for
this we briefly discuss some step. 1st step is; we choose the annual report of our selected textiles
companies. The annual financial report shows financial data of a company's operating
performance, funds flow and position, for an accounting period. 2nd
step is; we select financial
statement, income statement of our selected company from 2012 to 2017 from the annual report.
This help us with ratio analysis and to understand the company. 3rd
we select the suitable ratio
for performance analysis. 4th
we do some mathematical analysis for calculate the ratio analysis.
We do calculate the ratio from 2012 to 2017. 5th
we use graph to more appropriate evaluation of
our study. And finally we compare between our selected textiles companies performance
analysis, and give decision why one company better than other.
17
Scope of the Study
The scope of the study is to find out the financial performance of some selected textiles company
of Bangladesh, for the past six years. A deep attempt has been made to cover all the aspect
relating to the study. For this purpose, analysis of financial performance of the company has
done from the last six year published financial statement and all aspects the researcher should be
included in the report.
18
Chapter – 5
Literature Review
19
Literature Review In this chapter the summary of the current study related to our report in will be presented along
with the standard format of reference.
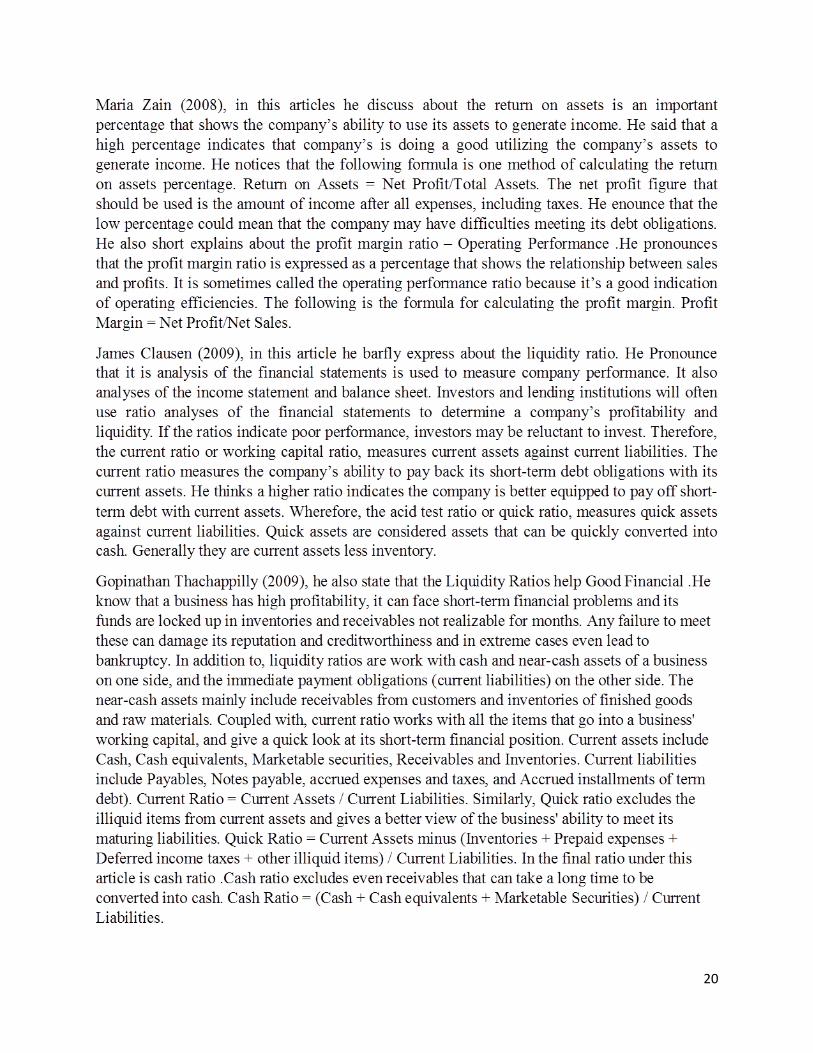
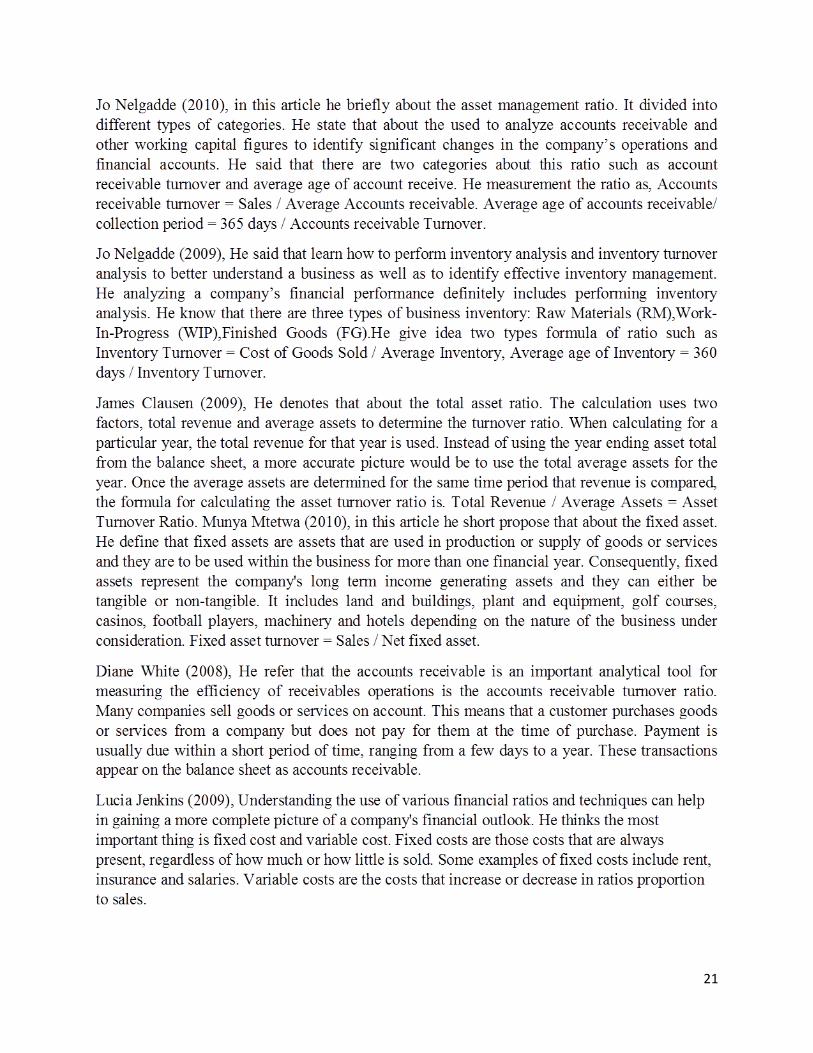
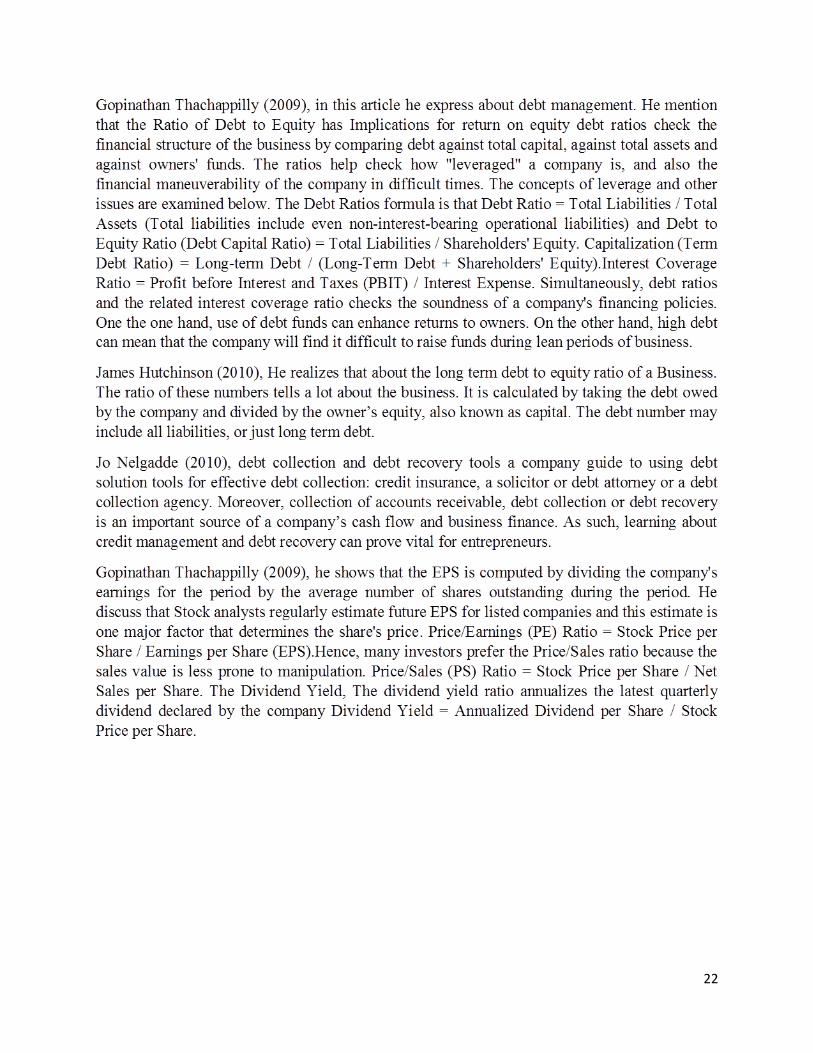
Gopinathan Thachappilly (2009), in this articles he discourse about the Financial Ratio Analysis
for Performance evaluation. The analysis is usually done to make wisdom of the enormous
amount of numbers accessible in company financial statements. It helps assess the performance
of a company, so that financiers can choose whether to finance in that company. Here we are
observing at the different ratio categories in separate articles on different features of performance
such as profitability ratios, liquidity ratios, debt ratios, performance ratios, investment ratios.
20
21
22
23
Chapter – 6
Collection of data and analysis of financial
statement
24
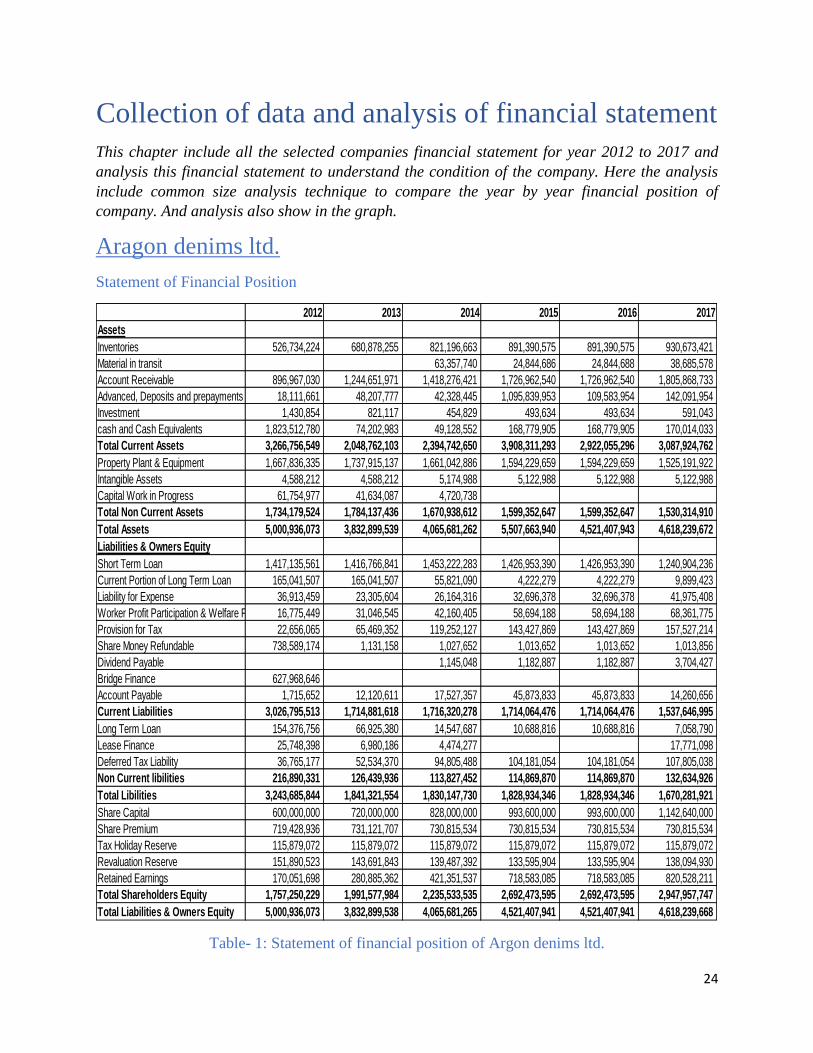
Collection of data and analysis of financial statement
This chapter include all the selected companies financial statement for year 2012 to 2017 and
analysis this financial statement to understand the condition of the company. Here the analysis
include common size analysis technique to compare the year by year financial position of
company. And analysis also show in the graph.
Aragon denims ltd.
Statement of Financial Position
Table- 1: Statement of financial position of Argon denims ltd.
2012 2013 2014 2015 2016 2017
Assets
Inventories 526,734,224 680,878,255 821,196,663 891,390,575 891,390,575 930,673,421
Material in transit 63,357,740 24,844,686 24,844,688 38,685,578
Account Receivable 896,967,030 1,244,651,971 1,418,276,421 1,726,962,540 1,726,962,540 1,805,868,733
Advanced, Deposits and prepayments 18,111,661 48,207,777 42,328,445 1,095,839,953 109,583,954 142,091,954
Investment 1,430,854 821,117 454,829 493,634 493,634 591,043
cash and Cash Equivalents 1,823,512,780 74,202,983 49,128,552 168,779,905 168,779,905 170,014,033
Total Current Assets 3,266,756,549 2,048,762,103 2,394,742,650 3,908,311,293 2,922,055,296 3,087,924,762
Property Plant & Equipment 1,667,836,335 1,737,915,137 1,661,042,886 1,594,229,659 1,594,229,659 1,525,191,922
Intangible Assets 4,588,212 4,588,212 5,174,988 5,122,988 5,122,988 5,122,988
Capital Work in Progress 61,754,977 41,634,087 4,720,738
Total Non Current Assets 1,734,179,524 1,784,137,436 1,670,938,612 1,599,352,647 1,599,352,647 1,530,314,910
Total Assets 5,000,936,073 3,832,899,539 4,065,681,262 5,507,663,940 4,521,407,943 4,618,239,672
Liabilities & Owners Equity
Short Term Loan 1,417,135,561 1,416,766,841 1,453,222,283 1,426,953,390 1,426,953,390 1,240,904,236
Current Portion of Long Term Loan 165,041,507 165,041,507 55,821,090 4,222,279 4,222,279 9,899,423
Liability for Expense 36,913,459 23,305,604 26,164,316 32,696,378 32,696,378 41,975,408
Worker Profit Participation & Welfare Fund 16,775,449 31,046,545 42,160,405 58,694,188 58,694,188 68,361,775
Provision for Tax 22,656,065 65,469,352 119,252,127 143,427,869 143,427,869 157,527,214
Share Money Refundable 738,589,174 1,131,158 1,027,652 1,013,652 1,013,652 1,013,856
Dividend Payable 1,145,048 1,182,887 1,182,887 3,704,427
Bridge Finance 627,968,646
Account Payable 1,715,652 12,120,611 17,527,357 45,873,833 45,873,833 14,260,656
Current Liabilities 3,026,795,513 1,714,881,618 1,716,320,278 1,714,064,476 1,714,064,476 1,537,646,995
Long Term Loan 154,376,756 66,925,380 14,547,687 10,688,816 10,688,816 7,058,790
Lease Finance 25,748,398 6,980,186 4,474,277 17,771,098
Deferred Tax Liability 36,765,177 52,534,370 94,805,488 104,181,054 104,181,054 107,805,038
Non Current libilities 216,890,331 126,439,936 113,827,452 114,869,870 114,869,870 132,634,926
Total Libilities 3,243,685,844 1,841,321,554 1,830,147,730 1,828,934,346 1,828,934,346 1,670,281,921
Share Capital 600,000,000 720,000,000 828,000,000 993,600,000 993,600,000 1,142,640,000
Share Premium 719,428,936 731,121,707 730,815,534 730,815,534 730,815,534 730,815,534
Tax Holiday Reserve 115,879,072 115,879,072 115,879,072 115,879,072 115,879,072 115,879,072
Revaluation Reserve 151,890,523 143,691,843 139,487,392 133,595,904 133,595,904 138,094,930
Retained Earnings 170,051,698 280,885,362 421,351,537 718,583,085 718,583,085 820,528,211
Total Shareholders Equity 1,757,250,229 1,991,577,984 2,235,533,535 2,692,473,595 2,692,473,595 2,947,957,747
Total Liabilities & Owners Equity 5,000,936,073 3,832,899,538 4,065,681,265 4,521,407,941 4,521,407,941 4,618,239,668
25
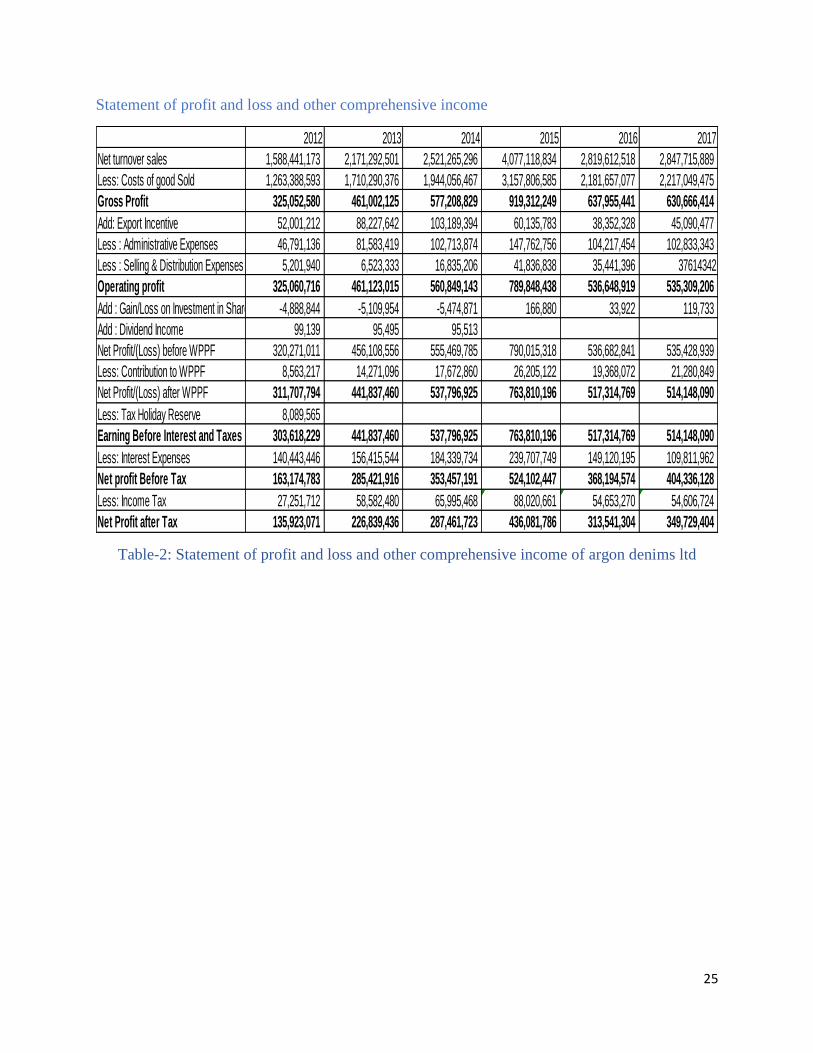
Statement of profit and loss and other comprehensive income
Table-2: Statement of profit and loss and other comprehensive income of argon denims ltd
2012 2013 2014 2015 2016 2017
Net turnover sales 1,588,441,173 2,171,292,501 2,521,265,296 4,077,118,834 2,819,612,518 2,847,715,889
Less: Costs of good Sold 1,263,388,593 1,710,290,376 1,944,056,467 3,157,806,585 2,181,657,077 2,217,049,475
Gross Profit 325,052,580 461,002,125 577,208,829 919,312,249 637,955,441 630,666,414
Add: Export Incentive 52,001,212 88,227,642 103,189,394 60,135,783 38,352,328 45,090,477
Less : Administrative Expenses 46,791,136 81,583,419 102,713,874 147,762,756 104,217,454 102,833,343
Less : Selling & Distribution Expenses 5,201,940 6,523,333 16,835,206 41,836,838 35,441,396 37614342
Operating profit 325,060,716 461,123,015 560,849,143 789,848,438 536,648,919 535,309,206
Add : Gain/Loss on Investment in Share -4,888,844 -5,109,954 -5,474,871 166,880 33,922 119,733
Add : Dividend Income 99,139 95,495 95,513
Net Profit/(Loss) before WPPF 320,271,011 456,108,556 555,469,785 790,015,318 536,682,841 535,428,939
Less: Contribution to WPPF 8,563,217 14,271,096 17,672,860 26,205,122 19,368,072 21,280,849
Net Profit/(Loss) after WPPF 311,707,794 441,837,460 537,796,925 763,810,196 517,314,769 514,148,090
Less: Tax Holiday Reserve 8,089,565
Earning Before Interest and Taxes 303,618,229 441,837,460 537,796,925 763,810,196 517,314,769 514,148,090
Less: Interest Expenses 140,443,446 156,415,544 184,339,734 239,707,749 149,120,195 109,811,962
Net profit Before Tax 163,174,783 285,421,916 353,457,191 524,102,447 368,194,574 404,336,128
Less: Income Tax 27,251,712 58,582,480 65,995,468 88,020,661 54,653,270 54,606,724
Net Profit after Tax 135,923,071 226,839,436 287,461,723 436,081,786 313,541,304 349,729,404
26
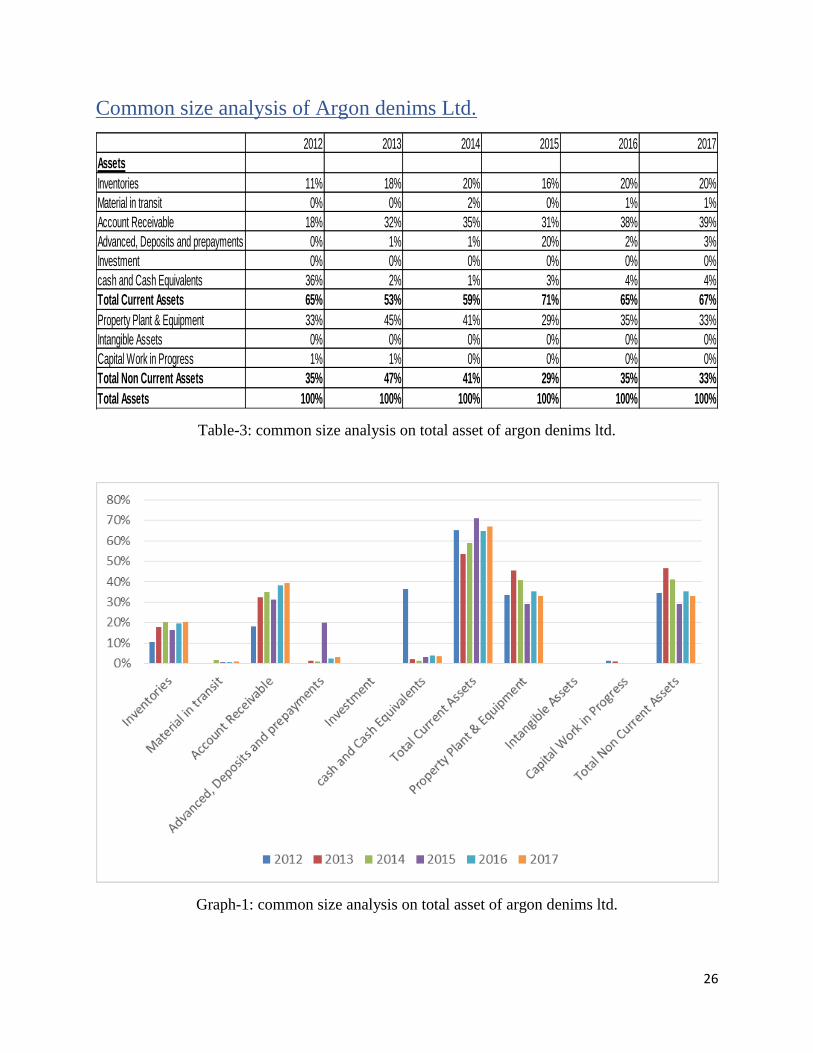
Common size analysis of Argon denims Ltd.
Table-3: common size analysis on total asset of argon denims ltd.
Graph-1: common size analysis on total asset of argon denims ltd.
2012 2013 2014 2015 2016 2017
Assets
Inventories 11% 18% 20% 16% 20% 20%
Material in transit 0% 0% 2% 0% 1% 1%
Account Receivable 18% 32% 35% 31% 38% 39%
Advanced, Deposits and prepayments 0% 1% 1% 20% 2% 3%
Investment 0% 0% 0% 0% 0% 0%
cash and Cash Equivalents 36% 2% 1% 3% 4% 4%
Total Current Assets 65% 53% 59% 71% 65% 67%
Property Plant & Equipment 33% 45% 41% 29% 35% 33%
Intangible Assets 0% 0% 0% 0% 0% 0%
Capital Work in Progress 1% 1% 0% 0% 0% 0%
Total Non Current Assets 35% 47% 41% 29% 35% 33%
Total Assets 100% 100% 100% 100% 100% 100%
27
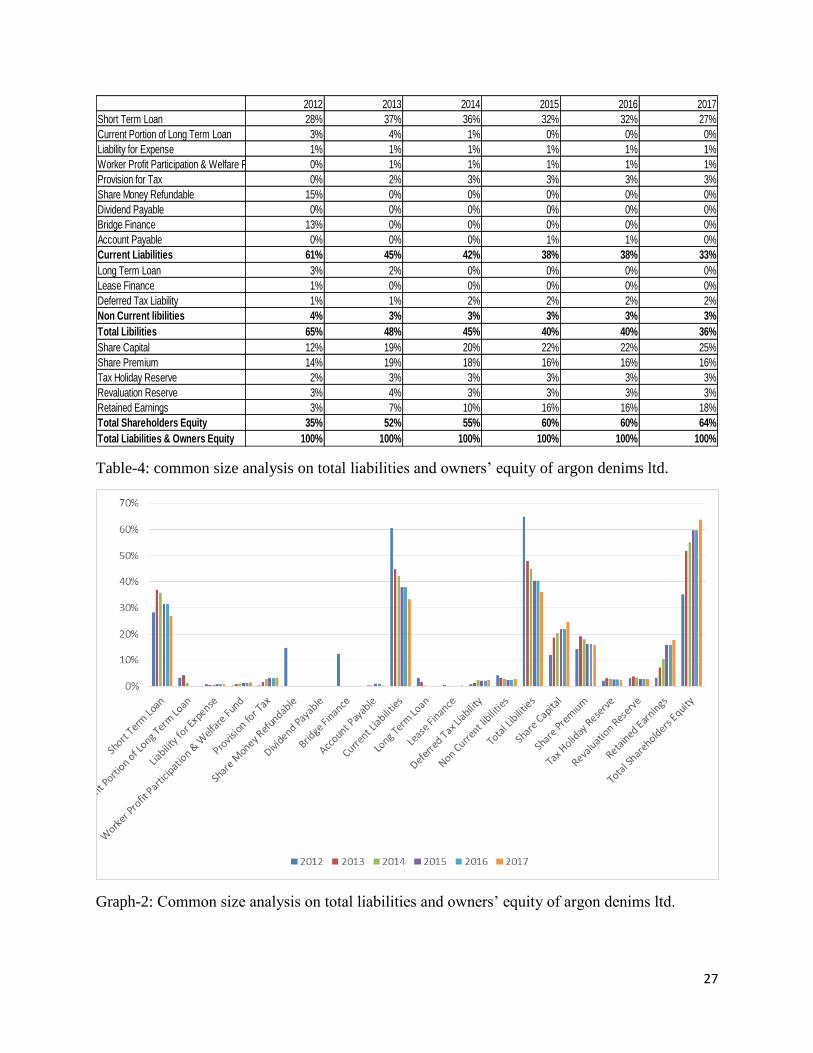
Table-4: common size analysis on total liabilities and owners’ equity of argon denims ltd.
Graph-2: Common size analysis on total liabilities and owners’ equity of argon denims ltd.
2012 2013 2014 2015 2016 2017
Short Term Loan 28% 37% 36% 32% 32% 27%
Current Portion of Long Term Loan 3% 4% 1% 0% 0% 0%
Liability for Expense 1% 1% 1% 1% 1% 1%
Worker Profit Participation & Welfare Fund 0% 1% 1% 1% 1% 1%
Provision for Tax 0% 2% 3% 3% 3% 3%
Share Money Refundable 15% 0% 0% 0% 0% 0%
Dividend Payable 0% 0% 0% 0% 0% 0%
Bridge Finance 13% 0% 0% 0% 0% 0%
Account Payable 0% 0% 0% 1% 1% 0%
Current Liabilities 61% 45% 42% 38% 38% 33%
Long Term Loan 3% 2% 0% 0% 0% 0%
Lease Finance 1% 0% 0% 0% 0% 0%
Deferred Tax Liability 1% 1% 2% 2% 2% 2%
Non Current libilities 4% 3% 3% 3% 3% 3%
Total Libilities 65% 48% 45% 40% 40% 36%
Share Capital 12% 19% 20% 22% 22% 25%
Share Premium 14% 19% 18% 16% 16% 16%
Tax Holiday Reserve 2% 3% 3% 3% 3% 3%
Revaluation Reserve 3% 4% 3% 3% 3% 3%
Retained Earnings 3% 7% 10% 16% 16% 18%
Total Shareholders Equity 35% 52% 55% 60% 60% 64%
Total Liabilities & Owners Equity 100% 100% 100% 100% 100% 100%
28
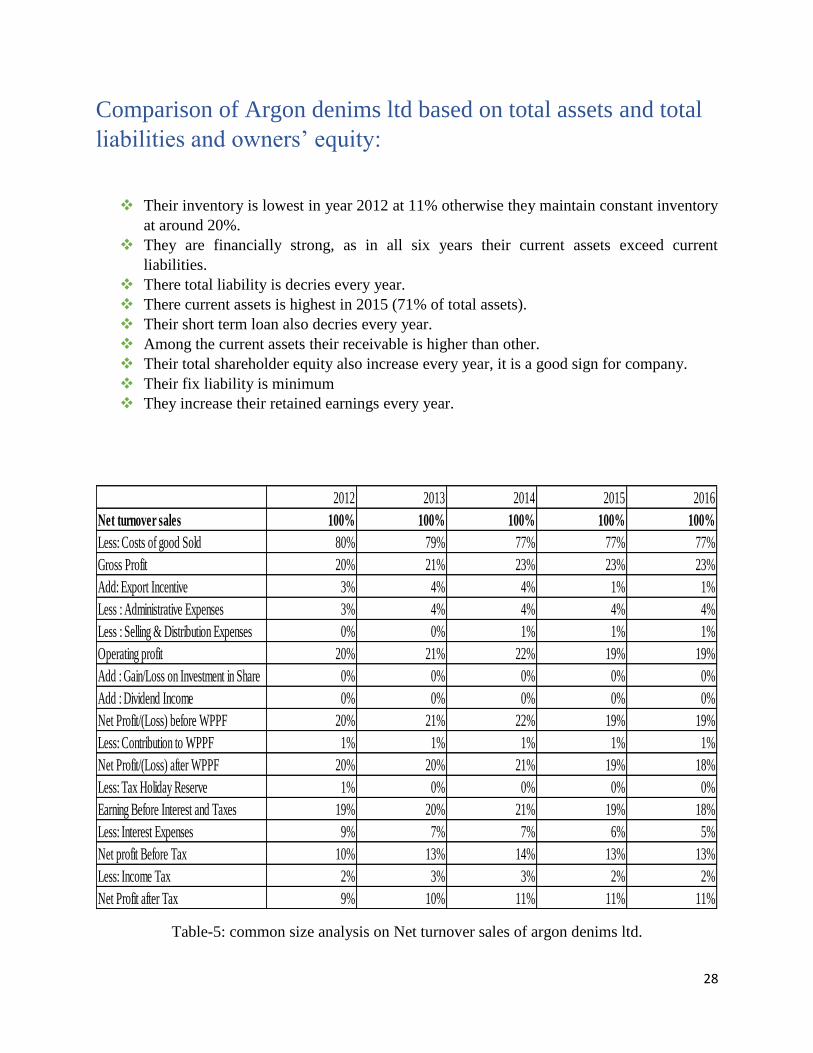
Comparison of Argon denims ltd based on total assets and total
liabilities and owners’ equity:
Their inventory is lowest in year 2012 at 11% otherwise they maintain constant inventory
at around 20%.
They are financially strong, as in all six years their current assets exceed current
liabilities.
There total liability is decries every year.
There current assets is highest in 2015 (71% of total assets).
Their short term loan also decries every year.
Among the current assets their receivable is higher than other.
Their total shareholder equity also increase every year, it is a good sign for company.
Their fix liability is minimum
They increase their retained earnings every year.
Table-5: common size analysis on Net turnover sales of argon denims ltd.
2012 2013 2014 2015 2016
Net turnover sales 100% 100% 100% 100% 100%
Less: Costs of good Sold 80% 79% 77% 77% 77%
Gross Profit 20% 21% 23% 23% 23%
Add: Export Incentive 3% 4% 4% 1% 1%
Less : Administrative Expenses 3% 4% 4% 4% 4%
Less : Selling & Distribution Expenses 0% 0% 1% 1% 1%
Operating profit 20% 21% 22% 19% 19%
Add : Gain/Loss on Investment in Share 0% 0% 0% 0% 0%
Add : Dividend Income 0% 0% 0% 0% 0%
Net Profit/(Loss) before WPPF 20% 21% 22% 19% 19%
Less: Contribution to WPPF 1% 1% 1% 1% 1%
Net Profit/(Loss) after WPPF 20% 20% 21% 19% 18%
Less: Tax Holiday Reserve 1% 0% 0% 0% 0%
Earning Before Interest and Taxes 19% 20% 21% 19% 18%
Less: Interest Expenses 9% 7% 7% 6% 5%
Net profit Before Tax 10% 13% 14% 13% 13%
Less: Income Tax 2% 3% 3% 2% 2%
Net Profit after Tax 9% 10% 11% 11% 11%
29
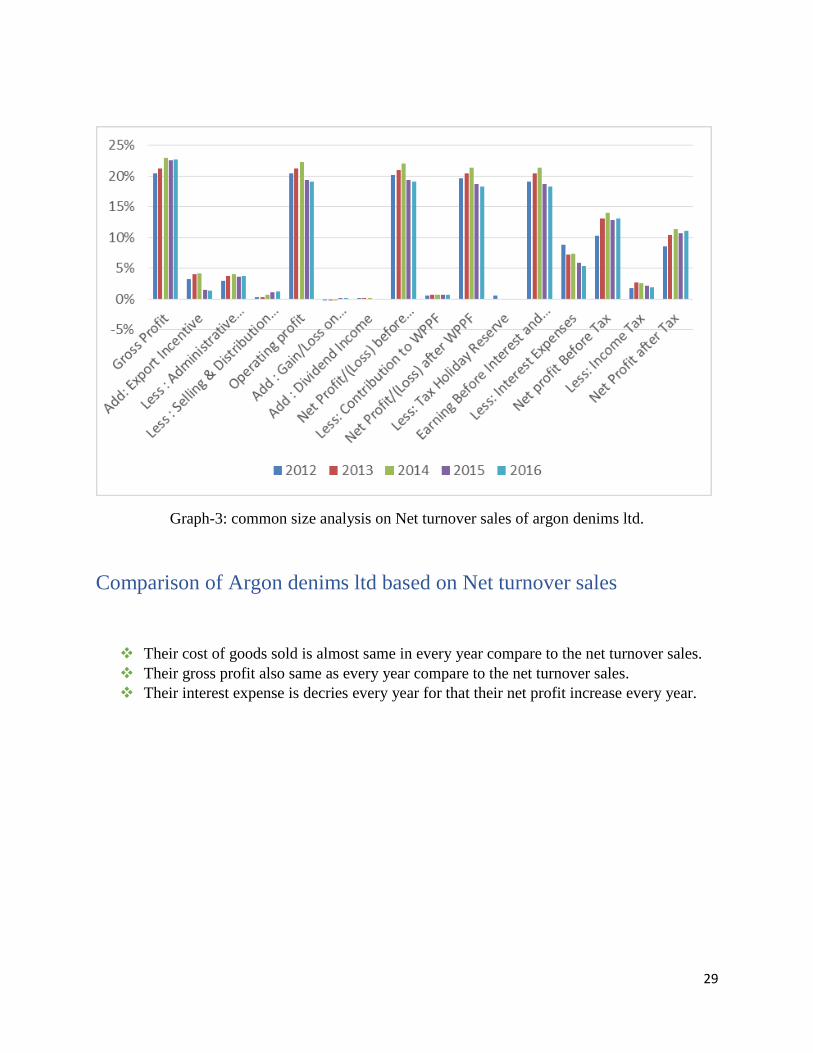
Graph-3: common size analysis on Net turnover sales of argon denims ltd.
Comparison of Argon denims ltd based on Net turnover sales
Their cost of goods sold is almost same in every year compare to the net turnover sales.
Their gross profit also same as every year compare to the net turnover sales.
Their interest expense is decries every year for that their net profit increase every year.
30
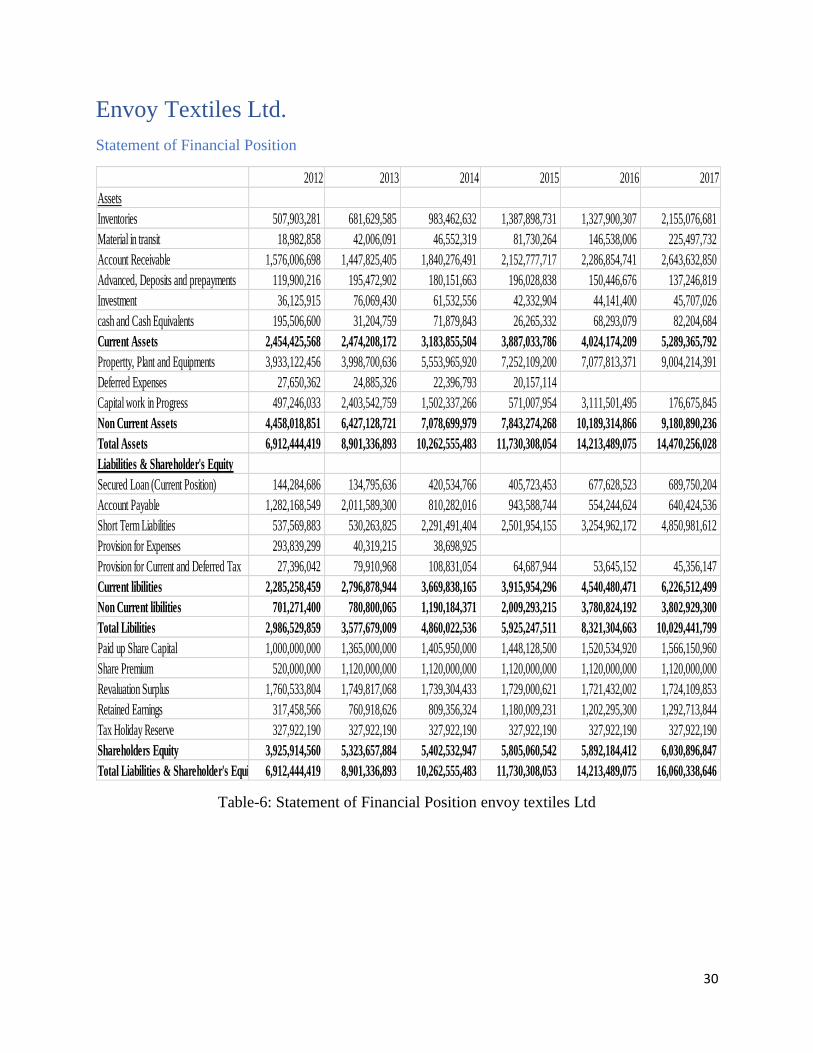
Envoy Textiles Ltd.
Statement of Financial Position
Table-6: Statement of Financial Position envoy textiles Ltd
2012 2013 2014 2015 2016 2017
Assets
Inventories 507,903,281 681,629,585 983,462,632 1,387,898,731 1,327,900,307 2,155,076,681
Material in transit 18,982,858 42,006,091 46,552,319 81,730,264 146,538,006 225,497,732
Account Receivable 1,576,006,698 1,447,825,405 1,840,276,491 2,152,777,717 2,286,854,741 2,643,632,850
Advanced, Deposits and prepayments 119,900,216 195,472,902 180,151,663 196,028,838 150,446,676 137,246,819
Investment 36,125,915 76,069,430 61,532,556 42,332,904 44,141,400 45,707,026
cash and Cash Equivalents 195,506,600 31,204,759 71,879,843 26,265,332 68,293,079 82,204,684
Current Assets 2,454,425,568 2,474,208,172 3,183,855,504 3,887,033,786 4,024,174,209 5,289,365,792
Propertty, Plant and Equipments 3,933,122,456 3,998,700,636 5,553,965,920 7,252,109,200 7,077,813,371 9,004,214,391
Deferred Expenses 27,650,362 24,885,326 22,396,793 20,157,114
Capital work in Progress 497,246,033 2,403,542,759 1,502,337,266 571,007,954 3,111,501,495 176,675,845
Non Current Assets 4,458,018,851 6,427,128,721 7,078,699,979 7,843,274,268 10,189,314,866 9,180,890,236
Total Assets 6,912,444,419 8,901,336,893 10,262,555,483 11,730,308,054 14,213,489,075 14,470,256,028
Liabilities & Shareholder's Equity
Secured Loan (Current Position) 144,284,686 134,795,636 420,534,766 405,723,453 677,628,523 689,750,204
Account Payable 1,282,168,549 2,011,589,300 810,282,016 943,588,744 554,244,624 640,424,536
Short Term Liabilities 537,569,883 530,263,825 2,291,491,404 2,501,954,155 3,254,962,172 4,850,981,612
Provision for Expenses 293,839,299 40,319,215 38,698,925
Provision for Current and Deferred Tax 27,396,042 79,910,968 108,831,054 64,687,944 53,645,152 45,356,147
Current libilities 2,285,258,459 2,796,878,944 3,669,838,165 3,915,954,296 4,540,480,471 6,226,512,499
Non Current libilities 701,271,400 780,800,065 1,190,184,371 2,009,293,215 3,780,824,192 3,802,929,300
Total Libilities 2,986,529,859 3,577,679,009 4,860,022,536 5,925,247,511 8,321,304,663 10,029,441,799
Paid up Share Capital 1,000,000,000 1,365,000,000 1,405,950,000 1,448,128,500 1,520,534,920 1,566,150,960
Share Premium 520,000,000 1,120,000,000 1,120,000,000 1,120,000,000 1,120,000,000 1,120,000,000
Revaluation Surplus 1,760,533,804 1,749,817,068 1,739,304,433 1,729,000,621 1,721,432,002 1,724,109,853
Retained Earnings 317,458,566 760,918,626 809,356,324 1,180,009,231 1,202,295,300 1,292,713,844
Tax Holiday Reserve 327,922,190 327,922,190 327,922,190 327,922,190 327,922,190 327,922,190
Shareholders Equity 3,925,914,560 5,323,657,884 5,402,532,947 5,805,060,542 5,892,184,412 6,030,896,847
Total Liabilities & Shareholder's Equity 6,912,444,419 8,901,336,893 10,262,555,483 11,730,308,053 14,213,489,075 16,060,338,646
31
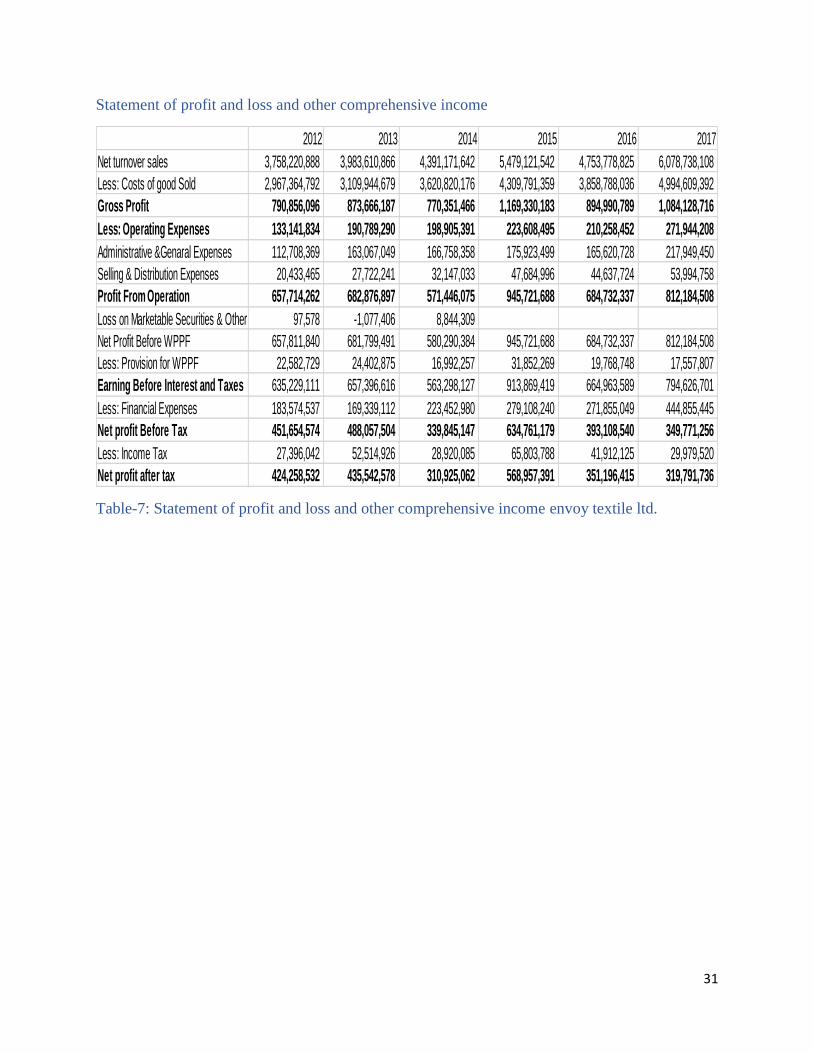
Statement of profit and loss and other comprehensive income
Table-7: Statement of profit and loss and other comprehensive income envoy textile ltd.
2012 2013 2014 2015 2016 2017
Net turnover sales 3,758,220,888 3,983,610,866 4,391,171,642 5,479,121,542 4,753,778,825 6,078,738,108
Less: Costs of good Sold 2,967,364,792 3,109,944,679 3,620,820,176 4,309,791,359 3,858,788,036 4,994,609,392
Gross Profit 790,856,096 873,666,187 770,351,466 1,169,330,183 894,990,789 1,084,128,716
Less: Operating Expenses 133,141,834 190,789,290 198,905,391 223,608,495 210,258,452 271,944,208
Administrative &Genaral Expenses 112,708,369 163,067,049 166,758,358 175,923,499 165,620,728 217,949,450
Selling & Distribution Expenses 20,433,465 27,722,241 32,147,033 47,684,996 44,637,724 53,994,758
Profit From Operation 657,714,262 682,876,897 571,446,075 945,721,688 684,732,337 812,184,508
Loss on Marketable Securities & Other 97,578 -1,077,406 8,844,309
Net Profit Before WPPF 657,811,840 681,799,491 580,290,384 945,721,688 684,732,337 812,184,508
Less: Provision for WPPF 22,582,729 24,402,875 16,992,257 31,852,269 19,768,748 17,557,807
Earning Before Interest and Taxes 635,229,111 657,396,616 563,298,127 913,869,419 664,963,589 794,626,701
Less: Financial Expenses 183,574,537 169,339,112 223,452,980 279,108,240 271,855,049 444,855,445
Net profit Before Tax 451,654,574 488,057,504 339,845,147 634,761,179 393,108,540 349,771,256
Less: Income Tax 27,396,042 52,514,926 28,920,085 65,803,788 41,912,125 29,979,520
Net profit after tax 424,258,532 435,542,578 310,925,062 568,957,391 351,196,415 319,791,736
32
Common-size analysis of envoy textile ltd.
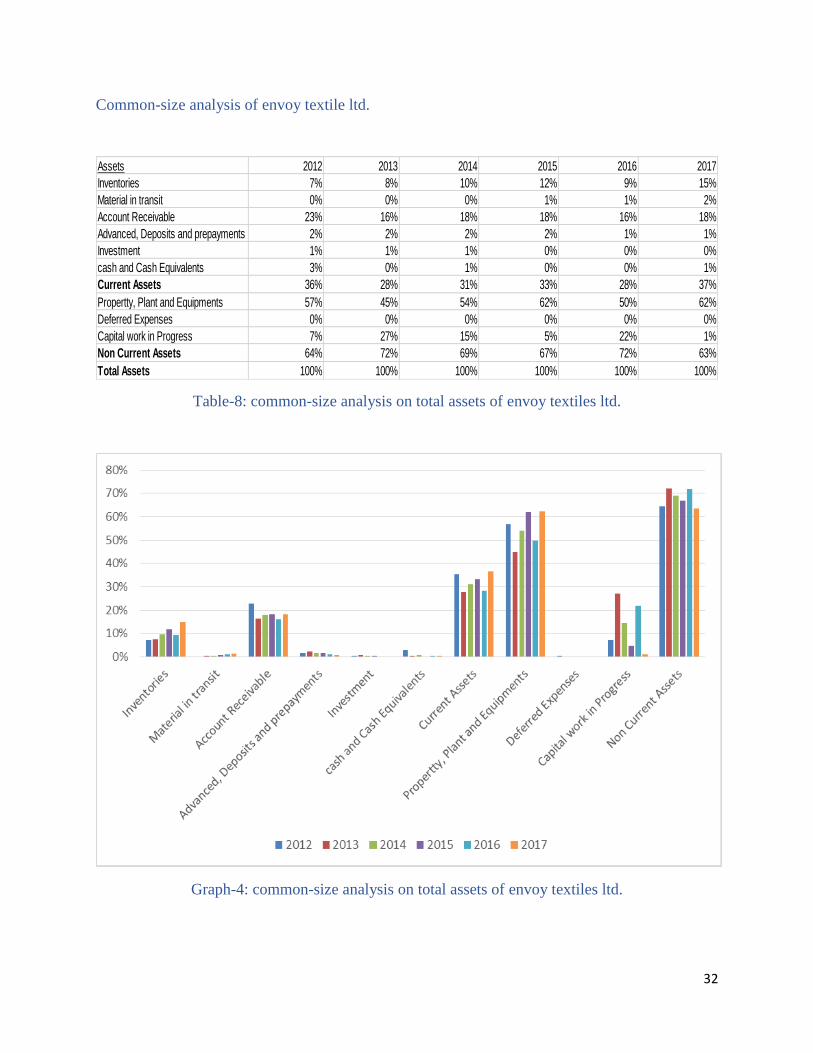
Table-8: common-size analysis on total assets of envoy textiles ltd.
Graph-4: common-size analysis on total assets of envoy textiles ltd.
Assets 2012 2013 2014 2015 2016 2017
Inventories 7% 8% 10% 12% 9% 15%
Material in transit 0% 0% 0% 1% 1% 2%
Account Receivable 23% 16% 18% 18% 16% 18%
Advanced, Deposits and prepayments 2% 2% 2% 2% 1% 1%
Investment 1% 1% 1% 0% 0% 0%
cash and Cash Equivalents 3% 0% 1% 0% 0% 1%
Current Assets 36% 28% 31% 33% 28% 37%
Propertty, Plant and Equipments 57% 45% 54% 62% 50% 62%
Deferred Expenses 0% 0% 0% 0% 0% 0%
Capital work in Progress 7% 27% 15% 5% 22% 1%
Non Current Assets 64% 72% 69% 67% 72% 63%
Total Assets 100% 100% 100% 100% 100% 100%
33
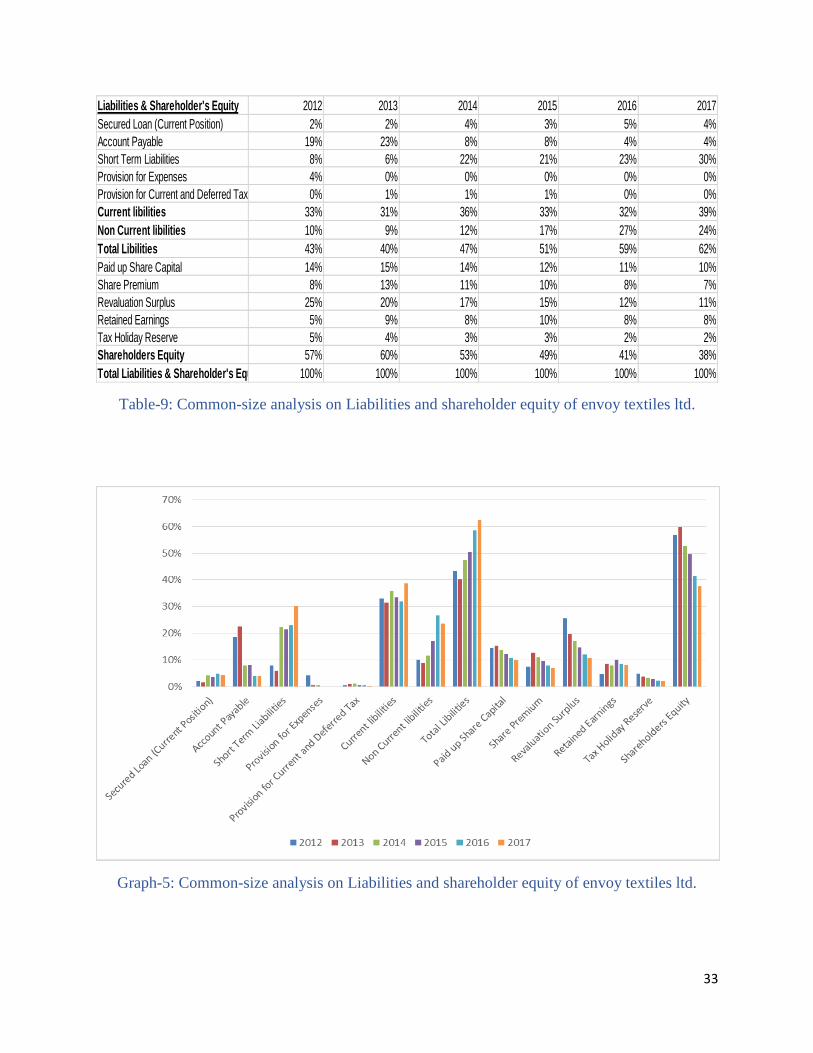
Table-9: Common-size analysis on Liabilities and shareholder equity of envoy textiles ltd.
Graph-5: Common-size analysis on Liabilities and shareholder equity of envoy textiles ltd.
Liabilities & Shareholder's Equity 2012 2013 2014 2015 2016 2017
Secured Loan (Current Position) 2% 2% 4% 3% 5% 4%
Account Payable 19% 23% 8% 8% 4% 4%
Short Term Liabilities 8% 6% 22% 21% 23% 30%
Provision for Expenses 4% 0% 0% 0% 0% 0%
Provision for Current and Deferred Tax 0% 1% 1% 1% 0% 0%
Current libilities 33% 31% 36% 33% 32% 39%
Non Current libilities 10% 9% 12% 17% 27% 24%
Total Libilities 43% 40% 47% 51% 59% 62%
Paid up Share Capital 14% 15% 14% 12% 11% 10%
Share Premium 8% 13% 11% 10% 8% 7%
Revaluation Surplus 25% 20% 17% 15% 12% 11%
Retained Earnings 5% 9% 8% 10% 8% 8%
Tax Holiday Reserve 5% 4% 3% 3% 2% 2%
Shareholders Equity 57% 60% 53% 49% 41% 38%
Total Liabilities & Shareholder's Equity 100% 100% 100% 100% 100% 100%
34
Comparison of envoy textiles ltd based on total assets and total
liabilities and owners’ equity:
Their inventory is increasing since year 2012 except year 2015 compare to total assets.
Account receivable is not that much very except 2012 (23% of total asset).
There current asset is highest in year 2017 which is 37%. But except 2012 current asset is
less than current liability which is not a good sign for company’s creditor.
Their current liability is highest in year 2017 which is 39% of total liability and
shareholder equity.
Shareholder equity is decreasing every year lowest is in 2017 (38% of total liability and
shareholder equity) and highest in 2012 (57% of total liability and shareholder equity).
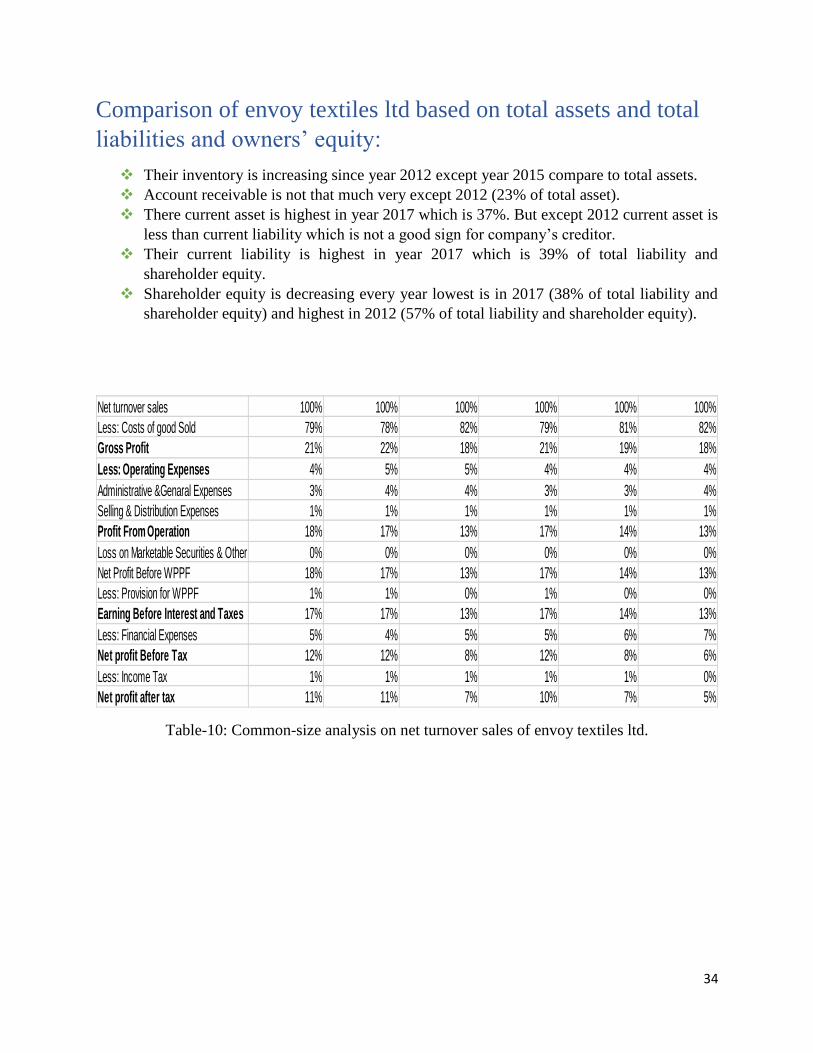
Table-10: Common-size analysis on net turnover sales of envoy textiles ltd.
Net turnover sales 100% 100% 100% 100% 100% 100%
Less: Costs of good Sold 79% 78% 82% 79% 81% 82%
Gross Profit 21% 22% 18% 21% 19% 18%
Less: Operating Expenses 4% 5% 5% 4% 4% 4%
Administrative &Genaral Expenses 3% 4% 4% 3% 3% 4%
Selling & Distribution Expenses 1% 1% 1% 1% 1% 1%
Profit From Operation 18% 17% 13% 17% 14% 13%
Loss on Marketable Securities & Other 0% 0% 0% 0% 0% 0%
Net Profit Before WPPF 18% 17% 13% 17% 14% 13%
Less: Provision for WPPF 1% 1% 0% 1% 0% 0%
Earning Before Interest and Taxes 17% 17% 13% 17% 14% 13%
Less: Financial Expenses 5% 4% 5% 5% 6% 7%
Net profit Before Tax 12% 12% 8% 12% 8% 6%
Less: Income Tax 1% 1% 1% 1% 1% 0%
Net profit after tax 11% 11% 7% 10% 7% 5%
35
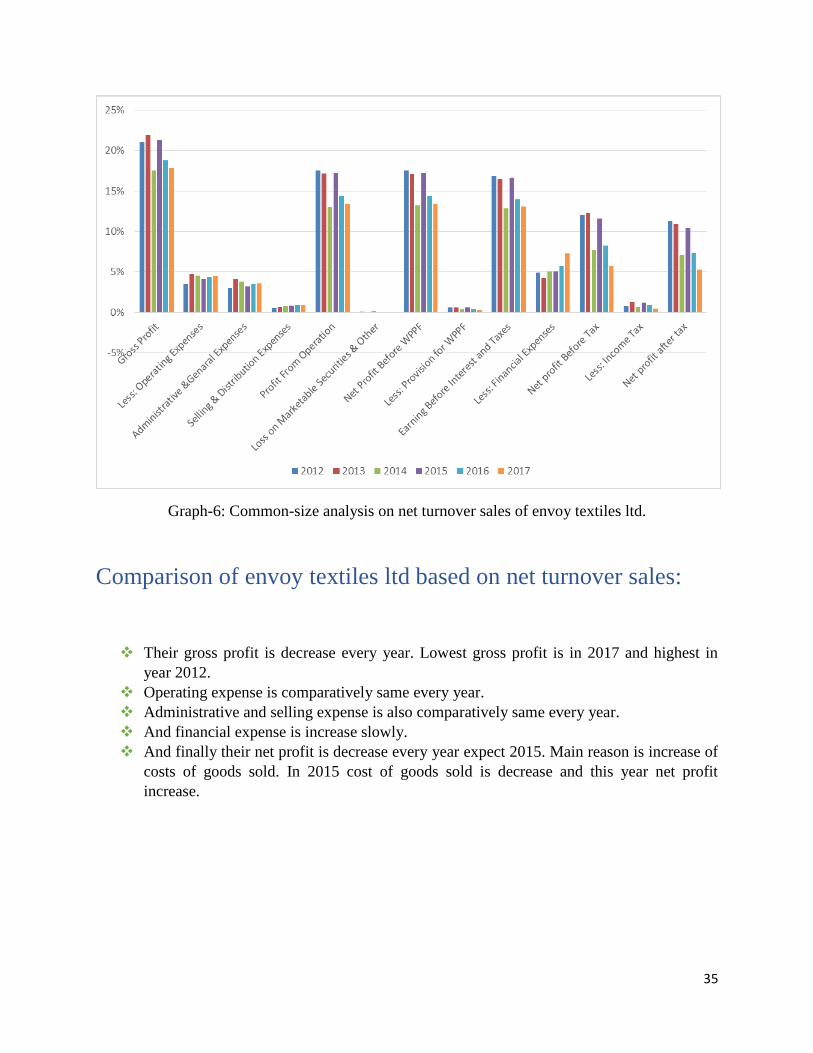
Graph-6: Common-size analysis on net turnover sales of envoy textiles ltd.
Comparison of envoy textiles ltd based on net turnover sales:
Their gross profit is decrease every year. Lowest gross profit is in 2017 and highest in
year 2012.
Operating expense is comparatively same every year.
Administrative and selling expense is also comparatively same every year.
And financial expense is increase slowly.
And finally their net profit is decrease every year expect 2015. Main reason is increase of
costs of goods sold. In 2015 cost of goods sold is decrease and this year net profit
increase.
36
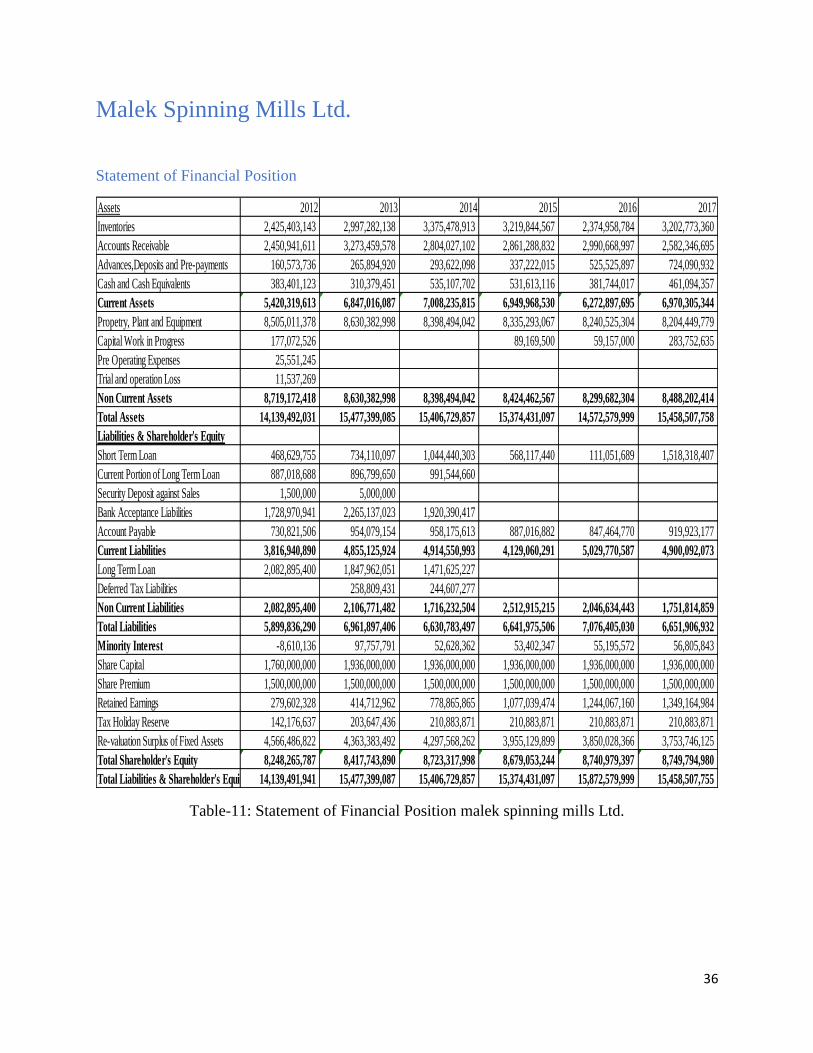
Malek Spinning Mills Ltd.
Statement of Financial Position
Table-11: Statement of Financial Position malek spinning mills Ltd.
Assets 2012 2013 2014 2015 2016 2017
Inventories 2,425,403,143 2,997,282,138 3,375,478,913 3,219,844,567 2,374,958,784 3,202,773,360
Accounts Receivable 2,450,941,611 3,273,459,578 2,804,027,102 2,861,288,832 2,990,668,997 2,582,346,695
Advances,Deposits and Pre-payments 160,573,736 265,894,920 293,622,098 337,222,015 525,525,897 724,090,932
Cash and Cash Equivalents 383,401,123 310,379,451 535,107,702 531,613,116 381,744,017 461,094,357
Current Assets 5,420,319,613 6,847,016,087 7,008,235,815 6,949,968,530 6,272,897,695 6,970,305,344
Propetry, Plant and Equipment 8,505,011,378 8,630,382,998 8,398,494,042 8,335,293,067 8,240,525,304 8,204,449,779
Capital Work in Progress 177,072,526 89,169,500 59,157,000 283,752,635
Pre Operating Expenses 25,551,245
Trial and operation Loss 11,537,269
Non Current Assets 8,719,172,418 8,630,382,998 8,398,494,042 8,424,462,567 8,299,682,304 8,488,202,414
Total Assets 14,139,492,031 15,477,399,085 15,406,729,857 15,374,431,097 14,572,579,999 15,458,507,758
Liabilities & Shareholder's Equity
Short Term Loan 468,629,755 734,110,097 1,044,440,303 568,117,440 111,051,689 1,518,318,407
Current Portion of Long Term Loan 887,018,688 896,799,650 991,544,660
Security Deposit against Sales 1,500,000 5,000,000
Bank Acceptance Liabilities 1,728,970,941 2,265,137,023 1,920,390,417
Account Payable 730,821,506 954,079,154 958,175,613 887,016,882 847,464,770 919,923,177
Current Liabilities 3,816,940,890 4,855,125,924 4,914,550,993 4,129,060,291 5,029,770,587 4,900,092,073
Long Term Loan 2,082,895,400 1,847,962,051 1,471,625,227
Deferred Tax Liabilities 258,809,431 244,607,277
Non Current Liabilities 2,082,895,400 2,106,771,482 1,716,232,504 2,512,915,215 2,046,634,443 1,751,814,859
Total Liabilities 5,899,836,290 6,961,897,406 6,630,783,497 6,641,975,506 7,076,405,030 6,651,906,932
Minority Interest -8,610,136 97,757,791 52,628,362 53,402,347 55,195,572 56,805,843
Share Capital 1,760,000,000 1,936,000,000 1,936,000,000 1,936,000,000 1,936,000,000 1,936,000,000
Share Premium 1,500,000,000 1,500,000,000 1,500,000,000 1,500,000,000 1,500,000,000 1,500,000,000
Retained Earnings 279,602,328 414,712,962 778,865,865 1,077,039,474 1,244,067,160 1,349,164,984
Tax Holiday Reserve 142,176,637 203,647,436 210,883,871 210,883,871 210,883,871 210,883,871
Re-valuation Surplus of Fixed Assets 4,566,486,822 4,363,383,492 4,297,568,262 3,955,129,899 3,850,028,366 3,753,746,125
Total Shareholder's Equity 8,248,265,787 8,417,743,890 8,723,317,998 8,679,053,244 8,740,979,397 8,749,794,980
Total Liabilities & Shareholder's Equity 14,139,491,941 15,477,399,087 15,406,729,857 15,374,431,097 15,872,579,999 15,458,507,755
37
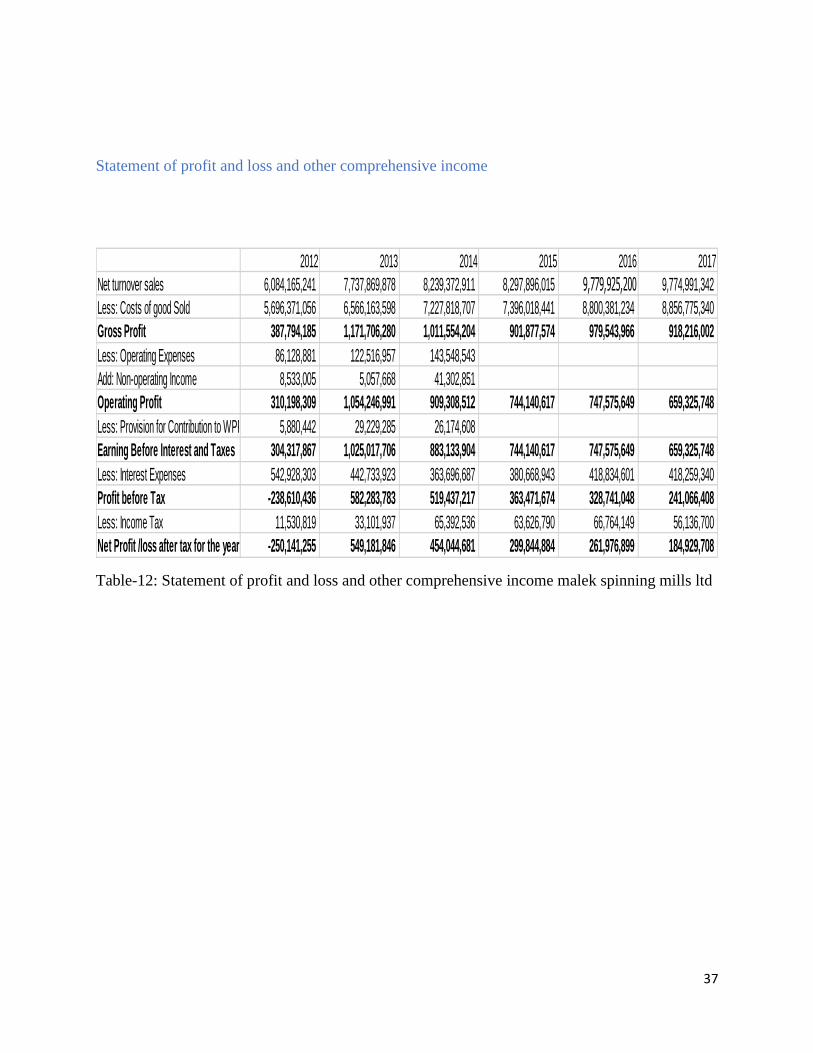
Statement of profit and loss and other comprehensive income
Table-12: Statement of profit and loss and other comprehensive income malek spinning mills ltd
2012 2013 2014 2015 2016 2017
Net turnover sales 6,084,165,241 7,737,869,878 8,239,372,911 8,297,896,015 9,779,925,200 9,774,991,342
Less: Costs of good Sold 5,696,371,056 6,566,163,598 7,227,818,707 7,396,018,441 8,800,381,234 8,856,775,340
Gross Profit 387,794,185 1,171,706,280 1,011,554,204 901,877,574 979,543,966 918,216,002
Less: Operating Expenses 86,128,881 122,516,957 143,548,543
Add: Non-operating Income 8,533,005 5,057,668 41,302,851
Operating Profit 310,198,309 1,054,246,991 909,308,512 744,140,617 747,575,649 659,325,748
Less: Provision for Contribution to WPPF 5,880,442 29,229,285 26,174,608
Earning Before Interest and Taxes 304,317,867 1,025,017,706 883,133,904 744,140,617 747,575,649 659,325,748
Less: Interest Expenses 542,928,303 442,733,923 363,696,687 380,668,943 418,834,601 418,259,340
Profit before Tax -238,610,436 582,283,783 519,437,217 363,471,674 328,741,048 241,066,408
Less: Income Tax 11,530,819 33,101,937 65,392,536 63,626,790 66,764,149 56,136,700
Net Profit /loss after tax for the year -250,141,255 549,181,846 454,044,681 299,844,884 261,976,899 184,929,708
38
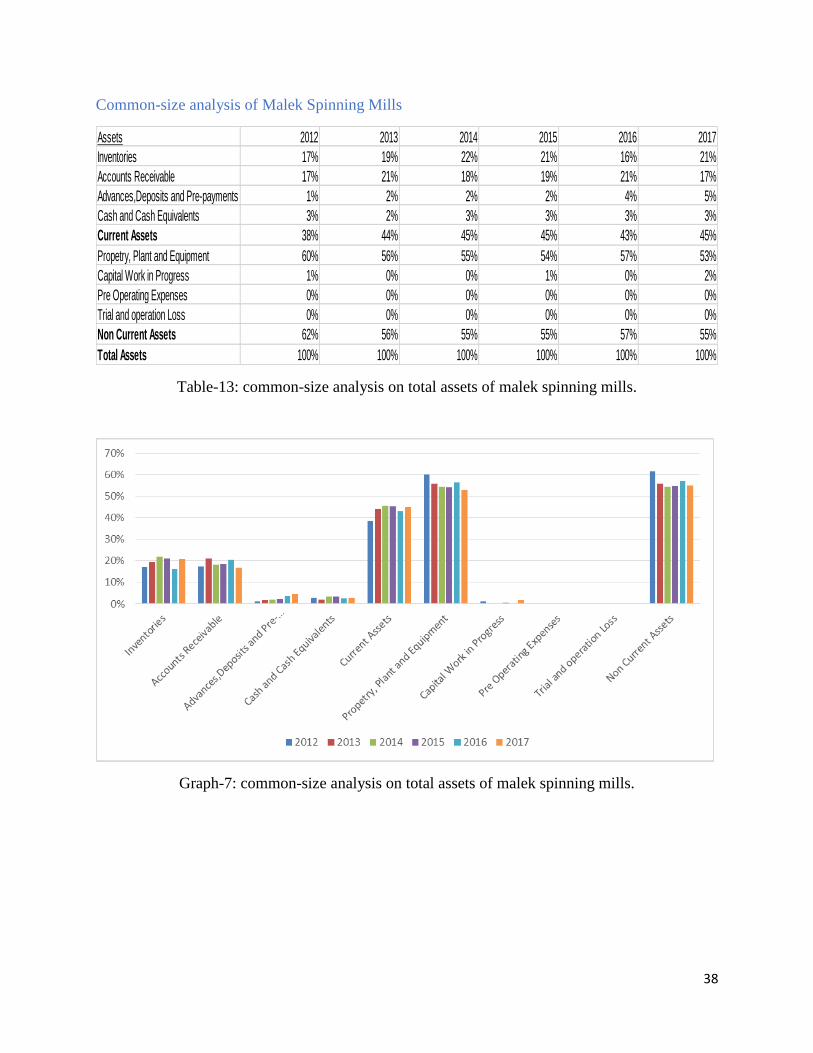
Common-size analysis of Malek Spinning Mills
Table-13: common-size analysis on total assets of malek spinning mills.
Graph-7: common-size analysis on total assets of malek spinning mills.
Assets 2012 2013 2014 2015 2016 2017
Inventories 17% 19% 22% 21% 16% 21%
Accounts Receivable 17% 21% 18% 19% 21% 17%
Advances,Deposits and Pre-payments 1% 2% 2% 2% 4% 5%
Cash and Cash Equivalents 3% 2% 3% 3% 3% 3%
Current Assets 38% 44% 45% 45% 43% 45%
Propetry, Plant and Equipment 60% 56% 55% 54% 57% 53%
Capital Work in Progress 1% 0% 0% 1% 0% 2%
Pre Operating Expenses 0% 0% 0% 0% 0% 0%
Trial and operation Loss 0% 0% 0% 0% 0% 0%
Non Current Assets 62% 56% 55% 55% 57% 55%
Total Assets 100% 100% 100% 100% 100% 100%
39
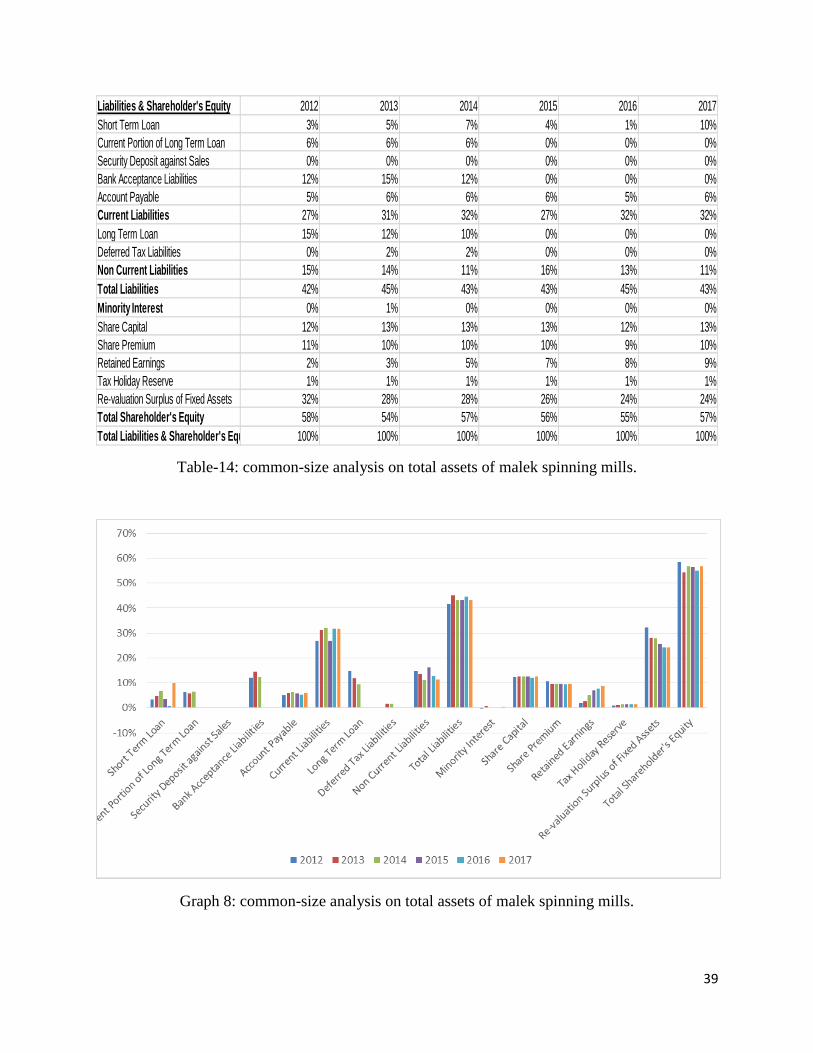
Table-14: common-size analysis on total assets of malek spinning mills.
Graph 8: common-size analysis on total assets of malek spinning mills.
Liabilities & Shareholder's Equity 2012 2013 2014 2015 2016 2017
Short Term Loan 3% 5% 7% 4% 1% 10%
Current Portion of Long Term Loan 6% 6% 6% 0% 0% 0%
Security Deposit against Sales 0% 0% 0% 0% 0% 0%
Bank Acceptance Liabilities 12% 15% 12% 0% 0% 0%
Account Payable 5% 6% 6% 6% 5% 6%
Current Liabilities 27% 31% 32% 27% 32% 32%
Long Term Loan 15% 12% 10% 0% 0% 0%
Deferred Tax Liabilities 0% 2% 2% 0% 0% 0%
Non Current Liabilities 15% 14% 11% 16% 13% 11%
Total Liabilities 42% 45% 43% 43% 45% 43%
Minority Interest 0% 1% 0% 0% 0% 0%
Share Capital 12% 13% 13% 13% 12% 13%
Share Premium 11% 10% 10% 10% 9% 10%
Retained Earnings 2% 3% 5% 7% 8% 9%
Tax Holiday Reserve 1% 1% 1% 1% 1% 1%
Re-valuation Surplus of Fixed Assets 32% 28% 28% 26% 24% 24%
Total Shareholder's Equity 58% 54% 57% 56% 55% 57%
Total Liabilities & Shareholder's Equity 100% 100% 100% 100% 100% 100%
40
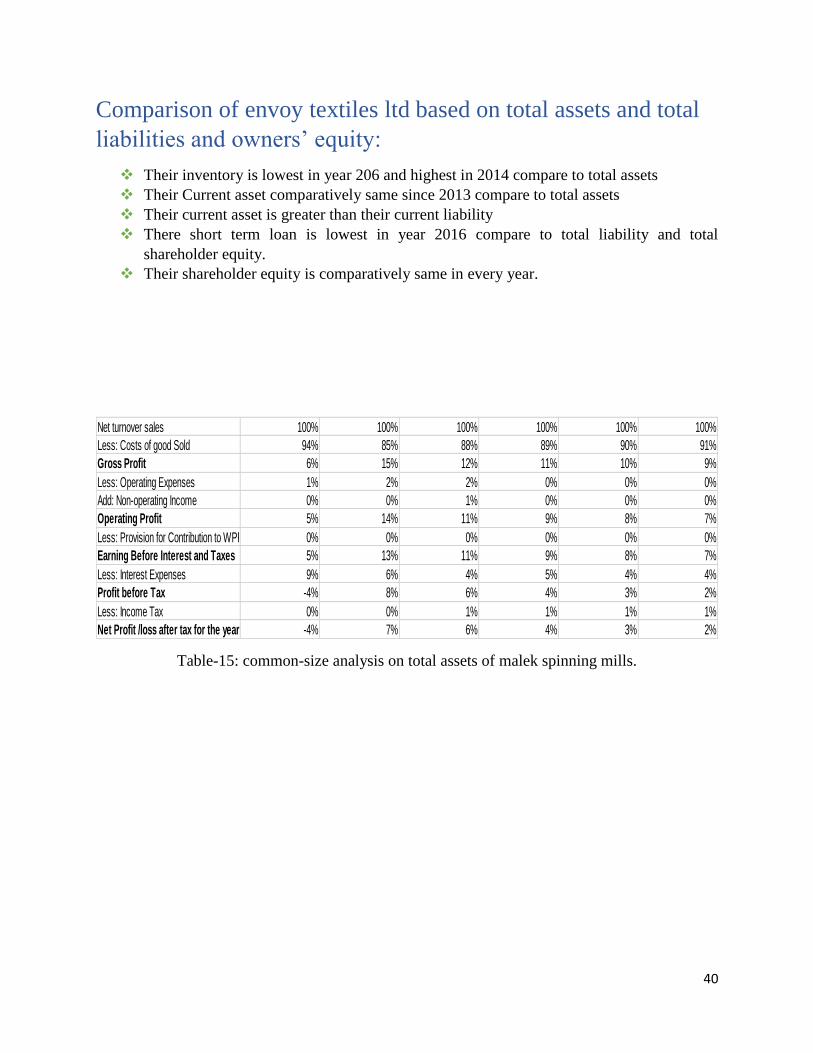
Comparison of envoy textiles ltd based on total assets and total
liabilities and owners’ equity:
Their inventory is lowest in year 206 and highest in 2014 compare to total assets
Their Current asset comparatively same since 2013 compare to total assets
Their current asset is greater than their current liability
There short term loan is lowest in year 2016 compare to total liability and total
shareholder equity.
Their shareholder equity is comparatively same in every year.
Table-15: common-size analysis on total assets of malek spinning mills.
Net turnover sales 100% 100% 100% 100% 100% 100%
Less: Costs of good Sold 94% 85% 88% 89% 90% 91%
Gross Profit 6% 15% 12% 11% 10% 9%
Less: Operating Expenses 1% 2% 2% 0% 0% 0%
Add: Non-operating Income 0% 0% 1% 0% 0% 0%
Operating Profit 5% 14% 11% 9% 8% 7%
Less: Provision for Contribution to WPPF 0% 0% 0% 0% 0% 0%
Earning Before Interest and Taxes 5% 13% 11% 9% 8% 7%
Less: Interest Expenses 9% 6% 4% 5% 4% 4%
Profit before Tax -4% 8% 6% 4% 3% 2%
Less: Income Tax 0% 0% 1% 1% 1% 1%
Net Profit /loss after tax for the year -4% 7% 6% 4% 3% 2%
41
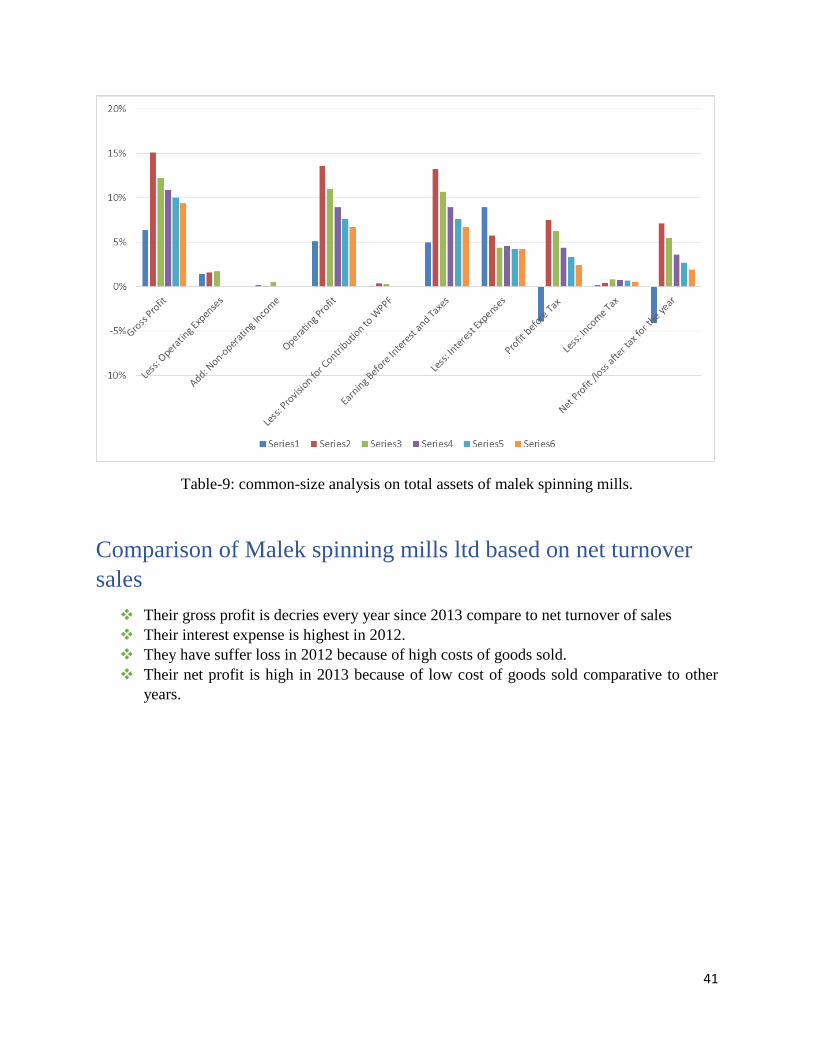
Table-9: common-size analysis on total assets of malek spinning mills.
Comparison of Malek spinning mills ltd based on net turnover
sales
Their gross profit is decries every year since 2013 compare to net turnover of sales
Their interest expense is highest in 2012.
They have suffer loss in 2012 because of high costs of goods sold.
Their net profit is high in 2013 because of low cost of goods sold comparative to other
years.
42
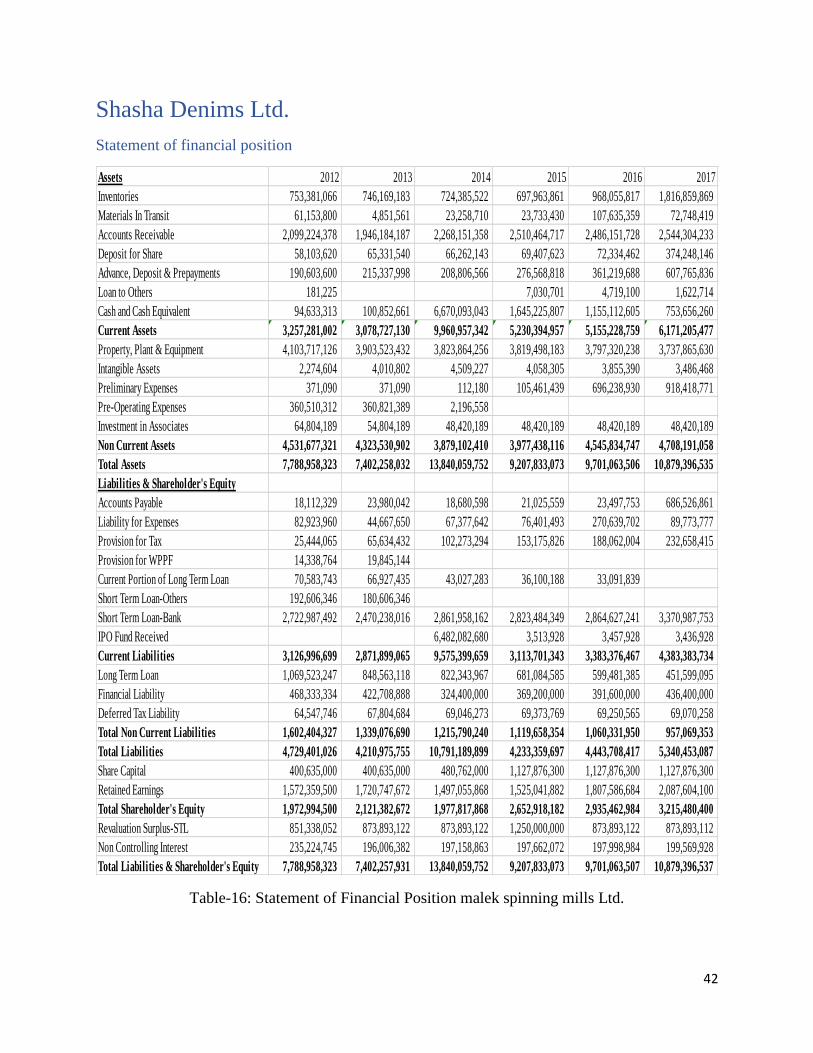
Shasha Denims Ltd.
Statement of financial position
Table-16: Statement of Financial Position malek spinning mills Ltd.
Assets 2012 2013 2014 2015 2016 2017
Inventories 753,381,066 746,169,183 724,385,522 697,963,861 968,055,817 1,816,859,869
Materials In Transit 61,153,800 4,851,561 23,258,710 23,733,430 107,635,359 72,748,419
Accounts Receivable 2,099,224,378 1,946,184,187 2,268,151,358 2,510,464,717 2,486,151,728 2,544,304,233
Deposit for Share 58,103,620 65,331,540 66,262,143 69,407,623 72,334,462 374,248,146
Advance, Deposit & Prepayments 190,603,600 215,337,998 208,806,566 276,568,818 361,219,688 607,765,836
Loan to Others 181,225 7,030,701 4,719,100 1,622,714
Cash and Cash Equivalent 94,633,313 100,852,661 6,670,093,043 1,645,225,807 1,155,112,605 753,656,260
Current Assets 3,257,281,002 3,078,727,130 9,960,957,342 5,230,394,957 5,155,228,759 6,171,205,477
Property, Plant & Equipment 4,103,717,126 3,903,523,432 3,823,864,256 3,819,498,183 3,797,320,238 3,737,865,630
Intangible Assets 2,274,604 4,010,802 4,509,227 4,058,305 3,855,390 3,486,468
Preliminary Expenses 371,090 371,090 112,180 105,461,439 696,238,930 918,418,771
Pre-Operating Expenses 360,510,312 360,821,389 2,196,558
Investment in Associates 64,804,189 54,804,189 48,420,189 48,420,189 48,420,189 48,420,189
Non Current Assets 4,531,677,321 4,323,530,902 3,879,102,410 3,977,438,116 4,545,834,747 4,708,191,058
Total Assets 7,788,958,323 7,402,258,032 13,840,059,752 9,207,833,073 9,701,063,506 10,879,396,535
Liabilities & Shareholder's Equity
Accounts Payable 18,112,329 23,980,042 18,680,598 21,025,559 23,497,753 686,526,861
Liability for Expenses 82,923,960 44,667,650 67,377,642 76,401,493 270,639,702 89,773,777
Provision for Tax 25,444,065 65,634,432 102,273,294 153,175,826 188,062,004 232,658,415
Provision for WPPF 14,338,764 19,845,144
Current Portion of Long Term Loan 70,583,743 66,927,435 43,027,283 36,100,188 33,091,839
Short Term Loan-Others 192,606,346 180,606,346
Short Term Loan-Bank 2,722,987,492 2,470,238,016 2,861,958,162 2,823,484,349 2,864,627,241 3,370,987,753
IPO Fund Received 6,482,082,680 3,513,928 3,457,928 3,436,928
Current Liabilities 3,126,996,699 2,871,899,065 9,575,399,659 3,113,701,343 3,383,376,467 4,383,383,734
Long Term Loan 1,069,523,247 848,563,118 822,343,967 681,084,585 599,481,385 451,599,095
Financial Liability 468,333,334 422,708,888 324,400,000 369,200,000 391,600,000 436,400,000
Deferred Tax Liability 64,547,746 67,804,684 69,046,273 69,373,769 69,250,565 69,070,258
Total Non Current Liabilities 1,602,404,327 1,339,076,690 1,215,790,240 1,119,658,354 1,060,331,950 957,069,353
Total Liabilities 4,729,401,026 4,210,975,755 10,791,189,899 4,233,359,697 4,443,708,417 5,340,453,087
Share Capital 400,635,000 400,635,000 480,762,000 1,127,876,300 1,127,876,300 1,127,876,300
Retained Earnings 1,572,359,500 1,720,747,672 1,497,055,868 1,525,041,882 1,807,586,684 2,087,604,100
Total Shareholder's Equity 1,972,994,500 2,121,382,672 1,977,817,868 2,652,918,182 2,935,462,984 3,215,480,400
Revaluation Surplus-STL 851,338,052 873,893,122 873,893,122 1,250,000,000 873,893,122 873,893,112
Non Controlling Interest 235,224,745 196,006,382 197,158,863 197,662,072 197,998,984 199,569,928
Total Liabilities & Shareholder's Equity 7,788,958,323 7,402,257,931 13,840,059,752 9,207,833,073 9,701,063,507 10,879,396,537
43
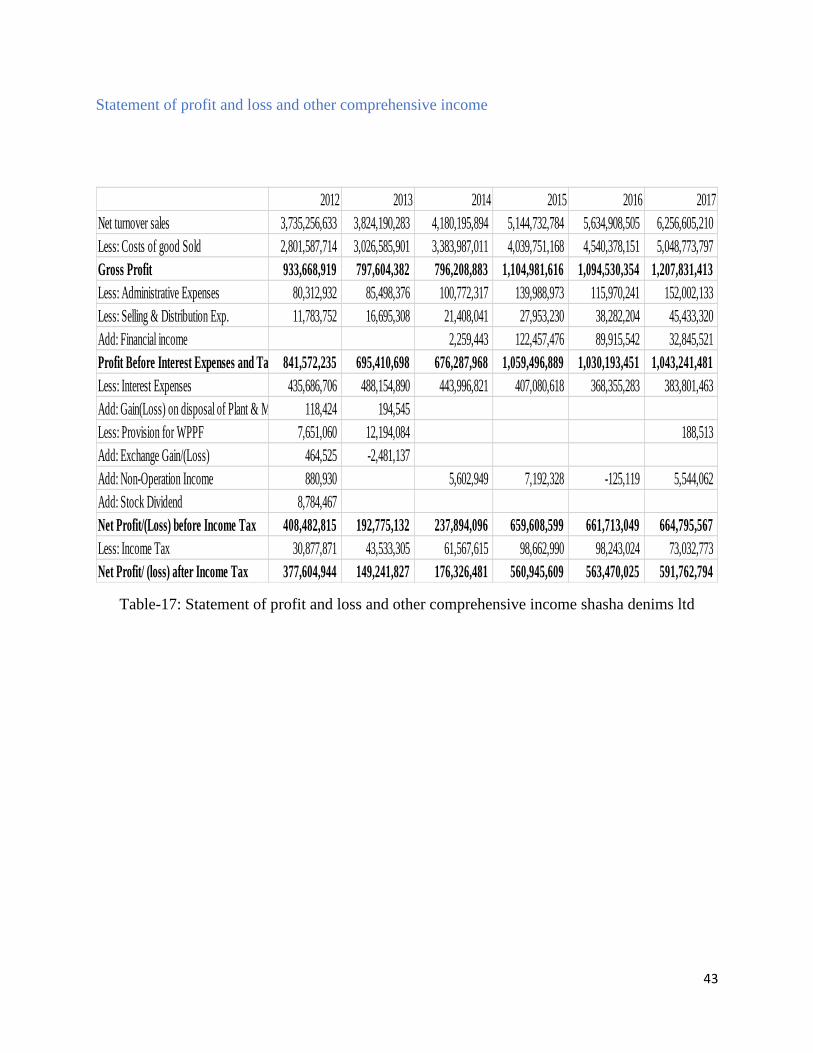
Statement of profit and loss and other comprehensive income
Table-17: Statement of profit and loss and other comprehensive income shasha denims ltd
2012 2013 2014 2015 2016 2017
Net turnover sales 3,735,256,633 3,824,190,283 4,180,195,894 5,144,732,784 5,634,908,505 6,256,605,210
Less: Costs of good Sold 2,801,587,714 3,026,585,901 3,383,987,011 4,039,751,168 4,540,378,151 5,048,773,797
Gross Profit 933,668,919 797,604,382 796,208,883 1,104,981,616 1,094,530,354 1,207,831,413
Less: Administrative Expenses 80,312,932 85,498,376 100,772,317 139,988,973 115,970,241 152,002,133
Less: Selling & Distribution Exp. 11,783,752 16,695,308 21,408,041 27,953,230 38,282,204 45,433,320
Add: Financial income 2,259,443 122,457,476 89,915,542 32,845,521
Profit Before Interest Expenses and Tax 841,572,235 695,410,698 676,287,968 1,059,496,889 1,030,193,451 1,043,241,481
Less: Interest Expenses 435,686,706 488,154,890 443,996,821 407,080,618 368,355,283 383,801,463
Add: Gain(Loss) on disposal of Plant & Machinery 118,424 194,545
Less: Provision for WPPF 7,651,060 12,194,084 188,513
Add: Exchange Gain/(Loss) 464,525 -2,481,137
Add: Non-Operation Income 880,930 5,602,949 7,192,328 -125,119 5,544,062
Add: Stock Dividend 8,784,467
Net Profit/(Loss) before Income Tax 408,482,815 192,775,132 237,894,096 659,608,599 661,713,049 664,795,567
Less: Income Tax 30,877,871 43,533,305 61,567,615 98,662,990 98,243,024 73,032,773
Net Profit/ (loss) after Income Tax 377,604,944 149,241,827 176,326,481 560,945,609 563,470,025 591,762,794
44
Common-Size analysis of Shasha Denims Ltd.
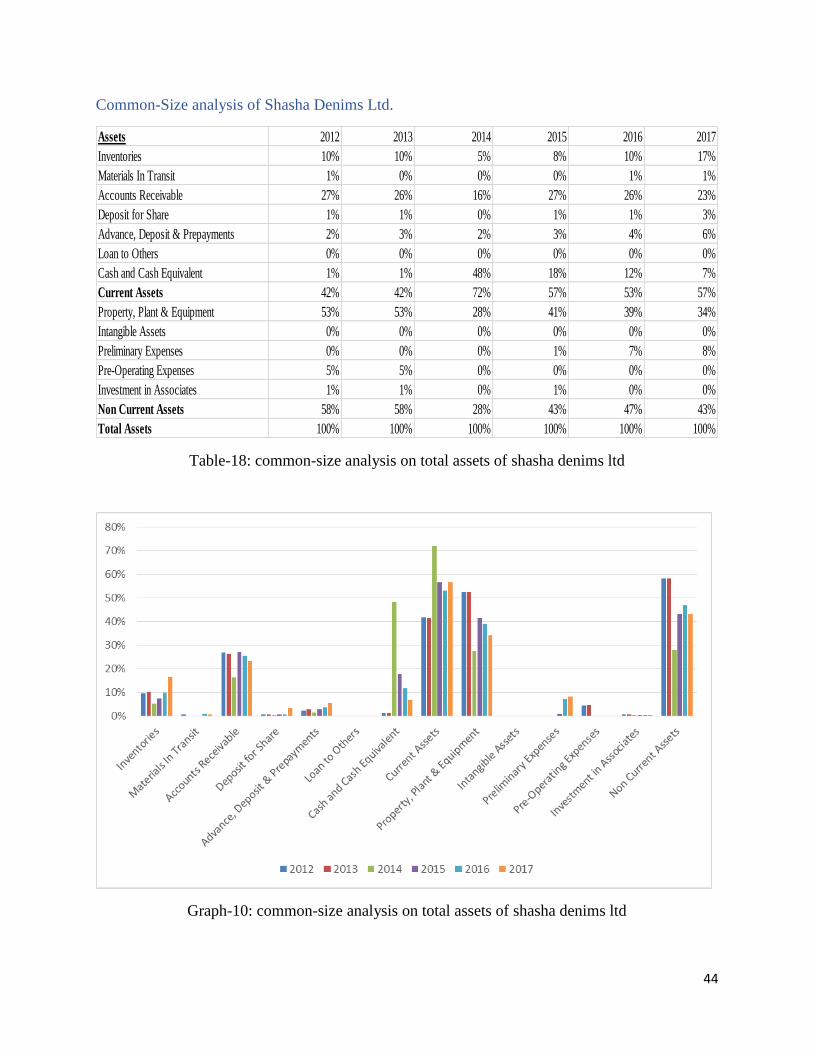
Table-18: common-size analysis on total assets of shasha denims ltd
Graph-10: common-size analysis on total assets of shasha denims ltd
Assets 2012 2013 2014 2015 2016 2017
Inventories 10% 10% 5% 8% 10% 17%
Materials In Transit 1% 0% 0% 0% 1% 1%
Accounts Receivable 27% 26% 16% 27% 26% 23%
Deposit for Share 1% 1% 0% 1% 1% 3%
Advance, Deposit & Prepayments 2% 3% 2% 3% 4% 6%
Loan to Others 0% 0% 0% 0% 0% 0%
Cash and Cash Equivalent 1% 1% 48% 18% 12% 7%
Current Assets 42% 42% 72% 57% 53% 57%
Property, Plant & Equipment 53% 53% 28% 41% 39% 34%
Intangible Assets 0% 0% 0% 0% 0% 0%
Preliminary Expenses 0% 0% 0% 1% 7% 8%
Pre-Operating Expenses 5% 5% 0% 0% 0% 0%
Investment in Associates 1% 1% 0% 1% 0% 0%
Non Current Assets 58% 58% 28% 43% 47% 43%
Total Assets 100% 100% 100% 100% 100% 100%
45
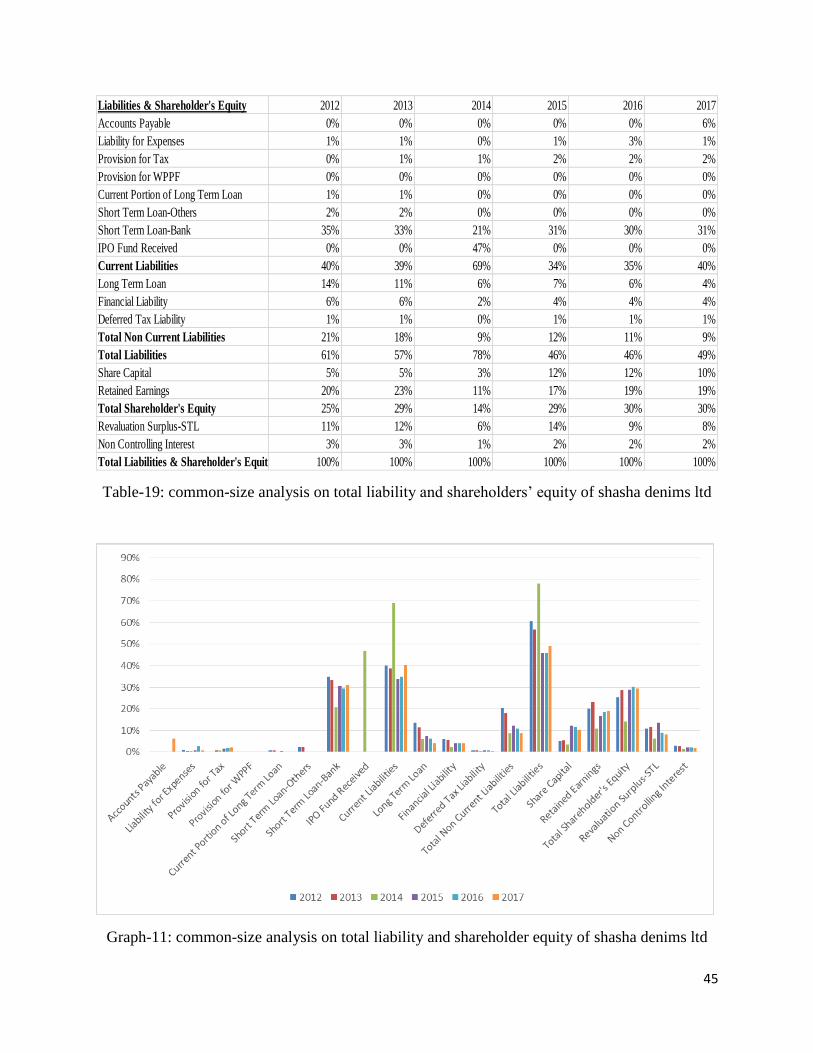
Table-19: common-size analysis on total liability and shareholders’ equity of shasha denims ltd
Graph-11: common-size analysis on total liability and shareholder equity of shasha denims ltd
Liabilities & Shareholder's Equity 2012 2013 2014 2015 2016 2017
Accounts Payable 0% 0% 0% 0% 0% 6%
Liability for Expenses 1% 1% 0% 1% 3% 1%
Provision for Tax 0% 1% 1% 2% 2% 2%
Provision for WPPF 0% 0% 0% 0% 0% 0%
Current Portion of Long Term Loan 1% 1% 0% 0% 0% 0%
Short Term Loan-Others 2% 2% 0% 0% 0% 0%
Short Term Loan-Bank 35% 33% 21% 31% 30% 31%
IPO Fund Received 0% 0% 47% 0% 0% 0%
Current Liabilities 40% 39% 69% 34% 35% 40%
Long Term Loan 14% 11% 6% 7% 6% 4%
Financial Liability 6% 6% 2% 4% 4% 4%
Deferred Tax Liability 1% 1% 0% 1% 1% 1%
Total Non Current Liabilities 21% 18% 9% 12% 11% 9%
Total Liabilities 61% 57% 78% 46% 46% 49%
Share Capital 5% 5% 3% 12% 12% 10%
Retained Earnings 20% 23% 11% 17% 19% 19%
Total Shareholder's Equity 25% 29% 14% 29% 30% 30%
Revaluation Surplus-STL 11% 12% 6% 14% 9% 8%
Non Controlling Interest 3% 3% 1% 2% 2% 2%
Total Liabilities & Shareholder's Equity 100% 100% 100% 100% 100% 100%
46
Comparison of Shasha denims ltd based on total assets and total
liabilities and owners’ equity:
First their inventory is highest in year 2017 (17% of total assets) and lowest in year 2014
(5% of total assets)
Their current assets is highest in year 2014 (72% of total assets) and lowest in year
2012and 2013 (42% of total assets)
There current assets is positive in every year because their current asset is greater than
current liability in every year.
Their long term liability is decreasing in every year compare to total liability and
shareholder equity
Their shareholder equity is same since 2013 except 2014.
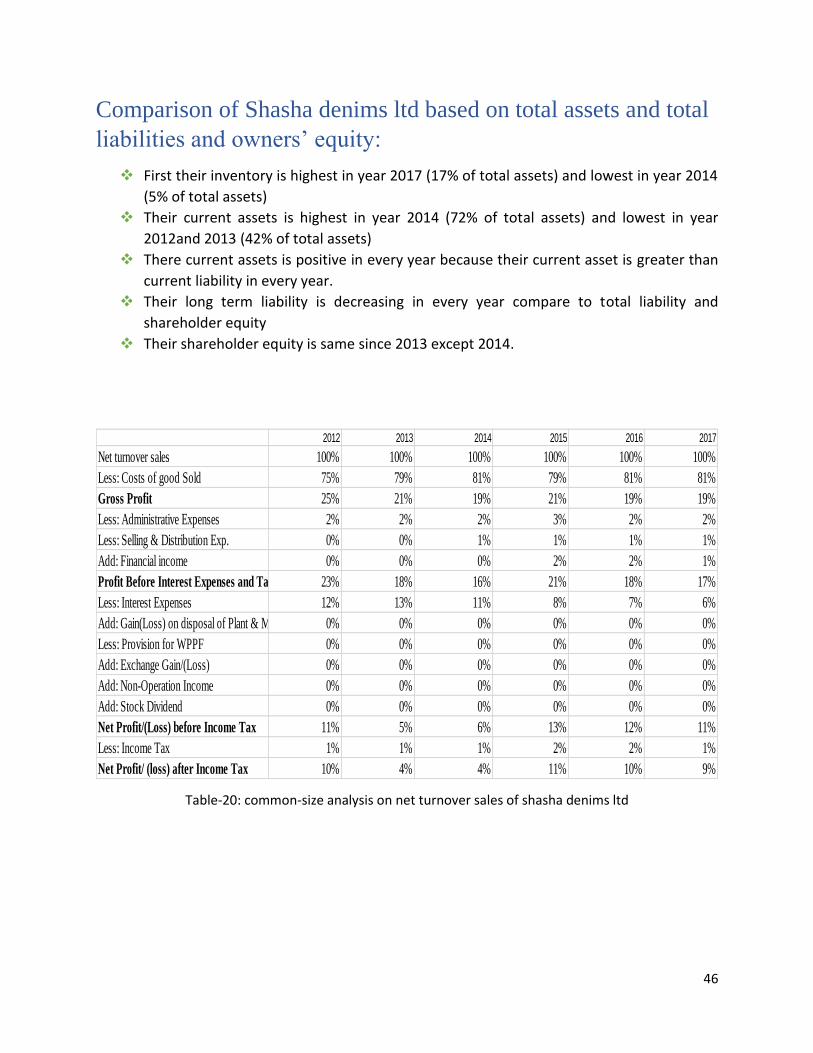
Table-20: common-size analysis on net turnover sales of shasha denims ltd
2012 2013 2014 2015 2016 2017
Net turnover sales 100% 100% 100% 100% 100% 100%
Less: Costs of good Sold 75% 79% 81% 79% 81% 81%
Gross Profit 25% 21% 19% 21% 19% 19%
Less: Administrative Expenses 2% 2% 2% 3% 2% 2%
Less: Selling & Distribution Exp. 0% 0% 1% 1% 1% 1%
Add: Financial income 0% 0% 0% 2% 2% 1%
Profit Before Interest Expenses and Tax 23% 18% 16% 21% 18% 17%
Less: Interest Expenses 12% 13% 11% 8% 7% 6%
Add: Gain(Loss) on disposal of Plant & Machinery 0% 0% 0% 0% 0% 0%
Less: Provision for WPPF 0% 0% 0% 0% 0% 0%
Add: Exchange Gain/(Loss) 0% 0% 0% 0% 0% 0%
Add: Non-Operation Income 0% 0% 0% 0% 0% 0%
Add: Stock Dividend 0% 0% 0% 0% 0% 0%
Net Profit/(Loss) before Income Tax 11% 5% 6% 13% 12% 11%
Less: Income Tax 1% 1% 1% 2% 2% 1%
Net Profit/ (loss) after Income Tax 10% 4% 4% 11% 10% 9%
47
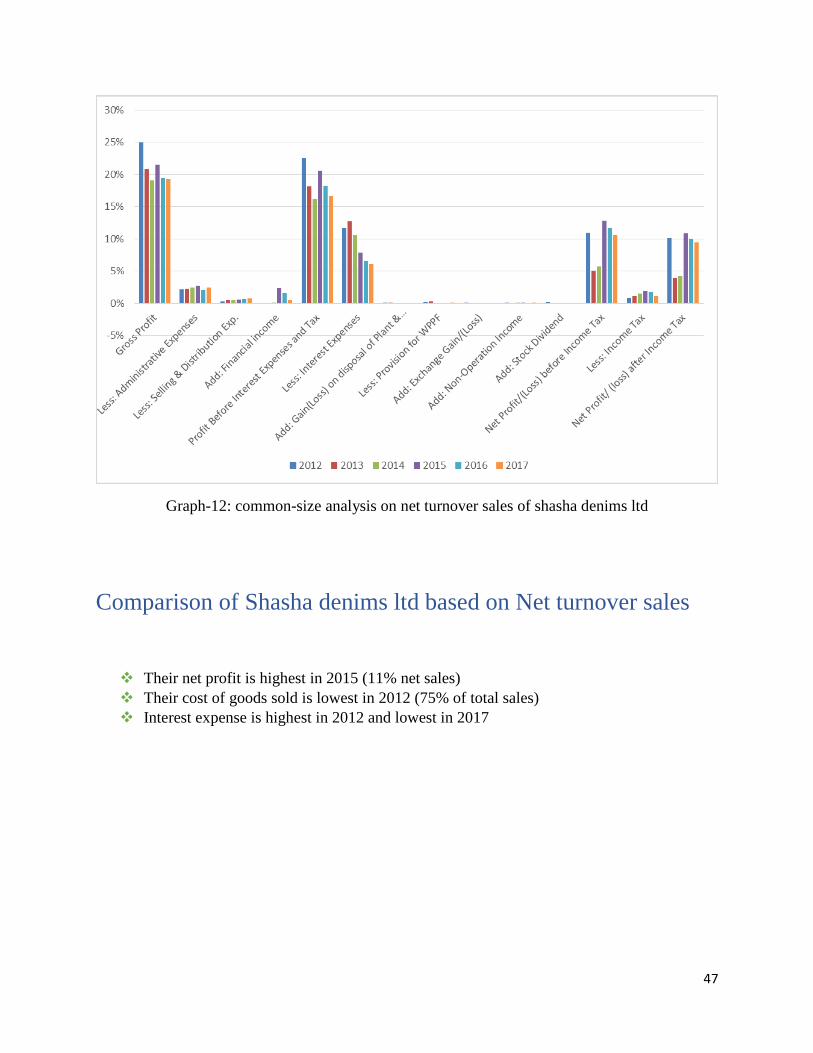
Graph-12: common-size analysis on net turnover sales of shasha denims ltd
Comparison of Shasha denims ltd based on Net turnover sales
Their net profit is highest in 2015 (11% net sales)
Their cost of goods sold is lowest in 2012 (75% of total sales)
Interest expense is highest in 2012 and lowest in 2017
48
Chapter – 7
Performance Analysis of Selected Textiles
Companies of Bangladesh
49
Performance Analysis of Selected Textiles
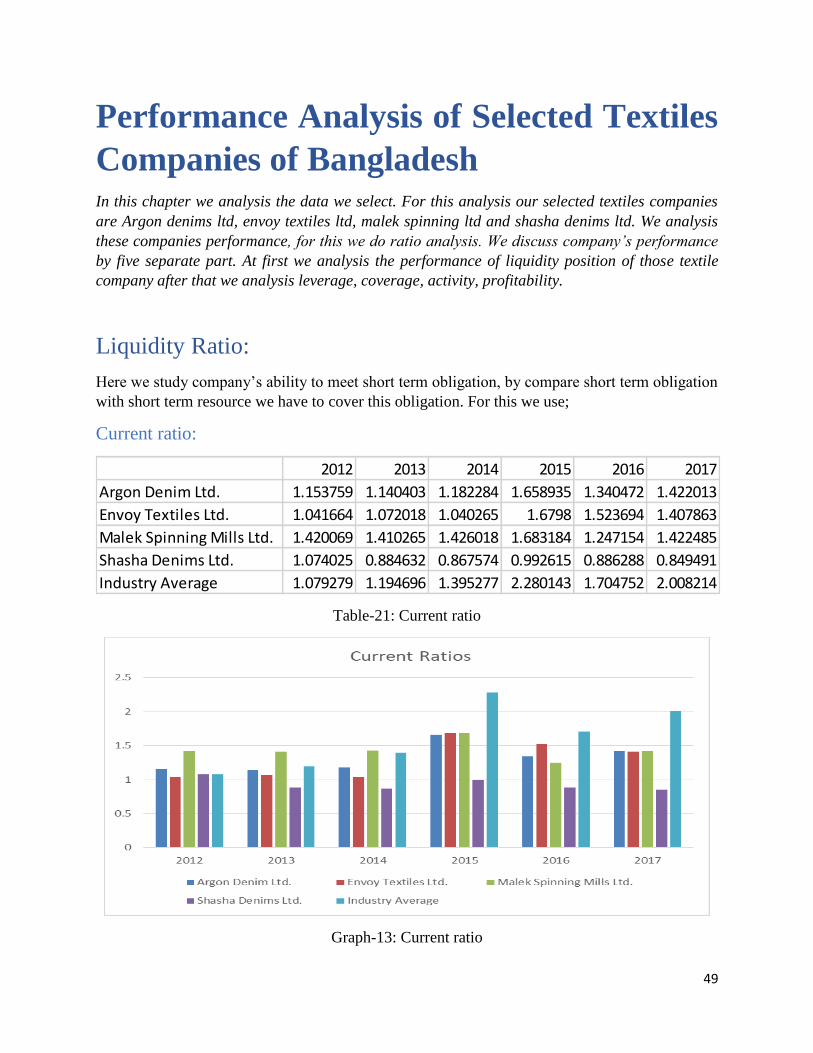
Companies of Bangladesh In this chapter we analysis the data we select. For this analysis our selected textiles companies
are Argon denims ltd, envoy textiles ltd, malek spinning ltd and shasha denims ltd. We analysis
these companies performance, for this we do ratio analysis. We discuss company’s performance
by five separate part. At first we analysis the performance of liquidity position of those textile
company after that we analysis leverage, coverage, activity, profitability.
Liquidity Ratio:
Here we study company’s ability to meet short term obligation, by compare short term obligation
with short term resource we have to cover this obligation. For this we use;
Current ratio:
Table-21: Current ratio
Graph-13: Current ratio
2012 2013 2014 2015 2016 2017
Argon Denim Ltd. 1.153759 1.140403 1.182284 1.658935 1.340472 1.422013
Envoy Textiles Ltd. 1.041664 1.072018 1.040265 1.6798 1.523694 1.407863
Malek Spinning Mills Ltd. 1.420069 1.410265 1.426018 1.683184 1.247154 1.422485
Shasha Denims Ltd. 1.074025 0.884632 0.867574 0.992615 0.886288 0.849491
Industry Average 1.079279 1.194696 1.395277 2.280143 1.704752 2.008214
50
One of the most used liquidity ratio is current ratio. Current ratio means how much current asset
company have, to pay the current liability. For example, Here Argon Denim Ltd. 2012 indicates
that for every tk of Liability Company have 1.5 tk assets. And if the ratio is higher than 1 it
shows the positive sign to the company or assets is higher than liability. Here we see argon ltd
has stable current ratio throughout the financial year. Envoy textiles have better scenario after
2014. Makek spinning mills ltd also have stable current ratio but it have strongest position
among them. And shasha denims ltd is lowest position among the company.
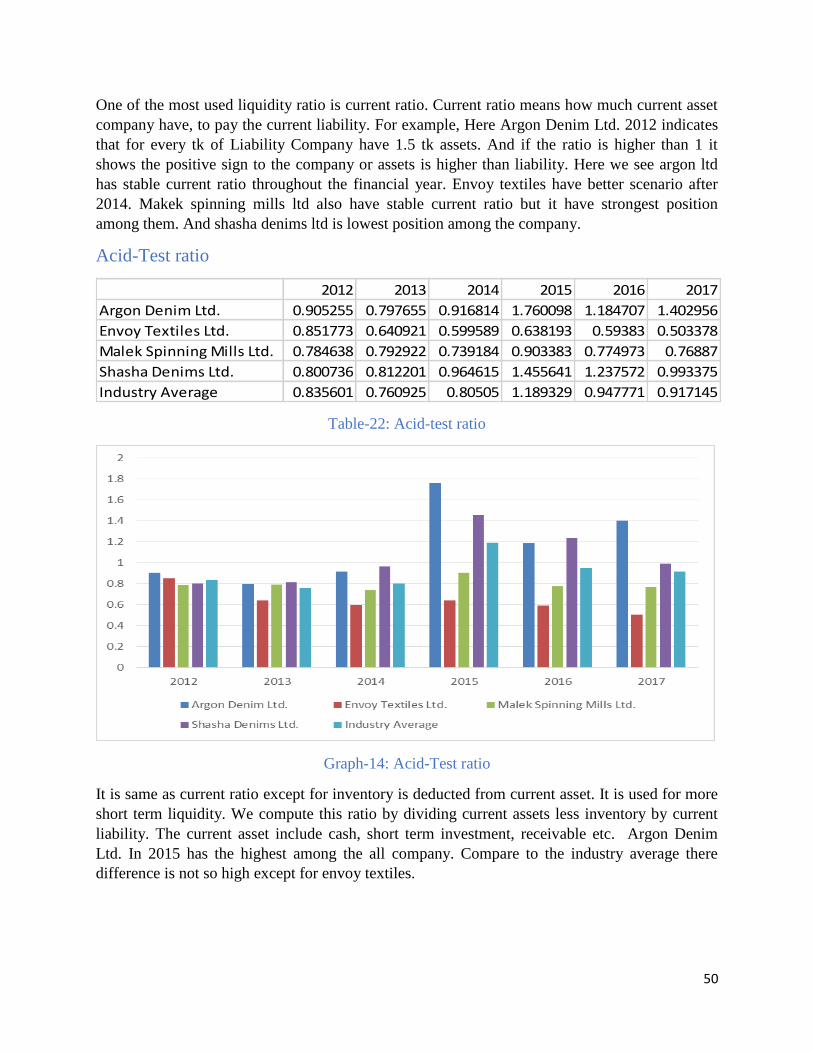
Acid-Test ratio
Table-22: Acid-test ratio
Graph-14: Acid-Test ratio
It is same as current ratio except for inventory is deducted from current asset. It is used for more
short term liquidity. We compute this ratio by dividing current assets less inventory by current
liability. The current asset include cash, short term investment, receivable etc. Argon Denim
Ltd. In 2015 has the highest among the all company. Compare to the industry average there
difference is not so high except for envoy textiles.
2012 2013 2014 2015 2016 2017
Argon Denim Ltd. 0.905255 0.797655 0.916814 1.760098 1.184707 1.402956
Envoy Textiles Ltd. 0.851773 0.640921 0.599589 0.638193 0.59383 0.503378
Malek Spinning Mills Ltd. 0.784638 0.792922 0.739184 0.903383 0.774973 0.76887
Shasha Denims Ltd. 0.800736 0.812201 0.964615 1.455641 1.237572 0.993375
Industry Average 0.835601 0.760925 0.80505 1.189329 0.947771 0.917145
51
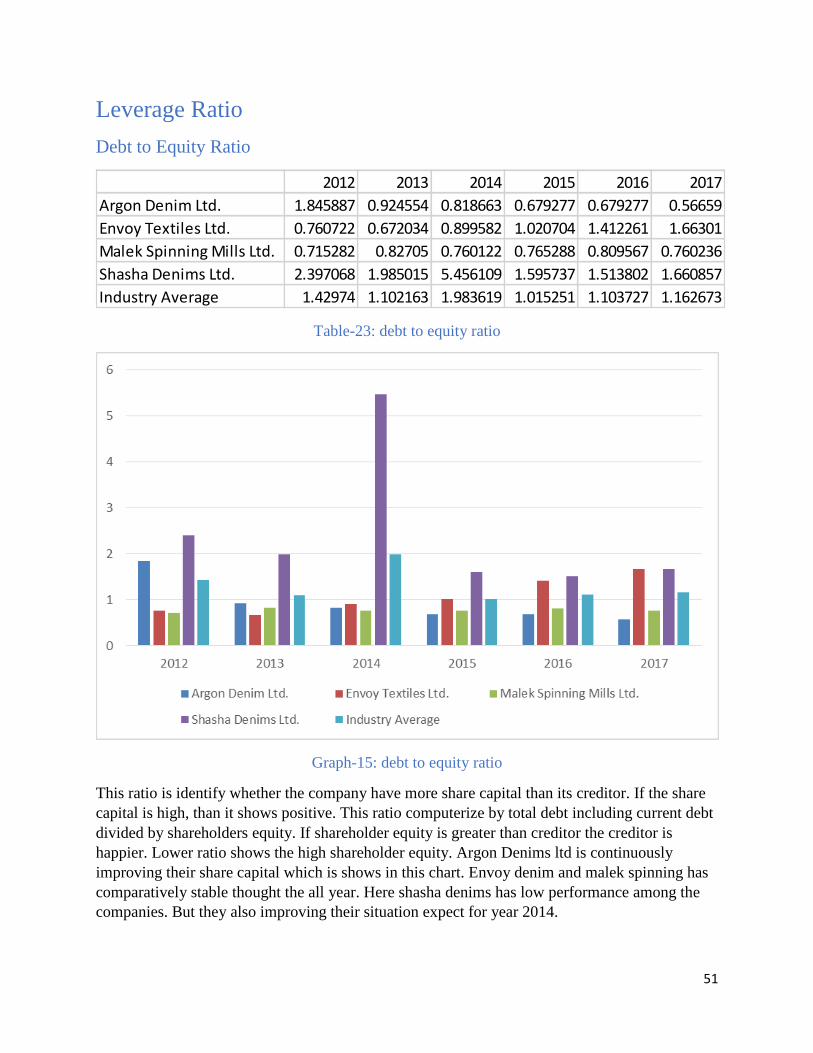
Leverage Ratio
Debt to Equity Ratio
Table-23: debt to equity ratio
Graph-15: debt to equity ratio
This ratio is identify whether the company have more share capital than its creditor. If the share
capital is high, than it shows positive. This ratio computerize by total debt including current debt
divided by shareholders equity. If shareholder equity is greater than creditor the creditor is
happier. Lower ratio shows the high shareholder equity. Argon Denims ltd is continuously
improving their share capital which is shows in this chart. Envoy denim and malek spinning has
comparatively stable thought the all year. Here shasha denims has low performance among the
companies. But they also improving their situation expect for year 2014.
2012 2013 2014 2015 2016 2017
Argon Denim Ltd. 1.845887 0.924554 0.818663 0.679277 0.679277 0.56659
Envoy Textiles Ltd. 0.760722 0.672034 0.899582 1.020704 1.412261 1.66301
Malek Spinning Mills Ltd. 0.715282 0.82705 0.760122 0.765288 0.809567 0.760236
Shasha Denims Ltd. 2.397068 1.985015 5.456109 1.595737 1.513802 1.660857
Industry Average 1.42974 1.102163 1.983619 1.015251 1.103727 1.162673
52
Debt to Total Assets Ratio
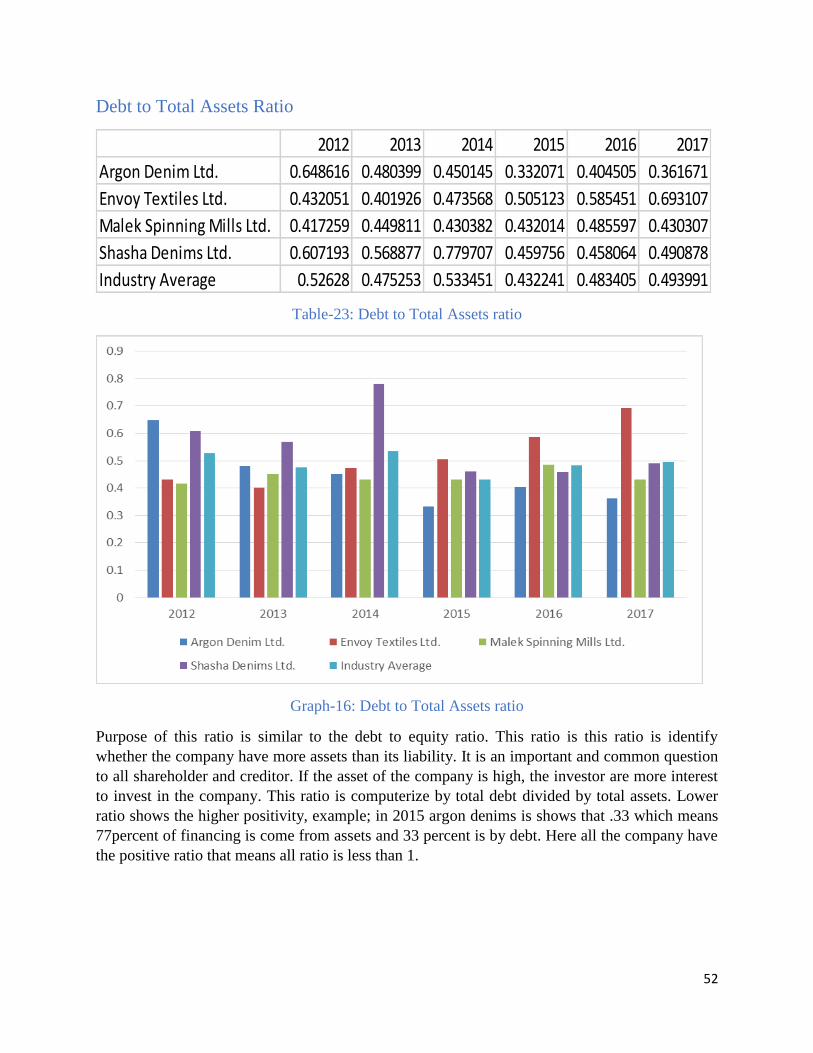
Table-23: Debt to Total Assets ratio
Graph-16: Debt to Total Assets ratio
Purpose of this ratio is similar to the debt to equity ratio. This ratio is this ratio is identify
whether the company have more assets than its liability. It is an important and common question
to all shareholder and creditor. If the asset of the company is high, the investor are more interest
to invest in the company. This ratio is computerize by total debt divided by total assets. Lower
ratio shows the higher positivity, example; in 2015 argon denims is shows that .33 which means
77percent of financing is come from assets and 33 percent is by debt. Here all the company have
the positive ratio that means all ratio is less than 1.
2012 2013 2014 2015 2016 2017
Argon Denim Ltd. 0.648616 0.480399 0.450145 0.332071 0.404505 0.361671
Envoy Textiles Ltd. 0.432051 0.401926 0.473568 0.505123 0.585451 0.693107
Malek Spinning Mills Ltd. 0.417259 0.449811 0.430382 0.432014 0.485597 0.430307
Shasha Denims Ltd. 0.607193 0.568877 0.779707 0.459756 0.458064 0.490878
Industry Average 0.52628 0.475253 0.533451 0.432241 0.483405 0.493991
53
Coverage Ratio
Interest Coverage ratio
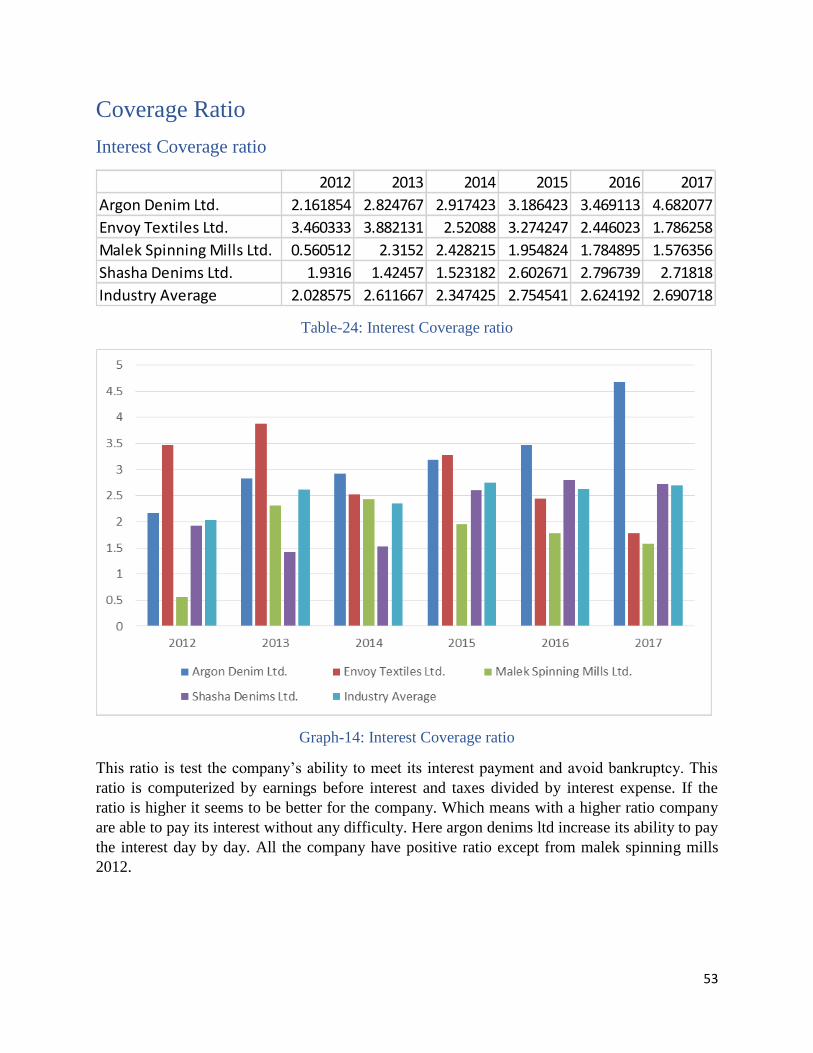
Table-24: Interest Coverage ratio
Graph-14: Interest Coverage ratio
This ratio is test the company’s ability to meet its interest payment and avoid bankruptcy. This
ratio is computerized by earnings before interest and taxes divided by interest expense. If the
ratio is higher it seems to be better for the company. Which means with a higher ratio company
are able to pay its interest without any difficulty. Here argon denims ltd increase its ability to pay
the interest day by day. All the company have positive ratio except from malek spinning mills
2012.
2012 2013 2014 2015 2016 2017
Argon Denim Ltd. 2.161854 2.824767 2.917423 3.186423 3.469113 4.682077
Envoy Textiles Ltd. 3.460333 3.882131 2.52088 3.274247 2.446023 1.786258
Malek Spinning Mills Ltd. 0.560512 2.3152 2.428215 1.954824 1.784895 1.576356
Shasha Denims Ltd. 1.9316 1.42457 1.523182 2.602671 2.796739 2.71818
Industry Average 2.028575 2.611667 2.347425 2.754541 2.624192 2.690718
54
Activity Ratio
Receivable Turnover Ratio
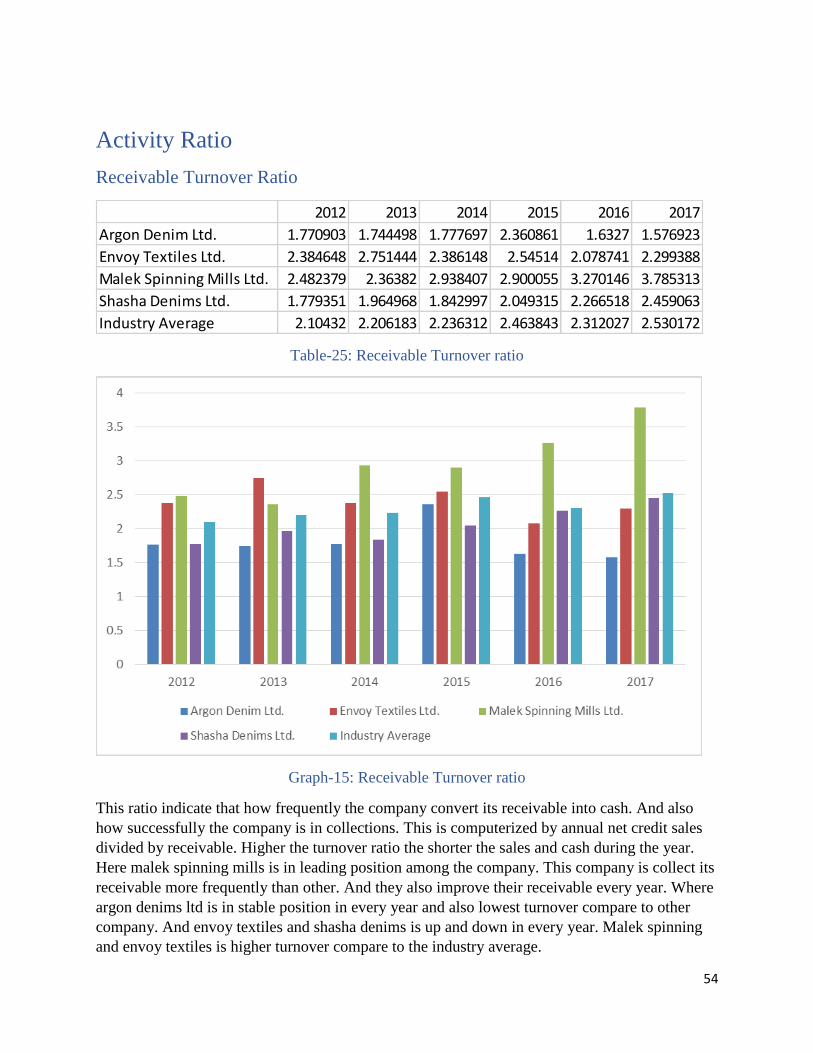
Table-25: Receivable Turnover ratio
Graph-15: Receivable Turnover ratio
This ratio indicate that how frequently the company convert its receivable into cash. And also
how successfully the company is in collections. This is computerized by annual net credit sales
divided by receivable. Higher the turnover ratio the shorter the sales and cash during the year.
Here malek spinning mills is in leading position among the company. This company is collect its
receivable more frequently than other. And they also improve their receivable every year. Where
argon denims ltd is in stable position in every year and also lowest turnover compare to other
company. And envoy textiles and shasha denims is up and down in every year. Malek spinning
and envoy textiles is higher turnover compare to the industry average.
2012 2013 2014 2015 2016 2017
Argon Denim Ltd. 1.770903 1.744498 1.777697 2.360861 1.6327 1.576923
Envoy Textiles Ltd. 2.384648 2.751444 2.386148 2.54514 2.078741 2.299388
Malek Spinning Mills Ltd. 2.482379 2.36382 2.938407 2.900055 3.270146 3.785313
Shasha Denims Ltd. 1.779351 1.964968 1.842997 2.049315 2.266518 2.459063
Industry Average 2.10432 2.206183 2.236312 2.463843 2.312027 2.530172
55
Receivable turnover in days
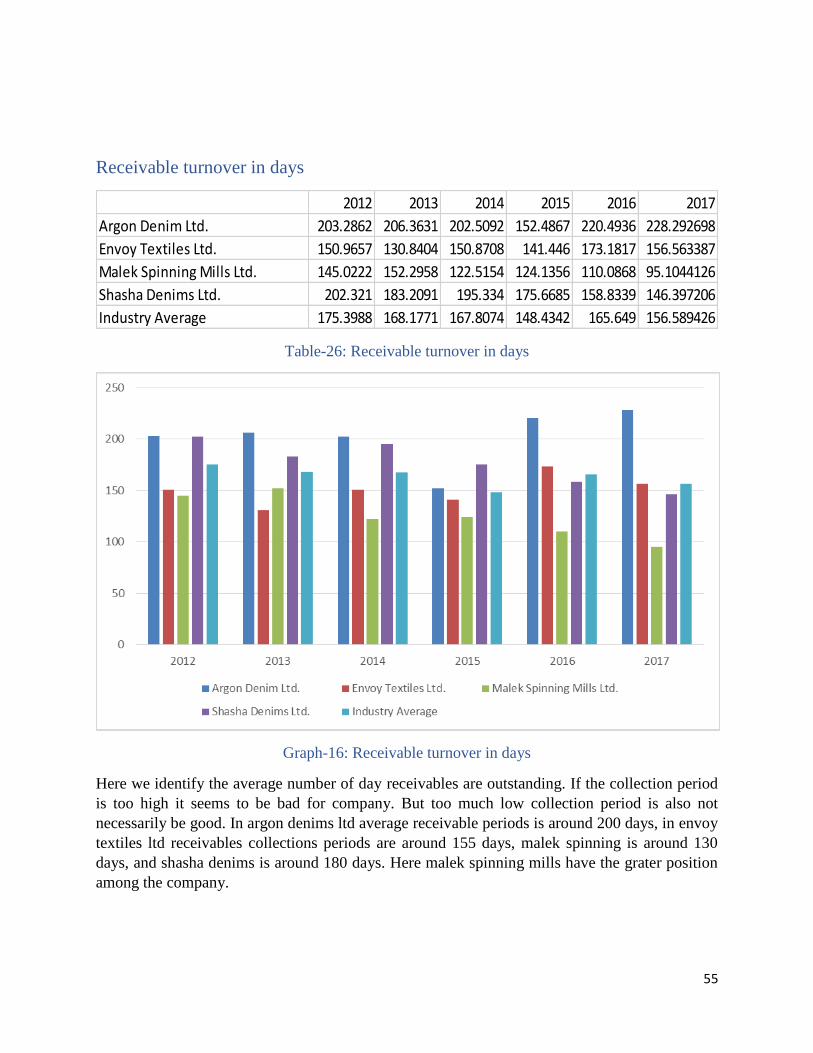
Table-26: Receivable turnover in days
Graph-16: Receivable turnover in days
Here we identify the average number of day receivables are outstanding. If the collection period
is too high it seems to be bad for company. But too much low collection period is also not
necessarily be good. In argon denims ltd average receivable periods is around 200 days, in envoy
textiles ltd receivables collections periods are around 155 days, malek spinning is around 130
days, and shasha denims is around 180 days. Here malek spinning mills have the grater position
among the company.
2012 2013 2014 2015 2016 2017
Argon Denim Ltd. 203.2862 206.3631 202.5092 152.4867 220.4936 228.292698
Envoy Textiles Ltd. 150.9657 130.8404 150.8708 141.446 173.1817 156.563387
Malek Spinning Mills Ltd. 145.0222 152.2958 122.5154 124.1356 110.0868 95.1044126
Shasha Denims Ltd. 202.321 183.2091 195.334 175.6685 158.8339 146.397206
Industry Average 175.3988 168.1771 167.8074 148.4342 165.649 156.589426
56
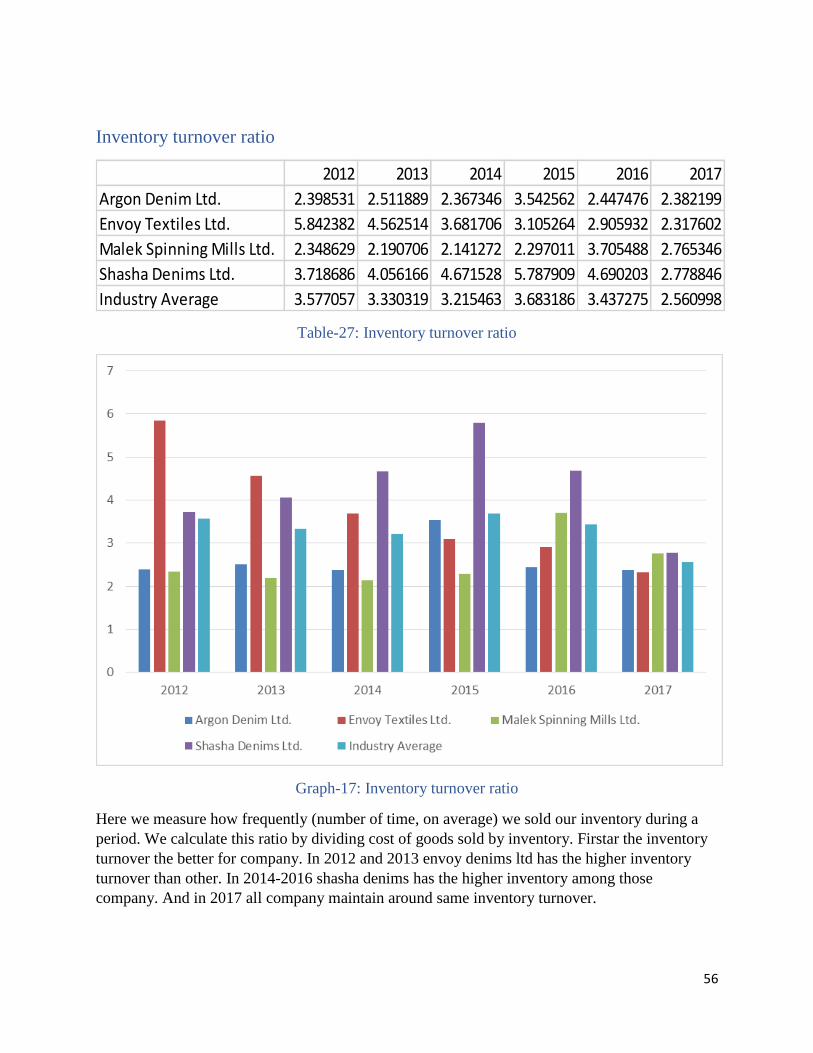
Inventory turnover ratio
Table-27: Inventory turnover ratio
Graph-17: Inventory turnover ratio
Here we measure how frequently (number of time, on average) we sold our inventory during a
period. We calculate this ratio by dividing cost of goods sold by inventory. Firstar the inventory
turnover the better for company. In 2012 and 2013 envoy denims ltd has the higher inventory
turnover than other. In 2014-2016 shasha denims has the higher inventory among those
company. And in 2017 all company maintain around same inventory turnover.
2012 2013 2014 2015 2016 2017
Argon Denim Ltd. 2.398531 2.511889 2.367346 3.542562 2.447476 2.382199
Envoy Textiles Ltd. 5.842382 4.562514 3.681706 3.105264 2.905932 2.317602
Malek Spinning Mills Ltd. 2.348629 2.190706 2.141272 2.297011 3.705488 2.765346
Shasha Denims Ltd. 3.718686 4.056166 4.671528 5.787909 4.690203 2.778846
Industry Average 3.577057 3.330319 3.215463 3.683186 3.437275 2.560998
57
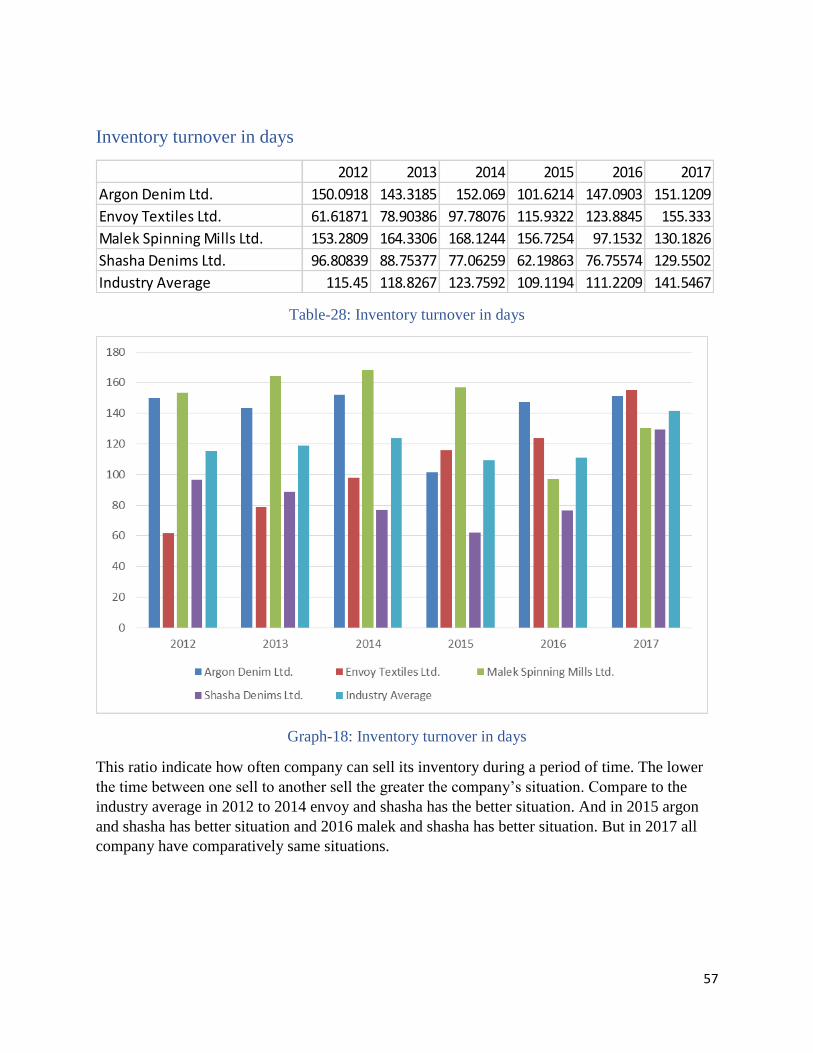
Inventory turnover in days
Table-28: Inventory turnover in days
Graph-18: Inventory turnover in days
This ratio indicate how often company can sell its inventory during a period of time. The lower
the time between one sell to another sell the greater the company’s situation. Compare to the
industry average in 2012 to 2014 envoy and shasha has the better situation. And in 2015 argon
and shasha has better situation and 2016 malek and shasha has better situation. But in 2017 all
company have comparatively same situations.
2012 2013 2014 2015 2016 2017
Argon Denim Ltd. 150.0918 143.3185 152.069 101.6214 147.0903 151.1209
Envoy Textiles Ltd. 61.61871 78.90386 97.78076 115.9322 123.8845 155.333
Malek Spinning Mills Ltd. 153.2809 164.3306 168.1244 156.7254 97.1532 130.1826
Shasha Denims Ltd. 96.80839 88.75377 77.06259 62.19863 76.75574 129.5502
Industry Average 115.45 118.8267 123.7592 109.1194 111.2209 141.5467
58
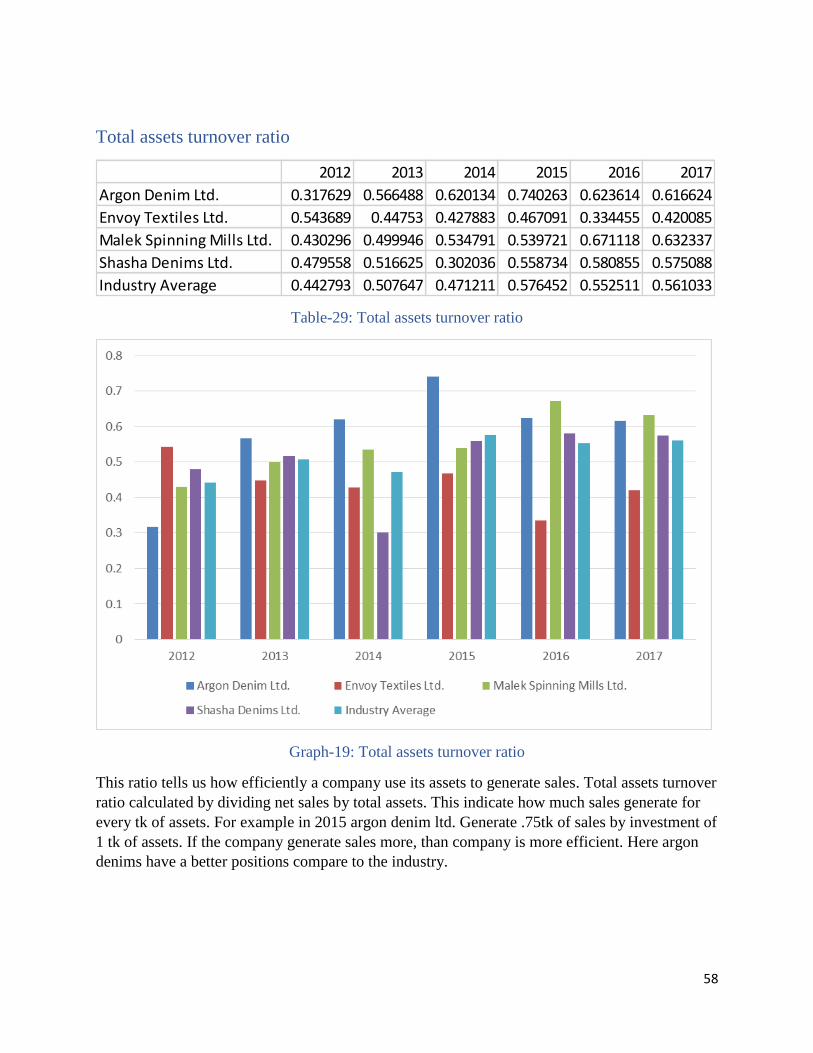
Total assets turnover ratio
Table-29: Total assets turnover ratio
Graph-19: Total assets turnover ratio
This ratio tells us how efficiently a company use its assets to generate sales. Total assets turnover
ratio calculated by dividing net sales by total assets. This indicate how much sales generate for
every tk of assets. For example in 2015 argon denim ltd. Generate .75tk of sales by investment of
1 tk of assets. If the company generate sales more, than company is more efficient. Here argon
denims have a better positions compare to the industry.
2012 2013 2014 2015 2016 2017
Argon Denim Ltd. 0.317629 0.566488 0.620134 0.740263 0.623614 0.616624
Envoy Textiles Ltd. 0.543689 0.44753 0.427883 0.467091 0.334455 0.420085
Malek Spinning Mills Ltd. 0.430296 0.499946 0.534791 0.539721 0.671118 0.632337
Shasha Denims Ltd. 0.479558 0.516625 0.302036 0.558734 0.580855 0.575088
Industry Average 0.442793 0.507647 0.471211 0.576452 0.552511 0.561033
59
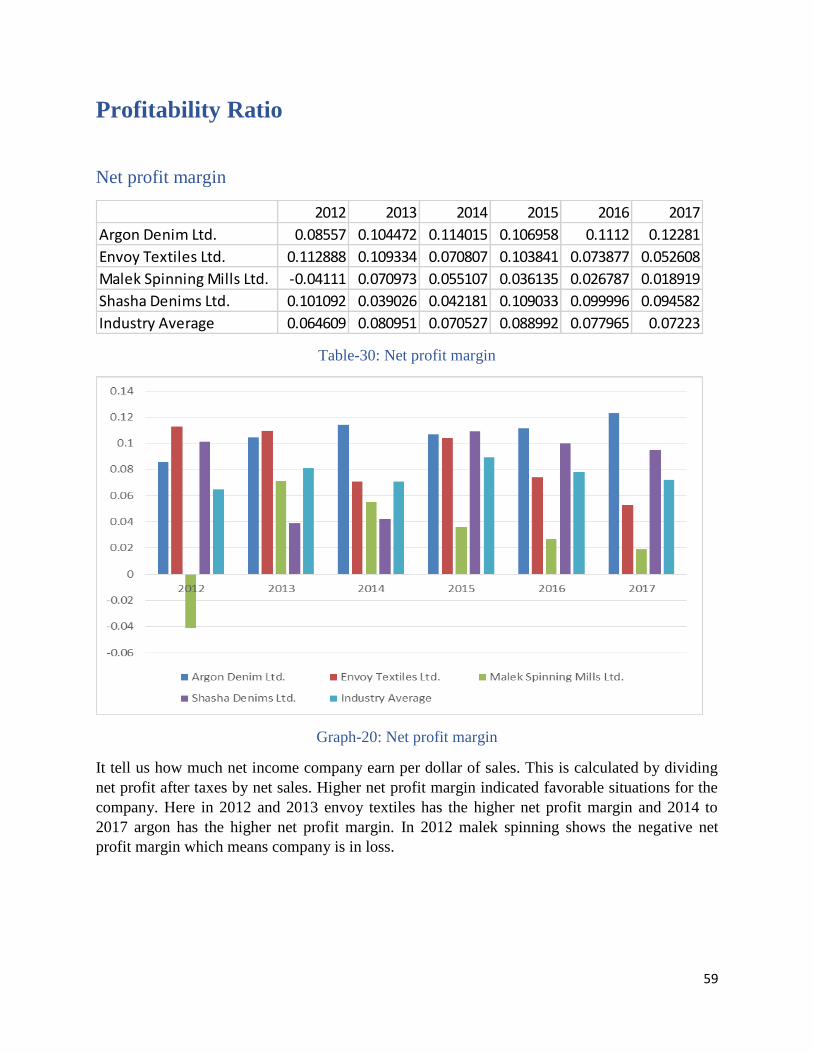
Profitability Ratio
Net profit margin
Table-30: Net profit margin
Graph-20: Net profit margin
It tell us how much net income company earn per dollar of sales. This is calculated by dividing
net profit after taxes by net sales. Higher net profit margin indicated favorable situations for the
company. Here in 2012 and 2013 envoy textiles has the higher net profit margin and 2014 to
2017 argon has the higher net profit margin. In 2012 malek spinning shows the negative net
profit margin which means company is in loss.
2012 2013 2014 2015 2016 2017
Argon Denim Ltd. 0.08557 0.104472 0.114015 0.106958 0.1112 0.12281
Envoy Textiles Ltd. 0.112888 0.109334 0.070807 0.103841 0.073877 0.052608
Malek Spinning Mills Ltd. -0.04111 0.070973 0.055107 0.036135 0.026787 0.018919
Shasha Denims Ltd. 0.101092 0.039026 0.042181 0.109033 0.099996 0.094582
Industry Average 0.064609 0.080951 0.070527 0.088992 0.077965 0.07223
60
Return on investment
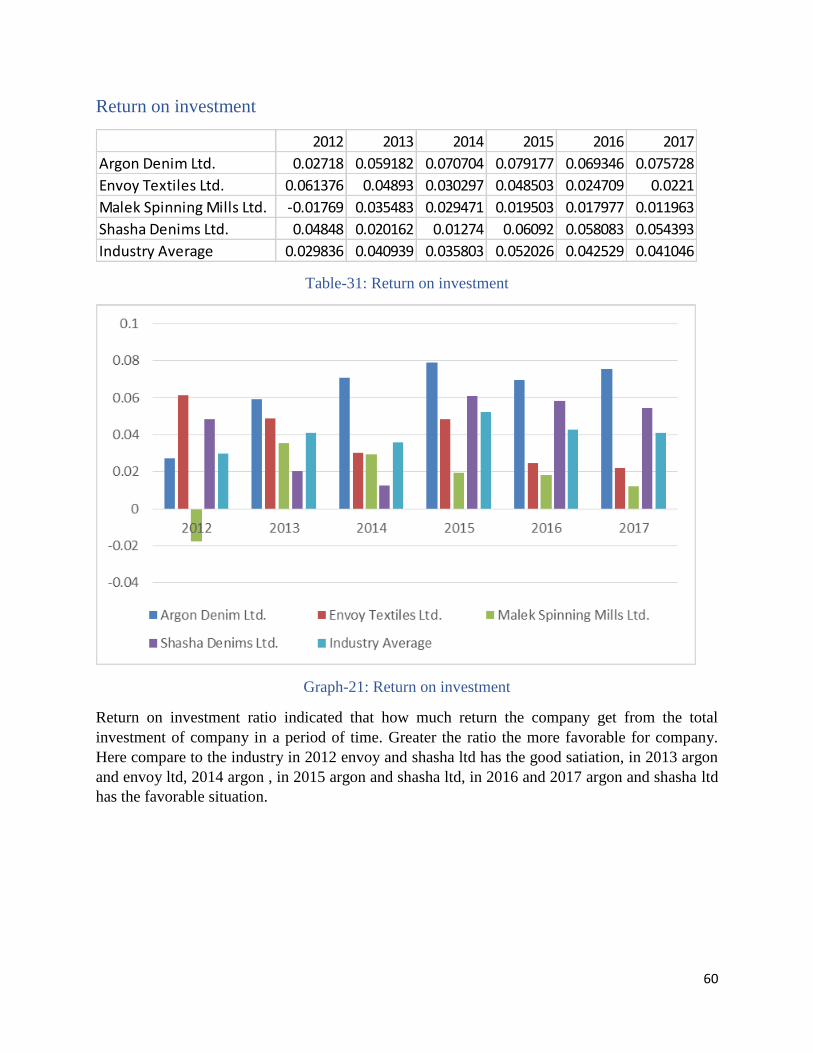
Table-31: Return on investment
Graph-21: Return on investment
Return on investment ratio indicated that how much return the company get from the total
investment of company in a period of time. Greater the ratio the more favorable for company.
Here compare to the industry in 2012 envoy and shasha ltd has the good satiation, in 2013 argon
and envoy ltd, 2014 argon , in 2015 argon and shasha ltd, in 2016 and 2017 argon and shasha ltd
has the favorable situation.
2012 2013 2014 2015 2016 2017
Argon Denim Ltd. 0.02718 0.059182 0.070704 0.079177 0.069346 0.075728
Envoy Textiles Ltd. 0.061376 0.04893 0.030297 0.048503 0.024709 0.0221
Malek Spinning Mills Ltd. -0.01769 0.035483 0.029471 0.019503 0.017977 0.011963
Shasha Denims Ltd. 0.04848 0.020162 0.01274 0.06092 0.058083 0.054393
Industry Average 0.029836 0.040939 0.035803 0.052026 0.042529 0.041046
61
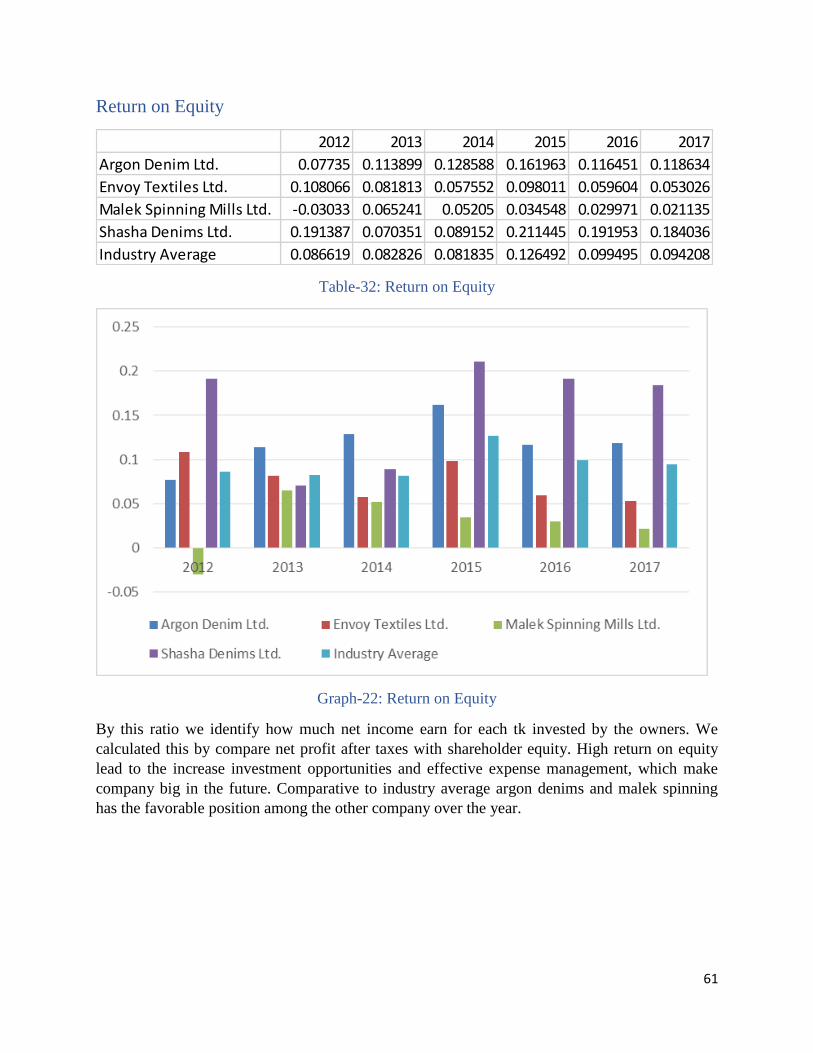
Return on Equity
Table-32: Return on Equity
Graph-22: Return on Equity
By this ratio we identify how much net income earn for each tk invested by the owners. We
calculated this by compare net profit after taxes with shareholder equity. High return on equity
lead to the increase investment opportunities and effective expense management, which make
company big in the future. Comparative to industry average argon denims and malek spinning
has the favorable position among the other company over the year.
2012 2013 2014 2015 2016 2017
Argon Denim Ltd. 0.07735 0.113899 0.128588 0.161963 0.116451 0.118634
Envoy Textiles Ltd. 0.108066 0.081813 0.057552 0.098011 0.059604 0.053026
Malek Spinning Mills Ltd. -0.03033 0.065241 0.05205 0.034548 0.029971 0.021135
Shasha Denims Ltd. 0.191387 0.070351 0.089152 0.211445 0.191953 0.184036
Industry Average 0.086619 0.082826 0.081835 0.126492 0.099495 0.094208
62
Chapter – 8
Conclusion
63
Conclusion In this chapter we will discuss the findings of the study. How the study meet our objective. We
give comparison between our selected companies performance. And give the summarized
recommendation related to the study. Analysis whether the study fulfill the purpose of our report.
This report are conduct on performance analysis of textiles companies of Bangladesh. We apply
many technique to understand the companies scenario and make comparison between them. For
understand companies financial statement we conduct common-size analyses. And for
understand companies performance analysis we conduct various ratio analysis related to our
study.
Common size analysis give us year to year comparison between companies financial statement
items based on total assets and total liabilities & shareholder equity and income statement item
based on net turnover sales.
For performance analysis the best tools is ratio analysis. One single ratio is not able to give us
the perfect scenario of a company. For that we need group of ratio to conduct the best analysis of
companies. We conduct ratio analyses divided into five part: liquidity ratio, leverage ratio,
coverage ratio, activity ratio, and finally profitability ratio.
In our analysis of liquidity measurement we find that argon denim ltd is in 1st position, malek
spinning mills ltd in second position and shasha denims in third position and envoy textile is in
last position. Second we measure the leverage ratio to understand companies ability to pay debt
by their asset and shareholder equity. Here we find that argon denims and malek spinning mills
ltd is in a favorable situation. Third we measure coverage ratio to find out, is that net income
cover the interest expense. Argon denims is in first position in terms of interest coverage
compare. Fourth we measure activity ratio to understand how effective the companies is in terms
of activity. Here result shows us envoy textiles ltd in in first position among other company.
Finally we measure how much profit company earns compare to net sales, total assets and equity.
Here results shows that in terms of profit earn argon denims is in also first position.
Finally by conducting the performance analysis we can say that argon denims performance is
best among the four company we select. And other company also increase their performance
year to year.
64
References Weygandt, J.J., Kimmel, P.D., Kieso, D.E. (2014, 2015), Accounting Principal, john
Willy & Sons, Inc, 10th
E.
Horne, J.C.V., Wcahowicz, Jr., J.M., (2016, 2017) Fundamental of Financial
Management, PHL Learning, 13th
E.
The following web site was assessed on January 1, 2019: www.lankabd.com.
The following web site was assessed on January 1, 2019: www.argondenims.com.
The following web site was assessed on January 1, 2019: www.envoytextiles.com
The following web site was assessed on January 1, 2019: www.shashadenim.com
The following web site was assessed on January 1, 2019:
www.newasiabd.com/malekspinning
The following web site was assessed on January 1, 2019:
https://en.wikipedia.org/wiki/Performance_appraisal