Embed Size (px)
Citation preview

A Report of the Nevada Land Management
Task Force to the Nevada Interim Legislative
Committee on Public Lands: Congressional
Transfer of Public Lands to the State of Nevada
Pursuant to AB 227 of the 2013 Nevada Legislative Session
July 18, 2014

Nevada Land Management Task Force Established Pursuant to Assembly Bill 227 enacted in the 2013 Legislative Session
August 1, 2014 Assemblyman Paul Aizley Chair, Interim Committee on Public Lands RE: Final Submission of the Nevada Land Management Task Force Report Dear Chairman Aizley and Committee Members: When AB227 was passed during the 2013 Legislative Session it created the Nevada Land Management Task Force and set in motion a series of events designed to create a study to determine the implications of transferring Nevada’s public lands from the Federal Government to the State of Nevada.
After twelve months of diligent work by Task Force Members, numerous stakeholders, and staff; and three hearings to take input from your Committee, we have produced a final version of our Report for you. In order for the study to possess the integrity necessary to gain broad support, it required the effort of a very dedicated Task Force Membership and full participation by every member who had been chosen to serve.
Especially important for the Task Force to accomplish its mission was support of the staff of the Nevada Association of Counties and Intertech Services, Inc. Intertech Services, Inc. exceeded all expectations in fulfilling its contract for services.
I want to thank the members of the Task Force and all who supported them for a job well done and also thank you, the Legislative Committee on Public Lands, for receiving periodic reports on the progress of the Task Force and spending the time to evaluate and provide input on all of the information provided by the Task Force.
Thank you again, and please accept the submission of this Report to meet the requirement of AB 227 from the 2013 Nevada Legislative Session.
Sincerely,
Demar Dahl, Elko County Commissioner Chair, Nevada Land Management Task Force

i
Table of Contents
Page Nevada Land Management Task Force Recommendation to the Nevada
Legislative Committee on Public Lands iv
I. Executive Summary 1
II. Introduction 4
III. Economic Analysis of the Transfer of Public Lands to the State of Nevada 8
A. Estimated Amount of Net Revenues to be Derived by the State of Nevada
from Transferred Lands 8
B. Recommended Disposition of Net Revenue 11
C. Land Transfer Costs 12
Federal Government 12
State of Nevada 14
County Government 15
D. Revenue Sources for State Management of Transferred Lands 16
E. Land Management Related Revenue Distributed to State and Local
Government in Nevada 16
F. Fire Suppression 17
IV. Identification of Public Lands to be Transferred to the State of Nevada 21
A. Land Transfer Should Be Completed in Phases 21
B. Land to Be Transferred During Phase I 21
C. Land to Be Transferred in Subsequent Phases 29
V. Administration, Management and Use of Transferred Lands 30
A. Recommended Plan for Administration and Management of
Lands Transferred to the State of Nevada 30
B. Uses of Transferred Lands 43
Appendices
Appendix A – AB 227
Appendix B – Listing of Nevada Land Management Task Force Members
Appendix C – Summary of Formal Presentations to the Nevada Land
Management Task Force
Appendix D – Listing of Persons Providing Public Comments and Summary
of Issues Raised
ii
Appendices Cont’d. Page
Appendix E - Listing of Dates on Which County Commissions in Nevada
Formally Considered the Draft Report and Recommendations
of the Nevada Land Management Task Force with Web Links
to Related County Commission Meeting Agendas/Minutes
Appendix F - Comparative Analysis of Revenues and Expenses for State
Trust Land Management and Bureau of Land Management in
Select States: Implications for an Expanded State Land Base
in Nevada
Appendix G – Section 7.3 Fire Suppression of Alternatives for Management of
An Expanded State Land Base in Nevada; a 1996 Study Prepared
For The Board of Eureka County Commissioners
List of Tables
Table 1. Percentage of Federal, Private and State Land in Select
Western States 4
Table 2. Five-Year Multi-state Observed High, Observed Low and
Four State Average Revenues, Expenses and FTEs (2008-2012) 9
Table 3. Estimated Net Revenue from Expanded State Land Ownership
in Nevada Using Four State Net Revenue Models 10
Table 4. BLM Nevada Five Year Revenues, Expenditures and
Employment, 2008 – 2012 11
Table 5. Distribution of Net Revenue and Investment Income
Derived From New Mexico State Trust Lands: Selected
Beneficiaries (2012) 13
Table 6. Bureau of Land Management Nevada, Department of Interior
Office of Natural Resources Revenue and Payment In-Lieu of
Taxes Revenue Distribution to Nevada State and Local
Governments 18
Table 7. Number and Acreage Burned for Fires on Private and State
Land Responded to by the Nevada Division of Forestry,
2008-2013 18
Table 8. Lands Identified for Transfer from the Federal Government
to Nevada During Phase I 23
Table 9. Status of Land Acts in Nevada 29

iii
List of Tables Cont’d. Page
Table 10. Five-Year Average Acres of State Trust Land Managed,
Staffing Level (Full Time Equivalents) and Acres Managed
Per FTE, Arizona, Idaho, Nevada, New Mexico and Utah,
2008-2013 31
Table 11. Comparison of NEPA Topics of Analysis for Projects on
Federal Land and Permits and Approvals Required for
Projects in Nevada on State and Private Land 39
Table 12. Alternative Uses of Transferred Land Which Might
Generate Revenue for Designated Beneficiaries 44
List of Figures
Figure 1. Nevada Land Status 5
Figure 2. Land Owned by the State of Nevada by County 6
Figure 3. State of Nevada Fire Suppression Costs; All Fires 20
Figure 4. BLM Checkerboard Land 24
Figure 5. Proposed Organizational Chart: Nevada Division of State
Lands, Office of Trust Land Management 36

iv
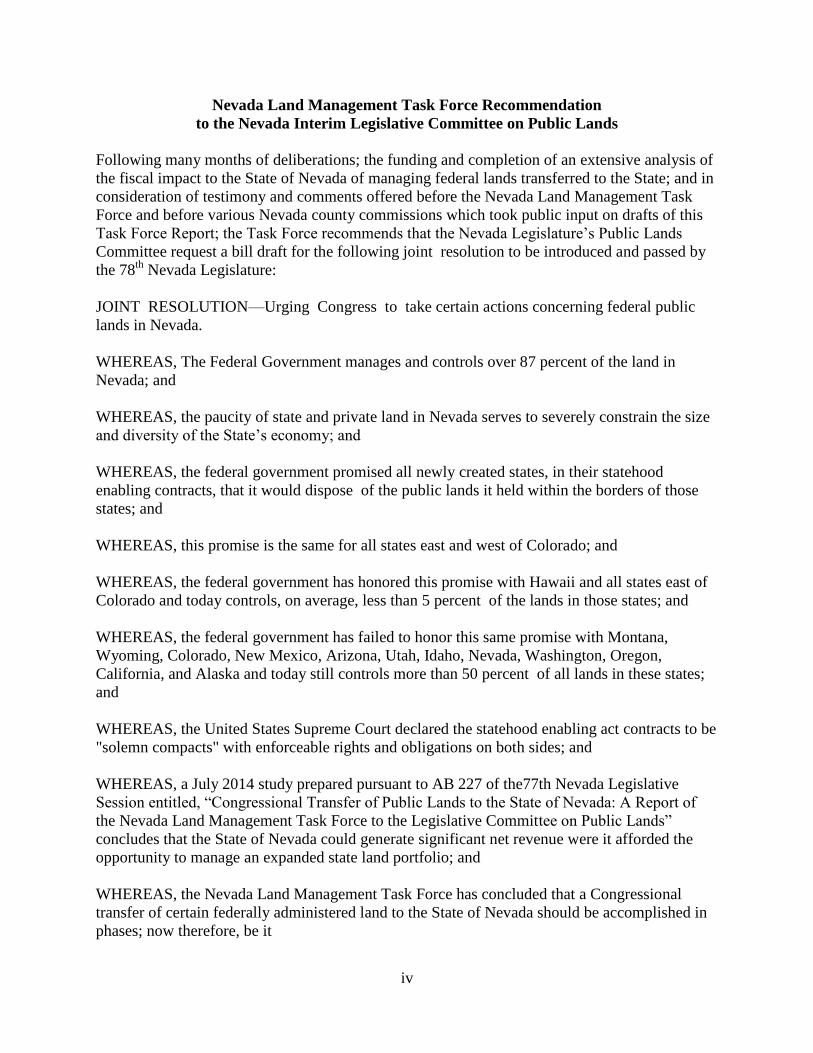
Nevada Land Management Task Force Recommendation
to the Nevada Interim Legislative Committee on Public Lands
Following many months of deliberations; the funding and completion of an extensive analysis of
the fiscal impact to the State of Nevada of managing federal lands transferred to the State; and in
consideration of testimony and comments offered before the Nevada Land Management Task
Force and before various Nevada county commissions which took public input on drafts of this
Task Force Report; the Task Force recommends that the Nevada Legislature’s Public Lands
Committee request a bill draft for the following joint resolution to be introduced and passed by
the 78th
Nevada Legislature:
JOINT RESOLUTION—Urging Congress to take certain actions concerning federal public
lands in Nevada.
WHEREAS, The Federal Government manages and controls over 87 percent of the land in
Nevada; and
WHEREAS, the paucity of state and private land in Nevada serves to severely constrain the size
and diversity of the State’s economy; and
WHEREAS, the federal government promised all newly created states, in their statehood
enabling contracts, that it would dispose of the public lands it held within the borders of those
states; and
WHEREAS, this promise is the same for all states east and west of Colorado; and
WHEREAS, the federal government has honored this promise with Hawaii and all states east of
Colorado and today controls, on average, less than 5 percent of the lands in those states; and
WHEREAS, the federal government has failed to honor this same promise with Montana,
Wyoming, Colorado, New Mexico, Arizona, Utah, Idaho, Nevada, Washington, Oregon,
California, and Alaska and today still controls more than 50 percent of all lands in these states;
and
WHEREAS, the United States Supreme Court declared the statehood enabling act contracts to be
"solemn compacts" with enforceable rights and obligations on both sides; and
WHEREAS, a July 2014 study prepared pursuant to AB 227 of the77th Nevada Legislative
Session entitled, “Congressional Transfer of Public Lands to the State of Nevada: A Report of
the Nevada Land Management Task Force to the Legislative Committee on Public Lands”
concludes that the State of Nevada could generate significant net revenue were it afforded the
opportunity to manage an expanded state land portfolio; and
WHEREAS, the Nevada Land Management Task Force has concluded that a Congressional
transfer of certain federally administered land to the State of Nevada should be accomplished in
phases; now therefore, be it

v
RESOLVED BY THE ASSEMBLY AND SENATE OF THE STATE OF NEVADA,
JOINTLY, That the members of the 78th Session of the Nevada Legislature hereby urge
Congress to enact legislation transferring title and ownership of certain federally administered
land to the state of Nevada; and be it further
RESOLVED, that any such Congressional transfer of federally administered land to the State of
Nevada should exclude the following lands from consideration for transfer 1) current
Congressionally designated wilderness areas; 2) National Conservation Areas; 3) lands currently
administered by a) the Department of Energy; b) Department of Defense; c) Department of
Interior, Bureau of Indian Affairs; d) Department of the Interior, U. S. Fish and Wildlife Service;
e) Department of the Interior, National Park Service; and 4) Bureau of Land Management
designated Areas of Critical Environmental Concern established to protect Desert Tortoise; and
be it further
RESOLVED, that the Congressional transfer of federally administered land to the State of
Nevada should be authorized to occur in phases; and be it further
RESOLVED, that the following federally administered land should be included in an initial
phase for transfer to the State of Nevada 1) all parcels of Bureau of Land Management
administered land remaining within the original Central Pacific Railroad corridor along Interstate
80 in Northern Nevada; 2) all land previously identified by the Bureau of Land Management as
suitable for disposal or currently moving forward in planning documents for federal land use
plans that have not yet been disposed of in Nevada; 3) all Bureau of Land Management land
under existing Recreation & Public Purposes Act lease in Nevada; 4) all Bureau of Land
Management land authorized under rights-of-way granted to the State of Nevada and her units of
local government and non-linear rights-of-way granted to private parties within Nevada; 5) all
Bureau of Land Management held subsurface estate where the surface estate is privately held in
Nevada; 6) all Bureau of Land Management land designated by the Secretary of the Interior as
Solar Energy Zones in the State of Nevada; 7) all Bureau of Land Management land in Nevada
leased for geothermal exploration and utilization; 8) all Bureau of Land Management Land in
Nevada which has been authorized for disposal within enacted and introduced federal legislation;
and be it further
RESOLVED, that the State of Nevada shall be authorized to select no less than 7.2 million acres
from among the aforementioned classes of land to be transferred during an initial phase by the
federal government; and be it further
RESOLVED, that upon request by a local government or the Nevada Legislature within 10 years
of the initial transfer of Phase I lands the following federally administered land to be transferred
from the federal government to the State of Nevada in subsequent phases including 1) other
Bureau of Land Management administered land in Nevada; 2) land administered by the United
States Forest Service in Nevada; 3) lands deemed to be surplus by the Bureau of Reclamation in
Nevada; 4) other federally managed and administered lands in Nevada; and be it further
vi
RESOLVED, that any such Congressional transfer of federally administered land to the State of
Nevada shall include 1) surface estate; 2) subsurface estate and 3) any federally held water rights
appurtenant to transferred lands; and be it further
RESOLVED, that the transferred lands will be held by the State of Nevada in trust for the select
beneficiaries; and be it further
RESOLVED, that land transferred by the federal government to the State of Nevada in an initial
phase shall be managed for long-term net revenue maximization; and be it further
RESOLVED, that federally administered land transferred to the State of Nevada in subsequent
phases shall be managed for on-going net revenue generation and environmental health, function,
productivity and sustainability; and be it further
RESOLVED, that the transferred lands shall be managed by the State of Nevada in trust for the
following beneficiaries 1) public K-12 education; 2) public higher education; 3) public
specialized education; 4) public mental and medical health services; 5) social, senior and veteran
services ; and 6) public programs for candidate and listed threatened or endangered species
recovery plan development and implementation; and 7) local governments to pay for services
and infrastructure required on these lands which would otherwise be financed through property
tax or other revenues available to local government; and be it further
RESOLVED, that payments to local government to replace the revenue lost through reduced
federal Payments in Lieu of Taxes (PILT) will be made by the State of Nevada from gross
revenues derived through management of federal land transferred to the State of Nevada; and be
it further
RESOLVED, that payments to local governments to replace the amount of revenue which
would otherwise have been shared with local governments in Nevada by the Bureau of Land
Management from the sale of materials, mineral leases and permits, grazing permits and other
revenues on federal lands transferred to the State of Nevada will be made by the State of Nevada
from the gross revenue derived by the State for management of those lands; and be it further
RESOLVED that payments to local governments to replace the amount of revenue which would
otherwise have been shared with local governments in Nevada by the Department of Interior
Office of Natural Resources Revenue from royalties, rents, and bonuses generated throughout the
life of energy and mineral leases on federal lands transferred to the State of Nevada will be made
by the State of Nevada from the gross revenue derived by the State for management of those
lands; and be it further
RESOLVED, that consistent with the Southern Nevada Public Land Management Act, the
Lincoln County Conservation, Recreation and Development Act and the White Pine County
Conservation, Recreation and Development Act, 10 percent of the proceeds of the sale of
transferred land by the State of Nevada which was identified in these Acts for disposal by the
Bureau of Land Management shall be provided to the Southern Nevada Water Authority, Lincoln
County and White Pine County for uses identified by each respective Act; and be it further

vii
RESOLVED, that the following principals will guide State of Nevada management of transferred
lands 1) all transferred land subject to applicable State of Nevada and local government statutes,
regulations, ordinances, and codes; 2) all transferred land subject to valid existing federal, State
of Nevada, and local government permits; land use authorizations; existing authorized multiple
uses; rights of access and property rights; 3) administration and management, including disposal,
of transferred land by the State of Nevada shall be subject to review by the governing board of
local government(s) within which land to be disposed of is located for consistency with local
master plans, resource management/open space plans, land disposal lists, ordinances and land
use policies; and 4) costs incurred by the State of Nevada to administer federal land transferred
to the State shall be covered by gross revenue derived from managing said land and not passed
through to local government; and be it further
RESOLVED, that net revenues derived from the management of transferred lands shall be 1)
held in trust for the benefit of select beneficiaries and 2) deposited into a Permanent Trust Fund
for the express benefit of aforementioned beneficiaries; and be it further
RESOLVED, That the Chief Clerk of the Assembly (or Senate) prepare and transmit a copy of
this resolution to the Vice President of the United States as the presiding officer of the United
States Senate, the Speaker of the House of Representatives and each member of the Nevada
Congressional Delegation; and be it further
RESOLVED, that this resolution becomes effective upon passage.
1
A Report of the Nevada Land Management Task Force to the Legislative Committee on
Public Lands: Congressional Transfer of Public Lands to the State of Nevada
I. Executive Summary
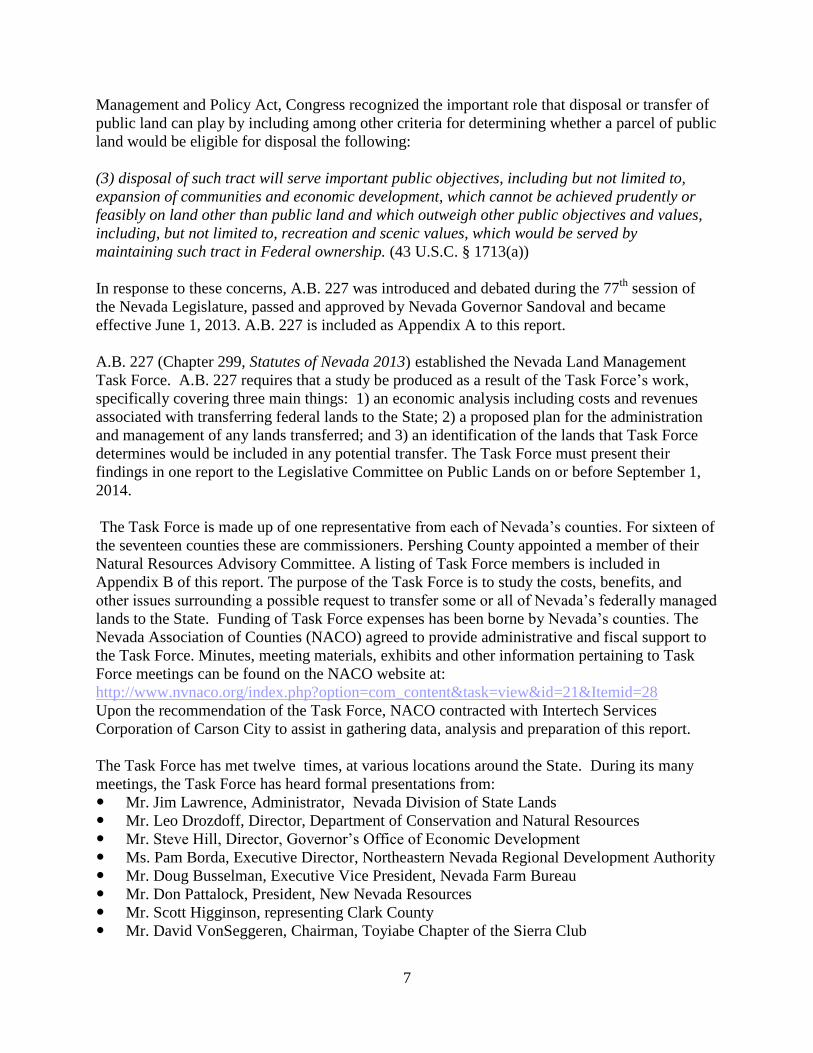
Pursuant to the requirements of A.B. 227 (Chapter 299, Statutes of Nevada 2013) the Nevada
Land Management Task Force has completed this report which documents 1) an economic
analysis including costs and revenues associated with transferring federal lands to the State; 2) a
proposed plan for the administration and management of any lands transferred; and 3) an
identification of the lands that Task Force determines would be included in any potential
transfer. During its July 18, 2014 meeting, the Task Force reviewed and those members of the
Task Force present voted unanimously to approve this report and recommendation for
submission to the Nevada Interim Lagislative Committee on Public Lands. The Task Force is
recommending that the Legislative Public Lands Committee submit a bill draft request to
introduce a joint resolution calling upon the Congress to transfer 7.2 million acres of public land
to the State of Nevada in an initial phase; other federally administered lands in subsequent
phases and other matters pertaining thereto.
The Task Force recognizes the need to maintain the integrity of environmentally sensitive and
culturally important areas designated by Congress for special management such as wilderness,
national parks, national monuments, national recreation areas, national wildlife refuges, national
conservation areas, federally recognized Indian reservations and other lands administered by the
Bureau of Indian Affairs and land designated by the Bureau of Land Management (BLM) as
Areas of Critical Environmental Concern to protect the Desert Tortoise. These lands are
recommended by the Task Force for exclusion from any congressional transfer of land to the
State of Nevada.
The Task Force has determined that the State of Nevada would likely be able to generate
significant net revenues from the management of an expanded state land base. The Task Force
believes that conditions which attended state trust land management in the states of Arizona,
Idaho, New Mexico and Utah during the years of 2008 through 2012 are sufficiently similar to
those in Nevada to support the assumption that were the Congress to transfer an amount of land
commensurate with state trust land holdings in those states that Nevada could achieve net land
management revenues ranging between $7.78 and $28.59 per acre.
The concept of self-funding of an expanded state land management function was embraced by
the Task Force as a goal. Consequently, two key objectives were identified including 1) phasing
of a federal to state land transfer to enable absorption of an expanded land management function
in a fiscally neutral and sustainable manner and 2) selection of lands for transfer during Phase I
having immediate potential for collateralization, minimal management costs and generation of
net revenues in a short term.
The Task Force applied these framing considerations and has identified the following public
lands in Nevada for inclusion in a proposed Phase I land transfer:

2
BLM administered parcels of land remaining within the original Central Pacific Railroad
corridor along Interstate 80 in Northern Nevada (BLM Checkerboard; 4.2 million acres)
Lands identified by BLM as suitable for disposal or currently moving forward in planning
documents for federal land use plans that have not yet been disposed of (Identified by BLM
as Suitable for Disposal; 1 million acres)
BLM lands under existing Recreation & Public Purposes (R&PP) Act lease (Existing BLM
R&PP Leases; 200,000 acres)
BLM lands authorized under Rights-of-Way granted to the State and local governments and
non-linear Rights-of-Way granted to private parties (Existing BLM ROW Grants; 255,000
acres)
BLM held subsurface estate where the surface estate is privately held (BLM Split Estate;
300,000 acres)
BLM lands designated by the Secretary of the Interior as Solar Energy Zones (BLM
Designated Solar Energy Zones; 65,000 acres)
BLM lands leased for geothermal exploration and utilization ( BLM Geothermal Leases;
1,045,079 acres)
BLM lands authorized for disposal within enacted and introduced federal legislation
(Enacted and Proposed Congressional Transfers of BLM Land; 250,000 acres)
Collectively, these Phase I lands would total an estimated 7,281,074 acres.
Assuming that net revenues between $7.78 and $28.59 per acre can be derived by the State of
Nevada from management of an expanded state land area and assuming that a Phase I
Congressional transfer of land included 7.2 million acres (the Task Force recommendation for
Phase I), the State of Nevada might be capable of generating net revenues ranging between
$56,016,000 and $205,848,000 annually.
The Task Force has observed the important role that the dedication of net revenues to select
beneficiaries has seemingly played in states’ success in generating net revenues. The Task Force
recommends that 1) the transferred lands will be held by the State of Nevada in trust for select
beneficiaries; 2) Phase I transferred lands will be managed for long-term net revenue
maximization; 3) lands transferred in subsequent phases will be managed for on-going net
revenue generation and environmental health, function, productivity and sustainability and 4)
the transferred lands will be managed by the State of Nevada in trust for the following
beneficiaries:
Public K-12 education
Public higher education
Public specialized education
Public mental and medical health services
Social, senior and veterans services
Public programs for candidate and listed threatened or endangered species recovery plan
development and implementation
Local governments to pay for services and infrastructure required on these lands which
would otherwise be financed through property tax or other revenues available to local
government

3
Because Nevada currently only holds and manages less than 200,000 acres, of which
approximately 2,900 acres are State Trust Lands, the Task Force recognizes that fiscal and
staffing considerations suggest that the State would be well served to accept transferred federal
lands in phases. The Task Force further believes that any phasing strategy must be focused in the
beginning on lands which offer immediate revenue generating potential so as to enable the State
early access to monies from which an expanded State Trust land management capacity can be
established with minimal impact upon the State General Fund .
The Task Force has considered alternatives for administration and management of an expanded
State land base and has determined that land to be transferred by the Congress should be
transferred to and administered by the State of Nevada, Division of State Lands. As noted
previously, the Task Force is recommending that the majority of transferred land be held in trust
and managed for the benefit of select beneficiaries. Were the Congress to transfer 7.2 million
acres during Phase I to the State of Nevada, the Task Force estimates management of this area
would require a staffing level at the Division of State Lands of between 96 and 162 persons.
Given existing statutory and regulatory environmental and land use review, oversight and
approval/denial authority vested with State of Nevada agencies and local government, the Task
Force believes that proposed development and use of transferred lands in an environmentally
responsible manner is likely and that extra-regulatory procedure such as a state-level National
Environmental Policy Act (NEPA) like process is unnecessary.
The Task Force has come up with the following plan for financing start-up transferred land
management costs. Elements of the plan include:
No Nevada State General Fund expenditures to manage 7.2 million acres of Phase I
transferred lands
A portion of the 7.2 million acres of transferred lands to the State of Nevada to be
collateralized
Short to intermediate term debt to be incurred by State of Nevada for land management
start-up capital
The observed four-state, five-year average expense per acre of $3.73 (see Table 10 of
Appendix E of this report) can be assumed as the Year 1 land management cost per acre
for lands transferred to the State of Nevada
Estimated first year State of Nevada expense for management of 7.2 million acres is
estimated at $26,856,000
As soon as possible after patenting and recordation of the Phase I transferred land, the
sale of select parcels to generate start-up capital and repay debt would occur
A first year sale of up to 30,000 acres from among those lands previously identified for
disposal by BLM at an assumed $1,000/acre would yield $30 million plus other on-going
revenues (rents, royalties, fees, etc.) from the management of 7.2 million acres of
transferred land
Land sales in the Las Vegas Valley and Reno-Sparks areas would likely result in higher
values per acre
The Task Force believes that implementation of the aforementioned steps would result in the
availability of sufficient capital to cover Year 1 management costs of the 7.2 million acres

4
transferred during Phase 1 and that no Nevada State General Funds would be required to cover
said management costs. After Year 1, the Task Force believes, based upon the analyses included
in Appendix E of this report, that the management of the 7.2 million acres of Phase I transferred
lands would be self-supporting.
II. Introduction
Nevada covers 110,567 square miles, making it the 7th largest of the 50 states. As shown in
Table 1, 81.1 percent of Nevada’s land area is administered by various agencies of the federal
government, the highest percentage of federal land among all 50 states. As evidenced by Figure
1, some counties in Nevada such as Esmeralda, Lander, Lincoln, Nye, and White Pine have over
90 percent of total county acreage being administered by the federal government. The majority
of federally administered land in Nevada is administered by the Bureau of Land Management
(BLM). During 2012, BLM administered land in Nevada totaled nearly 47.8 million acres, or
67.5 percent of Nevada’s land area. The high percentage of federally administered land in
Nevada necessarily results in the state having a paucity of state and private land, ranking last
among all 50 states. Figure 2 illustrates the small area of state land which exists in Nevada. The
extent of federally administered land in Nevada has been viewed by many as a constraint to
expansion and diversification of the State’s economy and tax base as well as conservation of key
components of its flora and fauna. Many important decisions regarding authorization of land
uses and environmental management face institutional and temporal uncertainty as decision-
making is subjected to myriad of federal statutes, regulations and policies and decision-making is
often relegated from local to state offices then on to agency leadership in Washington, D.C.
Table 1. Percentage of Federal, Private and State Land in Select Western States
Area
Percent
Federal Land
Percent
Private Land
Percent
State Land
Nevada 87.6 12.2 .2
Arizona 42.3 43.2 14.5
Idaho 61.7 29.6 8.7
New Mexico 34.7 52.6 12.7
Utah 66.5 24.8 8.7
Sources: Congressional Budget Office; Federal Land Ownership: Overview
and Status; http://www.summitpost.org/public-and-private-land-percentages-
by-us-states/186111
Federal land management policies may serve to constrain economic development while the
availability of private land may encourage economic expansion. A recent study found that
production of oil and gas on private property in the Mountain West region encompassing
Wyoming, Utah, Colorado, New Mexico, Montana, Nevada, and Idaho has outpaced production
from federal lands. While crude oil output on federal lands in the region increased almost 14
percent since 2009, production on private lands has increased at 28 percent, twice that rate.
While production growth of natural gas and natural gas liquids on private lands in the region has
grown 0.9 percent since 2009, production of these products on federal lands has declined 5.4

5
Figure 1. Nevada Land Status

6
Figure 2. Land Owned by the State of Nevada by County
percent. (http://endfedaddiction.org/wp-content/uploads/2013/09/Economic-Value-of-Energy-
Resources-on-Federal-Lands-Final-Revision-9.17.13.pdf). In enacting the Federal Land
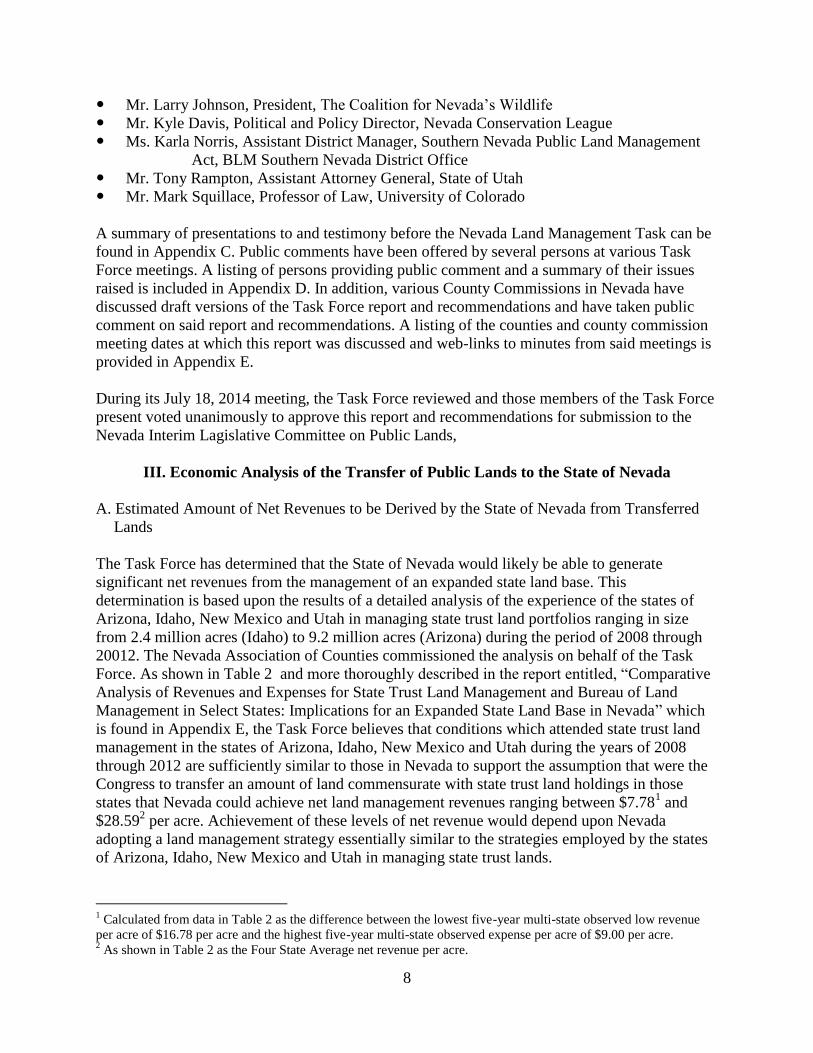
7
Management and Policy Act, Congress recognized the important role that disposal or transfer of
public land can play by including among other criteria for determining whether a parcel of public
land would be eligible for disposal the following:
(3) disposal of such tract will serve important public objectives, including but not limited to,
expansion of communities and economic development, which cannot be achieved prudently or
feasibly on land other than public land and which outweigh other public objectives and values,
including, but not limited to, recreation and scenic values, which would be served by
maintaining such tract in Federal ownership. (43 U.S.C. § 1713(a))
In response to these concerns, A.B. 227 was introduced and debated during the 77th
session of
the Nevada Legislature, passed and approved by Nevada Governor Sandoval and became
effective June 1, 2013. A.B. 227 is included as Appendix A to this report.
A.B. 227 (Chapter 299, Statutes of Nevada 2013) established the Nevada Land Management
Task Force. A.B. 227 requires that a study be produced as a result of the Task Force’s work,
specifically covering three main things: 1) an economic analysis including costs and revenues
associated with transferring federal lands to the State; 2) a proposed plan for the administration
and management of any lands transferred; and 3) an identification of the lands that Task Force
determines would be included in any potential transfer. The Task Force must present their
findings in one report to the Legislative Committee on Public Lands on or before September 1,
2014.
The Task Force is made up of one representative from each of Nevada’s counties. For sixteen of
the seventeen counties these are commissioners. Pershing County appointed a member of their
Natural Resources Advisory Committee. A listing of Task Force members is included in
Appendix B of this report. The purpose of the Task Force is to study the costs, benefits, and
other issues surrounding a possible request to transfer some or all of Nevada’s federally managed
lands to the State. Funding of Task Force expenses has been borne by Nevada’s counties. The
Nevada Association of Counties (NACO) agreed to provide administrative and fiscal support to
the Task Force. Minutes, meeting materials, exhibits and other information pertaining to Task
Force meetings can be found on the NACO website at:
http://www.nvnaco.org/index.php?option=com_content&task=view&id=21&Itemid=28
Upon the recommendation of the Task Force, NACO contracted with Intertech Services
Corporation of Carson City to assist in gathering data, analysis and preparation of this report.
The Task Force has met twelve times, at various locations around the State. During its many
meetings, the Task Force has heard formal presentations from:
Mr. Jim Lawrence, Administrator, Nevada Division of State Lands
Mr. Leo Drozdoff, Director, Department of Conservation and Natural Resources
Mr. Steve Hill, Director, Governor’s Office of Economic Development
Ms. Pam Borda, Executive Director, Northeastern Nevada Regional Development Authority
Mr. Doug Busselman, Executive Vice President, Nevada Farm Bureau
Mr. Don Pattalock, President, New Nevada Resources
Mr. Scott Higginson, representing Clark County
Mr. David VonSeggeren, Chairman, Toyiabe Chapter of the Sierra Club
8
Mr. Larry Johnson, President, The Coalition for Nevada’s Wildlife
Mr. Kyle Davis, Political and Policy Director, Nevada Conservation League
Ms. Karla Norris, Assistant District Manager, Southern Nevada Public Land Management
Act, BLM Southern Nevada District Office
Mr. Tony Rampton, Assistant Attorney General, State of Utah
Mr. Mark Squillace, Professor of Law, University of Colorado
A summary of presentations to and testimony before the Nevada Land Management Task can be
found in Appendix C. Public comments have been offered by several persons at various Task
Force meetings. A listing of persons providing public comment and a summary of their issues
raised is included in Appendix D. In addition, various County Commissions in Nevada have
discussed draft versions of the Task Force report and recommendations and have taken public
comment on said report and recommendations. A listing of the counties and county commission
meeting dates at which this report was discussed and web-links to minutes from said meetings is
provided in Appendix E.
During its July 18, 2014 meeting, the Task Force reviewed and those members of the Task Force
present voted unanimously to approve this report and recommendations for submission to the
Nevada Interim Lagislative Committee on Public Lands,
III. Economic Analysis of the Transfer of Public Lands to the State of Nevada
A. Estimated Amount of Net Revenues to be Derived by the State of Nevada from Transferred
Lands
The Task Force has determined that the State of Nevada would likely be able to generate
significant net revenues from the management of an expanded state land base. This
determination is based upon the results of a detailed analysis of the experience of the states of
Arizona, Idaho, New Mexico and Utah in managing state trust land portfolios ranging in size
from 2.4 million acres (Idaho) to 9.2 million acres (Arizona) during the period of 2008 through
20012. The Nevada Association of Counties commissioned the analysis on behalf of the Task
Force. As shown in Table 2 and more thoroughly described in the report entitled, “Comparative
Analysis of Revenues and Expenses for State Trust Land Management and Bureau of Land
Management in Select States: Implications for an Expanded State Land Base in Nevada” which
is found in Appendix E, the Task Force believes that conditions which attended state trust land
management in the states of Arizona, Idaho, New Mexico and Utah during the years of 2008
through 2012 are sufficiently similar to those in Nevada to support the assumption that were the
Congress to transfer an amount of land commensurate with state trust land holdings in those
states that Nevada could achieve net land management revenues ranging between $7.781 and
$28.592 per acre. Achievement of these levels of net revenue would depend upon Nevada
adopting a land management strategy essentially similar to the strategies employed by the states
of Arizona, Idaho, New Mexico and Utah in managing state trust lands.
1 Calculated from data in Table 2 as the difference between the lowest five-year multi-state observed low revenue
per acre of $16.78 per acre and the highest five-year multi-state observed expense per acre of $9.00 per acre. 2 As shown in Table 2 as the Four State Average net revenue per acre.

9
The net revenues described in Table 2 are net of expenses associated with managing state trust
lands. In most cases observed during preparation of this report, state trust land management
activities are self funded from revenues generated and accrued in each state’s permanent or trust
fund. In only a few cases were state general fund sources used to support state trust land
management functions. Idaho, New Mexico and Utah each cover all or a portion of their trust
land management expenses from revenues derived from said management. Arizona obtains its
operating funds through legislative appropriations. Each state except New Mexico has its state
trust land management operating budget approved by the legislature. (Souder, Jon and Sally
Fairfax, Material excerpted from the authors' book, State Trust Lands: History, Management,
and Sustainable Use, 1995 by the University of Kansas Press; web article entitled “State Trust
Lands” which can be found at http://www.ti.org/statetrusts.html.)
Table 2. Five-Year Multi-state Observed High, Observed Low and Four State
Average Revenues, Expenses and FTEs1 (2008-2012)
Category Observed High Observed Low Average
Revenues $652,347,910 $48,276,287 $240,460,652
Expenses $23,880,660 $8,586,066 $15,325,490
Net Revenue $639,111,910 $25,591,016 $223,111,851
Total Acres Managed 9,302,255 2,449,255 6,021,44
1 Revenue/Acre $72.40 $16.78 $36.79
Expense/Acre $9.00 $1.45 $3.73
Net Revenue/Acre $72.26 $10.00 $28.59
Total FTEs 264 66 160
Acres Managed/FTE 74616 9266 44275
Revenue/FTE $4,320,184 $182,864 $1,776,061
Expense/FTE $155,069 $76,367 $102,502
Net Revenue/FTE $4,311,461 $96,935 $1,644,310
1/ For state trust land management activities in the states of Arizona, Idaho, New Mexico and Utah. As shown in
Appendix F the highest observed expense per acre is for Idaho and reflects the management of commercial timber
tracts and related harvests. The lowest observed revenue per acre is for Arizona and reflects a significant decline in
land sale acreage and value during 2010’s recessionary influence.
Source: Derived from data within each state Land Department’s Annual Reports for 2008
through 2012 as shown in Table 10 of Comparative Analysis of Revenues and Expenses for
State Trust Land Management and Bureau of Land Management in Select States: Implications
for an Expanded State Land Base in Nevada which is included as Appendix E.
The transfer of federal land to the State of Nevada may result in a reduction of Payments in Lieu
of Taxes and federal revenues derived from land management activities currently provided to
counties in Nevada. To address the potential reduction of these revenues, the Task Force is
recommending that that payments to local government to replace the revenue lost through
reduced federal Payments in Lieu of Taxes (PILT) will be made by the State of Nevada from
gross revenues derived through management of federal land transferred to the State of Nevada.
The Task Force is further recommending that payments to local governments to replace the
amount of revenue which would otherwise have been shared with local governments in Nevada

10
by the Bureau of Land Management from the sale of materials, mineral leases and permits,
grazing permits and other revenues and the Department of Interior Office of Natural Resources
Revenue from royalties, rents, and bonuses generated throughout the life of energy and mineral
leases on federal lands transferred to the State of Nevada will be made by the State of Nevada
from the gross revenue derived by the State for management of those lands,
As shown in Table 3 and assuming that net revenues between $7.78 and $28.59 per acre can be
derived by the State of Nevada from management of an expanded state land area and assuming
that a Phase I Congressional transfer of land included 7.2 million acres (the Task Force
recommendation for Phase I), the State of Nevada might be capable of generating net revenues
ranging between $56,016,000 and $205,848,000 annually. Should the Congress elect to transfer
title to the balance of BLM administered land in Nevada, excepting Congressionally designated
wilderness (2,055,005 acres) and National Conservation Areas (665,503 acres not also included
as wilderness) totaling 2,720,508, to the State (which during 2012 would have totaled just over
45 million acres) in subsequent phases, Nevada might generate net revenues ranging between
$350,100,000 and $1,286,550,000 annually. It is important to note for perspective that New
Mexico generated $639,175,119 in net revenue in managing just 9 million acres of state trust
land during 2012. New Mexico is benefitting from the ongoing U.S. oil and gas boom, a
production trend which might spread to Nevada in the coming years.
Table 3. Estimated Net Revenue from Expanded State Land Ownership in Nevada Using
Four State Net Revenue Models
Net Revenue Per Acre
Value Applied1
Total Net Revenue
Assuming 7.2 Million
Acres of BLM Land
Transferred to Nevada
Total Net Revenue
Assuming 45,000,000
Acres of BLM Land
Transferred to
Nevada2
Four State Average Net
Revenue/Acre Model
$28.59
$205,848,000
$1,286,550,0003
Four State Low Observed
Net Revenue and High
Observed Expense/Acre
Model
$7.78
$56,016,000
$350,100,0003
1/ Four State Average from Table 10; Four State Low Observed Net Revenue and High Observed Expense is the
difference between Low Observed Revenue of $16.78 per acre and High Observed Expense of $9.00 per acre as
shown in Table 10.
2/ BLM administers approximately 48 million acres in Nevada, assumed 45 million acre transfer excludes estimated
acreages for designated wilderness, National Conservation Areas, National Monuments and other Congressionally
designated areas.
3/ While an expanded state land base in Nevada would likely contain mineralized areas and potential for fossil fuel
production, the likelihood that such resources would be located within most of the nearly 48 million acres now
administered by BLM is not great. As a consequence, a significant (yet admittedly unknown) portion of the public
lands in Nevada would not have the potential to generate net revenues of the magnitude observed for other states
considered in this study.
It is important to note that said state trust land management strategies are uniformly aimed at the
generation of net revenues on a long-term sustainable basis. It is also important that these
strategies are different than that employed by the Bureau of Land Management in managing the
11
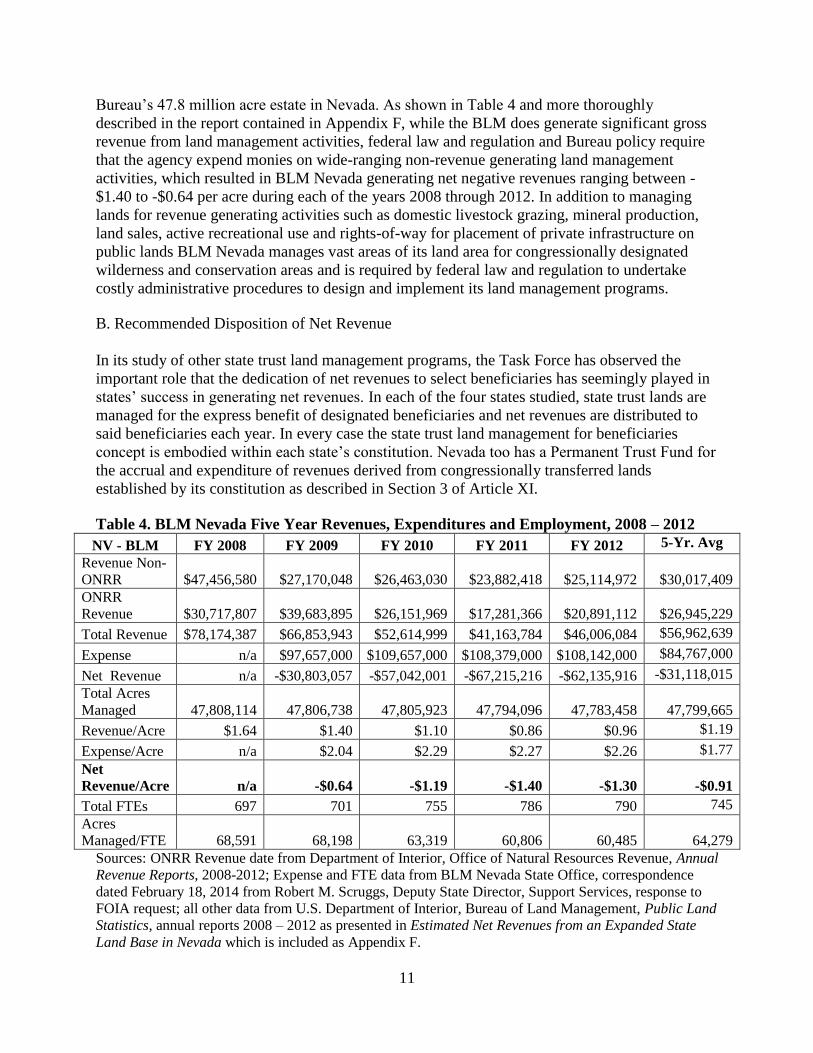
Bureau’s 47.8 million acre estate in Nevada. As shown in Table 4 and more thoroughly
described in the report contained in Appendix F, while the BLM does generate significant gross
revenue from land management activities, federal law and regulation and Bureau policy require
that the agency expend monies on wide-ranging non-revenue generating land management
activities, which resulted in BLM Nevada generating net negative revenues ranging between -
$1.40 to -$0.64 per acre during each of the years 2008 through 2012. In addition to managing
lands for revenue generating activities such as domestic livestock grazing, mineral production,
land sales, active recreational use and rights-of-way for placement of private infrastructure on
public lands BLM Nevada manages vast areas of its land area for congressionally designated
wilderness and conservation areas and is required by federal law and regulation to undertake
costly administrative procedures to design and implement its land management programs.
B. Recommended Disposition of Net Revenue
In its study of other state trust land management programs, the Task Force has observed the
important role that the dedication of net revenues to select beneficiaries has seemingly played in
states’ success in generating net revenues. In each of the four states studied, state trust lands are
managed for the express benefit of designated beneficiaries and net revenues are distributed to
said beneficiaries each year. In every case the state trust land management for beneficiaries
concept is embodied within each state’s constitution. Nevada too has a Permanent Trust Fund for
the accrual and expenditure of revenues derived from congressionally transferred lands
established by its constitution as described in Section 3 of Article XI.
Table 4. BLM Nevada Five Year Revenues, Expenditures and Employment, 2008 – 2012
NV - BLM FY 2008 FY 2009 FY 2010 FY 2011 FY 2012 5-Yr. Avg
Revenue Non-
ONRR $47,456,580 $27,170,048 $26,463,030 $23,882,418 $25,114,972
$30,017,409
ONRR
Revenue $30,717,807 $39,683,895 $26,151,969 $17,281,366 $20,891,112
$26,945,229
Total Revenue $78,174,387 $66,853,943 $52,614,999 $41,163,784 $46,006,084 $56,962,639
Expense n/a $97,657,000 $109,657,000 $108,379,000 $108,142,000 $84,767,000
Net Revenue n/a -$30,803,057 -$57,042,001 -$67,215,216 -$62,135,916 -$31,118,015
Total Acres
Managed 47,808,114 47,806,738 47,805,923 47,794,096 47,783,458
47,799,665
Revenue/Acre $1.64 $1.40 $1.10 $0.86 $0.96 $1.19
Expense/Acre n/a $2.04 $2.29 $2.27 $2.26 $1.77
Net
Revenue/Acre n/a -$0.64 -$1.19 -$1.40 -$1.30
-$0.91
Total FTEs 697 701 755 786 790 745
Acres
Managed/FTE 68,591 68,198 63,319 60,806 60,485 64,279
Sources: ONRR Revenue date from Department of Interior, Office of Natural Resources Revenue, Annual
Revenue Reports, 2008-2012; Expense and FTE data from BLM Nevada State Office, correspondence
dated February 18, 2014 from Robert M. Scruggs, Deputy State Director, Support Services, response to
FOIA request; all other data from U.S. Department of Interior, Bureau of Land Management, Public Land
Statistics, annual reports 2008 – 2012 as presented in Estimated Net Revenues from an Expanded State
Land Base in Nevada which is included as Appendix F.
12
Table 5 shows how net revenues derived by the State of New Mexico in managing state trust
lands (and interest earned on accrued net revenues) were distributed during 2012.The report in
Appendix F describes similar distribution schemes for the states of Arizona, Idaho and Utah. In
every case, funding of public education (K-12) is the most significant beneficiary in terms of
monies received. Other beneficiaries common among states include public higher education,
public medical institutions, public mental health services, and public correctional facilities. As
shown in Table 5, New Mexico also provides funding for water reservoirs from net state trust
land revenues.
To help insure that state trust lands are managed in a manner that generates net revenues, the
Task Force recommends that 1) the transferred lands will be held by the State of Nevada in trust
for select beneficiaries; 2) Phase I transferred lands will be managed for long-term net revenue
maximization; 3) lands transferred in subsequent phases will be managed for on-going net
revenue generation and environmental health, function, productivity and sustainability and 4)
the transferred lands will be managed by the State of Nevada in trust for the following
beneficiaries:
Public K-12 education
Public higher education
Public specialized education
Public mental and medical health services
Social, senior and veterans services
Public programs for candidate and listed threatened or endangered species recovery plan
development and implementation
local governments to pay for services and infrastructure required on these lands which would
otherwise be financed through property tax or other revenues available to local government
C. Land Transfer Costs
In response to Congressional action approving the transfer of public land to Nevada, the federal
government and the State of Nevada may incur costs associated with both conveyance and
recordation of the lands transferred. As described in more detail below, the language contained in
the Act resulting in the transfer of public land to Nevada can serve to both minimize ambiguity
about, and minimize the costs associated with, the land transfer process. A discussion of these
potential costs follows.
Federal Government – Unless specifically exempted from doing so by the land transfer
legislation, the federal government would typically be required to undertake the following steps
in conveying public land to the State of Nevada through a transfer:
1. Perform a Phase I Environmental Site Assessment to identify the presence or absence of any
hazardous substances on the subject property. Disposal of real property is any action in which the
United States conveys or otherwise disposes of real property. Prior to the disposal of any real
property, the BLM must determine the likelihood of hazardous substance, petroleum products, other
environmental contamination, solid waste issues, or physical hazards on the real property. (BLM
Manual H-2000-02, Environmental Site Assessments for Disposal of Real Property, August 2012;
p.19)

13
Table 5. Distribution of Net Revenue and Investment Income Derived From
New Mexico State Trust Lands: Selected Beneficiaries (2012)
Beneficiary Amount Received
Common Schools (K-12) $544,244,931
University of New Mexico $9,482,298
New Mexico State University $2,955,919
New Mexico Military Institute $1,558,074
Miner’s Hospital $7,401,699
Behavioral Institute $2,986,671
State Penitentiary $11,416,378
School for the Deaf $11,635,495
School for the Visually Impaired $11,613,393
Water Reservoirs $7,278,813
Source: 2011-2012 Annual Report, New Mexico State Land Office.
A Phase I Environmental Site Assessment consists of five basic components: (1) a review of
local, state, and federal government environmental records; (2) a review of historical sources
pertaining to past site uses and environmental issues; (3) interviews with owners, occupants, and
other individuals in regard to property history, property use, and environmental issues; (4) a site
reconnaissance to identify present and past uses and recognized environmental conditions, if
present; and (5) preparation of a written report describing the Phase I procedures, findings, and
conclusions. While legislation designed to transfer public land to the State of Nevada could
resolve the federal government of the requirement to complete environmental site assessment of
lands to be conveyed and thus reduce significantly the cost to the federal government of
processing said transfer, the State of Nevada would want to ensure that the liability for the costs
of cleaning up any contamination discovered on conveyed lands remained with the federal
government. Given that most, if not all lands which would be subject of transfer from the federal
government to Nevada are undeveloped, the risks of contamination from past use may be quite
low. In areas where the risks of contamination appear unacceptable, the Phase I Environmental
Assessment process could be undertaken at a cost per parcel which might range from between
$2,000 and $3,000 or more depending on the property (http://cre-expert.com/blog/archives/283).
2. Survey the property to enable a legal description of same to be included on a patent (deed)
document. A simple survey to establish the boundaries of a residential parcel can cost as much
as $900.00 (http://www.homeadvisor.com/cost/architects-and-engineers/hire-a-land-surveyor/).
The greater the size of the parcel; the more remote its location; the more rugged its terrain and
the more irregular its shape, the more costly will be the cost of surveying the site and developing
a legal description of same. Obviously, given the extant nature, remoteness and inaccessibility of
public land in Nevada which may be subject of transfer legislation, the cost of surveys to
establish legal descriptions of the land to be conveyed could be very significant. One means to
mitigate the cost of providing the necessary legal description of public land to be transferred
would be to limit to the maximum extent possible the transfer to those lands which have already
been surveyed by the BLM and /or are capable of being described on an aliquot parts basis.
Because the land is not being sold to the State, other requirements of the federal government
associated with disposal of land by sale would likely not apply to a transfer of public land such
as the following:
14
1. Publication of a Notice of Realty Action in the Federal Register.
2. Compliance with NEPA through preparation of an environmental assessment addressing the
proposed land transfer.
3. Completion of an appraisal of the property to be transferred to establish its Fair Market Value.
State of Nevada - Upon conveyance from the federal government, the State Land Registrar will
be required to include such lands in the record of all lands and interests in land held by the
Nevada Division of State Lands pursuant to NRS 321.001 and of all lands and interests in land
which have been sold by the Division. These records, together with all plats, papers and
documents relating to the business of the State Land Office, must be open to public inspection
during office hours at no charge. (NRS 321.040)
Pursuant to NRS 321.090 the State Land Registrar may select lands on behalf of the State of
Nevada in accordance with the terms of any grant authorized by the Congress of the United
States. Further, NRS 321.110 provides the following provisions regarding the acceptance of land
grants by the Governor or State Land Registrar:
1. Pursuant to the laws of the United States, when any lands are offered to the State of Nevada by
the United States Government or any department thereof, the Governor or the State Land
Registrar may accept the lands and the possession and title thereof in the name of the State of
Nevada and take all necessary steps to comply with any requirement and condition mentioned in
the offer.
2. The State of Nevada shall negotiate for the acquisition of any such lands obtained pursuant to
1 above as an unconditional grant by the United States Government to the State of Nevada
without any other considerations, and that if the State of Nevada is unable to acquire those lands
in the manner indicated, the Governor or the State Land Registrar may obtain those lands on the
best terms available.
The State Land Registrar will incur unspecified costs to include information regarding any public
land transferred to Nevada in the public records of the Registrar’s Office. Said information may
include conveyance documents in the form of patents or deeds; existing mining claims; grants for
existing land use authorizations such as right-of-way; and grazing permits, among others. In
addition, the State Land Registrar may be called upon to assist in the selection of lands to be
conveyed and the terms upon which said conveyance, unless specifically defined in federal
transfer legislation, shall be accomplished. The Division of State Lands land records
management function has a current annual budget of $155,000 annually and maintains records
for State Lands totaling nearly 196,000 acres (including 2,900 acres of original school trust
lands). Currently, the Division of State Lands appears to spend an estimated $1.26 per acre for
land records management.
The Task Force heard concerns from members of the Nevada Legislative Committee on Public
Lands that the management of lands transferred to the State of Nevada should, to the extent
practical not require monies from Nevada’s General Fund. The analysis of fiscal impacts
contained in Appendix E of this report demonstrates unequivocally that the management of lands
transferred to the State should be capable of generating revenues in excess of land management

15
costs. However, the issue of what monies will be required to manage transferred lands at the
point of transfer and where will said funds come from must be addressed. In keeping with a goal
for the management of transferred lands to be self-supporting, the Task Force has come up with
the following plan for financing start-up transferred land management costs. Elements of the plan
include:
No Nevada State General Fund expenditures to manage 7.2 million acres of Phase I
transferred lands
A portion of the 7.2 million acres of transferred lands to the State of Nevada to be
collateralized
Short to intermediate term debt to be incurred by State of Nevada for land management
start-up capital
The observed four-state, five-year average expense per acre of $3.73 (see Table 10 of
Appendix E of this report) can be assumed as the Year 1 land management cost per acre
for lands transferred to the State of Nevada
Estimated first year State of Nevada expense for management of 7.2 million acres is
estimated at $26,856,000
As soon as possible after patenting and recordation of the Phase I transferred land, the
sale of select parcels to generate start-up capital and repay debt would occur
A first year sale of up to 30,000 acres from among those lands previously identified for
disposal by BLM at an assumed $1,000/acre would yield $30 million plus other on-going
revenues (rents, royalties, fees, etc.) from the management of 7.2 million acres of
transferred land
Land sales in the Las Vegas Valley and Reno-Sparks areas would likely result in higher
values per acre
The Task Force believes that implementation of the aforementioned steps would result in the
availability of sufficient capital to cover Year 1 management costs of the 7.2 million acres
transferred during Phase 1 and that no Nevada State General Funds would be required to cover
said management costs. After Year 1, the Task Force believes, based upon the analyses included
in Appendix E of this report, that the management of the 7.2 million acres of Phase I transferred
lands would be self-supporting.
County Government – Documents conveying the transferred former federal land to the State of
Nevada will likely need to be recorded in the offices of the respective Nevada counties where the
transferred land is located. In addition, copies of existing land use authorizations for conveyed
lands within each county such as mining claims, right-of-way, and grazing permits, among others
may also need to be recorded or otherwise included in the official records maintained by each
county. County Fees for recording documents are generally established by Nevada Revised
Statute and run around $17.00 for the first page and $1.00 for each additional page. Fees for
recording mining documents tend to be in the range of $14.00 to $17.00 plus $4 to $8.50 per map
or claim. These fees are intended to reflect the cost of recording and represent the likely cost to
counties to record information regarding transferred lands in county information systems.
16
D. Revenue Sources for State Management of Transferred Lands
Ultimately, once conveyed with patents and other land use authorization documents recorded in
the records of the State of Nevada and her counties and as see in other states, revenues generated
from the management and disposition of the transferred lands should be sufficient to cover
administration and maintenance of transferred lands. However, on day one of a transfer, no
revenues will have yet been generated and expenses, such as those associated with recording
conveyance documents and related existing land use authorizations upon said transferred lands,
will be incurred. As a consequence, it will be necessary for Nevada to have established a budget
and provided funding to cover such costs until the transferred lands begin to generate revenues
from which such costs can be paid.
Conceptually, General Fund or other State of Nevada monies could be made available on a
temporary basis to jump-start the administration and management of transferred lands. As the
transferred lands begin to generate revenues these costs could be covered by gross land
management revenues. As the lands begin to produce net revenues as described in Section A
above, the General Fund or other State of Nevada monies utilized to cover initial land
administration and management costs could be repaid.
Alternatively, or following the initial use of and to minimize the need for State General Fund
monies, it may be possible to collateralize a portion of the transferred lands and for the State to
assume short to intermediate term debt to cover initial administrative and management costs.
Transferred lands that have been previously identified as suitable for disposal (and may be
among the highest value lands transferred to the State) could be used as collateral to secure short
term financing to cover initial administration and land management costs. Once sold, the debt
could be retired and excess funds from the land sale used to cover continuing costs of
administration and land management. This approach could be used until the administration and
management of remaining transferred lands becomes self supporting.
E. Land Management Related Revenue Distributed to State and Local Government in Nevada
While the Task Force has determined that the State of Nevada can generate significant net
revenues from select transferred lands, an important consideration regarding the feasibility of
such a transfer is the extent to which said net revenues would exceed or be offset by any loss in
revenue from federal land management activities which is currently shared with the State and her
counties. As shown in Table 5, significant funds are paid annually by the federal government
from land management activities to the State of Nevada and her counties. During the years 2008
through 2012, distribution of a portion of the revenues generated through primarily surface land
management activities by BLM in Nevada to the State of Nevada and local governments ranged
between $1,465,948 and $5,447,044 annually. During those same years, the Department of
Interior’s (DOI) Office of Natural Resources Revenue (ONRR) distributed a portion of revenues
generated primarily from subsurface management activities by BLM in Nevada to the State of
Nevada and local governments ranging between $9,794,788 and $28,744,481. Finally, during the
years 2008 through 2012, the Congress, exercising its discretion, authorized Payments In Lieu of
Taxes (PILT) to Nevada ranging from $22,610,017 to $23,917,845.

17
As shown in Table 6, during the period 2008 through 2012 the combined total of these sources of
federal payments to the State of Nevada and her counties has ranged between a low of $0.72 to a
high of $1.13 per acre of land managed by BLM in Nevada. In contrast, as described in Section
A. above, the Task Force has determined that Nevada could achieve net land management
revenues ranging between $7.78 and $28.59 per transferred acre managed. Assuming all BLM
land in Nevada was transferred to the State and federal revenue sharing were to cease, the gain in
net revenue per acre to the State would be on the order of $7.06 to $27.46 per acre. Given that it
is not likely that all federal land in Nevada would transferred to the State, a component of federal
revenue sharing would likely continue as it does in neighboring states with much higher acreages
of state trust land and much lower percentages of federally administered land.
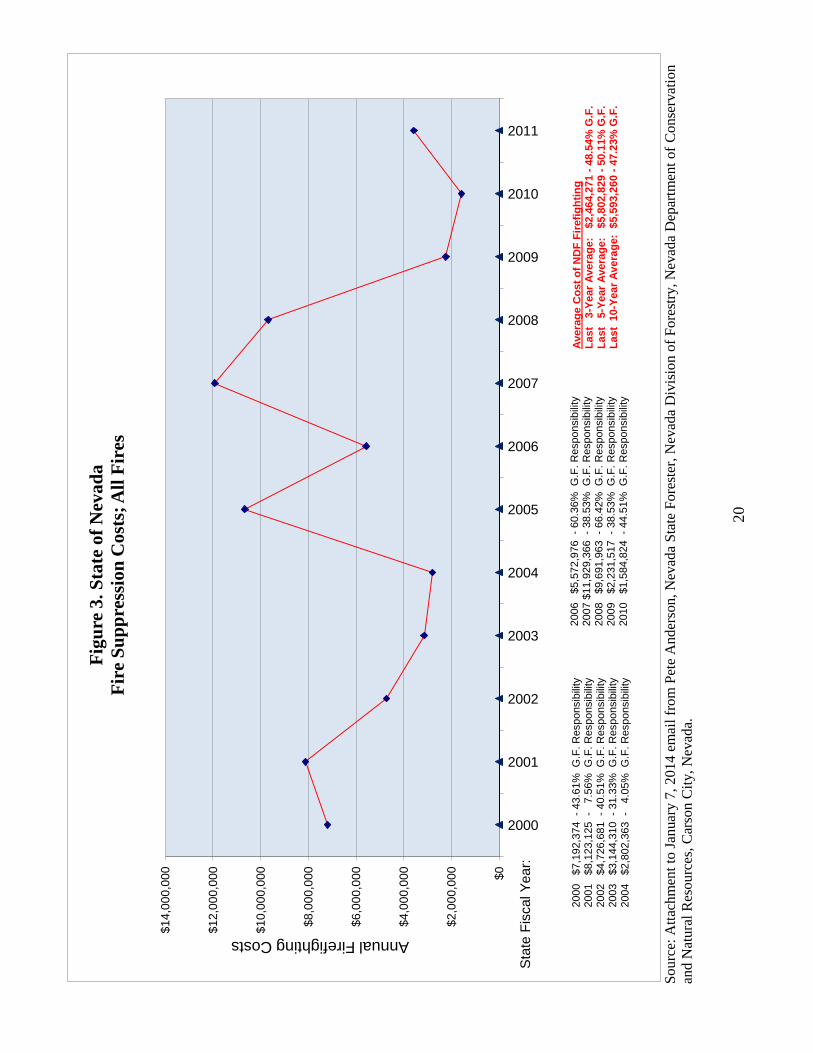
F. Fire Suppression
The Task Force acknowledges concerns over the extent to which wildfire suppression costs may
challenge the ability of the State of Nevada to adequately protect an expanded state land area and
simultaneously generate net revenues for the benefit of trust beneficiaries. To date, the Task
Force has been unable to assemble and analyze recent BLM and other-state fire suppression cost
data across the four-state region considered in assessing the financial feasibility of a
congressional transfer of federally administered land to the State of Nevada. For Nevada, Mr.
Pete Anderson, Nevada State Forester provided historical data on the number, size and costs
incurred by the Nevada Division of Forestry (NDF) in suppressing wildland fires for the years
2000 through 2011 (see Table 7 and Figure 1). As shown in Table 6, the number and size of
fires on private and state land responded to by the Nevada Division of Forestry in Nevada has
increased over the past six years. During the six-year period of 2008 through 2013, the average
annual number of fires was 65 and the average annual size of fires was 585 acres and the annual
average acreage burned was18,953.
According to Mr. Anderson, the vast majority of NDF’s fire response are to fires on federal land
both in-state and out of state. NDF provides initial and extended attack on federal land statewide
via individuals, hand crews, engines, kitchens and helicopters. NDF bills the responsible federal
jurisdiction for its fire suppression services. In turn, the federal agencies (typically BLM and
U.S. Forest Service) bill NDF when they send their resources to fires on private and state land in
Nevada. Mr. Anderson noted that states currently rely on the federal agencies providing the air
tankers, helicopters, Incident Management Teams and other “expensive” components of wildfire
suppression. This is true for Nevada and in western states with significantly less federal land and
more state land than Nevada. Mr. Anderson expressed concern that a reduction in federal lands
due to transfers to the State of Nevada might result in cutbacks of equipment and personnel
currently fully funded by the government. In that case, Mr. Anderson noted that the State of
Nevada may face shortages of critical resources when wildfire activity is high as the federal
government would be focusing on its lands. As a consequence, there may be a need to expand
the State of Nevada’s prevention-preparedness-suppression-rehabilitation capabilities over time.3
3 Email from Mr. Pete Anderson, Nevada State Forester, July 17, 2014.

18
Tab
le 6
. B
ure
au
of
Lan
d M
an
agem
ent
Nev
ad
a, D
epart
men
t of
Inte
rior
Off
ice
of
Natu
ral
Res
ou
rces
Rev
enu
e
an
d P
aym
ent
In-L
ieu
of
Taxes
Rev
enu
e D
istr
ibu
tion
to N
evad
a S
tate
an
d L
oca
l G
over
nm
ents
Rev
enu
e S
ou
rce
2008
2009
20
10
20
11
20
12
BL
M N
V R
even
ue
Dis
t. to N
V S
tate
/Loca
l G
ovt.
$5,4
47,0
44
$2,1
36,8
62
$2
,56
0,6
35
$1
,46
5,9
48
$1
,72
5,9
63
DO
I O
NR
R R
even
ue
Dis
t. to N
V S
tate
/Loca
l G
ovt.
$17,6
22,1
48
$28,7
44,4
81
$1
7,0
59
,292
$9
,79
4,7
88
$1
1,7
85
,382
PIL
T P
aym
ent to
Nev
ada
$22,6
10,0
17
$23,2
69,3
50
$2
2,7
53
,204
$2
2,9
42
,298
$2
3,9
17
,845
Tota
l B
LM
NV
/ON
RR
/PIL
T R
even
ue
Dis
t. T
o N
V S
tate
/Loca
l
Govt.
$45,6
79,2
09
$54,1
50,6
93
$4
2,3
73
,131
$3
4,2
03
,034
$3
7,4
29
,190
Tota
l A
cres
Man
aged
by B
LM
in N
evad
a 47,8
08,1
14
47,8
06,7
38
47,8
05,9
23
47,7
94,0
96
47,7
83,4
58
Tota
l R
even
ue
Dis
t. to N
V S
tate
/Lo
cal
Govt.
/Acr
e M
anag
ed
$0.9
6
$1.1
3
$0.8
7
$0.7
2
$0.7
8
Sourc
es:
BL
M N
V R
even
ue,
PIL
T a
nd A
cres
Man
aged
dat
a fr
om
U.S
. D
epar
tmen
t of
Inte
rior,
Bu
reau
of
Lan
d M
anag
emen
t, P
ubli
c
Land S
tati
stic
s, a
nnual
rep
ort
s 2008 –
2012;
ON
RR
Rev
enue
dat
e fr
om
Dep
artm
ent
of
Inte
rior,
Off
ice
of
Nat
ura
l R
esourc
es R
even
ue,
Annual
Rev
enu
e R
eport
s, 2
008
-2012.
T
ab
le 7
. N
um
ber
an
d A
crea
ge
Bu
rned
for
Fir
es o
n P
rivate
an
d S
tate
Lan
d R
esp
on
ded
to
b
y t
he
Nev
ad
a D
ivis
ion
of
Fore
stry
, 2008
-201
3
Yea
r
Nu
mb
er
of
Fir
es
Tota
l A
crea
ge
Bu
rned
2008
34
26
2009
47
886
2010
52
2,5
39
2011
74
118,8
06
2012
90
53,2
97
2013
92
51,8
86
S
ourc
e: J
anuar
y 7
, 2014 e
mai
l fr
om
Pet
e A
nder
son, N
evad
a S
tate
Fore
ster
,
N
evad
a D
ivis
ion o
f F
ore
stry
, N
evad
a D
epar
tmen
t of
Conse
rvat
ion
an
d
N
atura
l R
esourc
es,
Car
son C
ity,
Nev
ada.

19
Federal Emergency Management Agency (FEMA) Fire Management Assistance grants are
available to Nevada and its local and tribal governments, for the mitigation, management, and
control of fires on publicly or privately owned forests or grasslands, which threaten such
destruction as would constitute a major disaster. The Fire Management Assistance Grant
(FMAG) provides a 75 percent Federal cost share and the State pays the remaining 25 percent for
actual costs. Eligible firefighting costs may include expenses for field camps; equipment use,
repair and replacement; tools, materials and supplies; and mobilization and demobilization
activities. The availability of FMAG grants would serve to mitigate possible increased costs
associated with wildland fires on an expanded State of Nevada land base. However, according to
Mr. Anderson, the criteria for FMAG award has been tightened significantly. He noted further
that unless there are numerous structures and infrastructure directly threatened with imminent
destruction it is now next to impossible to get an FMAG4.
As shown in Figure 3, the annual cost incurred by NDF in suppressing wildfires on private, state
and federal land in all locations (including many outside the State of Nevada) during the period
2000 through 2011 averaged $5,593,260 of which $2,641,697 or 47.23 percent was funded by
Nevada General Fund monies and the balance of $2,951,563 or 52.77 percent was funded by
other non-state sources, primarily the federal government. Given an average annual 18,953 acres
have burned and an average annual General Fund expense for fire suppression of $2,641,697, the
twelve – year average NDF State-funded cost per acre for fire suppression in Nevada was
$139.38 per acre burned.
Currently, the State of Nevada contains approximately 8.8 million acres of private and state land
of which an estimated 500,000 to 550,000 acres are located within urban areas not typically
subject to NDF wildfire suppression (for example the metropolitan Las Vegas valley contains
approximately 384,000 acres; the metropolitan Reno-Sparks area contains approximately 90,880
acres and the City of Elko contains approximately 10,000 acres). Considering that annual NDF
state-funded wildfire suppression costs averaged $2,641,697 over the twelve-year period 2000
through 2012, the state cost per non-urban private and state acre in Nevada averaged $.32 per
acre. The nonmetropolitan/urban area of private and state land in Nevada would be increased by
an estimated 87 percent from 8.3 million acres to an estimated 15.5 million acres if a
congressional transfer of 7.2 million acres to the State of Nevada were to occur. At $.32 per acre,
it is estimated that the addition of 7.2 million acres to the State of Nevada’s land portfolio might,
on average, add an additional $2,304,000 per year in wildland fire suppression costs.
A 1996 study completed for the Board of Eureka County Commissioners identified the potential
impacts of fire suppression costs and ways to manage costs in the event the State of Nevada
secured an expanded State land base. The study found that while total BLM fire costs in Nevada
appear to range between $212 and $264 per acre, fire suppression costs of the State of Nevada
ranged between $30 and $80 per acre during the period 1990 through 1994. The average size of
fires responded to by the State of Nevada ranged from 2 to 111 and averaged approximately 32
acres over the four-year period. During the period of 1990 through 1993, fires on BLM managed
land averaged 78 acres in size. The 1996 study further concluded that under conditions of an
assumed transfer of public land to the State of Nevada, expectations of fire suppression costs
4 Email from Mr. Pete Anderson, Nevada State Forester, July, 17, 2014.
20
S
ourc
e: A
ttac
hm
ent
to J
anuar
y 7
, 2
01
4 e
mai
l fr
om
Pet
e A
nder
son,
Nev
ada
Sta
te F
ore
ster
, N
evad
a D
ivis
ion
of
Fo
rest
ry,
Nev
ada
Dep
artm
ent
of
Co
nse
rvat
ion
and N
atura
l R
esourc
es, C
arso
n C
ity, N
evad
a.
$0
$2
,00
0,0
00
$4
,00
0,0
00
$6
,00
0,0
00
$8
,00
0,0
00
$1
0,0
00
,00
0
$1
2,0
00
,00
0
$1
4,0
00
,00
0
2000
2001
2002
2003
2004
2005
2006
2007
2008
2009
2010
2011
Annual Firefighting Costs
Sta
te F
iscal Y
ear:
Fig
ure
3. S
tate
of
Nev
ad
a
Fir
e S
up
pre
ssio
n C
ost
s; A
ll F
ires
2000 $
7,1
92,3
74
- 43.6
1%
G
.F. R
esponsib
ility
2001 $
8,1
23,1
25
- 7.5
6%
G
.F. R
esponsib
ility
2002 $
4,7
26,6
81
- 40.5
1%
G
.F. R
esponsib
ility
2003 $
3,1
44,3
10 -
31.3
3%
G
.F. R
esponsib
ility
2004 $
2,8
02,3
63
- 4.0
5%
G
.F. R
esponsib
ility
2006 $
5,5
72,9
76
- 60.3
6%
G
.F. R
esponsib
ility
2007 $
11,9
29,3
66
- 38.5
3%
G
.F. R
esponsib
ility
2008 $
9,6
91,9
63
- 66.4
2%
G
.F. R
esponsib
ility
2009 $
2,2
31,5
17
- 38.5
3%
G
.F. R
esponsib
ility
2010 $
1,5
84,8
24
- 44.5
1%
G
.F. R
esponsib
ility
Avera
ge
Co
st
of
ND
F F
irefi
gh
tin
g
La
st
3
-Year
Avera
ge
: $2,4
64,2
71 -
48.5
4%
G.F
. L
ast
5
-Year
Avera
ge
: $5,8
02,8
29 -
50.1
1%
G.F
. L
ast
10
-Year
Avera
ge
: $
5,5
93,2
60 -
47.2
3%
G.F
.
21
would be for significantly lower total expenditures than has been true for BLM. The complete
Fire Suppression section including data tables from the 1996 report are included in Appendix G.
IV. Identification of Public Lands to be Transferred to the State of Nevada
A. Land Transfer Should be Completed in Phases
Because Nevada currently only holds and manages less than 200,000 acres, of which
approximately 2,900 acres are State Trust Lands, the Task Force recognizes that fiscal and
staffing considerations suggest that the State would be well served to accept transferred federal
lands in phases. The Task Force further believes that any phasing strategy must be focused in the
beginning on lands which offer immediate revenue generating potential so as to enable the State
early access to monies from which an expanded State Trust land management capacity can be
established with minimal impact upon the State General Fund .
B. Land to be Transferred During Phase I
During its various meetings, the Task Force considered a variety of options regarding what
federal lands might be considered for transfer to the State of Nevada. Discussions of which lands
to be transferred were initially framed by defining those federal lands which should be excluded
from any transfer. Consideration of which lands to exclude from transfer was focused in part by
a need to maintain the integrity of environmentally sensitive and culturally important areas
designated by Congress for special management such as wilderness, national parks, national
monuments, national recreation areas, national wildlife refuges, national conservation areas,
federally recognized Indian reservations and other lands administered by the Bureau of Indian
Affairs and land designated by the Bureau of Land Management as Areas of Critical
Environmental Concern to protect the Desert Tortoise. Ultimately, it was determined that these
areas should be excluded from any transfer to the State of Nevada.
The importance of federal military installations and federal energy research and development
areas to the national security and Nevada’s economy were also recognized. To ensure the
continued availability of these areas to support the national defense and contribute to Nevada’s
economy, existing active Department of Defense and Department of Energy land installations
and related land areas were identified for exclusion from any transfer to the State of Nevada.
Another issue framing the identification of which lands to be transferred considered the ability of
Nevada to establish and maintain an expanded land management capacity in a manner which
does not adversely impact other existing state operations and funding. The concept of self-
funding of an expanded state land management function was embraced by the Task Force as a
goal. Consequently, two key objectives were identified including 1) phasing of a federal to state
land transfer to enable absorption of an expanded land management function in a fiscally neutral
and sustainable manner and 2) selection of lands for transfer during Phase I having immediate
potential for collateralization, minimal management costs and generation of net revenues in a
short term. The ability to generate revenues in the short term led to the inclusion below in federal
lands identified for transfer in Phase I of lands previously identified by BLM or local
governments as suitable for disposal and/or development potential.
22
The Task Force applied these framing considerations and has identified the following public
lands in Nevada for inclusion in a proposed Phase I land transfer:
BLM administered parcels of land remaining within the original Central Pacific Railroad
corridor along Interstate 80 in Northern Nevada (BLM Checkerboard)
Lands identified by BLM as suitable for disposal or currently moving forward in planning
documents for federal land use plans that have not yet been disposed of (Identified by BLM
as Suitable for Disposal)
BLM lands under existing Recreation & Public Purposes (R&PP) Act lease (Existing BLM
R&PP Leases)
BLM lands authorized under Rights-of-Way granted to the State and local governments and
non-linear Rights-of-Way granted to private parties (Existing BLM ROW Grants)
BLM held subsurface estate where the surface estate is privately held (BLM Split Estate)
BLM lands designated by the Secretary of the Interior as Solar Energy Zones (BLM
Designated Solar Energy Zones)
BLM lands leased for geothermal exploration and utilization ( BLM Geothermal Leases)
BLM lands authorized for disposal within enacted and introduced federal legislation
(Enacted and Proposed Congressional Transfers of BLM Land)
Table 8 lists the estimated acreage for each of the identified classes of public land identified for
transfer during Phase I.
BLM Checkerboard -The Task Force has determined that one of the issues which confounds the
economy of Nevada and can serve to impede conservation objectives of land management is the
split nature of ownership rights associated with the federal estate in Nevada. When the federal
government administers lands intermingled with parcels of private land, issues surrounding
access, water rights and water use, and grazing management can be confounded on both public
and private lands involved. Nowhere in Nevada is this issue of complexity of surface land
management more apparent than within the area known as the BLM administered land remaining
within the original Central Pacific Railroad corridor along Interstate 80 in Northern Nevada,
otherwise known as the “checkerboard”.
The Task Force believes that if transferred to the State of Nevada, the BLM administered
checkerboard parcels represent the opportunity for the State of Nevada to undertake immediate
action to sell certain of these lands and/or to exchange them with private land owners to both
increase the management viability and revenue generation potential of the lands and to increase
the value of the resulting State Trust Land portfolio. It is estimated that BLM administered
checkerboard parcels of land total approximately 4,230.600 acres (see Figure 4). The Task Force
recommends that these lands be transferred to Nevada during Phase I.
Identified by BLM as Suitable for Disposal - BLM is authorized through various laws to identify
and dispose of public land. Sec. 203 of the Federal Land Policy and Management Act (FLPMA)
authorizes the Secretary of Interior to sell a tract of the public land (except land in units of the
National Wilderness Preservation System, National Wild and Scenic Rivers Systems, and
National System of Trails) where, as a result of BLM land use planning, the Secretary
determines that the sale of such tract meets certain disposal criteria which include:

23
Table 8. Lands Identified for Transfer from the Federal Government to Nevada During
Phase I
Description Estimated Acreage
BLM Checkerboard 4,230,600
Identified by BLM as Suitable for Disposal 1,000,000
Existing BLM R&PP Leases 200,000
Existing BLM ROW Grants 255,000
BLM Split Estate 300,000
BLM Designated Solar Energy Zones 60,395
Existing BLM Geothermal Leases 1,045,079
Approved and Proposed Congressional
Transfers of BLM Land
250,000
Total Estimated Phase I Acreage 7,281,074
Sources: Spilt Estate: http://www.blm.gov/wo/st/en/info/About_BLM/subsurface.html;
Geothermal Leases: As of 9/30/12; Department of Interior, BLM, Public Land Statistics, Volume
197, Tables 3-13 and 3-14, June 2013; SNPLMA; 29,284 remaining as of 9/30/13;
http://www.blm.gov/pgdata/etc/medialib/blm/nv/field_offices/las_vegas_field_office/snplma/pdf
/reports.Par.12274.File.dat/PROGRAM%20STATISTICS%20Thru%20%20September%202013
(1) such tract because of its location or other characteristics is difficult and uneconomic to
man-age as part of the public lands, and is not suitable for management by another Federal
department or agency; or
(2) such tract was acquired for a specific purpose and the tract is no longer required for that
or any other Federal purpose; or
(3) disposal of such tract will serve important public objectives, including but not limited to,
expansion of communities and economic development, which cannot be achieved prudently or
feasibly on land other than public land and which outweigh other public objectives and values,
including, but not limited to, recreation and scenic values, which would be served by
maintaining such tract in Federal ownership.
BLM typically identifies and evaluates parcels of public land as potentially suitable for disposal
during their periodic land use planning activities. In a draft 1999 document, the Nevada Division
of State Lands determined that various BLM land use plans in Nevada had identified 1,112,419
acres of public land as suitable for disposal. (Nevada Division of State Lands, BLM Lands
Identified for Disposal, March 19, 1999). Largely due to focus and spending on other land
management priorities, during the past 15 years very little of the land identified by BLM for
disposal in Nevada has been processed for sale and sold.
More recently, BLM Districts in Nevada have or are in the process of updating their land use
plans. For example the Ely Resource Management Plan, which was adopted in August 2008,
identifies 75,582 acres of public land in the Ely District as suitable for disposal. This is down
from the 90,008 acres identified in the previous land use documents upon which the Division of
State Lands based its 1999 estimate. Resource Management Plan updates are being prepared for
most other BLM districts in Nevada and updated estimates of lands identified as suitable for

24
F
igu
re 4
. B
LM
Ch
eck
erb
oard
Lan
d
25
disposal are not yet available for most BLM districts in the state. The Task Force is
recommending that all lands previously identified as suitable for disposal in BLM land use plans
or currently moving forward in planning documents for federal land use plans but not yet
disposed of (estimated to be 1,000,000 acres) be transferred to the State of Nevada during Phase
I.
Existing BLM R&PP Leases - The Recreation and Public Purposes Act of 1954 (R&PP)
authorizes the sale or lease of public lands by BLM for recreational or public purposes to State
and local governments and to qualified nonprofit organizations. Applications are made to BLM
for R&PP sites and upon approval are leased to the applicant until such time as the property is
fully improved to reflect its intended public purpose. At that time, BLM can sell the land which
subject of the R&PP lease to the lease. Unfortunately, the Task Force learned during its
deliberations that requests to obtain patent to R&PP land have taken many years to process and
many thousands of acres of leases are now occupied by fully developed public facilities.
During his December 6, 2013 presentation to the Task Force Mr. Scott Higginson, representing
various local government entities in Clark County, cited examples of public facilities located on
public land under BLM issued R&PP leases which said local governmental entities would like to
see included in the Task Force proposal for transfer as including flood control detention basins;
fire stations; police stations and training facilities; public schools; public parks; community
centers; trail heads and related facilities; reservoirs and pumping stations and the Spring
Mountain Youth Camp. Mr. Higginson noted that these local governments held R&PP leases
totaled approximately 15,880 acres. Clark County has previously approached Nevada’s
congressional delegation about seeking legislation transferring the land which is covered by
these R&PP leased lands from the BLM to the County. While it is known that the State of
Nevada and many, if not all, Nevada counties hold BLM issued R&PP leases, the total acreage
of this class of land use authorizations is not known. Recognizing that Clark County holds
approximately 15,880 acres of R&PP leases, and the State of Nevada and other local
governments in Nevada each likely hold R&PP leases, it is estimated that the total acreage of
such leases to the State and local governments in Nevada may exceed 200,000 acres. Because the
terms of existing BLM issued R&PP leases can restrict a holder from making any changes in the
land use subject to said authorization without additional processing time and expense, the Task
Force recommends that all lands under existing R&PP leases held by the State of Nevada and her
local governments be transferred to the State of Nevada during Phase I. Transferred lands under
R&PP lease held by local governments would in turn be transferred by the State of Nevada to
said local governments at no cost.
Existing BLM ROW Grants - In addition, pursuant to FLPMA, BLM is authorized to grant
rights-of-way to State and local governments and to qualified nonprofit organizations for various
public facility and infrastructure needs. These tend to be, but are not limited to linear in nature.
In testimony before the Task Force, a representative of Clark County reported that it held BLM
issued rights-of-way totaling 17,000 acres. While it is known that the State of Nevada and many,
if not all, Nevada counties hold BLM issued rights-of-way grants, the total acreage of this class
of land use authorizations is not known.

26
BLM is also authorized to grant rights-of-way to private parties and industry for various
economic uses of the public land. Examples include sites for coal, natural gas, wind, solar and
geothermal power plants and telecommunications sites. These rights-of-way tend to be non-
linear in nature and host industrial facilities. It is not known how many acres of such non-linear
rights-of-way have been granted by BLM and exist within Nevada but an estimate of 5,000 acres
is used in this report.
Given that rights-of-way include those for roads owned by the State of Nevada and local
governments, it is estimated that the acreage of this class of land to be transferred likely exceeds
250,000 acres statewide. For example, the right-of-way for U.S. Highway 93 is in most places is
400’ wide and the highway stretches 500 miles across Nevada for an estimated total of 24,259
acres. Combined, it is possible that State of Nevada and local government held BLM issued
R&PP leases and rights-of-way total in excess of 450,000 acres. Because the terms of existing
BLM issued rights-of-way can restrict a holder from making any changes in the land use subject
to said authorization without additional processing time and expense, the Task Force
recommends that all lands under existing BLM granted rights-of-way held by the State of
Nevada and her local governments and all lands under existing BLM granted non-linear rights-
of-way held by private entities be transferred to the State of Nevada during Phase I.
BLM Split Estate - Where the federal government administers the surface and the subsurface,
decisions regarding land use authorizations can take inordinate amounts of time to be processed;
are subject to multiple layers of decision-making and can pose a financial burden to those
requesting said authorizations. In many cases, while the land surface is privately owned, the
federal government has retained the subsurface estate placing private surface land use and
investment at risk. Finally, the Task Force intends that all valid existing land use authorizations
be continued on all public land transferred to the State of Nevada. In some cases, BLM may hold
surface and/or groundwater rights which are appurtenant to valid existing land uses on public
land identified for transfer to the State of Nevada. Transfer of said land without transfer of the
water rights supporting valid existing authorized land uses would confound the ability of the
State of Nevada to recognize and honor said valid existing authorized land uses. Accordingly, the
Task Force recommends that for all transferred lands the following rights will be transferred
from the federal government to the State of Nevada:
Surface estate
Subsurface estate
Federally held water rights appurtenant to transferred lands
BLM Designated Solar Energy Zones – Following a three-year planning process, the Secretary
of Interior designated Solar Energy Zones on BLM administered land in Arizona, California,
Colorado, Nevada, New Mexico and Utah. Designation of the 17 SEZs was intended by the
Secretary to spur development of solar energy on public lands in these six western states. Within
Nevada, five SEZs were established totaling 60,395 acres. Figure 2 shows the locations of the
SEZs in Nevada. While establishment of the SEZs was intended by BLM to incentivize and
speed development of solar energy projects within each area, a failure by BLM to complete
regulations governing competitive leasing of sites within SEZs coupled with continuing
requirements to comply with the National Environmental Policy Act (NEPA) and related
development and implementation of regional solar mitigation strategies for projects within SEZs

27
challenges the competitiveness of said areas as alternatives for which investment by solar
industry will occur. As a consequence, the State of Nevada and her local governments may miss
out on the economic and fiscal benefits associated with industry investments in solar energy
projects. If given the opportunity, the Task Force believes that the State of Nevada, in
consultation with her counties, can attract and permit the development of solar energy projects
within SEZs in a manner which will attract investment in solar energy projects to Nevada. As a
consequence, the Task Force recommends that designated Solar Energy Zones on BLM
administered land in Nevada be transferred to the State of Nevada during Phase I.
Existing BLM Geothermal Leases – As noted by the Nevada Division of Minerals, Nevada’s
geothermal resources are utilized in three major ways. The geothermal resources are used to
generate electricity, for space heating, and commercial applications.
Nevada’s geothermal electrical generation plants are located predominantly in the northern
portion of the State. Currently, Nevada has 586 megawatts of nameplate generating capacity
from 22 operating geothermal plants, at 14 different locations. Nevada’s geothermal plants can
theoretically generate up to 539 megawatts of power collectively in any given hour. A megawatt
is 1,000 kilowatts, which is enough electrical power to serve over 300 typical households. The
2013 gross electrical output for Nevada’s 22 geothermal plants was 3,433,903.5 MWh, with net
output (sales) being 2,588,629.0 MWh. Nevada’s electrical generation capacity from its
geothermal plants is second only to California.
Geothermal energy is also used to heat homes and businesses in numerous Nevada locations. The
cities of Elko and Caliente have small heating districts that are approved by the Public Utility
Commission to provide heat for buildings. A private heating district provides heat to homes in
southwest Reno. Domestic geothermal heating systems utilizing an anomalous heat source
provide heat to individual residences and ranches. Heat pump and ground source heat systems
that do not utilize an anomalous heat source are not considered geothermal systems in Nevada.
Geothermal resources can be used to assist processing in both agricultural and mining operations.
In the case of agriculture, heat from geothermal fluids is used in the dehydration process of
vegetables. In mining, geothermal fluids have been used to assist in the separation of gold from
associated ore. (http://minerals.state.nv.us/ogg_nvgeorespro.htm)
Of the 22 operating geothermal energy plants in Nevada, 13 are located on lands administered by
the BLM. Collectively, these 13 plants generate nearly 382 of the 539 megawatts (or 71 percent)
of generating capacity in Nevada. BLM administered lands in Nevada play an important role in
providing sites geothermal utilization projects. As of September 30, 2012, BLM in Nevada had
701 geothermal leases in place covering 1,045,079 acres. With only 13 operating plants out of
700 plus leases, the potential for enhanced geothermal energy production on BLM administered
land appears excellent. Unfortunately, the federal statutory and regulatory framework which
BLM must apply encourages a process which can be uncertain, costly and quite extended. This
permitting environment can discourage investment in geothermal projects. If given the
opportunity, the Task Force believes that the State of Nevada, in consultation with her counties,
can attract and permit the development of geothermal energy projects within existing geothermal
lease areas in a manner which will attract heightened investment in geothermal energy projects to

28
Nevada. As a consequence, the Task Force recommends that all existing land under existing
BLM geothermal lease be transferred to the State of Nevada during Phase I.
Approved and Proposed Congressional Transfers of BLM Land – The BLM has been authorized
to dispose of land in Nevada through various special acts of Congress. Included are the Mesquite
Land Act (MLA) (PL 99-548),Southern Nevada Public Land Management Act (SNPLMA) (PL
105-263), the Lincoln County Land Act (LCLA) (PL 106-298), the Lincoln County
Conservation, Recreation and Development Act (LCCRDA) (PL 108-424) and the White Pine
County Conservation, Recreation and Development Act (WPCCRDA) (PL 109-432). Table 9
shows the acreage authorized for sale, the acres actually sold and remaining acres to be sold for
each act.
Upon passage of amendments to LCLA which were contained in LCCRDA which effectively,
resolved NEPA compliance issues and required the sale of 13,466 acres within 75 days, the BLM
sold the subject land expeditiously. Unfortunately, the Bureau’s progress in processing land sales
authorized pursuant to LCCRDA and WPCCRDA has been less fruitful. The Task Force believes
that if provided the opportunity, the State of Nevada in consultation with local governments can
efficiently and in a more timely manner process the sale of lands authorized by SNPLMA,
LCLA, LCCRDA and WPCCRDA resulting in land sale revenues accruing to the State and the
addition of sold lands to county tax rolls. Accordingly, the Task Force recommends that the
lands authorized for disposal pursuant to MLA, SNPLMA, LCLA, LCCRDA and WPCCRDA
be transferred to the State of Nevada during Phase I.
Table 9. Status of Land Acts in Nevada
Abbreviated Title of
Act
Acres Authorized for
Disposal
Acres Disposed
Acres Remaining to
be Disposed
MLA 15,460 10,400 5,060
SNPLMA 74,000 44,716 29,284
LCLA 13,300 13,466 0
LCCRDA 90,000 66 89,934
WPCCRDA 45,000 2.5 44,997.5
Sources: SNPLMA,
http://www.blm.gov/pgdata/etc/medialib/blm/nv/field_offices/las_vegas_field_office/snplma/pdf
/reports.Par.12274.File.dat/PROGRAM%20STATISTICS%20Thru%20%20September%202013
.pdf; LCLA, http://www.blm.gov/wo/st/en/prog/more/lands/land_tenure/sale.print.html
LCCRDA and WPCCRDA via April 28, 2014 email from Carol Bass, BLM Ely District Office;
MLA, email from Aaron Baker of the City of Mesquite dated 6/28/14.
In addition to special federal land sale legislation already enacted into law, there are bills
pending before the Congress which also authorize the sale or transfer of public land in Nevada.
They include:
HR 1168; 1,400 acres of BLM administered land within the City of Carlin (Amodei)
HR 1167; all acres of BLM surface estate in Storey County (Amodei)
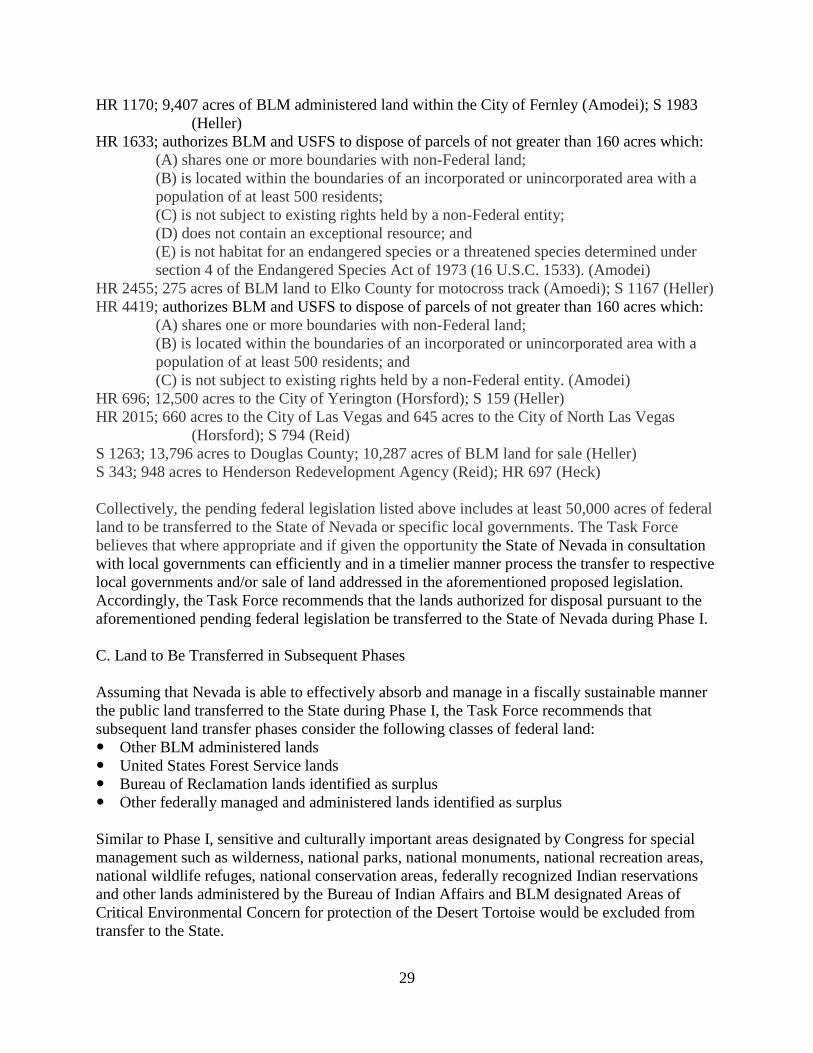
29
HR 1170; 9,407 acres of BLM administered land within the City of Fernley (Amodei); S 1983
(Heller)
HR 1633; authorizes BLM and USFS to dispose of parcels of not greater than 160 acres which:
(A) shares one or more boundaries with non-Federal land;
(B) is located within the boundaries of an incorporated or unincorporated area with a
population of at least 500 residents;
(C) is not subject to existing rights held by a non-Federal entity;
(D) does not contain an exceptional resource; and
(E) is not habitat for an endangered species or a threatened species determined under
section 4 of the Endangered Species Act of 1973 (16 U.S.C. 1533). (Amodei)
HR 2455; 275 acres of BLM land to Elko County for motocross track (Amoedi); S 1167 (Heller)
HR 4419; authorizes BLM and USFS to dispose of parcels of not greater than 160 acres which:
(A) shares one or more boundaries with non-Federal land;
(B) is located within the boundaries of an incorporated or unincorporated area with a
population of at least 500 residents; and
(C) is not subject to existing rights held by a non-Federal entity. (Amodei)
HR 696; 12,500 acres to the City of Yerington (Horsford); S 159 (Heller)
HR 2015; 660 acres to the City of Las Vegas and 645 acres to the City of North Las Vegas
(Horsford); S 794 (Reid)
S 1263; 13,796 acres to Douglas County; 10,287 acres of BLM land for sale (Heller)
S 343; 948 acres to Henderson Redevelopment Agency (Reid); HR 697 (Heck)
Collectively, the pending federal legislation listed above includes at least 50,000 acres of federal
land to be transferred to the State of Nevada or specific local governments. The Task Force
believes that where appropriate and if given the opportunity the State of Nevada in consultation
with local governments can efficiently and in a timelier manner process the transfer to respective
local governments and/or sale of land addressed in the aforementioned proposed legislation.
Accordingly, the Task Force recommends that the lands authorized for disposal pursuant to the
aforementioned pending federal legislation be transferred to the State of Nevada during Phase I.
C. Land to Be Transferred in Subsequent Phases
Assuming that Nevada is able to effectively absorb and manage in a fiscally sustainable manner
the public land transferred to the State during Phase I, the Task Force recommends that
subsequent land transfer phases consider the following classes of federal land:
Other BLM administered lands
United States Forest Service lands
Bureau of Reclamation lands identified as surplus
Other federally managed and administered lands identified as surplus
Similar to Phase I, sensitive and culturally important areas designated by Congress for special
management such as wilderness, national parks, national monuments, national recreation areas,
national wildlife refuges, national conservation areas, federally recognized Indian reservations
and other lands administered by the Bureau of Indian Affairs and BLM designated Areas of
Critical Environmental Concern for protection of the Desert Tortoise would be excluded from
transfer to the State.

30
V. Administration, Management and Use of Transferred Land
A. Recommended Plan for Administration, Management and Use Lands Transferred to the
State of Nevada
The Task Force has considered alternatives for administration and management of an expanded
State land base and has determined that land to be transferred by the Congress should be
transferred to and administered by the State of Nevada, Division of State Lands. The Division
could then be responsible for granting or selling those lands identified in pending federal
legislation for transfer to local governments or under existing R&PP or ROW leases to said
governments. The Division already is responsible for administration of the remaining 2,900 acres
of State School Trust land held by Nevada and administers others lands belonging to the State of
Nevada (approximately 193,000 acres). As described previously, the Task Force is
recommending that the majority of transferred land be held in trust and managed for the benefit
of select beneficiaries.
During his September 27, 2013 presentation to the Task Force, Mr. Jim Lawrence, Administrator
of the Nevada Division of State Lands reported that his office maintains a staff of 7 and could,
with additional staffing and budget, effectively manage an expanded State land base. As shown
in Table 10, other states with significantly greater state trust land holdings manage their lands
effectively with staffing to acreage levels ranging from 9,266 to 74,616 acres per full time
equivalent (FTE) staff position. Actual staffing levels for the states of Arizona, Idaho, New
Mexico and Utah range from a low of 66 in Utah managing 3.4 million acres of trust lands to 264
in Idaho managing 2.4 million acres of trust land. These differences in both acres per FTE and
numbers of staff reflect the labor intensive nature of managing commercial timber land in Idaho
versus the lack of such timber resources in Utah. New Mexico’s acreage to staffing ratio reflects
the extensive oil and gas resources which have been and continue to be developed on state trust
lands in that state.
Based upon the mix of natural resources managed in Arizona, Idaho, New Mexico and Utah, the
Task Force believes that the State of Nevada could effectively manage an expanded state trust
land base with acres per FTE rate ranging between 44,275 and 74,616 acres per FTE5. Were the
Congress to transfer 7.2 million acres during Phase I to the State of Nevada, the Task Force
estimates management of this area would require a staffing level at the Division of State Lands
of between 96 and 162 persons. This is a significant increase in staffing above the 7 staff
currently employed by the Division. Initially and as the Division of State lands staffing levels
grew, the Task Force believes that many of the required land management functions could be
undertaken by temporary contractors. As Phase I revenues begin to accrue, staffing levels at the
Division could be expanded as necessary to effectively manage the expanded state trust land area
as needed maximize net returns to trust beneficiaries on a sustained basis.
Depending on the nature of other federal lands which might be transferred during subsequent
phases, the acres per FTE ratio might go up as the transferred lands require less intensive
5 The five-year multi-state average acres managed per FTE (44,275) and five-year multi-state observed high acres
managed per FTE for state trust lands in Arizona, Idaho, New Mexico and Utah; 2008-2012.

31
management (recall that Phase I lands have been identified owing to their immediate to short
term revenue generating capacity). The expanded management capacity of the Division of State
Lands may also enable the absorption of a greater state trust land base without the addition of a
commensurate number of employees per acre managed. As Nevada’s state trust land inventory
grew over time, the Task Force would expect the acres managed per FTE within the Division of
States Lands to increase from the initial expected range of 44,275 to 74,616 acres per FTE to a
rate approaching 75,000 acres per FTE or more.
Table 10. Five-Year Average Acres of State Trust Land Managed, Staffing
Level (Full Time Equivalents) and Acres Managed Per FTE,
Arizona, Idaho, Nevada, New Mexico and Utah, 2008-2013
Area
Acres of State
Land
Staffing Level
(FTE)
Acres per
FTE
Nevada1
196,000 7 28,000
Arizona 9,266,468 155 60,569
Idaho 2,450,355 262 9,346
New Mexico 8,963,363 153 58,592
Utah 3,405,577 70 48,595
1/ Nevada data is for 2013.
Sources: Nevada, Nevada Division of State Lands, other states annual
reports for respective state land departments, 2008-2013.
Section 1, Subsection 6(b) of AB 227 directs that the Nevada Land Management Task Force
study include a “proposed plan for the administration, management and use of the public lands,
including without limitation, the designation of wilderness or other conservation areas or the
sale, lease or other disposition of those lands.” As previously noted, the Task Force is
recommending that the transferred lands be administered by an expanded Nevada Division of
State Lands. The Task Force has considered the state trust land management organizational
structures and programs of the states of Arizona, Idaho, New Mexico and Utah as potential
models for Nevada. Mr. Jim Lawrence, Special Assistant to Nevada Department of Conservation
and Natural Resources and recently Administrator of the Nevada Division of State Lands has
suggested that the organizational structure and programs of the Arizona State Lands Department
most appropriately fit an expanded state trust land base in Nevada.6 The Task Force agrees.
Accordingly, much of the description of a proposed administrative and management capability
for an expanded Nevada State Trust Land estate is drawn from the Arizona State Land
Department’s website.
The Arizona State Land Department states as its mission, “The Department has a fiduciary
responsibility to maximize the income from the sale and use of Trust lands and their products.”
The Task Force sees a very similar mission for Nevada Division of State Lands of an expanded
state trust land estate in Nevada.
6 Personal Communication with Mr. Jim Lawrence, former Administrator, Nevada Division of State Lands, May 20,
2014.
32
Proposal for Expanding the Nevada Division of State Lands
To effectively manage a state trust land estate of approximately 7.2 million acres, the Nevada
Division of State Lands would need to expand its range of capabilities and staffing. Accordingly,
the Task Force envisions a Nevada Division of State Lands Office of Trust Land Management
comprised of several programmatic areas including:
Natural Resources Program – This program which would administer all natural resource-
related leases and any natural resource issue affecting Nevada State Trust Land. Leasing
categories would likely include grazing, agriculture, mineral, mineral material, and related
exploration. Other administrative areas could include water sales, mineral material sales,
trespass, recreational permits, environmental contamination, and cultural resources.
Grazing administration would likely include the following functions:
developing Coordinated Resource Management Plans for grazing leases
conducting rangeland monitoring
conducting clearances on range improvement and land treatment projects to prevent or
mitigate the impacts of these projects on protected plant, wildlife and cultural resources
providing recommendations to the Real Estate Program for preventing or mitigating the
impacts of commercial, right of way and sales projects on State Trust rangeland
coordinating efforts with federal and private land managers
providing Nevada Division of State Lands Office of Trust Land Management
representation to various collaborative groups which are addressing rangeland
management issues
Real Estate Program – This program would provide the support for sales, commercial leasing
and rights of way. The Real Estate Program would analyze and make recommendations
concerning the sale or lease of Nevada State Trust Land, with a responsibility to maximize
revenue for the Trust beneficiaries. The Real Estate Program would be responsible for the
planning, engineering, appraisal and disposition functions of the Nevada Division of State
Lands.
Appraisal Section - The mission of the Appraisal Section would be the valuation and evaluation
of all dispositions of Nevada State Trust Land. The Appraisal Section would complete appraisal
assignments with in house appraisal staff and oversee reviews and coordination of fee appraisals
with a large stable of independent fee appraisers. Valuation assignments would cover a very
wide range of property types including commercial, residential, rights of way,
telecommunication sites, mining and mineral excavations, agricultural farms, rangelands, wind
farms, geothermal leases, lands for solar energy generation, open space, sites with archeological
significance, water resources, and many other income generating land uses. The Appraisal
Section would accomplish these assignments in accordance with all applicable requirements of
Nevada Revised Statutes and regulations regarding the appraisal of state land and economic
resources to establish fair market value.
Planning Section - The Planning Section would support the Real Estate Division in matters
related to entitlement issues, general plan amendments, and strategic land use planning. A
strategic plan would be very important as a tool in prioritizing and charting the Division of State
Land’s Trust Land sales and leasing activity based upon planning, engineering and marketing

33
principles. The Task Force would envision the Planning Section collaborating closely with both
counties and municipalities on planning issues, including but not limited to scenic corridors,
zoning text amendments, environmental ordinances, impact fees and other issues impacting the
value and development utility of State Trust Lands and advancing the mission of the Trust in a
manner consistent with local government master plans and infrastructure development
capabilities. The Planning Section, along with the Engineering Section, would work on large
Development Master Plans. It would also work with developers seeking to include State Trust
Lands in their own master planning efforts. This would not only entitle the Trust land but would
also result in unified master planning and allow for sustainable development.
The existing State Land Use Planning Agency within the Nevada Division of State Lands might
be fully capable of broadening its capabilities to be responsible for the State Trust Land planning
initiatives outlined above.
Engineering Section - The Engineering Section would provide engineering and hydrologic
support to the Division of State Lands; including performing infrastructure, drainage and
environmental assessments; technical review and comments on applications; navigable stream
determinations; and Colorado River ownership and boundary determinations, as applicable.
As proposed, the duties and responsibilities of the Engineering Section would include analyses of
potential land uses as a means to enhance the value of State Trust Lands. Any state proposed use
of Trust Land, from a master planned community, commercial center, or something as simple as
the temporary planting of an advertising sign, would be evaluated for its impact, both negative
and positive. An assessment of a negative impact to the use, or future use, of the land could
result in either a request to alter the plan or a refusal of permission to site the project at that
location.
Sales and Commercial Leasing Section – This section would work to assure that all Nevada
State Trust Land transactions are consistent with the Task Force recommended State of Nevada
mandate to achieve the highest and best use of the Phase I transferred lands in order to maximize
revenues to the Trust beneficiaries. It is presumed that both the purchase and the commercial
lease process for State Trust Land would be initiated by an application, completed by the
applicant in consultation with Division of State Lands staff, and filed with the Division.
Typically, Nevada State Trust Land intended for residential purposes would be sold, where as
lands intended for commercial uses would be leased.
It is proposed that all sales and long term commercial leases would be acquired through the
public auction process. It is further proposed that all sales and commercial leases of Nevada
State Trust Land would be approved by a State Land Commission described below.
As proposed, the Division of State Lands would review a purchase or lease application, taking
into consideration at a minimum: the income potential to the Trust beneficiaries; proposed use;
cultural resource issues, threatened and endangered flora and fauna issues; hydrology; geology;
entitlements; impact to adjacent Nevada State Trust and private lands; availability of utilities and
infrastructure; access; proximity to existing development; parcel size; and conformity with local
jurisdiction land use plans, ordinances and regulations.
Rights of Way Section – This function would accept and process applications for rights of way
across Nevada State Trust Land for a variety of public and private uses, such as access roads,

34
infrastructure, power lines, communication lines, and public roadways. Rights of way might be
issued for terms ranging from one year to perpetuity. As proposed, all rights of way in excess of
10 years would be approved by the State Land Commission described below.
Land Information, Title, and Transfer Program – This program area would ensure the
integrity of the State of Nevada Trust Land ownership title, would manage public records, would
coordinate applications and prepare leases, permits and other contracts associated with the
surface use of the Task Force proposed 7.2 million plus acres of Nevada State Trust Land.
As proposed, this Section would perform research of title records on the following types of
acquisitions and disposals: Purchases, Quiet Title Actions, Federal Condemnations,
Reconveyances, Resurveys, Civil Actions and Court Settlements.
Public Records Program – This program would function as the Nevada State Trust Land’s
information and records center. Existing public records capabilities within the Nevada Division
of State Lands could be expanded to serve this role. The Public Records function would assist
and instruct the public and other interested parties in the retrieval of the Nevada Division of State
Lands computerized records, interpretation of Nevada State Trust Land title documentation, and
accessing records and case files as each relates to individual research subjects.
With an approximate nine million acre state trust land estate, Arizona receives approximately
52,000 public inquires to its Public Records section annually. Given that Arizona’s population is
nearly 2.5 times that of Nevada, the Nevada Division of State Lands might expect to receive in
excess of 20,000 public inquiries regarding a 7.2 million acre State Trust Land estate. Functions
performed by the Public Records Section might include but would not necessarily be limited to:
document reproduction; case file maintenance, access, and retrieval; providing application and
permit forms; issuance of recreational permits; providing access to computerized records
pertaining to application status, current land use, and title and land use history; assistance in
determining the location of Nevada State Trust Lands applied for through use of mapping tools;
and telephonic inquiries.
Administrative Appeals Program – This program would prepare and issue decisions, orders
and notices from the Administrator’s Office and oversee the administration of the Nevada
Division of State Lands proposed appeals program wherein applicants or other interested parties
may appeal a final decision of the Administrator of the Nevada Division of State Lands. As
proposed, an appeal of Administrator decisions would be coordinated with an Office of
Administrative Hearings. The office would conduct informal settlement conferences to resolve
appealed issues prior to hearing. The Section would also be responsible for coordinating
administrative appeals to, and hearings before, the State Land Commission as well as litigation
issues.
Administration Program – This program would oversee the administrative functions of the
Department including budget development and implementation, personnel, fiscal monitoring and
reporting, accounting, purchasing, risk management, procurement, human resources and space
management.
35
Information Systems and Resource Analysis Program – This program would be responsible
for developing and managing expanded information systems functions of the Nevada Division of
State Lands including its network, hardware, software, web sites, and its enterprise business and
geographic information systems (GIS).
It is proposed that a Nevada State Land Commission be established whose primary function
would be to act as a quasi-judicial and quasi-legislative board for approval of regulations as well
as the disposition of appeals regarding State Trust Lands for the Nevada Division of State Lands.
Applicants, lessees, permit holders and others would be able to appeal to the Board a final
decision of the Administrator of the Division of State Lands that relates to appraisals,
classifications of land or other final administrative decisions.
Conceptually, the Nevada State Land Commission might consist of seven board members
selected by the Governor and confirmed by the Senate for six-year terms. Five members would
represent the 17 counties in Nevada, which could be divided into five districts. Two members
might hold positions-at-large. Additions to Nevada Revised Statute would be necessary to
establish the proposed Nevada State Trust Land Commission. Figure 5 presents a proposed
organization chart for the Nevada Division of State Lands, Office of Trust Land Management.
While management of an expanded state trust land area would be the primary responsibility of
the Nevada Division of State Lands there would be instances where shared management with
other state or local government entities might be appropriate. For example, should the Division
of State Lands determine the development of an industrial park with sites for sale or lease to
industry was the highest and best use for a parcel of trust land, the Governor’s Office of
Economic Development and/or a Regional Economic Development Authority might work
closely with the Division to market the industry park to industry. This same case might see a
county or city cooperating with the Division to plan and secure funding for infrastructure to
serve said industrial park. The county or city would benefit from increased area employment,
incomes and tax revenue while the Division and the state land trust beneficiaries would benefit
from enhanced generation of land lease or sale revenue.
As noted in Section 6 of the Wild and Free Roaming Horse and Burro Act:
Sec. 6. The Secretary is authorized to enter into cooperative agreements with other landowners
and with the State and local government agencies and may issue such regulations as he deems
necessary for the furtherance of the purposes of this Act.
With limited exceptions, the Task Force is not recommending the transfer of lands with BLM
designated wild horse and burro herd management areas (HMA) at this time. The Task Force
recommends that when lands within an HMA are transferred to the State of Nevada, the
Secretary of Interior enter into a cooperative agreement with state and local agencies to manage
the protected horses and burros on state and federally administered lands. The act authorizes this
and in some areas of the United States, agreement such as this are in place.

36
Adm
inis
trat
or's
Off
ice
Dep
uty
Adm
inis
trat
or
for
Tru
st L
and
Man
agem
ent
Ad
min
istr
ativ
e A
ppea
ls P
rogr
am
Adm
inis
trat
ion
P
rogr
am
Publi
c R
ecord
s P
rogra
m
Info
rmat
ion
Sy
stem
s an
d
Res
ourc
e A
nal
ysis
P
rogr
am
Lan
d
Info
rmat
ion,
Tit
le a
nd
Tra
nsf
er
Pro
gra
m
Rea
l E
stat
e P
rogra
m
Nat
ura
l R
esourc
es
Pro
gra
m
Sta
te L
and
Com
mis
sion
Fig
ure
5.
Pro
pose
d O
rgan
izati
on
al
Ch
art
: N
evad
a D
ivis
ion
of
Sta
te L
an
ds,
Off
ice
of
Tru
st L
an
d M
an
agem
ent

37
Presentations and public comments made during Task Force meetings identified concern
regarding the capability of the State of Nevada to address the development and use of transferred
lands in an environmentally responsible manner. The Task Force received presentations from
Mr. Leo Drozdoff, Director of the Nevada Department of Conservation and Natural Resources,
Mr. Jim Lawrence, Administrator of the Nevada Division of State Lands and Dr. Mike
Baughman, President of Intertech Services Corporation which described the capabilities of the
State of Nevada to ensure that development and use of transferred lands is done in an
environmentally responsible manner7.
The Task Force has learned that the following agencies of the State of Nevada are empowered by
Nevada Revised Statute and regulation to address the environmental integrity of potential
development and uses of federal land transferred to the State of Nevada:
Nevada Department of Conservation and Natural Resources
o Nevada Division of Environmental Protection
Bureau of Air Pollution Control
Bureau of Mining Regulation and Reclamation
Bureau of Water Pollution Control
o Nevada Environmental Commission
o Nevada Division of Forestry
o Nevada Division of Water Resources
o Nevada Division of State Lands
State Land Use Planning Advisory Council
o Nevada Conservation Districts
o Sage Brush Ecosystem Council
o State Historic Preservation Office
Nevada Department of Wildlife
Nevada Department of Agriculture
Nevada Commission On Minerals
o Nevada Division of Minerals
Public Utilities Commission of Nevada
Collectively, these agencies are responsible for the following environmental regulation:
Air Quality
Water Quality
Water Quantity
Conservation of Renewable Resources
Preservation of Cultural and Historic Resources
Designation of Areas of Critical Environmental Concern
Noxious Weed Control
Wildlife Management
7 Dr. Mike Baughman, Intertech Services Corporation, Capacity of the State of Nevada to Undertake Environmental
Protection Programs, presentation to the Nevada Public Lands Management Task Force, February 21, 2014, Carson
City, Nevada; available at
http://www.nvnaco.org/images/2_21_14_state%20of%20nevada%20%20environmental%20protection%20program
%20%20%20capacity%20_rev%201.pdf
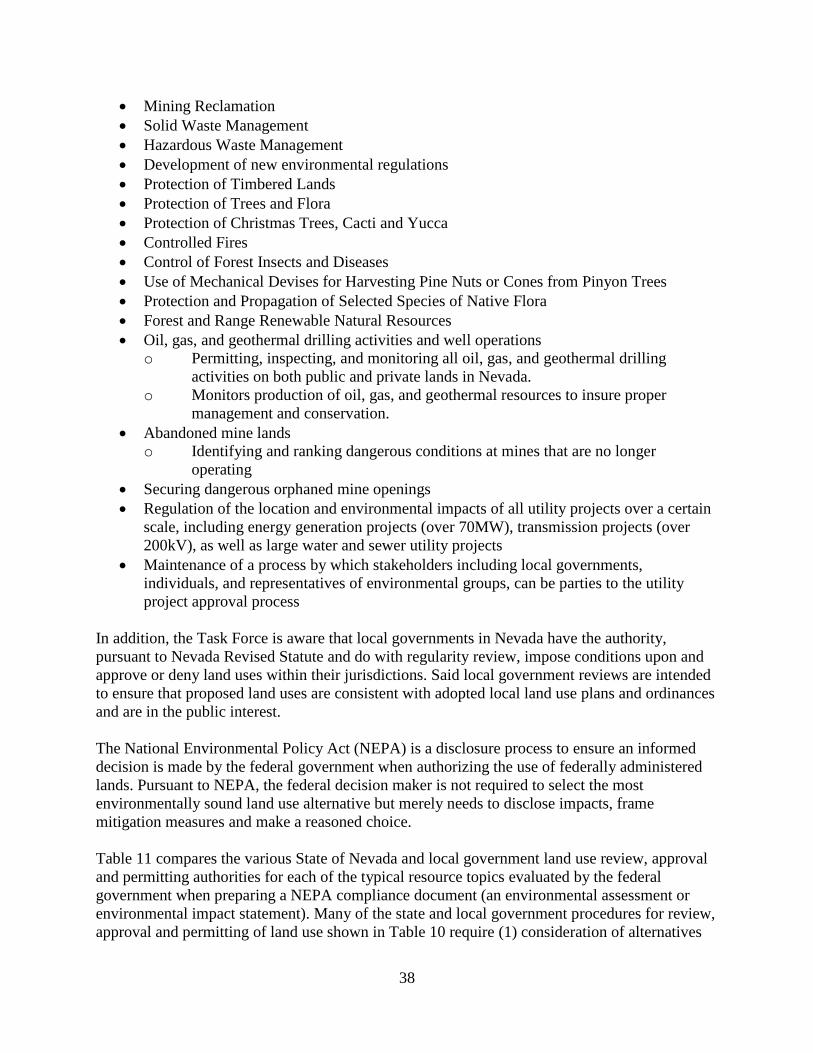
38
Mining Reclamation
Solid Waste Management
Hazardous Waste Management
Development of new environmental regulations
Protection of Timbered Lands
Protection of Trees and Flora
Protection of Christmas Trees, Cacti and Yucca
Controlled Fires
Control of Forest Insects and Diseases
Use of Mechanical Devises for Harvesting Pine Nuts or Cones from Pinyon Trees
Protection and Propagation of Selected Species of Native Flora
Forest and Range Renewable Natural Resources
Oil, gas, and geothermal drilling activities and well operations
o Permitting, inspecting, and monitoring all oil, gas, and geothermal drilling
activities on both public and private lands in Nevada.
o Monitors production of oil, gas, and geothermal resources to insure proper
management and conservation.
Abandoned mine lands
o Identifying and ranking dangerous conditions at mines that are no longer
operating
Securing dangerous orphaned mine openings
Regulation of the location and environmental impacts of all utility projects over a certain
scale, including energy generation projects (over 70MW), transmission projects (over
200kV), as well as large water and sewer utility projects
Maintenance of a process by which stakeholders including local governments,
individuals, and representatives of environmental groups, can be parties to the utility
project approval process
In addition, the Task Force is aware that local governments in Nevada have the authority,
pursuant to Nevada Revised Statute and do with regularity review, impose conditions upon and
approve or deny land uses within their jurisdictions. Said local government reviews are intended
to ensure that proposed land uses are consistent with adopted local land use plans and ordinances
and are in the public interest.
The National Environmental Policy Act (NEPA) is a disclosure process to ensure an informed
decision is made by the federal government when authorizing the use of federally administered
lands. Pursuant to NEPA, the federal decision maker is not required to select the most
environmentally sound land use alternative but merely needs to disclose impacts, frame
mitigation measures and make a reasoned choice.
Table 11 compares the various State of Nevada and local government land use review, approval
and permitting authorities for each of the typical resource topics evaluated by the federal
government when preparing a NEPA compliance document (an environmental assessment or
environmental impact statement). Many of the state and local government procedures for review,
approval and permitting of land use shown in Table 10 require (1) consideration of alternatives
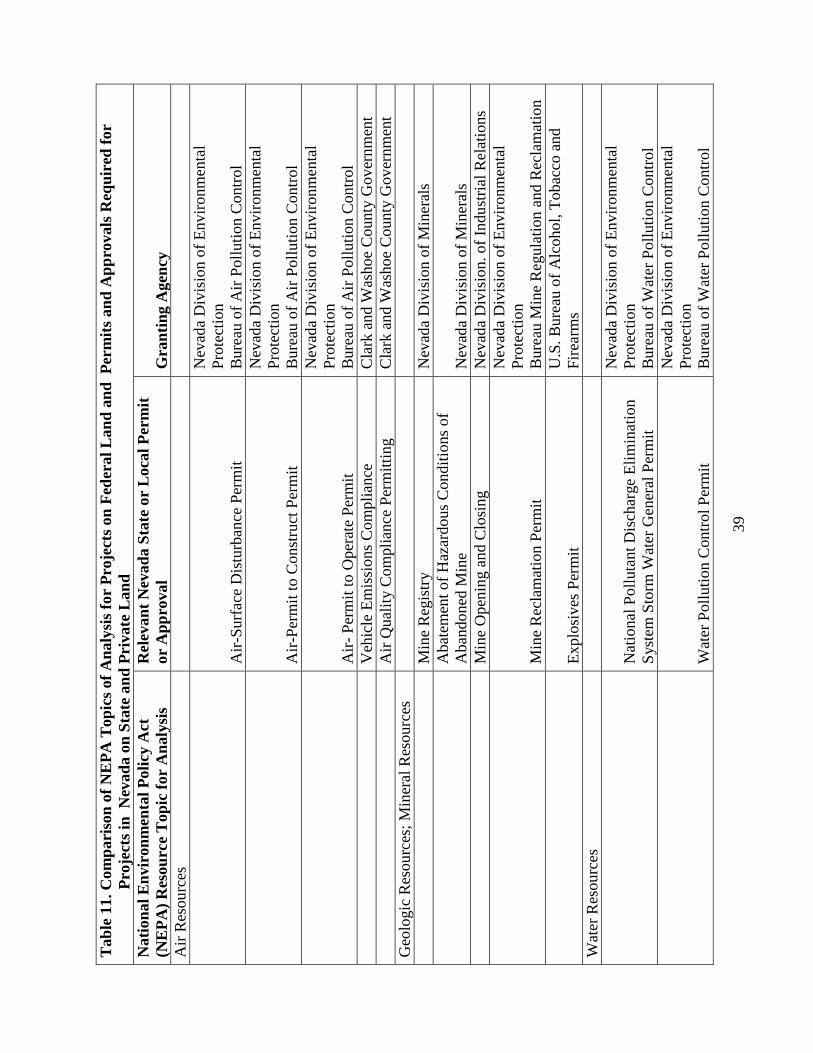
39
Tab
le 1
1. C
om
pari
son
of
NE
PA
Top
ics
of
An
aly
sis
for
Pro
ject
s on
Fed
eral
Lan
d a
nd
P
erm
its
an
d A
pp
rovals
Req
uir
ed f
or
Pro
ject
s in
N
evad
a o
n S
tate
an
d P
rivate
Lan
d
Nati
on
al
En
vir
on
men
tal
Poli
cy A
ct
(NE
PA
) R
esou
rce
Top
ic f
or
An
aly
sis
Rel
evan
t N
evad
a S
tate
or
Loca
l P
erm
it
or
Ap
pro
val
Gra
nti
ng A
gen
cy
Air
Res
ourc
es
A
ir-S
urf
ace
Dis
turb
ance
Per
mit
Nev
ada
Div
isio
n o
f E
nvir
onm
enta
l
Pro
tect
ion
Bure
au o
f A
ir P
oll
uti
on C
ontr
ol
A
ir-P
erm
it t
o C
on
stru
ct P
erm
it
Nev
ada
Div
isio
n o
f E
nvir
onm
enta
l
Pro
tect
ion
Bure
au o
f A
ir P
oll
uti
on C
ontr
ol
A
ir-
Per
mit
to O
per
ate
Per
mit
Nev
ada
Div
isio
n o
f E
nvir
onm
enta
l
Pro
tect
ion
Bure
au o
f A
ir P
oll
uti
on C
ontr
ol
V
ehic
le E
mis
sions
Com
pli
ance
C
lark
and W
ashoe
County
Gov
ernm
ent
A
ir Q
ual
ity C
om
pli
ance
Per
mit
ting
C
lark
and W
ashoe
County
Gov
ernm
ent
Geo
logic
Res
ourc
es;
Min
eral
Res
ourc
es
M
ine
Reg
istr
y
Nev
ada
Div
isio
n o
f M
iner
als
A
bat
emen
t of
Haz
ardous
Condit
ions
of
Aban
doned
Min
e
Nev
ada
Div
isio
n o
f M
iner
als
M
ine
Open
ing a
nd C
losi
ng
N
evad
a D
ivis
ion. of
Indu
stri
al R
elat
ions
M
ine
Rec
lam
atio
n P
erm
it
Nev
ada
Div
isio
n o
f E
nvir
onm
enta
l
Pro
tect
ion
Bure
au M
ine
Reg
ula
tion a
nd R
ecla
mat
ion
E
xplo
sives
Per
mit
U.S
. B
ure
au o
f A
lcohol,
Tobac
co a
nd
Fir
earm
s
Wat
er R
esou
rces
N
atio
nal
Poll
uta
nt
Dis
char
ge
Eli
min
atio
n
Syst
em S
torm
Wat
er G
ener
al P
erm
it
Nev
ada
Div
isio
n o
f E
nvir
onm
enta
l
Pro
tect
ion
Bure
au o
f W
ater
Poll
uti
on C
ontr
ol
W
ater
Poll
uti
on C
ontr
ol
Per
mit
Nev
ada
Div
isio
n o
f E
nvir
onm
enta
l
Pro
tect
ion
Bure
au o
f W
ater
Poll
uti
on C
ontr
ol

40
Tab
le 1
1. C
om
pari
son
of
NE
PA
Top
ics
of
An
aly
sis
for
Pro
ject
s on
Fed
eral
Lan
d a
nd
P
erm
its
an
d A
pp
rovals
Req
uir
ed f
or
Pro
ject
s in
N
evad
a o
n S
tate
an
d P
rivate
Lan
d
Nati
on
al
En
vir
on
men
tal
Poli
cy A
ct
(NE
PA
) R
esou
rce
Top
ic f
or
An
aly
sis
Rel
evan
t N
evad
a S
tate
or
Loca
l P
erm
it
or
Ap
pro
val
Gra
nti
ng A
gen
cy
P
erm
it t
o A
ppro
pri
ate
Wat
er –
Chan
ge
in
Poin
t of
Use
and D
iver
sion
Nev
ada
Div
isio
n o
f W
ater
Res
ourc
es
N
evad
a S
tate
Dam
Per
mit
(st
orm
wat
er
ponds)
Nev
ada
Div
isio
n o
f W
ater
Res
ourc
es
In
dust
rial
Art
ific
ial
Pond P
erm
it
Nev
ada
Dep
artm
ent
of
Wil
dli
fe
P
ota
ble
Wat
er S
yst
em A
ppro
val
Nev
ada
Div
isio
n o
f E
nvir
onm
enta
l
Pro
tect
ion
Bure
au o
f S
afe
Dri
nkin
g W
ater
S
epti
c S
yst
em A
ppro
val
Nev
ada
Div
isio
n o
f E
nvir
onm
enta
l
Pro
tect
ion
Bure
au o
f W
ater
Poll
uti
on C
ontr
ol
U
nder
gro
und I
nje
ctio
n C
ontr
ol
Per
mit
Nev
ada
Div
isio
n o
f E
nvir
onm
enta
l
Pro
tect
ion
Bure
au o
f W
ater
Poll
uti
on C
ontr
ol
S
ecti
on 4
04 W
ater
Qual
ity P
erm
it
U.S
. A
rmy C
orp
s of
En
gin
eers
Soil
Res
ourc
es
G
radin
g P
erm
it
Loca
l G
over
nm
ent
Veg
etat
ion R
esourc
es
P
oss
essi
on o
r R
emoval
of
Chri
stm
as T
rees
,
Cac
ti a
nd Y
ucc
a
Nev
ada
Div
isio
n o
f F
ore
stry
S
pec
ies
dec
lare
d t
o b
e th
reat
ened
wit
h
exti
nct
ion;
spec
ial
per
mit
req
uir
ed f
or
rem
oval
or
des
tru
ctio
n
Nev
ada
Div
isio
n o
f F
ore
stry
Ter
rest
rial
Wil
dli
fe
A
B 3
07 E
ner
gy C
onse
rvat
ion a
nd P
lannin
g
Fund (
revie
w o
f en
erg
y p
roje
ct i
mpac
ts t
o
wil
dli
fe)
Nev
ada
Dep
artm
ent
of
Wil
dli
fe
H
unti
ng a
nd T
rappin
g L
icen
ses
Nev
ada
Dep
artm
ent
of
Wil
dli
fe

41
Tab
le 1
1. C
om
pari
son
of
NE
PA
Top
ics
of
An
aly
sis
for
Pro
ject
s on
Fed
eral
Lan
d a
nd
P
erm
its
an
d A
pp
rovals
Req
uir
ed f
or
Pro
ject
s in
N
evad
a o
n S
tate
an
d P
rivate
Lan
d
Nati
on
al
En
vir
on
men
tal
Poli
cy A
ct
(NE
PA
) R
esou
rce
Top
ic f
or
An
aly
sis
Rel
evan
t N
evad
a S
tate
or
Loca
l P
erm
it
or
Ap
pro
val
Gra
nti
ng A
gen
cy
H
abit
at M
anag
emen
t N
evad
a D
epar
tmen
t of
Wil
dli
fe
A
scer
tain
wh
ether
or
not
the
min
ing
oper
atio
n w
ould
endan
ger
gam
e hab
itat
Nev
ada
Dep
artm
ent
of
Wil
dli
fe
Aquat
ic a
nd
Bio
logic
al R
esourc
es
W
ater
Poll
uti
on C
ontr
ol
Per
mit
Nev
ada
Div
isio
n o
f E
nvir
onm
enta
l
Pro
tect
ion
Bure
au o
f W
ater
Poll
uti
on C
ontr
ol
F
ishin
g L
icen
ses
Nev
ada
Dep
artm
ent
of
Wil
dli
fe
H
abit
at M
anag
emen
t N
evad
a D
epar
tmen
t of
Wil
dli
fe
A
scer
tain
wh
ether
or
not
the
min
ing
oper
atio
n w
ould
endan
ger
fis
h h
abit
at
Nev
ada
Dep
artm
ent
of
Wil
dli
fe
D
red
gin
g P
erm
it
Nev
ada
Dep
artm
ent
of
Wil
dli
fe
Lan
d U
se
M
aste
r P
lan/
Mas
ter
Pla
n A
men
dm
ent
Loca
l G
over
nm
ent
S
pec
ial
Use
/Condit
ional
Use
Per
mit
L
oca
l G
over
nm
ent
Z
one
Ch
ange
Loca
l G
over
nm
ent
B
uil
din
g P
erm
it
Loca
l G
over
nm
ent
G
radin
g P
erm
it
Loca
l G
over
nm
ent
A
uth
ori
zati
on t
o U
se S
tate
Lan
d B
enea
th
Nav
igab
le W
ater
s of
the
Unit
ed S
tate
s
Nev
ada
Div
isio
n o
f S
tate
Lan
ds
A
ppli
cati
on t
o U
se S
tate
Lan
ds
Nev
ada
Div
isio
n o
f S
tate
Lan
ds
Rec
reat
ion
M
aste
r P
lan
L
oca
l G
over
nm
ent
F
acil
ity U
se P
erm
its
Loca
l gover
nm
ent
H
unti
ng , F
ishin
g a
nd T
rappin
g L
icen
ses
Nev
ada
Dep
artm
ent
of
Wil
dli
fe
S
tate
Par
k M
anag
emen
t an
d U
se
Nev
ada
Div
isio
n o
f S
tate
Par
ks
P
erm
it f
or
Rec
reat
ional
Use
of
Subm
erged
Sta
te L
ands
Nev
ada
Div
isio
n o
f S
tate
Lan
ds
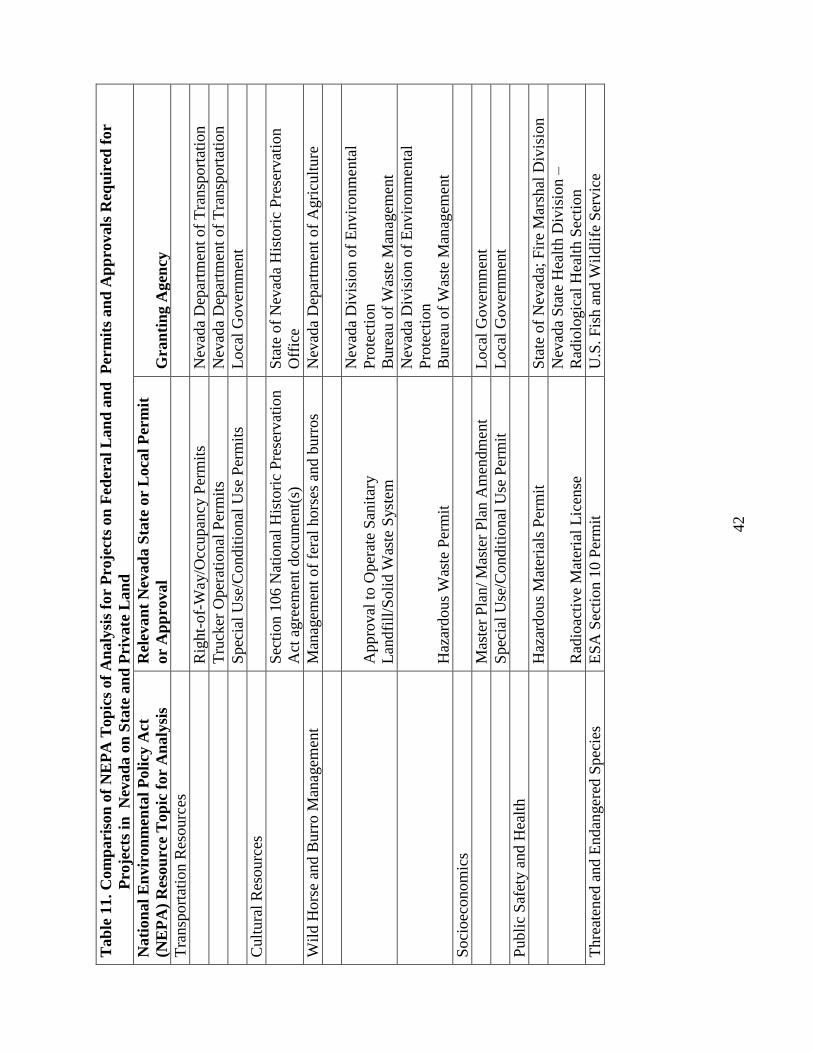
42
Tab
le 1
1. C
om
pari
son
of
NE
PA
Top
ics
of
An
aly
sis
for
Pro
ject
s on
Fed
eral
Lan
d a
nd
P
erm
its
an
d A
pp
rovals
Req
uir
ed f
or
Pro
ject
s in
N
evad
a o
n S
tate
an
d P
rivate
Lan
d
Nati
on
al
En
vir
on
men
tal
Poli
cy A
ct
(NE
PA
) R
esou
rce
Top
ic f
or
An
aly
sis
Rel
evan
t N
evad
a S
tate
or
Loca
l P
erm
it
or
Ap
pro
val
Gra
nti
ng A
gen
cy
Tra
nsp
ort
atio
n R
esourc
es
R
ight-
of-
Way/O
ccupan
cy P
erm
its
Nev
ada
Dep
artm
ent
of
Tra
nsp
ort
atio
n
T
ruck
er O
per
atio
nal
Per
mit
s N
evad
a D
epar
tmen
t of
Tra
nsp
ort
atio
n
S
pec
ial
Use
/Condit
ional
Use
Per
mit
s L
oca
l G
over
nm
ent
Cult
ura
l R
esourc
es
S
ecti
on 1
06 N
atio
nal
His
tori
c P
rese
rvat
ion
Act
agre
emen
t docu
men
t(s)
Sta
te o
f N
evad
a H
isto
ric
Pre
serv
atio
n
Off
ice
Wil
d H
ors
e an
d B
urr
o M
anag
emen
t M
anag
emen
t of
fera
l hors
es a
nd b
urr
os
Nev
ada
Dep
artm
ent
of
Agri
cult
ure
A
ppro
val
to O
per
ate
San
itar
y
Lan
dfi
ll/S
oli
d W
aste
Syst
em
Nev
ada
Div
isio
n o
f E
nvir
onm
enta
l
Pro
tect
ion
Bure
au o
f W
aste
Man
agem
ent
H
azar
dous
Was
te P
erm
it
Nev
ada
Div
isio
n o
f E
nvir
onm
enta
l
Pro
tect
ion
Bure
au o
f W
aste
Man
agem
ent
Soci
oec
onom
ics
M
aste
r P
lan/
Mas
ter
Pla
n A
men
dm
ent
Loca
l G
over
nm
ent
S
pec
ial
Use
/Condit
ional
Use
Per
mit
L
oca
l G
over
nm
ent
Publi
c S
afet
y a
nd H
ealt
h
H
azar
dous
Mat
eria
ls P
erm
it
Sta
te o
f N
evad
a; F
ire
Mar
shal
Div
isio
n
R
adio
acti
ve
Mat
eria
l L
icen
se
Nev
ada
Sta
te H
ealt
h D
ivis
ion –
Rad
iolo
gic
al H
ealt
h S
ecti
on
Thre
aten
ed a
nd E
nd
anger
ed S
pec
ies
ES
A S
ecti
on 1
0 P
erm
it
U.S
. F
ish a
nd W
ildli
fe S
ervic
e
43
which meet the proponent’s purpose and need for the land use; (2) result in disclosure of land use
impacts; (3) provide for mitigation of impacts; (4) provide opportunities for public comment on
the proposed land use; and (5) allow for administrative and judicial review of any decision to
approve and/or permit the proposed land use.
The Task Force believes that given existing statutory and regulatory environmental and land use
review, oversight and approval/denial authority vested with State of Nevada agencies and local
government, proposed development and use of transferred lands in an environmentally
responsible manner is likely and that extra-regulatory procedure such as a state-level National
Environmental Policy Act (NEPA) like process is unnecessary.
B. Uses of Transferred Lands
The Task Force has identified a variety of revenue generating and non-revenue generating uses
which might be made of transferred lands. In recommending that the land transfer be
accomplished through phases, and in recommending that Phase I lands be comprised entirely of
lands with immediate to short term revenue generating potential, the Task Force is seeking to
ensure that the management of an expanded state trust land base be self-funding as soon as
possible. Given the nature of lands to be excluded from transfer in any phase as recommended by
the Task Force (i.e. wilderness, national parks, national monuments, national recreation areas,
national wildlife refuges, national conservation areas and federally recognized Indian
reservations and other lands administered by the Bureau of Indian Affairs), the Task Force
believes that all lands transferred in Phase I to the State of Nevada, Division of State Lands for
management as state trust lands to benefit designated beneficiaries should be managed to
maximize sustainable net revenue for said beneficiaries. Lands transferred in subsequent phases
will be managed primarily for long-term sustainable net revenue maximization with the
exception of those lands identified as suitable for disposal and to the extent possible for
long-term health, function, productivity and sustainability. This would except those lands
transferred to the State which were subsequently transferred to or sold to a local government for
community development and other public purposes. It should also be noted that transferred state
lands might, in some cases, be used to mitigate impacts to enable development of other state trust
lands for their highest and best revenue generation use.
With regard to the possible designation of transferred land by the State of Nevada for wilderness
or other conservation areas, the Task Force recommends that, if needed, the process outlined in
NRS 321.770, State Designation/Planning for Areas of Critical Environmental Concern be
followed. The Task Force notes however there already exist 45 wilderness areas and three
National Conservation Areas on BLM-administered land and 20 wilderness areas on U.S. Forest
Service administered land widely distributed throughout Nevada and totaling just over 4,000,000
acres. The Task Force believes that management by the State of Nevada of congressionally
transferred land subsequently designated by the State as wilderness or other conservation areas
would likely cost more to manage than it would generate in revenues therefore reducing the
amount of net revenue available to designated state trust land beneficiaries. As a consequence,
and given the many millions of acres of federally designated wilderness which already exist in
Nevada, the Task Force does not believe that any lands transferred by the Congress to the State
of Nevada should be designated and managed by the State of Nevada as wilderness.

44
Given the sustained revenue generation goal that the Task Force sees for the Division of State
Lands in managing an expanded state trust land base, Table 12 lists possible uses of said lands
which might generate revenues have been identified. This list is not all inclusive and other
possibilities are likely to become apparent as the State’s management capacity for its expanded
land area matures.
Table 12. Alternative Uses of Transferred Land Which Might Generate Revenue
for Designated Beneficiaries
Recreation
Big Game Hunting
Small Game Hunting
Waterfowl Hunting
Upland Bird Hunting
Trapping
Boating
Fishing
Off-Road Racing
Camping/RV
OHV Use
Rock hounding
Cross-Country Skiing
Alpine Skiing
Snowboarding
Archeology
Land sailing
Backpacking
Trail riding
Photography
Snowmobiling
Wildlife Viewing
Agriculture
Water Storage
Water Transmission
Grazing
Farming
Aquaculture
Landscape Materials
Forestry
Posts and Rails
Pulp
Woodchips
Christmas Trees
Pine Nuts
Chemical Extracts
Biochar
Biofuels
Firewood
Energy
Oil
Gas
Solar
Wind
Geothermal
Hydropower
Biomass
Development
Summer Homes
Ranchettes
Summer Camps
Pack Stations
Dude Ranches
Telecommunications
Transportation
Utilities
Industrial Parks
Commercial
Land Sales
Land Leases
Housing
Airports
Govt. Installations
Community Facilities
Mining
Precious Metals
Industrial Metals
Industrial Minerals
Sand and Gravel
Topsoil
Other
Movie Production
Advertising
Feral Horse Mgt.
Airspace Easements
Appendix A
AB 227

Assembly Bill No. 227–Assemblymen Ellison, Wheeler, Hansen, Hickey, Hardy; Paul Anderson,
Bustamante Adams, Carrillo, Duncan, Fiore, Flores, Grady, Hambrick, Healey,
Kirkpatrick, Kirner, Livermore, Neal, Ohrenschall, Oscarson, Spiegel, Stewart and
Woodbury
Joint Sponsors: Senators Goicoechea, Gustavson, Roberson, Hutchison, Hammond; Atkinson,
Brower, Cegavske, Denis, Hardy, Jones, Kieckhefer, Kihuen, Manendo, Parks,
Settelmeyer, Spearman and Woodhouse
CHAPTER 299
[Approved: June 1, 2013]
AN ACT relating to public lands; creating the Nevada Land Management Task Force to conduct
a study addressing the transfer of public lands in Nevada from the Federal Government to
the State of Nevada; and providing other matters properly relating thereto. Legislative Counsel’s Digest:
This bill creates the Nevada Land Management Task Force, consisting of a representative
from each county in this State appointed by the board of county commissioners, to conduct a
study during the 2013-2014 legislative interim to address the transfer of public lands in Nevada
from the Federal Government to the State of Nevada, in contemplation of Congress turning over
the management and control of those public lands to the State of Nevada on or before June 30,
2015. The Task Force is required to submit a report of its findings and recommendations to the
Legislative Committee on Public Lands on or before September 1, 2014. The Task Force is
similar to an interim commission that is being recommended for creation in the State of Utah to
study issues relating to the transfer of public lands in Utah from the Federal Government to the
State of Utah. (House Bill No. 148, 2012 Utah Laws, ch. 353, § 5) EXPLANATION – Matter in bolded italics is new; matter between brackets [omitted material] is
material to be omitted. WHEREAS, Unlike the eastern states that received dominion over their lands upon joining
the Union, the western states have been placed in an inferior position as a result of the Federal
Government withholding a significant portion of land from those states as a condition of
admission to the Union; and
WHEREAS, According to the Congressional Research Service, as of 2010, the Federal
Government manages and controls approximately 640 million acres, or about 28 percent of the
2.27 billion acres, of land in the United States; and
WHEREAS, The highest concentration of land managed and controlled by the Federal
Government is in Alaska (61.8 percent) and the 11 coterminous western states, namely Arizona
(42.3 percent), California (47.7 percent), Colorado (36.2 percent), Idaho (61.7 percent), Montana
(28.9 percent), Nevada (81.1 percent), New Mexico (34.7 percent), Oregon (53.0 percent), Utah
(66.5 percent), Washington (28.5 percent) and Wyoming (48.2 percent); and
WHEREAS, In contrast, the Federal Government only manages and controls 4 percent of
the land in the states east of those western states; and
WHEREAS, The state with the highest percentage of lands within its boundaries that is
managed and controlled by the Federal Government is Nevada, with over 80 percent of its lands
being managed and controlled by various federal agencies, including the Bureau of Land
Management, the National Park Service, the United States Forest Service, the United States Fish
and Wildlife Service and the Department of Energy; and
WHEREAS, Increased control by the State of Nevada over the public lands within its
borders would benefit the residents of Nevada significantly by allowing the State to balance the
economic, recreational and other critical interests of its residents, with special emphasis on the
multiple uses that are allowed presently on the public lands; and
WHEREAS, In March 2012, legislation was enacted in the State of Utah that, among other
things, requires the Federal Government to turn over management and control of the public lands
in Utah to the State of Utah and requires the study of various issues that may arise during such a
transfer; and
WHEREAS, Other western states are considering the enactment of similar laws and
momentum is building towards the Federal Government turning over management and control of
certain public lands to the western states; and
WHEREAS, In light of the magnitude of federal management and control of public lands
in Nevada, a study by the State of Nevada, in contemplation of Congress turning over the
management and control of public lands in Nevada to the State of Nevada on or before June 30,
2015, would assist in ensuring that the transfer proceeds in a timely and orderly manner; now
therefore
THE PEOPLE OF THE STATE OF NEVADA, REPRESENTED IN SENATE AND
ASSEMBLY, DO ENACT AS FOLLOWS:
Section 1. 1. The Nevada Land Management Task Force, consisting of 17 members,
is hereby created. Within 30 days after the effective date of this act, the board of county
commissioners of each county shall appoint one member to the Task Force.
2. A vacancy on the Task Force must be filled in the same manner as the original
appointment.
3. The Task Force shall hold its first meeting on or before
July 1, 2013. At the first meeting, the Task Force shall elect a Chair and Vice Chair from among
its members.
4. While engaged in the business of the Task Force, each member of the Task Force is
entitled to receive such per diem allowance and travel expenses as provided by the board of
county commissioners that appointed the member. Each board of county commissioners shall
pay the per diem allowance and travel expenses required by this subsection to the member that is
appointed by that board of county commissioners.
5. The board of county commissioners of each county, in conjunction with the Nevada
Association of Counties, shall provide such administrative support to the Task Force as is
necessary to carry out the duties of the Task Force.
6. The Task Force shall conduct a study to address the transfer of public lands in
Nevada from the Federal Government to the State of Nevada in contemplation of Congress
turning over the management and control of those public lands to the State of Nevada on or
before June 30, 2015. The study must include, without limitation:

(a) An identification of the public lands to be transferred and the interests, rights and
uses associated with those lands;
(b) The development of a proposed plan for the administration, management and use of
the public lands, including, without limitation, the designation of wilderness or other
conservation areas or the sale, lease or other disposition of those lands; and
(c) An economic analysis concerning the transfer of the public lands, including, without
limitation:
(1) The identification of the costs directly incident to the transfer of title of those
lands;
(2) The identification of sources of revenue to pay for the administration and
maintenance of those lands by the State of Nevada;
(3) A determination of the amount of any revenue that is currently received by
the State of Nevada or a political subdivision of this State in connection with those lands,
including, without limitation, any payments made in lieu of taxes and mineral leases; and
(4) The identification of any potential revenue to be received from those lands by
the State of Nevada after the transfer of the lands and recommendations for the distribution of
those revenues.
7. The Task Force shall report periodically to the Legislative Committee on Public
Lands established by NRS 218E.510 concerning the activities of the Task Force.
8. On or before September 1, 2014, the Task Force shall submit a report of its findings
and recommendations to the Legislative Committee on Public Lands for inclusion in the final
report of that Committee for the 2013-2014 legislative interim. During the 78th Session of the
Nevada Legislature, the Task Force must be available, upon request, to present the
recommendations of the Task Force to the Legislature or the appropriate standing committees
with jurisdiction over public lands matters.
Sec. 2. This act becomes effective upon passage and approval and expires by limitation
on June 30, 2015.


APPENDIX B
Listing of Nevada Land Management Task Force Members

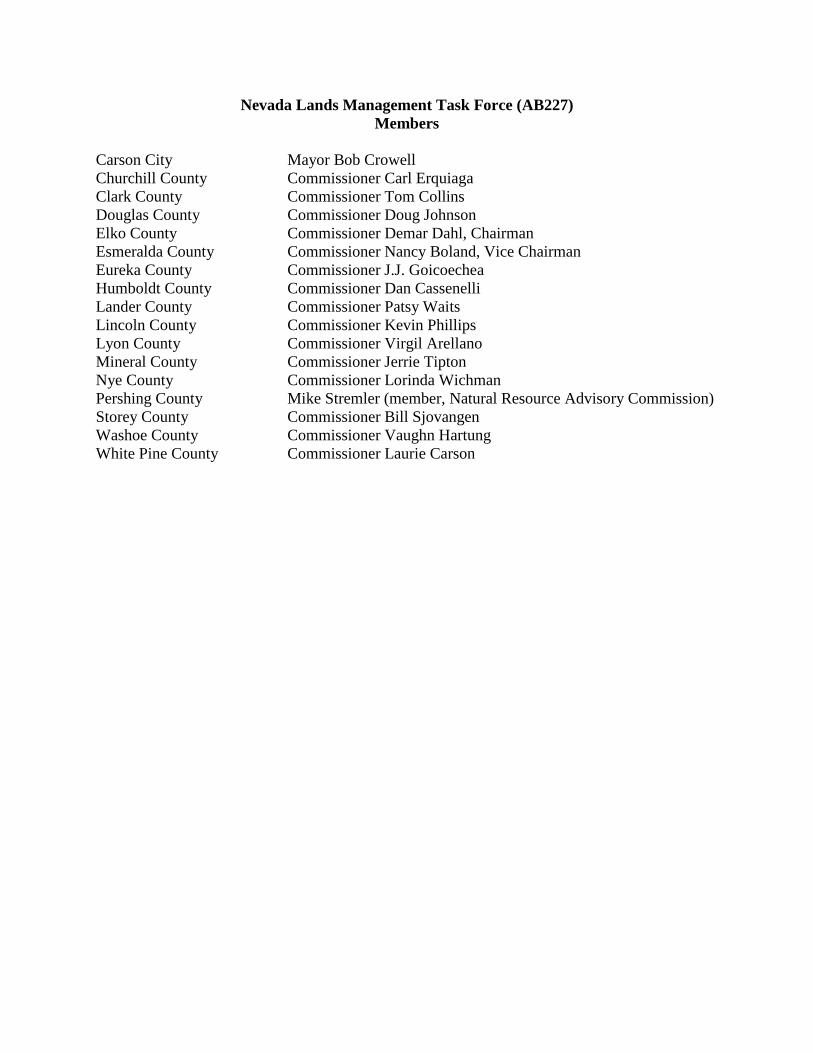
Nevada Lands Management Task Force (AB227)
Members
Carson City Mayor Bob Crowell
Churchill County Commissioner Carl Erquiaga
Clark County Commissioner Tom Collins
Douglas County Commissioner Doug Johnson
Elko County Commissioner Demar Dahl, Chairman
Esmeralda County Commissioner Nancy Boland, Vice Chairman
Eureka County Commissioner J.J. Goicoechea
Humboldt County Commissioner Dan Cassenelli
Lander County Commissioner Patsy Waits
Lincoln County Commissioner Kevin Phillips
Lyon County Commissioner Virgil Arellano
Mineral County Commissioner Jerrie Tipton
Nye County Commissioner Lorinda Wichman
Pershing County Mike Stremler (member, Natural Resource Advisory Commission)
Storey County Commissioner Bill Sjovangen
Washoe County Commissioner Vaughn Hartung
White Pine County Commissioner Laurie Carson


APPENDIX C
Summary of Formal Presentations to the Nevada Land Management Task

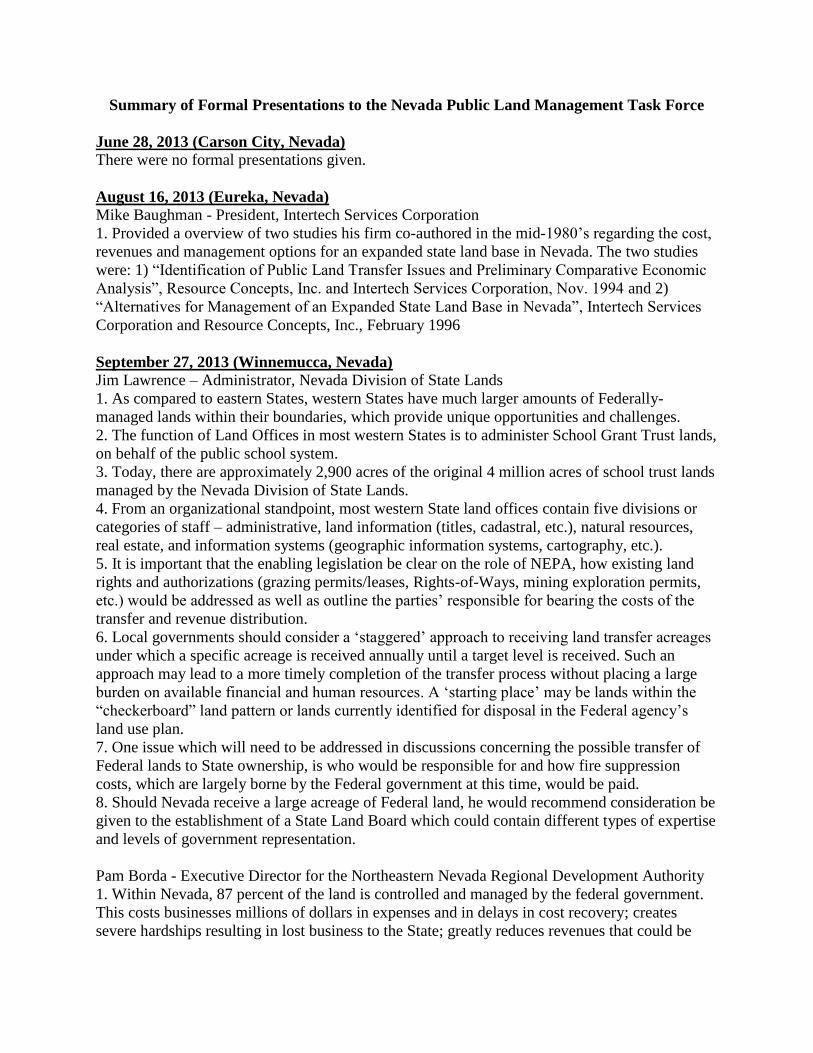
Summary of Formal Presentations to the Nevada Public Land Management Task Force
June 28, 2013 (Carson City, Nevada)
There were no formal presentations given.
August 16, 2013 (Eureka, Nevada)
Mike Baughman - President, Intertech Services Corporation
1. Provided a overview of two studies his firm co-authored in the mid-1980’s regarding the cost,
revenues and management options for an expanded state land base in Nevada. The two studies
were: 1) “Identification of Public Land Transfer Issues and Preliminary Comparative Economic
Analysis”, Resource Concepts, Inc. and Intertech Services Corporation, Nov. 1994 and 2)
“Alternatives for Management of an Expanded State Land Base in Nevada”, Intertech Services
Corporation and Resource Concepts, Inc., February 1996
September 27, 2013 (Winnemucca, Nevada)
Jim Lawrence – Administrator, Nevada Division of State Lands
1. As compared to eastern States, western States have much larger amounts of Federally-
managed lands within their boundaries, which provide unique opportunities and challenges.
2. The function of Land Offices in most western States is to administer School Grant Trust lands,
on behalf of the public school system.
3. Today, there are approximately 2,900 acres of the original 4 million acres of school trust lands
managed by the Nevada Division of State Lands.
4. From an organizational standpoint, most western State land offices contain five divisions or
categories of staff – administrative, land information (titles, cadastral, etc.), natural resources,
real estate, and information systems (geographic information systems, cartography, etc.).
5. It is important that the enabling legislation be clear on the role of NEPA, how existing land
rights and authorizations (grazing permits/leases, Rights-of-Ways, mining exploration permits,
etc.) would be addressed as well as outline the parties’ responsible for bearing the costs of the
transfer and revenue distribution.
6. Local governments should consider a ‘staggered’ approach to receiving land transfer acreages
under which a specific acreage is received annually until a target level is received. Such an
approach may lead to a more timely completion of the transfer process without placing a large
burden on available financial and human resources. A ‘starting place’ may be lands within the
“checkerboard” land pattern or lands currently identified for disposal in the Federal agency’s
land use plan.
7. One issue which will need to be addressed in discussions concerning the possible transfer of
Federal lands to State ownership, is who would be responsible for and how fire suppression
costs, which are largely borne by the Federal government at this time, would be paid.
8. Should Nevada receive a large acreage of Federal land, he would recommend consideration be
given to the establishment of a State Land Board which could contain different types of expertise
and levels of government representation.
Pam Borda - Executive Director for the Northeastern Nevada Regional Development Authority
1. Within Nevada, 87 percent of the land is controlled and managed by the federal government.
This costs businesses millions of dollars in expenses and in delays in cost recovery; creates
severe hardships resulting in lost business to the State; greatly reduces revenues that could be

derived from business and local/State government; and prevents communities from growing their
economy in target industries.
2. Through its permitting, acquisition, and access programs, the Federal government has cost
Elko County millions of dollars in revenue over the past two years and for the foreseeable future.
3. Currently, it takes 7 to 10 years to permit a mine at a cost of $2 to $4 million – this is in
comparison to Canada where it can be done in 3 to 4 years.
4. Elko County has tried for many years to get contiguous blocks of land larger than 640 acres
within the “checkerboard” land pattern. Elko County has lost two major business opportunities
because they could not obtain more than 640 acres of contiguous land.
5. Access to public lands continues to be denied for a variety of reasons including sage grouse,
the California National Historic Trail, bull trout, and travel management planning.
6. Growth in this state is severely limited due to lack of land to develop.
7. Federal government policies are preventing use of public land in all industries and is causing a
loss of millions of dollars per year.
8. If the Federal agencies cannot work with the State and local governments, we need to manage
the land ourselves.
9. The Federal government is reaping the benefits of our land with royalties, federal taxes and
permit fees and, at the same time, causing a loss to many others.
Steve Hill - Executive Director, Nevada Governor’s Office of Economic Development
1. Housing and land prices are one part of the solution to creating a healthy economy.
2. If there is a transfer of land, there may be an opportunity to streamline many processes which
will have a significant impact on the State’s economy and help to create jobs within the State.
November 21, 2013 (Reno, Nevada)
David VonSeggern – Chairman, Sierra Club, Toiyabe Chapter
1. The federal government currently has hundreds of federal employees responsible for
managing the public land resources within Nevada. How would the State replace that number of
employees?
2. There are thousands if not millions of pages of procedures, Memorandums of Understanding,
guidelines, management plans, etc., which would need to be updated, rewritten, and reissued.
3. Funds would be needed to address the purchase or replacement of property such as offices,
facilities, motor vehicles, fire equipment, and IT systems.
4. The State would need to identify sources of revenue to pay for the administration and
maintenance of the transferred lands. Such sources might include grazing fee increases, access
fees for recreational activities, increases in hunting and angling permit fees, mining fee increases,
recreational equipment taxes, the State’s general fund or land sales.
5. The current federal management arrangement works well for the Sierra Club and Nevada.
6. There have been decades of adjustments, cooperation, and fine tuning among local, state, and
federal agencies.
7. Nevada benefits from the large federal government investment and environmental protections
are greater under federal control. Disposal mechanisms such as County land bills and the
Southern Nevada Public Land Management Act are already in place.

8. There are many intangible benefits from the public lands in Nevada including health and
welfare to its citizens, maintaining the “Spirit of the Old West,” scenic beauty values, unfettered
enjoyment of the outdoors, preservation of species, and clean air and water.
9. The Sierra Club believes AB 227 would adversely affect the ability of their members and
members of other recreational groups to (1) enjoy the ‘wild’ lands of Nevada and (2) effectively
protect and conserve Nevada’s air, water, wildlife, and scenery.
10. The public lands belong to all of the United States; not just to Nevada.
11. The Sierra Club opposes a massive land transfer from the federal government to
State/County governments as prescribed in AB 227.
Larry Johnson – President, Coalition for Nevada’s Wildlife
1. If transferred lands are to be disposed of, maintenance of access for hunting and fishing is of
paramount concern.
2. If public lands are privatized, there is no guarantee that private land owners will manage lands
for wildlife benefits.
3. Limitations in water availability would restrict the ability to develop privatized lands and said
demands for water could result in adverse environmental impacts.
4. Privatization would increase the cost of accessing land for hunting and fishing, restricting this
family tradition.
5. It is imperative that critical wildlife habitat, migration corridors and waterways be protected.
6. It is not clear that the State could generate enough revenue to properly manage an expanded
land base which might result in degradation of key wildlife habitat resources.
7. The State of Nevada’s inability to manage the feral horses in the Virginia Range is an example
of why the State would not be able to effectively manage a larger number of horses.
8. The ability of the State to fund wild land firefighting and restoration activities must be
considered - if funding is inadequate than the natural resource conditions will decline.
Kyle Davis - Political and Policy Director, Nevada Conservation League
1. Concerned that existing access to transferred lands will be eliminated.
2. Does not have confidence that the transferred lands would remain in public control.
3. Given the State’s history of selling lands and current budget situation, isn’t confident that a
large amount of State controlled lands wouldn’t be sold to balance the State’s budget.
4. Currently, less than one percent of the State’s budget is dedicated to conservation issues or
actions.
5. Overall, there is not a general public investment in conservation within the State of Nevada
and he doesn’t see indication that approach will change in the future.
6. Does not believe the State has the experience to balance the multiple uses, he doesn’t believe
there is a momentum building in support of the transfer of the public lands to the State, and there
have been successful, collaborative efforts to transfer lands in the past.
7. Does not believe the transfer of public lands to the State is a good idea.
8. The State isn’t prepared and hasn’t demonstrated the capability and willingness to manage
these lands. 9. It is not in the local government’s economic interest to set aside lands for
conservation interests.
10. Historically, the State and local government priorities have not included conservation, and
many issues – wildfire, climate change, wild horses, and invasive species - are too large for the
State to handle alone.
11. There are many perils which come with the transfer of land from the federal government to
the State of Nevada.
Doug Busselman – Executive Director, Nevada Farm Bureau
1. A survey of Nevada Farm Bureau farmer/rancher members revealed the following:
67.75 percent rated the proposal for transfer of federal lands as “Very Important”
82.86 percent agreed that Nevada should control federal lands
77.14 percent indicated greater advantages for Nevada to acquire federal lands
More than 1/3 of members responding indicating that they believe Farm Bureau’s
current policy for lands to be converted to private ownership should be changed to
have Nevada State Government control these lands.
2. Encouraged review of existing NRS and regulations to make certain State Lands manage lands
within parameters of local land use plans.
3. Suggested it is Critical to build a consensus going forward, providing opportunity for local
citizens to participate in identification of lands to be included and understanding the options for
management of these lands.
4. Review of existing NRS and regulations may stimulate ideas for changes which are
necessary to give Nevada citizens greater input than the current system of federal
management provides.
December 6, 2013 (Las Vegas, Nevada)
Scott Higginson - FourSquare Group, a consultant to the Clark County Regional Flood Control;
Mr. Higginson was also speaking on behalf of other entities in Clark County
1. Recommended an alternative approach that he hopes will be included in the Task Force’s
recommendation to the Legislative Public Lands Committee that federal legislation be
recommended that allows the fee title ownership of the federal lands where permanent public
facilities have been constructed through the R&PP Act or granted through Right-of-Way
applications be turned over to the entity who built those permanent structures.
2. Encouraged the Task Force to develop a recommendation requesting the State Legislature’s
support for federal legislation to accomplish the transfer of ownership of lands containing
permanent public facilities to the entity owning those facilities.
Karla Norris - Assistant District Manager for the Southern Nevada Public Lands Management
Act (SNPLMA), BLM Southern Nevada District Office, Las Vegas
1. With passage of the Federal Land Policy and Management Act of 1976 (FLPMA), Congress
declared public lands should be retained in federal ownership, unless, as a result of land use
planning, disposal would serve the national interest.
2. FLPMA also declared that the public lands would be managed for several purposes including:
Promote multiple use and sustained yield;
Protect the scientific, scenic, historical, ecological environment, air and atmosphere,
water resources, and archaeological values;
Preserve the lands in their natural condition to provide food and habitat for fish, wildlife,
and domestic animals; and,
Provide for outdoor recreation and human occupancy and use

3. SNPLMA was enacted in 1998 to provide for the orderly disposal of certain federal lands in
Clark County and to expand the sale proceeds and other revenues for purposes identified in the
Act.
4. Over 15 years of implementation, sale of public lands in Clark County have generated over
$3.3 billion which has been used to fund over 1,200 projects in 8 major categories.
Tony Rampton - Utah’s Assistant Attorney General
1. The Supreme Court found in 1980 that the State’s enabling acts equate to contracts between
the Federal government and the State within which each party entering into the contact is entitled
to be benefit of their bargain.
2. Disposal of the federal lands was clearly intended by both the United States government and
the State at the time of the enabling legislation.
3. There is a “good faith” argument that could be made as to the constitutionality of the transfer
of public lands to the State.
4. Currently, the United States Supreme Court looks fondly on States’ rights and there is a
possibility if that the property clause question were presented to this Supreme Court, it could rule
in the State’s favor.
5. The issues shouldn’t be resolved based on emotion or ideology but on pragmatism and the
law.
6. Nevada is approaching the issue appropriately by being careful and taking things one step at a
time.
7. Commends the State for its approach to an important question having a major effect on things
such as revenues, education, and jobs.
Mark Squillace - Professor of Law, University of Colorado
1.Suggested other alternative avenues such as land exchange or working with Congress to
change the General Mining Act to increase the State’s control over certain public lands that it
believes would benefit from closer State management.
2. The State of Nevada cannot make a credible legal argument to support a transfer of federal
land to the State.
3. How can a state that has expressly disclaimed all right and title to its unappropriated public
lands now lay claim to those same lands?
4. When the Congress enacted FLPMA and established a policy of retaining the public lands in
federal ownership it was exercising a power that was expressly countenanced by the Court in its
San Francisco decision.
5. In Kleppe v. New Mexico the Supreme Court held that Congress has “complete power” over
public lands, and this power necessarily includes the power to regulate and protect the wildlife
thereon.
6. It is simply not possible to reconcile this complete power – recognized by the Court in New
Mexico – with any state claim of ownership to the federal public lands.
January 24, 2014 (Carson City, Nevada)
Leo Drozdoff – Director, Nevada Department of Conservation and Natural Resources (DCNR)
1. The organization and structure of the Department’s divisions have been established based on
the amount of private and State land within Nevada.
2. Significant change in the State’s land ownership pattern (as suggested under Assembly Bill
(AB) 227) would require significant changes to the organizational structure and operational
strategies of several State agencies (particularly the Nevada Division of Forestry (NDF) and the
Division of State Lands (DSL) but not many statutory changes.
3. Current programs are built to be robust but not duplicative of federal agency efforts.
4. A possible avenue for managing the transfer of public lands to the State would be sequential
approach focusing first on areas where the interface between the State and federal agencies has
been worked out such as the checkerboard land pattern along Interstate 80. Then, as the State or
Counties are ready for additional acreages, they could be requested.
5. States containing significantly higher percentages of State and private land have State land
agencies that are typically larger in staffing and more bureaucratic as compared to Nevada’s
DSL.
6. A significant change in the land ownership pattern would require NDF to reconsider its current
staffing structure and operational strategies to suppress wildfires.
February 21, 2014 (Carson City, Nevada)
Mr. Don Pattalock - President, New Nevada Resources, LLC
1. New Nevada Resources manages over 1.25 million acres of fee mineral rights and royalty
interest and approximately 500,000 acres of fee surface ownership in Nevada.
2. New Nevada Resources generates most of its revenues from following activities: land sales;
water sales and development; leases; easements, right of ways and access; mining leases; oil and
gas leases; geothermal leases; and royalty income.
3. New Nevada Resources land sales have historically averaged between $5 and $7 million
annually.
4. New Nevada Resources receives royalties from mineral production in the areas of gold, silver,
iron ore, limestone, and barite on their lands; however, there is no federal royalty on hard rock
minerals.
5. Mr. Pattalock referenced other oil/gas producing areas such as the Bakken shale in North
Dakota, Eagle Ford shale in Texas, and Tuscaloosa Marine shale in Alabama where the oil
producing shale is a couple of hundred feet thick and has significantly changed the economies of
those areas. In contrast, the Chainman and Elko shale formations lie at depths ranging from
7,000 to 12,000 below the surface of the earth and vary from 10,000 to 15,000 feet in depth.
6. The distribution of New Nevada Resources revenues is as follows: mining lease revenue
(65%); royalty revenues (leased, 2%); geothermal lease revenue (3%); grazing revenue (2%);
land sale revenue (5%); other lease revenue (4%); water sale revenue (19%).
7. Mr. Pattalock offered several reasons why the Task Force should consider public lands within
the checkerboard land pattern as part of the initial request for transfer from the federal
government:
The checkerboard land pattern is difficult to manage for both the private land owners as
well as the federal agencies.
There are no United State Forest Service (USFS) lands within the checkerboard, which
minimizes the number of federal agencies to be dealt with.
There are no federally designated wilderness areas or wilderness study areas within the
checkerboard land pattern.
There are few wild horse management areas within the checkerboard land pattern.

The Union Pacific Railroad mainline, Interstate 80, U. S. 95, and U. S. 93 transportation
corridors lie within the checkerboard land pattern.
8. New Nevada Resources has not, despite several attempts, been able to consummate a land
exchange with the federal government in fifteen years.
9. Mr. Pattalock believes the transfer of public lands to the State within the checkerboard land
pattern would beneficial to the State as well as New Nevada Resources as the lands would be
managed from a revenue generation perspective bringing more growth and opportunities for
increased agriculture, community development, and regional economic benefits, and improved
management through ownership consolidation.
10. It will be critical for the State of Nevada to be prepared and have programs in place to
manage the lands to the actual transfer of ownership.
11. Leasable mineral royalties will likely be a negotiated item but could result in substantial
revenue for the State if acquired with the transfer.
12. Just having the lands available for sale doesn’t make those lands salable.
March 28, 2014 (Carson City, Nevada)
There were no formal presentations given.
April 25, 2014 (Carson City, Nevada)
There were no formal presentations given.
May 30, 2014 (Carson City, Nevada)
There were no formal presentations given.
June 27, 2014 (Carson City, Nevada)
There were no formal presentations given.
July 18, 2014 (Carson City, Nevada)
There were no formal presentations given.


APPENDIX D
Listing of Persons Providing Public Comments and Summary of Issues Raised

Persons Providing Public Comments and Summary of Issues Raised
June 28, 2013 (Carson City, Nevada)
There were no public comments.
August 16, 2013 (Eureka, Nevada)
Jim Faulk - spoke about the great increases in federal lands over the last number of years, and
said that he believed that this increase was related to the UN’s Agenda 21 initiative.
Jim Gifford - noted that the Task Force needs to pay attention to using the word “public lands.”
He also suggested that the Task Force would benefit from obtaining a financial analyst.
Assemblyman John Ellison - Noted that PILT Funding is not consistent, and it is an ongoing
uphill battle.
September 27, 2013 (Winnemucca, Nevada)
Robert Clifford - Encouraged the Task Force to review Nevada Revised Statue (NRS) 321 –
Title 26 - Administration, Control and Transfer of State Lands – which, in his opinion, already
addresses the issues facing the Task Force including mechanisms for managing the transferred
lands and the decision making processes.
Cliff Gardner – Expressed concern over the extent to which federal land manager decisions have
been influenced by environmental interests in a manner adverse to multiple uses such as
livestock grazing.
Jim Falk - Encouraged the Task Force to expedite its deliberations because of ongoing activities
of other state and federal agencies whose outcomes will further constrain public land uses in
Nevada.
Floyd W. Rathbun – Encouraged the Task Force to consider the beneficial direct and indirect
economic and environmental impacts of the range livestock sector as an important use of
transferred land in Nevada. He also encouraged the Task Force and its contractor to identify the
costs of failing to act.
Grant Gerber - Encouraged the Task Force to give significance to the issue of the federal
government’s failed policies which have led to a significant increase in the number of acres and
animals burned by wildfire annually as well as the significant increase in pollution from those
fires.
November 1, 2013 (Reno, Nevada)
Ed Martinez - For many years, BLM’s Battle Mountain office contained a staff of three
individuals and is now a bloated, top heavy bureaucracy of 320 agents. He believes Nevada can
manage with a lot less.
June Carter - The use and access to the public lands is a major issue. Another issue which came
to mind while listening to today’s discussions is the issue of money. She doesn’t mind paying
federal income tax but no one in the room pays a state income tax. If Nevada becomes

responsible for the administration of these lands, she is concerned with how will it be paid for.
She believes three things might happen - we will obtain the lands which won’t be accessible to
the public, new taxes will have to be instilled, or there will be a ‘pay to play’ situation. She
doesn’t believe AB 227 is in the best interest of the State given the economics of the situation.
Jake Tibbits - He believes the Task Force should assume the transfer of public lands to the State
will take place. He recommends the Task Force move forward with an extreme bias toward
solutions. What he has failed to hear from individuals raising the issues are solutions to those
issues. It is important to move forward with solutions as if the transfer of public lands is to take
place.
Karen Dallett - Encouraged the Task Force to invite the non-profit, friends, and other
organizations to share their opinions on the transfer of public lands to the State and understand
the knowledge they could bring to the Task Force.
Tina Knappe - Believes it will be impossible at the State and local levels to hold on to same
kinds of grazing fees, mining and other fees that the BLM collects. Believes members of the
Task Force are too close to those who will be paying those fees. The State has no interest in
protecting cultural resources and puts no money into wildlife except that generated by the
Nevada Department of Wildlife. While she is hears people supporting multiple uses, she does not
believe they define ‘multiple use’ as everyone doing what they want to do. Such an approach
won’t protect endangered species or sage grouse. The more land you remove from public
ownership to private ownership, the more water you need, which is a very limited resource. In
reality, the public lands have protected Nevada from having to make difficult decisions. She
encouraged the Task Force to complete a valid inventory of the financial investment Nevada
currently receives from the federal government so that the State is prepared to manage these
lands, if and when the transfer takes place.
Bob Fulkerson – If federal lands are transferred to the State of Nevada, public access to said
lands will be greatly diminished, if not precluded altogether. The State of Nevada has
demonstrated that it cannot effectively manage our land, water, wildlife and other resources
without federal intervention.
Trish Swain – Concerned about unanticipated consequences of a land transfer. Does not see the
need for a land transfer, not sure what a transfer is trying to fix. Federal lands provide important
benefits to Nevadans and the Nation. Public lands belong to all U.S. citizens not just Nevadans.
Desires that management issues be resolved and lands not transferred.
Anthony Karr – Opposed to transfer of federal land to State of Nevada. Said lands belong to all
taxpayers not just state residents.
Earl Piercy – In favor of keeping our federal public lands.
Elaine Brooks – Would not like to see the federal lands sold off and free access restricted. The
State of Nevada does not have the financial resources to effectively manage the federal land area.
Kay Sanders – Opposed to the transfer of federal lands to the State of Nevada proposed by AB
227. The State does not have the financial resources to effectively manage the expanded land
resources.
Traci Ferrante - Opposed to the transfer of federal lands to the State of Nevada. Concerned that
State would sell lands to cover costs of management.
Zena and Walter Lamp – Keep our public lands federal.
Pierre Mousset-Jones - Opposed to the transfer of federal lands to the State of Nevada. The State
of Nevada cannot competently manage these lands; cannot afford to manage the lands; and
management decisions would be influenced by special narrow state interests.
Doug Vacek – Opposed to the transfer of federal lands to the State of Nevada.
Sue and Bobby Watson - Opposed to the transfer of federal lands to the State of Nevada.
December 6, 2013 (Las Vegas, Nevada)
Terri Robertson - Believes the only purpose of the transfer of public lands to the State is to allow
the State to sell those lands into private ownership. Expressed how people who move from states
with little or no public land to Nevada must feel when they can walk, ride, and learn to love the
public lands in Nevada, which are the State’s greatest treasure that must be preserved and
protected. Is not concerned with the hardships experienced by ranchers and others who depend
on the public lands but cares about being able to drive and walk where she wanted and to
continue to live in a State she loves. The makeup of the Task Force at one representative per
county is unfair to the residents of Clark County. Clark County has not traditionally been treated
equitably by the Legislature. The State of Nevada cannot afford to manage an expanded land
base. Selling the lands will be the State’s only option which will restrict access.
Nancy Gentis - The Bureau of Land Management (BLM) has a “multiple use” philosophy for
managing the public lands, which allows everyone to use those lands. Believes that under private
ownership only certain people would be able to continue using those lands. Doesn’t believe
Nevada has the resources to manage the land if it were transferred to the State.
Michelle Burkett –The State of Nevada cannot afford to manage an expanded state land base.
Sandra Dyan – Public lands need to be kept public.
David Mahon – Please keep Red Rocks public. Opposed to privatizing any parks.
Kristin Kosacek – Keep our public lands public.
John Marchese – Federally managed public lands allow for multiple use which balances
economic interests with recreation and conservation. Public lands are an economic driver
bringing tourism and discretionary spending. Nevada does not have the resources to manage
public lands and would likely sell them into private ownership.

January 24, 2014 (Carson City, Nevada)
Cliff Gardner - Believes the problems being experienced on the public lands now are due to the
fact that citizens are not afforded full due process rights particularly in regards to being under the
common law. Water rights administered by the State of Nevada are not recognized by the U. S.
Supreme Court as being an obtained for steward of sovereignty. Water rights managed by the
State of Nevada are viewed by the Supreme Court as being obtained pursuant to the 1866 Act,
which places the State in a very vulnerable position where the right to have jurisdiction over
those water rights will be undermined. Encouraged the Task Force to do everything possible to
have the State of Nevada gain full control over the public lands.
Bevan Lister - Supported the effort and the issues ahead of the Task Force. Management in our
system of government is best done at home, which is the only way that principal will become a
reality. There may only be one opportunity to transfer the public lands. Writing legislation
containing a tapered time line is one of many options to explore.
February 21, 2014 (Carson City, Nevada)
No public comment.
March 28, 2014 (Carson City, Nevada)
Bob Clifford - Questioned the credibility of the analysis summarized at the end of the letter that
suggests the State of Nevada could receive approximately $371 million from the management of
the public lands transferred to the State of Nevada. Suggested a “bottoms up” analysis of the top
revenue sources including revenues that would be generated at current rates for those sources and
the rates charged for those sources by other States’, to determine the potential range of revenues
which could be generated. Suggested including “managing for multiple uses” as one objective (in
addition to managing for maximum sustainable revenue) for the lands to be transferred to the
State of Nevada. Opponents to the transfer will claim the lands will be managed for maximum
sustainable use and that managing for multiple uses would not be a priority.
Morgan Lynn – BLM does not care about local economies. BLM permitting procedures
constrain local economies.
April 25, 2014 (Carson City, Nevada)
No public comment.
May 30, 2014 (Carson City, Nevada)
No public comment.
June 27, 2014 (Carson City, Nevada)
Tina Nappe - The Task Force’s draft report is that it does not address the value of the federal
employees that work within the State of Nevada. As an example she noted Lander and Humboldt
Counties where there are fairly large BLM offices with staff that have good jobs with good pay
and benefits. BLM archeologists not only do their job in clearances but also go out and do
special projects. She does not see any reference to those types of activities in the Task Force’s
draft report. She believes that Nevada will lose much of its history and archaeology if an
investment is not made in those resources. The federal partners have been some of the best in
investing in the State’s historical and archaeological resources. The economic value of the
federal jobs is of concern to her and is not addressed in the draft report.
She noted that the federal lands have protected the State from having to deal with the State’s
scarce water resources. The more land that is sold, the more demand there is for water at a time
when we are going to have less and less water to address those demands. She believes the Task
Force should be looking at how we will address the water issue.
She observed that the federal agencies have invested a lot in economic development as far as
tourism goes. She does not believe the State will invest the same amount of money nor has the
Task Force proposed using revenues for such resources. Such facilities are economic
development actions that the citizens have taken for granted.
Ms. Nappe stated she doesn’t understand how the Task Force will balance its budget. The sale
of land will take a significant amount of time and the most valuable land will be near urban
areas. She doesn’t see how the Task Force will generate the identified income as the land will
not sell for very much and won’t produce much in taxes.
She noted that the Nevada Department of Agriculture is responsible for managing horses on
State lands but they have no budget to do so. If they had a budget, they could deal with the
horses at Washoe Lake but they won’t. If you want to get involved with management of the
horses on a state level, give the Department some money and wait for the ruckus to begin when
you propose to remove a single horse even if it isn’t a wild horse. Similarly, there is no range
management here, which is more than just livestock grazing. Where would the State find the
budget for replacing forage on burned lands or pinyon-juniper removal?
She stated that she appreciates that the federal government is slow, complex, and frustrating to
work with but it is better than not having it.
Carl F. Clinger – Observed that the phased approach to the land transfer proposed by the Task
Force is an excellent approach but based upon past experience all phases need to be defined at
the outset. The Task Force decision to not transfer Wilderness Designated Land may not be in
the best interest of the State. Wilderness Study Areas are managed as Wilderness and the
Congress has been slow to determine whether these areas will be designated as Wilderness.

July 18, 2014 (Carson City, Nevada)
A July 16, 2014 letter was received from Mr. Carl Eriquiaga as Chairman of the Churchill
County Commission characterizing public comments received during the July 3, 2014 Churchill
County Commission meeting and stating that Churchill County is supportive of the Nevada
Land Management Task Force draft report to the Legislative Committee on Public Lands
concerning the Congressional Transfer of Public Lands to the State of Nevada.
A July 31, 2013 Memorandum from the Humboldt County Administrator to the Humboldt
County Commissioners was received which outlined key issues for consideration by the County
Commission regarding a congressional transfer of public land to the State of Nevada. Attached to
the Memorandum were public comments submitted to the County for consideration including an
email from Mr. Lewis Trout which noted several perceived limitations of the draft Task Force
report and a written proposal from Mr. Lyman Youngberg outlining a suggested approach to
calculating grazing fees on public land transferred to the State of Nevada.
A written set of comments submitted by Mr. Mike Lemich, a White Pine County resident
suggesting that Nevada should be compensated by the federal government for the extensive lands
under federal control such as National Parks and military bases.
An email from Ms. Doris Metcalf, a resident of White Pine County to White Pine County
Commissioner Laurie Carson noting that the draft Task Force report fails to include cultural
resource surveys by BLM as a cost to transfer public land; a concern that estimated State costs to
fight wildfires on a proposed expanded state land base are too low; failure to list the Nevada
State Historic Preservation Office (SHPO) as an entity which would be involved in permitting of
land uses on state lands; and a lack of discussion as to how the State of Nevada would handle
wild horse and burro management on transferred lands.
APPENDIX E
Listing of Dates on Which County Commissions in Nevada Formally Considered
the Draft Report and Recommendations of the Nevada Land Management Task
Force with Web Links to Related County Commission Meeting Minutes

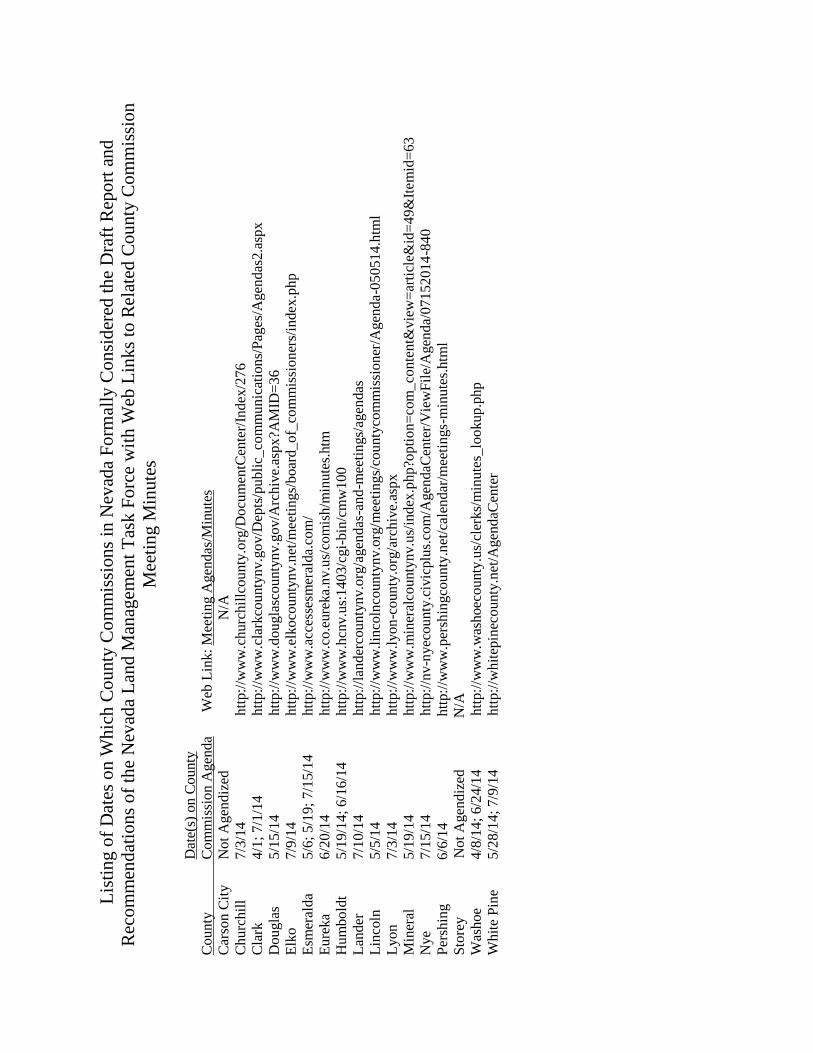
Lis
tin
g o
f D
ates
on
Wh
ich
Co
unty
Co
mm
issi
ons
in N
evad
a F
orm
ally
Con
sid
ered
th
e D
raft
Rep
ort
an
d
Rec
om
men
dat
ions
of
the
Nev
ada
Lan
d M
anag
emen
t T
ask
Fo
rce
wit
h W
eb L
inks
to R
elat
ed C
ou
nty
Co
mm
issi
on
Mee
tin
g M
inute
s
Dat
e(s)
on
Co
unty
County
C
om
mis
sio
n A
gen
da
Web
Lin
k:
Mee
ting A
gen
das
/Min
ute
s
Car
son C
ity
No
t A
gen
diz
ed
N/A
Churc
hil
l 7
/3/1
4
htt
p:/
/ww
w.c
hurc
hil
lcounty
.org
/Docu
men
tCen
ter/
Index
/276
Cla
rk
4
/1;
7/1
/14
htt
p:/
/ww
w.c
lark
county
nv.g
ov/D
epts
/publi
c_co
mm
un
icat
ion
s/P
ages
/Agen
das
2.a
spx
Dougla
s 5
/15/1
4
h
ttp:/
/ww
w.d
ougla
scounty
nv.g
ov/A
rchiv
e.as
px?A
MID
=36
Elk
o
7/9
/14
htt
p:/
/ww
w.e
lkoco
unty
nv.n
et/m
eeti
ngs/
boar
d_of_
com
mis
sio
ner
s/in
dex
.ph
p
Esm
eral
da
5/6
; 5
/19;
7/1
5/1
4
htt
p:/
/ww
w.a
cces
sesm
eral
da.
com
/
Eure
ka
6
/20/1
4
h
ttp:/
/ww
w.c
o.e
ure
ka.
nv.u
s/co
mis
h/m
inute
s.htm
Hum
bold
t 5
/19/1
4;
6/1
6/1
4
htt
p:/
/ww
w.h
cnv.u
s:1403/c
gi-
bin
/cm
w100
Lan
der
7/1
0/1
4
h
ttp:/
/lan
der
county
nv.o
rg/a
gen
das
-and
-mee
tings/
agen
das
Lin
coln
5/5
/14
htt
p:/
/ww
w.l
inco
lnco
unty
nv.o
rg/m
eeti
ngs/
county
com
mis
sio
ner
/Agen
da-0
50
51
4.h
tml
Lyon
7/3
/14
htt
p:/
/ww
w.l
yon
-county
.org
/arc
hiv
e.as
px
Min
eral
5
/19/1
4
h
ttp:/
/ww
w.m
iner
alco
unty
nv.u
s/in
dex
.php?o
pti
on=
com
_co
nte
nt&
vie
w=
arti
cle&
id=
49
&It
em
id=
63
Nye
7
/15/1
4
h
ttp:/
/nv-n
yec
ounty
.civ
icplu
s.co
m/A
gen
daC
ente
r/V
iew
Fil
e/A
gen
da/
071
52
01
4-8
40
Per
shin
g
6/6
/14
h
ttp:/
/ww
w.p
ersh
ingco
unty
.net
/cal
endar
/mee
tings-
min
ute
s.htm
l
Sto
rey
No
t A
gen
diz
ed
N/A
Was
hoe
4/8
/14
; 6/2
4/1
4
htt
p:/
/ww
w.w
ashoec
ounty
.us/
cler
ks/
min
ute
s_lo
okup.p
hp
Whit
e P
ine
5/2
8/1
4;
7/9
/14
htt
p:/
/whit
epin
ecounty
.net
/Agen
daC
ente
r

APPENDIX F
Comparative Analysis of Revenues and Expenses for State Trust Land
Management and Bureau of Land Management in Select States: Implications for an
Expanded State Land Base in Nevada


Comparative Analysis of Revenues and Expenses for State Trust
Land Management and Bureau of Land Management in Select
States: Implications for an Expanded State Land Base in Nevada
Prepared For:
Nevada Association of Counties
on Behalf of Nevada Public Land Management Task Force
Prepared By:
Intertech Services Corporation
P.O. 2008
Carson City, Nevada 89008
in consultation with:
Resource Concepts, Inc.
340 North Minnesota Street
Carson City, Nevada
May 30, 2014
i
TABLE OF CONTENTS
PAGE
INTRODUCTION 1
METHODOLOGY 3
RESULTS 5
State Trust Land Management Trends 5
Estimated Costs and Revenue for Expanded Nevada State Land Base 18
Distribution of State Trust Land Management Net Revenues 20
BLM Land Management Cost and Revenue Trends 23
Federal Government Distribution of Public Land Management
Related Revenues to State and Local Government in Nevada 30
CONCLUSIONS 30

1
INTRODUCTION
A.B. 227 (Chapter 299, Statutes of Nevada 2013) established the Nevada Land Management
Task Force (hereinafter referred to as Task Force). A.B. 227 requires that a study be produced as
a result of the Task Force’s work, specifically covering three main things: 1) an economic
analysis including costs and revenues associated with transferring federal lands to the State; 2) a
proposed plan for the administration and management of any lands transferred; and 3) an
identification of the lands that Task Force determines would be included in any potential
transfer. The Task Force must present their findings in one report to the Legislative Committee
on Public Lands on or before September 1, 2014.
In response to the study requirement contained in AB 227, the Nevada Association of Counties
(NACO) on behalf of the Task Force contracted with Intertech Services Corporation (ISC) to
address item 1) above; an economic analysis including costs and revenues associated with
transferring federal state lands to the State of Nevada. This report presents the results of said
analysis. ISC was assisted in preparation of this report by Resource Concepts, Inc.
An analysis similar to that documented within this report was prepared by ISC and RCI in 1994
at the request of Eureka County, Nevada.8 Given the 20-plus year old nature of the Eureka
County study, the Task Force elected to undertake a current analysis which is documented in this
report.
This report considers patterns of select state school trust land management entities and Bureau of
Land Management revenue generation, expenditures and production of outputs from
management of land resources. This information is intended to provide insight as to what might
be expected should Congress transfer title to federal land in Nevada to the State of Nevada
resulting in an expanded state land base. Information contained within this report is intended to
aid the Task Force and the Nevada Legislature’s Public Lands Committee in understanding
apparent opportunities and constraints to generating net revenues from expanded land
management activities in Nevada.
The transfer of title to public lands in Nevada from the federal government to the State of
Nevada could provide new sources of revenue and require new levels of expenditure by state
government. A decision by the Task Force to recommend and by the Nevada’s Executive and
Legislative branches of government to pursue a Congressional transfer of federally administered
land in Nevada to the State might reasonably be expected to include consideration of expected
revenues and costs. Presumably, a decision to pursue a Congressional transfer of federally
administered land in Nevada to the State would be conditioned upon an expectation that land
management revenues would exceed expenses, thereby providing a stream of net revenues to
assist with funding the State and its existing programs. Ultimately, the need by the State to
generate revenues sufficient to cover reasonable costs might have a significant bearing upon land
management policies for newly acquired public lands. It is important for policy makers to be
8 Resource Concepts, Inc., Identification of Public Land Transfer Issues and Preliminary Comparative Economic
Analysis, prepared in consultation with Intertech Services Corporation for Eureka County Board of Commissioners,
Eureka, Nevada, November 22,1994.
,

2
informed about the potential for management of newly acquired lands to require expenditures of
funds and to generate net revenues.
Beyond the important question of expected costs and revenues, issues of emphasis and efficiency
in existing public land management practices deserve consideration. Expenditure of public funds
for land management purposes can be focused upon both revenue and non-revenue producing
activities. Management of public land can result in the production of economic and non-
economic outputs. For example, production of forage for consumption by domestic livestock is
considered an economic output. Alternatively, production of forage for consumption by wild
horses and burros might be considered a non-economic output. The production of forage for
livestock consumption is predicated upon a desire to produce economic returns, whereas the
production of forage for wild horses and burros is the result of the need to comply with federal
laws mandating protection of these species.
Matters of public policy and legal mandates have served to structure existing federal land (also
referred to as “public” in this report) management practices in Nevada. Under State of Nevada
administration, land management policies might be revised to alter emphasis upon either
production of economic or non-economic outputs. Continued requirements for compliance with
federal legal mandates might depend upon the outcome of federal court proceedings and/or
Congressional action. Policy makers might then benefit from an understanding of existing
patterns of emphasis upon the expenditure of monies in the production of economic and non-
economic outputs from public lands.
Measures of efficiency under existing public land management practices may be useful in
framing prospective revenue and cost relationships. Factors such as Full-Time-Equivalents
(FTEs) per acre or FTEs per revenue dollar, AUMs produced per acre, and revenues and
expenditures per acre may be used to evaluate differences between existing federal land
management programs and those of states. Consideration of these factors may suggest the extent
to which alternative scenarios of emphasis upon management for production of economic and
non-economic outputs might influence costs and revenues.
Collectively then, policy makers would benefit from an understanding of the potential for public
land management activities to produce net economic benefits. Factors affecting revenue
generation may include total available acreage by type (i.e., rangeland, forest, etc.); production
constraints such as elevation, climate, soil types, slope, surface and groundwater hydrology, and
geology, among others; competing supplies and demand for producible outputs; pricing of
outputs; and trends in production of marketable resources, among others. With the possible
exceptions of pricing and controlling quantities of outputs produced (i.e., number of AUMs or
barrels of oil), options for influencing revenues will typically be limited by the characteristics of
natural resources available. Obviously, those characteristics will vary among states and within a
state. What might be learned from consideration of revenue generation in other states must be
viewed with local conditions in mind.
As has been noted previously, land management expenditures, either in the case of the federal
government or by states, will be dependent upon both public policy and legal mandate. While
federal policy and legal mandate may be widely applicable across several states, individual states

3
are free to establish unique policies and legal requirements for administration of state lands.
States may choose to parrot federal land management initiatives, may exceed federal
requirements and mandates in some cases, or may elect to de-emphasize certain federal
priorities. For example, while the federal government may be required through legal mandate to
provide habitat for wild horses and burros, states may not be similarly inclined. While federal
land managers may be required by law to identify and administer wilderness study areas, states
may elect to not pursue similar land management activities. States may elect to conduct forage
inventories on an annual basis, whereas the federal government may conduct such inventories
with less frequency. Each course of action, whether mandated or developed as a result of
discretionary authority, will have commensurate implications on land management expenditures,
revenues and the generation of net revenues.
This report, then, is intended to help answer the following questions:
1) To what degree have other states been able to generate net revenues as a result of land
management activities?
2) What have been the major revenue sources from land management activities of other
states?
3) In the event the State of Nevada were successful in assuming administrative authority for
public lands within the state, what is the potential for related land management revenues
to exceed expenditures?
4) In the event the State of Nevada were successful in securing Congressional transfer of
BLM administered land to the State, what is the potential for related land management
revenues to exceed expenditures?
5) How have other states distributed net revenues generated from state trust land
management activities?
5) To what degree has the Bureau of Land Management been able to generate net revenues
as a result of land management activities within selected states?
6) What have been the major revenue sources from land management activities of the
Bureau of Land Management?
7) To what extent does the federal government currently distribute public land management
related revenues to the State of Nevada and her local governments?
8) How do revenues, expenditures, labor utilization, and resource production rates differ
among different state land and BLM state programs, and between state and federal land
management activities?
METHODOLOGY
To aid Nevada policy makers in determining the potential for generation of net revenues through
management of an expanded state land base, a comparison of other state trust land management
fiscal situations was determined appropriate. The comparative analysis focuses upon land
management activities within the neighboring states of Arizona, New Mexico, Utah and Idaho.
These same four states were considered in the previously described study commissioned by
Eureka County, Nevada in 1994. The number of states considered within this preliminary
evaluation was necessarily limited by time and budget constraints. The use of several states was,
however, deemed important to filter potentially extreme conditions. The four states were
selected on the basis of their similarities to Nevada. For example, Utah contains a portion of the

4
Great Basin and consequently has many similar physiographic characteristics to Nevada.
Although the four states have many natural features similar to Nevada, there are important
differences which tend to influence public land management costs and revenues. Utah, for
example, contains coal producing regions. Idaho is characterized by large areas of commercial
forest. New Mexico's land area supports extensive production of oil and gas.
The comparative analysis considers both revenues and costs, and production of outputs for state
land management agencies and the Bureau of Land Management in these four states. The
analysis of BLM revenues and costs also considers Nevada. In addition to using data from
multiple states, thereby providing spatial control, information covering five fiscal years was
utilized (2008 – 2012). Data obtained for this analysis was consequently able to reflect broad
geographical and temporal conditions. It is also important to note that the selected years of
analysis also encompassed the period of time wherein the United States entered and began its
recovery from the Great Recession which resulted in profound adverse economic and fiscal
consequences throughout the western United States. The analysis of actual net revenues
addressed within this report both for the States of Arizona, Idaho, New Mexico and Utah and
estimates of potential net revenues for the State of Nevada then is considered conservative given
that it is based upon a generally recessed period of the U.S. economy.
At the federal level, the evaluation is limited to consideration of the BLM. Because BLM
administers the vast majority of all public lands within Nevada, focus upon this agency within
this preliminary study is appropriate. It is also consistent with the analysis commissioned by
Eureka County, Nevada in 1994. The analysis of BLM included statewide revenue, cost and
output features in the states of Idaho, Utah, Arizona, New Mexico and Nevada. BLM data on
revenues and outputs was obtained largely from annual reports (USDI, 2008 through 2012).
Expenditure and employment information was provided by BLM state office staff in the form of
unpublished tables and reports. In some cases, all or portions of the collected BLM information
had to be requested through the Freedom of Information Act (FOIA). Generally, BLM staff was
very helpful in providing requested information.
Because Nevada presently does not administer a comparable level of land area, collection of
statewide land management revenue, cost and output data was limited to the states of Idaho,
Utah, Arizona and New Mexico. The absence of comparable Nevada data should not be seen as
a deficiency of this analysis. In fact, a primary objective of this research was to develop an
assumed cost and revenue structure for Congressionally transferred lands which might be
administered by the State of Nevada. State land management cost, revenue, output and
employment data was obtained from state land management agency annual reports and contact
with staff of state land management agencies
As data was received, it was entered into electronic spreadsheets for display and analytical
purposes. Spreadsheets were used to calculate performance ratios, derive net values and ,
calculate multi-year averages. The compiled information was first arrayed by state and year to
facilitate multi-year comparisons. Observed high, observed low and five-year averages were
then derived for the BLM and state data, respectively. This approach provided state by state
ranges of revenue, expenditure and output information. The five-year average data for BLM and
states, respectively, were then combined to derive multi-state averages for revenues,
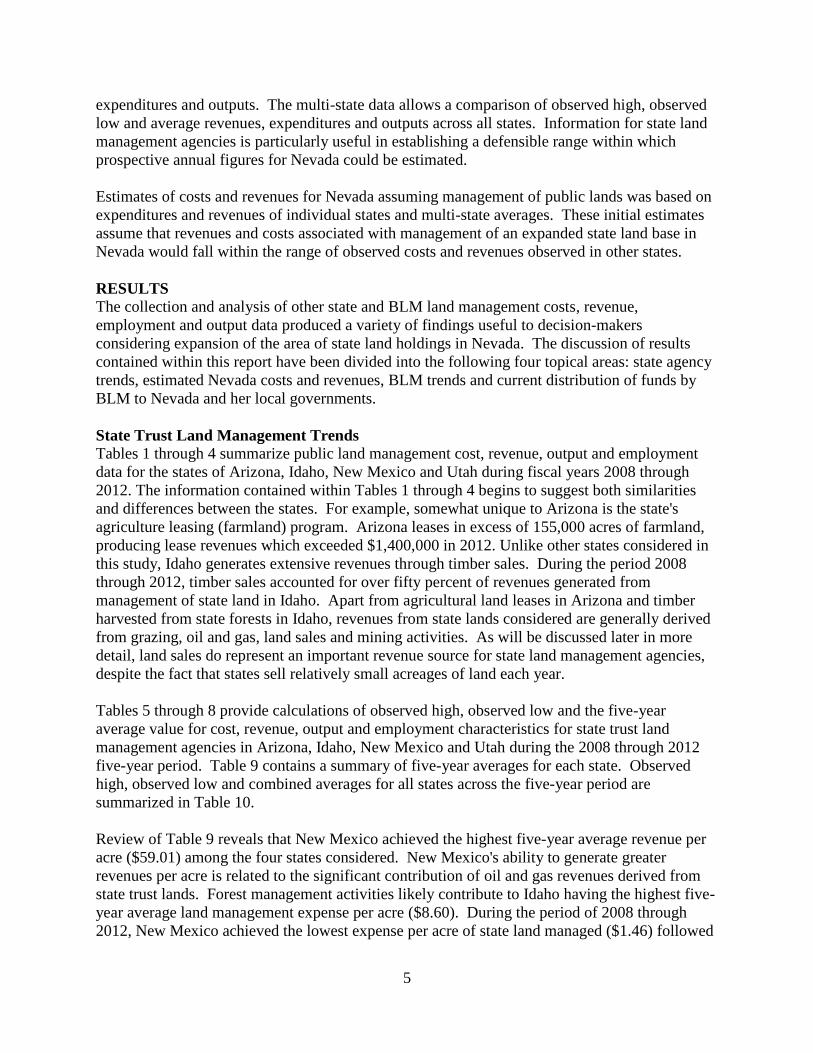
5
expenditures and outputs. The multi-state data allows a comparison of observed high, observed
low and average revenues, expenditures and outputs across all states. Information for state land
management agencies is particularly useful in establishing a defensible range within which
prospective annual figures for Nevada could be estimated.
Estimates of costs and revenues for Nevada assuming management of public lands was based on
expenditures and revenues of individual states and multi-state averages. These initial estimates
assume that revenues and costs associated with management of an expanded state land base in
Nevada would fall within the range of observed costs and revenues observed in other states.
RESULTS
The collection and analysis of other state and BLM land management costs, revenue,
employment and output data produced a variety of findings useful to decision-makers
considering expansion of the area of state land holdings in Nevada. The discussion of results
contained within this report have been divided into the following four topical areas: state agency
trends, estimated Nevada costs and revenues, BLM trends and current distribution of funds by
BLM to Nevada and her local governments.
State Trust Land Management Trends
Tables 1 through 4 summarize public land management cost, revenue, output and employment
data for the states of Arizona, Idaho, New Mexico and Utah during fiscal years 2008 through
2012. The information contained within Tables 1 through 4 begins to suggest both similarities
and differences between the states. For example, somewhat unique to Arizona is the state's
agriculture leasing (farmland) program. Arizona leases in excess of 155,000 acres of farmland,
producing lease revenues which exceeded $1,400,000 in 2012. Unlike other states considered in
this study, Idaho generates extensive revenues through timber sales. During the period 2008
through 2012, timber sales accounted for over fifty percent of revenues generated from
management of state land in Idaho. Apart from agricultural land leases in Arizona and timber
harvested from state forests in Idaho, revenues from state lands considered are generally derived
from grazing, oil and gas, land sales and mining activities. As will be discussed later in more
detail, land sales do represent an important revenue source for state land management agencies,
despite the fact that states sell relatively small acreages of land each year.
Tables 5 through 8 provide calculations of observed high, observed low and the five-year
average value for cost, revenue, output and employment characteristics for state trust land
management agencies in Arizona, Idaho, New Mexico and Utah during the 2008 through 2012
five-year period. Table 9 contains a summary of five-year averages for each state. Observed
high, observed low and combined averages for all states across the five-year period are
summarized in Table 10.
Review of Table 9 reveals that New Mexico achieved the highest five-year average revenue per
acre ($59.01) among the four states considered. New Mexico's ability to generate greater
revenues per acre is related to the significant contribution of oil and gas revenues derived from
state trust lands. Forest management activities likely contribute to Idaho having the highest five-
year average land management expense per acre ($8.60). During the period of 2008 through
2012, New Mexico achieved the lowest expense per acre of state land managed ($1.46) followed

6
by Arizona at $1.86 per acre.. These relatively low expense rates per acre are in part because
New Mexico and Arizona manage three to four-times as much land as do Idaho and Utah. The
observed experience of Arizona and New Mexico's suggest that costs per acre may decline as
total acreage managed increases.
Due largely to its coal resources, the State of Utah had the second highest five-year average
revenue per acre ($38.50). As a consequence of its relatively high revenue per acre and low
costs per acre, the State of New Mexico achieved the greatest net revenue per acre ($57.55)
through management of state trust lands during the five year period of 2008-2012.
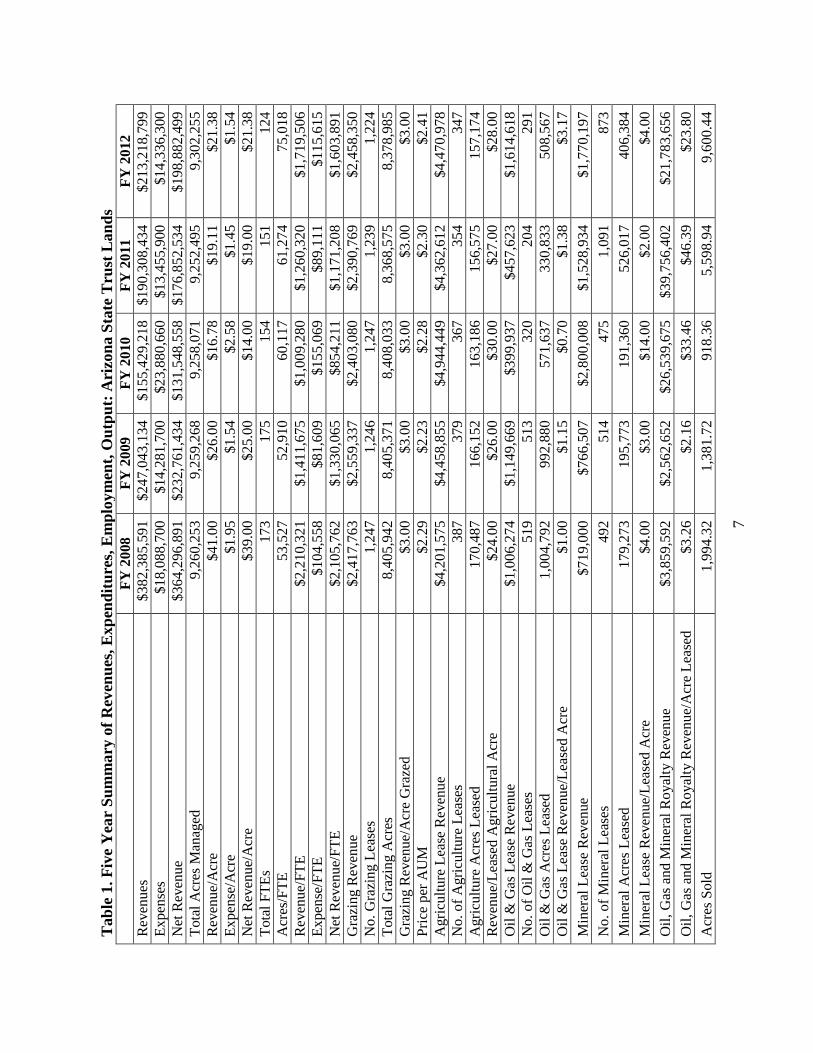
7
Tab
le 1
. F
ive
Yea
r S
um
ma
ry o
f R
even
ues
, E
xp
end
itu
res,
Em
plo
ym
ent,
Ou
tpu
t: A
rizo
na S
tate
Tru
st L
an
ds
FY
2008
FY
2009
FY
20
10
FY
20
11
FY
20
12
Rev
enues
$382,3
85,5
91
$247,0
43,1
34
$155,4
29
,21
8
$1
90
,30
8,4
34
$2
13
,21
8,7
99
Expen
ses
$18,0
88,7
00
$14,2
81,7
00
$23,8
80
,660
$1
3,4
55
,900
$1
4,3
36
,300
Net
Rev
enu
e $364,2
96,8
91
$232,7
61,4
34
$131,5
48
,55
8
$1
76
,85
2,5
34
$1
98
,88
2,4
99
Tota
l A
cres
Man
aged
9,2
60,2
53
9,2
59,2
68
9,2
58
,07
1
9,2
52
,49
5
9,3
02
,25
5
Rev
enue/
Acr
e $41.0
0
$26.0
0
$1
6.7
8
$1
9.1
1
$2
1.3
8
Expen
se/A
cre
$1.9
5
$1
.54
$2
.58
$1
.45
$1
.54
Net
Rev
enu
e/A
cre
$39.0
0
$25.0
0
$1
4.0
0
$1
9.0
0
$2
1.3
8
Tota
l F
TE
s 173
175
1
54
15
1
12
4
Acr
es/F
TE
53,5
27
52
,910
60,1
17
61
,27
4
75,0
18
Rev
enue/
FT
E
$2,2
10,3
21
$1,4
11,6
75
$1,0
09
,28
0
$1
,26
0,3
20
$1
,71
9,5
06
Expen
se/F
TE
$104,5
58
$81,6
09
$1
55
,06
9
$8
9,1
11
$1
15
,61
5
Net
Rev
enu
e/F
TE
$2,1
05,7
62
$1,3
30,0
65
$8
54
,21
1
$1
,17
1,2
08
$1
,60
3,8
91
Gra
zing R
even
ue
$2,4
17,7
63
$2,5
59,3
37
$2,4
03
,08
0
$2
,39
0,7
69
$2
,45
8,3
50
No.
Gra
zin
g L
ease
s 1,2
47
1,2
46
1,2
47
1,2
39
1,2
24
Tota
l G
razi
ng A
cres
8
,405
,942
8,4
05
,371
8,4
08,0
33
8,3
68,5
75
8,3
78,9
85
Gra
zing R
even
ue/
Acr
e G
raze
d
$3.0
0
$3.0
0
$3
.00
$3
.00
$3
.00
Pri
ce p
er A
UM
$2.2
9
$2.2
3
$2
.28
$2
.30
$2
.41
Agri
cult
ure
Lea
se R
even
ue
$4,2
01,5
75
$4,4
58,8
55
$4,9
44
,44
9
$4
,36
2,6
12
$4
,47
0,9
78
No.
of
Agri
cult
ure
Lea
ses
387
379
3
67
35
4
34
7
Agri
cult
ure
Acr
es L
ease
d
170
,487
166
,152
16
3,1
86
15
6,5
75
15
7,1
74
Rev
enue/
Lea
sed
Agri
cult
ura
l A
cre
$24.0
0
$26.0
0
$3
0.0
0
$2
7.0
0
$2
8.0
0
Oil
& G
as L
ease
Rev
enu
e $1,0
06,2
74
$1,1
49,6
69
$3
99
,93
7
$4
57
,62
3
$1
,61
4,6
18
No.
of
Oil
& G
as L
ease
s 519
513
3
20
20
4
29
1
Oil
& G
as A
cres
Lea
sed
1,0
04
,792
992
,880
57
1,6
37
33
0,8
33
50
8,5
67
Oil
& G
as L
ease
Rev
enu
e/L
ease
d A
cre
$1.0
0
$1.1
5
$0
.70
$1
.38
$3
.17
Min
eral
Lea
se R
even
ue
$719,0
00
$766,5
07
$2,8
00
,00
8
$1
,52
8,9
34
$1
,77
0,1
97
No.
of
Min
eral
Lea
ses
492
514
4
75
1,0
91
87
3
Min
eral
Acr
es L
ease
d
179
,273
195
,773
19
1,3
60
52
6,0
17
40
6,3
84
Min
eral
Lea
se R
even
ue/
Lea
sed
Acr
e $4.0
0
$3.0
0
$1
4.0
0
$2
.00
$4
.00
Oil
, G
as a
nd
Min
eral
Ro
yal
ty R
even
ue
$3,8
59,5
92
$2,5
62,6
52
$26,5
39
,675
$3
9,7
56
,402
$2
1,7
83
,656
Oil
, G
as a
nd
Min
eral
Ro
yal
ty R
even
ue/
Acr
e L
ease
d
$3.2
6
$2.1
6
$3
3.4
6
$4
6.3
9
$2
3.8
0
Acr
es S
old
1,9
94.3
2
1,3
81.7
2
91
8.3
6
5,5
98
.94
9,6
00
.44

8
Tab
le 1
. F
ive
Yea
r S
um
ma
ry o
f R
even
ues
, E
xp
end
itu
res,
Em
plo
ym
ent,
Ou
tpu
t: A
rizo
na S
tate
Tru
st L
an
ds
FY
2008
FY
2009
FY
20
10
FY
20
11
FY
20
12
Lan
d S
ale
Rev
enu
e $125,9
97,0
00
$71,7
52,0
00
$19,1
51
,000
$1
04
,37
1,5
86
$1
19
,88
6,9
49
Lan
d S
ale
Rev
enu
e/A
cre
So
ld
$63,1
77
$51,9
29
$2
0,8
53
$1
8,6
41
$1
2,4
87
S
ourc
e: A
rizo
na
Sta
te L
and D
epar
tmen
t, A
nnual
Rep
ort
s, 2
008 t
hro
ugh 2
012.

9
Ta
ble
2. F
ive
Yea
r S
um
ma
ry o
f R
even
ues
, E
xp
end
itu
res,
Em
plo
ym
ent
an
d O
utp
ut:
Id
ah
o S
tate
Tru
st L
an
ds
FY
2008
FY
2009
FY
2010
FY
20
11
FY
20
12
Rev
enu
es
$75,4
90,9
86
$63,4
72,2
07
$48,2
76,2
87
$6
7,5
26
,091
$6
5,7
57
,944
Exp
ense
s $20,1
61,0
83
$21,0
19,2
53
$22,6
85,2
71
$2
3,8
54
,935
$2
3,3
54
,297
Net
Rev
enu
e $55,3
29,9
03
$42,4
52,9
54
$25,5
91,0
16
$4
3,6
71
,156
$4
2,4
03
,647
Tota
l A
cres
2,4
59
,750
2,4
46
,335
2,4
49
,25
5
2,4
48
,42
5
2,4
48,0
10
Rev
enu
e/A
cre
$30.0
0
$25.0
0
$1
9.0
0
$2
7.0
0
$2
6.0
0
Exp
ense
/Acr
e $8.0
0
$8.0
0
$9
.00
$9
.00
$9
.00
Net
Rev
enu
e/A
cre
$22.0
0
$17.0
0
$1
0.0
0
$1
7.0
0
$1
7.0
0
Tota
l F
TE
s 264
264
2
64
25
9
26
0
Acr
es/F
TE
9,3
17
9,2
66
9,2
77
9,4
53
9,4
15
Rev
enu
e/F
TE
$285,9
50
$240,4
25
$182,8
64
$2
60
,71
8
$2
52
,91
5
Exp
ense
/FT
E
$76,3
67
$79,6
18
$85
,92
9
$9
2,1
03
$8
9,8
24
Net
Rev
enu
e/F
TE
$209,5
82
$160,8
06
$96
,93
5
$1
68
,61
4
$1
63
,09
0
Gra
zin
g R
even
ue
$1,5
70,1
09
$1,5
24,0
03
153
26
52
$1
,87
8,8
63
$1
,43
9,2
17
Gra
zin
g L
ease
s 1,2
22
1,2
07
1,2
01
1,1
75
1,1
65
Tota
l G
razi
ng A
cres
1,7
78
,280
1,7
83
,813
1,7
86
,77
4
1,7
73
,24
9
1,7
77,7
58
Gra
zin
g R
even
ue/
Acr
e G
raze
d
$0.8
8
$0.8
5
$0
.85
$1
.05
$0
.81
Pri
ce p
er A
UM
$5
.12
$5
.13
$5
.25
Ag L
and
Lea
se R
even
ue
$280,0
05
$270,3
71
$329,2
98
$2
77
,79
0
$3
99
,69
6
No. o
f A
gri
cult
ure
Lea
ses
77
75
7
3
71
67
Agri
cult
ure
Acr
es L
ease
d
20
,264
19,6
99
18
,99
8
18,3
29
18
,35
0
Rev
enu
e/L
ease
d A
gri
cult
ura
l A
cre
$13.8
1
$13.7
2
$1
7.3
3
$1
5.1
5
$2
1.7
8
Res
iden
tial
an
d C
om
m. L
and
Lea
se R
even
ue
$6,7
78,9
82
$6,5
54,1
79
$7,0
91,5
12
$6
,89
9,6
15
$9
,07
8,0
44
No. o
f R
esid
enti
al a
nd
Com
m. L
and L
ease
s 747
695
6
83
67
2
68
4
Acr
es o
f R
esid
enti
al a
nd
Co
mm
. L
ease
16
,993
17,1
16
16
,43
5
16,4
50
16
,69
6
Rev
enu
e/R
esid
enti
al a
nd
Co
mm
. A
cre
$398.9
2
$382.9
4
$43
1.4
8
$4
19
.42
$5
43
.72
Tim
ber
an
d F
ore
st P
rod
uct
s R
even
ue
$61,7
65,9
64
$50,4
25,8
22
$36,3
03,9
06
$5
4,1
06
,083
$5
0,7
60
,589
Acr
es o
f F
ore
st M
anag
ed
971
,613
971
,678
977
,42
9
97
7,0
05
97
7,5
29
Rev
enu
e/A
cre
of
Fo
rest
Man
aged
$63.5
7
$51.8
9
$3
7.1
4
$5
5.3
7
$5
1.9
2
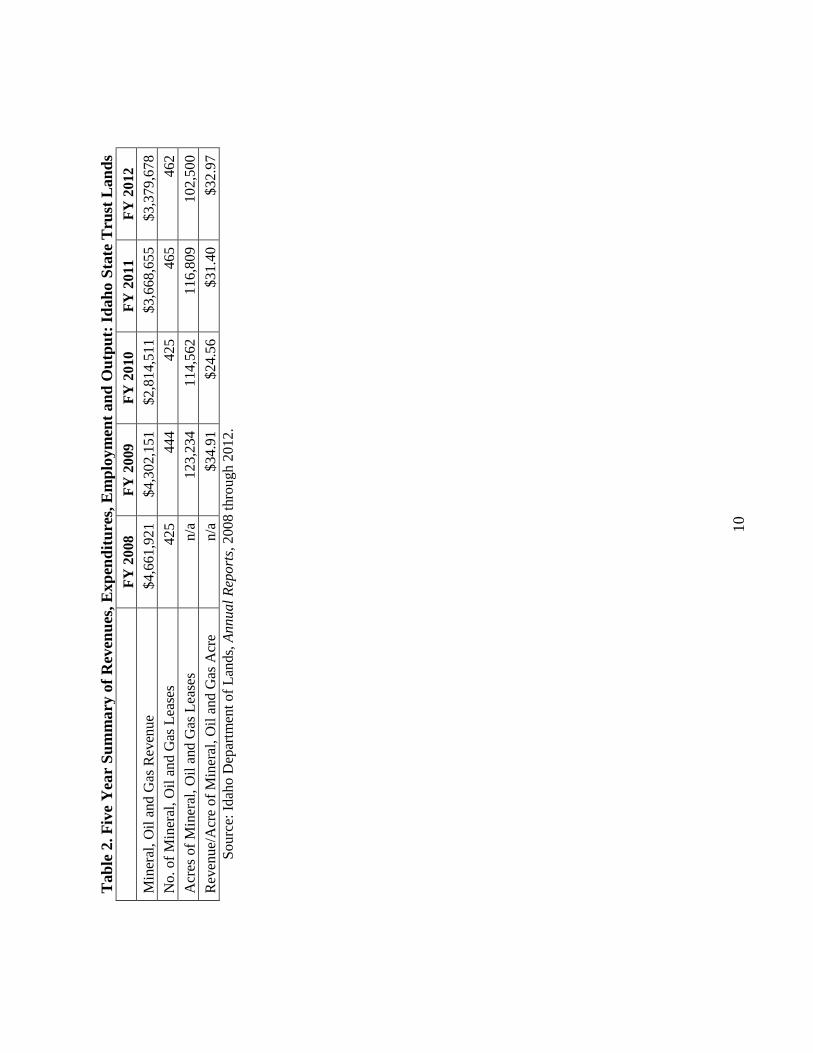
10
Ta
ble
2. F
ive
Yea
r S
um
ma
ry o
f R
even
ues
, E
xp
end
itu
res,
Em
plo
ym
ent
an
d O
utp
ut:
Id
ah
o S
tate
Tru
st L
an
ds
FY
2008
FY
2009
FY
2010
FY
20
11
FY
20
12
Min
eral
, O
il a
nd
Gas
Rev
enu
e $4,6
61,9
21
$4,3
02,1
51
$2,8
14,5
11
$3
,66
8,6
55
$3
,37
9,6
78
No. o
f M
iner
al, O
il a
nd
Gas
Lea
ses
425
444
4
25
46
5
46
2
Acr
es o
f M
iner
al, O
il a
nd
Gas
Lea
ses
n/a
123
,234
114
,56
2
11
6,8
09
10
2,5
00
Rev
enu
e/A
cre
of
Min
eral
, O
il a
nd G
as A
cre
n/a
$34.9
1
$2
4.5
6
$3
1.4
0
$3
2.9
7
So
urc
e: I
dah
o D
epar
tmen
t of
Lan
ds,
Annual
Rep
ort
s, 2
008 t
hro
ugh 2
01
2.

11
Tab
le 3
. F
ive
Yea
r S
um
ma
ry o
f R
even
ues
, E
xp
end
itu
res,
Em
plo
ym
ent
an
d O
utp
ut:
New
Mex
ico S
tate
Tru
st L
an
ds
FY
2008
FY
2009
FY
20
10
FY
20
11
FY
20
12
Rev
enue
$546,1
94,9
08
$526,5
34,5
38
$420,2
76
,40
0
$4
99
,21
1,1
75
$6
52
,34
7,9
10
Expen
se
$13,2
36,0
00
$13,1
84,1
00
$12,9
75
,900
$1
2,9
48
,500
$1
3,1
72
,000
Net
Rev
enu
e $532,9
58,9
08
$513,3
50,4
38
$407,3
00
,50
0
$4
86
,26
2,6
75
$6
39
,17
5,9
10
Tota
l S
urf
ace
Acr
es
8,9
24,6
20
8,9
75,6
44
8,9
76
,37
3
8,9
73
,72
1
8,9
66
,45
6
Tota
l S
ub
surf
ace
Acr
es
12,6
87,7
04
12,6
87,7
04
12,6
90
,44
2
12
,68
9,0
29
12
,68
3,5
92
Rev
enue/
Su
rfac
e A
cre
$61.2
0
$5
8.6
6
$4
6.8
2
$55
.63
$7
2.7
5
Expen
se/S
urf
ace
Acr
e $1.4
8
$1.4
7
$1
.45
$1
.44
$1
.47
Net
Rev
enu
e/S
urf
ace
Acr
e $59.7
2
$57.1
9
$4
5.3
7
$5
4.1
9
$7
1.2
8
Rev
enue/
Su
bsu
rfac
e A
cre
$43
.05
$41
.50
$3
3.1
1
$39
.34
$5
1.4
3
Expen
se/S
ubsu
rfac
e A
cre
$1
.04
$1.0
3
$1
.02
$1
.02
$1
.04
Net
Rev
enu
e/S
ub
surf
ace
Acr
e $42
.01
$40
.47
$3
2.0
9
$38
.32
$5
0.3
9
Tota
l F
TE
s 155
155
1
53
15
1
15
1
Surf
ace
Acr
es/F
TE
57,5
78
57
,907
58
,66
9
59
,42
8
59
,38
0
Rev
enue/
FT
E
$3,5
23,8
38
$3,3
96,9
97
$2,7
46
,90
4
$3
,30
6,0
34
$4
,32
0,1
84
Expen
se/F
TE
$85,3
93
$85,0
58
$8
4,8
09
$8
5,7
51
$8
4,1
05
Net
Rev
enu
e/F
TE
$3,4
38,4
44
$3,3
11,9
38
$2,6
62
,09
4
$3
,22
0,2
82
$4
,23
2,9
53
Gra
zing a
nd
Cro
pla
nd
Lea
se R
even
ue
$7,0
82,7
51
$7,4
27,3
44
$5,2
16
,78
4
$5
,91
8,1
44
$5
,42
9,6
88
No.
of
Gra
zin
g a
nd
Cro
pla
nd
Lea
ses
357
0
n/a
n
/a
n/a
n
/a
Tota
l G
razi
ng a
nd
Cro
pla
nd
Lea
se A
cres
8
,831,0
88
8,8
21,2
83
8,8
58
,69
2
8,8
48
,59
1
8,8
71
,71
4
Gra
zing a
nd
Cro
pla
nd
Rev
enu
e/L
ease
d A
cre
$0.8
0
$0.8
4
$0
.59
$0
.67
$0
.61
Pri
ce p
er A
UM
$3.8
6
$4.0
7
$2
.71
$3
.19
$2
.88
Oil
& G
as L
ease
Rev
enu
e $509,8
13,1
15
$407,3
28,4
04
$389,9
53
,35
9
$4
67
,66
3,0
89
$6
20
,27
8,9
57
No.
of
Oil
an
d G
as L
ease
s 482
452
4
18
37
6
32
4
Acr
es o
f O
il a
nd
Gas
Lea
ses
131,5
73
131,3
34
12
5,1
80
10
1,7
21
10
0,7
77
Oil
and
Gas
Rev
enu
e/L
ease
d A
cre
$3,8
74
.75
$3,1
01.4
7
$3
,11
5.1
4
$4
,59
7.5
0
$6
,15
4.9
7
Min
eral
Rev
enu
e $6,9
92,5
16
$17,6
82,6
15
$11,1
04
,227
$1
2,1
59
,202
$1
4,5
46
,914
No.
of
Min
eral
Lea
ses
220
191
1
96
18
4
17
4
Acr
es o
f M
iner
al L
ease
s 1
57,4
53
152,5
07
16
9,5
74
18
3,8
11
18
6,7
38
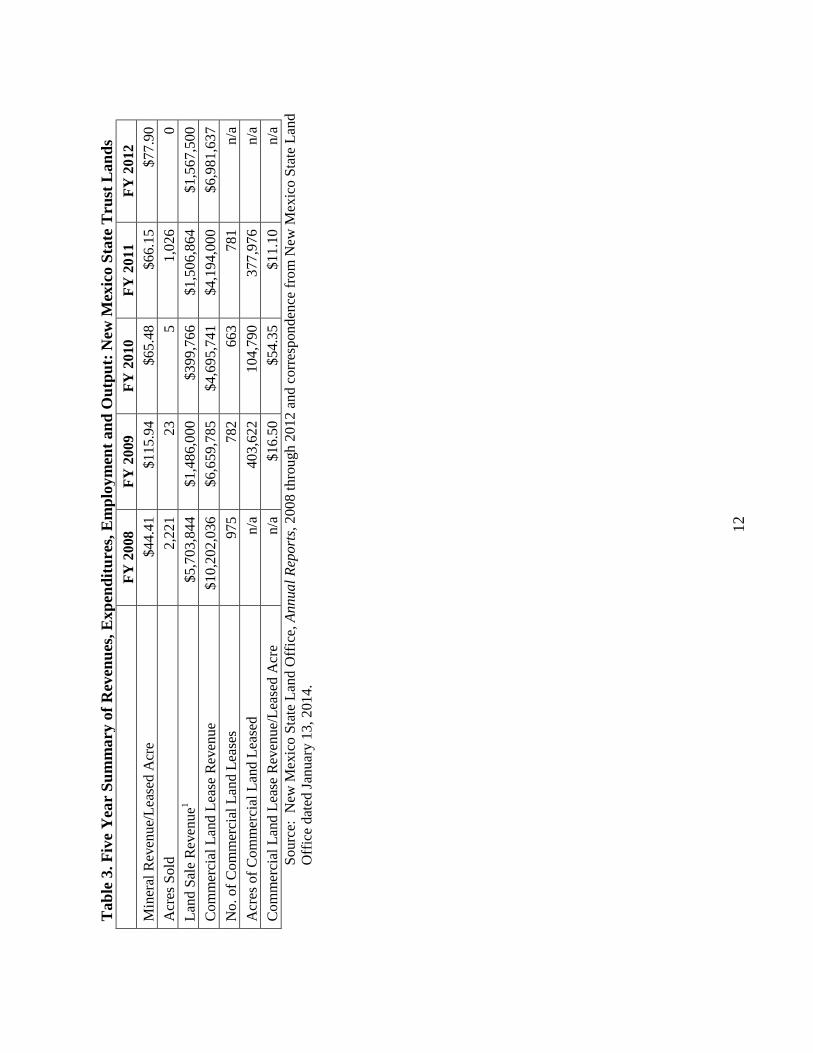
12
Tab
le 3
. F
ive
Yea
r S
um
ma
ry o
f R
even
ues
, E
xp
end
itu
res,
Em
plo
ym
ent
an
d O
utp
ut:
New
Mex
ico S
tate
Tru
st L
an
ds
FY
2008
FY
2009
FY
20
10
FY
20
11
FY
20
12
Min
eral
Rev
enu
e/L
ease
d A
cre
$44
.41
$115.9
4
$6
5.4
8
$6
6.1
5
$7
7.9
0
Acr
es S
old
2,2
21
23
5
1,0
26
0
Lan
d S
ale
Rev
enu
e1
$5,7
03,8
44
$1,4
86,0
00
$3
99,7
66
$1
,50
6,8
64
$1
,56
7,5
00
Com
mer
cial
Lan
d L
ease
Rev
enu
e $10,2
02,0
36
$6,6
59,7
85
$4,6
95
,74
1
$4
,19
4,0
00
$6
,98
1,6
37
No.
of
Co
mm
erci
al L
and L
ease
s 975
782
6
63
78
1
n/a
Acr
es o
f C
om
mer
cial
Lan
d L
ease
d
n/a
403,6
22
10
4,7
90
37
7,9
76
n/a
Com
mer
cial
Lan
d L
ease
Rev
enu
e/L
ease
d A
cre
n/a
$16.5
0
$5
4.3
5
$1
1.1
0
n/a
S
ou
rce:
N
ew M
exic
o S
tate
Lan
d O
ffic
e, A
nnual
Rep
ort
s, 2
008 t
hro
ugh 2
012 a
nd c
orr
esp
on
den
ce f
rom
New
Mex
ico
Sta
te L
and
Off
ice
dat
ed J
anuar
y 1
3, 2014.

13
Tab
le 4
. F
ive
Yea
r S
um
ma
ry o
f R
even
ues
, E
xp
end
itu
res,
Em
plo
ym
ent
an
d O
utp
ut:
Uta
h S
tate
Tru
st L
an
ds
FY
2008
FY
2009
FY
2010
FY
20
11
FY
20
12
Rev
enu
es
$151,1
27,8
06
$138,2
58,0
00
$115,2
81,4
00
$1
21
,73
0,4
13
$1
29
,34
1,8
02
Op
erat
ing E
xp
endit
ure
s $
9,1
19,3
10
$9,5
37,8
48
$8,5
86,0
66
$9
,00
5,0
48
$9
,62
6,9
19
Cap
ital
Exp
endit
ure
s $10,1
34,9
97
$13,6
03,4
53
$12,2
87,2
99
$1
,84
5,6
89
$2
,59
4,7
91
Tota
l E
xp
end
itu
res
$19,2
54,3
07
$23,1
41,3
01
$20,8
73,3
65
$1
0,8
50
,735
$1
2,2
21
,710
Net
Rev
enu
e $131,8
73,4
99
$115,1
16,6
99
$94
,408,0
35
$1
10
,87
9,6
78
$1
17
,12
0,0
92
Tota
l A
cres
3,4
11
,514
3,4
07
,235
3,4
04
,63
5
3,4
02
,25
0
3,4
02,2
50
Rev
enu
e/A
cre
$44.2
9
$40.5
7
$33.8
6
$3
5.7
7
$3
8.0
1
Op
erat
ing E
xp
ense
/Acr
e $2.6
7
$2.7
9
$2.5
2
$2
.64
$2
.82
Net
Rev
enu
e/A
cre
$38.6
5
$33.7
8
$27.7
2
$3
2.5
9
$3
4.4
2
Tota
l F
TE
s 66
68
7
4
72
71
Acr
es/F
TE
51
,689
50,1
06
46,0
08
47
,25
3
47,9
19
Rev
enu
e/F
TE
$2,2
89,8
15
$2,0
33,2
05
$1,5
57,8
56
$1
,69
0,7
00
$1
,82
1,7
15
Op
erat
ing E
xp
ense
/FT
E
$138,1
71
$140,2
62
$116,0
27
$1
25
,07
0
$1
35
,59
0
Net
Rev
enu
e/F
TE
$1,9
98,0
83
$1,6
92,8
92
$1,2
75,7
84
$1
,53
9,9
95
$1
,64
9,5
78
Surf
ace
Man
agem
ent
Rev
enu
es
$10,1
34,0
11
$9,3
67,0
00
$7,4
66,7
00
$8
,75
7,3
92
$8
,64
1,2
48
Lan
d D
evel
op
men
t R
even
ue
$25,0
27,0
69
$4,4
27,0
00
$3,9
00,9
00
$3
,91
2,2
95
$4
,45
9,3
00
Oil
& G
as L
ease
Rev
enu
e $76,5
70,1
37
$75,4
12,0
00
$56,2
69,4
00
$6
0,9
09
,236
$5
9,1
29
,505
Co
al a
nd
Oth
er M
iner
al R
even
ue
$81,9
08,6
39
$20,9
65,0
00
$21,1
16,2
00
$1
8,6
19
,526
$1
6,7
84
,842
Inves
tmen
t R
even
ue
$41,7
97,8
98
$32,5
46,3
00
$26,5
28,2
00
$2
9,5
28
,681
$4
0,3
03
,434
Lan
d S
ale
Rev
enu
e $24,1
04,0
25
$3,3
01,5
82
$3,0
59,5
99
$3
,14
5,0
89
$3
,53
7,2
38
Acr
es o
f L
and
So
ld
6,8
35
6,5
73
1,1
53
2,3
85
30
9
S
ou
rce:
Uta
h S
cho
ol
and T
rust
Lan
d A
dm
inis
trat
ion,
Annual
Rep
ort
s, 2
008 t
hro
ugh
20
12
and
em
ail
fro
m D
ian
e L
un
d,
Uta
h
Sta
te S
choo
l an
d T
rust
Lan
d A
dm
inis
trat
ion d
ated
Jan
uar
y 2
8,
2014.

14
Table 5. Observed High, Low and Five Year Average, 2008-2012 – Arizona State Trust
Lands
Observed
High
Observed
Low
5-Year
Average
Revenues $382,385,591 $155,429,218 $237,677,035
Expenses $23,880,660 $13,455,900 $16,808,652
Net Revenue $364,296,891 $131,548,558 $220,868,383
Total Acres Managed 9,302,255 9,252,495 $9,266,468
Revenue/Acre $41.00 $16.78 $24.85
Expense/Acre $2.58 $1.45 $1.81
Net Revenue/Acre $39.00 $14.00 $23.68
Total FTEs 175 124 155
Acres/FTE 74,616 52,910 60,569
Revenue/FTE $2,185,060 $1,253,461 $1,522,220
Expense/FTE $155,069 $81,609 $109,192
Net Revenue/FTE $2,210,321 $854,211 $1,413,027
Grazing Revenue $2,559,337 $2,390,769 $2,445,860
No. Grazing Leases 1,247 1,224 1,241
Total Grazing Acres 8,408,033 8,368,575 8,393,381
Grazing Revenue/Acre Grazed $3.00 $3.00 $3.00
Price per AUM $2.41 $2.23 $2.30
Agriculture Lease Revenue $4,944,449 $4,201,575 $4,487,694
No. of Agriculture Leases 387 347 366.8
Agriculture Acres Leased 170,487 156,575 162,715
Revenue/Leased Agricultural Acre $30.00 $24.00 $27.00
Oil & Gas Lease Revenue $1,614,618 $399,937 $925,624
No. of Oil & Gas Leases 519 204 369
Oil & Gas Acres Leased 1,004,792 330,833 681,742
Oil & Gas Lease Revenue/Leased Acre $3.17 $0.70 $1.48
Mineral Lease Revenue $2,800,008 $719,000 $1,516,929
No. of Mineral Leases 1,091 475 689
Mineral Acres Leased 526,017 179,273 299,761
Mineral Lease Revenue/Leased Acre $14.00 $2.00 $5.40
Oil, Gas and Mineral Royalty Revenue $39,756,402 $2,562,652 $18,900,395
Oil, Gas and Mineral Royalty Revenue/Acre Leased $46.39 $2.16 $21.81
Acres Sold 9,600.44 918.36 3,898.76
Land Sale Revenue $125,997,000 $19,151,000 $88,231,707
Land Sale Revenue/Acre Sold $63,177 $12,487 $33,417
Source: Calculated from data in Table 1.

15
Table 6. Observed High, Low and Five Year Average; 2008-2012 – Idaho Trust
Lands
Observed
High
Observed
Low
5 Year
Avg.
Revenues $75,490,986 $48,276,287 $64,104,703
Expenses $23,854,935 $20,161,083 $22,214,968
Net Revenue $55,329,903 $25,591,016 $41,889,735
Total Acres 2,446,335 2,449,255 2,450,355
Revenue/Acre $30.00 $19.00 $25.40
Expense/Acre $9.00 $6.00 $8.60
Net Revenue/Acre $22.00 $10.00 $16.60
Total FTEs 264 259 262
Acres/FTE 9,453 9,266 9,345.6
Revenue/FTE $285,950 $182,864 $244,574
Expense/FTE $92,103 $76,367 $84,768
Net Revenue/FTE $209,582 $96,935 $159,805
Grazing Revenue $1,878,863 $1,439,217 $1,588,969
Grazing Leases 1,222 1,165 1,194
Total Grazing Acres 1,786,774 1,773,249 1,77,9975
Grazing Revenue/Acre Grazed $1.05 $0.81 $0.89
Price per AUM $5.25 $5.12 $5.17
Ag Land Lease Revenue $399,696.00 $270,371.00 $311,432
No. of Agriculture Leases 77 67 72.6
Agriculture Acres Leased 20,264 18,329 19,128
Revenue/Leased Agricultural Acre $21.78 $13.72 $16
Residential and Comm. Land Lease Revenue $9,078,044 $6,554,179 $7,280,466
No. of Residential and Comm. Land Leases 747 672 696
Acres of Residential and Comm. Lease 17,116 16,435 16,738
Revenue/Residential and Comm. Acre $543.72 $382.94 $435.30
Timber and Forest Products Revenue $61,765,964 $36,303,906 $50,672,473
Acres of Forest Managed 977,529 971,613 975,051
Revenue/Acre of Forest Managed $63.57 $37.14 $52
Mineral, Oil and Gas Revenue $4,661,921 $2,814,511 $3,765,383
No. of Mineral, Oil and Gas Leases 465 425 444
Acres of Mineral, Oil and Gas Leases 123,234 102,500 114,276
Revenue/Acre of Mineral, Oil and Gas Acre $34.91 $24.56 $30.96
Source: Calculated from data in Table 2.

16
Table 7. Observed High, Low and Five Year Average; 2008-2012 - New Mexico Trust
Lands
Observed
High
Observed
Low
5-Year
Average
Revenue $652,347,910 $420,276,400 $528,912,986
Expense $13,236,000 $12,948,500 $13,103,300
Net Revenue $639,111,910 $407,300,500 $515,809,686
Total Surface Acres 8,976,373 8,924,620 8,963,363
Total Subsurface Acres 12690442 12,683,592 12,687,694
Revenue/Surface Acre $72.75 $46.82 $59.01
Expense/Surface Acre $1.48 $1.44 $1.46
Net Revenue/Surface Acre $71.28 $45.37 $57.55
Revenue/Subsurface Acre $51.43 $33.11 $41.68
Expense/Subsurface Acre $1.04 $1.02 $1.03
Net Revenue/Subsurface Acre $50.39 $32.09 $40.65
Total FTEs 155 151 153
Surface Acres/FTE 59,428 57,578 58,592
Revenue/FTE $4,320,184 $2,746,904 $3,458,791
Expense/FTE $85,751 $85,393 $85,023
Net Revenue/FTE $4,311,461 $2,662,094 $3,373,142
Grazing and Cropland Lease Revenue $7,427,344 $5,216,784 $6,214,942
Total Grazing and Cropland Lease Acres 8,871,714 8,821,283 8,846,273
Grazing and Cropland Revenue/Leased Acre $0.84 $0.59 $0.70
Price per AUM $4.07 $2.71 $3.34
Oil & Gas Lease Revenue $620,278,957 $389,953,359 $479,007,385
No. of Oil and Gas Leases 482 324 410
Acres of Oil and Gas Leases 131,573 100,777 118,117
Oil and Gas Revenue/Leased Acre $6,154.97 $3,101.47 $4,168.77
Mineral Revenue $17,682,615 $6,992,516 $12,497,095
No. of Mineral Leases 220 174 193
Acres of Mineral Leases 186,738 152,507 170,116
Mineral Revenue/Leased Acre $115.94 $44.41 $73.98
Acres Sold 2,221 0 665
Land Sale Revenue $5,703,844 $399,766 $2,132,795
Commercial Land Lease Revenue $10,202,036 $4,194,000 $6,546,640
No. of Commercial Land Leases
975 663 800a
Acres of Commercial Land Leased
403,622 104,790 295,463b
Commercial Land Lease Revenue/Leased Acre
$54.35 $11.10 $27.31b
a/ Four year average.
b/ Three year average.
Source: Calculated from data in Table 3.

17
Table 8. Observed High, Low and Five Year Average; 2008-2012 – Utah
Trust Lands
Observed
High
Observed
Low
5-Year
Average
Revenues $151,127,806 $115,281,400 $131,147,884
Operating Expenditures $9,626,919 $8,586,066 $9,175,038
Capital Expenditures $13,603,453 $1,845,689 $8,093,246
Total Expenditures $23,141,301 $10,850,735 $17,268,284
Net Revenue $131,873,499 $94,408,035 $113,879,601
Total Acres 3,411,514 3,402,250 3,405,577
Revenue/Acre $44.29 $33.86 $38.50
Operating Expense/Acre $2.82 $2.52 $2.69
Net Revenue/Acre $38.65 $27.72 $33.43
Total FTEs 74 66 70
Acres/FTE 51,689 46,008 48,595
Revenue/FTE $2,289,815 $1,557,856 $1,878,658
Operating Expense/FTE $140,262 $116,027 $131,024
Net Revenue/FTE $1,998,083 $1,275,784 $1,631,266
Surface Management Revenues $10,134,011 $7,466,700 $8,873,270
Land Development Revenue $25,027,069 $3,900,900 $8,345,313
Oil & Gas Lease Revenue $76,570,137 $56,269,400 $65,658,056
Coal and Other Mineral Revenue $81,908,639 $16,784,842 $31,878,841
Investment Revenue $41,797,898 $26,528,200 $34,140,903
Land Sale Revenue $24,104,025 $3,059,599 $7,429,507
Annual Acres of Land Sold 6,835 309 3,451
Source: Calculated from data in Table 5.
Table 9. Five Year Average Revenues, Expenditures and Employment In Selected States
Arizona Idaho New Mexico Utah
Revenues $237,677,035 $64,104,703 $528,912,986 $131,147,884
Expenses $16,808,652 $22,214,968 $13,103,300 $9,175,038
Net Revenue $220,868,383 $41,889,735 $518,809,686 $113,879,601
Total Acres Managed 9,266,468 2,450,355 8,963,363 3,405,577
Revenue/Acre $24.85 $25.40 $59.01 $38.50
Expense/Acre $1.81 $8.60 $1.46 $2.69
Net Revenue/Acre $23.68 $16.60 $57.55 $33.43
Total FTEs 155 262 153 70
Acres/FTE 60,569 9,346 58,592 48,595
Revenue/FTE $1,522,220 $244,574 $3,458,791 $1,878,658
Operating Expense/FTE $109,192 $84,768 $85,023 $131,024
Net Revenue/FTE $1,413,027 $159,805 $3,373,142 $1,631,266
Source: Calculated from Tables 1 through 5.

18
Table 10. Five-Year Multi-State Observed High, Observed Low and
Average for State Trust Lands in Arizona, Idaho, New Mexico
and Utah; 2008-2012
Observed High Observed Low Average
Revenues $652,347,910 $48,276,287 $240,460,652
Expenses $23,880,660 $8,586,066 $15,325,490
Net Revenue $639,111,910 $25,591,016 $223,111,851
Total Acres
Managed 9,302,255 2,449,255 6,021,441
Revenue/Acre $72.40 $16.78 $36.79
Expense/Acre $9.00 $1.45 $3.73
Net
Revenue/Acre $72.26 $10.00 $28.59
Total FTEs 264 66 160
Acres/FTE 74,616 9,266 44,275
Revenue/FTE $4,320,184 $182,864 $1,776,061
Expense/FTE $155,069 $76,367 $102,502
Net
Revenue/FTE $4,311,461 $96,935 $1,644,310
Source: Data in Tables 1 through 5.
As shown in Table 10, estimated average revenue per acre during the past five years across the
four states considered was $36.79. This average compares to observed high and low revenues of
$72.40 and $16.78 per acre, respectively. State trust land management expenses in the four
states averaged an estimated $3.73 per acre during the period 2008 through 2012. During this
same time frame, the observed high and low expense levels per acre were $9.00 and $1.45,
respectively (see Table 10). The ranges of costs, revenues, employment and output presented in
Tables 1 through 10 suggest bounding assumptions within which estimates of fiscal outcome
associated with an expanded state land base in Nevada might be developed.
Estimated Costs and Revenues for an Expanded Nevada State Land Base
A primary objective of this study is the development of estimates of the potential costs and
revenues which might attend Congressional transfer to, and management by, the State of Nevada
of an expanded state land base comprising an assumed 7.2 million acres (as compared to the total
current acreage of State-owned lands of approximately 196,000 acres, of which 2,900 are state
trust lands). Information regarding the prospective fiscal viability of expanded state land
ownership is essential to decision-makers who might now or may in the future deliberate upon
the merits of pursuing a congressional transfer of federally administered land to Nevada.
The foregoing analysis of state land management agency costs and revenues for Arizona, Idaho,
New Mexico and Utah provides a set of bounds within which assumptions about fiscal outcome
associated with an expanded state land base in Nevada can be made. With regard to revenue
potential, the state of Arizona is likely most analogous to Nevada due to the limited timber, coal
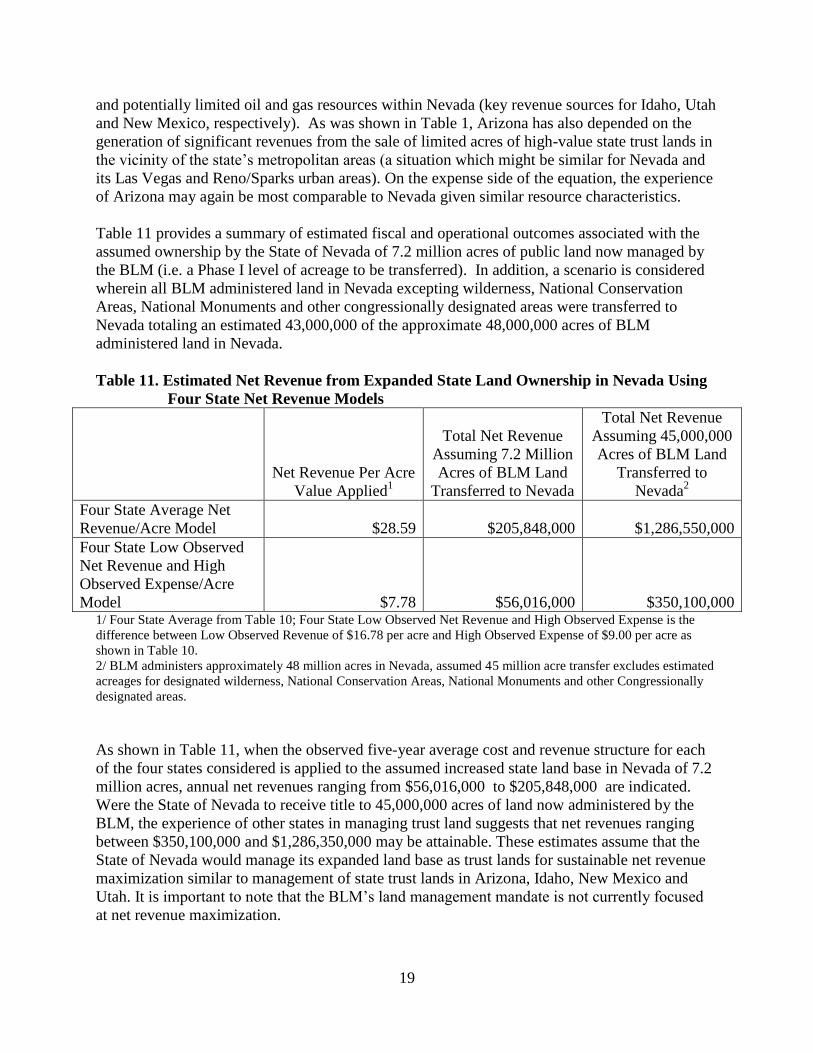
19
and potentially limited oil and gas resources within Nevada (key revenue sources for Idaho, Utah
and New Mexico, respectively). As was shown in Table 1, Arizona has also depended on the
generation of significant revenues from the sale of limited acres of high-value state trust lands in
the vicinity of the state’s metropolitan areas (a situation which might be similar for Nevada and
its Las Vegas and Reno/Sparks urban areas). On the expense side of the equation, the experience
of Arizona may again be most comparable to Nevada given similar resource characteristics.
Table 11 provides a summary of estimated fiscal and operational outcomes associated with the
assumed ownership by the State of Nevada of 7.2 million acres of public land now managed by
the BLM (i.e. a Phase I level of acreage to be transferred). In addition, a scenario is considered
wherein all BLM administered land in Nevada excepting wilderness, National Conservation
Areas, National Monuments and other congressionally designated areas were transferred to
Nevada totaling an estimated 43,000,000 of the approximate 48,000,000 acres of BLM
administered land in Nevada.
Table 11. Estimated Net Revenue from Expanded State Land Ownership in Nevada Using
Four State Net Revenue Models
Net Revenue Per Acre
Value Applied1
Total Net Revenue
Assuming 7.2 Million
Acres of BLM Land
Transferred to Nevada
Total Net Revenue
Assuming 45,000,000
Acres of BLM Land
Transferred to
Nevada2
Four State Average Net
Revenue/Acre Model
$28.59
$205,848,000
$1,286,550,000
Four State Low Observed
Net Revenue and High
Observed Expense/Acre
Model
$7.78
$56,016,000
$350,100,000 1/ Four State Average from Table 10; Four State Low Observed Net Revenue and High Observed Expense is the
difference between Low Observed Revenue of $16.78 per acre and High Observed Expense of $9.00 per acre as
shown in Table 10.
2/ BLM administers approximately 48 million acres in Nevada, assumed 45 million acre transfer excludes estimated
acreages for designated wilderness, National Conservation Areas, National Monuments and other Congressionally
designated areas.
As shown in Table 11, when the observed five-year average cost and revenue structure for each
of the four states considered is applied to the assumed increased state land base in Nevada of 7.2
million acres, annual net revenues ranging from $56,016,000 to $205,848,000 are indicated.
Were the State of Nevada to receive title to 45,000,000 acres of land now administered by the
BLM, the experience of other states in managing trust land suggests that net revenues ranging
between $350,100,000 and $1,286,350,000 may be attainable. These estimates assume that the
State of Nevada would manage its expanded land base as trust lands for sustainable net revenue
maximization similar to management of state trust lands in Arizona, Idaho, New Mexico and
Utah. It is important to note that the BLM’s land management mandate is not currently focused
at net revenue maximization.
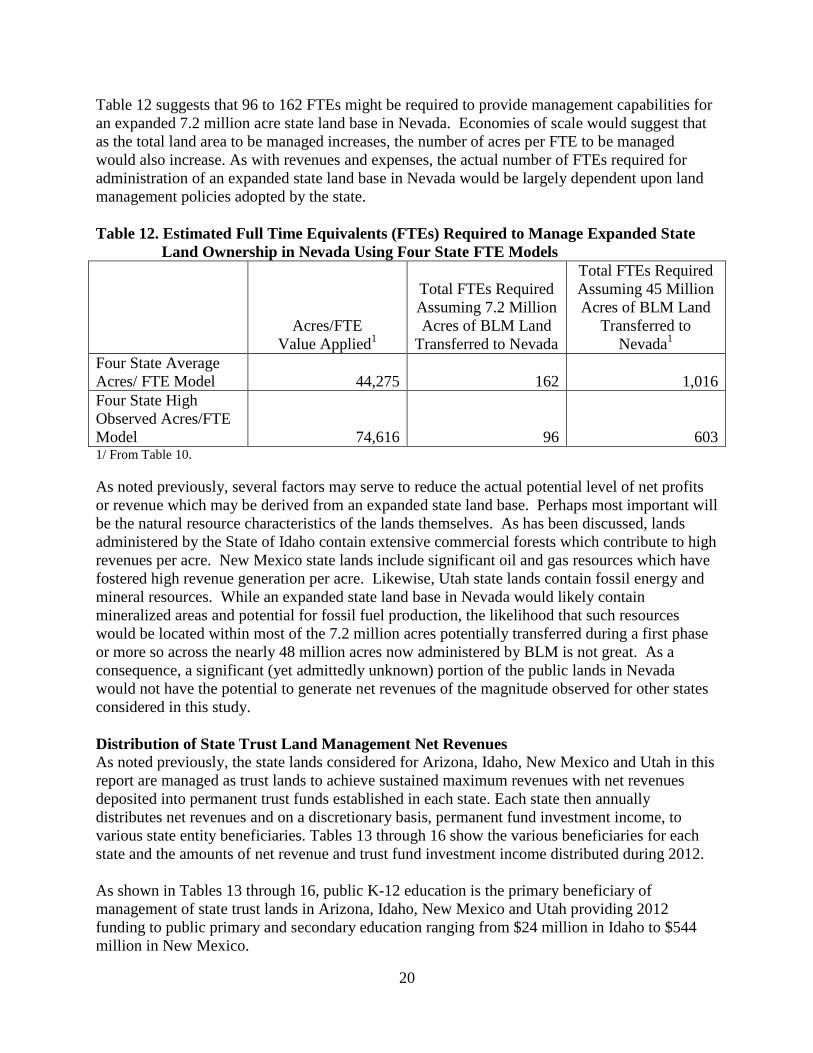
20
Table 12 suggests that 96 to 162 FTEs might be required to provide management capabilities for
an expanded 7.2 million acre state land base in Nevada. Economies of scale would suggest that
as the total land area to be managed increases, the number of acres per FTE to be managed
would also increase. As with revenues and expenses, the actual number of FTEs required for
administration of an expanded state land base in Nevada would be largely dependent upon land
management policies adopted by the state.
Table 12. Estimated Full Time Equivalents (FTEs) Required to Manage Expanded State
Land Ownership in Nevada Using Four State FTE Models
Acres/FTE
Value Applied1
Total FTEs Required
Assuming 7.2 Million
Acres of BLM Land
Transferred to Nevada
Total FTEs Required
Assuming 45 Million
Acres of BLM Land
Transferred to
Nevada1
Four State Average
Acres/ FTE Model 44,275 162 1,016
Four State High
Observed Acres/FTE
Model 74,616 96 603 1/ From Table 10.
As noted previously, several factors may serve to reduce the actual potential level of net profits
or revenue which may be derived from an expanded state land base. Perhaps most important will
be the natural resource characteristics of the lands themselves. As has been discussed, lands
administered by the State of Idaho contain extensive commercial forests which contribute to high
revenues per acre. New Mexico state lands include significant oil and gas resources which have
fostered high revenue generation per acre. Likewise, Utah state lands contain fossil energy and
mineral resources. While an expanded state land base in Nevada would likely contain
mineralized areas and potential for fossil fuel production, the likelihood that such resources
would be located within most of the 7.2 million acres potentially transferred during a first phase
or more so across the nearly 48 million acres now administered by BLM is not great. As a
consequence, a significant (yet admittedly unknown) portion of the public lands in Nevada
would not have the potential to generate net revenues of the magnitude observed for other states
considered in this study.
Distribution of State Trust Land Management Net Revenues
As noted previously, the state lands considered for Arizona, Idaho, New Mexico and Utah in this
report are managed as trust lands to achieve sustained maximum revenues with net revenues
deposited into permanent trust funds established in each state. Each state then annually
distributes net revenues and on a discretionary basis, permanent fund investment income, to
various state entity beneficiaries. Tables 13 through 16 show the various beneficiaries for each
state and the amounts of net revenue and trust fund investment income distributed during 2012.
As shown in Tables 13 through 16, public K-12 education is the primary beneficiary of
management of state trust lands in Arizona, Idaho, New Mexico and Utah providing 2012
funding to public primary and secondary education ranging from $24 million in Idaho to $544
million in New Mexico.

21
Table 13. Distribution of State Trust Land Net Revenue and Investment Income by
Beneficiary - Arizona; 2012 Trust Acres Total Receipts
($)
BENEFICIARIES
Common Schools
(K—12)‡
8,088,270.54
272,560,356.05
Normal Schools Grant 174,797.56 309,776.02
Agricultural &
Mechanical Colleges
124,943.87
367,276.93
Military Institutes Grant 80,168.11 61,108.41
School of Mines Grant 123,254.09 555,363.13
University Land Code 137,906.42 1,874,540.22
University of Arizona (Act of 2/18/1881) 51,881.13 1,749,257.72
School for the Deaf & Blind 82,559.65 399,040.46
Legislative, Executive & Judicial Buildings 64,257.10 726,847.71
State Hospital Grant 71,248.39 851,716.17
Miners' Hospital Grant† 95,383.13 5,391,036.87
State Charitable, Penal, and Reformatory 77,228.58 6,634,465.60
Penitentiary Grant 76,110.72 1,475,846.60 † Miners’ Hospital and Miners’ Hospital 1929 combined
‡ Including County Bonds
Source: Arizona State Land Department, Annual Report, 2012.
Table 14. Distribution of State Trust Land Net Revenue and Investment Income by
Beneficiary - Idaho; 2012
Beneficiaries Total Receipts
($)
Agricultural
College
1,646,080
Capitol Permanent (351,963) Charitable Inst. 4,572,497 Normal School 627,308 Penitentiary Inc. 2,350,053 Public Schools 24,570,082 School of Science 2,470,613 State Hospital South 3,524,851 University of Idaho 2,985,127 Source: Idaho Department of Lands, Annual Report, 2012.
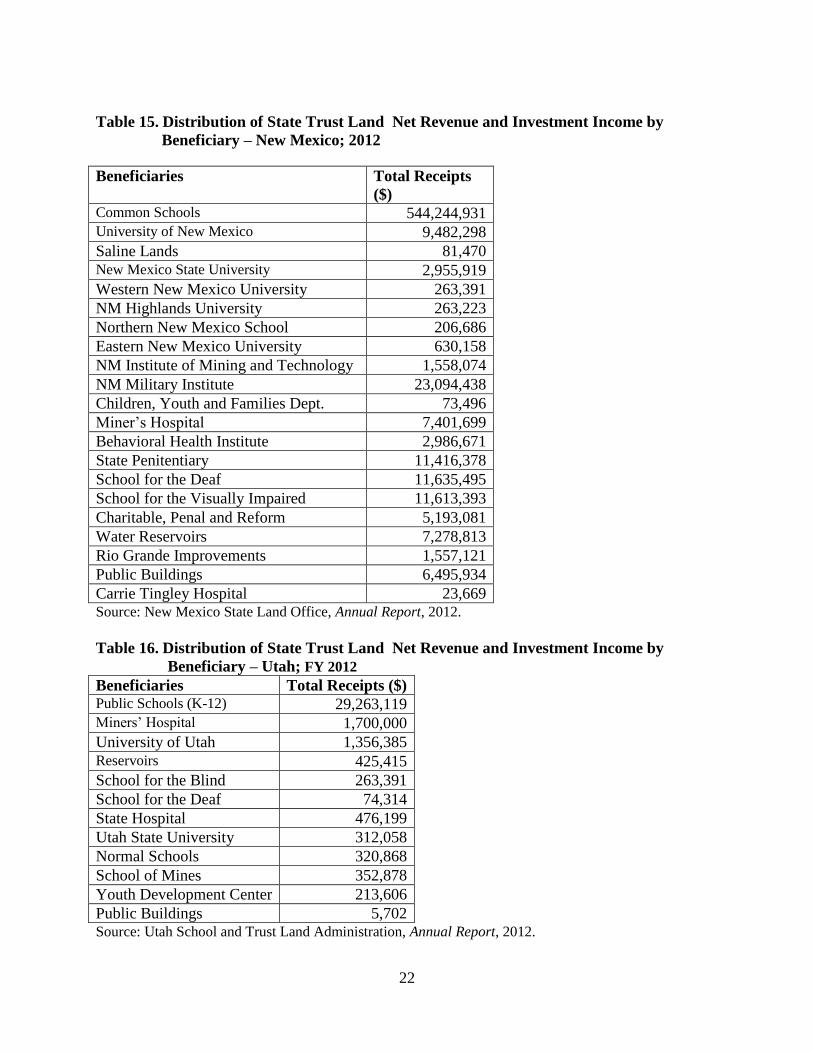
22
Table 15. Distribution of State Trust Land Net Revenue and Investment Income by
Beneficiary – New Mexico; 2012
Beneficiaries Total Receipts
($) Common Schools 544,244,931 University of New Mexico 9,482,298
Saline Lands 81,470 New Mexico State University 2,955,919
Western New Mexico University 263,391
NM Highlands University 263,223
Northern New Mexico School 206,686
Eastern New Mexico University 630,158
NM Institute of Mining and Technology 1,558,074
NM Military Institute 23,094,438
Children, Youth and Families Dept. 73,496
Miner’s Hospital 7,401,699
Behavioral Health Institute 2,986,671
State Penitentiary 11,416,378
School for the Deaf 11,635,495
School for the Visually Impaired 11,613,393
Charitable, Penal and Reform 5,193,081
Water Reservoirs 7,278,813
Rio Grande Improvements 1,557,121
Public Buildings 6,495,934
Carrie Tingley Hospital 23,669 Source: New Mexico State Land Office, Annual Report, 2012.
Table 16. Distribution of State Trust Land Net Revenue and Investment Income by
Beneficiary – Utah; FY 2012
Beneficiaries Total Receipts ($) Public Schools (K-12) 29,263,119 Miners’ Hospital 1,700,000
University of Utah 1,356,385 Reservoirs 425,415
School for the Blind 263,391
School for the Deaf 74,314
State Hospital 476,199
Utah State University 312,058
Normal Schools 320,868
School of Mines 352,878
Youth Development Center 213,606
Public Buildings 5,702 Source: Utah School and Trust Land Administration, Annual Report, 2012.
23
BLM Land Management Cost and Revenue Trends
This section of the report provides an overview of the revenues, expenditures, employment and
output associated with BLM land management activities within the states of Nevada, Arizona,
Idaho, New Mexico, and Utah. This information is included to afford perspective on annual
fiscal outcomes of existing BLM land management activities within the study area. Data for
2008 through 2012 was available for each of the five states included in this analysis. Tables 17
through 21 provide five-year summaries of cost, revenue, employment and output characteristics
of BLM land management in each state. The tables reveal that BLM administers 2-3 times as
much land in Nevada than does BLM in the other states considered. In Nevada, Arizona and
Idaho, for each of five years between 2008 and 2012, expenses associated with BLM land
management activities have exceeded revenues. BLM land management activities during this
same five-year period in New Mexico and Utah have generated net revenue (revenues have
exceeded expenses). The ability of BLM to generate net revenue is largely a function of the oil
and gas resources in New Mexico and coal resources in Utah.
Within each of the states revenues from royalties, rents and bonus payments for projects on
BLM-administered lands sent to the Department of Interior’s Office of Natural Resources
Revenue (ONRR) from oil, gas, coal and geothermal energy generation are a very significant
component of total revenues generated exceeding non-ONRR revenue sources in Idaho, New
Mexico and Utah and roughly equaling non-ONRR revenues sources in Nevada,. In Arizona
non-ONRR revenue sources greatly exceed ONRR revenue for BLM. Within Nevada, oil and
gas related ONRR revenues represent approximately 75 percent of total ONRR revenues from
BLM-administered land. The current and prospective significance of the oil and gas industry to
an expanded State of Nevada land base is demonstrated by the ONRR revenue data shown in
Table 17. Land sales (primarily associated with the Southern Nevada Public Land Management
Act) have contributed roughly one-third of non-ONRR land management revenues by BLM in
Nevada. Rights-of-way rent are the second most significant non-ONRR revenue source for BLM
Nevada. Combined, realty-related land management provided an estimated 70 to 80 percent of
BLM Nevada non-ONRR revenues during the years 2008 through 2012. Recreation fees
represent the third most important source of non-ONRR revenue for BLM in Nevada growing
from $2.7 million in 2008 to $3.8 million in 2011 before falling in 2012 to $3.6 million. During
the period 2008 through 2012, BLM Nevada collected more in recreation fees than any of the
other four state BLM programs considered.
Tables 17 reveals that employment levels (FTEs) for BLM statewide in Nevada have risen from
697 in 2008 to 745 in 2012, an increase of nearly 7 percent. Tables 18 through 21 suggest that
BLM statewide employment levels (FTEs) in the states of Arizona, Idaho, New Mexico and Utah
have stayed fairly constant during the same five-year period.

24
Tab
le 1
7. B
LM
Nev
ad
a F
ive
Yea
r R
even
ues
, E
xp
end
itu
res
an
d E
mp
loym
ent,
2008 -
2012
FY
2008
FY
2009
FY
2010
FY
20
11
FY
20
12
5-Y
r. A
vg
.
Rev
enue
Non
-ON
RR
$47,4
56,5
80
$27,1
70,0
48
$26,4
63,0
30
$2
3,8
82
,418
$2
5,1
14
,972
$3
0,0
17
,409
ON
RR
Rev
enu
e $30,7
17,8
07
$39,6
83,8
95
$26,1
51,9
69
$1
7,2
81
,366
$2
0,8
91
,112
$2
6,9
45
,229
Tota
l R
even
ue
$78,1
74,3
87
$66,8
53,9
43
$52,6
14,9
99
$4
1,1
63
,784
$4
6,0
06
,084
$5
6,9
62
,639
Expen
se
n/a
$97,6
57,0
00
$109,6
57,0
00
$10
8,3
79
,00
0
$1
08
,14
2,0
00
$8
4,7
67
,000
Net
R
even
ue
n/a
-$
30,8
03,0
57
-$
57,0
42,0
01
-$
67
,21
5,2
16
-$6
2,1
35
,91
6
-$3
1,1
18
,01
5
Tota
l A
cres
Man
aged
47
,808
,114
47
,806
,738
47,8
05
,923
47
,79
40,9
6
47
,78
3,4
58
47
,79
9,6
65
Rev
enue
Per
Acr
e M
anag
ed
$1.6
4
$1.4
0
$1.1
0
$0
.86
$0
.96
$1
.19
Expen
se P
er A
cre
Man
aged
n/a
$2.0
4
$2.2
9
$2
.27
$2
.26
$1
.77
Net
R
even
ue
Per
Acr
e M
anag
ed
n/a
-$
0.6
4
-$1.1
9
-$1
.40
-$
1.3
0
-$0
.91
Tota
l F
TE
s 697
701
755
7
86
79
0
74
5
Acr
es M
anag
ed P
er F
TE
68
,591
68
,198
63
,319
60
,80
6
60
,48
5
64
,27
9
Gra
zing R
even
ue
$1,7
36,9
00
$1,7
18,4
01
$1,7
13,4
09
$1
,93
7,7
54
$1
,88
6,5
17
$1
,79
8,5
96
No.
of
Gra
zin
g A
uth
ori
zati
on
s 516
555
536
5
70
55
5
54
6
AU
Ms
Auth
ori
zed
1,1
33
,094
1,1
38
,147
1,1
38
,171
1,3
33,3
46
1,2
91,6
10
1,2
06
,87
3
Pri
ce p
er A
UM
$1.3
5
$1.3
5
$1.3
5
$1
.35
$1
.35
$1
.35
Tim
ber
Rev
enu
e $22,4
05
$30,6
65
$29,0
78
$2
6,5
81
$2
7,2
67
$2
7,1
99
Oil
, G
as a
nd G
eoth
erm
al L
ease
Rev
enu
e
(BL
M)
$1,2
45,6
16
$167,8
28
$642,0
10
-$1
74
,77
7
$1
,03
9,0
54
$5
83
,94
6
Sal
e of
Lan
d a
nd
Min
eral
s (S
NP
LM
A s
ales
Incl
uded
) $35,1
20,7
37
$14,5
20,1
37
$14,7
95,3
98
$9
,70
2,8
08
$1
0,6
49
,922
$1
6,9
57
,800
Fee
s an
d C
om
mis
sio
ns
$3,5
60
$2,5
77
$2,9
98
$2
,31
4
$1
,30
2
$2
,55
0
Rig
hts
of
Way
Ren
t $5,3
98,2
17
$7,0
30,4
19
$6,3
22,4
40
$7
,46
1,6
63
$7
,74
2,4
20
$6
,79
1,0
31
Ren
t of
Lan
d
$1,1
55,8
70
$1,1
65,9
15
$213,1
45
$1
,03
4,5
25
$1
18
,50
2
$7
37
,59
1
Rec
reat
ion F
ees
$2,7
43,6
64
$2,5
30,7
80
$2,7
41,2
86
$3
,87
4,8
83
$3
,64
1,5
59
$3
,10
6,4
34
Oth
er R
even
ue
$29,6
11
$3,3
26
$3,2
66
$1
6,6
67
$8
,42
9
$1
2,2
59
Sourc
es:
ON
RR
Rev
enu
e dat
e fr
om
Dep
artm
ent
of
Inte
rior,
Off
ice
of
Nat
ura
l R
esourc
es R
even
ue,
Ann
ua
l R
even
ue
Rep
ort
s, 2
00
8-2
01
2;
Ex
pen
se
and F
TE
dat
a fr
om
BL
M N
evad
a S
tate
Off
ice,
corr
esponden
ce d
ated
Feb
ruar
y 1
8, 2014 f
rom
Rober
t M
. S
crug
gs,
Dep
uty
Sta
te D
irec
tor,
Su
pp
ort
Ser
vic
es,
resp
onse
to
FO
IA r
eques
t; a
ll o
ther
dat
a fr
om
U.S
. D
epar
tmen
t of
Inte
rior,
Bure
au o
f L
and
Man
agem
ent,
Pu
bli
c L
an
d S
tati
stic
s, a
nn
ual
report
s 2008 –
20
12
.
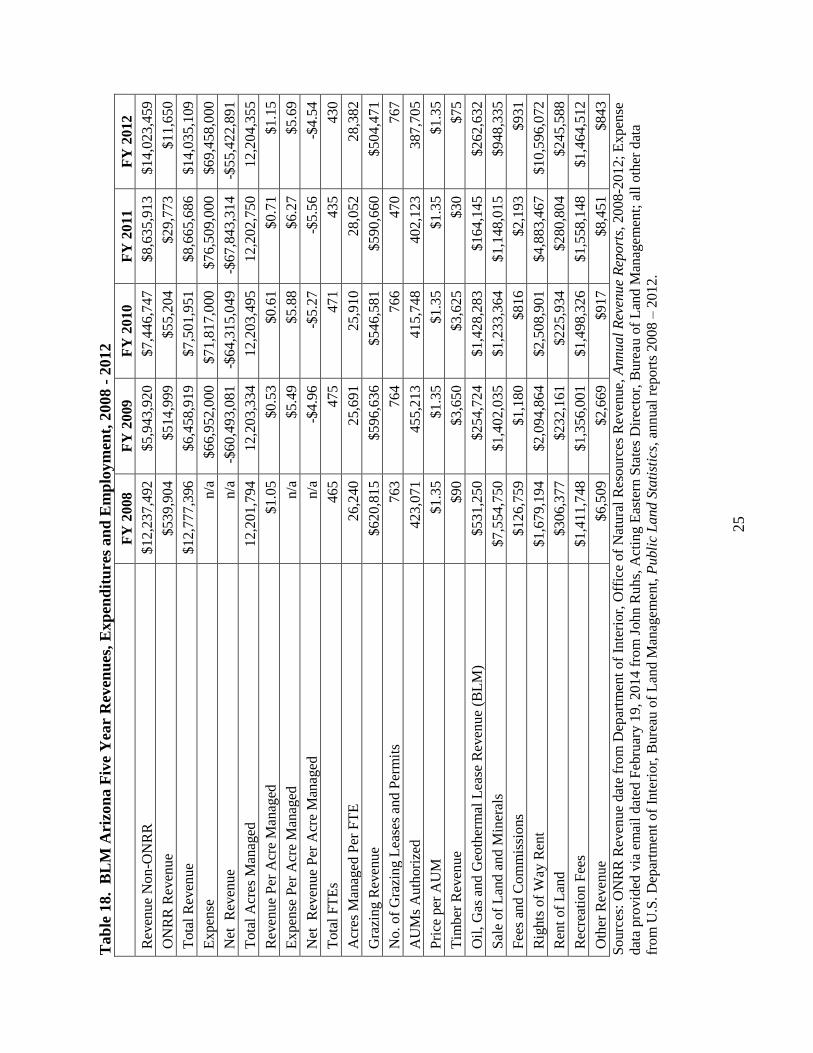
25
Tab
le 1
8. B
LM
Ari
zon
a F
ive
Yea
r R
even
ues
, E
xp
end
itu
res
an
d E
mp
loym
ent,
2008 -
2012
FY
2008
FY
2009
FY
20
10
FY
20
11
FY
20
12
Rev
enue
Non
-ON
RR
$12,2
37,4
92
$5,9
43,9
20
$7
,44
6,7
47
$8
,63
5,9
13
$1
4,0
23
,459
ON
RR
Rev
enu
e $539,9
04
$514,9
99
$5
5,2
04
$2
9,7
73
$1
1,6
50
Tota
l R
even
ue
$12,7
77,3
96
$6,4
58,9
19
$7
,50
1,9
51
$8
,66
5,6
86
$1
4,0
35
,109
Expen
se
n/a
$66,9
52,0
00
$7
1,8
17
,000
$7
6,5
09
,000
$6
9,4
58
,000
Net
R
even
ue
n/a
-$
60,4
93,0
81
-$
64
,31
5,0
49
-$6
7,8
43
,31
4
-$5
5,4
22
,89
1
Tota
l A
cres
Man
aged
12,2
01,7
94
12,2
03
,334
12
,20
3,4
95
12
,20
2,7
50
12
,20
4,3
55
Rev
enue
Per
Acr
e M
anag
ed
$1.0
5
$0.5
3
$0
.61
$0
.71
$1
.15
Expen
se P
er A
cre
Man
aged
n/a
$5.4
9
$5
.88
$6
.27
$5
.69
Net
R
even
ue
Per
Acr
e M
anag
ed
n/a
-$
4.9
6
-$5
.27
-$
5.5
6
-$4
.54
Tota
l F
TE
s 465
475
4
71
43
5
43
0
Acr
es M
anag
ed P
er F
TE
26,2
40
25,6
91
25
,91
0
28
,05
2
28
,38
2
Gra
zing R
even
ue
$620,8
15
$596,6
36
$5
46
,58
1
$5
90
,66
0
$5
04
,47
1
No.
of
Gra
zin
g L
ease
s an
d P
erm
its
763
764
7
66
47
0
76
7
AU
Ms
Auth
ori
zed
423,0
71
455,2
13
41
5,7
48
40
2,1
23
38
7,7
05
Pri
ce p
er A
UM
$1.3
5
$1.3
5
$1
.35
$1
.35
$1
.35
Tim
ber
Rev
enu
e $90
$3,6
50
$3
,62
5
$3
0
$7
5
Oil
, G
as a
nd G
eoth
erm
al L
ease
Rev
enu
e (B
LM
) $531,2
50
$254,7
24
$1
,42
8,2
83
$1
64
,14
5
$2
62
,63
2
Sal
e of
Lan
d a
nd
Min
eral
s $7,5
54,7
50
$1,4
02,0
35
$1
,23
3,3
64
$1
,14
8,0
15
$9
48
,33
5
Fee
s an
d C
om
mis
sio
ns
$126,7
59
$1,1
80
$8
16
$2
,19
3
$9
31
Rig
hts
of
Way
Ren
t $1,6
79,1
94
$2,0
94,8
64
$2
,50
8,9
01
$4
,88
3,4
67
$1
0,5
96
,072
Ren
t of
Lan
d
$306,3
77
$232,1
61
$2
25
,93
4
$2
80
,80
4
$2
45
,58
8
Rec
reat
ion F
ees
$1,4
11,7
48
$1,3
56,0
01
$1
,49
8,3
26
$1
,55
8,1
48
$1
,46
4,5
12
Oth
er R
even
ue
$6,5
09
$2,6
69
$9
17
$8
,45
1
$8
43
Sourc
es:
ON
RR
Rev
enu
e dat
e fr
om
Dep
artm
ent
of
Inte
rior,
Off
ice
of
Nat
ura
l R
esourc
es R
even
ue,
Ann
ua
l R
even
ue
Rep
ort
s, 2
00
8-2
01
2;
Ex
pen
se
dat
a pro
vid
ed v
ia e
mai
l dat
ed F
ebru
ary 1
9,
2014 f
rom
John R
uhs,
Act
ing E
aste
rn S
tate
s D
irec
tor,
Bu
reau
of
Lan
d M
anag
emen
t; a
ll o
ther
dat
a
from
U.S
. D
epar
tmen
t o
f In
teri
or,
Bu
reau
of
Lan
d M
anag
em
ent,
Publi
c L
and S
tati
stic
s, a
nnual
rep
ort
s 2
00
8 –
20
12
.
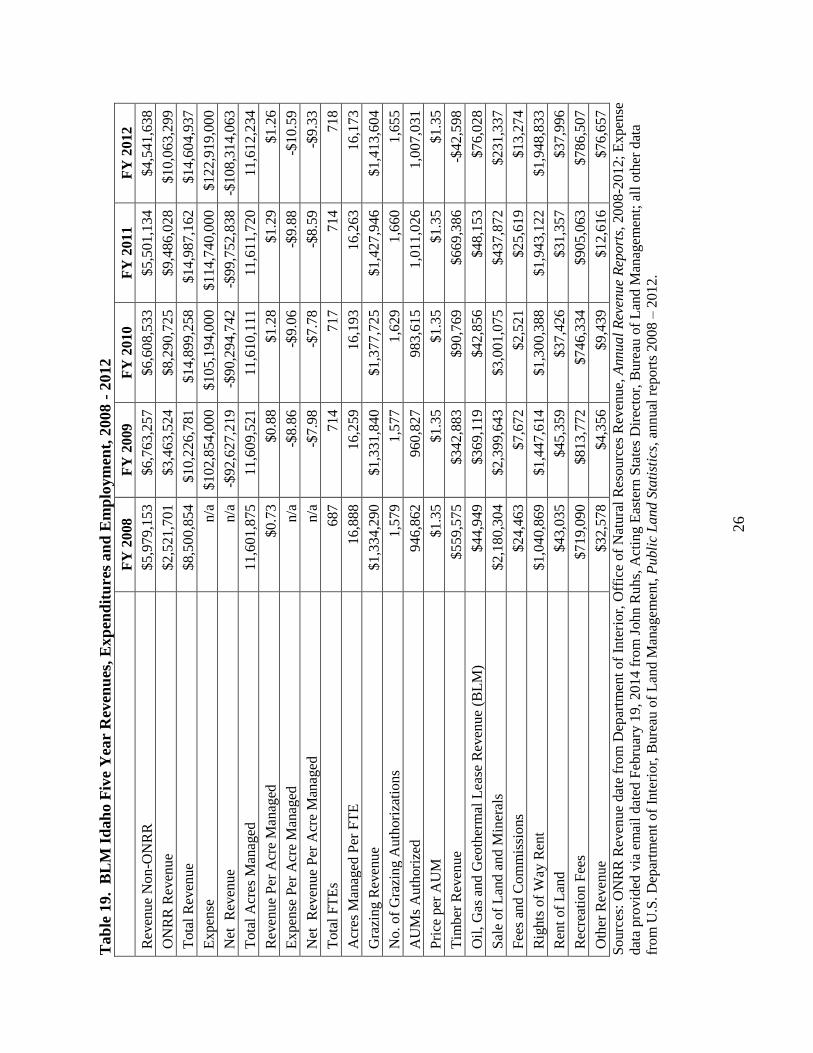
26
Tab
le 1
9. B
LM
Id
ah
o F
ive
Yea
r R
even
ues
, E
xp
end
itu
res
an
d E
mp
loym
ent,
2008 -
2012
FY
2008
FY
2009
FY
20
10
FY
20
11
FY
20
12
Rev
enue
Non
-ON
RR
$5,9
79,1
53
$6,7
63,2
57
$6
,60
8,5
33
$5
,50
1,1
34
$4
,54
1,6
38
ON
RR
Rev
enu
e $2,5
21,7
01
$3,4
63,5
24
$8
,29
0,7
25
$9
,48
6,0
28
$1
0,0
63
,299
Tota
l R
even
ue
$8,5
00,8
54
$10,2
26,7
81
$1
4,8
99
,258
$1
4,9
87
,162
$1
4,6
04
,937
Expen
se
n/a
$102,8
54,0
00
$10
5,1
94
,00
0
$1
14
,74
0,0
00
$1
22
,91
9,0
00
Net
R
even
ue
n/a
-$
92,6
27,2
19
-$
90
,29
4,7
42
-$9
9,7
52
,83
8
-$1
08
,31
4,0
63
Tota
l A
cres
Man
aged
11,6
01,8
75
11,6
09,5
21
11
,61
0,1
11
11
,61
1,7
20
11
,61
2,2
34
Rev
enue
Per
Acr
e M
anag
ed
$0.7
3
$0.8
8
$1
.28
$1
.29
$1
.26
Expen
se P
er A
cre
Man
aged
n/a
-$
8.8
6
-$9
.06
-$
9.8
8
-$1
0.5
9
Net
R
even
ue
Per
Acr
e M
anag
ed
n/a
-$
7.9
8
-$7
.78
-$
8.5
9
-$9
.33
Tota
l F
TE
s 687
714
7
17
71
4
71
8
Acr
es M
anag
ed P
er F
TE
16,8
88
16,2
59
16
,19
3
16
,26
3
16
,17
3
Gra
zing R
even
ue
$1,3
34,2
90
$1,3
31,8
40
$1
,37
7,7
25
$1
,42
7,9
46
$1
,41
3,6
04
No.
of
Gra
zin
g A
uth
ori
zati
on
s 1,5
79
1,5
77
1,6
29
1,6
60
1,6
55
AU
Ms
Auth
ori
zed
946,8
62
960,8
27
98
3,6
15
1,0
11
,02
6
1,0
07
,03
1
Pri
ce p
er A
UM
$1.3
5
$1.3
5
$1
.35
$1
.35
$1
.35
Tim
ber
Rev
enu
e $559,5
75
$342,8
83
$9
0,7
69
$6
69
,38
6
-$4
2,5
98
Oil
, G
as a
nd G
eoth
erm
al L
ease
Rev
enu
e (B
LM
) $44,9
49
$369,1
19
$4
2,8
56
$4
8,1
53
$7
6,0
28
Sal
e of
Lan
d a
nd
Min
eral
s $2,1
80,3
04
$2,3
99,6
43
$3
,00
1,0
75
$4
37
,87
2
$2
31
,33
7
Fee
s an
d C
om
mis
sio
ns
$24,4
63
$7,6
72
$2
,52
1
$2
5,6
19
$1
3,2
74
Rig
hts
of
Way
Ren
t $1,0
40,8
69
$1,4
47,6
14
$1
,30
0,3
88
$1
,94
3,1
22
$1
,94
8,8
33
Ren
t of
Lan
d
$43,0
35
$45,3
59
$3
7,4
26
$3
1,3
57
$3
7,9
96
Rec
reat
ion F
ees
$719,0
90
$813,7
72
$7
46
,33
4
$9
05
,06
3
$7
86
,50
7
Oth
er R
even
ue
$32,5
78
$4,3
56
$9
,43
9
$1
2,6
16
$7
6,6
57
Sourc
es:
ON
RR
Rev
enu
e dat
e fr
om
Dep
artm
ent
of
Inte
rior,
Off
ice
of
Nat
ura
l R
esourc
es R
even
ue,
Ann
ua
l R
even
ue
Rep
ort
s, 2
00
8-2
01
2;
Ex
pen
se
dat
a pro
vid
ed v
ia e
mai
l dat
ed F
ebru
ary 1
9,
2014 f
rom
John R
uhs,
Act
ing E
aste
rn S
tate
s D
irec
tor,
Bu
reau
of
Lan
d M
anag
emen
t; a
ll o
ther
dat
a
from
U.S
. D
epar
tmen
t o
f In
teri
or,
Bu
reau
of
Lan
d M
anag
em
ent,
Publi
c L
and S
tati
stic
s, a
nnual
rep
ort
s 2
00
8 –
20
12
.

27
Tab
le 2
0. B
LM
New
Mex
ico F
ive
Yea
r R
even
ues
, E
xp
end
itu
res
an
d E
mp
loy
men
t, 2
008 -
2012
FY
2008
FY
2009
FY
20
10
FY
20
11
FY
20
12
Rev
enue
Non
-ON
RR
$10,7
95,7
90
$9,2
86,4
46
$1
0,8
25
,377
$1
1,3
66
,909
$1
2,6
24
,358
ON
RR
Rev
enu
e $1,3
27,5
27,0
05
$673,6
77,7
62
$8
01
,52
4,1
11
$8
95
,77
1,8
11
$9
59
,53
0,5
89
Tota
l R
even
ue
$1,3
28,6
22,7
95
$682,9
64,2
08
$8
12
,34
9,4
88
$9
07
,13
8,7
20
$9
72
,15
4,9
47
Expen
se
n/a
$100,0
56,0
00
$1
08
,56
9,0
00
$1
04
,85
1,0
00
$1
04
,24
5,0
00
Net
R
even
ue
n/a
$582,9
08,2
08
$7
03
,78
0,4
88
$8
02
,28
7,7
20
$8
67
,90
9,9
47
Tota
l A
cres
Man
aged
13,3
67,9
20
13,4
76,9
82
13
,48
4,4
05
13
,48
4,4
12
13
,46
5,9
22
Rev
enue
Per
Acr
e M
anag
ed
$99.3
9
$50.6
8
$6
0.2
4
$6
7.2
7
$7
2.1
9
Expen
se P
er A
cre
Man
aged
n/a
$7.4
2
$8
.05
$7
.76
$7
.74
Net
R
even
ue
Per
Acr
e M
anag
ed
n/a
$43.2
6
$5
2.1
9
$5
9.5
1
$6
4.4
5
Tota
l F
TE
s 750
793
7
71
76
3
76
9
Acr
es M
anag
ed P
er F
TE
17,8
24
16,9
95
17
,49
0
17
,67
3
15
,51
1
Gra
zing R
even
ue
$1,9
95,3
24
$2,0
49,3
22
$2
,02
9,1
80
$2
,06
4,8
72
$1
,95
9,0
97
No.
of
Gra
zin
g A
uth
ori
zati
on
s 2,1
06
2,0
83
1,6
29
2,1
64
2,1
42
AU
Ms
Auth
ori
zed
1,4
55,0
19
1,4
84,1
29
1,4
88
,82
4
1,5
06
,49
4
1,4
33
,72
1
Pri
ce p
er A
UM
$1.3
5
$1.3
5
$1
.35
$1
.35
$1
.35
Tim
ber
Rev
enu
e $24,8
11
$34,7
61
$3
8,3
84
$5
3,8
24
$4
8,1
37
Oil
, G
as a
nd G
eoth
erm
al L
ease
Rev
enu
e (B
LM
) $1,5
01,7
05
$2,6
91,5
28
$3
,39
0,7
61
$2
,64
0,6
56
$3
,10
9,8
33
Sal
e of
Lan
d a
nd
Min
eral
s $4,8
39,4
35
$1,7
58,8
65
$2
,61
2,4
74
$3
,81
5,7
06
$4
,29
7,6
65
Fee
s an
d C
om
mis
sio
ns
$2,5
32
$1,9
46
$1
,55
0
$2
,07
0
$3
,09
9
Rig
hts
of
Way
Ren
t $1,9
84,3
73
$2,2
88,5
68
$2
,30
6,1
41
$2
,34
3,0
59
$2
,73
8,2
31
Ren
t of
Lan
d
$12,4
49
$10,0
36
$1
3,8
06
$2
0,8
31
$6
,61
2
Rec
reat
ion F
ees
$448,6
02
$451,0
71
$4
31
,98
0
$4
22
,65
6
$4
61
,80
2
Oth
er R
even
ue
-$13,4
41
$349
$1
,10
1
$3
,23
5
-$1
18
Sourc
es:
ON
RR
Rev
enu
e dat
e fr
om
Dep
artm
ent
of
Inte
rior,
Off
ice
of
Nat
ura
l R
esourc
es R
even
ue,
Ann
ua
l R
even
ue
Rep
ort
s, 2
00
8-2
01
2;
Ex
pen
se
dat
a pro
vid
ed v
ia e
mai
l dat
ed F
ebru
ary 1
9,
2014 f
rom
John R
uhs,
Act
ing E
aste
rn S
tate
s D
irec
tor,
Bu
reau
of
Lan
d M
anag
emen
t; a
ll o
ther
dat
a
from
U.S
. D
epar
tmen
t o
f In
teri
or,
Bu
reau
of
Lan
d M
anag
em
ent,
Publi
c L
and S
tati
stic
s, a
nnual
rep
ort
s 2
00
8 –
20
12
.
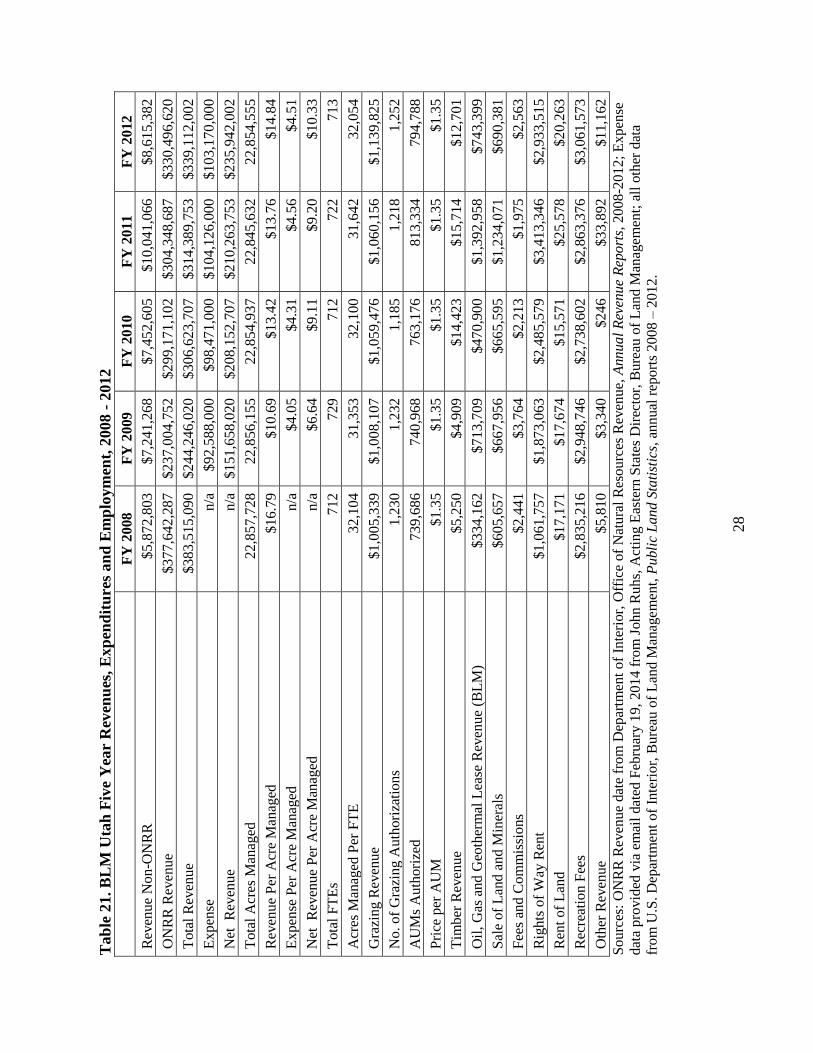
28
Tab
le 2
1. B
LM
Uta
h F
ive
Yea
r R
even
ues
, E
xp
end
itu
res
an
d E
mp
loym
ent,
2008 -
2012
FY
2008
FY
2009
FY
20
10
FY
20
11
FY
20
12
Rev
enue
Non
-ON
RR
$5,8
72,8
03
$7,2
41,2
68
$7
,45
2,6
05
$1
0,0
41
,066
$8
,61
5,3
82
ON
RR
Rev
enu
e $377,6
42,2
87
$237,0
04,7
52
$2
99
,17
1,1
02
$3
04
,34
8,6
87
$3
30
,49
6,6
20
Tota
l R
even
ue
$383,5
15,0
90
$244,2
46,0
20
$3
06
,62
3,7
07
$3
14
,38
9,7
53
$3
39
,11
2,0
02
Expen
se
n/a
$92,5
88,0
00
$9
8,4
71
,000
$1
04
,12
6,0
00
$1
03
,17
0,0
00
Net
R
even
ue
n/a
$151,6
58,0
20
$2
08
,15
2,7
07
$2
10
,26
3,7
53
$2
35
,94
2,0
02
Tota
l A
cres
Man
aged
22,8
57,7
28
22,8
56,1
55
22
,85
4,9
37
22
,84
5,6
32
22
,85
4,5
55
Rev
enue
Per
Acr
e M
anag
ed
$16.7
9
$10.6
9
$1
3.4
2
$1
3.7
6
$1
4.8
4
Expen
se P
er A
cre
Man
aged
n/a
$4.0
5
$4
.31
$4
.56
$4
.51
Net
R
even
ue
Per
Acr
e M
anag
ed
n/a
$6.6
4
$9
.11
$9
.20
$1
0.3
3
Tota
l F
TE
s 712
729
7
12
72
2
71
3
Acr
es M
anag
ed P
er F
TE
32,1
04
31,3
53
32
,10
0
31
,64
2
32
,05
4
Gra
zing R
even
ue
$1,0
05,3
39
$1,0
08,1
07
$1
,05
9,4
76
$1
,06
0,1
56
$1
,13
9,8
25
No.
of
Gra
zin
g A
uth
ori
zati
on
s 1,2
30
1,2
32
1,1
85
1,2
18
1,2
52
AU
Ms
Auth
ori
zed
739,6
86
740,9
68
76
3,1
76
81
3,3
34
79
4,7
88
Pri
ce p
er A
UM
$1.3
5
$1.3
5
$1
.35
$1
.35
$1
.35
Tim
ber
Rev
enu
e $5,2
50
$4,9
09
$1
4,4
23
$1
5,7
14
$1
2,7
01
Oil
, G
as a
nd G
eoth
erm
al L
ease
Rev
enu
e (B
LM
) $334,1
62
$713,7
09
$4
70
,90
0
$1
,39
2,9
58
$7
43
,39
9
Sal
e of
Lan
d a
nd
Min
eral
s $605,6
57
$667,9
56
$6
65
,59
5
$1
,23
4,0
71
$6
90
,38
1
Fee
s an
d C
om
mis
sio
ns
$2,4
41
$3,7
64
$2
,21
3
$1
,97
5
$2
,56
3
Rig
hts
of
Way
Ren
t $1,0
61,7
57
$1,8
73,0
63
$2
,48
5,5
79
$3
,41
3,3
46
$2
,93
3,5
15
Ren
t of
Lan
d
$17,1
71
$17,6
74
$1
5,5
71
$2
5,5
78
$2
0,2
63
Rec
reat
ion F
ees
$2,8
35,2
16
$2,9
48,7
46
$2
,73
8,6
02
$2
,86
3,3
76
$3
,06
1,5
73
Oth
er R
even
ue
$5,8
10
$3,3
40
$2
46
$3
3,8
92
$1
1,1
62
Sourc
es:
ON
RR
Rev
enu
e dat
e fr
om
Dep
artm
ent
of
Inte
rior,
Off
ice
of
Nat
ura
l R
esourc
es R
even
ue,
Ann
ua
l R
even
ue
Rep
ort
s, 2
00
8-2
01
2;
Ex
pen
se
dat
a pro
vid
ed v
ia e
mai
l dat
ed F
ebru
ary 1
9,
2014 f
rom
John R
uhs,
Act
ing E
aste
rn S
tate
s D
irec
tor,
Bu
reau
of
Lan
d M
anag
emen
t; a
ll o
ther
dat
a
from
U.S
. D
epar
tmen
t o
f In
teri
or,
Bu
reau
of
Lan
d M
anag
em
ent,
Publi
c L
and S
tati
stic
s, a
nnual
rep
ort
s 2
00
8 –
20
12
.

29
Tab
le 2
2. B
LM
NV
, D
OI
ON
RR
an
d P
ILT
Rev
enu
e D
istr
ibu
tion
to
Nev
ad
a S
tate
an
d L
oca
l G
over
nm
ents
Rev
enu
e S
ou
rce
2008
2009
20
10
20
11
20
12
BL
M N
V R
even
ue
Dis
t. to N
V S
tate
/Lo
cal
Govt.
$5,4
47,0
44
$2,1
36,8
62
$2
,56
0,6
35
$1
,46
5,9
48
$1
,72
5,9
63
DO
I O
NR
R R
even
ue
Dis
t. to N
V S
tate
/Loca
l G
ovt.
$17,6
22,1
48
$28,7
44,4
81
$1
7,0
59
,292
$9
,79
4,7
88
$1
1,7
85
,382
PIL
T P
aym
ent to
Nev
ada
$22,6
10,0
17
$23,2
69,3
50
$2
2,7
53
,204
$2
2,9
42
,298
$2
3,9
17
,845
Tota
l P
aym
ents
BL
M N
V/O
NR
R/P
ILT
Rev
enue
Dis
t. T
o N
V
Sta
te/L
oca
l G
ovt.
$45,6
79,2
09
$54,1
50,6
93
$4
2,3
73
,131
$3
4,2
03
,034
$3
7,4
29
,190
Tota
l A
cres
Man
aged
by B
LM
in N
evad
a 47,8
08,1
14
47,8
06,7
38
47,8
05,9
23
47,7
94,0
96
47,7
83,4
58
Tota
l R
even
ue
Dis
t. to N
V S
tate
/Lo
cal
Govt.
/Acr
e M
anag
ed
$0.9
6
$1.1
3
$0.8
7
$0.7
2
$0.7
8
Sourc
es:
BL
M N
V R
even
ue,
PIL
T a
nd A
cres
Man
aged
dat
a fr
om
U.S
. D
epar
tmen
t of
Inte
rior,
Bu
reau
of
Lan
d M
anag
emen
t, P
ubli
c
Land S
tati
stic
s, a
nnual
rep
ort
s 2008 –
2012;
ON
RR
Rev
enue
dat
e fr
om
Dep
artm
ent
of
Inte
rior,
Off
ice
of
Nat
ura
l R
esourc
es R
even
ue,
Annual
Rev
enu
e R
eport
s, 2
008
-2012.
30
Federal Government Distribution of Public Land Management Related Revenues to State
and Local Government in Nevada
As shown in Table 22, the BLM, the Department of Interior Office of Natural Resources
Revenue (ONRR) and the Congress (through Payments-in-Lieu-of-Taxes or PILT) annually
distribute public land management related funding to the State of Nevada and its local
governments. During the period 2008 through 2012 these payments have trended downward
from $45.6 million in 2008 to $37.4 million in 2012. During this same period, these payments
have ranged from a low of $0.72 per acre to a high of $1.13 per acre. This contrasts with
potential earnings per acre for an expanded state land base in Nevada ranging from $7.78 per
acre to $28.59 per acre
CONCLUSIONS
The foregoing analysis of state and federal land management agency revenue, cost, employment
and output characteristics is useful in understanding prospective fiscal implications for an
expanded state land base in Nevada. Although limited to four state land management entities
and five BLM programs, the information contained in this report provides clear evidence of the
potential for state land management activities to generate revenues in excess of expenses.
Several caveats must be considered, however, when seeking to estimate prospective revenues
and costs for an expanded state land base in Nevada.
First is the difference in physiographic characteristics between other states considered and those
in Nevada. These differences concern the availability of non-renewable and renewable
resources. As shown in Tables 5 through 8, timber, oil and gas, and minerals compromise the
most significant contributors to state land revenues among states considered in this study.
Nevada does not have any appreciable commercial forest resources. While the BLM in Nevada
derives significant revenue from oil and gas resources in the state, the location of those resources
under land which might be selected by the State of Nevada for transfer is uncertain. Mineral
potential has been demonstrated by extensive mining activities within Nevada. The potential for
additional mining development is considered good, but highly dependent upon market forces.
For Nevada to derive the levels of net revenues per acre experienced in other states and estimated
within this report for the State, extensive oil and gas and/or expanded mining activities would
likely be necessary. It is important to note that Nevada derived just over $128 million in net
proceeds mining taxes during 20129. If mining in the state were to be expanded significantly,
owing to the availability of an expanded state trust land base, mining tax revenues might be
significantly increased.
Second, the analysis of cost and revenue data included within this report does not explicitly
consider differences in state land management policies between states and BLM. Results
described within this report suggest that management policies do differ between states and
between states and BLM. Table 5 reveals the significance of land sales as a revenue generating
source, particularly in Arizona. This is comparable to the importance of land sale revenue to
BLM in Nevada. During the past few years land sales and other realty related land use
9 Nevada Department of Taxation, 2012-2013 Net Proceeds of Minerals Bulletin, Division of Local Government
Services, June 24, 2013.

31
authorizations have accounted for an estimated 70 to 80 percent of BLM non-ONRR revenues in
Nevada (see Table 17). If total revenues per acre of the magnitude estimated in this report are to
be achieved through management of an expanded Nevada state land base, sales by the State of
transferred lands previously identified by BLM for disposal will be required to bolster revenue
generation potential and provide critical early sources of funding for management of an
expanded state land base.
Coupled with this issue is the fact that these analyses do not account for trends in natural
resource condition. States may be generating excess revenues at the expense of ecosystem
condition. As a consequence the ability to sustain levels of revenue generation in the future may
be challenged. Alternatively, states may be managing their natural resources in a manner
consistent with sustained yield so as to fulfill their mandate to maximize net revenue on a
sustained basis. Additional research into state land management policies and practices which
have produced reported revenues is required.
What then do the analyses of state and BLM land management costs and revenues suggest with
regard to the questions posed at the beginning of this report? Following is a brief answer to each
of the previously stated questions.
1) To what degree have other states been able to generate net revenues as a result of land
management activities? In each of the four states considered, during the period of 2008
through 2012, annual net revenues ranging from $10.00 to $72.26 per acre have been
achieved (see Table 10).
2) What levels of revenue and expenditure have other states historically incurred in the
management of lands? During the period of 2008 through 2012, average annual revenues
across the four states considered in this analysis have ranged from $16.78 to $72.40 per
acre. Expenditures have ranges from $1.45 to $9.00 per acre (see Table 10).
3) What have been the major revenue sources from land management activities of other
states? In recent years primary revenue sources from state land management activities
include oil and gas, timber, land sales, land rent and mining.
4) In the event the State of Nevada were successful in securing Congressional transfer of
BLM administered land to the State, what is the potential for related land management revenues
to exceed expenditures? Based upon the experience of other states, it is very possible that
revenues would exceed expenditures for administration of an expanded state land base in
Nevada producing net revenues ranging between $7.78 to $28.59 per acre.
5) How have other states distributed net revenues generated from state trust land management
activities? Net revenues and investment income are distributed by state trust land agencies
in Arizona, Idaho, New Mexico and Utah to a designated set of beneficiaries with public K-
12 education receiving the greatest amounts of funding.
6) To what degree has the Bureau of Land Management been able to generate net revenues
as a result of land management activities within selected states? Of the BLM statewide land

32
management programs assessed in this report, only the New Mexico and Utah BLM
programs generated net revenue. Statewide, BLM land management activities in Arizona,
Idaho and Nevada each expended more funds than revenue generated.
7) To what extent does the federal government currently distribute public land management
related revenues to the State of Nevada and her local governments? During the years 2008
through 2012 the federal government has distributed land management related revenue to
Nevada state and local governments ranging from $45.6 million in 2008 to $37.4 million in
2012 or a low of $0.72 per acre to a high of $1.13 per acre managed by BLM in Nevada.
8) What have been the major revenue sources from land management activities of the
Bureau of Land Management? Among the most significant revenue sources for BLM
observed during the period of 2008 through 2012 were land sales, land rent, recreation fees,
grazing, and royalties from oil, gas and minerals.
33
APPENDIX G
Section 7.3 Fire Suppression of Alternatives for Management of
An Expanded State Land Base in Nevada
A 1996 Study Prepared For
The Board of Eureka County Commissioners


Excerpt from Alternatives for Management
Of an Expanded State Land Base in Nevada10
7.2 Fire Suppression - Discussion about transfer of public land in Nevada to state and/or county
administration eventually includes concern over the extent to which fire suppression costs might render
local management infeasible. Table 9 provides data descriptive of BLM fire management activity in
Nevada during the period of 1990 through 1993. During this period, BLM fought 1,360 fires on land
administered by the Bureau. Another 391 fires were responded to on lands not managed by BLM. The
four year period saw 105,452 acres of BLM managed land burned in wildland fires. BLM responded to
fires on non-agency administered lands which consumed another 45,438 acres. During the four year
period, the average size of wildland fires on BLM administered lands was 78 acres. The average size of
fires responded to by BLM on non-Bureau managed lands during this period was 116 acres.
Table 9 also provides statistics regarding the pre-suppression cost and cost per acre for fires
responded to by BLM in Nevada. During the four-year period of 1990 to 1993, pre-suppression costs
ranged from a low of $3.1 million to nearly $5.5 million in 1993. The average pre-suppression cost per
fire ranged from $7,062 to $15,567 in 1993. It is important to note that fire pre-suppression costs do not
include all costs to prevent and fight wildland fires on BLM lands in Nevada. Information provided by
the Acting Fire Management Officer for the BLM in Nevada indicates that total suppression costs for
fires by BLM in Nevada during the years 1992, 1993, and 1994 were $5,063,647, $2,197,248, and
$10,612,984, respectively.11
Collectively then, it appears as though total BLM fire pre-suppression and
suppression costs have ranged between $8 and $10 million during the past few years. This would
suggest total fire costs on the order of $212 per acre (at average of 37,750 acres burned per year at a cost
of $8 million) to $264 per acre (at average of 37,750 acres burned per year at a cost of $10 million). It is
important to note that collection of complete and consistent fire cost information from BLM has been
difficult.
To understand how state management of public lands in Nevada might bear upon fire costs, a
review of Nevada and other western state wildland fire management activities was undertaken. Data for
10
Intertech Services Corporation, Alternatives For Management Of An Expanded State Land Base In Nevada, prepared for
Board of Eureka County Commissioners and Eureka County Public Land Advisory Commission, Carson City, Nevada,
February 1996. 11
Correspondence received October 27, 1995 from Ms. Jean Rivers-Council, Associate State Director, BLM Nevada.
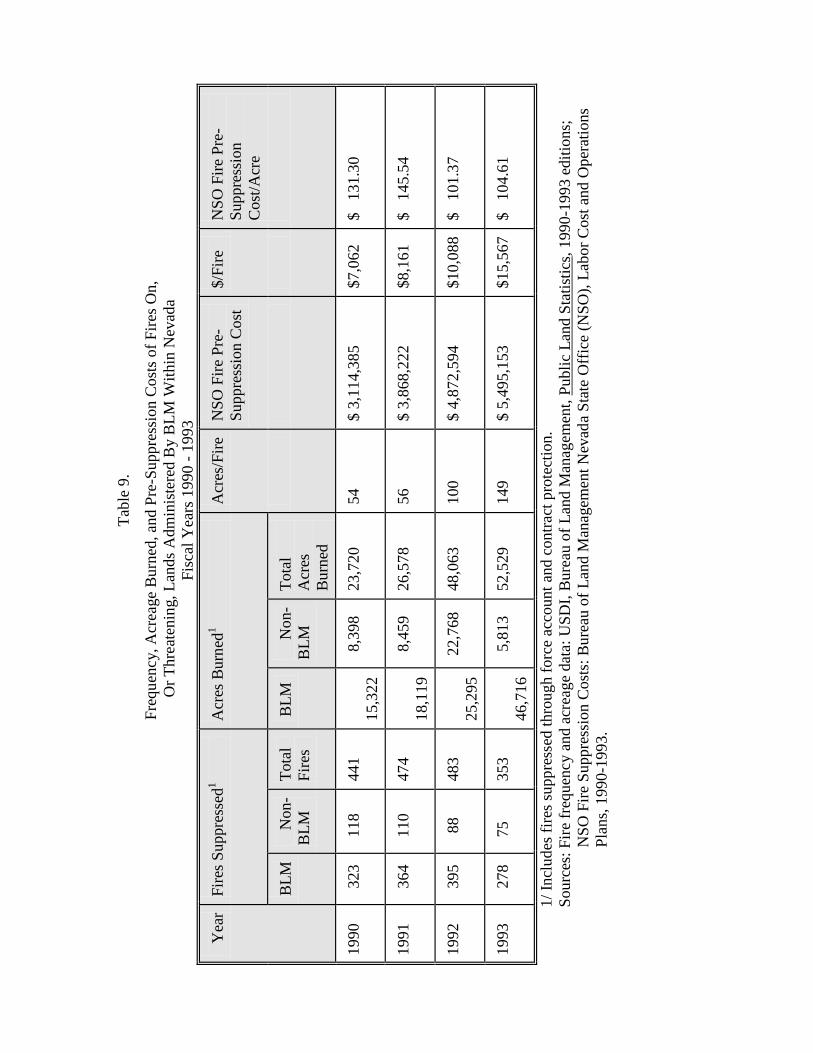
Tab
le 9
.
Fre
qu
ency, A
crea
ge
Burn
ed, an
d P
re-S
uppre
ssio
n C
ost
s of
Fir
es O
n,
Or
Thre
aten
ing,
Lan
ds
Adm
inis
tere
d B
y B
LM
Wit
hin
Nev
ada
Fis
cal
Yea
rs 1
990 -
1993
Yea
r F
ires
Suppre
ssed
1
Acr
es B
urn
ed1
Acr
es/F
ire
NS
O F
ire
Pre
-
Suppre
ssio
n C
ost
$/F
ire
NS
O F
ire
Pre
-
Suppre
ssio
n
Cost
/Acr
e B
LM
Non-
BL
M
Tota
l
Fir
es
BL
M
N
on-
BL
M
Tota
l
Acr
es
Burn
ed
1990
323
118
441
15
,322
8,3
98
23,7
20
54
$ 3
,114,3
85
$7,0
62
$ 1
31.3
0
1991
364
110
474
18
,119
8,4
59
26,5
78
56
$ 3
,868,2
22
$8,1
61
$ 1
45.5
4
1992
395
8
8
483
25
,295
22,7
68
48,0
63
100
$ 4
,872,5
94
$10,0
88
$ 1
01.3
7
1993
278
75
353
46
,716
5,8
13
52,5
29
149
$ 5
,495,1
53
$15,5
67
$ 1
04.6
1
1/
Incl
ud
es f
ires
supp
ress
ed t
hro
ugh f
orc
e ac
count
and c
ontr
act
pro
tect
ion.
Sourc
es:
Fir
e fr
equen
cy a
nd a
crea
ge
dat
a: U
SD
I, B
ure
au o
f L
and M
anag
emen
t, P
ubli
c L
and S
tati
stic
s, 1
990-1
993 e
dit
ions;
N
SO
Fir
e S
uppre
ssio
n C
ost
s: B
ure
au o
f L
and M
anag
emen
t N
evad
a S
tate
Off
ice
(NS
O),
Lab
or
Cost
and O
per
atio
ns
P
lans,
1990-1
993.
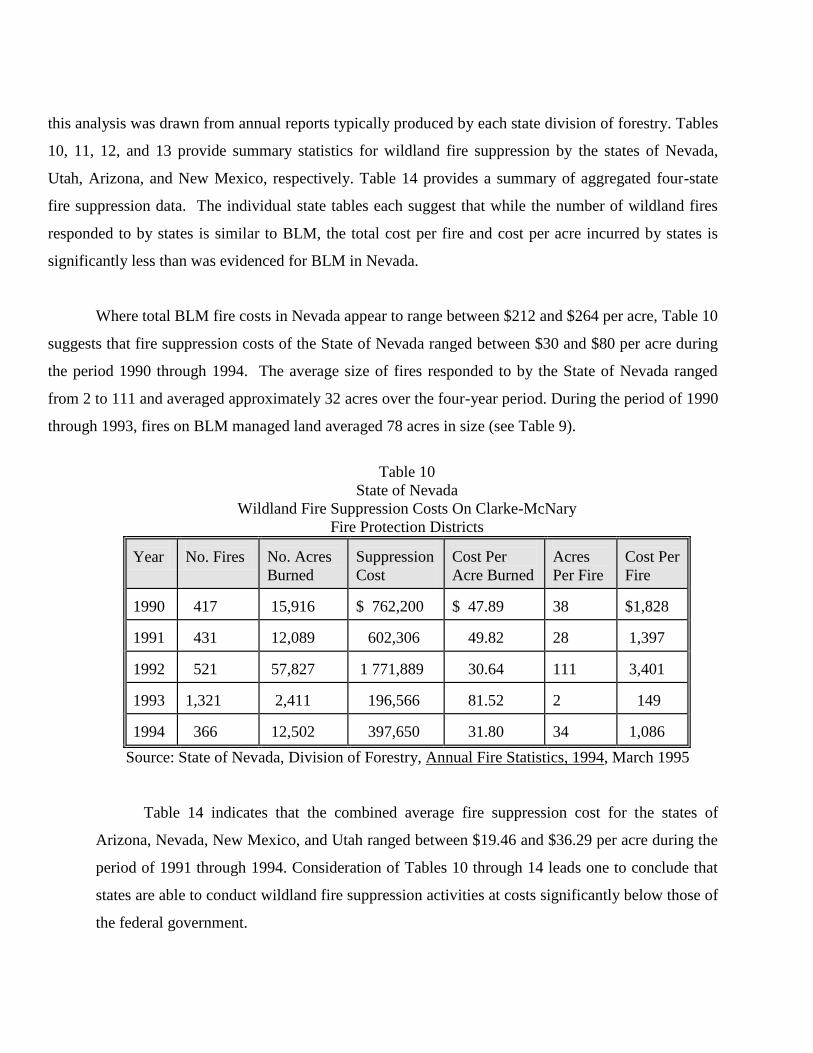
this analysis was drawn from annual reports typically produced by each state division of forestry. Tables
10, 11, 12, and 13 provide summary statistics for wildland fire suppression by the states of Nevada,
Utah, Arizona, and New Mexico, respectively. Table 14 provides a summary of aggregated four-state
fire suppression data. The individual state tables each suggest that while the number of wildland fires
responded to by states is similar to BLM, the total cost per fire and cost per acre incurred by states is
significantly less than was evidenced for BLM in Nevada.
Where total BLM fire costs in Nevada appear to range between $212 and $264 per acre, Table 10
suggests that fire suppression costs of the State of Nevada ranged between $30 and $80 per acre during
the period 1990 through 1994. The average size of fires responded to by the State of Nevada ranged
from 2 to 111 and averaged approximately 32 acres over the four-year period. During the period of 1990
through 1993, fires on BLM managed land averaged 78 acres in size (see Table 9).
Table 10
State of Nevada
Wildland Fire Suppression Costs On Clarke-McNary
Fire Protection Districts Year
No. Fires
No. Acres
Burned
Suppression
Cost
Cost Per
Acre Burned
Acres
Per Fire
Cost Per
Fire 1990
417
15,916
$ 762,200
$ 47.89
38
$1,828
1991
431
12,089
602,306
49.82
28
1,397
1992
521
57,827
1 771,889
30.64
111
3,401
1993
1,321
2,411
196,566
81.52
2
149
1994
366
12,502
397,650
31.80
34
1,086
Source: State of Nevada, Division of Forestry, Annual Fire Statistics, 1994, March 1995
Table 14 indicates that the combined average fire suppression cost for the states of
Arizona, Nevada, New Mexico, and Utah ranged between $19.46 and $36.29 per acre during the
period of 1991 through 1994. Consideration of Tables 10 through 14 leads one to conclude that
states are able to conduct wildland fire suppression activities at costs significantly below those of
the federal government.

Table 11
State of Utah
Wildland/Interface Fire Suppression Costs Year
No. Fires
No. Acres
Burned
Suppression
Cost
Cost Per
Acre Burned
Acres Per
Fire
Cost Per
Fire 1990
415
30,393
$2,547,483
$83.82
73
$6,139
1991
300
12,028
486,675
40.46
40
1,622
1992
499
40,025
1,343,886
33.38
80
2,693
1993
282
13,950
1,109,865
79.56
49
3,931
1994
703
166,419
6,274,498
37.70
237
8,925
Source: Utah Division of State Lands and Forestry, Wildland Fire Reports for calendar years
1990 - 1994.
Table 12
State of Arizona
Wildland Fire Suppression Costs Year
No. Fires
No. Acres
Burned
Suppression
Cost
Cost Per
Acre Burned
Acres Per
Fire
Cost Per
Fire 1990
326
17,486
$1,538,526
$87.99
54
$4,719
1991
423
9,740
577,353
59.28
23
1,365
1992
459
16,058
784,798
48.87
35
1,710
1993
834
109,294
3,590,726
32.85
131
4,305
1994
774
40,153
2,735,450
68.13
52
3,534
Source: Arizona State Land Department, Division of Forestry, Memorandum: Scott E. Hunt to
Mike Hart, Re: Information Request for Intertech, October 11, 1995

Table 13
State of New Mexico
Wildland Fire Suppression Costs
Year
No. Fires
No. Acres
Burned
Suppression
Cost
Cost Per
Acre Burned
Acres Per
Fire
Cost Per
Acre 1991
518
36,669
$ 893,132
$24.36
71
$1,724
1992
579
63,070
998,669
15.83
109
1,725
1993
1,209
192,699
1,299,421
6.74
159
1,074
1994
1,213
245,757
2,167,768
8.82
203
1,787
1995
894
129,456
2,096,389
16.19
145
2,345
Source: State of New Mexico, Forestry and Resources Division, unpublished table, "5 Year Fire
History for New Mexico", provided by Frank Smith, State Fire Management Officer, November
27, 1995.
Under conditions of an assumed transfer of public land to state and/or county
management, expectations of fire suppression costs for the approximate 48 million acres would
be for significantly lower total expenditures than has been true for BLM. The foregoing analysis
suggests that typical BLM fires are relatively small. The commonly held perception that fires on
public lands are typically very large and therefore cost more to suppress may not be accurate.
Depending upon location of state and/or county wildland fire suppression crews and equipment,
local and state response to wildland fires on public lands may be quicker, thereby resulting in
burned acreage on a scale similar to that experienced by current state fire suppression activities.
Effective placement of trained state and local "quick" response fire personnel and equipment
may serve to minimize the propensity for the periodic "campaign fire". Other states were found
to have available at their disposal locally positioned manpower and equipment, including county
staff and machinery.
Beyond enhanced placement and efficient use of manpower and equipment, avenues for
reduction in fire suppression costs under conditions of assumed transfer of public land to the
State of Nevada might also be possible through improvements in fire prevention and pre-
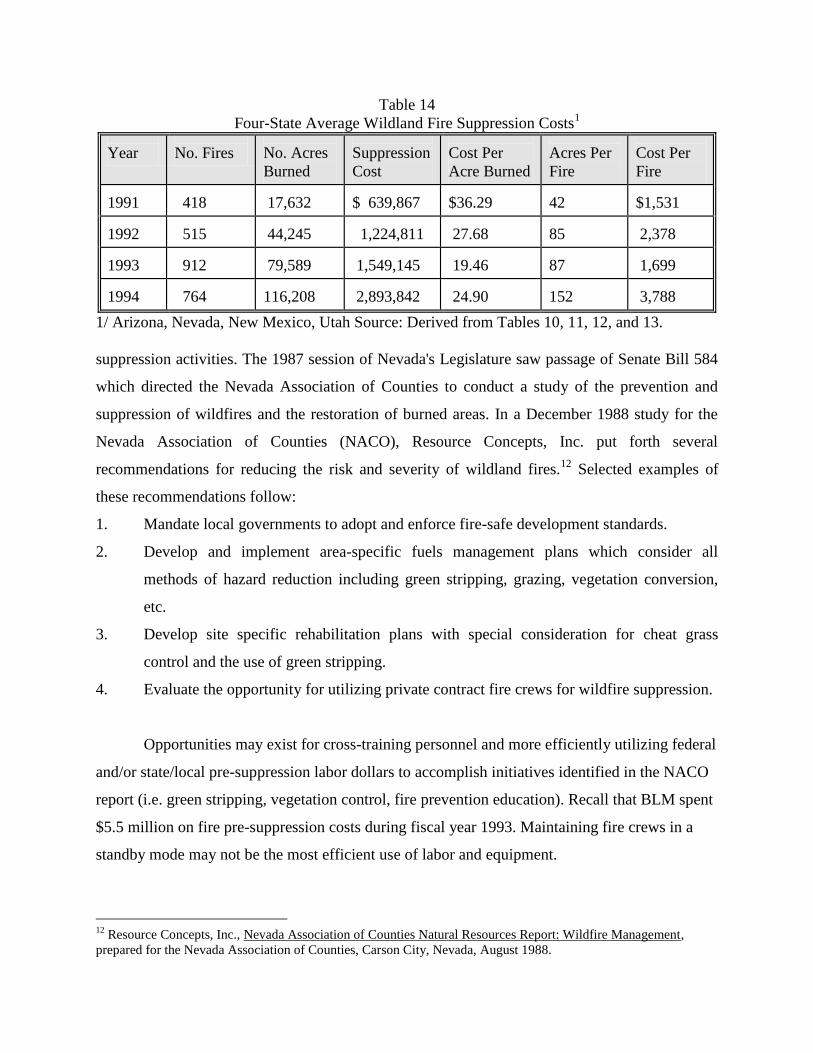
Table 14
Four-State Average Wildland Fire Suppression Costs1
Year
No. Fires
No. Acres
Burned
Suppression
Cost
Cost Per
Acre Burned
Acres Per
Fire
Cost Per
Fire 1991
418
17,632
$ 639,867
$36.29
42
$1,531
1992
515
44,245
1,224,811
27.68
85
2,378
1993
912
79,589
1,549,145
19.46
87
1,699
1994
764
116,208
2,893,842
24.90
152
3,788
1/ Arizona, Nevada, New Mexico, Utah Source: Derived from Tables 10, 11, 12, and 13.
suppression activities. The 1987 session of Nevada's Legislature saw passage of Senate Bill 584
which directed the Nevada Association of Counties to conduct a study of the prevention and
suppression of wildfires and the restoration of burned areas. In a December 1988 study for the
Nevada Association of Counties (NACO), Resource Concepts, Inc. put forth several
recommendations for reducing the risk and severity of wildland fires.12
Selected examples of
these recommendations follow:
1. Mandate local governments to adopt and enforce fire-safe development standards.
2. Develop and implement area-specific fuels management plans which consider all
methods of hazard reduction including green stripping, grazing, vegetation conversion,
etc.
3. Develop site specific rehabilitation plans with special consideration for cheat grass
control and the use of green stripping.
4. Evaluate the opportunity for utilizing private contract fire crews for wildfire suppression.
Opportunities may exist for cross-training personnel and more efficiently utilizing federal
and/or state/local pre-suppression labor dollars to accomplish initiatives identified in the NACO
report (i.e. green stripping, vegetation control, fire prevention education). Recall that BLM spent
$5.5 million on fire pre-suppression costs during fiscal year 1993. Maintaining fire crews in a
standby mode may not be the most efficient use of labor and equipment.
12
Resource Concepts, Inc., Nevada Association of Counties Natural Resources Report: Wildfire Management,
prepared for the Nevada Association of Counties, Carson City, Nevada, August 1988.