Embed Size (px)
Citation preview
In This IssueTourism looks to the future
page 1
“A new beginning,”Dr. Seiji Naya
page 2
Measuring the economicimpact of tourism
page 5
Tourism initiatives and issues – theHTA tourism plan
page 9
The emerging cruise ship marketpage 12
Developing the niche marketspage 15
Is the convention centerpaying its way?
page 18
Air service to Hawaii –seats, comfort and cost
page 21
State and countydata tables
pages 23 & 24
Hawaii’s Economyis published by the Department of Business,
Economic Development & Tourism; Research &Economic Analysis Division
BENJAMIN J. CAYETANOGovernor
SEIJI F. NAYADirector
BRADLEY J. MOSSMANDeputy Director
PEARL IMADA IBOSHIDivision Head
ROBERT SHOREEditor
Direct Inquiries to:Hawaii’s Economy
DBEDTP.O. Box 2359
Honolulu, Hawaii 96804Fax: (808) 586-8449
E-mail: [email protected] report is also available on the internet at:
http://www.hawaii.gov/dbedt/hecon.html
1Hawaii’s Economy /July 1999
EC NOMYA Report from the Department of Business, Economic Development & Tourism
HAWAII’S July 1999
Tourism Looks tothe Future
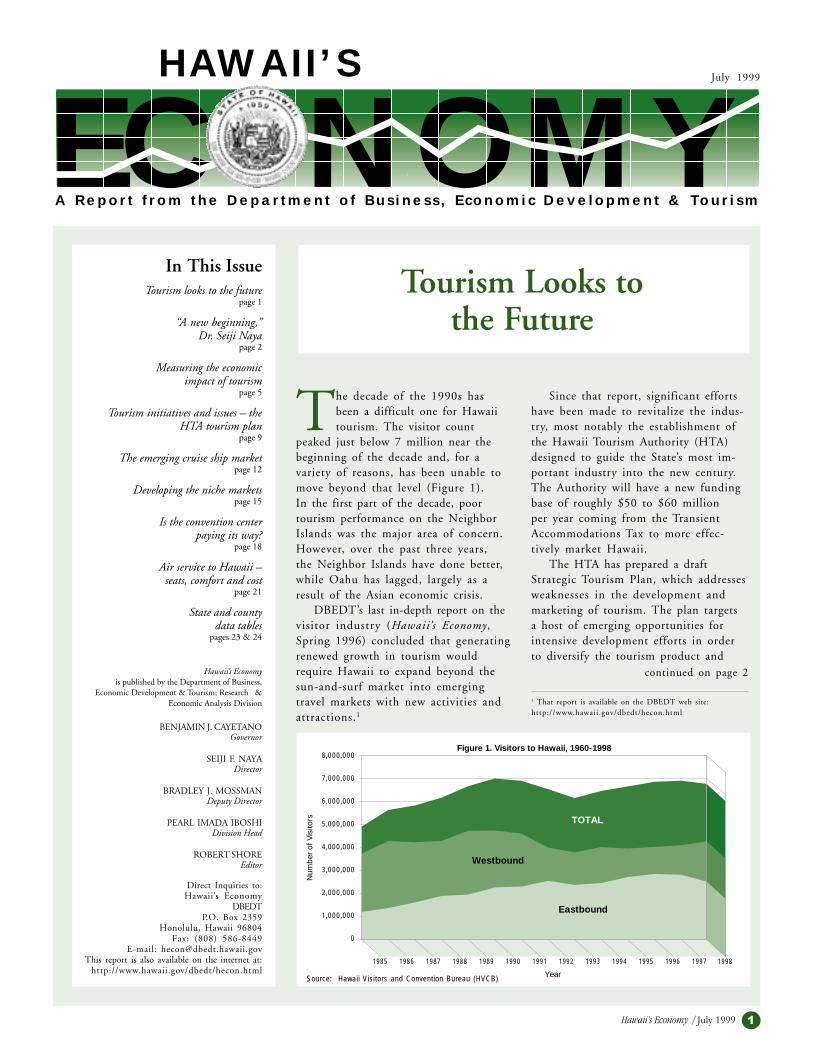
The decade of the 1990s hasbeen a difficult one for Hawaiitourism. The visitor count
peaked just below 7 million near thebeginning of the decade and, for avariety of reasons, has been unable tomove beyond that level (Figure 1).In the first part of the decade, poortourism performance on the NeighborIslands was the major area of concern.However, over the past three years,the Neighbor Islands have done better,while Oahu has lagged, largely as aresult of the Asian economic crisis.
DBEDT’s last in-depth report on thevisitor industry (Hawaii’s Economy,Spring 1996) concluded that generatingrenewed growth in tourism wouldrequire Hawaii to expand beyond thesun-and-surf market into emergingtravel markets with new activities andattractions.1
continued on page 2
Since that report, significant effortshave been made to revitalize the indus-try, most notably the establishment ofthe Hawaii Tourism Authority (HTA)designed to guide the State’s most im-portant industry into the new century.The Authority will have a new fundingbase of roughly $50 to $60 millionper year coming from the TransientAccommodations Tax to more effec-tively market Hawaii.
The HTA has prepared a draftStrategic Tourism Plan, which addressesweaknesses in the development andmarketing of tourism. The plan targetsa host of emerging opportunities forintensive development efforts in orderto diversify the tourism product and
8,000,000
7,000,000
6,000,000
5,000,000
4,000,000
3,000,000
2,000,000
1,000,000
0
1985
Figure 1. Visitors to Hawaii, 1960-1998
Num
ber
of V
isito
rs
Year
1986 1987 1988 1989 1990 1991 1992 1993 1994 1995 1996 1997 1998
TOTAL
Westbound
Eastbound
1 That report is available on the DBEDT web site:http://www.hawaii.gov/dbedt/hecon.html
Source: Hawaii Visitors and Convention Bureau (HVCB)

2 Hawaii’s Economy /July 1999
Tourism Looks to the Futurecontinued from page 1
strengthen Hawaii as a top competitor intourism worldwide.
This report updates the situation intourism, including the strategies pro-posed by the Tourism Strategic Plan toaddress the situation and move forward.The report also presents new estimates oftourism’s economic impact on the statebased on DBEDT’s newly revised HawaiiInput-Output Model. Other sections dis-cuss a number of tourism topics of par-ticular interest, many of which paralleltopics addressed in the Tourism StrategicPlan. These include the emerging cruiseship segment, niche markets and airservice to Hawaii.
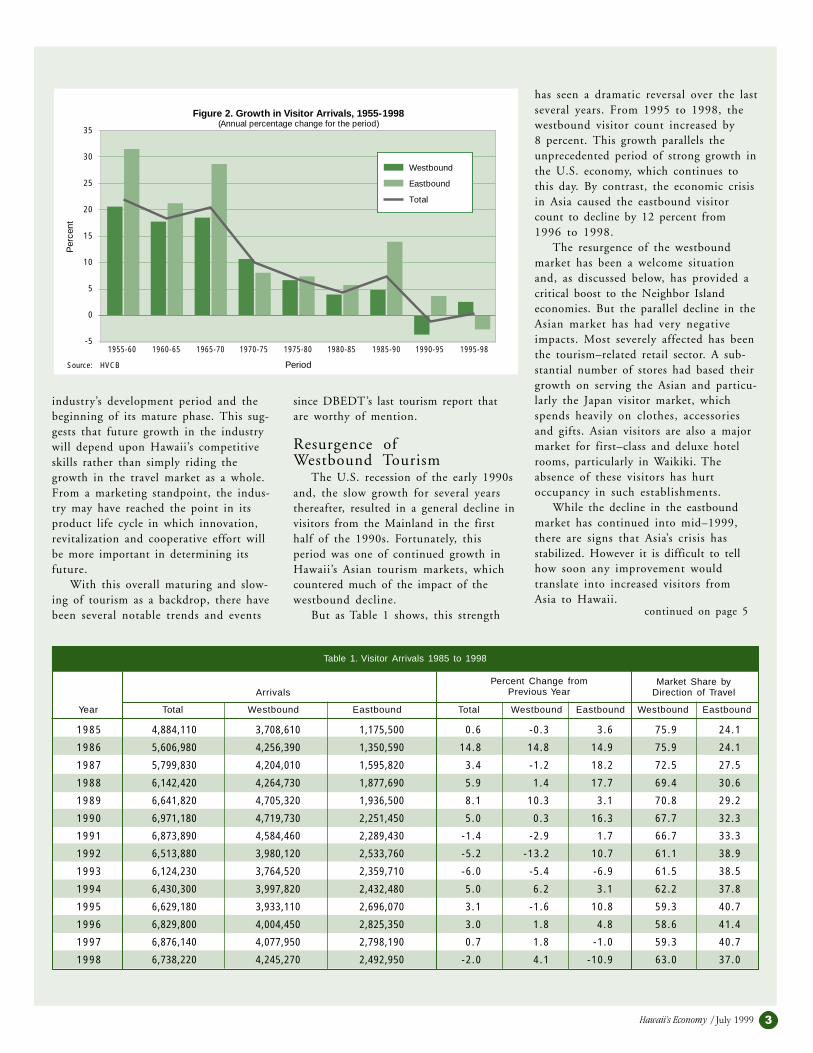
Long-term StructuralChange Continues
The formation of the HTA andcreation of the new funding source areefforts to address structural changes thatare impacting the industry and ultimatelythe entire state economy. At the root ofthat structural change, and the difficultiestourism has experienced in the 1990s,has been the long-term maturing of theindustry in Hawaii and the gradualslowing of its growth rate. As Figure 2illustrates, tourism growth slowed consis-tently from the mid-1950s through themid-1980s.
The slowing trend was interrupted bya temporary period of renewed growth inthe second half of the 1980s as the Japanmarket took off. This surge in tourismfrom Japan was the result of a sharpincrease in the value of the yen, coupledwith a policy by the Japanese govern-ment to lower its foreign trade surplusby encouraging foreign travel. This wasalso a period of very high investment inboth Hawaii and U.S. real estate bythe Japanese.
The long-term slowdown in visitorindustry growth resumed in the 1990s asfirst the U.S. economy and later theAsian economies experienced a series ofeconomic and financial crises. The long-term slowing of tourism appears to haveleveled out at one to two percent peryear, although arrivals actually declinedin 1998, due to the Asian crisis.
Reaching the bottom of the declininggrowth curve signals the end of the
Tourism – “A New Beginning”This update report on Hawaii’s visitor industry comes at a time of significant change
in tourism and the economy. About eight years ago Hawaii’s post-statehood boom period,
fueled by tourism, came to an abrupt end. Since then, both business and government have
been struggling to adjust to a new economic era. Companies in all industries are learning
to compete in a global marketplace by becoming more efficient and more relevant to their
markets. In the meantime, State government has halted its
decades of continuous growth and has sought to become a
facilitator of business and economic activity rather than
primarily a regulator.
Tourism has been undergoing its own adjustment and
transition. Hawaii is no longer the fast-growing resort destina-
tion it was in the 1960s, 70s and 80s. We have reached a level
of maturity as a destination and have found ourselves relying
much more on repeat business than in the past. Moreover, we
find that we must compete vigorously for visitors with the many
established and new destinations that have entered the world
tourism market in recent years. We know that to keep and expand our visitor markets in
the face of this competition, Hawaii must maintain its reputation for high quality and
become more efficient. We must revitalize our visitor infrastructure and provide an
ever-changing menu of attractions and events for new and repeat visitors.
One of the most important milestones so far in this period of transition has been the
creation of the Hawaii Tourism Authority (HTA). This agency is a product of the public-
private sector effort over the past several years to rethink our approach to the economy.
With a dedicated funding source and a mostly private sector membership, the HTA has
assumed responsibility for leading the future development and marketing of tourism.
The Authority has risen boldly to this challenge and produced a strategic plan designed to
launch a “New Beginning” for Hawaii tourism. Moreover, the Authority intends to refine
and carry out this plan in cooperation with the community.
While the leadership for tourism policy and marketing has shifted to the Authority,
DBEDT still has important responsibilities in tourism. First, we will be working closely with
the Authority to make sure marketing and promotion of Hawaii’s developing industries
such as technology, film, health, education and other emerging export activity are coordi-
nated well with tourism marketing. In this way marketing efforts can be leveraged to
provide a boost to economic diversification as well.
In addition, DBEDT will be maintaining the critical base of statistical information on
visitor activity that serves to measure the industry’s performance and provide information
for marketing and development purposes. Since assuming this responsibility earlier this
year, DBEDT’s new Tourism Research Branch has made improvements in the data collection
process and, with the help of the Department’s Business Resource Center, has established
an internet web site for disseminating the information.
The revitalization of Hawaii tourism for the 21st century is essential for our economic
wellbeing. But it must be compatible with the imperative need to develop new industries
and with our environmental and social values, and must be a positive benefit to all
residents of Hawaii. The Hawaii Tourism Authority is committed to these challenging goals
and I urge the cooperation and goodwill of all residents, businesses and government
agencies to help the Hawaii Tourism Authority succeed in these goals.
Dr. Seiji NayaDirectorDept. of Business, Economic Development & Tourism
Seiji Naya
3Hawaii’s Economy /July 1999
industry’s development period and thebeginning of its mature phase. This sug-gests that future growth in the industrywill depend upon Hawaii’s competitiveskills rather than simply riding thegrowth in the travel market as a whole.From a marketing standpoint, the indus-try may have reached the point in itsproduct life cycle in which innovation,revitalization and cooperative effort willbe more important in determining itsfuture.
With this overall maturing and slow-ing of tourism as a backdrop, there havebeen several notable trends and events
since DBEDT’s last tourism report thatare worthy of mention.
Resurgence ofWestbound Tourism
The U.S. recession of the early 1990sand, the slow growth for several yearsthereafter, resulted in a general decline invisitors from the Mainland in the firsthalf of the 1990s. Fortunately, thisperiod was one of continued growth inHawaii’s Asian tourism markets, whichcountered much of the impact of thewestbound decline.
But as Table 1 shows, this strength
has seen a dramatic reversal over the lastseveral years. From 1995 to 1998, thewestbound visitor count increased by8 percent. This growth parallels theunprecedented period of strong growth inthe U.S. economy, which continues tothis day. By contrast, the economic crisisin Asia caused the eastbound visitorcount to decline by 12 percent from1996 to 1998.
The resurgence of the westboundmarket has been a welcome situationand, as discussed below, has provided acritical boost to the Neighbor Islandeconomies. But the parallel decline in theAsian market has had very negativeimpacts. Most severely affected has beenthe tourism–related retail sector. A sub-stantial number of stores had based theirgrowth on serving the Asian and particu-larly the Japan visitor market, whichspends heavily on clothes, accessoriesand gifts. Asian visitors are also a majormarket for first–class and deluxe hotelrooms, particularly in Waikiki. Theabsence of these visitors has hurtoccupancy in such establishments.
While the decline in the eastboundmarket has continued into mid–1999,there are signs that Asia’s crisis hasstabilized. However it is difficult to tellhow soon any improvement wouldtranslate into increased visitors fromAsia to Hawaii.
continued on page 5
Table 1. Visitor Arrivals 1985 to 1998
ArrivalsPercent Change from
Previous YearMarket Share by
Direction of Travel
Year Total Westbound Eastbound Total Westbound Eastbound Westbound Eastbound
1 9 8 5 4,884,110 3,708,610 1,175,500 0 . 6 - 0 . 3 3 . 6 7 5 . 9 2 4 . 1
1 9 8 6 5,606,980 4,256,390 1,350,590 1 4 . 8 1 4 . 8 1 4 . 9 7 5 . 9 2 4 . 1
1 9 8 7 5,799,830 4,204,010 1,595,820 3 . 4 - 1 . 2 1 8 . 2 7 2 . 5 2 7 . 5
1 9 8 8 6,142,420 4,264,730 1,877,690 5 . 9 1 . 4 1 7 . 7 6 9 . 4 3 0 . 6
1 9 8 9 6,641,820 4,705,320 1,936,500 8 . 1 1 0 . 3 3 . 1 7 0 . 8 2 9 . 2
1 9 9 0 6,971,180 4,719,730 2,251,450 5 . 0 0 . 3 1 6 . 3 6 7 . 7 3 2 . 3
1 9 9 1 6,873,890 4,584,460 2,289,430 - 1 . 4 - 2 . 9 1 . 7 6 6 . 7 3 3 . 3
1 9 9 2 6,513,880 3,980,120 2,533,760 - 5 . 2 - 1 3 . 2 1 0 . 7 6 1 . 1 3 8 . 9
1 9 9 3 6,124,230 3,764,520 2,359,710 - 6 . 0 - 5 . 4 - 6 . 9 6 1 . 5 3 8 . 5
1 9 9 4 6,430,300 3,997,820 2,432,480 5 . 0 6 . 2 3 . 1 6 2 . 2 3 7 . 8
1 9 9 5 6,629,180 3,933,110 2,696,070 3 . 1 - 1 . 6 1 0 . 8 5 9 . 3 4 0 . 7
1 9 9 6 6,829,800 4,004,450 2,825,350 3 . 0 1 . 8 4 . 8 5 8 . 6 4 1 . 4
1 9 9 7 6,876,140 4,077,950 2,798,190 0 . 7 1 . 8 - 1 . 0 5 9 . 3 4 0 . 7
1 9 9 8 6,738,220 4,245,270 2,492,950 - 2 . 0 4 . 1 - 1 0 . 9 6 3 . 0 3 7 . 0
35
30
25
20
15
10
5
0
-51955-60 1960-65 1965-70 1970-75 1975-80 1980-85 1985-90 1990-95 1995-98
Figure 2. Growth in Visitor Arrivals, 1955-1998(Annual percentage change for the period)
Westbound
Eastbound
Total
Per
cent
PeriodSource: HVCB

4 Hawaii’s Economy /July 1999
As in 1998, visitor industry perfor-mance in 1999 has hinged on the bal-ance between an Asian market inrecession and generally thriving marketsin the U.S. and Canada. Table A summa-rizes tourism performance for the first sixmonths of 1999. The results are mixed,with visitor arrivals flat or down, butwith the daily visitor census generally up
Tourism in 1999: Performance and Outlookparticularly Japanese visitors, wererunning about 7.7 percent behind thesame 1998 period. However a modestincrease in length of stay by those east-bound visitors who did arrive helpedkeep the decline in the average dailycensus for this group to just 3.3 percent.The overall result has been a 0.6 percentincrease in the statewide visitor count in1999, with an increase in the dailyvisitor census of 2.7 percent.
The decline in eastbound visitors hasbeen most serious for Oahu, sinceroughly half of the City and County’svisitors come from Asia and the Pacific.Consequently, while Oahu showed gainsin westbound tourism for the first sixmonths, the double-digit decline in theeastbound direction pulled the overallarrival total down 3.1 percent for thefirst six months of the year. Yet, like thestate, Oahu experienced a gain in theoverall visitor census (a 3.4 percentincrease for the period) thanks to theincreased length of stay.
Among the Neighbor Island counties,the strong westbound market was ableto counter eastbound declines on Mauiand Kauai but not in Hawaii County. Ha-waii was also the only county to registera decline in the overall visitor censusduring the first six months of 1999.
Short-Term Outlook for TourismDBEDT’s economic forecast for 1999
expects some improvement in the visitorcount in the second half of the year,leading to a slight increase for statewidetourism in 1999. However it is not clearwhether the improvement will be consis-tent among the counties. It is hoped thatthe Asian market will stabilize this yearand begin a gradual recovery thereafter,although the schedule for that recoverydepends on how quickly the Asianeconomies, particularly Japan, can solvetheir economic problems.
around the state.The strength in the U.S and Canadian
markets has helped westbound visitorarrivals increase by 5.4 percent for theperiod. With a slight decrease in thewestbound length of stay, the dailywestbound visitor census was up by4.5 percent. Eastbound visitor arrivals,which are dominated by Asian and
Table A. Visitor Industry Performance IndicatorsJanuary to June 1999
(all data are preliminary)
Arrivals
Indicator Number % Change
Statewide visitor arrivals (by air)1 3,368,040 0.6%
Westbound 2,228,970 5.4%
U.S. 1,849,810 5.5%
Canada 163,180 15.6%
Europe 88,730 0.1%
Eastbound 1,139,070 -7.7%
Intended visitors by county
Oahu 2,288,400 -3.1%
Westbound 1,207,210 5.8%
Eastbound 1,081,190 -11.4%
Maui (Maui, Molokai & Lanai Islands) 1,178,130 0.5%
Westbound 1,008,460 4.1%
Eastbound 169,670 -16.4%
Hawaii 626,980 -3.0%
Westbound 500,490 1.2%
Eastbound 126,490 -16.7%
Kauai 536,340 6.5%
Westbound 477,700 9.0%
Eastbound 58,640 -10.2%
Statewide daily visitor census 162,630 2.7%
Westbound 126,630 4.5%
Eastbound 36,000 -3.3%
Oahu 75,655 3.4%
Maui County 45,547 1.3%
Hawaii County 23,277 -1.9%
Kauai County 18,151 9.5%
1 About 26,000 visitors arr ived on cruise ships in the first six months of 1999. This was 58.0 percent more than in thesame 1998 period.
Source: DBEDT

5Hawaii’s Economy /July 1999
Tourism Growth Now Favorsthe Neighbor Islands
Oahu was the primary beneficiary ofthe surge in eastbound visitors duringthe first half of the 1990s. From 1990to 1997, the proportion of Oahu arrivalsaccounted for by eastbound visitorsincreased from 41 percent to nearly55 percent. But as a result of the shift inthe growth from eastbound to westboundvisitors since 1997, the visitor count onOahu has fallen, while Neighbor Islandshave experienced stronger growth onaverage. This trend has restored confi-dence in the tourism sectors of theNeighbor Islands and provided a neededeconomic boost. However, the impact onOahu, which accounts for more thanthree-quarters of the state’s economy,has been the opposite.
Policy TrendsFormation of the Hawaii Tourism
Authority (HTA) may be the most signifi-cant change in tourism marketing sincethe formation of the Hawaii VisitorsBureau in 1903. This thirteen-memberauthority was created through Act 156HSL 1998, as an outgrowth of recom-mendations by the Economic Revitaliza-tion Task Force of the previous year. Theformation of the HTA reflects the notionthat tourism is entering a new stage and
that pro-active, cooperative effort by theprivate and public sectors will determinethe long-run future of Hawaii’s majorindustry.
The HTA has been given the author-ity to develop and administer marketingand promotional efforts on behalf ofHawaii’s visitor industry. The HTA mayalso develop plans for the future develop-ment of tourism in terms of both industryproducts and infrastructure support. TheAuthority was finalizing its first strategicplan for tourism as of June 1999.
The HTA assumes responsibilities thatwere previously shared among severalpublic and private agencies, most notablyDBEDT, through its State Tourism Office,and the Hawaii Visitors and ConventionBureau. The legislation establishing theHTA also designated DBEDT to maintainand report visitor statistics as well asconduct tourism–related research.
Tourism Financing ReformOne of the issues raised in DBEDT’s
1996 report on tourism was the need toprovide more stability in the fundingprocess for tourism marketing. In addi-tion to establishing the HTA, Act 156also shifted the burden of funding tour-ism promotion and marketing activitiesfrom the State General Fund, where itcompeted with all other state spending
Tourism Looks to the Future continued from page 3
TheEconomicImpact ofTourism:
An Update
Tourism spending in Hawaiiaccounted directly and indirectlyfor about 22 percent of both Gross
State Product (GSP) and labor income in1998. This updated estimate is based onDBEDT’s State of Hawaii Input-Output(I-O) Model which was recently revisedto reflect valuable new information.1
The “Visitor Industry”Tourism is not an industry in the strict
sense of the term. A search of the Stan-dard Industrial Classification manual orthe U.S. Bureau of Economic Analysis’sindustrial structure will not turn up anindustry called “tourism” or “visitors”.What Hawaii defines as the visitor indus-try is made up of parts of many different
industries ranging from agriculture tomanufacturing to government. The visi-tor component of each industry is calcu-
lated as a proportion of the industry’ssales to visitors. Thus, estimating thesize of the “visitor industry” and its rela-tionship to other industries is particularlychallenging, since it requires estimatingthe visitor-related portion of each of the118 industries that are part of theI-O model.
Visitor SpendingMeasuring the economic impact of
the visitor industry starts with visitorexpenditures — that is, the amount of
priorities, to the Transient Accommoda-tions Tax (TAT). A new Tourism SpecialFund was created to absorb about 38percent of the TAT, which was adjustedupwards to 7.25%. It is expected that thefund will provide between $50 and $60million per year for tourism marketingand development.
Previously, tourism marketing fundswere appropriated by the Legislaturefrom the General Fund each year, andthis meant that tourism marketing needscompeted with all other state priorities.The special fund establishes a dedicatedfinancing source that can assure a con-sistent long-run marketing and promo-tion effort even as year-to-year statepriorities change. The section of thisreport on tourism issues explores thesignificance of the policy changes inmore detail.
ConclusionSince 1996 tourism has shown only
modest improvement. However with anew Tourism Authority, more funding formarketing, and a Tourism Strategic Planto set the direction, there is reason foroptimism about reinvigorating this essen-tial industry. The next several articleslook at particular areas of interest inthe emerging tourism market of the21st century.
1 A report on the 1992 I-O model can be found at http://www.hawaii.gov/dbedt under Statistics & Publications.The new information are based on the 1992 EconomicCensus and other sources. Before the revisions, the modelwas based on 1987 relationships.
continued on page 6

6 Hawaii’s Economy /July 1999
money that out-of-state visitors spend inHawaii.2 Table 1 shows expendituresmade by visitors arriving by air. Inaddition to visitor spending in Hawaii,the visitor–related portion of overseasairline expenditures in Hawaii is alsoincluded as a component of visitorexpenditures.
The sum of the components in Table 1equals Gross Visitor Expenditures, whichinclude the portion of spending on prod-ucts or services that were imported andresold to the visitor. As the table indi-cates, gross expenditures increased in allbut two of the last six years and in 1998were about 4 percent below their peakin 1995.
While gross visitor expenditurescorrectly represent the total sales made tovisitors by Hawaii businesses, it does notnecessarily represent the economic con-tribution of tourism to Hawaii. If we areinterested in the contribution of the visi-tor industry to goods and services pro-duced by Hawaii, we must exclude thevalue of goods that were imported fromelsewhere and sold to visitors.
Table 2 shows estimates of theportion of gross visitor expendituresaccounted for by imports. When this issubtracted from gross expenditures, theresult is a measure of net visitor expendi-tures. Net visitor expenditures representthe value added to the economy by thevisitor industry as measured by GSP. Netvisitor expenditures declined in two ofthe past six years and in 1998, it was4 percent below its peak in 1995.
GSP, Jobs, Income and TaxesVisitor expenditures stimulate the
economy in three major ways. First, aportion of visitor spending directlysupports the jobs and income of visitorindustry employees, managers and smallbusiness owners.3 These are the peopleand firms that deal directly with the visi-tor. The operation might be a hotel inWaikiki, deriving most its income fromvisitors, or a convenience store in Aiea,with only occasional visitor sales.
Second, visitor spending stimulatesthe economy indirectly when firms inthe visitor industry and their businesssuppliers replenish inventories and main-tain their facilities. The indirect impactstimulates the inter-business income andproduction chain by re-circulating visitordollars to industries and workers whosupply goods and services to the visitorsector. For example, cases of macadamianut candies purchased in a store bymembers of a tour group are replaced by
ordering more of the product. This im-pacts local companies all the way downthe business-distribution chain, andeventually to the macadamia orchardson the Big Island and Kauai.
The third effect of visitor spending,called the induced effect, is felt whenemployees of firms in both tourism andits business-distribution chain spendtheir household income for goods andservices in the community. The inducedeffect spreads throughout the economy,far beyond the tourism industry and itssupply chain. In times of rapid increasein visitor activity, the indirect and in-duced effect can stimulate incomes andspending throughout the state in all in-dustries with most people and businessesunaware that their prosperity is linked tovisitor spending.
Of course the process also works inreverse. That is, a decline in visitorspending will not only reduce the directeffect on the industry; it will also reducethe indirect and induced effects, and thecommunity will eventually see declinesin sales and probably job losses in areasthat are not directly related to visitoractivity. While this lack of visible linkagemay help explain why many residents donot think they are or will be affected bydeclines in the visitor industry, in fact,most residents are vitally affected by thehealth of this industry.
Table 1. Hawaii Visitor-Related Expenditures1
Overseas Airl ine Gross Visi torExpendi tures Expendi tures
Ye a r Visitors by Air ($mil.) ($mil.)
Table 2. Direct Contribution of Tourism to Hawaii’s Economy
Gross Visi tor Visi tor-Related Net Visi torExpendi tures Impor t s Expendi tures
Ye a r ($mil.) ($mil.) ($mil.)
GSP ($mil.) Jobs (1,000)1 Labor Income ($mil.) S&L Taxes ($mil.)
Direct , Direct , Direct , Direct ,Direct & Indirect, Direct & Indirect, Direct & Indirect, Direct & Indirect,
Year Indirect & Induced Indirect & Induced Indirect & Induced Indirect & Induced
Table 3. Economic Impact of Tourism in Hawaii
2 While residents can certainly be viewed as tourists whenthey use hotels and visit tourist attractions, this analysisfocuses on sales to out-of-state visitors, which brings newmoney into the state.
3 Of course, visitor spending also supports stockholderdividends and retained corporate earnings of businessesdirectly involved in providing goods and services to visitors.However, these are relatively small compared to payroll andinter-business purchases.
The Economic Impact of Tourism continued from page 5
1 9 9 2 9 ,558 .9 4 6 1 . 2 10 ,020 .1
1 9 9 3 8 ,677 .6 4 4 7 . 5 9 ,125 .1
1 9 9 4 10 ,603 .2 4 3 2 . 5 11 ,035 .7
1 9 9 5 11 ,587 .7 4 3 9 . 3 12 ,027 .0
1 9 9 6 10 ,684 .8 4 4 1 . 8 11 ,126 .6
1 9 9 7 10 ,770 .1 4 6 1 . 6 11 ,231 .7
1 9 9 8 2 11 ,133 .3 4 6 1 . 4 11 ,594 .7
1 Visitors came to Hawaii by Air only.2 Preliminary estimate.
Source: DBEDT
1 9 9 2 10 ,020 .1 3 ,757 .5 6 ,262 .6
1 9 9 3 9 ,125 .1 3 ,421 .9 5 ,703 .2
1 9 9 4 11 ,035 .7 4 ,138 .4 6 ,897 .3
1 9 9 5 12 ,027 .0 4 ,510 .1 7 ,516 .9
1 9 9 6 11 ,126 .6 4 ,172 .5 6 ,954 .1
1 9 9 7 11 ,231 .7 4 ,211 .9 7 ,019 .8
1 9 9 8 11 ,594 .7 4 ,348 .0 7 ,246 .7
1 9 9 2 6 ,262 .6 9 ,872 .7 1 8 1 . 6 3 2 3 . 2 3 ,952 .0 6 ,069 .1 7 5 2 . 7 1 ,112 .6
1 9 9 3 5 ,703 .2 8,990.9 1 7 6 . 3 3 1 2 . 3 3 ,599 .0 5 ,527 .0 6 8 7 . 2 1,015.0
1 9 9 4 6 ,897 .3 10 ,873 .4 1 7 6 . 4 3 1 1 . 7 4 ,352 .6 6 ,684 .3 8 2 6 . 4 1 ,222 .8
1 9 9 5 7 ,516 .9 11 ,850 .1 1 7 7 . 7 3 1 4 . 0 4 ,743 .5 7 ,284 .7 9 1 2 . 0 1 ,344 .0
1 9 9 6 6 ,954 .1 10 ,962 .9 1 7 9 . 6 3 1 7 . 2 4 ,388 .4 6 ,739 .3 8 7 0 . 0 1 ,269 .7
1 9 9 7 7 ,019 .8 11 ,066 .5 1 8 0 . 7 3 1 9 . 2 4 ,429 .9 6 ,803 .0 8 8 0 . 0 1 ,283 .4
1 9 9 8 2 7 ,246 .7 11 ,424 .2 1 8 0 . 1 3 1 8 . 2 4 ,573 .0 7 ,022 .9 9 0 3 . 3 1 ,319 .8
1 Includes self-employed jobs.2 Preliminary estimates.Source: DBEDT
Source: DBEDT
7Hawaii’s Economy /July 1999
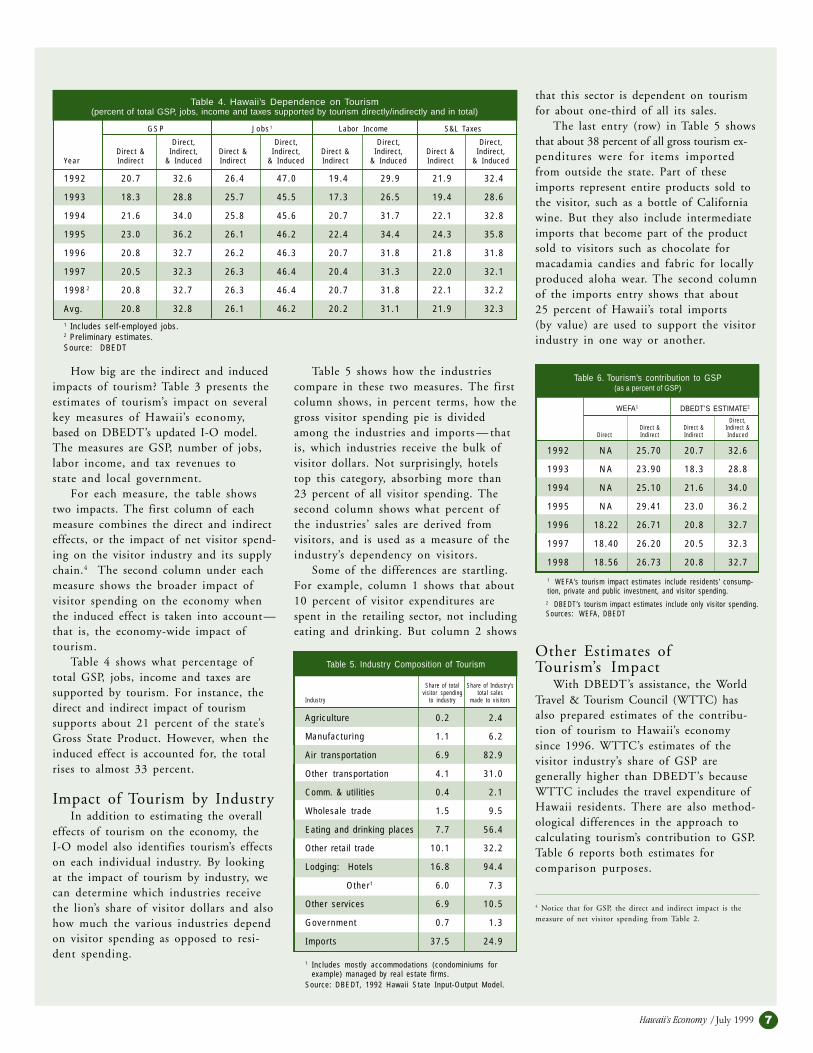
How big are the indirect and inducedimpacts of tourism? Table 3 presents theestimates of tourism’s impact on severalkey measures of Hawaii’s economy,based on DBEDT’s updated I-O model.The measures are GSP, number of jobs,labor income, and tax revenues tostate and local government.
For each measure, the table showstwo impacts. The first column of eachmeasure combines the direct and indirecteffects, or the impact of net visitor spend-ing on the visitor industry and its supplychain.4 The second column under eachmeasure shows the broader impact ofvisitor spending on the economy whenthe induced effect is taken into account—that is, the economy-wide impact oftourism.
Table 4 shows what percentage oftotal GSP, jobs, income and taxes aresupported by tourism. For instance, thedirect and indirect impact of tourismsupports about 21 percent of the state’sGross State Product. However, when theinduced effect is accounted for, the totalrises to almost 33 percent.
Impact of Tourism by IndustryIn addition to estimating the overall
effects of tourism on the economy, theI-O model also identifies tourism’s effectson each individual industry. By lookingat the impact of tourism by industry, wecan determine which industries receivethe lion’s share of visitor dollars and alsohow much the various industries dependon visitor spending as opposed to resi-dent spending.
Table 5 shows how the industriescompare in these two measures. The firstcolumn shows, in percent terms, how thegross visitor spending pie is dividedamong the industries and imports — thatis, which industries receive the bulk ofvisitor dollars. Not surprisingly, hotelstop this category, absorbing more than23 percent of all visitor spending. Thesecond column shows what percent ofthe industries’ sales are derived fromvisitors, and is used as a measure of theindustry’s dependency on visitors.
Some of the differences are startling.For example, column 1 shows that about10 percent of visitor expenditures arespent in the retailing sector, not includingeating and drinking. But column 2 shows
that this sector is dependent on tourismfor about one-third of all its sales.
The last entry (row) in Table 5 showsthat about 38 percent of all gross tourism ex-penditures were for items importedfrom outside the state. Part of theseimports represent entire products sold tothe visitor, such as a bottle of Californiawine. But they also include intermediateimports that become part of the productsold to visitors such as chocolate formacadamia candies and fabric for locallyproduced aloha wear. The second columnof the imports entry shows that about25 percent of Hawaii’s total imports(by value) are used to support the visitorindustry in one way or another.
Table 4. Hawaii’s Dependence on Tourism(percent of total GSP, jobs, income and taxes supported by tourism directly/indirectly and in total)
G S P J o b s 1 Labor Income S&L Taxes
Direct , Direct , Direct , Direct ,Direct & Indirect, Direct & Indirect, Direct & Indirect, Direct & Indirect,
Year Indirect & Induced Indirect & Induced Indirect & Induced Indirect & Induced
Table 5. Industry Composition of Tourism
Share of total Share of Industr y’svisitor spending total sales
Indust ry to industry made to visitors
Table 6. Tourism’s contribution to GSP(as a percent of GSP)
Direct ,Direct & Direct & Indirect &
Direct Indi rect Indi rect I nduced
WEFA1 DBEDT’S ESTIMATE2
1 9 9 2 2 0 . 7 3 2 . 6 2 6 . 4 4 7 . 0 1 9 . 4 2 9 . 9 2 1 . 9 3 2 . 4
1 9 9 3 1 8 . 3 2 8 . 8 2 5 . 7 4 5 . 5 1 7 . 3 2 6 . 5 1 9 . 4 2 8 . 6
1 9 9 4 2 1 . 6 3 4 . 0 2 5 . 8 4 5 . 6 2 0 . 7 3 1 . 7 2 2 . 1 3 2 . 8
1 9 9 5 2 3 . 0 3 6 . 2 2 6 . 1 4 6 . 2 2 2 . 4 3 4 . 4 2 4 . 3 3 5 . 8
1 9 9 6 2 0 . 8 3 2 . 7 2 6 . 2 4 6 . 3 2 0 . 7 3 1 . 8 2 1 . 8 3 1 . 8
1 9 9 7 2 0 . 5 3 2 . 3 2 6 . 3 4 6 . 4 2 0 . 4 3 1 . 3 2 2 . 0 3 2 . 1
1 9 9 8 2 2 0 . 8 3 2 . 7 2 6 . 3 4 6 . 4 2 0 . 7 3 1 . 8 2 2 . 1 3 2 . 2
Avg . 2 0 . 8 3 2 . 8 2 6 . 1 4 6 . 2 2 0 . 2 3 1 . 1 2 1 . 9 3 2 . 3
1 Includes self-employed jobs.2 Preliminary estimates.Source: DBEDT
Agr iculture 0 . 2 2 . 4
Manufactur ing 1 . 1 6 . 2
Air transportation 6 . 9 8 2 . 9
Other transportation 4 . 1 3 1 . 0
Comm. & uti l i t ies 0 . 4 2 . 1
Wholesale trade 1 . 5 9 . 5
Eating and drinking places 7 . 7 5 6 . 4
Other retail trade 1 0 . 1 3 2 . 2
Lodging: Hotels 1 6 . 8 9 4 . 4
Other1 6 . 0 7 . 3
Other services 6 . 9 1 0 . 5
Gove r nmen t 0 . 7 1 . 3
Impor ts 3 7 . 5 2 4 . 9
1 Includes mostly accommodations (condominiums for example) managed by real estate firms.Source: DBEDT, 1992 Hawaii State Input-Output Model.
1 9 9 2 N A 2 5 . 7 0 2 0 . 7 3 2 . 6
1 9 9 3 N A 2 3 . 9 0 1 8 . 3 2 8 . 8
1 9 9 4 N A 2 5 . 1 0 2 1 . 6 3 4 . 0
1 9 9 5 N A 2 9 . 4 1 2 3 . 0 3 6 . 2
1 9 9 6 1 8 . 2 2 2 6 . 7 1 2 0 . 8 3 2 . 7
1 9 9 7 1 8 . 4 0 2 6 . 2 0 2 0 . 5 3 2 . 3
1 9 9 8 1 8 . 5 6 2 6 . 7 3 2 0 . 8 3 2 . 7
1 WEFA’s tourism impact est imates include residents’ consump-tion, private and public investment, and visitor spending.
Other Estimates ofTourism’s Impact
With DBEDT’s assistance, the WorldTravel & Tourism Council (WTTC) hasalso prepared estimates of the contribu-tion of tourism to Hawaii’s economysince 1996. WTTC’s estimates of thevisitor industry’s share of GSP aregenerally higher than DBEDT’s becauseWTTC includes the travel expenditure ofHawaii residents. There are also method-ological differences in the approach tocalculating tourism’s contribution to GSP.Table 6 reports both estimates forcomparison purposes.
4 Notice that for GSP, the direct and indirect impact is themeasure of net visitor spending from Table 2.
2 DBEDT’s tour ism impact estimates include only visitor spending.Sources: WEFA, DBEDT
8 Hawaii’s Economy /July 1999
Understanding Tourism Niche Marketswith Input-Output Analysis
Because tourism is Hawaii’s largesteconomic activity, DBEDT’s Research andEconomic Analysis Division (READ)conducts economic impact analyses ofvisitor-related events. To conduct theseanalyses, READ economists frequentlyuse the State Input-Output (I-O) model.This article looks at the application ofthese I-O techniques in analyzing twotourism-related activities: cruise shipactivity and the Ironman Triathlon.
In most cases, the analysis beginswith an estimate of the expected directdollar impact of the event. In our ex-amples, estimates must be made of cruiseship visitor expenditures or the spendingof participants and related visitors for theIronman. These direct spending estimatesare often constructed from informationoutside the I-O model. The I-O modelthen converts these direct dollar impactsinto additional indirect and inducedeffects on sales, income, jobs, and so on.
Cruise ShipsHawaii’s cruise industry consists of
two components: (1) the domesticoperations of American Hawaii Cruises(AHC), and (2) foreign-flagged cruiseships that visit Hawaii from foreignports. AHC currently operates one,U.S.-flagged cruise ship in its interislandcruise operations, the S.S. Independence(see article on page 12 for more infor-mation on the cruise and AHC). TheIndependence leaves Honolulu’s AlohaTower Marketplace each Saturday andcruises to Kauai, Maui, Hilo and Konabefore returning to Honolulu thefollowing Saturday.
In addition to AHC operations, foreigncruise vessels regularly visit Hawaii andtour among the islands. Indeed, thecruise industry has been growing rapidlyfor many years. In 1998, 21 foreigncruise ships visited Hawaii, making atotal of 220 port calls — up from just56 port calls in 1994.
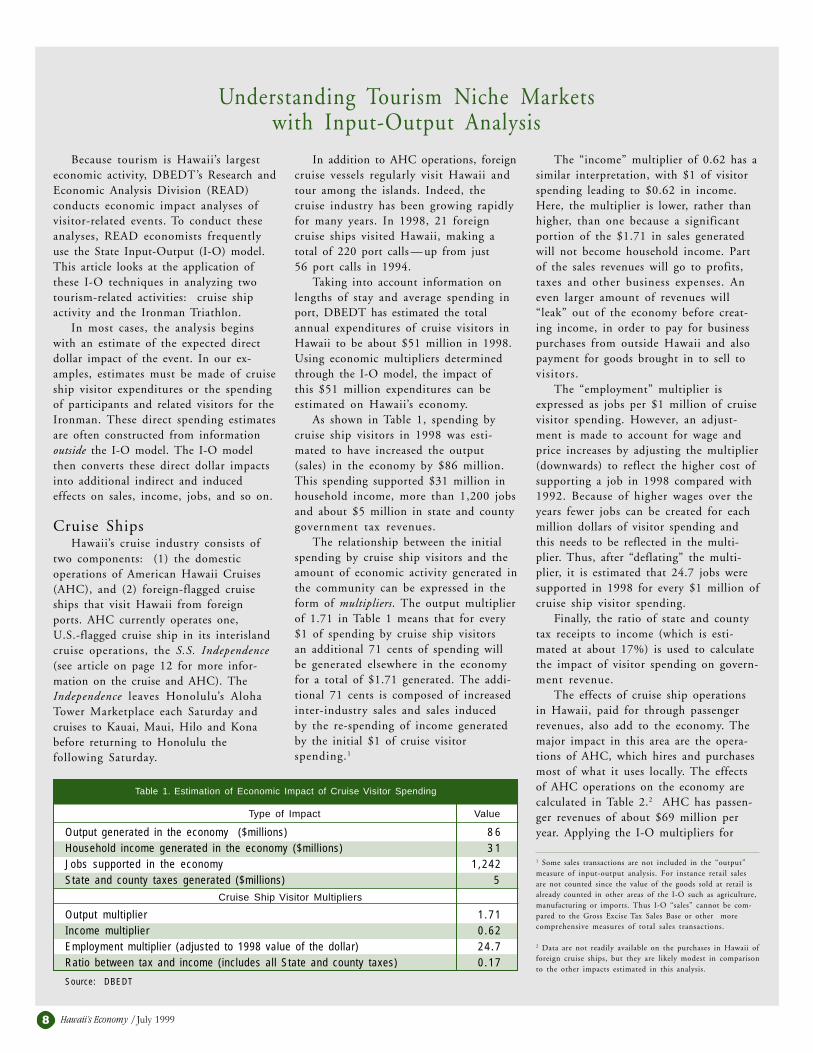
Taking into account information onlengths of stay and average spending inport, DBEDT has estimated the totalannual expenditures of cruise visitors inHawaii to be about $51 million in 1998.Using economic multipliers determinedthrough the I-O model, the impact ofthis $51 million expenditures can beestimated on Hawaii’s economy.
As shown in Table 1, spending bycruise ship visitors in 1998 was esti-mated to have increased the output(sales) in the economy by $86 million.This spending supported $31 million inhousehold income, more than 1,200 jobsand about $5 million in state and countygovernment tax revenues.
The relationship between the initialspending by cruise ship visitors and theamount of economic activity generated inthe community can be expressed in theform of multipliers. The output multiplierof 1.71 in Table 1 means that for every$1 of spending by cruise ship visitorsan additional 71 cents of spending willbe generated elsewhere in the economyfor a total of $1.71 generated. The addi-tional 71 cents is composed of increasedinter-industry sales and sales inducedby the re-spending of income generatedby the initial $1 of cruise visitorspending.1
Type of Impact Value
Table 1. Estimation of Economic Impact of Cruise Visitor Spending
The “income” multiplier of 0.62 has asimilar interpretation, with $1 of visitorspending leading to $0.62 in income.Here, the multiplier is lower, rather thanhigher, than one because a significantportion of the $1.71 in sales generatedwill not become household income. Partof the sales revenues will go to profits,taxes and other business expenses. Aneven larger amount of revenues will“leak” out of the economy before creat-ing income, in order to pay for businesspurchases from outside Hawaii and alsopayment for goods brought in to sell tovisitors.
The “employment” multiplier isexpressed as jobs per $1 million of cruisevisitor spending. However, an adjust-ment is made to account for wage andprice increases by adjusting the multiplier(downwards) to reflect the higher cost ofsupporting a job in 1998 compared with1992. Because of higher wages over theyears fewer jobs can be created for eachmillion dollars of visitor spending andthis needs to be reflected in the multi-plier. Thus, after “deflating” the multi-plier, it is estimated that 24.7 jobs weresupported in 1998 for every $1 million ofcruise ship visitor spending.
Finally, the ratio of state and countytax receipts to income (which is esti-mated at about 17%) is used to calculatethe impact of visitor spending on govern-ment revenue.
The effects of cruise ship operationsin Hawaii, paid for through passengerrevenues, also add to the economy. Themajor impact in this area are the opera-tions of AHC, which hires and purchasesmost of what it uses locally. The effectsof AHC operations on the economy arecalculated in Table 2.2 AHC has passen-ger revenues of about $69 million peryear. Applying the I-O multipliers for
1 Some sales transactions are not included in the “output”measure of input-output analysis. For instance retail salesare not counted since the value of the goods sold at retail isalready counted in other areas of the I-O such as agriculture,manufacturing or imports. Thus I-O “sales” cannot be com-pared to the Gross Excise Tax Sales Base or other morecomprehensive measures of total sales transactions.
2 Data are not readily available on the purchases in Hawaii offoreign cruise ships, but they are likely modest in comparisonto the other impacts estimated in this analysis.
Output generated in the economy ($millions) 8 6Household income generated in the economy ($mill ions) 3 1Jobs supported in the economy 1 , 2 4 2State and county taxes generated ($millions) 5
Cruise Ship Visitor Multipliers
Output multipl ier 1 . 7 1Income multipl ier 0 . 6 2Employment multiplier (adjusted to 1998 value of the dollar) 2 4 . 7Ratio between tax and income (includes all State and county taxes) 0 . 1 7
Source: DBEDT

9Hawaii’s Economy /July 1999
ocean transportation, the model indicatesthat interisland cruise operations accountfor $155 million of sales, $42 million ofhousehold income, and 1,200 jobs inHawaii’s economy.
The economic impacts of cruise shipvisitor expenditures and AmericanHawaii Cruises operations may be addedtogether to estimate the total effect of thecruise industry on Hawaii’s economy.Table 3 summarizes these results.
The estimates show that the industrycurrently generates nearly 2,500 jobs inthe state, as well as $240 million in out-put, $73 million in household incomeand close to $13 million in state andlocal government revenues.
Ironman TriathlonInput-output analysis can also be
used to calculate the economic impact onthe economy of events held in Hawaii.One example is the Ironman Triathlonwhich has been held in Hawaii since1978. Held on the Big Island, the eventhas grown steadily over the years andnow averages about 1,400 participants.
About 95 percent of the participantscome from out-of-state. They are accom-panied by family, friends, other visitors,and media personnel covering the event.All of these people spend money inHawaii and thereby contribute to theeconomy. In order to estimate the impactof the Ironman on the economy, anestimate must first be made of how muchthose associated with the event spend inHawaii. This estimate has been calcu-lated at $14.9 million.
Understanding Tourism Niche Markets continued from page 8
Table 2. Impact of American Hawaii Cruises Operations
Type of Impact Value
Table 3. Total Economic Impact of Cruise Industry in Hawaii
Applying the estimated tourismmultipliers for total sales (1.71) andhousehold income (0.62) to the $14.9million spent, it is estimated that theIronman event results in total output/sales of $25.4 million and householdincome of $9.2 million. Since approxi-mately 17 percent of visitor expendituresbecome state and local tax revenue, theevent generated about $1.6 million instate and local revenue.
The employment multiplier is gener-ally not applied to annual or one-timeevents such as the Triathlon. Such eventsdo not generally result in permanent or
ongoing positions. Instead, the economyresponds by creating opportunities forovertime and temporary jobs that maylast only during the event.
ConclusionThe I-O model provides a powerful
tool for estimating the impact of industryactivity and events on the economy. Italso allows comparison among alterna-tive activities, particularly as to whichones generate the most economic activityfor a given amount of export revenue orspending by outsiders in the localeconomy.
TourismInitiativesand Issues
In the last issue of Hawaii’s Economydevoted to tourism, four issues wereidentified as worthy of special atten-
tion by policy makers and planners.Those were 1) the need to boost activityon the Neighbor Islands, 2) increasingthe proportion of deluxe rooms in theWaikiki area, 3) working for more airseat capacity, and 4) restructuring tour-ism promotion financing to provide amore stable marketing effort.
Encouraging progress has been madein most of these areas. Neighbor Islandtourism now leads growth statewide.
Tourism marketing is now fundedthrough a portion of the TransientAccommodations Tax (TAT) which will
provide about twice the level of previouspublic sector support. Air seat capacitydoes appear to be improving as the west-bound market recovers (see p. 21). Somemodest progress in establishing incen-tives for renovation and upgrading ofroom quality in Waikiki has been made.However, the sharp decline in the Asianmarket, which favors first–class accom-modations, has eased the potential short-age for now. Nevertheless, as the Asianmarket recovers and the convention cen-ter bookings increase, the potential for ashortage of high-end rooms will remain.
Output generated ($mill ions) 2 4 1 . 2Household income generated ($mill ions) 7 3 . 3Jobs supported 2 , 4 5 0State and local taxes generated ($millions) 1 2 . 5
Source: DBEDT
Type of Impact Value
Estimated annual passenger revenure ($million) 6 9
Output generated ($mill ion) 1 5 5Household income generated ($mill ion) 4 2
Jobs supported 1 , 2 0 9State and local taxes generated ($million) 7 . 2
Cruise Ship Operations Multipliers (for ocean transportation)Output multipl ier 2 . 2 5Income multipl ier 0 . 6 1Employment multipl ier for ocean transportation 1 7 . 3 1Ratio between tax and income (includes all state & county taxes) 0 . 1 7
Source: DBEDT
continued on page 10

10 Hawaii’s Economy /July 1999
New InitiativesThe primary responsibility for antici-
pating and addressing Hawaii’s tourismdevelopment needs now rests with thenew Hawaii Tourism Authority. The HTAhas developed a Tourism Strategic Planwhich evaluates the state of the industryand establishes priority needs and issuesthe Authority will address under itsresponsibilities and with the resourcesof the Tourism Special Fund.
Formulated as Strategic Initiatives,the priorities and issues on which theHTA intends to focus address issuesraised in the earlier DBEDT tourismreport and add a comprehensive set ofnew priorities which were developedthrough the Authority’s extensive situa-tion analysis of tourism. Rather thanattempt to add to the HTA list of initia-tives and issues, it is more useful for thisreport to help foster an understanding ofthe content and rationale of theAuthority’s intended initiatives.
HTA Strategic InitiativesA : Communication and
Community RelationsThe HTA recognizes that public
support and participation are essentialto the goal of reinvigorating tourism.There are many stakeholders in Hawaiitourism — visitors, residents, privatebusinesses, and government agencies —all of whom have different issues ofinterest and concern. As the overallgovernment authority responsible fortourism, the HTA will need to link stake-holders and their interests to a commondirection. This will mean facilitating rela-tionships among community, industryand government stakeholders to addressrelevant tourism issues. To accomplishthis strategic initiative, the Authorityproposes development of a communica-tion plan to increase public awarenessand understanding of tourism, andobtain input on issues of concern.
B : M a r k e t i n gMarketing and promotion of Hawaii
to the world is the HTA’s primary respon-sibility. In the past few years Hawaii’spromotional efforts have been overshad-owed by those of competing destinationsand the state has not been able to keep
its high–quality product offerings in frontof consumers. The Authority believesthis situation has been a factor in thedecline of visitor expenditures andmarket share in recent years. With thecreation of the dedicated Tourism SpecialFund, Hawaii will have the capability todeliver a more globally competitivemarketing and promotional effort.
But with the ability to apply addi-tional resources comes the need to bemore sophisticated about the approachto marketing and the responsibility tomeasure the effectiveness of marketingexpenditures. The HTA’s strategy formarketing is to increase promotionalpresence and “brand identity” to morecompetitive levels and to optimize theeffectiveness of promotion in each MajorMarket Area, or “MMA,” as the HTArefers to them. The HTA’s aim is toallocate marketing resources so as toincrease the total expenditures made byvisitors in Hawaii, thus creating jobs andgenerating tax revenues.
The HTA has segmented the worldinto 10 MMAs. Two U.S. regions includethe western and eastern halves of thecountry. Japan and Canada are singledout as MMAs. Europe, Oceania, otherAsia and Latin America are each a sepa-rate MMA. The Hawaii ConventionCenter is designated as an MMA, and allremaining markets are contained in an“other” MMA category. Resource alloca-tions to the MMAs will be based onobtaining the highest return on invest-ment in terms of visitor expenditures,not just arrivals.
The challenge for the HTA will be thedevelopment of promotional programs toaccomplish the goal of increasing expen-ditures in each of the MMAs.
C: E v e n t sHawaii has a multitude of events that
vary in their degree of impact on the visi-tor industry. Most industry experts agreethat events for visitors, and especiallyevents that attract national media, are animportant part of a destination’s market-ing arsenal. In the past, many eventshave been funded through the State tour-ism budget. However, it has not alwaysbeen clear how the funded events wereexpected to contribute to the overall
marketing effort or how Hawaii’s fundingof such events could be optimized toincrease the marketing value.
The HTA’s Tourism Plan proposes astrategy to develop and support eventsthat generate cost–effective awareness ofthe Hawaii brand through national andinternational exposure. The Authorityintends to focus first on a year-roundseries of signature events that willbecome an integral part of the overallmarketing plan for the state. These willinclude significant and prestigious eventsin professional and college football,college basketball, professional golf,triathlon and marathon, and oceansports. The national and internationaltelevision and other media coverageassociated with such events can show-case Hawaii as the premiere locationfor recreation and sports activity.
The HTA also plans to support visitorattraction and cultural events, which willprovide incremental visitor expendituresto the state, particularly during times ofthe year when visitor counts are season-ally low. These include, among others,the Honolulu Festival and French Festi-val, and major island events like theMaui Writers Conference, A Taste ofLahaina, Kapalua Wine & Food Sympo-sium, Savor the Flavors of Kauai and theHawaiian Paniolo Music Festival. Theyalso include cultural events such as theAloha Festivals, Merrie Monarch andKing Kamehameha celebrations, whichprovide unique insight into Hawaii’s hostculture. Additionally, there is a wide-spread desire to increase the number of,and attention to, other special eventsand festivals.
D: Product DevelopmentThe HTA proposes to serve as a cata-
lyst for product and community-basedtourism development. The Authorityplans to focus on the development ofnew tourism events and experiences, andalso develop community-based tourismprograms. The HTA will particularly seekto develop programs in specialty or nichemarkets related to agriculture, culture,education, health and wellness, nature,sports, and science and technology, tocomplement Hawaii’s traditional leisureproduct offerings. There are existing
Tourism Initiatives and Issues continued from page 9

11Hawaii’s Economy /July 1999
attractions in each niche area whichhave developed more or less on theirown. However, the HTA plans to channelresources into creating a firm base for thegrowth of these and additional products.(A detailed description of the targetedniche markets can be found on pages 15to 17.)
The HTA also plans to work withisland advisory groups to establishmarkets for each product area. Thestrategy includes building on synergiesbetween tourism products well as provid-ing for a coordinated, easily accessibleinformation base.
E : A i r l i f tAs the article on Air Service (p. 21)
discusses, in marketing a leisure visitordestination the availability of affordable,convenient and comfortable transporta-tion to and from the destination is animportant competitive factor. Not eventhe most effective marketing programcan succeed if the air capacity to thedestination is insufficient.
Decisions to fly routes with particularfrequency and equipment depend oncomplex factors, including marketingcosts, distribution networks, airport is-sues, route and hub strategies, interna-tional agreements, and yields. Hawaii’sdependence on air transportation make itcritical that tourism planners and policymakers understand airline economics andthe carrier’s decision-making processwith respect to service levels. The HTAplans to address this issue through directcommunication with airline companiesand by efforts to increase awareness ofair transportation issues among theindustry and public.
The HTA will also advocate changesin airport operations and policies to makeit more cost–effective for airline compa-nies to operate and expand service in theHawaii market. The HTA will supportefforts to initiate new direct and/or non-stop service from cities not adequatelyconnected to Hawaii. The HTA will bal-ance efforts to improve direct overseasservice into Neighbor Island airports withthe impact it may have on the viability ofHawaii’s critical inter-island air system.
F : Infrastructure and Support ServicesThe quality of the infrastructure can
be a major factor in the success or failure
of tourism product development andmarketing. Consequently, the Authorityintends to become a strong advocate forinvestments in infrastructure and supportservices to strengthen tourism andenhance residents’ quality of life. Ofparticular interest is the revitalization ofWaikiki and other key visitor destinationareas of the state. HTA’s assessment ofthe infrastructure and support servicesfor tourism has highlighted several areasof concern that the Authority intendsto address.
Sa fe tyThe HTA is concerned about enhanc-
ing Hawaii’s reputation as a relativelysafe destination. Providing a safe, secureenvironment for visitors and residents isimportant in any economy, but it is criti-cal for a resort destination. An actual oreven perceived increase in crimes againstvisitors can cripple a destination longafter the problem is mitigated. TheAuthority intends to proactively workwith industry and government to findways to maintain and improve that levelof safety and to ensure that safety inHawaii remains a positive factor in thevacation decision of visitors.
Waikiki RevitalizationWaikiki is the premier symbol and
usually the initial gateway for visitors tothe islands. Hawaii’s reputation as aresort destination is unavoidably linkedto the reputation of Waikiki. TheAuthority views the revitalization and“re-enchantment” of Waikiki as para-mount to the health of Hawaii’s visitorindustry, now and into the future. TheHTA intends to be proactive in advocat-ing tax and zoning initiatives to stimu-late capital investment in Waikiki toreconfigure and restore its lost attributes.
Hawaii’s AirportsThe HTA concludes that the arrival
experience of visitors and residents at theHonolulu International Airport and atother state airports is in need of improve-ment, particularly with the creation of a“Hawaiian sense of place” at thesefacilities. The Authority intends toactively promote improvements in archi-tecture, landscaping, art and airportsignage, to create “a Hawaiian experi-ence” for arriving passengers. The HTAwill also advocate infrastructure improve-ments at Neighbor Island airports. These
measures will help ensure that arriving,departing and traveling inter–island inHawaii enhances, rather than detracts,from the visitor experience and contrib-utes to the state’s competitive edge inthe world market.
Maintenance of Public FacilitiesHawaii’s parks, beaches, and other
facilities are key visitor and residentresources. However, the HTA has con-cluded that they are inadequately funded,developed, and maintained. The Author-ity intends to aggressively seek federalfunds for preservation of specific naturalattraction sites as well as for highwaybeautification and trail systems and otherinitiatives. The HTA believes this fundingcould help resolve some of the debateover funding for tourism development“vs.” preservation of natural resources.
Cruise Ship FacilitiesThe Authority has determined that
Hawaii’s cruise facilities are unattractiveand inadequate for the current andprojected needs of the industry. The HTAwill advocate multiple island ports andthe development of Neighbor Islandcruise facilities. The Authority alsointends to explore federal fundingopportunities for harbors and facilities toenhance and expand Hawaii’s marketshare in this burgeoning market.
G: Regulations and InvestmentI n c e n t i v e sThe HTA has found that tourism
policy and planning has been marked bytension both within government andamong government, private sector andcommunity stakeholders. The HTA willattempt to act as a catalyst for ongoingeducation and consensus building inrelationships for the development oftraditional and new tourism products.The Authority has expressed its commit-ment to the meaningful participation oflocal communities in planning new typesof tourism products.
The Authority also expressed concernthat the existing State land use systempresents fundamental obstacles to thedevelopment of non-traditional, low–impact forms of tourism. Existing landuse laws, in the Authority’s view, favoragriculture conservation over other useson lands controlled by the State. Thoselaws have not been substantially
continued on page 12

12 Hawaii’s Economy /July 1999
changed since their initial adoption,despite a fundamental shift in Hawaii’seconomy from agriculture to tourism.Moreover, the HTA found that Countyland use laws and approval processes arevery inflexible and make it difficult topermit, much less encourage, new formsof visitor accommodations andattractions.
The HTA has expressed its intentionto exercise a leadership role in securingchanges in planning, coordination oflaws and permitting procedures, in orderto support sustainable land uses relatedto tourism. The Authority argues thatrestructuring of these regulations wouldstimulate substantial capital investmentand permit the opening of private landfor diverse forms of eco–, edu–, and agri–tourism. The HTA believes this can beaccomplished while sustaining Hawaii’snatural and cultural resources, andcommunity values.
Finally, the Authority recognizes thestrong link between the goals of diversi-fying both tourism and the economy.The HTA will seek to link tourism witheconomic diversification by using tourismadvertising as a means to promoteHawaii products and to attract investorsin technology and other diversifiedeconomic activity.
ConclusionsSince the last report in Hawaii’s
Economy on revitalizing tourism, therehas been measurable progress towardsthe goal of revitalizing this critical indus-try. Most of the overall issues raised inthat report are being addressed.
In particular, the progress in restruc-turing tourism marketing and promotionsupport has resulted in a single agency,the Hawaii Tourism Authority, respon-sible for the development and marketing
of tourism. In addition the agency willhave roughly twice the annual fundingresources that were available in the past.With input from a broad spectrum ofcommunity interests, the HTA has estab-lished seven priority initiatives it willpursue, in order to discharge its responsi-bility to revitalize Hawaii’s rourismindustry. The Authority intends topursue these initiatives in cooperationwith the community, the industryand government.
The Hawaii Tourism AuthorityEstablished: By Act 156 State of Hawaii Legislature, 1998.Membership: Thirteen members appointed by GovernorMission Statement: To manage the strategic growth of Hawaii’s visitor
industry in a manner consistent with the economicgoals, cultural values, and community interests ofthe people of Hawaii.
Goa l s : Achieve managed growth of Hawaii’s tourism industry by focusingon increasing visitor expenditures. Average an annual growth rateof 4.6 percent in visitor expenditures through 2005.
Funding Source: Dedicated Tourism Funding: 2.75 percentage points of theTAT was dedicated to create an annual tourism fund ofapproximately $50 to $60 million.
Tourism Initiatives and Issues continued from page 11
The EmergingCruise Ship
Market
dedicated to recreation rather thantransportation. These new ships weredesigned to be floating resorts withswimming pools, gyms, restaurants, andin most cases, full-service casinos. Atypical cruise lasts a week or more andincludes one- or two-day stops at variousnon-U.S. Caribbean and Gulf ports.
Today the North American cruisemarket represents 90 percent of the
worldwide market. Caribbean cruises stillrepresent a sizable (46 percent) share ofthat market, but European cruises nowclaim a 20 percent share. Alaska hascarved out an 8 percent share of themarket. Mexico has about 5 percent,while Hawaii attracts about 2 percent ofthe North American market.
In an effort to improve efficiency in acompetitive market, ship owners arecommissioning increasingly largervessels — up to 3,100 passengers.These mega-ships can be built for anaverage cost of $160,000 per passengercompared with an average cost of$245,000 per passenger for ships de-signed to carry fewer than 1,500 people.Of course improved profitability from thenew larger ships depends on runningthese ships as close as possible to their3,000-plus passenger capacity.
The cruise ship industry has be-come a major force in the NorthAmerican vacation market. The
Cruise Lines International Associationestimates that just over 5 million Ameri-cans and Canadians took overnight orlonger cruises in 1997, up nearly9 percent from the year before.
Reinvention of theCruise Industry
In the early 1970s, the cruisebusiness began to reinvent itself in theCaribbean as a vacation format ratherthan as primarily a form of transporta-tion. As the market grew, cruise shipcompanies like the Carnival and HollandAmerica lines began upgrading theirfleets from the classic 600- to 800-passenger ship designs of the 1950s, tohuge 1,500- to 2,000-passenger ships

13Hawaii’s Economy /July 1999
American Hawaii CruisesThroughout the 1970s and 1980s,
Hawaii received periodic cruise ship visitsfrom overseas. While a strong tour boatindustry had developed for day orevening excursions, the availability ofovernight cruising was virtually non-existent. However, in 1985 AmericanHawaii Cruises (AHC) began operatingtwo 800-passenger cruise ships in Ha-waiian waters, the S.S. Constitution andthe S.S. Independence. In 1997, AHCtook the Constitution out of service dueto the high cost of refurbishing the ship.In 1988 a competing ship, the S.S.Monterey, entered the interisland market.But financial problems forced the with-drawal from service of the Monterey onlya year later. Since then, AHC has com-missioned construction of two new U.S.-built cruise ships of 2,000 passengerseach. The first is scheduled to enterservice in 2003 with the second shipentering service the next year. In themeantime, special federal legislation willpermit AHC to acquire a re-flagged,2,000-passenger foreign cruise ship forservice beginning in January 2000 tosupplement the Independence. The twoolder vessels would then be phased outof service. This same legislation will giveAHC exclusive rights to the Hawaii inter-island cruise market for at least 25 years.
AHC offers a seven-day cruise withstops at all major islands, starting atabout $1,230 per person. Variations in-clude “theme” cruises, which offer eitherbig band, whale watching, or HawaiianHeritage as the entertainment and activ-ity focus. These cruises do not permitgaming. AHC registered about 46,000passengers in 1998 but expects over140,000 for the year 2000 with theadditional ship. The passenger count isexpected to level off at about 190,000per year under the two-ship operation.
Hawaii andForeign Cruise Ships
Passengers on foreign cruise ships toHawaii jumped from about 28,000 in1997 to 42,000 in 1998. Under the U.S.Passenger Services Act (PSA) of 1886and the Jones Act, only U.S.-built and-operated ships may embark and debark
The Emerging Cruise Ship Market continued from page 12
passengers between U.S. ports. Foreignpassenger ships can stop at any numberof U.S. ports but passengers mustre-board the ship before it leaves port.This has required some rather creativelogistics to enable foreign ships to cruiseHawaii economically.
Passengers on foreign cruise shipswill either fly to Hawaii first, or fly homefrom Hawaii after their cruise. A typicalcruise scenario is a two-phase operationfrom the ship’s point of view. In the firstphase, U.S. and other passengers areembarked from either Ensenada, Mexicoor Vancouver, British Columbia. The ves-sel then spends about four days at seaand stops at Hawaii ports for the remain-ing four to five days of the ten-day tour,ending the cruise in Honolulu. Passen-gers then debark to either fly home orspend additional time in Hawaii. In phaseII, a new group of passengers whoarrived in Hawaii by air are embarked,tour the island ports, and finally spendfour days at sea, to be debarked inVancouver or Ensenada.
Building Cruise ShipInfrastructure
Consultants for the State HarborsDivision (the firm of Leo A. Daly) antici-pate that passengers on foreign cruiseships visiting Hawaii could reach100,000 by 2004, 200,000 by 2013,and as many as 340,000 by 2020.Coupled with American Hawaii Cruisesexpectations, Hawaii could be hostingnearly 400,000 cruise passengers in2005, before AHC’s Independence andtemporary foreign ship are decommis-sioned. The level might drop to about300,000 in 2006 but build slowly backup to over 500,000 by 2020.
To accommodate this potentialgrowth, the consultant report recom-mends about $54 million in a phase Iimprovement program for seven majorports in Hawaii from now through 2004,and an additional $43 in improvementsduring a phase II program from 2004 to2020. Phase I improvements would in-clude new terminal facilities at HonoluluHarbor’s Pier 2 and renovations andretrofits to Neighbor Island ports. Phase IIwould make major improvements to the
ports of Hilo, Hawaii, Kahului, Maui,Port Allen, Kauai, and Piers 19/20in Honolulu.
The report stressed that the improve-ments do not reflect an “if we build it,they will come” strategy, but are rather avery selective set of investment optionsdesigned to make the most productiveand resource–conserving improvementsto stay competitive in this market. Never-theless, the report expects that eitheradditional sources of revenues will beneeded to fund the improvements, orarrangements made for development offacilities by a t hird party.
Potential Impacts of theCruise Market
Should Hawaii aggressively court thismarket? One concern commonly raisedabout the increase in cruise activity is itspotential competition with land-basedresorts and hotels. The fear is that cruisesmay be diverting vacationers away fromhotels and local restaurants. On the otherhand, the cruise may be attracting visi-tors who were specifically looking for acruise opportunity and would have other-wise chosen a cruise to somewhere elserather than a land-based Hawaii vaca-tion. It is also argued that cruises couldprovide new visitors with a taste of whatHawaii has to offer and encourage repeatvisits to Hawaii’s land–based resortslater on.
Even though they do not stay inhotels, cruise passengers do add to theeconomy through their direct purchasesin the ports they visit and indirectlythrough the business spending by cruiseship operators. As the analysis on page___ shows, cruise ship activity in 1998supported an estimated 2,500 jobs in thestate and generated $73 million inhousehold income and more than $12million in revenues to the public sector.At a level of 400,000 cruise visitors inthe year 2005, as suggested by theHarbor’s consultant study, the numberof jobs generated could exceed 10,000,accompanied by over $300 million inhousehold income and $60 million inpublic revenues.
Another benefit of cruise ships is theircontinued on page 14
14 Hawaii’s Economy /July 1999
positive economic impact on the portsthat they visit. More cruise ship visitscould be a revitalizing agent for the com-munities of Hilo, Hawaii, Kahului, Mauiand Port Allen-Hanapepe on Kauai,which are outside of land-based resortareas. For the merchants of downtownHonolulu, a larger volume of frequentcruise ship passengers could create a newmarket for business during the eveningsand weekends. It could also provide abase for new visitor attractions. Finally, alarge number of visiting and home-portedcruise ships in Hawaii suggests an oppor-tunity to regenerate Hawaii’s ship repair
and maintenance industry, which hasbeen contracting for several decades.
Thus, it would appear that the cruisemarket could represent a very valuablenew visitor segment for the economy asa whole, although there is the possibilityof some diversion of visitors from land-based resorts. Cruises could introducenew visitors to Hawaii’s beauty andattractions. They may also offer theadded benefit of directing economicstimulus to geographical areas,businesses, and industry that have beenbypassed by the development of tourismover the past several decades.
Taking advantage of the cruise shipopportunity will mean making a commit-ment to improving the quality of portfacilities. It will also mean workingclosely with the cruise ship industry todevelop marketing strategy, new attrac-tions and special events. Such coordina-tion and planning could help ensure thatcruises are a profitable investment forHawaii and the industry, and a memo-rable experience for cruise passengersthat will motivate them to return to theislands and recommend Hawaii tofriends.
The U.S. Passenger Services ActIntroduct ion
The United States is one of many nationsthat protects its domestic transportationindustries through cabotage laws. Theselaws reserve to U.S.-flagged vessels the rightto transport cargo and passengers betweenU.S. ports. (Cabotage laws also apply toforms of transportation other than watercarriers such as airlines, but this articlefocuses exclusively on water carriers.)Cabotage has a long history in the UnitedStates. The current cabotage statute fortransportation of cargo is the MerchantMarine Act of 1920 and its amendmentspopularly known as the Jones Act. Thestatute covering cabotage as it applies topassengers is known as the PassengerServices Act and became law in 1886.1
Proponents of cabotage laws make twomain arguments. First, cabotage laws protectnational defense interests by preserving bothan active merchant marine and a domesticshipbuilding industry. In the past, bothindustries proved vital to the efficient pros-ecution of national defense interests duringtimes of war. Second, cabotage laws protectnational economic interests in the form ofAmerican jobs and businesses from low-wage, subsidized, unsafe and/or environ-mentally reckless foreign competitors.
Those advocating reform of the cabotagelaws take issue with these points. Someargue that much of the defense justificationno longer applies because technological
change has made ocean shipping a non-viable method for achieving many nationaldefense goals. Further, defense needs requirespecially-built craft rather than modifiedcommercial vessels. No U.S.-flagged, ocean-going passenger vessels have been built inthe United States since 1951, and thereexists only one U.S.-flagged passengervessel currently in operation (the S.S. Inde-pendence operating in Hawaii). Others arguethat maritime wages are increasingly set inan international marketplace and thatforeign government subsidies of foreignvessels accrue to the benefit of consumers.Finally, opponents argue that there are other,more efficient and direct methods than cabo-tage of enforcing safety and environmentallaws in the United States.
The Passenger Services ActThe PSA became law in 1886 and has
been a part of U.S. cabotage law since. Thefull text of the statute as it now applies inthe U.S. reads as follows:
No foreign vessel shall transpor tpassengers between ports or placesin the United States, either directly or byway of a foreign por t, under apenalty of $200 for each passengerso transported and landed.
Over time, a number of exceptions havebeen made to this requirement. Canadianvessels may transport passengers between
Rochester and Alexandria Bay, New Yorkand between southern Alaska and U.S. portsuntil an American carrier enters the markets.Similarly, foreign vessels may transport pas-sengers between Puerto Rico and the U.S.mainland as long as a U.S. carrier does notprovide such service.2 Foreign-flagged cruiseships may carry passengers from a U.S. portas long as they return them to the same port(a “cruise to nowhere”). Foreign vesselsmay also call at intermediate U.S. ports aslong as no passenger permanently leaves thevessel at those ports and the vessel makes atleast one call at a foreign port.
The PSA operates in conjunction with theJones Act and other shipping laws to definevessels authorized to carry passengers in thecoastwise trades. Under the Jones Act, U.S.-flag vessels must be built in the UnitedStates, owned by U.S. citizens, and docu-mented under the laws of the United States.Documentation means “registered, enrolled,or licensed under the laws of the UnitedStates.” In addition, all officers and 75% ofthe crew must be U.S. citizens. Vessels thatsatisfy these requirements comprise the“Jones Act fleet.”
1 The Passenger Services Act has also been referred to as thePassenger Vessel Act and the Passenger Ship Act.
2 These exceptions are discussed in C. Todd Jones (1995),“The Practical Effects on Labor of Repealing American Cabo-tage Laws,” 22 Transportation Law Journal 403, 412-413.
The Emerging Cruise Ship Market continued from page 13
15Hawaii’s Economy /July 1999
Economic ImplicationsThere are two important economic impli-
cations of the PSA as it applies to Hawaii.First the PSA prevents foreign cruise shipsfrom transporting passengers betweenAlaska or the U.S. West Coast and Hawaii.Second, the law prevents foreign cruisevessels from picking up and transportingpassengers for cruises among the HawaiianIslands. As a consequence, there currently isno cruise ship offering service from Alaskaor the West Coast to Hawaii, and there isonly one cruise ship line that operatesamong the Hawaiian Islands.
Currently the Jones Act fleet containsonly one ocean-going passenger vessel, andit operates exclusively in Hawaii. Untilrecently Great Hawaiian Cruise Line Inc.,doing business as American Hawaii Cruises,operated the S.S. Constitution and the S.S.Independence offering cruises among theHawaiian Islands. Both ships were built in1951 and are relatively small by today’sstandards for cruise vessels (the Indepen-
dence has 747 berths and the Constitutionhad 779 berths, compared with morerecently-built ships with 1,800 to 2,000berths each). In 1996, American HawaiiCruises announced that the Constitutionwould not return to service because ofexcessive cost of repairs.
While the PSA prevents foreign cruiseships from carrying passengers directly fromAlaska and the West Coast to Hawaii andfrom competing with American HawaiiCruises for interisland cruise traffic, foreignvessels do visit Hawaii. Between 20 and 25foreign cruise ships visit Hawaii in a givenyear. American passengers on foreign cruiseships to Hawaii must board in anothercountry—typically, Vancouver, Canada orEncinada, Mexico. These ships cannot pickup a passenger in one U.S. port and drop offthe passenger in another U.S. port. However,after arriving from Canada or Mexico, theymay tour the islands and drop off passengersin Hawaii. They may then pick up newpassengers, tour the islands, and return to
The U.S. Passenger Services Act continued from page 14
Canada or Mexico. As a consequence, theseforeign cruise ships made approximately 230calls in Hawaii portsduring 1998.
Recent LegislationIn October 1997, federal legislation was
passed that permits a person to operate aforeign-built cruise ship in the U.S. coast-wise trade provided that the person hasentered a binding contract for the delivery oftwo U.S.-built cruise ships. The first shipmust be delivered no later than January 1,2005, and the second ship must be deliveredno later than January 1, 2008. Moreover, inHawaii, only the existing cruise ship opera-tor may operate a foreign-built ship amongthe islands unless a new U.S.-built cruiseship is placed into regular service outside ofHawaii. This legislation makes it possible totemporarily employ a foreign-built vesselamong the Hawaiian Islands despite thePassenger Services Act while new U.S.-builtcruise ships are constructed.
Developingthe NicheMarkets
cultural trip or both. Finally, almost 62million Americans reported taking anaverage of 2.5 “romantic” trips in themost recent year. Foreign travelers are alsogravitating towards more specialized andinvolved vacation experiences. 1
Niche MarketsThe emerging demand for such specialty
vacations is referred to as the tourism“niche” markets in the HTA’s TourismStrategic Plan. The Authority has identifiedseven niche markets upon which it willfocus its product development efforts. Theplan offers a number of “strategic directions”for each niche market.
Agri–TourismThe HTA plan notes that Hawaii has a
rich tradition of agricultural activities, manyof which are unusual in the U.S. and whichmany visitors may find very interesting.Hawaii has its share of traditional ranchingand crop raising. But our varied climate andresources enable the state to also produce ahost of unusual products such as pineapple,coffee, macadamia nuts, taro, and varietiesof fish in fishpond environments.
Of course, pineapple has been an attrac-tion for visitors for many years, particularlythe Dole Visitor Center in Central Oahu.Visitor sites also exist for ranching andcoffee growing on the Big Island. The vastinventory of agricultural activity around theislands could attract a wider niche market,
Warm sunny weather and picture–postcard white sand beaches arenot unique to Hawaii. Competi-
tion has increased significantly from newresorts in Mexico, Guam, Okinawa, theCaribbean, and Australia that possess andmarket similar assets. An important strategyfor reinvigorating Hawaii tourism is to carveout new markets based on unique assets ofthe islands, which would permit the state todevelop and maintain a stronger competitiveadvantage.
Increasing Sophisticationof Travelers
Fortunately for Hawaii, Americans andforeign travelers are becoming very sophisti-cated. They are not only looking for differentexperiences, but are also looking for moremeaningful experiences. A recent survey forthe U.S. Travel Data Center shows that verylarge numbers of Americans are seeking outmore active and interesting vacation experi-ences. For instance, in the past five years,98 million Americans have taken an adven-ture vacation ranging from camping towhite-water rafting. Nearly 66 millionAmericans have taken either a historical or
1 This article draws heavily on material from both the HTATourism Strategic Plan and a report prepared in November1998 for DBEDT by the UH School of Travel IndustryManagement (TIMS) entitled, Repositioning Hawaii’s VisitorIndustry Products. Data in this article attributed to the U.S.Travel Data Center, the Travel Industry Association and theWorld Tourism Organization are reported in the TIMS report.Both the HTA and TIMS reports are available from the HTAInternet web site at _ http://www.hawaii.gov/tourism/index.html.
continued on next page
16 Hawaii’s Economy /July 1999
2 TIMS report, p. 19.
Developing the Niche Markets continued from page 15
particularly if agricultural assets are“bundled” with elements of other nicheactivities such as health, adventure, cuisine,cultural, eco– and edu–tourism.
Cultural TourismCultural tourism, including historical
sites, is another growing market. Accordingto the TIA survey, 37 percent of U.S.travelers cite cultural activity as the primaryreason for a trip, while 19 percent basedtheir trip on a desire to see historical activity.In this survey, Hawaii ranked second in thenation, next to Washington D.C., for visitorspartaking in cultural and historical activity.Nationally, cultural and historical travelersspend 45 percent more on their trips than theaverage U.S. traveler.
Cultural tourism has the potential tobroaden the visitor’s perception of Hawaiibeyond its physical beauty and commercialimage. As in the case of the cruise market(see page 12), cultural and historical tourismcould help the economies of smaller, non-resort communities around the state, if theycan develop such attractions and activity.The high-profile resources in this nicheinclude such institutions as the BishopMuseum, the Polynesian Cultural Center, andthe Aloha and Merrie Monarch Festivals, allof which focus on host culture education.But there is a broad array of physical andevent resources beyond the host culturefocus which could form the basis of abroader effort to increase Hawaii’s appeal inthe general market and attract particular visi-tor niche markets. These include many addi-tional museums, performing arts programs,cultural programs and special events like theCherry Blossom Festival and the HawaiiInternational Film Festival. Coordinatingactivities and common marketing approachesappears to be the key to realizing thepotential of this area.
Edu–TourismEducation tourism is a niche in which
Hawaii has many advantages. Apart fromthe thousands of out-of-state students whoare in Hawaii for formal education, there is agrowing segment of the education sector thatfocuses on short-term learning and trainingopportunities. These include cross-culturaltraining/executive management programs,English as a second language (ESL)programs, contract training, and life-longlearning opportunities. Hawaii’s mid-
Pacific location again lends itself to short-term educational activities that help East andWest learn about one another in a tolerantsetting that is conducive to cultural aware-ness and understanding. More informationon the development of educational tourismand the export of educational services iscontained in the November 1998 issue ofHawaii’s Economy.
Health and Wellness TourismHealth tourism is a relatively new sector
that is expected to become an importantniche market as the population in developedcountries ages. Health tourism is comprisedof two sub-markets – medical or health caretourism and fitness and wellness tourism.
Modern medicine and health scienceshave combined high technology, educationand research (three areas of the economythat Hawaii is seeking to develop) toproduce leading-edge treatments and healthcare regimens. Hawaii possesses some of themost sophisticated medical facilities in thenation and can compete in this area. Ourproximity in the mid-Pacific makes Hawaii’sfacilities a natural resource for Asia and thePacific Islands.
Although sports tourism is itself atargeted niche market, numerous sportsevents along with fitness and exerciseprograms originating in Hawaii also helppromote health tourism. Many hotels andresorts feature fitness, gyms and exerciseprograms for their guests. It has been sug-gested that hotels and medicine could linkup to provide a unique health tourism pack-age that could attract a growing market.
The development of medical/health caretourism has been slowed somewhat by theeconomic crisis in Asia, which has nega-tively affected the growth of incomes and,consequently, the demand for such servicesas foreign medical care. Nevertheless, thelong-term outlook for this activity remainspositive and the medical infrastructure toserve this market is evolving. State and pri-vate sector efforts were successful in facili-tating a joint venture between Queen’sMedical Center and the Mayo Clinic in 1998to market diagnostic laboratory services toclients in the Pacific Rim nations as well asin Hawaii. Telemedicine is also progressingas a potential adjunct to the medical-caretourism infrastructure
The significant potential of the fitnessand wellness tourism market is being
addressed by resort hotels. A number ofthese properties are marketing packagesoffering five- to seven-night “get-aways”featuring exercise, meditation, yoga, stressreduction, nutrition and holistic healing.Japan is a prime market for such activity,as a considerable boom in self-healing andhealth-related practices has emerged inthat country.
Eco–TourismEco–tourism (also referred to as nature
tourism) has become a distinct market seg-ment over the past decade. Worldwide, eco–tourism is estimated by the World TourismOrganization to have been increasing at anannual rate of more than 10 percent inrecent years. In Hawaii, it is estimated thatnature-based tourism expenditures exceeded$413 million in 1993, or about 5 percent ofall visitors spending.2 Activities under thisheading can range from botanical gardentours to rigorous camping and hiking tripsthrough Haleakala Crater on Maui.
There are concerns as well as opportuni-ties associated with eco–tourism. In someecologically sensitive areas, the added pres-ence of tourists may pose a threat to pro-tected resources. On the other hand, naturetourism can provide a valuable revenuestream to help fund more protection andmanagement for the resource.
To protect both the resource and theeco–tourist, it is important that operators beknowledgeable and responsible. The Statehas a pilot project to license operators utiliz-ing public trails for organized hiking tours.The program ensures that operators haveliability insurance and helps raise funds forthe State to upkeep and improve trails.
The establishment of the 120-memberHawaii Ecotourism Association in 1995 wasa step forward in developing a coordinated,public and private sector effort to developand market nature tourism. This has giventhe industry a means to work with govern-ment to develop activities, certify operators,and interface activities and marketing withrelated niches such as cultural, adventureand health tourism.
Sports TourismSports tourism, including related recre-
ational tourism, is increasing in popularity.Sports tourism includes both spectator and

17Hawaii’s Economy /July 1999
Strategic Directions for Developing Niche MarketsFrom the HTA Draft Strategic Tourism Plan, June 1999
Agr i–Tour i sm• Create menus of experiences to make
it easier for visitors to purchase agri–tourism experiences and products.
• Promote the value-added component ofagricultural products.
• Promote cuisine related to Hawaiianproducts.
• Advocate “Bed & Breakfasts” (B & B’s)and “Country Inns” on agriculture lands,farms, and ranches.
• “Bundle” agricultural experiences withhealth, adventure, culture, eco–tourism,and edu–tourism.
Cultural Tourism• Coordinate organizations presently
involved in cultural activities to marketHawaii as a rich, multi-cultural center.
• Create and support “signature” culturalevents and supplement with other productofferings.
• Provide resources for community-basedcultural initiatives and supplement withother products.
• Change paradigm to “grass roots”perspective.
• Coordinate what Hawaii wants to sell withwhat visitors want to buy.
Edu–Tour i sm• Integrate the tourism marketing objectives
with those of the academic and learningcommunities to achieve the overall goalsof the HTA, with a focus on statewidesynergy.
• Foster partnerships of the visitor andeducation communities benefiting bothvisitors and residents alike.
• Develop programs to attract out-of-statevisitors to Hawaii for educational purposes.
• Create packages and partnerships withairlines, travel agents, and wholesalers.
• Develop programs and activities toexpand product offerings in this area.
Health and Wellness Tourism• Integrate aspects of health tourism with
other tourism products such as sports,agriculture, ecology, culture andtechnology.
• Create programs that relate complemen-tary medical practices to traditionalwestern medical care.
• Facilitate and develop partnerships of thevisitor and health and wellness communi-ties to provide expanded product offeringsand visitor attractions.
• Establish programs based on telemedicineand dissemination of health care.
Eco–Tour i sm• Support activities which promote conser-
vation and sustainability of Hawaii’snatural resources through educationalprograms.
• Create programs that will leverage federalor private sector funds through matchingchallenge grants for the protection of theenvironment.
• Encourage synergy with the worldwideinterest in ecologically responsible andeconomically sustainable tourism.
• Advocate changes in constraining lawsthat will encourage capital investmentsin resources and private lands for eco-tourism product development, reducingpressure on public lands.
Sports Tourism• Build Hawaii’s image as a lifestyle
sports center.• Build complementary events around
“signature” events.• Market on a mass media as well as on a
person-to-person basis.• Advocate investment in venues and
training camps and create events tosupport their use.
participant activities and attractions. TheTravel Industry Association reports that morethan 75 million U.S. adults traveled 50 milesor more to sporting events over the past fiveyears. Hawaii is an established sports desti-nation in a number of areas including theHonolulu Marathon, the Ironman Triathlon,the NFL Pro Bowl, the Aloha and Hulacollege bowls, and a host of PGA eventsincluding the Sony Open. The publicity andmedia exposure surrounding such majorevents is of enormous value to generaltourism promotion and the increasingprestige of the events.
Recreational tourism overlaps with sportsenough that joint marketing is feasible. Golfis the leading recreational activity for visi-tors, although opportunities exist to attractniche markets for surfing, sports fishing,diving and tennis as well.
The HTA Tourism Strategic Plan stressesdevelopment of “life style” sports, which are
participant–oriented and can be pursued overa lifetime. Running, swimming, cycling andgolf are prime examples.
Techno TourismThe Tourism Strategic Plan notes that
Hawaii has developed an extensive infra-structure of high technology, which couldserve as the basis for a techno tourismniche market. The plan cites such technol-ogy resources as the observatories onMauna Kea, the ocean research facilities onthe North Kona coast (Hawaii County),Maui’s “supercomputer” and the PacificMissile Range Facility on Kauai.
These and other technology resourcescould be coupled with conferences andsymposiums to form the nucleus of thetechno–tourism niche, according to thestrategic plan. Techno–tourism could alsohelp enhance Hawaii’s business image,and encourage further development of the
technology sector, as well supplementingthe tourism product.
ConclusionHawaii cannot continue to rely solely on
beaches and beautiful scenery as the basisfor its tourism appeal. Vacationers’ tastesand needs are changing and maturing.Moreover, the competition for the sun–and–surf market has intensified considerably inrecent years. The identification and develop-ment of niche tourism markets based onHawaii’s unique set of assets can providethe product diversification Hawaii needs toattract first–time and repeat visitors alike.The HTA Tourism Strategic Plan has identi-fied seven key opportunity areas to buildniche markets. These niche areas may alsohelp improve the economic situation of busi-nesses and workers in industries and areasof the state whose benefit from tourism waspreviously limited.
continued on page 18

18 Hawaii’s Economy /July 1999
Is theConvention
Center Payingits Way?
The opening of the Hawaii Conven-tion Center (HCC) in 1998 madeHawaii a new player in an impor-
tant and fast-growing segment of the travelmarket. The market for conventions andbusiness travel is quite large and manyother destinations besides Hawaii haveinvested in facilities to capture a piece ofthis lucrative travel segment. A recent sur-vey of business travel concluded that nearly43 million Americans took at least onebusiness trip in 1996. On average, businesstravelers made more than 5 trips during theyear. Internationally, a 1997 survey indi-cated that the average world business trav-eler makes 21 trips per year, and spends37 nights away from home. Moreover,business travelers are increasingly includingtheir families on trips. The number ofbusiness trips with a child in the travelingparty increased from 7.4 million in 1987 to24 million in 1997.
Conventions and business meetings arealso very lucrative markets. For instance,the average spending by all westboundvisitors to Hawaii in early 1999 was esti-mated to be about $136 per day, includinglodging. By comparison westbound conven-tion delegates spend an estimated $360 perday per person, while corporate meetingattendees spent nearly $900 per day onaverage .
The Hawaii Convention CenterHawaii’s new convention center has
been praised for its design, amenities andstate of the art technology. Nevertheless,the level of activity at the HCC has beenbelow projections made before its construc-tion. Consultants initially projected 30
events in 1998 with the total rising gradu-ally to about 60 events per year by 2008.The center actually hosted 15 events in1998. Consequently, the Hawaii Visitorsand Convention Bureau has establishedtargets for the number of events over thenext six years averaging roughly two-thirdsthe levels projected before construction(See table 1).1 The reduced number ofevents has meant that operating income ofthe facility will likely be lower and the oper-ating deficit higher than earlier projected.
The lower number of events has causedsome to suggest that the HCC was a badidea and there has even been talk ofprivatizing the Center.
Does the inability to cover costs withits rental income mean that the HCC was amistake? What would it take for the HCC tocover its costs or even make a profit? Theanswers to these questions depend on hownarrow a perspective one wishes to take.If the center is viewed as an independentbusiness activity, the operation will likelynever be able to cover all its costs withconvention rental income.
However, from the wider perspective ofthe economy as a whole, the HCC may notonly be covering costs, but may already be
making a very positive contribution to theeconomy. These seemingly contradictoryconclusions result from a comparison of thecosts and benefits of the HCC from differentperspectives. An examination of these alter-native perspectives helps show why manypublic investments that may, at first glance,appear to be losing propositions, are infact making significant contributions toeconomic growth.
Convention Center as aStand-alone Activity
The most straightforward approach inassessing whether the convention center isworth the cost is to compare the directexpenditures on the Center (debt service,operating, and marketing costs) with thedirect receipts (payments from users of thefacility). This viewpoint treats the center asif it were an independent, stand-alone busi-ness. Table 1A shows that the Centerclearly loses money from this perspective.In fact, projections of anticipated receiptsand costs from this direct comparisonsuggest that the Center would neverbreak even.
The problem is that a convention centerby itself has nothing else to sell but the useof its meeting facilities. It has no hotelrooms to rent and no restaurants or enter-tainment facilities to generate additionalincome. The table suggests that in order tobreak even, the facility would need toroughly quadruple its charges to conventionorganizations.
Strategic Directions for Developing the Niche Markets continued from page 17
Techno–Tour i sm• Integrate tourism marketing objectives
with those of the science and technologycommunities to achieve the overall goalsof the HTA, with a focus on statewidesynergy.
• Establish partnerships with non-profit andcommunity organizations designed toleverage state funding with that of thefederal and private sectors.
• Foster partnerships to provide for visitorattractions of technology venues.
• Market existing and emerging visitorcenters.
• Integrate HTA objectives with thoseof the science and technology communi-ties to provide for trade shows, seminars,expositions, and visitor centers which willenhance Hawaii’s business image.
1 This does not necessarily mean that the earlier consultantprojections are unattainable. Rather it represents a set ofmore conservative planning targets, based on the actualnumber of events to date.
• Establish marketing and businessattraction programs that will increasetax revenues to Hawaii by attractingincremental and diversified businesses,thus stimulating job creation as well asan increase in visitor expenditures.

19Hawaii’s Economy /July 1999
Of course raising fees significantly couldmake the center uncompetitive and actuallyresult in little or no income if conventionbusiness decides to go elsewhere.
The results from this stand-aloneperspective help explain the general lack ofinterest by a private firm to build and oper-ate a convention center without alternativerevenue sources such as an adjoining hotelcomplex with restaurant and entertainmentfacilities. It also highlights the difficulty ofprivatizing such an operation.
Convention Center as aPublic Investment
A second approach assesses the HCCfrom a broader perspective. This views theconvention center as a State enterprisewhich, like the first example, needs to payoperating and capital costs. But as a Stateoperation, the HCC not only receives feesfrom convention organizers and exhibitors,but also results in the collection of taxrevenues for the State from economicactivity generated by the Center.
The costs and benefits of the HCCfrom this perspective are shown in Table1B. The costs consist of Center operating,marketing and debt service expendituresplus some additional costs to State govern-ment such as road maintenance.1 The ben-efits from the Center include the same feeincome as before but also include the Gen-eral Excise and other taxes paid in Hawaiiby out-of-state visitors associated with theconvention or meeting held at the center.2
When viewed as a “State” facility, theHCC is still operating at a loss but the lossdeclines as the projected activity of the cen-ter picks up in later years. It even appearsthat the Center could break even if conven-tion center business continues to increase(line 15) or the average convention sizerises. Line 16 of Table 1b shows that thecenter would need about 70 events with anaverage 3,000 delegates per year to reachthe break–even point by 2004 from thisperspective. However, if the average con-vention size were to increase to 4,500delegates, the break–even point would bereached at about 40 events per year(the trade off between events and sizewill be discussed in a moment).
Convention Center as anEconomic Catalyst
Finally, we can also look at the cost andbenefit of the HCC from an economy-wide
perspective. This view compares all of thequantifiable costs of running the centerwith all of the quantifiable benefits, regard-less of who bears the costs or enjoys thebenefits. The costs include those alreadyidentified for the center and the State gov-ernment. On the benefit side, the Center feerevenue and State government tax revenuewould also be included. In addition, thebenefits from an economy-wide point ofview include all of the income generatedfrom the additional spending of visitors as-sociated with convention activity, visitorswho would not have come in the absenceof the facility.
Table 1C shows the results of theeconomy-wide analysis. From this perspec-
1 Number of Events (target goals)1 16 24 31 33 36 40
A: Direct Costs and Benefits (dollars in millions)))))
2 Costs 35.9 44.5 43.8 44.4 45.0 45.73 Debt Service * 2 3 . 5 2 7 . 7 2 6 . 4 2 6 . 4 2 6 . 4 2 6 . 44 Marketing Costs ** 4.1 4.3 4.5 4.7 5.0 5.25 Operating Costs 8 . 3 1 2 . 4 1 2 . 9 1 3 . 2 1 3 . 6 1 4 . 06 Benefits 3.6 7.8 8.7 9.2 9.6 10.17 Convention Fees 3 . 6 7 . 8 8 . 7 9 . 2 9 . 6 1 0 . 18 Net Benefits (Benefits minus Costs) -32.3 -36.7 -35.1 -35.2 -35.4 -35.6
B: State Perspective (dollars in millions)
9 Costs 38.0 47.6 47.9 48.7 49.7 50.91 0 Center Costs (Line 2) 3 5 . 9 4 4 . 5 4 3 . 8 4 4 . 4 4 5 . 0 4 5 . 71 1 Indirect (road repair, police, fire, etc.) 2 . 1 3 . 2 4 . 1 4 . 3 4 . 7 5 . 21 2 Benefits 12.6 21.5 26.7 28.7 31.4 34.81 3 Convention Fees (Line 7) 3 . 6 7 . 8 8 . 7 9 . 2 9 . 6 1 0 . 11 4 State Tax Revenue from Additional Visitors*** 9 . 0 1 3 . 7 1 8 . 0 1 9 . 6 2 1 . 8 2 4 . 71 5 Net Benefits (Benefits minus Costs) -25.4 -26.2 -21.1 -20.0 -18.3 -16.11 6 Number of Events Needed to Break Even*** 65 76 74 72 71 71
C: Economy-Wide Perspective (dollars in millions)
1 7 Costs 38.0 47.6 47.9 48.7 49.7 50.91 8 State Costs (Line 9) 3 8 . 0 4 7 . 6 4 7 . 9 4 8 . 7 4 9 . 7 5 0 . 91 9 Benefits 77.8 120.7 157.5 170.7 189.4 213.92 0 Convention Fees (Line 13) 3 . 6 7 . 8 8 . 7 9 . 2 9 . 6 1 0 . 12 1 Household Income from Additional Visitors*** 66 .5 101 .3 133 .5 144 .9 161 .2 182 .7
Additional Indirect Business Taxes 7 . 7 1 1 . 6 1 5 . 3 1 6 . 7 1 8 . 5 2 1 . 02 2 Net Benefits (Benefits minus Costs) 39.8 73.1 109.7 122.0 139.7 163.02 3 Number of Events Needed to Break Even*** 7 8 8 8 8 8
D: WTTC Convention Center Account2 (dollars in millions)
2 4 Costs 37.9 44.5 55.5 58.2 62.8 62.42 5 Operating Expenditures 1 0 . 3 1 2 . 4 1 2 . 9 1 3 . 2 1 3 . 6 1 4 . 02 6 Marketing costs 4 . 1 4 . 3 4 . 5 4 . 7 5 . 0 5 . 22 7 Debt Service 2 3 . 5 2 7 . 7 3 8 . 1 4 0 . 2 4 4 . 2 4 3 . 12 8 Benefits 37.3 48.8 52.5 55.9 59.5 63.32 9 Convention Fees 3 . 8 7 . 8 8 . 7 9 . 2 9 . 6 1 0 . 13 0 TAT Revenues 2 3 . 4 2 7 . 3 2 7 . 9 2 8 . 6 2 9 . 4 3 0 . 23 1 State Taxes (excluding dedicated TAT) 1 0 . 1 1 3 . 8 1 5 . 9 1 8 . 1 2 0 . 5 2 3 . 03 2 Net Benefits (Benefits minus Costs) -0.6 4.4 -3.0 -2.3 -3.3 1.0
NA: not available1 Source: Hawaii Visitors and Convention Bureau2 Source: World travel tourism council, WTTC Hawaii Tourism Repor t 1999. The WTTC assumption on the number of events wasnot published.*Based on refinancing schedule effective July 1, 2000, for a 25-year term at 6 percent interest rate.** Assumes a 5 percent annual increase.***Assumes an average 3,000 delegates per event.
Source: DBEDT except as noted.
Table 1. Cost–Benefit Estimates for Hawaii Convention Center
Fiscal year basis: July 1 to June 30
L ine I tems 1 9 9 8 - 9 9 1 9 9 9 - 0 0 2 0 0 0 - 0 1 2 0 0 1 - 0 2 2 0 0 2 - 0 3 2 0 0 3 - 0 4
1 Whether the capital costs should be included in the calcula-tion is an issue to some. The capital costs were funded froman increase in the Transient Accommodations Tax (TAT) ratein 1994 as well as a dedication of a portion of TAT receipts.Arguably, a portion of these funds would not have beenraised but for the need to fund the Hawaii Convention Center.Therefore some argue that from the State’s perspective, theydo not constitute a cost. The effect of this view is a muchsmaller annual cost for operating the center. This is how theWTTC has effectively treated capital costs in its analysis.However to avoid complicating this particular presentation,the issue is left aside and the full capital costs are included.
2 This assumes that all of the convention visitors andcompanions would not have otherwise come to Hawaii(on this trip) had their meeting not been held at HCC.
continued on next page
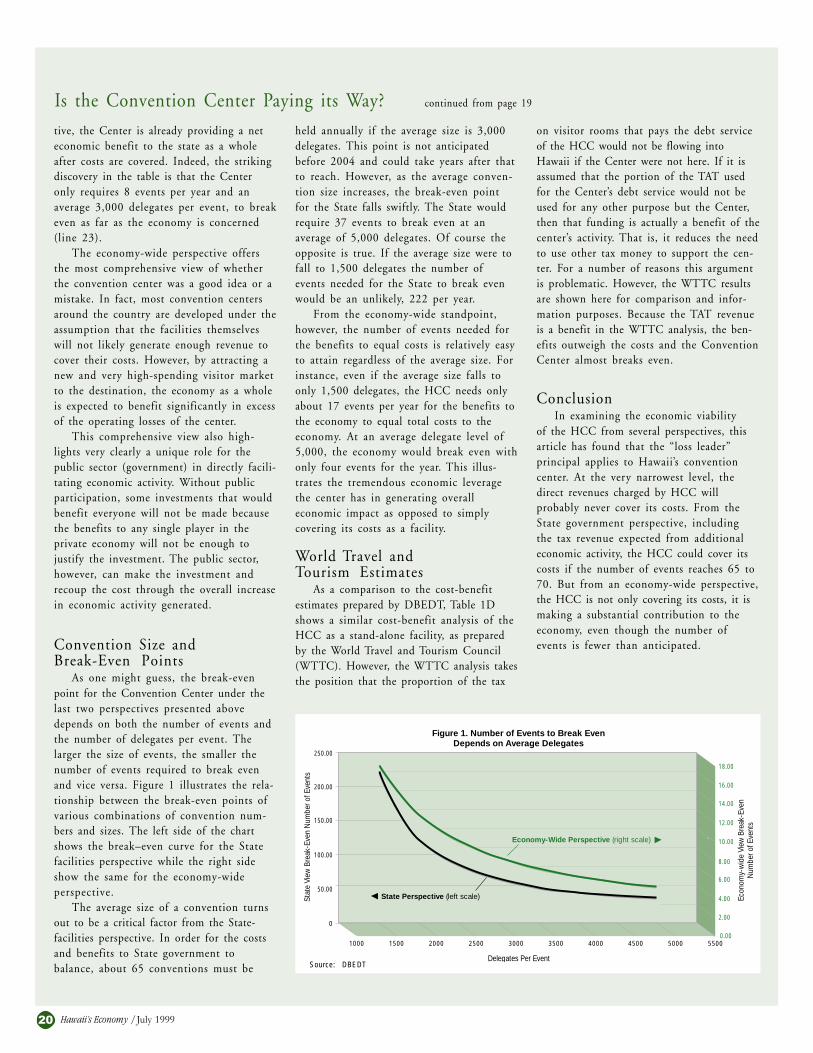
20 Hawaii’s Economy /July 1999
Is the Convention Center Paying its Way? continued from page 19
tive, the Center is already providing a neteconomic benefit to the state as a wholeafter costs are covered. Indeed, the strikingdiscovery in the table is that the Centeronly requires 8 events per year and anaverage 3,000 delegates per event, to breakeven as far as the economy is concerned(line 23).
The economy-wide perspective offersthe most comprehensive view of whetherthe convention center was a good idea or amistake. In fact, most convention centersaround the country are developed under theassumption that the facilities themselveswill not likely generate enough revenue tocover their costs. However, by attracting anew and very high-spending visitor marketto the destination, the economy as a wholeis expected to benefit significantly in excessof the operating losses of the center.
This comprehensive view also high-lights very clearly a unique role for thepublic sector (government) in directly facili-tating economic activity. Without publicparticipation, some investments that wouldbenefit everyone will not be made becausethe benefits to any single player in theprivate economy will not be enough tojustify the investment. The public sector,however, can make the investment andrecoup the cost through the overall increasein economic activity generated.
Convention Size andBreak-Even Points
As one might guess, the break-evenpoint for the Convention Center under thelast two perspectives presented abovedepends on both the number of events andthe number of delegates per event. Thelarger the size of events, the smaller thenumber of events required to break evenand vice versa. Figure 1 illustrates the rela-tionship between the break-even points ofvarious combinations of convention num-bers and sizes. The left side of the chartshows the break–even curve for the Statefacilities perspective while the right sideshow the same for the economy-wideperspective.
The average size of a convention turnsout to be a critical factor from the State-facilities perspective. In order for the costsand benefits to State government tobalance, about 65 conventions must be
held annually if the average size is 3,000delegates. This point is not anticipatedbefore 2004 and could take years after thatto reach. However, as the average conven-tion size increases, the break-even pointfor the State falls swiftly. The State wouldrequire 37 events to break even at anaverage of 5,000 delegates. Of course theopposite is true. If the average size were tofall to 1,500 delegates the number ofevents needed for the State to break evenwould be an unlikely, 222 per year.
From the economy-wide standpoint,however, the number of events needed forthe benefits to equal costs is relatively easyto attain regardless of the average size. Forinstance, even if the average size falls toonly 1,500 delegates, the HCC needs onlyabout 17 events per year for the benefits tothe economy to equal total costs to theeconomy. At an average delegate level of5,000, the economy would break even withonly four events for the year. This illus-trates the tremendous economic leveragethe center has in generating overalleconomic impact as opposed to simplycovering its costs as a facility.
World Travel andTourism Estimates
As a comparison to the cost-benefitestimates prepared by DBEDT, Table 1Dshows a similar cost-benefit analysis of theHCC as a stand-alone facility, as preparedby the World Travel and Tourism Council(WTTC). However, the WTTC analysis takesthe position that the proportion of the tax
on visitor rooms that pays the debt serviceof the HCC would not be flowing intoHawaii if the Center were not here. If it isassumed that the portion of the TAT usedfor the Center’s debt service would not beused for any other purpose but the Center,then that funding is actually a benefit of thecenter’s activity. That is, it reduces the needto use other tax money to support the cen-ter. For a number of reasons this argumentis problematic. However, the WTTC resultsare shown here for comparison and infor-mation purposes. Because the TAT revenueis a benefit in the WTTC analysis, the ben-efits outweigh the costs and the ConventionCenter almost breaks even.
ConclusionIn examining the economic viability
of the HCC from several perspectives, thisarticle has found that the “loss leader”principal applies to Hawaii’s conventioncenter. At the very narrowest level, thedirect revenues charged by HCC willprobably never cover its costs. From theState government perspective, includingthe tax revenue expected from additionaleconomic activity, the HCC could cover itscosts if the number of events reaches 65 to70. But from an economy-wide perspective,the HCC is not only covering its costs, it ismaking a substantial contribution to theeconomy, even though the number ofevents is fewer than anticipated.
Source: DBEDT
Figure 1. Number of Events to Break EvenDepends on Average Delegates
Stat
e Vi
ew B
reak
-Eve
n N
umbe
r of E
vent
s
Econ
omy-
wid
e Vi
ew B
reak
-Eve
nN
umbe
r of E
vent
s250.00
200.00
150.00
100.00
50.00
0
1000 1500 2000 2500 3000 3500 4000 4500 5000 5500
18.00
12.00
10.00
8.00
6.00
2.00
0.00
Economy-Wide Perspective (right scale)
State Perspective (left scale)
Delegates Per Event
14.00
16.00
4.00
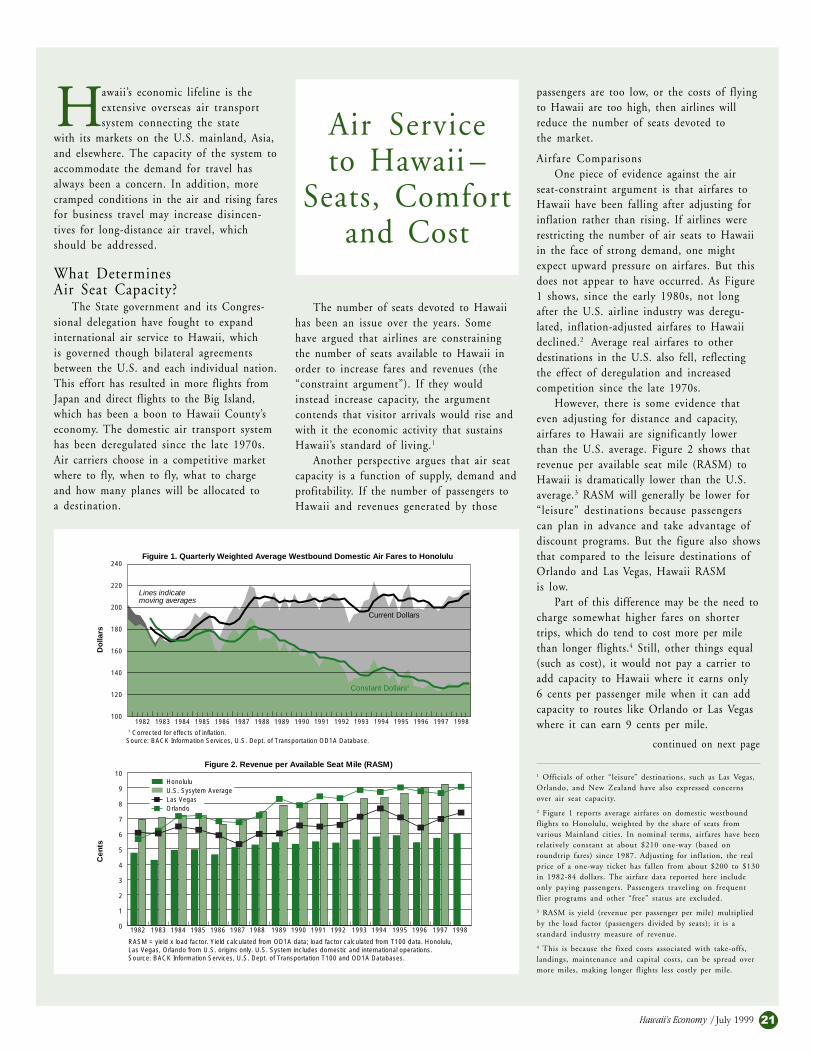
21Hawaii’s Economy /July 1999
Air Serviceto Hawaii –
Seats, Comfortand Cost
Hawaii’s economic lifeline is theextensive overseas air transportsystem connecting the state
with its markets on the U.S. mainland, Asia,and elsewhere. The capacity of the system toaccommodate the demand for travel hasalways been a concern. In addition, morecramped conditions in the air and rising faresfor business travel may increase disincen-tives for long-distance air travel, whichshould be addressed.
What DeterminesAir Seat Capacity?
The State government and its Congres-sional delegation have fought to expandinternational air service to Hawaii, whichis governed though bilateral agreementsbetween the U.S. and each individual nation.This effort has resulted in more flights fromJapan and direct flights to the Big Island,which has been a boon to Hawaii County’seconomy. The domestic air transport systemhas been deregulated since the late 1970s.Air carriers choose in a competitive marketwhere to fly, when to fly, what to chargeand how many planes will be allocated toa destination.
The number of seats devoted to Hawaiihas been an issue over the years. Somehave argued that airlines are constrainingthe number of seats available to Hawaii inorder to increase fares and revenues (the“constraint argument”). If they wouldinstead increase capacity, the argumentcontends that visitor arrivals would rise andwith it the economic activity that sustainsHawaii’s standard of living.1
Another perspective argues that air seatcapacity is a function of supply, demand andprofitability. If the number of passengers toHawaii and revenues generated by those
passengers are too low, or the costs of flyingto Hawaii are too high, then airlines willreduce the number of seats devoted tothe market.
Airfare ComparisonsOne piece of evidence against the air
seat-constraint argument is that airfares toHawaii have been falling after adjusting forinflation rather than rising. If airlines wererestricting the number of air seats to Hawaiiin the face of strong demand, one mightexpect upward pressure on airfares. But thisdoes not appear to have occurred. As Figure1 shows, since the early 1980s, not longafter the U.S. airline industry was deregu-lated, inflation-adjusted airfares to Hawaiideclined.2 Average real airfares to otherdestinations in the U.S. also fell, reflectingthe effect of deregulation and increasedcompetition since the late 1970s.
However, there is some evidence thateven adjusting for distance and capacity,airfares to Hawaii are significantly lowerthan the U.S. average. Figure 2 shows thatrevenue per available seat mile (RASM) toHawaii is dramatically lower than the U.S.average.3 RASM will generally be lower for“leisure” destinations because passengerscan plan in advance and take advantage ofdiscount programs. But the figure also showsthat compared to the leisure destinations ofOrlando and Las Vegas, Hawaii RASMis low.
Part of this difference may be the need tocharge somewhat higher fares on shortertrips, which do tend to cost more per milethan longer flights.4 Still, other things equal(such as cost), it would not pay a carrier toadd capacity to Hawaii where it earns only6 cents per passenger mile when it can addcapacity to routes like Orlando or Las Vegaswhere it can earn 9 cents per mile.
1 Officials of other “leisure” destinations, such as Las Vegas,Orlando, and New Zealand have also expressed concernsover air seat capacity.
2 Figure 1 reports average airfares on domestic westboundflights to Honolulu, weighted by the share of seats fromvarious Mainland cities. In nominal terms, airfares have beenrelatively constant at about $210 one-way (based onroundtrip fares) since 1987. Adjusting for inflation, the realprice of a one-way ticket has fallen from about $200 to $130in 1982-84 dollars. The airfare data reported here includeonly paying passengers. Passengers traveling on frequentflier programs and other “free” status are excluded.
3 RASM is yield (revenue per passenger per mile) multipliedby the load factor (passengers divided by seats); it is astandard industry measure of revenue.
4 This is because the fixed costs associated with take-offs,landings, maintenance and capital costs, can be spread overmore miles, making longer flights less costly per mile.
continued on next page
0
1
2
3
4
5
6
7
8
9
10
1982 1983 1984 1985 1986 1987 1988 1989 1990 1991 1992 1993 1994 1995 1996 1997 1998
Figure 2. Revenue per Available Seat Mile (RASM)
Figuire 1. Quarterly Weighted Average Westbound Domestic Air Fares to Honolulu
RASM = yield x load factor. Yield calculated from OD1A data; load factor calculated from T100 data. Honolulu, Las Vegas, Orlando from U.S. origins only. U.S. System includes domestic and international operations.Source: BACK Information Services, U.S. Dept. of Transportation T100 and OD1A Databases.
1 Corrected for effects of inflation.Source: BACK Information Services, U.S. Dept. of Transportation OD1A Database.
100
120
140
160
180
200
220
240
1982 1983 1984 1985 1986 1987 1988 1989 1990 1991 1992 1993 1994 1995 1996 1997 1998
Do
llars
Cen
ts
Current Dollars
Constant Dollars1
HonoluluU.S. Sysytem AverageLas VegasOrlando
Lines indicatemoving averages

22 Hawaii’s Economy /July 1999
Load FactorsData on load factors (the ratio of actual
passengers to available seats on a flight)provide another piece of evidence on the airseat capacity issue. If air seats were“constrained” in the face of stable or increas-ing demand, one would expect load factorsto rise to high levels. Indeed, the averageload factor range for Hawaii has increasedfrom about 70-75 percent during most of the1980s, to an 80-85 percent range since1995 (Figure 3).5 Average load factors inHawaii have also been significantly higherthan load factors elsewhere — about 14 per-centage points higher on domestic flights toHonolulu than on average domestic flightsbetween 1982 and 1997.
Some have interpreted this as evidence infavor of the constraint argument. However,while high or rising load are factors consis-tent with the constraint hypothesis, theymay also be consistent with the economicargument. With the real airfare level actuallyfalling for Hawaii in recent years as dis-cussed earlier, it may well be that airlineshave been flying fewer flights or smallerplanes in an attempt to boost efficiency atthe lower fare level.
Air SeatsWhile the number of air seats to Hawaii
is lower today than in the late 1980s, thenumber of seats has been rising since 1994(Figure 4). However, all of the increase hasoccurred on flights to the Neighbor Islands,principally Maui. Average load factors toMaui peaked in late 1993 and early 1994 atabout 90 percent. Since then, they havedrifted downward to about 85 percent. Inter-estingly, the number of seats flown to Mauiincreased at about the same time that theaverage load factor peaked. This suggeststhat once rising average load factors begin tostrain the available seat capacity, an increasein the number of air seats will likely follow.
This trend appears in the statewide fig-ures as well. Load factors reached 85 percentfor the state in early 1994, just about thesame time that the total number of air seatsbegan to rise. This suggests that, givendeclining real airfares, load factors appar-ently must remain high before the number ofair seats to Hawaii will begin to rise. Oncehigh load factors are achieved, the numberof air seats does, in fact, rise.
Figure 3. U.S. Mainland Load Factors to Hawaii
Figure 4. Seats All Domestic Westbound Flights to Hawaii
Data reflects only non-stop origins.Source: BACK Information Services, U.S. Dept. of Transportation T100 Database.
Source: BACK Information Services, U.S. Dept. of Transportation T100 Database.
250,000
300,000
350,000
400,000
450,000
500,000
550,000
50
55
60
65
70
75
80
85
90
95
1982 1983 1984 1985 1986 1987 1988 1989 1990 1991 1992 1993 1994 1995 1996 1997 1998
1982 1983 1984 1985 1986 1987 1988 1989 1990 1991 1992 1993 1994 1995 1996 1997 1998
Per
cent
Num
ber
of
Sea
ts
State
Honolulu
Lines indicatemoving averages
Line indicate moving averages
Air Service to Hawaii–Seats, Comfort and Cost continued from page 21
Long Flights —Addressing the Negatives
An increase in the number of seatsdoes not mean that Hawaii’s concern withoverseas air transportation is over. Shortervacations, families traveling with childrenand increasingly more senior traveler’s posea disincentive for long-distance travel onincreasingly crowded and less roomyaircraft. Within the constraints of reasonablecost, a warmer, more personable welcomeand smoother processing through theHonolulu Airport might help to mitigate theeffects of long, cramped flights. Ensuringthat the first and last experiences of visitorsto Hawaii are enjoyable would also help tomake visitors feel they are truly guests inHawaii and not simply tourists. More travel-ers might be willing to endure a 5–8 hourflight if they were confident that their arrivalat the destination will be appreciated andmade as comfortable as possible. Someresearch into how long-haul air travel andairport experience affects people and theirreceptiveness to a destination may helpboth the airlines and Hawaii mitigatesome inconveniences.
Rising Business Travel CostsAnother potential problem related to air
service is the recent increase in fares mostlyapplicable to business travel. While realairfares have declined on average, a biasappears to have developed in the structure offares, causing an increasing gap betweenrelatively low–cost leisure travel andbusiness travel. The American ExpressCompany has found that the averagebusiness traveler booking through thecompany’s travel service paid 39 percentmore than the average air passenger for aticket during the first quarter of 1999.Business travelers usually pay a premiumover leisure travelers because they do notbook flights very far in advance. But thelatest data indicate a widening gap, up froma 26 percent difference in the first quarter of1996. In fact the gap is now the widest ithas been since American Express begankeeping track of the data.
The impact of this increasing differenceon Hawaii is problematic. Conventions and
5 As the graph shows, on a month-to-month basis thevolatility in load factors is very high.

23Hawaii’s Economy /July 1999
corporate meetings are planned far enoughin advance that lower–priced, advancedtickets are readily feasible. However theincreasing spread in airfares affects the costof doing business in Hawaii for firms whoseemployees and officers must travelfrequently. Since the situation is apparentlya nationwide phenomenon, the solutionmight best lie with national business asso-ciations. Nevertheless the situation bearsmonitoring from Hawaii’s standpoint.
ConclusionConcerns about air seat capacity are
often expressed by those interested in“leisure” destinations. In addition to Hawaii,officials in Las Vegas and New Zealand haveexpressed concern over adequate capacity.At least with respect to Hawaii, the evidencesuggests that the provision of air seats islargely an economic decision. Unfortunately,direct data on costs are not available, sothat one cannot compare profitability acrossroutes. Nevertheless, relatively low revenueper available seat mile reduces the incentiveto increase capacity. Airlines have compen-sated for this by increasing load factors,thereby spreading costs over a greater
number of travelers. However, it appearsthat once the load factor reaches a criticallevel, the number of seats will increase asmarket demand increases, a trend which hasbeen occurring since 1994.
Apart from seat availability, a decline inthe ease and comfort of flying long distancecoupled with a changing traveler profile maypresent disincentives for long distance travel.Hawaii may be able to mitigate these disin-centives by working with the airlines andairport. Finally, the rising cost of businesstravel is worrisome and should be monitoredfor any measurable negative impacts.
Percent change from same periodPercent change from same periodof previous year
Series 1998 (12 mo.) Jan-May 1999p May 1999p 1998 Jan-May 1999 May 1999
Selected Economic Indicators: State
Period(calendar year basis except for taxes)
Civilian Labor Force (persons) 1 597,050 598,250 598,900 0.1 0.9 0.9
Civilian Employment 559,750 564,100 565,950 0.2 1.4 1.9
Civilian Unemployment 37,300 34,150 33,000 -2.4 -6.8 -13.5
Unemployment Rate (percent) 2 6.2 5.7 5.5 -0.2 -0.5 -0.9
Total Wage & Salary Jobs 537,550 536,850 539,700 -0.2 -0.2 -0.2
Total Non-Agr. Wage &
Salary Jobs (number) 530,000 529,650 532,200 -0.3 -0.2 -0.1
Contract Construction 21,250 20,450 20,350 -4.7 -3.8 -5.1
Manufacturing 16,300 16,050 16,100 -1.5 -1.5 -1.2
Trans., Comm., Utilities 41,000 40,250 40,150 -0.7 -2.1 -1.5
Trade 131,750 130,200 130,050 -1.9 -1.3 -1.1
Retail 110,750 109,400 109,400 -2.3 -1.4 -0.9
Finance, Insur. & Real Estate 35,500 35,050 34,950 -1.8 -0.7 -1.4
Services & Miscellaneous 171,950 174,150 176,000 1.6 1.9 2.4
Hotels 37,750 37,350 37,450 -1.6 -2.2 -1.2
Government 112,200 113,550 114,850 0.4 -0.5 -0.8
State 64,950 67,100 68,500 1.1 -0.2 -0.6
Federal 30,400 30,050 29,950 -0.8 -1.0 -1.3
Agriculture Wage & Salary Jobs 7,550 7,000 7,100 4.9 -2.1 -3.4
Taxes ($thousands, state fiscal year 1998-99)
Total State Tax Collections 3,367,700 1,372,988 267,235 3.6 -1.4 1.0
State General Fund Tax Revenues 3 2,889,291 1,151,704 209,063 4.8 -2.6 -1.3
(Selected taxes)
Transit Accommodations Tax Revenue 125,882 62,872 12,187 -0.8 15.7 31.2
General Excise & Use Tax 1,436,654 595,657 105,265 0.3 -0.3 -0.1
Personal Income Tax Collections 1,093,241 413,822 74,439 11.0 -3.5 -8.3
Corporate Income Tax Collections 50,113 24,043 3,459 -11.9 -11.9 -26.1
Visitor Arrivals (persons) 6,738,230 2,781,300 524,760 -2.0 0.0 0.0
Westbound Visitors 4,245,280 1,839,530 344,530 4.1 5.1 4.9
Eastbound Visitors 2,492,950 941,770 180,230 -10.9 -8.6 -8.3
Hotel Occupancy Rates (percent) 2 72.0 73.3 66.3 -2.0 -1.0 -0.8
1 Labor force and jobs averages are based on monthly rounded data. Labor force data were also rebenchmarked in March 1999.2 Change is expressed in percentage points rather than actual percent change of the rates shown.3 If tax period ends on a weekend some of the collections may be shifted to the next period.Note: Most data are preliminary and subject to revision.

24 Hawaii’s Economy /July 1999
ECO
OM
YNHAWAII’S
State of Hawaii, DBEDT • No. 1 Capitol District Bldg., 5th Floor • 250 South Hotel St. • Honolulu, Hawaii 96813
Printed on recycled paper
1 Measured in change in percentage points rather than percent change in rates.2 Labor force and jobs averages are based on monthly rounded data. Labor force data were also rebenchmarkedas of March 1999.3 Preliminary data.Note: Most data are preliminary and subject to revision.Sources: State DLIR, READ, PKF-Hawaii. Compiled by EPIS/READ, DBEDT.
This report has been cataloged as follows:Hawaii. Dept. of Business, Economic Development & Tourism.Research and Economic Analysis Division.
Hawaii’s economy. Honolulu: May 1995–1. Hawaii-Economic conditions.
2. Hawaii-Statistics.HA4007.H358
Selected Economic Indicators by County, January to May 1999(value and percent change from same 1998 period)
C&C of Honolulu Hawaii Maui Kauai
Percent Percent Percent PercentSeries Value Change Value Change Value Change Value Change
Unemployment rate 1, 2 5.0 -0.2 8.8 -0.8 6.1 -1.0 7.9 -2.4
Non-Agric. wage & salary Jobs 399,150 -0.6 49,050 -1.0 56,500 1.0 24,650 4.2
Construction 15,100 -8.2 1,600 -22.0 2,550 34.2 1,300 52.9
Manufacturing 12,450 -2.0 1,450 -3.3 1,700 3.0 450 12.5
Retail 77,750 -2.6 11,350 1.3 13,800 0.0 6,500 4.8
Services & miscellaneous 125,600 2.5 16,600 -2.6 22,450 -0.4 9,150 3.4
Hotels 16,350 -3.8 6,500 -4.4 10,850 -0.9 3,600 2.9
Government 91,350 -0.5 10,550 0.0 7,550 -0.7 4,000 -1.2
State 51,800 -0.4 7,450 0.7 5,200 -1.0 2,600 -1.9
Federal 28,350 -0.9 850 0.0 550 10.0 350 0.0
Agriculture wage & salary jobs 2,100 2.4 2,300 -8.0 1,950 5.4 800 0.0
Visitors, total number 3 1,879,400 -3.9 522,750 -3.8 981,960 0.4 443,930 7.2
Westbound 986,730 5.8 418,710 1.0 834,000 3.8 394,690 10.5
Eastbound 892,670 -12.8 104,040 -19.5 147,960 -15.5 49,240 -13.6
Room Occupancy Rate (%) 1 72.1 -3.4 67.9 -5.6 79.8 4.9 71.9 5.6