Embed Size (px)
Citation preview
A Report Card on G8 Health and Development
Commitments Ronald Labonte, SPHERU, Universities of
Saskatchewan and ReginaTed Schrecker, SPHERU, University of
SaskatchewanDavid Sanders and Wilma Meeus University of the Western Cape
Funded by a Grant from the International Development Research Centre, Canada
ALL OPINIONS ARE THOSE OF THE AUTHOR AND DO NOT NECESSARILY REFLECT THOSE OF THE FUNDOR

“Fatal Indifference: The G8 and Global Health”
by Ronald Labonte, Ted Schrecker, with David Sanders and Wilma Meeus, research assistance from Jennifer Cushon and Renee
Torgerson
in press with University of Capetown Press
available September 2003

Context of G8
• Established 1975 after oil crisis• Provide collective management global
economy• Reconcile globalism tensions between
members• Create global political leadership• Canada, France, Germany, Italy, Japan,
UK, US, Russia (1998) and EU (different status)
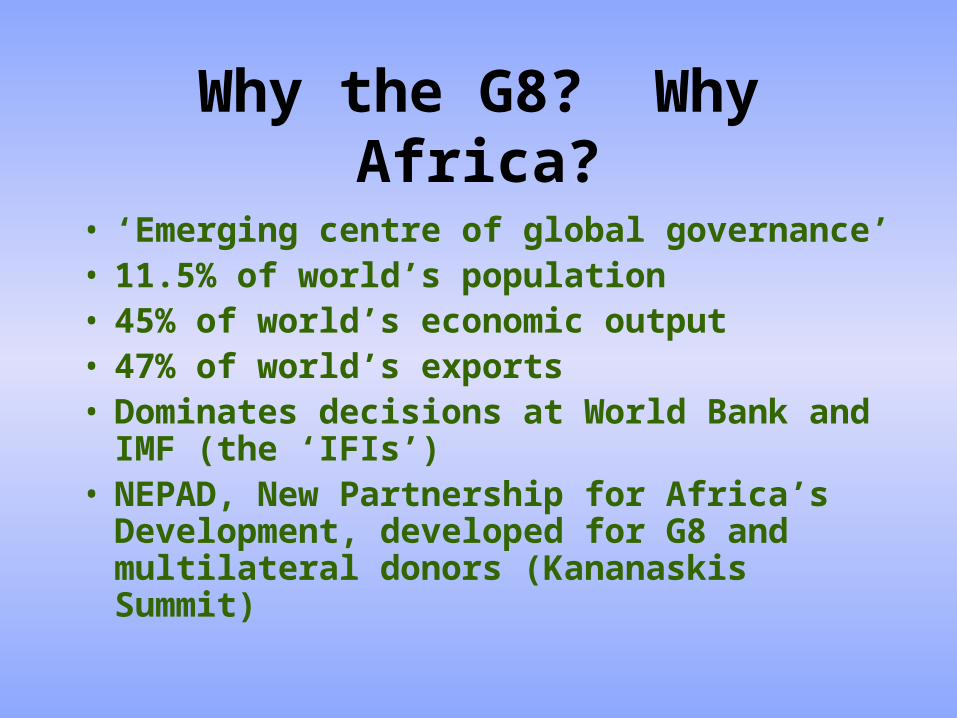
Why the G8? Why Africa?
• ‘Emerging centre of global governance’• 11.5% of world’s population• 45% of world’s economic output• 47% of world’s exports• Dominates decisions at World Bank and
IMF (the ‘IFIs’) • NEPAD, New Partnership for Africa’s
Development, developed for G8 and multilateral donors (Kananaskis Summit)

International/Millenium Development Goals
Similar, oft-supported by G8, referenced by NEPAD, by 2015:– Cut poverty by half ($1/day)– Universal Primary Education (UPE) – Gender equality in education – Cut IMR and <5 MR by 2/3rds – Reduce maternal MR by 75% – Access to all, reproductive health – Implement full sustainable
development strategies

A Quick Comparison
• Global anti-terrorist 2003: $551 billion• IDGs in all DCs, one-time: $600 billion• First 7 of MDGs, annual: $ 70 billion• Total G7 ODA 2001: $ 38 billion• Total G7 ODA to basic health: $ 1 billion• Anti-terrorist, US, 2003: $ 57 billion• Anti-terrorist, Canada, 2003: $ 7 billion• Investors’ gains, 1996-2000: $ 7 trillion

What We Did
• Reviewed last 3 Summits (Cologne 1999, Okinawa 2000, Genoa 2001)– not just compliance, but adequacy of
commitment to problem
• Comprehensive, organized in 7 categories: – macroeconomics, health, education,
nutrition/food security, development assistance, trade and market access, environment
– public health/health determinants approach

Macroeconomic policy and poverty reduction
• Drawing the poorest countries into the global economy is the surest way to address their fundamental aspirations. (Genoa Communiqué ¶3).
• [P]overty can best be overcome in … societies with … growing and open economies… (Okinawa Communiqué ¶14, emphasis added).

Macroeconomic policy and poverty reduction
• Liberalization reduces tariff taxes upon which many developing countries more reliant
• 1990 - 1999, average African tariffs as share of taxes fell from 33% to 30%; but more steeply in some countries
increased growth, alternative tax sources did not make up shortfall
• Contrast: G7 derive only 4% of taxes from tariffs – less to lose with market liberalization

Macroeconomic policy and poverty reduction
• SAPs/MAPs: liberalization, de-regulation, privatization, public spending (user-fees, cost-recovery)
• Conditionalities had many negative health effects, particularly in AfricaBreman, A., Shelton, C. 2001. Structural Adjustment and Health: A literature review of the debate, its role-players and presented empirical evidence. Paper No. WG6:6. Cambridge, MA: Commission on Macroeconomics and Health, June
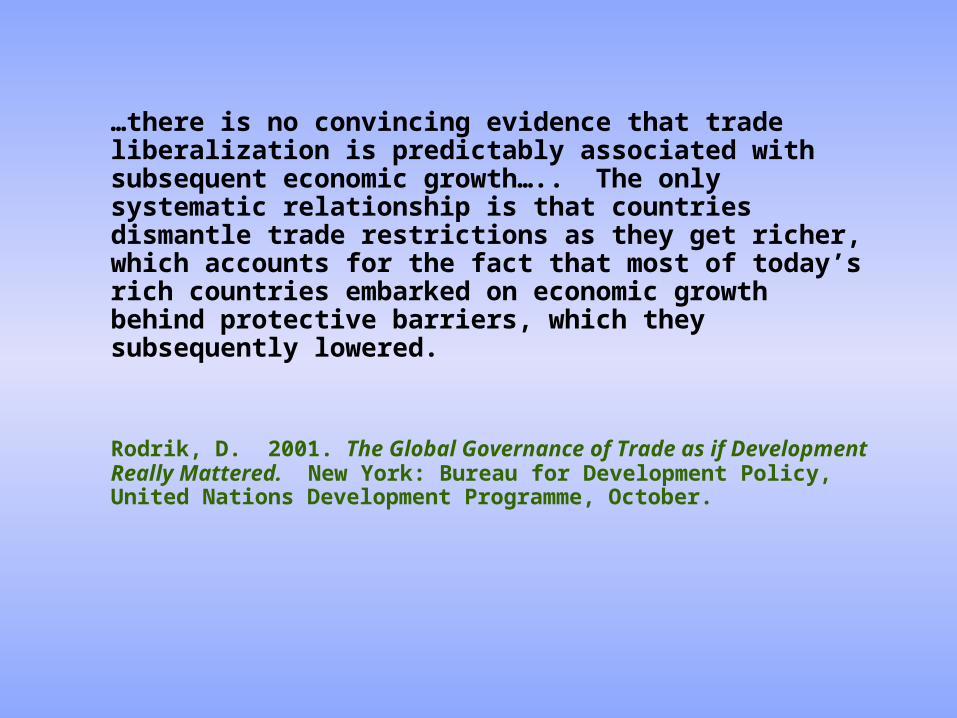
…there is no convincing evidence that trade liberalization is predictably associated with subsequent economic growth….. The only systematic relationship is that countries dismantle trade restrictions as they get richer, which accounts for the fact that most of today’s rich countries embarked on economic growth behind protective barriers, which they subsequently lowered.
Rodrik, D. 2001. The Global Governance of Trade as if Development Really Mattered. New York: Bureau for Development Policy, United Nations Development Programme, October.

“Maintaining that globalization as we know it is the way to go and that, if the Washington consensus policies have not borne fruit so far, they will
surely do so in the future, is to replace empiricism with ideology.”
Milanovic, B. 2003. The Two Faces of Globalization: Against Globalization as We Know It. World Development 31: 667-683.
At minimum, the pro-globalization, pro-growth, macroeconomic assumptions of the
G8 (and NEPAD) are empirically contested and lack consensus amongst economic theorists
and researchers.

HIPC and Debt Relief
• Focus of poverty reduction for G8 since Cologne summit (1999)
• Genoa committed G7 to $53 billion (over time) in debt relief; and to 100% forgiveness of ODA debt to HIPC countries
• Debt relief is freeing up some funding for health, education, sanitation and HIV/AIDS (Jubilee Movement, World Bank)

HIPC and Debt ReliefG7 have done what they said they would– 25 countries received $40 billion
debt relief (May 2002)– new funding ‘enhanced’ HIPC
provided– PRSPs have become condition for
HIPC and increasing amounts of multilateral and bilateral assistance
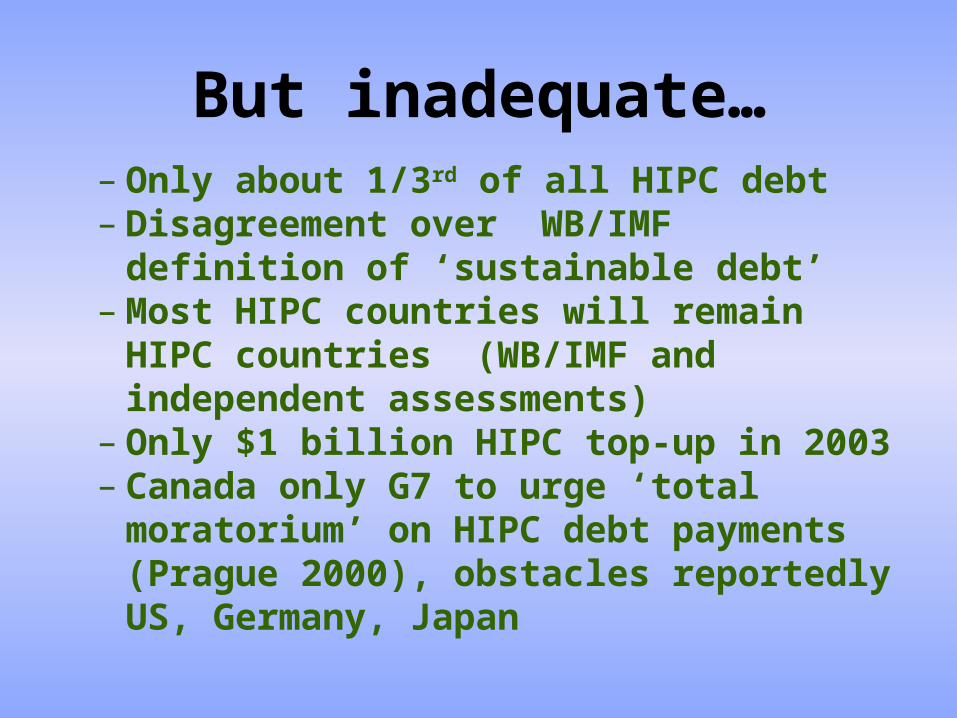
But inadequate…– Only about 1/3rd of all HIPC debt– Disagreement over WB/IMF
definition of ‘sustainable debt’– Most HIPC countries will remain
HIPC countries (WB/IMF and independent assessments)
– Only $1 billion HIPC top-up in 2003– Canada only G7 to urge ‘total
moratorium’ on HIPC debt payments (Prague 2000), obstacles reportedly US, Germany, Japan
HIPCs and the PRSPs
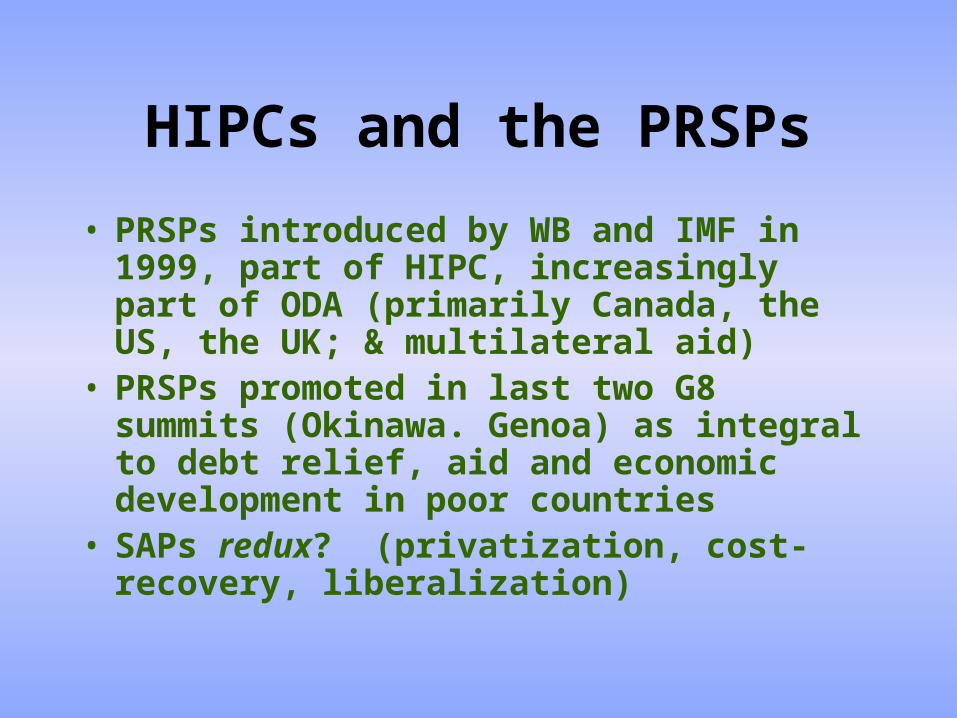
• PRSPs introduced by WB and IMF in 1999, part of HIPC, increasingly part of ODA (primarily Canada, the US, the UK; & multilateral aid)
• PRSPs promoted in last two G8 summits (Okinawa. Genoa) as integral to debt relief, aid and economic development in poor countries
• SAPs redux? (privatization, cost-recovery, liberalization)
HIPCs and the PRSPs
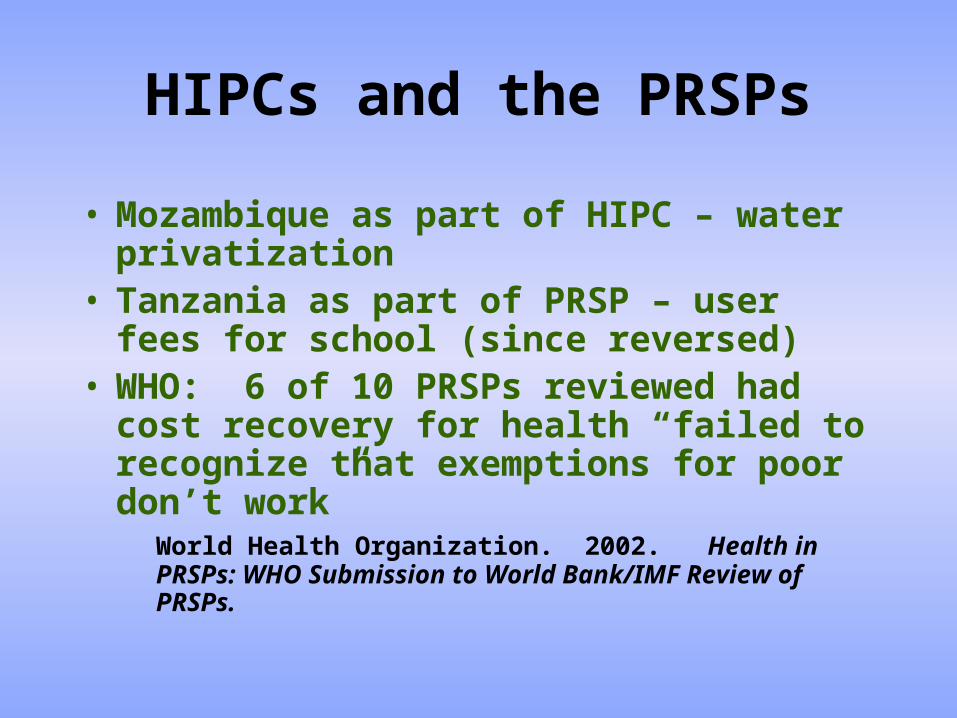
• Mozambique as part of HIPC – water privatization
• Tanzania as part of PRSP – user fees for school (since reversed)
• WHO: 6 of 10 PRSPs reviewed had cost recovery for health “failed to recognize that exemptions for poor don’t work”
World Health Organization. 2002. Health in PRSPs: WHO Submission to World Bank/IMF Review of PRSPs.

Foreign Direct Investment
G8 and NEPAD assume FDI to be engine of growth
The New Partnership for Africa's Development seeks to increase private capital flows to Africa, as an essential component of a sustainable long-term approach to filling the resource gap. (NEPAD, ¶ 153-154)
“at best an untested theory, at worst an inversion of the truth…growth attracts FDI, not FDI that brings growth”
Tandon, Y. 2000. UNCTAD

FDI & Capital Market Liberalization
African share of FDI (1990 – 2000)– 8 fold increase in $ terms – 0.4% to 0.5% in relative terms
Liberalization of capital markets to attract FDI also associated with:– health-damaging and poverty-increasing
currency speculations – tax evasion (havens) and competition– as much as $8 trillion in assets in tax-sheltered
accounts– developing country lose $50 - $100 billion
annually in potential taxes

Health and Health Systems
GFATM (Okinawa), $1.3 billion commitment – US and Japan below proportionate contribution– Canada, UK and Italy more generous per capita
contributors– Japan disbursed $700 million of $3 billion
infectious disease pledge(Okinawa), only $200 million to multilateral GFATM
– Of 2003 US pledge of $10 billion, 90% bilateral: of greater benefit to US-based PHARMAs?
– Sweden, Netherlands 2x as generous per capita as most generous G8

GFATM
Adequacy of commitment– call for $10 billion annually– all G8 well below two tithing
estimates (UN tithe, GDP tithe)– US opposed to any such tithe– what about health systems to
deliver?

% of GDP and actual health expenditure/capita per annum
(1996 – 1998 averages)G7 average ~10% $ 2,500
Tunisia 3% $ 68
Egypt 1.8% $ 20
Senegal 2.6% $ 15
Eritrea 2.9% $ 5
Madagascar
1.1% $ 2.6
Ethiopia 1.6% $ 1.8
Burundi 0.6% $ 0.88

African country per capita expenditures on health,
1998Number of countries
Amount of spending
6 > $60
3 $34 - $60
10 $12 - $34
27 < $12

What is needed and given annually
(billions)For HIV, TB, Malaria, Maternal & Child health: $38
(CMH-WHO 2001)
For health systems,(excl. HIV, TB, Malaria): $20 - 40
(World Bank data)
Current total health ODA: $ 6

What Does This Mean for the G8?
• Committed to IDGs (Genoa 2001)
reduce infant and < 5 mortality rates by 2/3rds, 2015
• Committed to reduce HIV 25%, TB 50%, malaria 50% (2010) (Okinawa 2000)
• “Strong national health systems will continue to play a key role…” (Genoa ¶17).
• With few exceptions, African countries health expenditures as % of GDPproblem is small and shrinking GDP, debt overhang

0
2
4
6
8
10
12
14
16
18
Canada France Germany Italy Japan UK US G7Average
1990/92 average 1996/98 average 1999 2000 2001
Trends in Health Aid as % of ODA(1990/92 and 96/98 bilateral only)

The Brain Drain• G7 has 30 X doctors/population than SSA
yet…• $500 million annual transfer training costs,
poor to rich countries, Canada, the UK and the US particularly at fault
• 1998 vacancy rates for physicians in Ghana, Malawi and Namibia were 43%, 36% and 26% respectively
• Despite commitments to not recruit, recruitment continuesOver 2,000 South African nurses registered in UK year following policy not to poach, twice as many as before
• Push factors: inadequate health systems

Global Public Goods for Health
G8 ‘called on’ MDBs ‘to provide support for GPGs’ (Genoa)– no evidence of MDB for GPGs (1999 -
2001)
G8 called for ‘meaningful replenishment of IDA’ for GPGs (health, education) (Genoa) and health, education, water, sanitation (Okinawa)– IDA replenished with $22 billion, no in IDA
funding of health, education or water/sanitation (2000-2001)
Global Public Goods for Health
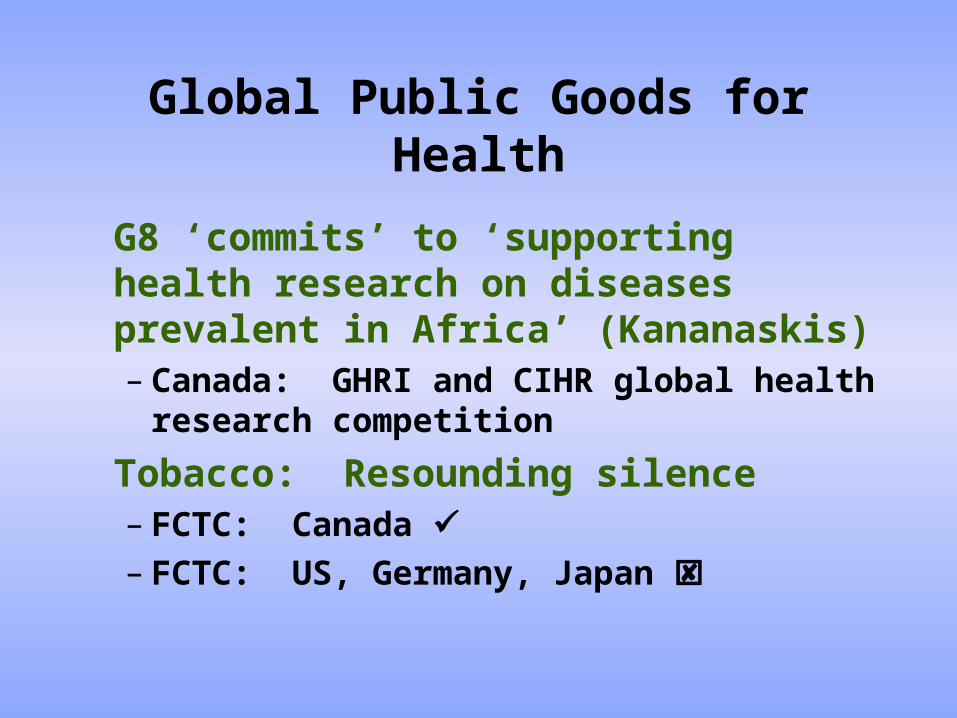
G8 ‘commits’ to ‘supporting health research on diseases prevalent in Africa’ (Kananaskis) – Canada: GHRI and CIHR global
health research competition
Tobacco: Resounding silence– FCTC: Canada – FCTC: US, Germany, Japan

Access to Essential Medicines
• G8 committed to improving drug access DCs (Okinawa 2000, Genoa 2001)We recognize the appropriateness of affected countries using the flexibility afforded by that agreement to ensure that drugs are available to their citizens who need them, particularly those who are unable to afford basic medical care (Genoa Communiqué ¶17).
• Doha Declaration: Each member has the right to grant compulsory licences and the freedom to determine the grounds upon which such licences are granted

Health promises kept/broken
• GFATM • IDA replenished • Progress on health IDGs • Strong national health systems
• Multilateral $ GPGs for health • Multilateral $ health • Essential drugs (TRIPS)

Education
• G8 committed to Dakar EFA Framework (Okinawa, Genoa)
• Annual cost estimates to achieve UPE alone: $10 – 30 billion SSA = seven fold increase in ODA (World Bank)
• UNESCO: 32 countries won’t reach target, most in SSA
• WB (completion not just access): 88

Education
• Social Watch: 30% (n=33) of countries regressed on initial starting point, spending less on education
• With few exceptions, Africa increasing education as % GDPMost optimistic growth estimates (market access, debt relief) insufficient to create revenue for many African countries to provide health, education, water/sanitation
THEY WILL STILL NEED AID

0
5
10
15
20
25
30
Canada France Germany Italy Japan UK US G7 average
1990-1992 (average) 1993-1996 (average) 1999 2000 2001
Trends in Education Aid as % of ODA
(1990/92 and 96/98 bilateral only)

[N]o government seriously committed to achieving education for all will be
thwarted in this achievement by lack of resources.
(Okinawa Communiqué ¶33). • UPE annual costs =
– 6% - 10% US tax reductions, 2002 – value of Canadian tax reductions 1984 – 2000
• Only marginal in education aid (2000/2001)
• Only Canada & France large in basic education aid (2000/2001)

Education promises kept/broken
• IDA replenished • Progress on education IDGs
– new (post Genoa/Kananaskis) pledges = 10% of required ODA for UPE (UNESCO, 2002)
• Multilateral $ education • G6 support to UNESCO

Nutrition and Food Security
• G8 committed to use ODA for rural and agricultural development and food security (Genoa)– Steep drop in agricultural aid 1980 – 2000 – Slight increase in agricultural aid 2000/01
• G8-endorsed IDGs require reducing child malnutrition– Food aid decreased 1999/2000, only slight
increase 2000/01 – Politics of food aid (‘dumping,’
commodity prices, GMOs) ?
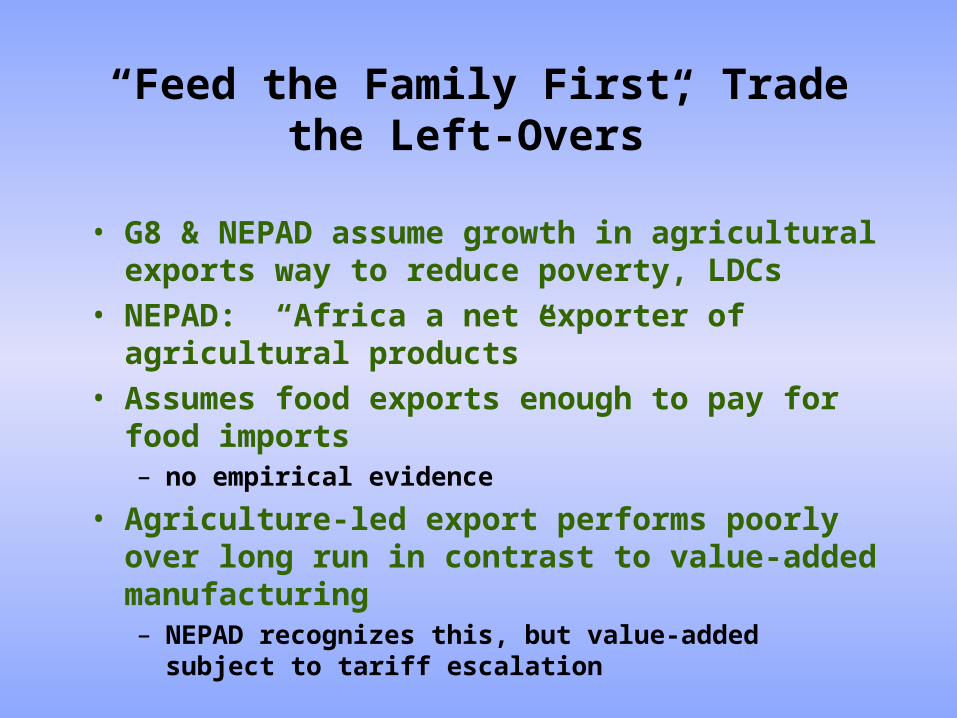
“Feed the Family First, Trade the Left-Overs”
• G8 & NEPAD assume growth in agricultural exports way to reduce poverty, LDCs
• NEPAD: “Africa a net exporter of agricultural products”
• Assumes food exports enough to pay for food imports – no empirical evidence
• Agriculture-led export performs poorly over long run in contrast to value-added manufacturing – NEPAD recognizes this, but value-added subject
to tariff escalation

Environmental Costs
• Increased agricultural production has negative environmental externalities (soil, water, nitrogen cycles)
• Contrary to NEPAD, Africa’s environment extremely fragile, high water insecurity forecast (UNDP 2001)
• Doesn’t preclude this option, but tempers it…
Development Assistance• Projected optimistic growth in most
DCs will provide neither adequate poverty reduction nor a tax base to support public investments in education, nutrition and health systems
• ODA not sufficient, but necessary • G8 committed to ODA, but retreating
from Cologne commitment to increase, to Okinawa and Genoa commitments to make aid more effective
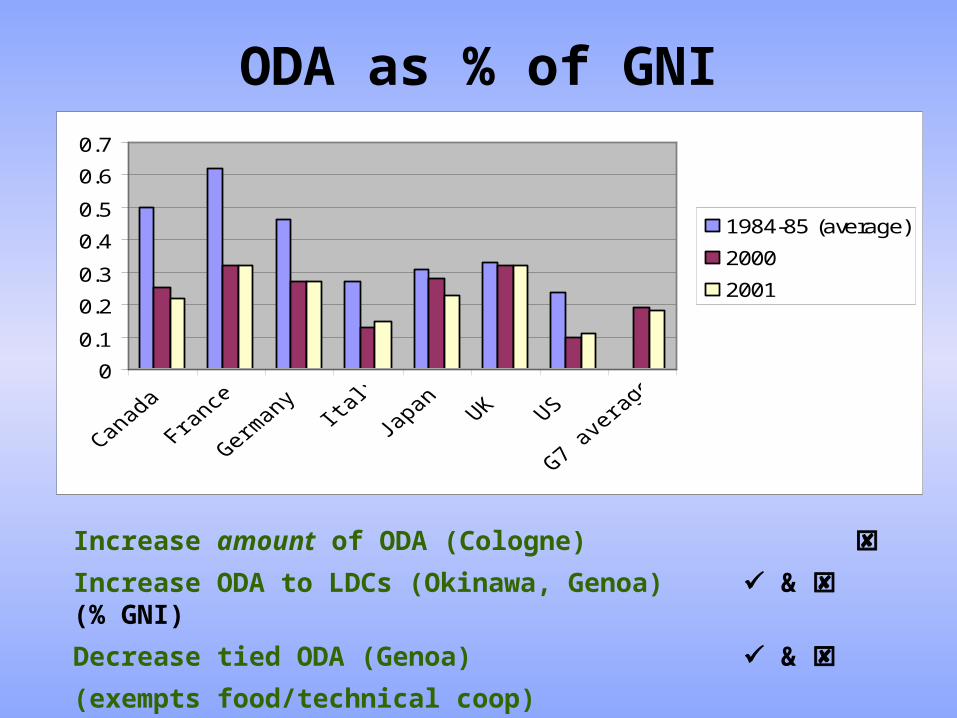
ODA as % of GNI
0
0.1
0.2
0.3
0.4
0.5
0.6
0.7
1984-85 (average)
2000
2001
Increase amount of ODA (Cologne)
Increase ODA to LDCs (Okinawa, Genoa) & (% GNI)
Decrease tied ODA (Genoa) &
(exempts food/technical coop)

-50%
-40%
-30%
-20%
-10%
0%
10%
20%
30%
40%
Canada
France
Germany
Italy
Japan
UK
US
G7 Total
Percentage Change in Total ODA 1993-2001, at 2000 Prices and Exchange
Rates

Until 2000, declining net ODA disbursements to SSA
02000400060008000
100001200014000160001800020000
Net ODA $ million at2000 prices andexchange rates

Politics of Aid• 1970s – how to make international
order work for poor countries• 1990s – how to make poor
countries fit the international order
World Bank (2001): Commercial and political considerations major determining factors (African) bilateral aid.
• Bilateral conditionality slowly being removed by most G7 (but not by the Anglo members)

The G8 Scorecard
• Promises kept = 9• Promises broken = 18 • Inadequacy of promises kept
to problems experienced• Globalization and G8 global
governance for whose benefit?

The G8 & ‘Global Governance’
• Drawing the poorest countries into the global economy is the surest way to address their fundamental aspirations (Genoa Communiqué)
• …there is nothing inherent in the process [of globalisation] that automatically reduces poverty and inequality (NEPAD ¶40)
• [G]lobalization, American-style, has left many of the poorest in the developing world even poorer (Joseph Stiglitz, former Chief Economist, World Bank)
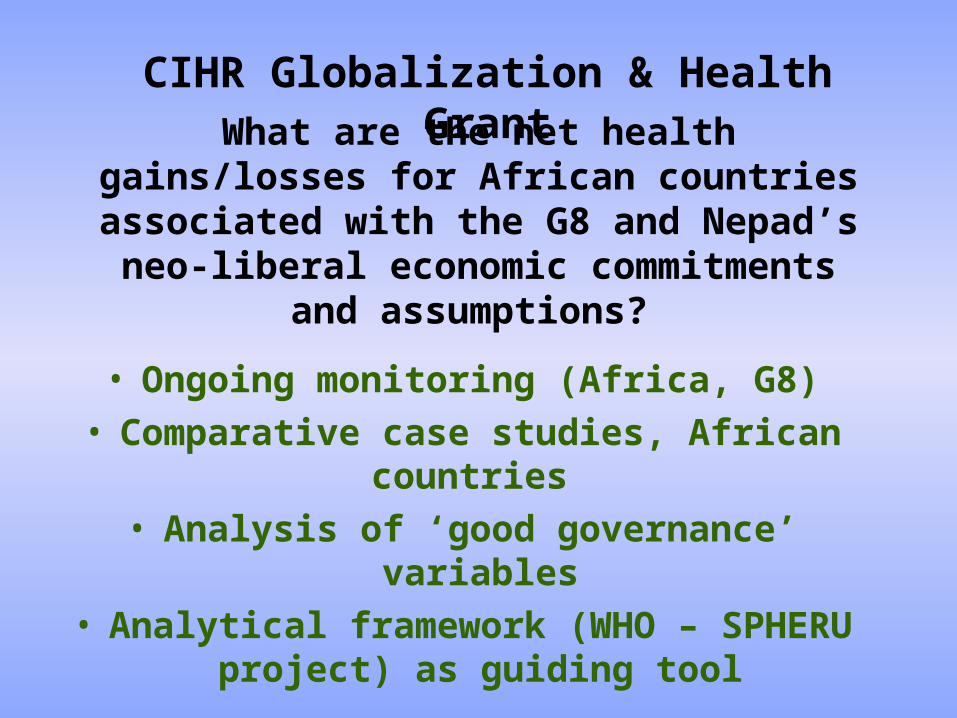
• Ongoing monitoring (Africa, G8)• Comparative case studies, African
countries • Analysis of ‘good governance’
variables• Analytical framework (WHO – SPHERU project) as guiding tool
What are the net health gains/losses for African countries associated with
the G8 and Nepad’s neo-liberal economic commitments and
assumptions?
CIHR Globalization & Health Grant

Work Plan
• Refine G8 monitoring methodology (develop links G8 monitors in G8
countries)• Develop and refine NEPAD monitoring
methodology (several African based collaborators)
• Refine methods for case studies (country selection, secondary data sets, liaison
with African country researchers) • Select multi-level modeling methods for
comparative data analyses • Develop longer-term fundable research
projects