Embed Size (px)
Citation preview

I ‘■VMM
A report by the Uganda Ecoi Study Team.
VOLUME tW O
^Sponsored by the International Development' Research Centre (10RC) at the -request of ttUganda Government. . ,

Economic Adjustment and
Long-Term Development in Uganda
By
. THF UGANDA ECONOMIC STUDY TEAM
TEAM HEH8ERS
1. Prof. John Loxley Co-Team LeaderProfessor and Head, D e p a r t m e n t of Economics, University of Hanitoba, Canada.
2. Prof. Yoeri Kyesimira C o -Team LeaderFormer Minister of ‘ Planning and Economic Development and former Professor and Head of Department of Economics, Hakerere University.
3. Prof. John Harris
Professor of Econ o m i c s and former Director of the African Studies Centre, Boston University.
4. Prof. Gerry Helleiner
Professor of Political Economy, Uni v e r s i t y of Toronto. Member of IDRC Board .of Governors.
5. Hr. Semyano Kiingi
Former G o v e r n o r , Bank of Uganda and former Director of the IMF.
6. Prof. Reginald Green
Professor, Institute of D e v e l o p m e n t Studies, Sussex, England.
7. Prof. Just Faaland
Hichelson Insitute, Norway. Former Director, OECD Development Centre, Paris.
8. Prof. Juraanne Wagao
Dar - p c ^ I i aaC* f°rfller Head of Economics, University of uar e s - S a l a a m .

9. Dr.
1 10. Prof
11. Mr.
12. Dr.
A s s o c i a t e p r o f e s s o r of Economics and Business, United St a t e s I n t e r n a t i o n a l University.IDRC Macroeconomic Analysis Prograaae C o - o r d i n a t o r .
, Lloyd Le Van HallProfessional Accountant, Winnipeg, Manitoba.
:i r im oo ni B a n u g i r eAssociate Professor of Econoaics, Makerere University,
ioshua DoriyeHead, Department of Econoraics, Institute of Finance Management, Tanzania.
13. Dr. Deryke BeishawProfessor of Rural Development, School of DevelopmentStudies, University of East Anglia, England.
CONSULTANTS
1. Dr. Mwita Rukandema■4\ Agricultural Economist, F A O , b a sed in Lusaka, Zambia.
2. Dr. Salim BachouLecturer, Department of Economics, M a k e r e r e University.
3. Dr. G. SsemogerereLecturer, Department of Economics, M a k e r e r e University.
4. Mr. E.O. OchiengAssociate Professor and Head of E c o n o m i c s Department, Makerere University.
5. M r . Edward KakoozaStatistician, UN Habitat
6. Mr. Walugeabe-HusokeSenior Lecturer, Department of Econoraics, Makerere Universi t y .
7. Prof. Senteza-Kajubi
Professor of Education, Maker e r e University
8. Mr. Kagule-Hagaabo
Geology Consultant and former Commi s s i o n e r of Geology, Ministry of Natural Resources.
9. Prof. Apollo Nsibambi
Professor of Political S c ience and Dean of Social Sciences, Makerere University

10. Dr. Hukwanason HyuhaLecturer, Department of Economics, University of Dar- e s - S a l a a m , Tanzania.
11. Mr.
12. Dr.
13. Prof
14. Prof
*
1 .
2.
3.
4.
5.
6 .
7.
8 .
9.
1 0 .
F. R. BibangambahAssociate Professor and Head, Department of Rural Economy, Makerere University.
f. LuyombyaSurgeon, and Member, National Resistance Council/
Robert Chernomas Professor, University of Manitoba.
Randy SpenceProfessor, Carleton University. Attached to Planning Project, Kenya.
The team worked closely with relevant Ministries. The contribution of the following officials is particularly appreciated.
Mr. H. LutayaMinistry of Planning and Economic Development.
Mr. S. KagoyeMinistry of Planning and Economic Development.
Mr. P. IkopitMinistry of Planning and Economic Development.
Mr.B. J. Twodo Ministry of Indsutry.
Mr. P. SanyaMinistry of' Transport and Telecommunications.
Mr. MunyanezaNational Residtance Movement, Secretariat
Mr. J. Mi tala Ministry of Labour.
Mr. J.R. KahangireMinistry of Agriculture and Forestry
Miss Sarah Ibanda Ministry of Housing.
Dr. S.I. Okware Ministry of Health.
11. Dr. J. NzabanitaHinistry of Health.

i N i K u D i ¡ i . i i U n
T h i s i s t h e s e c o n d V o l u m e o-f t h e S t u d y 0 1 1 t h e U g a n d a Economy. \ ' L
c o n t a i n s s e c t o r a l p a p e r s t o h i g h ! i g h t s o me o+ t h e i s s u e s ciiid
c o n c l u s i o n s a r r 1 v e d a t 1 n VoiuiTie 1 w l i i c i i c o r i c e i i t r a t e a ori
i n a c r o e c o n o i n i c a s p e c t s .
The s e c t o r a l p a p e r s p r e s e n t e d h e r e c o v e r h q r í c u l Lur e ; l n d u s t r y;
M i n i n g ; E n e r g y ; T r a n s p o r t a n d C o m m u n i c a t i o n s ; B a n k i n g and F i n a n c i a l
I n s t i t u t i o n s ; H e a l t h , W a t e r a n d N u t r i t i o n ; E d u c a t i o n ; and Housing,
w i d e r a g e o-f p a p e r s w e r e p r e p a r e d t o r t h e t e a m b y c o n s u l t a n t s and
t e a m m e m b e r s . T h e y w e r e d i s c u s s e d a n d t h e t e a m - f e l t t h a t p r e s e nt i ng
some o-f t h e m i n t h i s v o l u m e w o u l d a s s i s t i n u n d e r s t a n d i n g t h e i ssues
and c o n c l u s i o n s o f V o l u m e I . A t o t a l o-f 2 5 p o s i t i o n p a p e r s and
r e p o r t s w e r e p r e p a r e d -for t h e t e a m . T h o s e n o t i n c l u d e d i n t h i s
Vo l u me w e r e p r e s e n t e d s e p a r a t e l v t o q o v e r n m e n t -for i n-f or mat iori .
4

I
A G R I C U L T U R E
I
AGRICULTURE AND RURAL DEVELOPMENT IN UGANDA: ISSUES AND RECOMABJDATJQNS
I . OVFRALL OBJECTIVES AND DEVELOPMENT STRATEGY
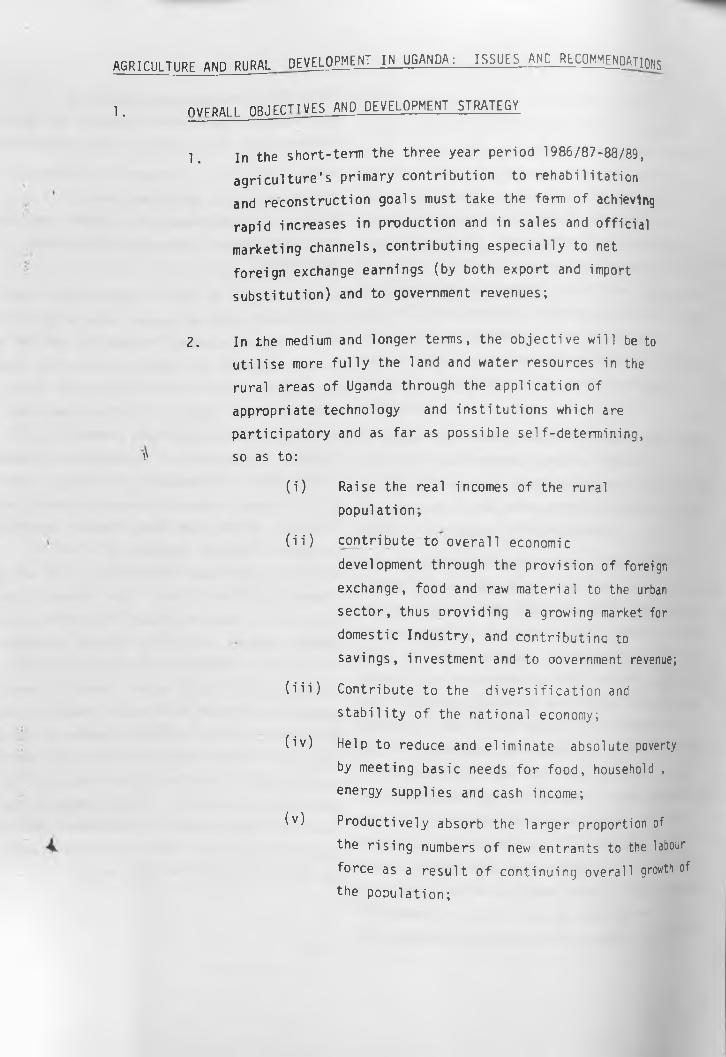
1. In the s h o r t - te rm the th ree y e a r p er iod 1986/87-88/89,
a g r i c u l t u r e 's p r im a ry c o n t r ib u t io n to re h a b i l i t a t io n
and re c o n s t ru c t io n goa ls must take the form o f achieving
ra p id increases in p rod u ct ion and in sa les and o f f ic ia l
marketing channels , c o n t r ib u t in g e s p e c ia l l y to net
fo re ig n exchange ea rn ings (by both e x p o r t and import
s u b s t i t u t io n ) and to government revenues;
2. In the medium and lo n g e r te rm s, the o b je c t iv e w i l l be to
u t i l i s e more f u l l y the land and w a te r resources in the
ru ra l areas o f Uganda through the a p p l ic a t io n o f
approp r ia te techno logy and i n s t i t u t i o n s which are
p a r t i c ip a t o r y and as f a r as p o s s ib le s e l f -d e te rm in in g ,
w so as to :
( i ) Raise the rea l incomes o f the ru ra l
p o p u la t io n ;
( i i ) c o n t r ib u te to o v e r a l l economic
development through the p ro v is io n o f foreign
exchange, food and raw m a te r ia l to the urban
s e c t o r , thus D ro v id in g a growing market for
domestic In d u s t r y , and c o n t r ib u t in q to
s a v in g s , investm ent and to oovernment revenue;
( i i i ) C o n tr ib u te to the d i v e r s i f i c a t i o n and
s t a b i l i t y o f the n a t io n a l economy;
( i v ) Help to reduce and e l im in a te absolute poverty
by meeting ba s ic needs f o r fo o d , household ,
energy s u p p lie s and cash income;
( v ) P ro d u c t iv e ly absorb the la r g e r proportion of
the r i s in g numbers o f new en tra n ts to the labour
fo rce as a r e s u l t o f c o n t in u in g overa ll g r o w t h of
the p o p u la t io n ;

(vi) Reduce the incidence and s e v e r i t y o f
environmental degradation consuming the n a tu ra l
resource base while using i t more i n t e n s i v e l y ;
(vii) Reduce d isp a r it ie s in le v e ls o f consumption o f
private and public goods and s e rv ic e s
families and in d iv id u a ls both w i t h in the ru ra l
sector and between the ru ra l and the urban
populations.
3 on the basis o f the demonstrated re s i l ie m
of the small-scale o r peasant mode o f production
in the face o f economic i n s t a b i l i t y and the stoc
present capacity f o r adopting a p p ro p r ia te innovai
and advancing s ig n i f i c a n t p r o d u c t i v i t y g a in s , i t
would seem most lo g ic a l f o r p r im a ry emphasis to
be placed on u t i l i s i n g these s tre n g th s s t i l l
further. In p a r t ic u la r , improvement and unimoda
(rather than transform ation and bim odal) approac
to the primary production processes should be
followed. A t 'th e same t im e , however, o p p ortun it
to explo it in ternal economies o f sca le in
processing, and input d e l i v e r y e .g . v ia out grow
schemes should be se ized. Thus in c re a s in g rural
productiv ity requires c lo s e r in t e g r a t io n w ith tfi
natural economy, e s p e c ia l l y through improvements
in transport, marketing and the p r o v is io n o f
finance increasing the value - added to primary
commodities through s m a l l -s c a le in d u s t r ie s and
exploiting external economies between d i f f e r e n t
a c t iv it ie s through in te g ra te d land use planning
and the spatial lo ca t io n o f s e rv ic e s would be
other valuable elements. A ls o , enhancing the
level and effectiveness o f e d u ca t ion a l and heal
services and domestic water s u p p l ie s a v a i la b le t(
the rural population is a lso needed.

Given the v a r ia t io n s in n a tu ra l ,social and
needed economic c o n d i t io n s sound in Uganda's
ru ra l a re a s , the a ccu ra te design and effective
im plem entation o f these components can be best
achieved through a r e l a t i v e l y decentralised
approach ra th e r than through attempting to
improve a s in g le b lue p r i n t from above.These
elements - s e l f - s u s t a i n i n g improvements in land
and la b o u r p r o d u c t i v i t y , reductions in absolute
and r e l a t i v e p o v e r t y , in te g ra te d multi-sectional
investm ent programmes and decentra lised,
p a r t i c i p a t o r y d e c is io n -m a k in g processes are the
e s s e n t ia l components o f a " ru ra l development
s t r a t e g y .
A t Uganda's p resent stage o f economic development
and w ith i t s resource a v a i l a b i l i t i e s ,
an a g r i c u l t u r e - l e d r u r a l development strategy is
recommended as the most prom ising basis for the
fu tu re development o f the co u n try .
In moving from the s h o r t - te rm rehab il itat ion
p e r io d to the lo n g - te rm ru ra l development strategy,
improvements in the t o t a l va lue o f agricultural
ou tp u t should a l lo w producers to retain a larger
share o f u n i t revenue, increased domestic value
added be ing generated by both primary products
and a b roa d er spread o f a c t i v i t i e s and services
lo ca te d in the r u r a l s e c t o r . The possible
c o n f l i c t s between the necessary direction required
in the s h o r t - r u n and the lo n g -ru n goals should
be recogn ise d from the o u ts e t so that transitional
measures are scheduled to be phased in as the
p rogress w i th re c o n s t ru c t io n permits. These
should in c lu d e the replacement o f (or reduction
in ) e x p o r t d u t ie s by o th e r sources of tax revenue,
investm ent in ru ra l s e rv ic e centres and
improvements in r u ra l h e a l th , water and primary

education.
M t r p n -F r .n u n m r . ASPECTS OF A G R jC U L m flL S E C T0 R PERFORM ANCE
6 . The coffee sector has come to dominate Uganda's economy,
generating between 90 and 98 percent o f fo re ig n exchange
and between 40 and 70 percent o f Government revenue in varioi
recent years. This dominance has come about not through the
growth of coffee output but w ith the. d e c l in e o f o th e r a c t iv i
e s p e c ia l ly cotton, tea and m inerals - and red uct ions in both
p o ten tia l taxable capacity and tax a c t u a l l y c o l le c t e d on
imports and sales of domestic in d u s t r ia l p rodu cts . Indeed,
not on ly has coffee production stagnated but s iz e a b le leakag
is known to occur into the p a ra l le l economy ( th e Magendo
market). These diversions fu r t h e r reduce (a ) the supply
o f fo re ign exchange a va ilab le f o r u t i l i s a t i o n in p u b l ic sect
agencies, and (b) Government tax revenue.
7. The causes of th is s itu a t io n are w ell-know n and re q u ire no
e laboration here. In genera l, the combination o f exte rna l
economic shocks and in terna l mismanagement and in s e c u r i t y
since 1973/74 have resulted in gross d i s t o r t i o n o f the
macro-economic framework w ith in which the a g r i c u l t u r a l sectc
inc lud ing coffee production, operates . The a g r i c u l t u r a l set
i t s e l f dominates the generation o f personal incomes and
employment (mainly self-employment or> fa m i ly fa rm s). Over 9(
percent o f the population is dependent on the a g r ic u l t u r a l
sector fo r th e ir l iv e l ih o o d s , Uganda t y p i f y i n g an
agrarian-based economy. While the q u a l i t y o f macro-economi
decisions can severely constra in a g r i c u l t u r a l performance,
performance of agr icu ltu re and, in the s h o r t - r u n , th a t o f t
coffee sector in p a r t ic u la r w i l l c lo s e ly c o n s t ra in the
performance of the economy as a whole. The normal form of
micro-economic analysis o f a crop a c t i v i t y , t h e r e fo re , does
not provide adequate in s igh ts in to t h is s i t u a t io n .

and Marketing Cooperatives has been o n ly partially funded to
date (PA-01; $2 . 8 8 m out o f $4.32m is not y e t secured). Work
is commencing in farm management economics, but further
ass is tance is u r g e n t ly re q u ire d to s tre n g th e n :
p ro je c t i d e n t i f i c a t i o n and p re p a ra t io n capacity
m o n ito r in g and ongoing e v a lu a t io n procedures
management in fo rm a tio n system s, in te g ra te d across the
th ree main m in is t r ie s i n i t i a l l y , but even tua lly
in c o rp o ra t in g the boards and p a r a s t a t a ls , as well as
major p r iv a t e s e c to r b o d ie s , re s p o n s ib le fo r the
performance o f the m u l t i - fa c e te d a g r ic u l t u r a l sector.
18. I t is recommended t h a t approaches to p o te n t ia l donors to
secure t h is a ss is ta n ce should be i n i t i a t e d immediately.
19. At the le v e l o f a g r i c u l t u r a l p o l i c y , a la rg e number of key
issues have accumulated whi'ch re q u ire informed decisions.
The A g r ic u l t u r a l P o l i c y Committee, which is serviced by the
A g r i c u l t u r a l S e c r e t a r ia t o f the Bank o f Uganda, should be
re v ive d w ith immediate e f f e c t to c o n s t ru c t an agenda and
t im e ta b le f o r commissioned s tu d ie s , performance indicators,
p o l i c y analyses and d e c is io n s .
20. In c o n d it ion s o f ra p id i n f l a t i o n , the key administered
commodity p r ic e s should be in d e x - l in k e d i f they are not to
have reverse consequences from those in tended. As the crop
p r ic e must be se t a lo n gs id e changes in consumer prices in
the ru ra l a reas, a set o f r u r a l consumer p r ic e indices should
be constructed and m ainta ined as soon as p oss ib le (a new TA
p ro je c t may be needed f o r t h i s ) . The crop p r ice changes
should be incorp ora ted in q u a r t e r l y p r ic e and economic
p o l i c y reviews at le a s t u n t i l i n f l a t i o n ra tes have fallen to
the reg ion o f 25 percent and below. Th is frequency interval
w i l l a l lo w the a n a ly s is o f m onthly in d ic a to rs o f key crop sales
and macroeconomic v a r ia b le s to a d ju s t the p r ic e signals fa ir ly a c c u ra te ly .

on, irv ISSUES AND RECOMMENDED ACTIONSURGENT AGRICULTURAL POLjCVJSSUt— ---- -------------------
6 . 1 DIVERSIFICATION O M G R l C U L I u m J j m S
21. A bank.of Uganda task-force is exam in ing a g r i c u l t u r a l
d iv e r s i f i c a t io n p o s s ib i l i t ie s .
( i ) Several of these id e n t i f ie d in s e t are a lre a d y the
object of identified investment p ro je c ts ( c e r e a ls ,
oilseeds, cocoa, hides and s k in s , and honey).
( i i ) Among others which are not p r o je c t is e d ; the c a l l i s
made fo r research. In the case o f many h igh va lue
vegetables and sp ices,(french beans, o k a ra , capsium
c h i l l i e s , ginger, furmeric)
however, there is substantia l exp er ien ce o f producing
these crops on a commercial basis - The need is not for
research but for the id e n t i f i c a t io n o f s i t e s , markets,
commercial backers and techn ica l p ro d u c t io n know how,
Some of these projects are covered in p r o je c t AG-36;
the rest should also-be tack led w i t h in i t .
( i i i ) Some of the less perishable crops lend themselves to
outgrower scheme arrangements, w i th nucleus esta tes
ensuring that the input d e l iv e r y and marketing/transpoi
economies of scale are provided. The ownership o f co
estates should be resolved as r a p id l y as p o s s ib le , as
some of these could be u t i l i s e d f o r t h i s purpose.
( i v ) Rice is imported at present, but i t appears th a t
output could be increased to match consumption at
26,000 tons by 1990. The t r a d i t io n a l technique is to
oxplough and broadcast upland r i c e . A Chinese project
has introduced i r r ig a te d paddy tech n iq u e ; t h is is
high-yielding but needs high management and la b o u r- in t
The simpler and more appropria te techniques o f small-s
i r r ig a t ion and swamp draw in g/ f lood ing upland r i c e shot
be subjected to rapid f i e ld t r i a l s . Th is seems especi
appropriate for some of the densely popu la ted ,

m e d iu m - f e r t i l i t y areas in the Eastern and Northern
parts o f Uganda. O ther ce rea l and vegetable crops
could a lso b e n e f i t from such a lo w -c o s t approach to
i r r i g a t e d a g r i c u l t u r e f o r example, wheat and barley
could be produced on s m a l l -s c a le i r r i g a t e d basis on the
Punjab model. The design o f p r o je c ts AG-07 and AG-35
should be c ross -checked and rea p pra ised in the l ig h t of
comments.
INPUT DELIVERY1 FINANCE AND PUBLIC AGENCIES
A la rge number o f p u b l ic s e c to r investm ent p ro je c ts are con
cerned w ith o b ta in in g a g r i c u l t u r a l in p u ts and d e l ive r in g them
to farmers v ia government - to - government channels. Where
these are f r more f i n a n c i a l l y p r o f i t a b le a c t i v i t i e s , especially
when medium and la r g e -s c a le e n te rp r is e s are in v o lv e d , i t seems
more a p prop ria te f o r commercial channels to p rov ide inputs,
advice (and t ra in n in g i f needed) and c r e d i t f o r these (as long
as reasonable fo re ig n exchange a l lo c a t io n s are g iv e n ) . This
observation a p p lies to AG-16 beef ranches, AG-17 p o u lt ry , AG-18
p ig s , AG-15 f is h in g in p u ts and AG-48 Mechanised Fishing
Techni ques.
A proposal is under a c t iv e c o n s id e ra t io n in the Bank
o f Uganda and the M in is t r y o f M arketing and Cooperatives to
set up a specia l farm c r e d i t agency, - the Uganda Agricutural
Finance Agency ( p r o je c t AG-53) Tne exp er ience w ith farm
c r e d i t schemes in most A f r ic a n c o u n t r ie s i s not very favourable.
High d e fa u lt rates and captu re o f funds by the more powerful
fanners (e s p e c ia l l y i f a n e g a t ive rea l ra te o f in te res t applies)
are common p lace. We would recommend p r i o r i t y attention is
g iven to ( i ) c h a n n e ll in g c r e d i t f o r p oo re r farmers through the
Cooperative Bank, Unions and p r im a ry s o c ie t ie s , and
( i i ) ch a nn e ll ing inpu ts and where n e cessa ry , production credit
on a commodity s p e c i f i c bas is e i t h e r v e r t i c a l l in k s with the
agro in d u s t r ia l p rocess ing and m anufactur ing f irm s or through
h o r izo n ta l l inkages from nucleus e s ta te s to outgrowers.

1 thp e s ta b l is h m e n t o f th e UAFA i s un c lea r The proposal f o r tne estabout in t e r e s t rate and s a v in g s m o b i l i s a t i o n p o l i c i e s . I t
1 , : refers to lending fo r a g ro -s e rv ic e cen tres and o the r ru,
i n f r a - s t r u c t u r e , presumably e i t h e r p ro p e r ty f o r corm erc ia l
rent or community assets best f inanced by government grants
and/or s e l f - h e l p . I t is recommended t h a t th e UAFA, when and
i t is e s ta b l is h e d , concentrate e n t i r e l y on p rod u ct ion and
c l o s e l y associated investments in p rim ary p rocess in g o n ly .
In the course of research and i n i t i a l p i l o t schemes, several
government departments have become q u i t e h e a v i l y engaged in
commercial production a c t i v i t i e s . T h u s , p r o je c t AG-05 conce
the manufacture of small farm e q u ip m e n t, AG-16 re fe rs to twc
departmental commercial ranches, AG-13 proposes the developn
o f f ive departmental dairy farms, AG-29 re fe rs to departmer
ap ia r ies , AG-46 to large-scale commercial f i s h - f a r m i n g , i n c l i
c rayf ish exports, and AG-58 proposes to s e t up a qua ?si-corn
f is h marketing and p ou ltry input d e l i v e r y s e rv ic e to f is h i r
v i l la g e s . Presumably these are e i t h e r u n i t e n te rp r is e s o r
proposals in government departments w ith access to la nd , ca[
and production expertise. The L ive s to ck S e c to r Task - f o r a
set up by the Bank of Uganda is a lre a d y add ress ing i t s e l f t(
the question of what are the esse n t ia l s e rv ic e s upon which
departments should concentrate t h e i r a t t e n t io n . Th is enqui
should be extended across the a g r ic u l t u r a l s e c t o r , broadly
with a view to the divestment o f commercial e n te rp r is e s to
parastatal, cooperative or p r iva te s e c to rs . T h is i s recomrr
both because they tend to detract a t t e n t io n from more funda
services which only the government can p ro v id e and, often,
because they have been run p r im a r i l y f o r the p r iv a t e benefi
the government officers and/or employees.
The World Bank s 1984 A g r ic u ltu ra l S e c to r Report recommenf
the transfer of the Dairy Corpora t ions ' fu n c t io n s to the
cooperative and private sectors c e r t a i n l y . The corporation
ineffective in competing f o r d a i r y farmers ' m ilk wh!
ng to sell at retail prices f i x e d a t le v e ls below the i
remaining function is to s e l l re c o n s t i tu te d milk

imported m ilk powder and e d ib le vege ta b le o i l . Attempts by
government to operate a d e ta i le d p r ic e c o n t ro ls fo r whole
milk have f a i l e d , but the p r o v is io n o f re c o n s t i tu te d milk
appears to have been a sound form o f in te rv e n t io n restraining
p r ice increases v ia the s u p p ly s id e . O r ie n t in g th is supply
( n u t r i t i o n a l l y id e n t ic a l to whole m i lk f o r a l l except infants)
to lower income groups a t a p r ic e d is c o u n t , and standing to
compete in the whole m i lk market when margins are tending to
widen i . e . p ro v id in g p o te n t ia l co m p e t i t io n in a free market
might j u s t i f y the D a ir y C o rp o ra t io n s c o n t in u in g existence.
A small market s tudy should be made as soon as possible to
assess there p o s s i b i l i t i e s .
6.3 TRANSPORT CONSTRAINTS ON MARKET SURPLUS
26. A number o f t ra n s p o r t p r o je c t p roposa ls are o r ien ted towards
veh ic le re p a ir and im prov ing ru ra l fe e d e r roads and other links.
These are:
AG-19 UCTU workshops
TR-16 ru ra l fe ed er road maintenance u n i t s .
TR-33 R e h a b i l i t a t io n o f f e r r i e s
TR-34 c o n s t ru c t io n and r e p a i r ’o f b r id ges . In specific instances these gaps o r b o t t le n e c k s in the transport system may cause s i g n i f i c a n t re d u c t io n s in marketed su rp lu s , in a d d i t io n to ha rd sh ip to the local population e .g . f e r r y l in k s to the Sesse and Buvuma Islands.In these cases h ig h e r p r i o r i t y may be warranted for
remedial a c t io n than i s g ive n to the o v e ra l l project w ith in the t ra n s p o r t s e c to r p la n . I t is recommended that p ub lic a g r ic u t u ra l p ro d u c t io n and marketing agencies take e f f e c t i v e a c t io n to draw the a t te n t io n of the Ministry o f Transport to such in s ta n c e s , so th a t consideration
can be given to in c o r p o r a t in g them in an ea r ly scaled down phase o f union p r o je c t , o r under the emergencyr e l i e f programme.

7 . nmrrv ISSUES AND RECOMMENDATIONSSHORT-TERM AGRICUTURAL_POyiiLi^— ----------------------
7 . , f n v t r o n m e n t a l coN iS y g i g L J O ^ S T R Y a n d a g r o - f o r e s t r y
. . . nnnulation pressure on the resource base28. With increasing popuiauun vin most parts of the country , the in c id en ce o f e n v iro n s
degradation - so il erosion, d e fo re s t ra t io n and in c re a s in g
r i v e r regime in s ta b i l i t y - is being encountered more frequem
6 t the same time, shortages of fuel wood s u p p l ie s are beginn
to occur lo c a l ly . The use of plywood co n s e rva t io n measures
bunds, terraces and d iforesta tion - i s t r a d i t i o n a l l y advocati
as is the planting of v i l la g e or homestead fuelwood p lo ts .
Recent experience, however has stressed .the importance o f
in tegra tin g trees into m itn -storey c ropp ing systems (as well
v ice -versa on forested land) in o rd e r to ra is e both product
conservation at the same time. C lose r c o o rd in a t io n o f agro
fo re s t ry into forest projects ( A G -2 6 ,AG-44 and AG-45) is
recommended. '
7.2 HIGH LEVEL MANPOWER PLANNING AND DEPLOYMENT
Also closer coordination and an agreed d i v i s i o n o f la bou r
between the Forest Department and the M in is t r y , o f Environmer
a c t i v i t y in rural energy supplies seems to b e . in d ic a te d . F'
AG-43 pulp and paper p lantations, should be reappra ised in I
l i g h t of land use r e a l i s t i c estim ates o f pap
demand and p oss ib i l it ies fo r advantageous s p e c ia l is a t io n a
exchange between Uganda and Tanzania in t h i s a rea .
29. The current practice is to gurantee employment in the publi
service to the larqe annual intakes to the a g r i c u l t u r a l sec
un ivers ity fa c u lt ie s , in s t i t u t e s , c o l le g e s and sch o o ls . 1
many cases, with increasingly scarce n o n -s a la r y re c u rre n t
expenditure, this results only in v i s i b l e unemployment in t
relevant departments ( i f at low renu m erat ion in re a l ten

This p ra c t ic e should be reviewed in c o n ju c t io n w ith adetailed
h ig h - le v e l manpower p la n n in g e x e rc is e across the sector
Related issues concern the p o s s ib le p r i v a t i s a t io n of veterinary
se rv ices to some (h ig h v a lu e ) l i v e s t o c k owners with a view
to t h e i r h i r in g t h e i r own p ro fe s s io n a l a d v is o rs .
Given the c u rre n t la ck o f in fo rm a t io n about these
or document o f such arrangm ents, a s h o r t (two yea r) p i lo t
p ro je c t f o r v e t e r in a r y p r a c t ic e should be in s t i t u t e d .
7 3 EAST AFRICAN COOPERATION ON AGRICULTURAL MATTERS
30. In the area o f a g r i c u l t u r a l in fo rm a t io n and serv ices , Uganda
has su ffe red by comparis ion w ith Kenya .and Tanzania. The
p o s s i b i l i t i e s o f c o s t -s h a r in g o r u s e r - fe e arrangements with the
neighbouring s ta te s should be e xp lo re d f o r the fo llow ing areas:
P lant q u a ra n t ive s e rv ic e s ( o f AG-37)
Access to l i b r a r y jo u r n a ls and books, purchase of seeds, p la n t in g m a te r ia ls and l i v e s t o c k , j o i n t use of internationa r e t r i e v al systems s c i e n t i f i c d ia g n o s t ic services.
A g ro -m e te o ro lo g ic a l s e rv ic e s
M u lt i -c o u n t r y p ro fe s s io n a l t r a i n in g courses.
7.4 PARTICIPATION1 SELF-HELP AND THE ROLÉ OF NGOS
31. Under the general d e s ire to a t t r a c t resources fo r rehabilitation
and development, th e re i s p o s s ib ly a tendency to neglect the
developmental ro le s o f community s e l f - h e lp , aided often by
nat ion a l and/or in t e r n a t io n a l non-governmental agencies -
c h a r i t i e s , churches, c lub s and groups o f var ious kinds. This
question p o s s ib ly cou ld be cons idered p ro d u c t iv e ly both at
a na tiona l le ve l and in r e la t i o n to s p e c i f i c p ro ject proposals.
For example, p ro je c ts AG-50 goats and sheep, AG-30 commercial
l iv e s to c k and AG-50 f i s h e r i e s , dams, would seem to offer scope
f o r lo ca l community e f f o r t supported by NGOS.

7.5. RETRAINING OF HIGH^LEVEL_MAWPOWER
32. With the deterioration over the la s t tw e lve years in l i b r a r ,
materials and teaching equipment at Makerere and the o the r
professional training in s t i tu t io n s and the r e l a t i v e is o la t ic o f professionals from new s c i e n t i f i c a p p l ic a t io n s and
development experience in neighbouring c o u n t r ie s , there is a
to ca re fu l ly assess the nature and methods o f re tra in in g/u p c
/refreshing trainers, recent graduates and lo n g -s e r v ic e
professionals in the d if fe ren t s p e c ia l is m s . The in s t i t u t i o r
a s ta f f college f a c i l i t y , p re fe ra b ly drawing in the resourc?
Makerere University (at the same time reduc ing any tendency
ivory-tower isolation from g ra s s -ro o ts r e a l i t i e s , should be
considered.
MEDIUM-TERM POLICY ISSUES
33. A number of important issues re q u ir in g a n a ly s is and resolu'
in the medium-term have been i d e n t i f i e d . Time c o n s t ra in ts
facing the mission, however, did not parm it t h e i r f u l l
investigation. The key questions o n ly are summarised here;
i t is recommended that task - forces are i n s t i t u t e d w ith ap
membership over the next 18 months to i d e n t i f y and appraise
options or solutions.
8.1 LAND POLICY
34. The leading issues here concern:
( i ) The principles fo r re s o lv in g the in c re a s in g
sevetity of c o n f l i c t between major forms o f
land-use; cropping, ra n ch in g , g r a z in g , fores! and w i ld - l i f e ;
( i i ) The implications f o r resource p r o d u c t i v i t y ,
employ ment and income d i s t r i b u t i o n o f recen!
changes in land tenure , e s p e c ia l l y the leas
tracts of land fo rm e r ly used under custom

r io h ts t.n s ta te land:
i
8 . 2 .
35.
8.3
36.
h ' i i l The p o s s ib le need f o r a s s is te d o r pump -
p r im ary land se tt lem en t schemes on unused or
under-used land f o r la n d le s s o r near-landness
fa m i l ie s from dense ly populated d i s t r i c t ;
( i v ) The p o s s ib le m erits and a d m in is t ra t io n f e a s ib i l i t y
o f a land ta x on the m in o r i t y o f la rge land holdings
(v ) The ro le o f new techniques f o r tse ts e eradication
(o d o u r- b a ite d t ra p s ) in re c la im in g or releasing
la rg e areas o f land f o r l i v e s t o c k development and/or
s m a l l -h o ld e r se tt le m e n t e .g . in Western and
North -W estern Uganda and in South Busoga.
RESEARCH STRATEGY
The key question in t h is area i s whether to attempt the
t ra n s fe r o f t e e l im o l o g y ( t o t ) system o f the 1960's or to
replace i t w ith e i t h e r fa n n in g systems re se a rch , o r the
farmer f i r s t and la s t model, both, supplemented by search
a c t i v i t i e s ( in fo rm a t io n r e t r i e v a l ) and an in te g ra te d diognostic
s e rv ic e . The t o t system ( re s e a rc h -e x te n s io n - fa rm e rs ) would
be ve ry expensive to re c o n s t ru c t and i s thought to be potentia lly
less cost e f f e c t i v e than e i t h e r o f the o th e r op tions . The
fu tu re o f p ro je c ts AG-09 A g r i c u l t u r a l Research Projects AG-32
Annual Health Research should be encompassed w i th in th is study
In two o the r research p r o je c t s (AG-47 and AG-55 crops for
in d u s t r y ) a v igorous commercial o r ie n t a t io n appears to be la c k in g .
FOOD SUPPLY POLICY
A food p o l ic y s t r a t e g y , i n v o lv in g a d e c e n t ra l is e d pattern of
s t r a t e g ic g ra in re s o u rce s , has been recommended by an EEC

m iss ion . Grain storage on t h is s ca le is l i k e l y to be costlj
h o w e ve r , since years of poor ha rvest are v e ry in f re q u e n t in
A ls o , e a r ly warning system cannot be e f f e c t i v e l y maintained
a f t e r the loss of the former EAC a g ro - m a te o ro lo g ical servit
The fu ture ro le of the Produce M arketing Board and the scopi
f o r regu la r exports of surplus maize ( p r o je c t AG -34), beans
o the r foodstuffs needs to be r e a l i s t i c a l l y appra ised on the
basis o f time - series data f o r Eastern A f r i c a . Arrangeme
fo r locust control in the s u b -re g io n , and the r i s k posed to
supp ly , should be reassessed in the same e x e rc is e .
8.4 AREA-BASED AGRICULTURAL FARMING1 INTEGRATED RURAL DEVELOPME
AND DFf.FNTRALISEP REGIONAL OR DISTRICT ^LEVEL PLANNING
37. There has been r e la t i v e l y l i t t l e exp erience in Uganda with
these spatia l and m u lt i -s e c to ra l approaches compared with
and Tanzania. Two such p ro je c ts are in p rogress(AG -04 and
and three are proposed (AG-23, 38 and 39). A t p re s e n t , the}
not to include s u f f ic ie n t income - g e n e ra t in g a c t i v i t i e s t(
as the leading edge fo r ru ra l development.
Other such projects could be combined w ith t h e i r d i f f e r e n t
long-running models fo r such p ro je c ts are c o n v e n ie n t ly ava
in Tanzania in Tanga (GTZ - a s s is te d ) and I r in g a (EEC - ass
regions. The possible u t i l i t y f o r Uganda o f t h i s la rg e and
complex subject is recommended fo r , thorough s tu d y on an Eas
African^basis by a small h ig h - le v e l team.
8 - 5 REVIEW OF FARMS FOR THE REHABILITATION OF PRISONERS
38. I t is suggested that the nature and e f fe c t iv e n e s s o f th is
approach to prisoner r e h a b i l i t a t io n , e s p e c ia l l y the releva1
o f scale and techniques f o r fu tu re s m a l l -s c a le fa n n ers , be
to evaluation p r io r to proceeding w ith p r o je c t proposal

M F K t H U l A I
THE MEDIUM-TERM UGANDA COEFEE MODEL: CONCEPTUAL VERSIONFXGFNOUS VARIABLES TARGET VARIABL POLICY VA R IA BLES
Labour fo rce growth
Farm Resource Stock
Weather, Roads/ ^di sease , p a t te rn ,
bearinge tc .
( In te rn a t io n a l Coffee P r ices
Farm ProductionIn te n s i f i c a t i o n o f p rodu ction
Tech n o log ica l in n o va t io n ra te
New landc u l t i v a t i o n
FoodCropRevenues
Round 1
Food Crop P r i ces
Food Crop co f fe e p r ic e r e l a t i v i t i e s
S ize o f marketed food crops
Input d e l i v e r y system
S ize o f marketed Coffee Crop______
// Econorny Coffee Revenues
O f f i c i a lCoffee
Fore ian exch ange earn ings
Government C o f fee r evenue)-
Fore ign exchange a l lo c a t io n s ____
Budgetary
Round 2
Rural ,Urban income di f f e r e n t i ate
LuweroR e h a b i l i ta t io n
A g r i c u l t u r a l c re d i t
CroD D r o d u c t i v i t v measures
A t h i r d p o s s ib le , consumptio n s e c t o r , t ra d e r s ' real
in c o m e s , i s renarded as a component o f ru ra l and urban expend itu re m u l t ip l ie r s Food revenues are viewed as in v e r s é ly re la te d to co ffe e r^a l incomes.

APPENDIX
METHODOLOGY OF THE EXCHANGE RATE AND__COFFEE PR I C I_N_G_POLICY STUDY
The simple a n a lys is summarised in tables I - IV sets out to examine the
nature o f the re la t io n sh ip s between in te rn a t io n a l p r ic e s , the p a tte rn o f
production, the shares o f the o f f i c ia l and p a r a l le l m arkets, exchange
rates and o f f i c i a l producer price levels on the one hand and fo re ig n
exchange earnings and Government tax revenues on the o th e r . The a n a ly s is
re la tes to a short -te rm period of three years i . e . 1986/87 - 1988/89. I t
is set in the context o f id e n t ify in g a l te rn a t iv e n a t ion a l s t a b i l i s a t i o n
s tra teg ies fo r those years. The assumed base s i t u a t io n (Ta b le 1) i s a modified vers ion o f a sub-modal in a balance o f payments p ro je c t io n
constructed by the IMF. The three subsequent ta b le s e xp lo re the e f fe c t s
on to ta l p roduction , foreign exchange revenue and government ta x revenues
o f three d i f f e r e n t leve ls of exchange rates and producer p r ic e s .
In te rna t ion a l coffee prices and marketing costs are taken as g iven f o r
the purposes o f th is ana lys is . An immediate o b je c t iv e o f the model is
to id e n t i f y gross magnitudes of foreign exchange and ta x revenues at
d i f f e r e n t fo re ign exchange rates, given cautious estim ates o f (a ) s h o rt
and medium-term responses of supply to p r ic e , and (b ) the e x te n t o f
m arket-sw itch ing between the para lle l and the o f f i c i a l markets. Fo llow ir
the IMF procedure, the model is constructed in terms o f consta n t p r ic e s .
The possib le e f fe c ts o f in f la t io n , in p a r t i c u la r , are not in d ic a te d ,
w ith the sole exception of exchange rate -induced changes in m arketing
costs v ia t h e i r fo re ign exchange component. The model i s not a forecasting
model; i t aims to elucidate the major p o l i c y im p l ic a t io n s in the areas o f
exchange ra te , producer price and tax revenue d e c is io n s .
The key assumptions used in the analysis are:
( i ) In te rna t iona l Coffee P r ices :
Current ( J u ly 1986) international p r ic e s are t re n d in g downwards
a f te r the beginning-of-year peak which led to the suspension o f
the in ternationa l quota. A set o f p r ic e s have been used which
are lower than those assumed in the IMF p ro je c t io n (US $/Kg. f.o Mombasa):

1986/87 1987/88 1988/89
Q .1 Q.2 Q .3 Q.4
IMF p r ic e assumptions 3.0 2.9 2.7 2.7 2.6
Revised p r iceassumptions 2.6 2.5 2.4 2.4 2.4 2.4
The rev ised p r ice s r e f l e c t : (a ) a c u r re n t composite p r ic e s based
on a 95 percent Robusta share a t Shs. 2.49 per kg. and a 5 percent
Arabica share at Shs. 4.48 per kg . (A ra b ica has been around 8 percent
o f the Uganda crop r e c e n t ly , b u t as i t i s grown in border reg ions i t is
p a r t i c u la r l y s u c e p t ib le to p a r a l le l m a r k e t / o f f ic ia l market p r ic e
d i f f e r e n t i a l s ) ; (b ) the assumption th a t the in t e r n a t io n a l quota w i l l be
re a c t iva te d w ith the e f f e c t o f p r o te c t in g the Uganda composite p r ice at around
US $ 2.40 per kg. f . o . b . Mombasa; ( c ) the ca u t ious assumption th a t there w i l l
be no s i g n i f i c a n t f r o s t in B r a z i l ' s southern co ffe e zones in August 1986,
im p ly in g th a t w o r ld p r ic e s w t l l not s t a r t r i s i n g a g a in ; and (d ) the
assumption th a t Uganda w i l l be ab le to secure a s i g n i f i c a n t upward revision
o f i t s exported co ffee quota o f 2.6 - 2.7m. bags. T h is increase could be
argued on severa l grounds: Uganda's h ig h e r quota le v e ls in the 1960's ; the
dependence o f the c u rre n t re c o n s t ru c t io n a c t i v i t y on fa vou ra b le treatment
fo r a s p e c i f i c p e r iod p r i o r t o a phase o f planned d i v e r s i f i c a t i o n ; and the
fa c t th a t as a r e s u l t o f la rg e sa les m arkedly low er producer p r ices in non-quota
markets would subsequently induce an in c re a se o f sa les to the p a ra l le l economy,
such co ffee moving i l l e g a l l y in t o quota m arkets. I n -o t h e r words, some expansion
o f quota is a necessary c o n d it io n f o r the success fu l a p p l ic a t io n o f ICO control
measures to co ffees o f Ugandan o r i g i n .
( i i ) S tru c tu re and Performance:
The IMF base production f i g u r e i s 2.4 m. bags o r 144,000 ton s . This reflects
Uganda s recent f l o o r quota (a lth o u g h i t was ra is e d to 2.6 m. bags in 1983/84).
T h is is bel.ieved to be an understatem ent o f probable o f f i c i a l supply at the
cu rre n t p r ice s o f Shs. 850.00 per kg. Robusta and Shs. 1 ,500.00 per kg. Arabica.
F i r s t l y , there has been a re d u c t io n in non-monetary cos ts ( o r r is k s ) imposed by

x 1 anri nrder in the country; t h is can be expected the Drevious absence o f law and
x + w n n d lv , the reoccupation o f the Luwero lead to some increase in output, beconu y ,additional output both from stumping and
area is expected to generate addit -regeneration and f r o . new planting, bearing commencing a f t e r 30 months.
On the other hand, the stock of coffee trees is a g e in g , the bu lk hav ing bee
planted in the 1930's and 1950's, while replacement has p roba b ly been
tapering o f f . Adjustments fo r these factors have been made to the annual
production f ig u r e s , as follows { ' 0 0 0 tons).
1986/87
Base (quota)
'Law and Order'
Luwero increment
Ageing fa c to r
TOTAL 160 167 174
1987/88 1988/89
144 144
10 10
22 33
-9 -13
1 . A rate o f 3 percent decline per annum has been a p p lie d to the an
assumed to be generating 144,000 plus 10,000 equals 154,000 tons
F in a l l y , an estimate needs to be made o f the q u a n t i t y o f co ffe e
purchased by the parallel economy. Various p ieces o f evidence
suggest that the annual production l i e s in - excess o f 2 0 0 , 0 0 0 to
and that 50-60,000 tons are being r e g u la r l y smuggled out o f Ugan
Earning on the cautious side, and assuming t h a t the 10,000 tons
increment to o f f ic ia l sales may represent a t r a n s f e r from the
magendo market, a figure of at least 40,000 tons remains to be
captured by the o f f ic ia l market. Part o f t h i s , however, is
represented by arabica production c lose to the n a t io n a l borders.
This is estimated at around 10,000 tons in Bugishu and 6,000 tor in Ankole and Kigezi.

( i i i ) P r ice Responses:
Coffee y i e ld s w i l l respond w i th in the 6 months season
to in t e n s i f i e d weeding, m u lch ing , f e r t i l i s i n g (w ith annual
manure, chem icals o r co ffe e husks) growing and cleaner
p ic k in g . I t i s reasonable to assume ( and supported by
numerous e m p ir ic a l s tu d ie s in A f r i c a and elsewhere)
th a t many (n o t a l l ) farmers w i l l va ry t h e i r in te n s ity of
p rodu ction a c t i v i t y in r e la t io n to t h e i r expectations of
re tu rn t o such e f f o r t , e s p e c ia l l y in in f la t io n a r y conditioi
Th is e x p e c ta t io n o f re tu rn to e f f o r t is best measured by
' r e a l p r i c e ' o r net b a r te r producers terms o f trade. This
i s the r a t i o o f the p r ic e rece ived by the producers for
t h e i r crop and the p r ic e s they pay f o r a set o f consumptio
goods ( and p rodu ction in p u ts , i f any) each price being
weighted by i t s p ro p o r t io n s in t h e i r to t a l expenditure.
In the s tu d y , a s h o r t - ru n ( l2 month) e l a s t i c i t y of supply
o f 0 . 1 was assumed - a c o n t in u o u s ly low f ig u re .
We must a ls o take in t o account p o s s ib le c ro s s -e la s t ic i t y
o f sup p ly e f f e c t ; another a c t i v i t y is becoming more
rew a rd in g , a t t r a c t i n g in p u ts away from coffee . The
a v a i la b le data (food components o f urban CPIs) do not
in d ic a te t h a t t h is has occured in the period since 1981.
In the lo n g e r - r u n , ou tp u t can increa se as a resu lt of
re c e n t ly p la n ted t re e s exceeding the e f fe c ts o f uprooting
and ageing in o ld t re e s . Farmers are l i k e l y to be more
s e n s i t i v e t o re a l p r ic e changes than in the short-run,
a lthough the e f f e c t i s lagged by - 3 years because
o f the crop g e s ta t io n p e r io d . A low response of 0.2
over a 2 ¿ y e a r p e r io d has been assumed, w ith a separate
deduction be ing made f o r ageing e f fe c t s as explained
above.

F in a l ly , allowance should be made f o r a m arketing
response - or d iversion sa les - between the o f f i c ia l
and magendo markets depending on t h e i r r e l a t i v e pri,
levels In these ta b le s , i t was assumed th e re wouli
an e la s t ic i t y o f s u b s t i tu t io n from magendo to o f f i i
sales of 1.0 above a t r i g g e r p r ic e in June 1986 pr
of UShs 1500 per kg, the upper end o f the magendo
buying range reported by the Coffee M arketing Board
In the macro-economic p r o je c t io n , sce n a r io 2c, th is
reduced to 1.0 above a t r i g g e r p r ic e o f UShs. 1300,
was fe l t that the Coffee Marketing Board estim ate wi
tend to be exaggerated no h ig h e r e l a s t i c i t y than l.(
assured to re f le c t the fa c t t h a t 'o n e - t h i r d o r so of
capturable sales l ie s c lose to b o rd e r in g co u n tr ie s ,
especially Kenya, Rwanda and Z a i re . The zero subst
pattern assumed in the range Shs. 850 - 1300 is the
adequately re f le c t the h ig h e r r i s k (b u t more immedi
cash payment) of magendo market o p e ra t io n s , even un
improved 'law and o r d e r ' .

T A B L E : I
UGANDA COFFEE SECTOR: BASE SITUATION 1986/87 - 1988/87
1986/87 1987/88 1988/89
01 Q2 Q3 Q4 ' Year
1 . U.S $ (Fob. Kampala) 2 . 6 2.5 2.4 2.4 2.4 2.4
'OGQ Tons O f f i c i a l Exports 52.9 24.1 31.3 51.7 160.0 167.0 174.0
3. US $ m 137.5 60.3 75.1 124.1 397.0 400.8 417.6
4. Exchange Rate (U.SHs. per Kg.) 1400 1400 1400 1400 1400 1400
5. Exp.Rev. (USHs.per K g.) 3640 3500 3360 3360 3360 3360
6 . To ta l C o s ts ' (USHs. per K g.) 2330 2330 2330 2330 2330 2330
6.1 T o ta l CMB & Others 756 756 756 756 756 756
6.2 Producer p r ic e 1574 1574 1574 1574 1574 1574
6.2 a (K iboko) (850) (850) (850) (850) (850) (850)
7. Tax Revenue (USHs. per K g . ) 1310 1170 1030 JU)30 1030 1030
8 . To ta l Tax
(B .U S H s .) 69.3 28.2 32.3 53.3 183.0 172.0 179.2

UGANDA COFFEE SECTOR: LEVEL 1 EXCHANGE RATE AND PRODUCER
PRICE ADJUSTMENTS 1986/87 - 1988/89 .
1986/87 1987/88 1988/89
Q1 Q2 Q3 Q4 Year
1 . US $/Kg (Fob Kla) 2 . 6 2.5 2.4 2.4 2.4 2.42 . 1000 Tons
O f f i c a i l E xports 60.0 27.2 35.4 57.8 180.4 187.0 207.7
3. US$ Forex 156.0 6 8 . 0 85.0 138.7 447.7 448.8 498.5
3.1 Gain over base t l8 .5 ♦-7.7 *9.9 + 14.6 +50.7 + 48.0 +80.9
4. Exchange Rate (USHs./U.S .S) 2 0 0 0 2 0 0 0 2 0 0 0 2 0 0 0 2 0 0 0 2 0 0 0
5. Expected Rev. (USHs. /Kg.) 5200 5000 4800 4800 4800 4800
6 . To ta l Costs (USHs./Kg) 3943 3998 4068 4168 4168 4168
6 . 1 CMB & Others 795 850 920 1 0 2 0 1 0 2 0 1 0 2 0
6 . 2 Producers p r ice 3148 3148 3148 3148 3148 3148
6 . 2 a (Kiboko) (1700) (1700) (1700) (1700) (1700) (1700)
7. Tax Revenue
(USHs./Kg.) 1257 1 0 0 2 732 632 632 632
8 Tota l Tax 75.4 27.3 25.9 36.5 165.1 118.2 131.3
9.A d d it io n a l Revenue Required fo r Constant Tota l Tax (B.USHs.)
( - 6 . 1 ) 0 . 0 0 . 0 -13.0 . -130 +53.8 -47,9

UGANDA COFFEE SECTOR: LEVEL 2 EXCHANGE RATE AND PRODUCER PRICE ADJUSTMENTS 1986/ 87 - 1988/ 89
- 8 -T A B L E : I I I
1986/87 1987/88 1988/89
Q1 Q2 Q3 Q4 Year
1 . US$ /Kg. (Fob Kla) 2 . 6 2.5 2.4 2.4 2.4 2.4
2 . 000 TonsO f f i c i a l Exports 69.8 29.9 39.9 60.0 199.5 2 1 0 . 0 258.2
3. US $ m. Forex 181.5 74.8 95.8 144.0 496.0 504.0 621.1
3.1 Gain o f Forex Over Base
>
-44.0 -14.5 -20.7 -19.9 -99 .0i . . .................
-103.2 -203.5
4. Exchange Rate (USHs./US $) 2500 2500 2500 2500 2500 2500
5. Expected Rev. (USHs./Kg.) 6500 6250 6000 6000 6000 6000
6 . To ta l Costs (USHs./Kg)
6.1 CMB & Others6.2 Producer p r ic e 6.2a (K iboko)
4751816
3935(2125)
4846911
3935(2125)
498110463935
(2125)
516712323935
(2125)
516712323935
(2125)
516712323935
(2125)
7. Tax Rev (USHs./Kg) 1749 .1404 1109 833 833 833
8 . To ta l Tax (B .USHs.) 1 2 2 . 1 42.0 44.2 50.0 258.3 174.9 215.6
9. A d d it io n a l Revenue
requi red f o r constant t o t a l Tax (B .U S H s.)
- 52.8 -13.8 -11.9 -3 .3 -75.3 - 2.9 -36.4
0

UGANDA COFFEE 5ECTOK: l l v l l j l a c h a n u l K A 1 t _ M M U I ' K u u u y ^ t . .-v
1986/87 Year 1987/88 1988/89
Q . l Q.2 Q.3 Q.4
1. US$ kg. ( f . o . b . Mombasa) 2 . 6 2.5 2.4 2.4 2.4 2.4
2 . ' 0 0 0 tons o f f i c i a l e xp o rts 76.5 32.8 43.7 65.6 218.5 229.7 292.3
3. US$ m. Forex . 198.9 82.0 104.9 157.4 543.2 551.3 701.5
3.1 Forex , ga in over base *62.4 ♦ 21.7 ♦ 29.8 ♦ 33.3 ♦145.2 ♦150.5 +283.9
4. Exchange Rate (UShs/US$) 3,000 3,000 3,000 3,000 3,000 3,000
5. Expected revenue (UShs/kg) 7,800 7,500 7,200 7,200 7,200 7,200
6 . To ta l costs (UShs/kg) 5,548 5,688 5,898 6,169 6,169 6,169
6.1 CMB plus others 826 966 1 ,176" 1 ,447 1,447 1 ,4476.2 Producer p r ic e 4,722 4,722 4,722 4,722 4,722 4,722
6 . 2 . a (Kiboko) (2,550) (2,550) (2,550) (2,550) (2,550) (2,550)
7. Tax Revenue (UShs/kg) 2,252 1 ,812 1,302 1,031 1,031 1,031
8 . To ta l Tax B. U.Shs. 172.3 59.4 56.9 67.6 356.2 236.8 301.3
9. A d d it io n a l Revenue fo r Constant To ta l 5, t a x . . -103.0 -31.2 -24.6 -14.3 -173.2 -64.8 - 1 2 2 . 1
4

PUBLIC SECTOR INVESTMENT/TA PROJECTS: AGRICULTURAL SECTOR FOREIGN EXCHANGE REQUIREMENTS (USS.M)
T A B L E I A P P E N D I X 3
SUB-SECTOR NO.OFPROJECTS
YEAR PRIORITY 1 PRIORITY 2 PRIORITY 3 PRIORITY 4 TOTAL.SSecured Unsec. Secured Unsec. Secured Unsec. Secured Unsec. Secured Unsec.
1. AGRICULTURE:I n c l . Crops )
Forests ) L iv e s to c k ) F is h e r ie s ) Coops/Mkting)
( a l l AG p ro je c ts )
1986-1989
B a lance
18.57 23.90
17.11
50.81 38.72
32.33 28.81
37.01 35.32
4.03 17.36
20.97 30.75
6.26 8.69
127.35 128.68
44.13 70.46
2. RURAL TRANSPORT:
(TRs 16, 33, 34) 3
1986-1989
B a l ance
11.26
19.80
>
- 11.26
19.80
3. AGRIC. PLANNING:
(PAs 1, 2, 3) 3
1986 - 1989
B a lance
0.80 3.97
0.16
- - 0.80 3.97
0.16
T O T A L S : 64 1986-1989
B a lance
19.37 39.13
37.07
50.81 38.72
32.33 28.81
37.01 35.32
4.03 17.36
20.97 30.75
6.26 8.69
128.15 143.91
44 .13 90.42
NOTE: PRIORITIES 1 and 2 should go ahead; 3 would m e r jt funding by ye a r 3; 4 should be re a l lo c a te d to o the r p r o je c ts .

T A B L E 11(Contd. ) 2
P r i o r i t y
(1 -3 )
Sub -Sector and P ro je c t
1986/87 ( in c lu d in g
1985/86 a l lo c a t io n assumed to beu n d e rs p e n t)
1987/88 1988/89 Balance o f P ro je c t a f t e r J u l y 1989
T O
Secured
T A L
Unsec.
2 AG 24* O i ls e e d s Development S 2.5 1.9 1 . 2 - 5.6 -
1 AG 25* Cocoa DevelopmentU/SS 0.1 U/S 0.2 1.8 0.2
- 0.1 ‘ 2 . 1
1 AG 27 Cotton P roduction SU/S 2 . 0 2.7 3.5
8.3
3
2
AG 34* Maize Development
AG 35* In te g ra te d A g r ic u l t u r e
SU/S 0.2
SU/S 0.1
0.7 ‘
0 . 6
1,1
0.5
-2.0
1 . 1
2 AG 3 6 * H o r t ic u l tu re -F e a s ib i - l i t y & Marketing Research
S 0.1
U/S 0.9 -
0 . 1 0.9
2
1
AG 37* P la n t P ro te c t io n and Quarantine S e rv ice
AG 38* In te g ra te d Rural
s
U/S 1.1 0.9 2.5
4.5
1.5Development (N.W.Uganda) SI U/S 0.8 0.8 -
2 AG 39 In te g ra te d Rural Devele ment (W.Uganda)
p - sU/S 0.8 0.8 -
1 . 5
3 AG 40* Wheat and B a r ley Development
sU/S 0.5 -
0.5
2 AG 55* Cereals and Rootsf o r In d u s t r y - Serere Research
S 0.1
U/S
0.1 N /S
N/S
0 . 2
Y
N/S

P r io r i ty (1 -3 )
Sub -Sector and P ro je c t
1986/87 ( in c lu d in g
1985/86 a l lo c a t io n assumed to be underspent)
1987/88 1988/89 Balance o f P ro je c t a f t e r J u l y 1989
T 0
Secured
T A L
Unsec
2 AG 57 Potato P ro je c t SU/S 0 . 6 0.5 0 . 8
- 2 . 0
S u b -T o ta l ; Crop P rodu ction : S 29.1 U/S 4.7
27.227.2
20.723.6
13.344.6 90.3 99.9
FORESTS:3 AG 11 F o re s t In v e n to ry S
U/S 1.0
>
0 . 6- -
1.52 AG 26* F o re s t r y f o r Rural
Communi t ie sSU/S 0.2 0 . 2 0.3 0.3
- 1 . 0
2 AG 42 P e r i -u rb a n Fuelwood
SU/S 0.7 0.3 0 . 2 0 . 1
- 1 . 2
2 AG 44* Regeneration of Natural Forests
SU/S 0.2 0 . 1 0 . 1 _ - 1
0.4
2 AG 45* A f fo re s ta t io n SU/S 0.4 0.3 0 . 1 0 . 1
- 1 .0
2 AG 59* F o re s try Research SU/S 0.7 0.4 - - 1.1
S u b -T o ta l : F o re s ts : SU/S 2.5 2 . 2 1 . 1 0.5
- 6 . 2
LIVESTOCK:
1 AG 12 L ives tock Disease Control
S 3.0 U/S 1.1
2 . 0
1 . 1
1 . 12 . 6 2.7
6 . 16 . 1 7.5
2 AG 13* D a iry In d u s try S 3.2 U/S 4.8
2 . 2
5.30 . 1
6.5 9.3V
5.55.5 25.9

T A B L E 11(Contd.)4
P r i o r i t y0 - 3 )
Sub -Sector and P ro je c t
1986/87 in c lu d in g 1985/86 a l l o c a t i on assumed to be underspent)
1987/88 1988/89 Balance o f P ro je c t a f t e r J u l y 1989
TOSecured j
TAL Unsec.
3 AG 14* V a l le y Tank/ S - - - - - 4.8Bush C le a r in g U n it U/S - 1.5 1 . 8 1.5
3 AG 28 L ive s to c k S - - - - - 2.3M arkets, e tc . U/S - 0.9 0 . 8 0 . 6
2 AG 29* Beekeeping S 0 . 2 0 . 1 - - 0.3 0.3U/S - 0.3 - -
3 AG 31* Tsetse and s - 0 . 2 . - - 0 . 2 2 . 0
Tryanosom iasis U/S - 1.3 0.3 0.4C ontro l
3 AG 32* Animal Health s 0.5 0.5 - - 1 . 0 4.0Research Centre U/S 1.4 1 . 0 1 . 6 -
3 AG 33* V e t e r in a r y and s - - - - - 2 . 2
F is h e r ie s T ra in in gIn s t i t u t i o n s U/S - 1 . 0 1 . 0 o ro
1 AG 52 Ass is ta n ce to s - - - - - 0 . 2
Hides and Skins U/S - 0 . 2 - -
3 AG 58* In te g ra te dF is h e r ie s and s - - - - - 7.4P o u l t r y P ro je c ts U/S 3.6 1.7 2 . 1 ' -
S u b -T o ta l : L ive s to ck s 6.9 5.0 1 . 2 _
U/S 10.9 14.3 16.7 14.7 13.1 56.6
FISHERIES:3 AG 46* Acquacu ltu re s _ - - _ 7 7
U/S 0.4 0.5 1 .3 1 . 1j # j
3 AG 47* Fish Stock s 0.9 0.4 0 . 1 _
In ve n to ry U/S 0 . 2 0 . 6 2.2 1 . 0 1 .4 4.0
y

8. A medium-term macro-economic model o f the Uganda c o ffe e
sector is set out at Appendix 1. Data is m iss in g o r un re li
f o r many o f the id e n t i f ie d v a r ia b le s , so th a t i t would not
possib le to construct a computable model a t t h is s ta ge .
Nevertheless, the attempt to con cep tu a lise the key exogenoy
state and p o l ic y variab les and the o v e r a l l p a t te rn o f
in te r -a c t io n has provided a usefu l framework, in t h a t i t al
the more fragmented e xp lo ra t io n o f a s m a l le r number o f vari
to be undertaken with g re a te r confidence th a t the r e s u l t s
can be c o r re c t ly in te rp re ted . v The mothodology o f the cof
study is described in Appendix 2.
9. Of the large number o f va r ia b le s i d e n t i f i e d in the model a!
being of potentia l s ig n if ic a n c e in e x p la in in g the behaviour
o f the coffee sector, the fo l lo w in g were g iven p a r t i c u la r
a ttention in the i n i t i a l p o l ic y a n a ly s is :
( i ) Exogenous va r iab les :
In te rn a t io n a l c o f fe e p r ic e s
Border s ta te s producer p r ic e s
Age s t ru c tu re o f p la n ted coffee
( i i ) Pol ic y va r ia b le s :
O f f i c i a l exchange ra te s
O f f i c i a l producer p r ic e s
O f f i c i a l a c t io n a g a in s t i l l e g a l marketing a c t i v i t y
R e h a b i l i ta t io n o f the 'Luwero Tf
( i i i ) Target variables:
Coffee p rodu ction
Marketed sa les in o f f i c i a l chanr
Fore ign exchange earn ings
Government tax revenues
Coffee g row ers ' monetary income!

Coffee grow ers ' rea l incomes
Rate o f domestic in f la t io n
10. The main r e s u l t s o f the c o ffe e s tu dy may be summarised as follows:
( i ) The c o f fe e crop dominates e x p o r ts . Informed observers
estim ate th a t 40-60,000 tons are smuggled annually,
re p re s e n t in g a m ajor lo s s o f c r i t i c a l l y needed foreign
exchange. Remedial a c t io n s in c lu d e :
t ig h te n in g s e c u r i t y checks on the borders,
d ism is s in g c o r ru p t o f f i c i a l s , moral and p o l i t ica l
e x h o r ta t io n , and removal o f n on -p r ice constraints
mentioned above;
the maintenance o f and, i f p o s s ib le , improvement
in the p rodu cers ' terms o f t ra d e . Producer prices
-a must not be eroded by i n f l a t i o n . A ls o , since
more can be done to ra is e y i e l d through weeding,
p ru n in g , in s e c t c o n t ro l e t c . , a h igher real price
can induce a sup p ly response even in as short
a time as 4-6 months. The tem ptation to sell
on the u n o f f i c ia l market i s a lso greater the
h ig h e r the d i f f e r e n t i a l between p rices in the
two m arkets. T h is may r e f l e c t the gap between
o f f i c i a l and u n o f f i c ia l exchange ra tes , as at
p re s e n t , o r the c ro s s -b o rd e r real p rice d ifferentia l
i . e . the com parative domestic terms of trade
f o r co f fe e producers .
( i i ) The le v e l o f Uganda's co f fe e quota may also become
a problem in the near fu tu re as the quota to l i s t a
c o u n t r y 's ( c u r r e n t l y 23 m i l l i o n bags) has been reduced.
Government should use e ve ry argument to have i ts quota
res to red to pre-Am in le v e ls as o f f i c i a l purchases and
stocks in c re a se .
( i i i ) A system o f open a u c t io n s a le s , s im i la r to t h a t which
is s e rv in g Kenya w e l l , should be introduced.

GENERAL PROBLEMS
11 There are a series o f major problems which have depressed
the output and o f f i c i a l l y marketed sa les o f Uganda's main
cash crops in recent years.
poor incentives, i . e . low producer p r ic e s r e l a t i v e tc
those o f goods purchased by the producer
smuggling
inadequate tra n sp orta t ion equipment and poor roads
problems with the a v a i l a b i l i t y , q u a l i t y and timelines o f production inputs
creeping marketing margins
unreliab le power s u p p l ie s .
Each o f these needs addressing u rg e n t ly i f the s i t u a t io n is
to improve.
12. COTTON
I t is techn ica lly and econom ically fe a s ib le to ra is e cotton
output s ig n i f ic a n t ly , from the c u rre n t o f f i c i a l f i g u r e o f
60,000 to as hi} h as 350,000 bales by 1990. T h is w i l l requ'
ra is ing the producer p r ic e e i t h e r to the market exchange rate level o r to some in te rm e d ia te le v e l
clearing the backlog o f u n c o l le c te d and unginnedcotton
removing the purchasing monopoly o f co o p e ra t ive unios which fa i l to c lea r o ld seed co tton by the beginning of the 1987/88 season, and
exploring the advantages o f v e r t i c a l l in k a g e s from t’ lint-consuming domestic t e x t i l e in d u s t r y to the grows
(c f . the support once provided to Uganda growers by the Lancashire T e x t i le In d u s t r y ) ; the o f f e r o f BCGC! advise in th is area should be accepted.

13. Th is commodity can be r a p id l y increased (estim ated feasible
increase is from around 3000 to 175000 tons by 1990), as the
crop is in the ground, in the form o f overgrown bushes
which can be brought back in t o p ro d u c t io n w i th in the year.
A s i g n i f i c a n t rea l p r ic e increa se i s needed, as fo r cotton.
In a d d it io n to r e l i e v i n g the genera l c o n s t r a in t s , structural
r e -o r g a n iz a t io n o f the key a u t h o r i t i e s - UTA and UTGC - is
overdue. T h is should g iv e more c o n t ro l over t h e i r industry
and, w h i le removing the m arketing nonopoly held by UTA,
enhance i t s c a p a c i ty to se rve the in d u s t r y 's needs.
14. SUGAR' TOBACCO AND OILSEEDS
These a c t i v i t i e s are d iscussed in the in d u s t r ia l sector
r e p o r t , a lthough se ve ra l p ro d u c t io n aspects o f sugar and o il
seeds are l e f t to the o f f i c i a l a g r i c u l t u r a l agencies. In
the case o f suga r, very se r io u s fo re ig n exchange consuming
de lays in r e s to r in g ou tp u t have occured a t the Kinyala and
Kakira p la n ta t io n s . The fo rm er should be placed under
an experienced managing a g e n t , as recommended by the Bank of
Uganda. In the c a s e .o f K a k ira , tenders f o r the factory
re c o n s t ru c t io n have been re c e iv e d . The government should
e n te r d isc u s s io n s concern ing the p ro p o r t io n o f capacity which
is to be produced by smal1 -h o id e rs on a sett lem ent or
outgrow er form o f p ro d u c t io n ( c f . Kenya, Sw aziland). Oilseeds
production has s u f fe re d from n o n - a v a i l a b i l i t y o f new seeds
v a r i e t i e s , low p r ic e s and lack o f a c t i v i t y by the Lint
Marketing Board in r e a c t i v a t in g i t s ten acquired o i l and
soap works. These problems should be reso lved rap id ly .
STRUCTURAL REFORM OF PRODUCTION:
REORGANIZATION ON A VERTICALLY-INTEGRATED BASIS
15. I t is c le a r th a t small h o ld e rs ' c u r re n t production d iff icu lt ies
can be overcome most r a p id l y where there is a strong vertical
l in ka ge from the a g r o - in d u s t r ia l e n d -u se r to the producer.

T h is system is working e f f e c t i v e l y f o r tobacco g row ers .
I t is proposed th a t studies be i n i t i a t e d in w e d ia te ly to
examine scope fo r ve rt ica l in t e g r a t io n in the f o l lo w in g
areas:•Cotton- A Uganda t e x t i l e f i r m consortium to take ot
^ ¡ T f i n a n c i a l and tech n ica l r e s p o n s i b i l i t i e s f o r
p r o d u c t io n and primary p rocess ing excep t where coope,
unions are operating e f f i c i e n t l y .
Oilseeds: A Ugandan o i l , soap and animal feeds paras
"(but noTthe LMB in view o f i t s past i n a c t i v i t y ) to t
. over financial and techn ica l r e s p o n s ib l i t i e s f o r oil
production and primary p rocess ing ( i . e . g roun dn uts , ;
castor, sesame, but not co tton se e d ). The proposed
investment project AG-24 (see ta b le I I a t Appervdix 3
should be redesigned a c c o r d in g ly ) .
Cocoa: An international m anufacturing f i r m to be ap:
on a managing agent basis to r e v i t a l i z e Uganda's emb
cocoa industry. P ro je c t AG-25 should be redesigned,
necessary.
Hides and Skins: The case f o r ULATI ta k in g a major
in the improvement o f hides and sk ins m arketing incl
in i t ia l preparation, should be examined, w ith the
implications for p ro je c ts AG-12 and AG-52 assessed
accordingly.
16. Complementary changes w i l l be re q u ire d , i f these proposed
reforms are acceptea, in the ro le and fu n c t io n s o f the
agricultural and livestock extension s e r v ic e . These shouli
in general, concentrate on applied fa rm - le v e l research and
on the more perishable and h ig h e r -v a lu e food crops .
STRENGTHENING AGRICULTURAL PLANNING AND DECISION-MAKING CAPABILj
17. A technical assistance p ro ject to a s s is t the p lann ing units
divisions in the Ministries o f A g r i c u l t u r e , Animal Industrj

T A B L E 11(Contd. )5
Priori ty (1-3)
1 Sub-Sector and Project
1986/87 ( in c lu d i ng 1985/86
a l lo c a t io n assumed to be underspent)
1987/88 1988/89 Balance of Project after July 1989
TOSecured
TALUnsecured
1 Aj 51 China/Uganda J o in t Venture
( L . V i c t o r i a F is h e r ie
S 0.2
s)U/S -
—
_
0.2 -
S u b -T o ta l : F is h e r ie s S 1.1 U/S 0.6
0.41 , 1
0 . 1
3.5 2 . 11 . 6 7.3
MARKETING AND COOPERATIVES:
2 /C 03 Cotton G inneries S 3.9 U/S 0.5
3.90 . 8
3.71 . 0
-11.5 2.3
1 /£ 19 UTCU Workshop SU/S - 0 . 8 0.8 1.5
- 3.0
2 /£ 20 Prim ary Coo p e ra t ive s F a c i l i t i e s
SU/S - 1.9 1 . 6
- - 3.5
3 AG 21 Central Storage Project
S 0.8 U/S -
0.5 “ 1.3"
3 A G 53 Agricultural Finance Agency
S 0.3 U/S 0.6 -
- 0.3 0 . 6
Sub-Total:Marketi ng and C o -ope ra t ives
S 5.0 U/S 1.1
4.43.5
3.73.4 1.5 13.1 9.4
RURAL COMMUNICATIONS:
1 TR 16 Rural Feeder Roads M aintenance Uni ts
S
U/S - 2.2 2.2 15.4
- 19.8

This system is working e f f e c t i v e l y f o r tobacco g row ers .
I t is proposed that studies be i n i t i a t e d im m ediate ly to
examine scope fo r v e r t ic a l in t e g r a t io n in the f o l lo w in g
areas:
Cotton: A Uganda t e x t i l e f i r m consortium to take 01
m ajorT in an c ia l and te ch n ica l r e s p o n s i b i l i t i e s fo r
production and primary p rocess ing except where coope
unions are operating e f f i c i e n t l y .
Oilseeds: A Ugandan o i l , soap and animal feeds para
(but not the LMB in view o f i t s past i n a c t i v i t y ) to
over financia l and tech n ica l r e s p o n s ib l i t i e s f o r oi
production and primary p rocess in g ( i . e . groundnuts,
castor, sesame, but not co tton seed ). The proposed
investment p ro ject AG-24 (see ta b le I I a t Appendix 3
should be redesigned a c c o r d in g l y ) .
Cocoa: An in te rn a t io n a l m anufacturing f i r m to be a;
on a managing agent basis to r e v i t a l i z e Uganda's emt
cocoa industry. P ro je c t AG-25 should be redesigned
necessary.
Hides and Skins: The case f o r ULATI ta k in g a majo1
in the improvement o f hides and sk ins m arketing inc
in i t i a l preparation, should be examined, w i th the
implications fo r p ro je c ts AG-12 and AG-52 assessed
accordingly.
16. Complementary changes w i l l be re q u ire d , i f these proposed
reforms are accepted, in the ro le and fu n c t io n s o f the
agr icu ltura l and lives tock e xten s ion s e r v ic e . These shoul
in general, concentrate on ap p lied fa rm - le v e l research and
on the more perishable and h ig h e r -v a lu e food c rops .
STRENGTHENING AGRICULTURAL PLANNING AND DECISION-MAKING CAPABIjJ
17. A technical assistance p ro je c t to a s s is t the p lann ing unit
d iv is ions in the M in is tr ie s o f A g r i c u l t u r e , Animal Indust'

T A B L E I K C o n t d . )
Priority(1 -3 )
Sub-Sector and Project
1986/87 (including 1985/86
a l lo c a t io n assumed to be underspent)
1987/88 1988/89 Balance of Project after July 1989 70Secured
TALUnsecured
1 AG 51 China/Uganda S 0 . 2 - - -0 . 2
J o i n t Venture( L . V i c t o r i a F is h e r ie s )U/S - - - -
S u b -T o ta l : F is h e r ie s S 1 . 1 0.4 0 . 1 -1 6 7 3
U/S 0 . 6 1 , 1 3.5 2 . 1
MARKETING ANDCOOPERATIVES:
2 £ 03 Cotton G inneries S 3.9 3.9 3.7 -U/S 0.5 0 . 8 1 . 0 - 11.5 2.3
1 19 UTCU Workshop s - - - -3 0
U/S - 0 . 8 0 . 8 1.5
2 /£ 20 Prim ary Coop e ra t ive s S - - - - - 3.5
F a c i l i t i e s U/S - 1.9 1 .6 -
3 A G 21 Centra l Storage s 0 . 8 0.5 - - 1.3 -P ro je c t U/S - - - -
3 A G 53 A g r ic u l t u r a lFi nance s 0.3 - - - 0.3 0.6
Agency U/S 0 . 6 - - -
S u b -To ta l :M a rke t i ng s 5.0 4.4 3.7 - 13 1 9.4and C o -ope ra t ives U/S 1 . 1 3.5 3.4 1 .5
RURAL COMMUNICATIONS:
1 TR 16 Rural Feeder S - - - - 19.8Roads M aintenanceUni ts U/S 2 . 2 2 . 2 15.4
y

P r i o r i t y S ub -S e cto r and 1986/87 1987/88 1988/89 Balance o f P r o je c t TOTAL(1 -3 ) P ro je c t in c lu d in g a f t e r J u l y 1989 Secured Unsec
1985/86a l lo c a t io nassumed to beunderspent)
1 TR 33 R e h a b i l i t a t io n o f SF e r r ie s U/S - 1.5 0.3 - 1 .8
1 TR 34 C o n s tru c t io n and S _ • _ n a
Repair o f Bridges U/S - 2.4 2 . 6 4.4 y . 4
1 S u b -T o ta l : RuralI Communicatior S - - - _ - j 31.0
U/S - 6 . 1 5.1 19.8 1i1AGRICULTURAL PLANNING
H-------ii
AND MANAGEMENT: 111
1 PA 01 S trengthen ing !A g r ic u l t u r a l P lanning S 0.5 0 . 2 -Serv ices U/S 1.1 0.7 0 . 6 0 . 8 2 . 4
1 PA 02 Strengthen ing S - - - - 1 3F is h e r ie s Develop
ment U/S 0.9 0.3 0 . 1 -
1 PA 03 Cooperative T r a in S - - - - 0.5ing U/S - 0 . 1 0.3 0 . 2
Sub-Tota l - .A g r ic u ltu ra l S 0.5 0 . 2 - -0 . 8 4.2
Planning & Management U/S 2 . 0 1 . 1 1 .0 0 . 2
FUNDS SECURED
Tota l AG P ro je c ts 42.1 37.0 25.7 13.3 118.1
Tota l TR and PA P ro je c ts 0.5 0 . 2 - - 0 . 8
Combined T o t a l : 42.6 37.2 25.7 13.3 118.9
i -_ _ _ _ _ _ _ _ _

T A B L E I I ( C o n t d . )
Sub-Sector and Project
1
1986/87 (i ncludi ng
1985/86 allocation assumed to be underspent)
1987/88 1988/89 Balance of after July
Project1989
1
FUNDS UNSECURED
To ta l AG P ro je c ts 19.8 48.3 48.3 63.4 179.4
To ta l TR and PA P ro je c ts 2 . 0 7.2 6.1 2 0 . 0 35.2
Combined T o t a l : 2 1 . 8 55.5 54.4 83.4 214.6
SOURCE: R epublic o f Uganda (1985) Investm ent Plan f o r Recovery and Development1985/86-1989/90 - Kampala. M in is t r y o f P lann ing and Economic Development.
NOTES: 1 Rows and Columns may not sum due to rounding .
2 . * in d ic a te s a proposal >that the p r o je c t design be reappra ised to ensure a g re a te rimpact on immediate development o b je c t i v e s ; see T e x t f o r d is c u s s io n .
3. S z. Funding secured; U/S =, Funding unsecured.
4. Consequential re c u rre n t fo re ig n exchange expend itu re has been added to the estimates o f unsecured funds re q u ire d .
r

Sub-Sector P ro je c t T i t l e Funding(US$mi ----------- -) A 1 t e r n a t iv e (s ) t
considered
C>rop Production: A G 05 Manufacture of Equipment fo r small farms A G 09 A g r ic u ltu ra l
Research
S - U/S SU/S
4.29.5
Divestment to J o in t 11
o r p r i v a t i s a t i o n . Refocus on (a ) Search and d ia g n o s is (b ) on- t r i a l s/demonstrations
AG 41 Prisoners Rehabilita t io n Farms
SU/S 11.5 A u to - in ve s tm e n t and j
f in a n c ia l c o n t r o l .
F o r e s t s : AG 43 Pulp and Paper P lantations
SU/S 1.0
Examine (a ) land-use p r i o r i t i e s (b ) regiof t ra d e p o s s i b i l i t i e s .
L iv e s to c k : AG 16 R ehab il ita t ion of Beef Industry
AG 17 R ehab il ita tion of Pou ltry Industry
sU/S
sU/S
7.117.7
5.0
Commercial le n d in g t and p a ra s ta ta l ranch! d ivestm ent o f Minist- ra n ch e s .Commercial len d in g t in t e n s iv e en terp r ise
AG 18 R ehab ilita tion of Pig Industry
sU/S 1 . 2
Commercial le n d in g t in t e n s iv e enterprise
AG 30 Commercial Livestock F ac i1i t ie s
sU/S 4.9
U t i l i s e s e l f - h e l p an f o r p h y s ic a l in fra s t rehabi 1 i tation/const
AG 56 Small Ruminants Development
sU/S 1.4
Examine reasons for in Kenya and possibl e n t e r p r is e .
F is h e r ie s : AG 15 Provision of F ishing Inputs
sU/S
10.915.2
Replace departmentc a c t i v i t y by (a ) conr d i s t r i b u t i o n (b ) coc and commercial cred:
AG 48 Fish MarketingStudy
SU/S 0.03
Refocus on in fo rm a l s e rv ic e s and communi
A G 49 Mechanised Fisheries Tra in ing
sU/S 0.3
T ra n s fe r responsibi to commercial distri
A G 50 Fisheries Dams sU/S 0.1
U t i l i s e s e l f - h e lp ar f o r r e h a b i l i t a t i n g ! i n f r a s t r u c t u r e .
Marketing and C oope ra t ives :
A G 54 Mechani sedCharcoal Briquettes
sU/S 0.9
Examine (a ) value o' husks as f e r t i l i s e r charcoa l (b ) auto-if by h u l l e r i e s _
T O T A L : 14 Projects s 27.5
-----------------u/s
> * u/s63.490.9
..

I
T H E C O F F E E I N D U S T R Y

, , u . ; o f f e e I n d u s t r y i n t h e c o n t e x t o f Mar . . e c on o . , u
A d j u s t i i K M i t and l o n g e r t o n . i r o w t '
C o f f e e i s t h e c o m m a n d i n g h e i g h t s i n d u s t r y i n U g a n d c s e c o n o m y . I t i s
a l m o s t t h e e x c l u s i v e s o u r c e o f t h e c o u n t r y ' s f o r e i g n e x c h a n g e and the
c o f f e e e x p o r t d u t y c o n s t i t u t e s a b o u t 40% o f t h e G o v e r n m e n t s t o t a l annual
r e v e n u e ( s e e t a b l e 1 ) . I t i s a l s o an i m p o r t a n t s o u r c e o f i ncome f o r a
w i d e s e c t i o n o f t h e p o p u l a t i o n . C o f f e e p r i c i n g a n d m a r k e t i n g arrangements
m u s t t h e r e f o r e be c a r e f u l l y f a s h i o n e d i n o r d e r t o a v o i d n e g a t i v e e f f e c t s
on D r o d u c t i o n , e x p o r t e a r n i n g s , g o v e r n m e n t r e v e n u e a n d i n c om e
d i s t r i b u t i o n .
iIn the Dast, price policy has aimed at :
1. Stabilizing producer prices and incomes
2. Maintaining production at levels within the quota fixed by the
International Coffee Organization (ICO)
3. Diversifying domestic export, and non-export agricultural
production
4. Maximizing coffee export proceeds
5. M a x i m i z i n g c o f f e e d u t y r e v e n u e s
6 . R e d i s t r i b u t i n g i n t e r - p e r s o n a 1 a n d i n t e r - r e g i o n a l i ncomes.
T h e s e o b j e c t i v e s a r e o f t e n i n c o n f l i c t a n d d i f f e r e n t p e r i o d s req u i r e
d i f f e r e n t e m p h a s i s o f e a c h o f t h e o b j e c t i v e s . I n t h e l a t e 1940's and the
1 )S0 s , t h e f i r s t g o a l was o f m a i n i m p o r t a n c e a n d i t was pursued through
t h e e s t a b l i s h m e n t o f t h e P r i c e A s s i s t a n c e F u n d w h i c h was used to
m u . l d i z c p r o d u c e r p r i c e s and i n c o m e s d u r i n g t h e l e a n y e a r s .

In the 1 9 6 0 ' s , a f t e r the estab l is hme nt o f t h e ¡ C 0 , and w i t h Independent
go als two, t h r e e and s i x pr e -occu pie d c o f f e e p r i c e p o l i c y . The import,
of c o f f e e as a source o f government revenue and e x p o r t e a r n i n g s rose a,
’ that of cotton production declined (see table 1). In the 1970's and
1980's, the need to maximize export earnings and government revenue f„
the coffee industry has been obvious given the collapse of the rest of
Uganda's agricultural export sector as well as its industrial sector.
These goals ought to continue to command the attention of government ii
current macroeconomic stabilization phase.
A look at Uganda's coffee price p o l ic y revea ls th a t d u ring the 1960's
1970's, the producer was taken fo r granted. He received less than 30!
o f the coffee d o l la r in the 1970's . His share was below 5% in 1975/76
and below 15% in the 1973/74 and 1977/78 (see ta b le 2 ) . The domestic
coffee earnings are c losely t ied to the exchange ra te . Cons idering tí
the Uganda s h i l l in g was grossly overvalued in the 1970's , the coffee
producer received even much lower shares of the export proceeds at ths
shadow and black market exchange rates. This somewhat affected coffee
production and export volumes though not very significantly (see table
Coffee prices were raised in 1979/80 and thereafter, explicitly fort'
purpose O: stimulating production. The massive d e v a l u a t i o n of the Uo.;
shilling in 1982 largely helped this process. Producer prices rose f
Shs. 2.86 per kg in 1977/78 to Shs. 15.40 in 1979/80 and Shs. 70.00'
1981/82. They rose further to Shs. 330.00 and Shs. 484.00 in 1 983 an
98¿ respectively?

1 , 1 ,l(; 1 : Relative Im portance o f E x p o r t C r o p s i n G o v e r n m e n t Rnve„ uc
and Export Earnings.
Export D u t y a s a o f E x p o r t E a r n i n g s as 0f , e a r and C r o p r ^ w n m m e n t R e v e n u e . t o t a l
1954
C o f f e eC o t t o nTeaTobacco
1958
CoffeeCottonTeaTobacco
1960
CoffeeCottonTeaTobacco
1965
CoffeeCottonTeaTobacco
1969
CoffeeCottonTeaTobacco
1979
CoffeeCottonT eaT o b a c c o
1980
C o f f e eCottonTeaT o b a c c o
1982
C o f f e eC o t t o nT eaT o b a c c o
J983C o f f e eCot tonT e a
Tobacco■' n*! r. •
9.2 33.21 6 .7 51.5
- 2.31 .4
18.0 45.9
1 1 . 0 40 .0- 2.2
1 .4
8.3 40.8
1 1 . 2 35.9- 3.5
1.23"
14.7 48 .0
3.9 27.0- 4.0
0.4 4.0
■>
10.3 54.0
3.7 17.0- 6.0
36.4 97.0- 1.4- 3.4
1.1
39.1 96-0- 1.2- 0.9~ 0.9
34.1 98-0- 1.9- 0.3 .-
3 7 . 9 9 2 , 2
- 3 . 1nJ j . : l
- 1 • 41 A h c t ,*i r ♦ r \ • J I * i • * • ...... i r , o O t o i W n M ' -

Tab le 2: WORLD ANO DQMEST IC _PRICES_ OF COFFEE FOR SELECTED YEAKS.
RealProducers
] U iHs 7 K 2 j
World P r i c e at
Year
Normi na 1 Pri ces ii /Kg
Pr i ces O f f i c i a l Exchange Rate U q .SH s ./Kq .
1 as a. " of ]
1945/46
U . jnb . / •
.36 0.30 1.16 26!
1951/52 1.10 1.10 6 .26 18)
1953/54 2.20 2.20 6 . 4 8 34"
1955/56 1.65 1.65 5 . 40 31!
1957/58 1.80 1.80 5. 14 35!
1959/60 1.40 1.40 4 . 2 2 33!
1961/62 1.40 1.10 2 . 7 0 52!
1963/64 1.05 1.05 3. 74 28:
1965/66 0.95 . 0.95 5 .12 19!
1967/68 0.95 0.90 ” •
1969/70 0.90 0.90 - -
1971/72 - - 7 .38 -
1973/74 1.10 0.40 9 .08 12!
1975/76 1.20 0.50 36 .15 3!
1977/78 2.60 0.30 21.38 12!
1979/80 15.20 0.35 19 .88 76!
1981/82 70.00 1.10 , 2 24 .8 31!
1983/84 330.00 2.20 607 .2 54:
Note: The period 1950-70 is assumed to be one of stable prices.Thereafter the Nominal prices are deflected using the official GDP Deflection, 1966 = 100
Source: Uganda: Statistical Abstracts, Background to the budgets.
Report of the Committee of Iquiry into the coffee Industry 1967 p.g. 3
I C 0: Quarterly Statistical Bulletine.

T ci b 1 e 3m a r k e t e d p r o d u c t i o n a n d o f f i c i a l c o f f e e e x p o r t s
( ’ OOO T o n n e s )
Year Marketed Production Export '
1945/46 28 24
1947/48 24 33
1949/50 24 29
1951/52 43 34
1953/54 36 27
1955/56 75 48
1957/58 86 65
1969/60 90 95
1961/62 105 119
1963/64 162 172
1965/66 152 152
1967/68 158 166
1969/70 229 ' 247
1971/72 176 175
1973/74 214 214
1975/76* 199 198
1977/78* 156 206
1979/80* 103 132
1981/82 98 128
1983/84 143 144
I ume
Includes estimates of smuggled coffee by the Coffee Marketing
Board put at 30, 60 and 18 metric tonnes respectively.
The G e o g r a p h i c a l Income o f Uganda 1950-56
Uganda Background t o t h e b u d g e t s ( v a r i o u s is su es )
I CO : Q u a r t e r l y S t a t i s t i c a l B u l l e t i n .

, l H (-f f t ?c ts on P r o d u c t i o n P r i c e P o 1i c y and j t s w .
r * f 0p Market ing Board acts as a m o n o p s o n i s t and Assuming that the Coffee Market _
♦ « t ai revenue from e x p o r t s , i t w o u ld f i x d o m e s t i c t r i e s t o maximize total
price at the minimum level needed to ob ta in the supp ly i t re q u ire s to
f u l f i l the quota. The Marketing Board here would face the problem of
d is t in gu ish in g between short run and long run ou tp u t requ irem ents . »
that the quota system is not always o p e ra t ive (1973-80 and a f t e r 19851
and also given that the quota is not always con s ta n t and th a t a countr
can make sales to non-ICO members, the Board cannot e a s i l y determine
the optimal short and long run supply requirem ents.
<

7
F i g u r e s I and I I g i v e h y p o t h e t i c a l s h o r t a nd l o n g - r u n supply curves of
c o f f e e i n U g a n d a b a s e d on an e x a m i n a t i o n o f t h e p n c e arid o u t p u t data since
t h e 1940s. An increase in the domestic price of c o f f e e will increase out
put in the short run by a small or a big amount, depending on the previous
price, the amount of crop neglect and the extent of p o o r harvesting tha t
was prevailing before the increase. If the price increase reaches a
certain critical level, new planting will take p l a c e in period t]. In period
t£ an increased output will occur with or without maintaining the price
increase. This is illustrated in Figure II which gives the long-run supply
curve. This position is verified by historical data. Once the coffee trees
cire in the ground, it takes little additional Investment to maintain produ
ction and so output tends to go up even when nominal or real prices are
falling. In Uganda explicit costs of production are usually low and as
long as the producer price covers these and leaves a cash margin for the
producer to pay for school fees, medical expenses and buy essentials like
clothing, sugar, salt etc., he will continue to increase output in the
short run. ' If prices however fall below a critical minimum in comparative
t e r m s to other s o u r c e s of cash incomes as well as t o other commodities which
the p r o d u c e r purchases, the producer will ignore the coffee shambas and put
in little effort in harvesting. And if marketing and payments arrangements
are poor as has been the case since the 1970s, the p r o d u c e r i s ever
more discouraged from coffee production. He may then switch to product ion
o f o t h e r c r o p s , j o i n f o r m a l and i n f o r m a l e m p l o y m e n t or j u s t remain i d l e ,
e n j o y i n g his l e i s u r e .

(
>*"' Sim* niw..
Dw - World demand for Uganda coffee a t In te rn a t io n a l p r ic e .
Pw - Í - World price of coffee in domestic currency a t theo ff ic ia l exchange ra te .
Blark TOrt6 °f coifee in domestic currency a t the Black market exchange ra te .
« c h a n g o te1 dareslic currency at the shadow
P •£- w
P . Í
P.D * Domestic price paid to growers.
P> Pw = Margin which goes tr> , k...Marketing B o J^ the Bovemnent and the Coffee
i d *
^ ^fnestic price leupithe quota level. lUired to gvt production to
P n d u c T io ,^ ’1-' CUPWf 0 r ^ C i n a l c o s t c u n v lo r C o ffe e
Alternative supply Curve r ( m f
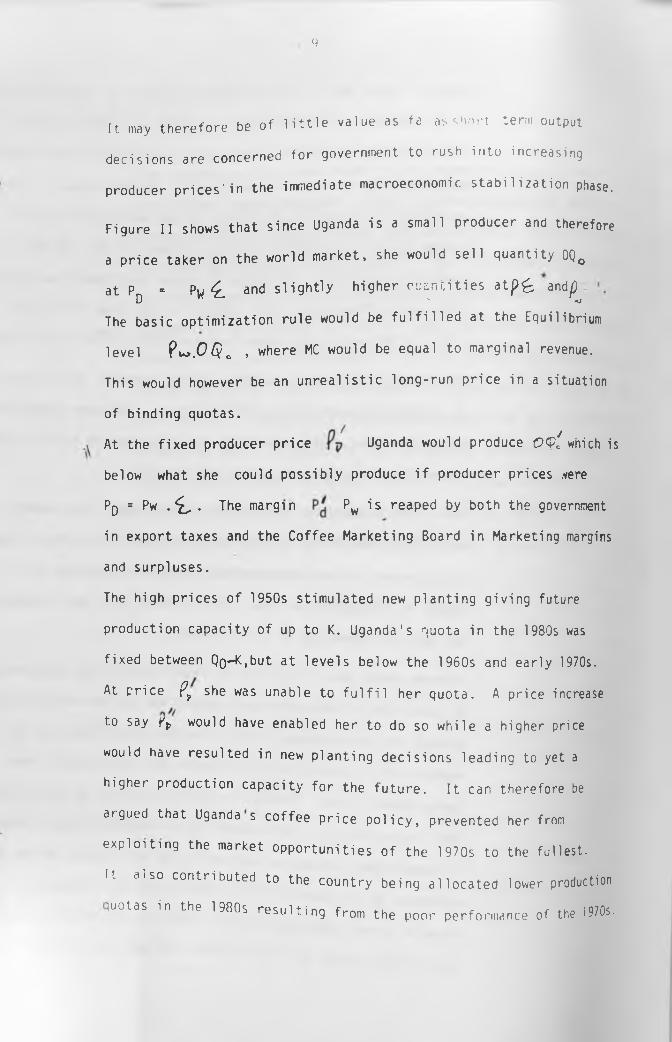
9
It may therefore be of little value as fa as short term output
decisions are concerned for government to rush into increasing
producer p r i c e s ' i n the immediate macroeconomic stabi1ization phase.
F igu re I I shows th a t s ince Uganda is a small p roducer and therefore
a p r ic e ta k e r on the w orld m arket, she would s e l l Q u a n t i ty OQ^
at P = Pw ^ and s l i g h t l y h ig h e r p y a n t i t i e s a t p £ andp D ' aj
The basic o p t im iz a t io n ru le would be f u l f i l l e d at the Equilibrium
le ve l P *>.0§o , where MC would be equal to m arginal revenue.
Th is would however be an u n r e a l i s t i c lo n g - ru n p r ic e in a situation
o f b in d in g quotas.
A t the f i x e d producer p r ic e Uganda would produce 0<$i which is
below what she could p o s s ib ly produce i f p roducer p r ices .vere
PD = Pw • i ' • ^ he mar9in Pw is re a Ped by both the government
in e x p o r t taxes and the Coffee M arketing Board in Marketing margins
and s u rp lu s e s .
The high p r ic e s o f 1950s s t im u la te d new p la n t in g g iv in g future
p rodu ction c a p a c ity o f up to K. Uganda's quota in the 1980s was
f ix e d between Qg~Kf but a t le v e ls below the 1950s and e a r ly 1970s.
At p r ic e Pj, she was unable to f u l f i l her quota . A p r ice increase
to say Yp would have enabled her to do so w h i le a h igher price
would have re s u lte d in new p la n t in g d e c is io n s le a d in g to yet a
h igher p rodu ction c a p a c i ty f o r the f u t u r e . I t can therefore be
argued th a t Uganda s co ffe e p r ic e p o l i c y , prevented her from
e x p lo i t in g the market o p p o r tu n i t ie s o f the 1970s to the fu l les t .
It also contributed to the country being allocated lower production
quotas in the 1 980s resulting from the poor performance of the 1970s.

]()
<
r h in h as 190,000 t o n n e s i n t h e e a r l y 1 9 7 0 s . Uganda's q u o t a was as h i g n
, * nno t onn es i n 1980 a nd s t o o d a t a b o u t I t was r e d u c e d t o 1 2 5 , uuu
• lop -m The supply c o n s t r a in t o f the 1970s150,000 tonnes in 1983/4. me s u w j
,,ninn nnsit ion fo r h ig h e r quotas. R ig h tcomplicated her bargaining posiciu
now there is a shortage of coffee on the w o r ld market which
Uganda could have exploited to the f u l l e s t i f she had the
production capacity. I t should be noted t h a t Uganda has a ls o
sold some coffee to non ICO members to the tune o f 11,160,
7,680, 2,040. and 4,380 tonnes between 1979 t o 1982 r e s p e c t i v e l y .
There is no doubt that a pric ing p o l ic y aimed at e x p lo i t i n g such
an opportun ity would have entailed r i s k s . But many c o u n t r ie s are
taking on these risks constantly and o fte n end up w inn in g h ig h e r
quotas fo r themselves in subsequent p e r io d s .
Ju s t l ik e in the game of the prisoners dilemma, the c o u n try has to
weigh the p ro b a b il i ty of the ICO tak in g p u n i t i v e a c t io n , remaining
s i le n t about her non-quota market sales o r a l l o c a t i n g her a higher
quota in subsequent periods. Since Uganda i s a small p rodu cer, she
may get the advantage of a free r id e r .
Extreme fears about producing at le v e ls beyond the quota would not
be j u s t i f i e d i f the additional production and m arketing costs do no;
exceed the price Uganda obtains from the e x t ra sa les to the non-quol
markets or i f storage costs are below the net b e n e f i t s from future
quota market sales. Production costs estim ates by Coda (1984) show
that the world price far exceeds the p rodu ction c o s ts . To ta l costs
production, processing and marketing f o r Robusta c o f fe e were
t o be Uganda S h i l l i n g 499/53 per K g . compared t o a world
P about Uganda S h i l l i n g s 1 , 2 0 0 / - a t t h e o f f i c i a l e x c h a n g e ra'
and o f o v e r Uganda S h i l l i n g s 2 , 0 0 0 / - a t t h e b l a c k m a r k e t r a t e .
The p roduction costs are given by the value of labour, land
and c a p i ta l inputs employed. Most farmers use own and family
labour and p lo ts acqu ired ye a rs back which e n t a i l im p l ic i t rather
than e x p l i c i t costs to the p ro d u ce r . There i s a ls o l im ited use
o f f e r t i l i z e r s and i n s e c t i c i d e s , though f re e o r r e la t i v e l y
inexpensive lo ca l manure o r c o f fe e husks are o f te n used to boost
output. Most c a p i ta l equipment i s in the form o f hoes and pangas,
though the use o f t r a c t o r s and h e rb ic id e s may ge t to vogue in the
near fu t u r e . The e x p l i c i t c o s ts thus tend to be low in coffee
p rodu ction and i t i s apparent t h a t p roducers have often grown
c o ffe e w ith o u t making economic p r o f i t s . So the costing of
p rodu ction might have h i s t o r i c a l l y helped in a r r i v i n g at a
f a i r producer p r i c e , but m ight n o t have t o ld us much about
actua l p rodu ction response.

In the 1970’s two developments occured which effected and are likely
to affect future coffee production. F i r s t , labour supply fell and
secondly, fan,, wages rose, in the 1950's and 1960's, there was a lot
of migrant labour from Rwanda, Burundi and Kenya and the lo c a l econo,
and labour att itudes allowed workers from Western Uganda to work on f,
in Buganda. The situation changed from the 1960's. U n s k i l le d migra,
labour to Uganda declined as the country ceased to be viewed as more
prosperous by i t s neighbours. On the domestic scene, p o l i t i c a l and
economic changes which have occurred since independence have changed
a tt itudes and the labour flow which used to come from Western Uganda
Buganda has dried up. The Baganda on the o th e r hand d o n 't want to wc
farm labourers. Coda's survey o f 844 farmers in 18 d i s t r i c t s foundt
on ly 36% of the respondents were able to s a t i s f y t h e i r h i re d labour
requirements. Family labour has a lso become le ss s ta b le g ive n the n;
o f the rural-urban migration and the p o l i t i c a l and economic disruptic
o f recent years. Even when farm labourers are a v a i la b le , t h e i r high
is becoming proh ib it ive . Adequate le v e ls o f c o f fe e p ro d u c t io n shoul:
therefore no longer be taken fo r granted. Indeed some o f the declins
in coffee output in the 19701 s and 1980's is e xp la in e d by lack of lab
M e c h a n i z a t i o n o f production may have to be in trodu ced e x te n s iv e ly i f
adequate s u p p l i e s of coffee are to be achieved and s ince mechanizatit
i s e x p e n s i v e , t h i s calls for higher producer p r ic e s or subs id ies on
t r a c t o r s e r v i c e s , weeding pumps and h e rb ic id e s .

Pr i c f " o l ■ i'.ov'.’tiui and 1 f)l*'
Closely linked to p r o d u c t i o n a r e government revenue and f0reigr:
exchange e a r n i n g s . I f coffee export volumes go d o w n , t h e government has
t o r a i s e t h e t a x r a t e i n o r d e r to r a i s e t h e same a m o u n t o f revenue from
t h is source. The e xp o rt tax ra te r o s e from about 16% in the 1960‘s to
6 6 % in 1976/77. Th is h igh ra te o f ta x a t io n is p a r t l y due to the fact
that most o f the o th e r tax bases have been v i r t u a l l y wiped out. The
manufacturing s e c to r , which was an im p orta n t source o f revenues in the
1960's, s ta r te d to co l la p se a f t e r 1973 when the As ian businessmen were
exp e l le d from the cou n try by Am in 's economic war d e c la ra t io n of 1972.
At the same time as the m anufacturing ou tp u t dw ind led to near zero
le v e ls , n on -co ffee a g r ic u l t u r a l e xp o r ts a ls o v i r t u a l l y vanished. The
'Atax a d m in is t ra t io n has a lso been v e ry weak s ince 1973/74. Levies on
co ffee exp orts have th e re fo re been the most con ven ien t source of
government revenue. Tax ing domestic crops proved d i f f i c u l t while taxing
the modern s e c to r , the l i t t l e o f i t th a t remained, became increasingly
e lu s iv e w ith the c o r ru p t io n and breakdown o f the government administrative
machinery. Hence co ffe e producers have had to bear the brunt of the
government ta x .
Similarly, the country has become extremely dependent on coffee for its
foreign exchange. Table 1 shows that in the 1960's, about 50% of the
country s foreign exchange earnings were obtained from coffee exports.
Between 1974-84, 90-98% of the country's foreign exchange came from
coffee. This was again mainly because of the fall in the production of the
seasonal e x p o r t c r o p s which has t a k e n place since the 1960's. Table 4 gives
t h e value o f Uganda's e x p o r t e a r n i n g s f o r 1 9 7 8 - 1 9 8 5 . I t shows that
the contribution of coffee alone is over 95%.

Of-''-' )D IT Y 1978 1979 1980 1981 1982 1983 1984 1985
C o f f e e 312.7 425.9 338.7 241.6 341 .0 339.7 359.0 3 4 4 . 0
C o t t o n 19.8 6.4 4.3 2 . 2 3.3 1 1 . 6 1 2 . 0 15.4
Tea 8.3 1.4 0.3 0.3 0 . 8 1 . 2 3.2 1 . 0
T o b a c c o 1 . 8 0.9 0.3 - - 0.9 1.5 ¡1
0 . 5
Mai ze - - - - 0 . 6 11.3 1 0 . 1 j 3.1
Other Exports 1 0 . 6 5.1 2.2 2.5 0.7 2 . 1 . . . i
j
4.3
TOTAL 353.2
- . ......... .
439.7 345.8 246.6 346.4 366.8 392.8 368.3 !!i
Source : Coffee Marketing Board, L in t Marketing Board, Uganda Tea Authority,
Uganda National Tobacco Corporation (B.A.T.)
STATISTICS DEPARTMENT.
y

Since the second half of the 1 970s th e re has been a lot of unofficial
co ffee exports through sm uggling . T h is has reduced the o f f ic ia l foreign
exchange earn ings o f the c o u n try as w e l l as the tax revenue from the
co ffee in d u s t r y . I t should be noted th a t i t i s not because of the poor
producer p r ic e s th a t t h is sm uggling has been ta k in g place. Rather i t
is because o f the g r o s s l y o ve rva lu ed Uganda s h i l l in o s o f f i c ia l government c o m p l ic i t y in smuggling and poor boarder checks. The smugglers are in te re s te d in the fo r e ig n exchange r e c e ip t s which they could keep
abroad or convert into Uganda Shillings at the black market rate.
Smuggling a lso enables them to a p p ro p r ia te f o r themselves the margins
which would have gone to government as ta x revenue in addition to the
d i f f e r e n t ia l between the b lack market and the o f f i c i a l foreign exchange
ra te . The producer h a rd ly o b ta in s h ig h e r than the o f f i c i a l prices.
The smugglers s im p ly d i v e r t the c o f fe e from being exported through the
o f f i c i a l channels. In fa c t the producers o f te n b e n e f i t because the
smugglers pay them prom ptly compared to the c o -o p e ra t iv e unions which
delay payments fo r per iods ra n g in g from 3 months to 2 years. In this
connection encouraging p r i v a t e buyers to opera te in competition with
the C o -o p e ra t ive Unions has a lo t to commend i t . Unions may also be
encouraged to s e l l shares to p r i v a t e owners in form o f jo in t ventures
fo r the sake o f improved e f f i c i e n c y . Shortage o f crop finance does
con s tra in the e f f i c i e n c y o f the Unions in e f f e c t i n g prompt pavments
to the producers. But i t i s a ls o b e l ie v e d th a t the Managers of the
c o -o p e ra t iv e Unions t i e up crop f in a n c e c a p i t a l in p r iva te under
takings for quick profits. If private buyers and procesos

are to be allowed either in joint ventures with government or as
fully private entities, the process of licensing them should be
made ear>y.
From the foregoing, the marketing board ought to be careful in
deciding appropriate producer prices f o r s h o rt and lo n g e r term
ob ject ives of maximizing revenue and fo re ig n exchange e a rn in g s .
Heavy taxation and low producer p r ices may be c o n s is te n t w ith
short term revenue objectives, as the producer tends to be
'ca p t ive ' in the short run, but i t may be q u i te in c o s is t e n t
with the longer term revenue and fo re ig n exchange m a xim iza t ion
ob ject ives since i t may negatively a f fe c t p ro d u c t io n .
The post 1955 output performance shows th a t in s p i t e o f the f a l l
in producer prices from say Shs. 2.20 per kg in the e a r l y 1950s
to -/ 90 cents in 1969 / 70, marketed p ro d u ct io n and e x p o r t volumes
reached peak levels of 229,000 and 247,000 tonnes r e s p e c t i v e l y in
1969/70. However poor crop husbandry and n e g le c t in h a rv e s t in g
a r is in g from poor producer prices re s u lte d in a d e c l in e in output
during the 1970s.
Real producer prices fell to record levels of about -/ 30 cents
per Kg in 1977/8. Marketed production and export volumes fell
by over 25 percent. The coffee experience is somewhat in sharp
contrast to the other seasonal export crops where neak output
went down from 85,000 tonnes to 11,000 tonnes for tea and from 5,00.'
tonnes to 1,800 tonnes for tobacco. Tree crops except tea which
requires high maintenance and harvesting costs do not respond very
t0 Short run changes in prices. Short run adjustment to a pnce fall would mean uprooting ^ ^ ^ '
except under a prolonged price d e n r e a n ™

• 1 7 -
Income Distribution
Perhaps the most far reaching effect of price policy has been
on income d i s t r i b u t i o n . Table 2 shows th a t the producer, who is
the p r im ary c la im ant o f the re tu rn s o f the economic rents from
co ffe e has h a rd ly rece ived h is f a i r share . Q u ite p o s s ib ly he has
o ften not been f u l l y compensated f o r h is e x p l i c t and im p l ic i t
p roduction c o s ts . Table 5 g iv e s the com para t ive share of the
co ffee d o l l a r paid to producers in Uganda, Kenya and Tanzania
between 1974 - 81.
TABLE 5: PROPORTION OF EXPORT VALUE PAID TO PRODUCERS
IN UGANDA, KENYA AND TANZANIA (1974 - 1979).
1974 1975 1976 1977 1978 1979 1980 1981
Uganda 20.6 32.4 17.2 14:5 32.3 58.2 46 50
Kenya a/ 92 93.6 91.1 92.1 * 87.7 N.A. NA NA
Tanzani a 66.7 60.9 49.5 45.3 49.9 N.A. NA NA
Source: Uganda C offee M arket ing Board-mimeograph 1 /
Inc ludes c o s t o f p ro c e s s in g .
The Uganda p rod u cer 's share o f the c o f fe e d o l l a r averaged 23% between
1974 - 78 w h i le th a t o f h is c o u n te rp a r t in Kenya and Tanzania averaged
91® and 55% r e s p e c t i v e l y . The share o f the Uganda p r o d u c e r would have
been even lower had the c a lc u la t io n been done us ing the shadow exchange
ra te . The Uganda s h i l l i n g has f o r sometimes been more over-valued than
two. The lower share of the Uganda Droducer is because of his
heavier tax burden averaging 50% between 1 972/3 - 1 9 7 7 / 8 a n d as high
1976/7. in Kenya the e x p o r t duty on coffee was as low as
5 UP to 1967 when i t was halved. It was then discontinued in 1973 and

18 -
, ■ -iq7 7 at the rate of only 13*. In Tanzania too the re-introduced in 19//
_ nable. These relative tax burdens may also duty has been more re as on am . .
partly be explained by the re la t iv e p o l i t i c a l w e .gh t of the producer,
in the three countries. Whereas in Kenya the c o lo n ia l government a*
the post independence governments have had reason to fa vo u r o r be i»,
fluenced by the estates owners who produce about 50% of the c o f fe e , ,
Uganda the Baganda who grow about 75% o f the c o f fe e have had no sign:
f ic a n t p o l i t i c a l power or influence in pre and post independence gov,
nments.
In Uganda, the Coffee Marketing Board s e l l s the c o f fe e through a sail
committee using a 'forward sales' method whereby c o n t ra c ts are concli
fo r future de live ry . I t is argued th a t t h is method has p o te n t ia l fo
corruption since the board members may not o n ly undergrade producers
coffee and accordingly underprice i t , but th e y may a ls o take commis
from buyers. Instances of dealing w ith s p e c i f i c d e a le rs have been;
source of concern. The Uganda method d i f f e r s from th a t o f Kenya whs
the Kenya Coffee Board sells the coffee d i r e c t l y to private exporter
through open bidding at weekly auctions held in Nairobi. The Ugandi
Coffee Marketing Board however argues that adequate market informar
on world prices is always available which should ru le out corruptiof
But if the officers somehow collude or if they are not adequately
checked, they may get away with some margins. The honesty of Coffes
Marketing Board officials has often been doubted and even question^
Whatever the case whether through corruption or because of the bene'
which incidentally raise the administrative overheads tW
reducing the producer price, the post of the Chairman of the Coffee
Board has commanded undue importance in the recent years

p a r l ia m e n ta ry P ro ce e d in g s , 1965.1/ ABU Mayanja - P a r 1 1 amenua.jr
2/ The Chief of Staff of the Uganda Army, General Oyite Ojok was for
example the Chairman of the Board between 1981-83 and thereafter
the Permanent S e c re ta ry o f P re s id e n t Obote t i l l h is overthrow in
1985. B e fo re , the post was he ld by c lo s e Assoc ia tes of Idi Amin.
Table 6 r i v e s the r e l a t i v e shares o f the c o f fe e d o l l a r between the various
economic agents f o r a s e le c te d number o f y e a r s . Nobody would question
the bas ic j u s t i f i c a t i o n o f ta x in g
TABLE 6 : D i s t r ib u t io n o f C o ffe e E x p o r t Proceeds (* Share) fo r Selected
Years .
YearPayment to Rrnwpr<:
GovernmentTax
M arketing Costs MarketingSurplus
1948 41 16 22 20
1951 34 19 9 38
1954 61 17 15 6
1957 64 , 16 17 2
1959 73, 13 22 - 9
I960 71 12 28 -11
1962 - - - *1964 - - - *1966 - - -1968 - - - •1970 - - - -1972 49 30 11 10
1973 34 43 8 15
1974 40 39 10 11
1975 24 56 7 13
1976 19 66 6 9
1977 34 63 6 -3
1978 37 43 20: -1979 61 26 -1980 53 32 -1981 63 20 1 7- -
a/ i ncludes payments to processors.b/ i ncludes marketing board surplus.Source: C M [5 - Mimeograph

? 0
coffee which has come to be the commanding heights industry of the
economy, but from the equity point of view, it is unreasonable f0r
the government to take up to 75% of the c o f fe e d o l l a r ( 1976 / 7) j,
export taxes and Coffee Marketing Board su rp lu se s which are also
put at the disposal of government. The share o f the m arketing cos
has gone down, though considering the volume o f s a le s , t h e i r s is s
very high and i t is enjoyed by a few p r i v i l e g e d employees o f the
board. The payments to growers, in c lu d in g p rocesso rs has ruefu ll j
been very low since independence. The c o lo n ia l government allowec
them as high as 73% (1959) and over an average o f 60% o f the total
^ proceeds between 1954 - 1969.
I t is tempting to wish to r e c t i f y the above. However d u r in g the
macroeconomic s tab il iza tion phase, one must w o rry about the
im plications of such a decision fo r the economy as a whole. Shoul
one reduce the coffee tax burden at the moment? Or should one fij
w ith the exchange rate in order to pay producers h ig h e r P r ices evs
though th e ir share of the export d o l la r may s t i l l remair low?
(See recent policy pronouncement) or must we defer the e q u it y
argument for later?
Alternative Approaches to Price Fixing.
The above analysis suggest that the coffee industry has had sizeai
economic rents but these have not been distributed well as far as
^ j ves of maximizing production, government revenue, foreign
exchange earnings and income distribution are concerned.

There a r e s e v e r a l principles which guide price f i x i n g p o l i C y .
These include the social and the private marginal and average
cost analyses; the export price parity principle; the rural-
urban income parity p r i n c i p l e ; and the a g r i c u ltural-industrial
p r ic e p a r i t y p r in c ip le . None o f these has y e t been e x p l i c i t l y
used to guide co ffee p r ic e d e te rm in a t io n in Uganda. As mentioned
a lre a d y , the Uganda government (1981) w i th the advice o f the IMF
and a f t e r the f l o a t o f the Uganda S h i l l i n g ra is e d domestic prices
by wide margins. The a g r i c u l t u r a l s e c r e t a r i a t o f the Bank of
Uganda is beginning to in c o rp o ra te c o s t c o n s id e ra t io n s in advising
on producer p r ic e s . We note t h a t t h i s i s a step in the right
d i r e c t io n . But as Coda (1984) observes t h a t the co s t in g exercise is
ra th e r complex because o f the d i f f i c u l t y o f e v a lu a t in g f ixed costs and
i m p l i c i t cos ts .
The marginal o r average co s t p r i c i n g approach estim ates the additional
and the average cost o f p roduc ing each k i lo g ra m o f coffee . A reasonable
margin is added to this in d e te rm in in g the producer p r ice . Market
prices or shadow prices are used depending on whether private or social
opportunity cost is the focus of i n t e r e s t . Parity pricing on the other he
attempts to ensure that the producer i s not losing out compared to other
producers in the economy or compared to the export proceeds obtained.
It is our opinion that the principles of agricultural -Agricultural,
agri cu 1 tural - industrial price p a r i t y and that of the export price
parity are better guides to coffee price determination than average or
marginal cost pricing in the Uganda situation today. This is because the
later is very difficult to estimate with any reasonable degree of accuracy
given the present structure of production. The first princ ip le has been
used f o r a l o n g time in the USA to guide the American fan,, support scheme*
Tne p r i n c i p i e p o p u l a r l y known as "the parity doctrine", seeks to
- 21 -
halt if not reverse the decline in the terms of trade between one
set of agricultural goods and others or between agricultural and
industrial output.
The a p p l i c a t i o n o f this princip le in Uganda should seek t o maintain
. n, ; rPn 0f the c o n t ro l le d a g r i c u l t u r a l e x p o r t crocp a r i t y between the prices oi K '-'W
and the food crops which are market determ ined. T h is should in addi
t io n seek to maintain pa r ity between a g r i c u l t u r a l p r ic e s and industr
product prices. Only on this basis would the c o f fe e producers keep
up and even increase output fo r the fu tu re o th e rw is e he i s bound to
switch resources into other production a c t i v i t i e s which are uni ike
to bring as much revenue to government o r the b a d ly needed foreign
exchange to the country. Production data on Uganda in the 1970s
i l lu s t r a t e s th is very well. Estimates o f the M i n is t r y o f Planning
fo r the 1970s show that the acreage under food crops was increasing
while that of coffee either kept steady o r d e c l in e d because some
producers ret ired the coffee shambas and sw itched to o th e r crop
production.
The adoption of this principle would require a proper choice of the
base year. The early 1950s were normal years, relatively free from
inflation and with minimum government interference on prices. Any
of these years can appropriately serve as the base year. Given the
base year and using price surveys, parity prices can easily be
estimated. Table 7 gives the domestic prices of coffee and a few
selected commodities between 1955 - 84. Table 8 gives the relative
price changes of these goods over the period while Table 9 gives the
appropriate coffee pnce based on the mean price Index of the diffe
rent commodities.

The t a b l e s de m o n s tr a te the need o f e m p l o y . n g the above P r i n c ip l e .
At the above prices the producer would for example require as much
as 7kg. of coffee to buy a bar of soap or a kg. of sugar in 1982,
and as much as 4 kg. o f co f fe e to buy a lo a f o f bread. This is in
c o n tra s t to 1955 when the r e l a t i v e p u rch a s in g power was 2 kg.of
co ffe e f o r a bar o f soap 3 kg. o f c o f fe e f o r a kg. o f sugar and4
2 kg. o f co ffee fo r a lo a f o f bread. The r e l a t i v e coffee 5requirements in 1980 were 28 kg, 22 kg. and 6 kg. respective ly .
In 1983/4 , the r e la t i v e requirem ents were 2 kg. 1.2 kg. and 1 kg.
The post 1982 co ffee p r ic e s are thus a c o n s id e ra b le improvement
and they do res to re the p a r i t y between c o f fe e and o the r competitive
a g r i c u l t u r a l output as w e ll as w ith the i n d u s t r ia l products.
Comparative estimates o f e d u ca t ion a l c o s ts , medical and transport
costs among others would improve o u r c o n c lu s io n s . From the above
a n a ly s is , i t can be t e n t a t i v e l y argued t h a t the recent doubling
o f co ffe e p r ice s was not warranted on e q u i t y grounds. I t cannot
a lso be j u s t f i e d e i t h e r on the grounds o f s t im u la t in g production
in the short run nor in the in t e r e s t o f the long run country's
s t ra te g y . I t is th e re fo re in c o n s is t e n t w i th the immediate
macroeconomic s t a b i l i z a t i o n and the long term growth objectives.

I H i ¡ 7 comparative p nce s fo r selected number of
C o n » , od, ties between 1995 - 1984 (Uganda Shilling)
1955 1960 1970 1978 1980 1983 1984Commodi ty -----------------------------
Coffee (pen Kg) 1.55 1.40
5.00
.90
7.50
2.86
30
15.4
2 0 0
330
400 CD CO -r-b
.
P la in ta in (per bunch)2 0 1 0 0 250 300
Tomatoes (per Kg)15 1 0 0 250
Bread (per loa f) 0 .66 0.80 1.03 250
3.30 4.94 •20 250 400 550Beef (per Kg)7001 0 0 400 900Chiecken ”
Fish (per Kg) - 5.78 5.00 2 0 1 0 0 300 350
Soap (per bar) - 3.39 4.96 50 450 500 450
Soda (per b o t t le ) 5 1 2 0 150 150
Beer (per b o tt le ) 1.84 1.83 2.90 25 250 350 350
Sugar (per Kg) 1.25 1.32 1.50 2 0 350 300 350
M ilk (per I t ) 0.40 0.40 0.70 5 80 1 0 0 100
Eggs (per t ra y 16.45 10.78 11.50 180 400 1500 1500
Maize f lo u r (per Kg) 0.60 0.48 1.08 7 80 1 2 0 150
Beans (per Kg) - 0 . 66 1.38 15 150 2 0 0 200
Wheat f lo u r (per Kg) - - - - 400 300 300
Tobacco (per packet) - - - 2 0 1 2 0 2 0 0 250
Pineapple - - - 30 60 1 0 0 100
P a ra f f in (Kerosin 0.74 0.74 0.85 3 3 80 150per I t )
S a l t - 0.44 1.08 15 60 150 150
Rice - - - 15 250 180 250Potatoes (sweet
per kg) - 0 . 20 0.30 - 50 1 0 0 150Potatoes ( I r i s h - _ 5 5 50 150
per kg)Petro l (per I t ) 0.63 0.87 1.13 7 7 150 200T o i l e t tissue
(per rol 1) - - - 30 30 130 150
Source. Abstracts and Data Collected at the WandegeyaV Kampala, Uganda by Author.
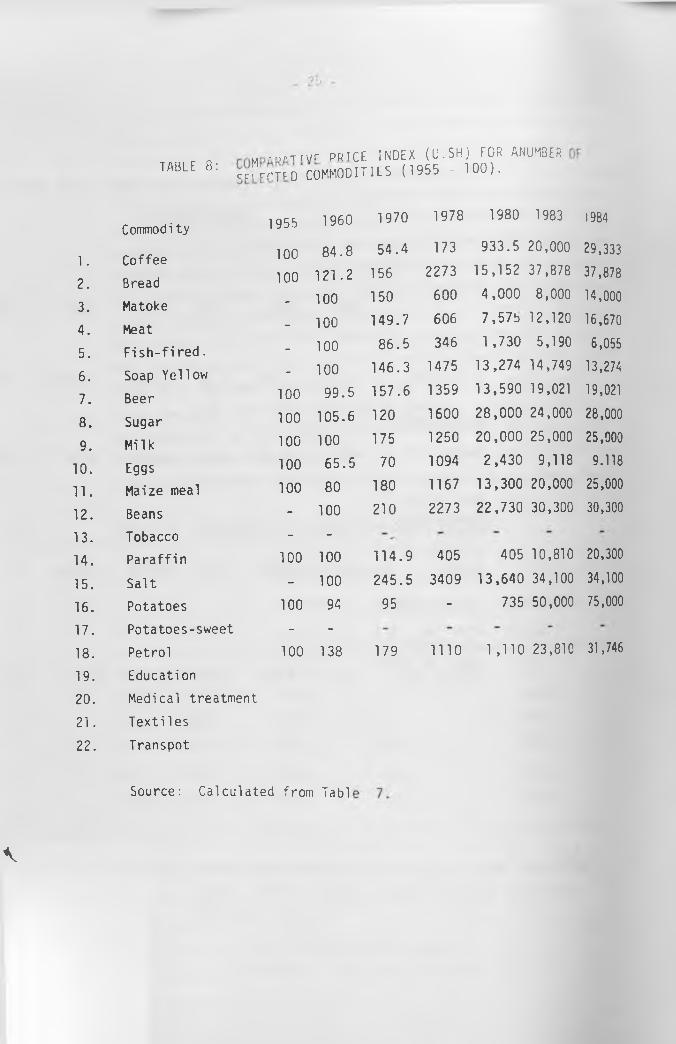
.n/cr iv/F PRICE INDEX (U.SH) FOR ANUM3ER TABLE 8: ccfrrTFD COMMODITIES (1955 - 100).
Commodi t y 1955 1960
1 . Coffee 1 0 0 84.8
2 . Bread 1 0 0 1 2 1 . 2
3. Matoke - 1 0 0
4. Meat - 1 0 0
5. F i s h - f i r e d . - 1 0 0
6 . Soap Ye l lo w - 1 0 0
7. Beer 1 0 0 99.5
8 . Sugar 1 0 0 105.6
9. M ilk 1 0 0 1 0 0
1 0 . Eggs 1 0 0 65.5
1 1 . Maize meal 1 0 0 80
1 2 . Beans - 1 0 0
13. Tobacco - -
14. P a ra f f in 1 0 0 1 0 0
15. S a lt - 1 0 0
16. Potatoes 1 0 0 94
17. Potatoes-sweet - -
18. P e tro l 1 0 0 138
19. Education
2 0 . Medical treatm ent
2 1 . T e x t i les
2 2 . Transpot
Source: Calculated from Tabl
1970 1978 1980 1983 1984
54.4 173 933.5 2 0 , 0 0 0 29,333
156 2273 15,152 37,878 37,878
150 600 4,000 8 , 0 0 0 14,000
149.7 606 7,57b 1 2 , 1 2 0 16,670
86.5 346 1 ,730 5,190 6,055
146.3 1475 13,274 14,749 13,274
157.6 1359 13,590 19,021 19,021
1 2 0 1600 28,000 24,000 28,000
175 1250 2 0 , 0 0 0 25,000 25,000
70 1094 2,430 9,118 9.118
180 1167 13,300 20,000 25,000
2 1 0 2273 22 ,730 30,300 30,300
114.9 405 405 10,810 20,300
245.5 3409 13,640 34,100 34,100
95 - 735 50,000 75,000
179 1 1 1 0 1 ,110 23,810 31,746
V

- 26 -
TAble 9 ; COFFEE PRICE: ASSUMING COMPARABLE PRICE CHANGES W I T h
OTHER PRODUCTS.
1 955 I960 1970 1978 1980 1983
1. COFFEE PRICE
(ACTUAL) 1.65 1.40 0.90 2.86 15.40 330
2. COFFEE-PRICE
^NDEX 100 84.8 54.5 18.2 21 .2 133.3
3. MEAN PRICE INDEX-OTHER COMMODITIES (ExcludingCoffee) 100 100.3 149 1354.7 10,512 21 ,606
4. COFFEE PRICE
APPLYING MEAN PRICE INDEX OF OTHER COMMODITIES •65 1.66 2.50 22.3 173.5 356.6

27
The other principle s u g g e s te d t o gu^de p n c e fixing is that of the
export p a r i t y p r ic in g . Accord ing to this p r i n c i p le the producer
prices would be based on the f.o.b. d o l l a r p r ic e converted in the
domestic currency at the o f f i c i a l exchange rate. If this principle
is to be f a i r , i t is important that the domestic curren cy is not
over valued v i s - a - v i s the foreign c u r re n c y , o th e rw ise the coffee
producer w i l l be lo s in g out. The shadow exchange ra te may be used
instead o f the o f f i c i a l nominal exchange ra te i f we are to obtain
the c o r re c t p ic tu re . Using the o f f i c i a l exchange r a te , the share
o f the producer o f the exp o rt price is g ive n in ta b le 2 . Except
f o r 1979/80 ■ the p roducer 's share was always below 50%. Given
th a t the Uganda S h i l l i n g was o v e r -v a lu e d thoughout the 1970s as
w e ll as in the 1980s the P ro d u ce r 's share o f the re a l export
value was much less th a t in d ic a te d in ta b le 2. Tab le 10 gives
an in d ic a t io n o f the o v e rv a lu a t io n o f the Uganda S h i l l i n g in the
1980s even a f t e r the in t ro d u c t io n o f the managed f l o a t and the two
window system under which the d o l l a r was auct ioned on window two.
TABLE 1CI: Exchange rate comparisons. (UGS per USD).
O f f i c i a l Rates
Window Wi ndow U n off ic i iAt the end of
One Two Rates
June 1980 7.3 _ 80June 1981 77.8 - 200.0June 1982 96.7 - 300.0June 19833 150.0 280.0 350.0
Nov. 1983b 210.0 330.0 400.0Apri 1 1984 280.0 320.0 450.0
Source. International Bank for Reconstruction and D eve lop m en t
(IBRD). 1983. Uganda: Country Economic Memorandum.W a s h i n g t o n , D C ,U S A .
a At July 1 f o r o f f i c i a l r a t e s ,
b A t N o v e m b e r 2 1 f o r ü f f i c í „ , r M e s _

A
KlflC thp covernment t o pay h i g h e r producer prices and Devaluation enables the govt
from the coffee I n d u s t r y . But since devak to obtain higher revenues from
u- of fort <; on the macroeconomy, one should not rush i ntt has fa r reaching effects
i»ic hp s to raise producer p r ic e s o r government i t simply because one wishes to
revenues.
One o f the reasons advanced for the past s e r ie s o f d e v a lu a t io n s in
Uganda is that of being able to pay h igher p roducer p r ic e s f o r agrie,
tu ra l exports. Whereas this has served w e ll between 1952 and 1984
to bring the coffee producer in p a r ity w ith o th e r p roducers in the
economy, the recent doubling of producer p r ic e s , i f i t doesn t
re s u lt in equal increases in other product p r i c e s , w i l l g iv e the
coffee producer an edge. A cussory e va lu a tion o f the evidence
indicates that other producer prices w i l l r i s e a lm ost p a r i passu,
thus wiping out the relative gains of the co ffe e p ro d u ce r . And
looking at the price increase from the export p r ic e p a r i t y p r inc ip le ,
the coffee producer w il l s t i l l receive ju s t over 50% o f the exp o rt
proceeds at window one and close to 15% at window 2. This compares
badly with his share of about 70% of the exp o rt proceeds in 1984/5
at the of f i cal rate and of over 25% at the black market ra te .
In conclusion during the macroeconomic stabil ization phase
government should not pay excessively high coffee producer prices
p c ’ally if these are not likely to stimulate output in the shortr-
longer run strategy of the economy is agricultural export
diversitication. ThP lqa/wc „ •n pnces were equitable enough and provi^
sufficient incentives t-n twthe producer in a period when the qovernnf
needed to rely on coffee « thD- the commanding h e i q h t s I n d u s t r y ,

29
This position which takes away a substantial chunk of producer 's
e n t i t le m e n t is supported o n ly f o r the s h o r t run to enable
government oversome i t s budgetary d i f f i c u l t i e s and on the
assumption that government is determ ined to eliminate waste
i n e f f i c ie n c y and cu rru p t io r i in the p u b l ic s e c to r .

I N D U S T R Y

Industrial S e c t o r issues and R e c o m m endation^
1 Overview o f Immediate P r o g r a m
The fo l lo w in a observations and recommendations stem fromine t o Mowing o d s d is c u s s io n s , and from m eetings w ith 12
Government/UDC documents and d is c u s s ■uns , o n fro n " , Ir fla rge companies and a handful o f v e ry s m a l l - s c a le e n tre p re n e u rs .
The major aim in t h is s e c to r is to r e v iv e i n d u s t r i a l production as a means o f generating income and employment, s a v in g f o r e ig n exchange and co n ta in in g i n f l a t i o n . S m a l l -s c a le in d u s t r y (under 10 employees) has been h ig h ly r e s i l i e n t over the past 15 ye a rs and p re s e n t y provides an estimated 50% o f in d u s t r ia l va lue added and 80% o f i n d u s t r ia l employment.Th is su b -s e c to r can expand s i g n i f i c a n t l y w i th v e ry l i t t l e imports and v i r t u a l l y no budgetary requ irem ents . P a r t i c u l a r l y i f fo r e ig n exchange, budget funding and borrowing requirements o f formal i n d u s t r y cannot be f u l l y met, s m a l l -s c a le in d u s t r y w i l l continue to p ro v id e the co re o f in d u s tr ia l p rod u ction , labour ab so rb t ion and t r a i n in g w i th minimal burden on the s ta te . What is most needed by t h is s e c to r are v e r y small in fus ions of working c a p i t a l . S m a ll -s ca le in d u s t r ia l loan programs are underway through UCB with donor fu n d in g , but w arran t some expansion and m a jo r p u b l i c i t y ; most of the ve ry small entrepreneurs do not know o f t h e i r e x is t e n c e . A c t i v i t i e s are p re s e n t ly concentrated in wood p ro d u c ts , shoes and le a th e r products and metal f a b r ic a t io n . The o n ly s i g n i f i c a n t im p ort needs a re t o o ls m eta l; the stock o f scrap (used a u to / b u s / lo rry bod ies ) i s t h in (p roducers waste much time searching f o r raw m a te r ia ls ) . I t i s thus recommended t h a t some f a c i l i t y be quickly set up to i d e n t i f y and im port e s s e n t ia l raw m a te r ia ls and t o o l s ; small foreign exchange a l lo c a t io n s f o r t h is purpose, f o r 1986, a re suggested below. The fu tu re ro le o f t h is s u b -s e c to r should no t be un de re st im ated .
P o l ic y focus continues to be con cen tra ted on th e r e v i v a l and rehabilitation o f la r g e r -s c a le in d u s t r y , a focus which i s a p p ro p r ia te in th a t problems are concentrated here. L a rg e -s c a le in d u s t r y d e t e r io r a t e d d ra m a t ic a l ly in the 1970s, i n i t i a l l y responded to the 1980/81 IDA C r e d i t f o r in d u s t r ia l inputs, and then fa l te re d and d e c l in e d . Major reasons f o r the l a t t e r dec line are argued to be:
1. P rodu cers -d id not charge what the market would b e ar, due to con t in u in g a d m in is t ra t iv e p r ic e c o n t ro l and i n t e r f e r e n c e , p a r t ic u la r ly by the M in is t r y o f Commerce, and p a r t i c u l a r l y in government companies
a deeply held tendency to p r ic e on a c o s t -p lu s b a s is . In some cases, this tendency stemmed from "moral r e s p o n s i b i l i t y " . In o t h e r s , i t provided o p p o r tu n ity f o r s e n io r managers to s e l l o u tp u t u n o f f i c i a l l y to traders and reap la rg e b e n e f i ts . In f i rm s v i s i t e d , the average margin between producer and r e t a i l p r ice s is s t i l l some 1 0 0 %, and th e re a re in d ic a t io n s that, in aT r a d P r r J ú n arproS L i f i the kind i ust mentl'oned i s s t i l l in existence.funde tn nurrhAc 1Ve l a r 9e m arg ins , and f i rm s were denied sufficient tunds to purchase the t h p h .a u a i i , k iincrea ses . ab1e fo r e ig n exchange and 'f inance production

• novation in financial markets to provide2. There was little in ^ expected earnings rather than rapidly
working capital on the basis ^ extent, pessimistic views abouteroding book value of asse s.. justified. future earnings were also clea y J
t Instances of poor management and mismanagement were f re q u e n t ,• , l - Í L x r t i c e s of p o l i t ic a l appointees,in c lu d in g corrupt p ractice , u v
4 . In some cases, there was major damage to assets through lo o t in g
and w ar-re la ted th e f t .
What policies/measures are " “ . ^ uÍ sr ^ n^ at ^ Ssut ^ ^ s P™ bab,e currpcc? Thp fo llow inq recommendations assume r e la t i v e success inD o li t i c á l /security and macro-economic s t a b i l i z a t io n . Most im p o r t a n t l y , the,envisaae s ia n i f ic a n t in f la t io n containment through, monetary and exchange ratp o l i c ie s , to which rev iva l of industr ia l production should i t s e l f c o n t r i bullRecommendations can be re la t iv e ly eas ily adjusted i f macro p o l ic y / p e r fo rm #diverges w ide ly from these assumptions.
Given th is broader s ta b i l iz a t io n , re v iv a l o f a p o r t io n (some 50%)of la rg e -s c a le industry production is considered to be o b ta in a b le . The o v e r r id in g present constraints to r e v i t a l i z a t io n , i d e n t i f i e d by a l l companii are acute shortages of imported raw materials and spare p a r ts . The immedial u n d e rly in g problem is lack of access to fo re ig n exchange. In a d d i t io n , mam companies could not raise working capital to purchase f o r e ig n exchange even i f i t were availab le/allocated. Underlying the w ork ing c a p i t a l shortages a: (p as t and present) p ric ing polic ies and re g u la t io n s , management deficiencies and a ser ies of related problems elaborated below. I t i s argued th a t the fo re ig n exchange, working cap ita l, p r ic ing and management c o n s t ra in ts mustt attacked f r o n t a l l y i f any rapid expansion o f "production is to be achieved. A long these l in e s , main recommended measures are :
1. Rapidly allocate approximately;^ TOO m i l l i o n to key basic -needs. revenue-generating and export companies, and to s m a l l -s c a le in d u s t r y . A v a i la b le information on allocations and suggested p r i o r i t i e s is s e t out in Table A. I f foreign exchange a v a i la b i l i t y does not perm it t h is level o f aggregate a l loca tion , allocations to lo w e r -p r io r i t y products/companies should be eliminated. The l i s t o f s p e c i f i c company a l lo c a t io n s and p r io r i t ie s should be completed q u ic k ly by the M in is t r y
s h o u íd ^ r c h e J k P ^ h ^ p í 3 1 1 0 ' 1 Wltí UDC Where aPPr °Pn a t e - F in a l allocations d e c id in g o r í o H t i p í « h l í iH 1!!9 Í Í the P re s id e n t 's O f f i c e . The main criteriaand net revenue-generating e f f e c t s ^ í r ^ t 0 WhlCh t h 8 p roduct is a basic neE tobacco industries Linkages tn ntho goven?men!: " in c lu d in g beverage andexchange savings s i i o u l W b e c S S lS e K d ? "1^ ln d u s t r i e s - 3" d net fore1*
in2supportbof9wírkinrcapital needsSwhirhb111l*°n-f0r UDC ^ °th8r companie!These estimates come from Unr J hlch, comPam es can not meet by borrowu in te rv ie w s - they are in urap t extraP0^at ion s from l im i t e d company v e r i fication/adiustmpnt t h J , I ?eedcompany in question. The mp h ustry/UDC c o n s u lta t io n s w ith each of the
Banks 1psDPr0 3 ini 9Uarantee and w r i te o f f ^ 1 V6ry among companies; equity
in d u s t r ia l r e h a b iH t a r " °"eS Shou,d coopera te™ ’ 5* H f t 1 n g ) - a£ Com"ercialatl°" than has hitherto been [he’c a s T ^ 1 eXte"Si°" ^

Mechanisms should a lso be worked out im m ediate ly by Ind ustry/U D C , in consultation w ith companies and lend ing i n s t i t u t i o n s .
3. D irect/enab le f irm s to a l t e r p r i c in g p o l i c i e s , ana p a r t ic u la r l y cease o r re -o rg a n is e a d m in is t ra t iv e p r ic e re g u la t io n s so th a t companies charge market o r p r ice s th a t a l lo w them adequate p r o f i t margins to generate more resources in t e r n a l l y f o r expansion .
4. R ap id ly complete management review and c o r r e c t i v e measures in UDC companies, in c lu d in g d ism issa l o f incompetent and c o r ru p t managers, and resolve management problems in a few o th e r cases (some d e t a i l s b e lo w ) .
There are c le a r l y some c o n t ro v e rs ia l issues here . In p a r t i c u la r , there is res is ta n ce in many q u a rte rs to e f f e c t i v e p r ic e d e re g u la t io n on grounds that i t w i l l be i n f l a t io n a r y ; t ra d e rs w i l l continue to ge t e x c e s s iv e margins and consumer p r ice s w i l l r i s e p ro p o r t io n a te ly to producer p r i c e s . T h is is argued to be u n l ik e l y where there is s i g n i f i c a n t com p e tit io n from im ports o r other domestic producers o f s im i la r goods - on b r i e f e xa m in at ion , the v a s t m a jo r i t y of cases.For f in a n c in g working c a p i ta l needs, the a l t e r n a t i v e i s argued to be increased budgetary p ro v is io n f o r e q u it y in fu s io n and loan gu ara n tees .
Many companies a ls o have a w orkforce w ith long e xp e r ie n ce and perspective on company o p e ra t io n s . I t i s argued th a t t h is resouce can be b e t te r u t i l ized .As union o rg a n iz a t io n is reported to be in d i s a r r a y , i t i t recommended that worker commitees o r s im i la r o rg a n iz a t io n s be e s ta b l is h e d to adv ise on discipline, p r o d u c t i v i t y , management and p la n n in g , and to i n i t i a l l y p ro v id e a further check in the system a g a in s t poor management and m a lp ra c t ic e .
On in fo rm a tion a v a i la b le , i t is estim ated th a t these measures can revive ca p a c ity u t i l i z a t i o n , f o r f irm s covered, from under 2 0 % to ove r 50% in a year's t ime. The fo re ig n exchange a l lo c a t io n s and w ork ing c a p i t a l p ro v is io n s are for imported raw m a te r ia ls and a bare minimum o f spare p a r t s ; these were identified as the major s h o r t - te rm c o n s t ra in ts to p rod u ct ion expansion by a l l firms visited.
Fu rther expansion o f p roduction w i l l re q u ire c o n s id e ra b ly la rge rehabilitation and expansion investm ents, a long the l in e s o f the Investm ent Plan (Industry P ro je c t P r o f i l e s ) . Much o f the requ ired p r o je c t fu n d in g i s l in e d up with donors, and should be forthcom ing i f the macro p o l i c y which emerges is s u f f ic ie n t ly acceptab le . In t h is e v e n t u a l i t y , c a p a c ity u t i l i z a t i o n cou ld reach levels of 75% in 3-5 ye a rs , tog e th e r w ith s i g n i f i c a n t c a p a c i ty exp an s ion . With lower donor response, r e h a b i l i t a t io n and expansion investm ent would f a l l h e a v i ly on budgetary fun d in g , resources ( u n l i k e l y ) p e rm it t in g . More is sa id below about prforíttes among p ro je c ts in the investment p la n ; they w i l l c e r t a i n l y have to be sequenced.An urgent requirement is to obta in a h ig h ly q u a l i f i e d e x p e r t in p ro ject appraisal and bu dgetin g/pub lic f in a n c e ; the present p r o je c t p r o f i l e s show alarming errors
{netJ ° re' gn « ^ " g e , net government revenue), and show no re c o g n it io n o f the need f o r sequencing and, hence p r i o r i t y setting.Given budgetary and borrow ing c o n s t ra in ts , a s im ultaneous launching of this e n t i re investment program would be d i s a r m . . c u . ,donor fund ing . d is a s t r o u s , even wi th major concessional

crucial issues and measures which are argued t(There are several less in i nimed ia te expansion o f in d u s t r ia l
nevertheless be important to succes production.
•11 have some bearing on borrow ing c a p a c i ty and1. In te res t rates w in enti y la rge degree o f money i l l u s i o n
practices o f f irm s, given tn p ^ are percei- veci t o be damaging tos t i l l in the system; high n ^ ^ firm s v i s j t e d . There are a lsodebt s e rv ic in g capacity tor y ^ detering banks from le n d in g ,reports that negative real ^ macrQ f ramew0rk and in t e r e s t ra te p0p a r t i c u la r l y long term, wn seni 0r managers o f key companies onthere appears urgent In p a r t , t h e i r concerns have been ju s t i f yfundamentals o f n* -,^5 and price c o n t ro ls have damaged debt repa,in that past production dec nes and P ^ an(J negatjv0 re a , in t e ^ ,ca p a c ity in sp ite o f generanzeu ia K
2 The level o f the exchange rate is a lso p e r c e p tu a l ly im portant.Given s u c c e s s f u l implementation of t h e ^ j o r measures l i s t e d ^ b o v e is
g e t t in g " th e preferred rate , and‘ ¡ ¿ le r . , genuine ly expect d is a s t e r i f thej Again fears are p a rt ly ju s t i f ie d by past production and reduce undue pre- occupation with dual rates as a major source o f Problems And a g a in , qui( se n io r management education/briefing would seem e s s e n t ia l .
3 A related point is the need fo r a rap id rev iew o f e f f e c t i v e tarif p ro te c t io n leve ls fo r producer-goods produced d o m e s t ic a l ly . There are one cases id e n t i f ie d ( i . e . hoes produced by UGUMA and C h i l l i n g t o n ) where impor come in at the preferred rate and producers are not sure i f they w i l l get the preferred rate on imported inputs. Here, t h e i r concerns ove r the dual are j u s t i f i e d . There is a related issue here o f im p o rts ; 7 m i l l i o n hoes a reported to have been ordered. This appears enough f o r the e n t i r e domesti market fo r two years. While hoes are badly, needed, care should be taken, p a r t i c u la r l y in 1987-88, not to undermine new p rod u ct ion c a p a c i ty being in s t a l le d at UGUMA and Chill ington. Fu rthe r , once the fu tu re exchange rat regime is decided, very rapid action w i l l be needed to ensure adequate (b. not undue) e f fe c t ive protection for domestic producer-goods in d u s t r ie s , ca p a c ity and machinery for this review should be e s ta b l is h e d now, in advar requirement. The relevant methodology is o u t l in e d in IBRD's "Uganda In d u s t r ia l Sector Memo" of September, 1985. Th is s tudy in d ic a te s negativa e f f e c t i v e protection rates (EPR) in 1984 (Est im ated) f o r 17 companies producing beer, fabr ics , shoes, paper products, t im b e r , v e h ic le batteries, asbestos products, matresses, wheat f lo u r , i ro n sh e e ts , r o l l e d s t e e l , emulsion pa in t, biscuits and sweets. For 70% o f these p ro d u c ts , "high p ro te c t io n to inputs (which reduces value-adaed at domestic p r ic e s ) outweighed protection to output (which was eroded by p r ic e c o n t r o l s ) " . The remaining products actually had negative value added a t domestic prices, macro and industr ia l policies which emerge in the near fu tu re w i l l affect the parameters of EPR calculations; these c a lc u la t io n s should be u pda ted; soon as the new polic ies are decided, w ith ass is tan ce from the IBRD or elesewhere i f necessary.

4 Domestic goods have a ls o , on occas ion been undercut by a) a id -s u b s id iz e d goods and b) im ports f o r which d u ty was avoided. The mechanisms fo r s to p p in g / p re ve n t in g both s v N a t io n s appear to nee s tre n g th e n in g , in c lu d in g more general measures to e ra d ic a te smuggling.
5. There are severa l ownership and maJ J 9 e¡jent issu es whieh need to bereso lved q u ic k ly . Some appear to in v o lv e t e a h p I a v Óh ntwo cases, in te rn a l fa m i ly ownership f i g h t s have undu ly delayed any progress on r e v iv a l o r r e h a b i l i t a t i o n ; a l l p o s s ib le e g by government appears w arranted. A t h i r d case in v o lv e s the abandoned bottle-making plant. While t h is op era t ion does not f i g u r e in immediate i n d u s t r ia l revival plans, im p orta t ion o f b o t t le s has been c o s t l y and p ro b le m a t ic f o r breweries and soft- d r in k m anufacturers. Most im p o r t a n t ly , the E .A . S te e l Corporation , w h i le m a jo r i t y government owned, i s by i n i t i a l agreement managed by Madhvani- appointed e x p a t r ia te s whose performance has been r e p o r te d ly very poor. Time has not perm itted d e ta i le d in v e s t i g a t i o n , but t h i s i s a key supplier to other p r i o r i t y in d u s t r ie s . I f w a rra n ted , a h i g h l y q u a l i f i e d Government manager should be made Chairman o f the board , and management put on notice of d ism issal i f company performance is no t s a t i s f a c t o r y w i t h in 4 months.
There appear to be severa l o th e r cases where ownership problems are h in d e r in g p rog ress . General Equipment i s one case i d e n t i f i e d where present management cannot ra is e w ork ing c a p i ta l due to u n reso lve d ownership, and there are reported to be many s i m i la r cases . A c c o rd in g to Industry, there have been many problems w ith the V e r i f i c a t i o n s Committee, and a new one is in process o f be ing formed. In u rge n t cases where ownership s t i l l may not be reso lved q u i c k l y , i t i s recommended t h a t in t e r im arrangements be made, such as w o rk in g -c a p i ta l loan gu arantees , -by Government, f o r ex is ting management, to a l lo w op e ra t io n s to resume.
6 . Many companies re p o r t th a t accumulated debts are hindering present borrowing c a p a c ity and o p e ra t io n s . Local c o ve r p ro v is io n s (above) are be lieved s u f f i c i e n t , in the a ggreg ate , to put s e le c te d companies on a resonably sound fo o t in g , but the most a p p ro p r ia te mechanisms f o r ensuring availability o f working c a p i t a l , ta k in g account o f accumulated d e b t , need to be workedout r a p id ly on a ca s e -b y -ca s e b a s is . O p t ion s in c lu d e e q u ity infusion, new loan guarantees, resumption o f repayments by Government and w r i t e - o f f of bad debts where ne go t ia b le w ith c r e d i t o r s . I t i s recommended th a t UDC be consulted immediately on t h is is s u e , in the c o n te x t o f o v e r a l l UDC-company f in a n c in g c o n s u lta t io n s recommended above.
7. I t is re p o r te d , and here assumed, t h a t th e re i s s u f f ic ie n t liquidity in the banking system to cover immediate bo rro w in g requirements, including w o rk in g -c a p ita l borrow ing by the i n d u s t r ia l s e c t o r . Th is needs rapid co n f irm a tio n . I n t e g r i t y ( c o r ru p t p r a c t ic e s ) o f some f in a n c ia l institutions has a lso been ra is e d ; t h is may w arran t re v ie w and remedial measures.
. 8 . One o r two instances o f se r io u s i n f r a s t r u c t u r e (power, water) f a i l u r e have been i d e n t i f i e d . One company (Hima Cement) is purchas ing a
in t e r m it t e n ^ D o w e r 'r p " A"° th e r (UGUMA> e f f i c i e n t l y large in te rm it te n t power requirem ents to o ve r lo a d the system and damageproduction equipment. Such s i tu a t io n s need q u ic k re s o lu t io n as'they arise.
cful imolementation o f a l l p o l i c ie s and measures w i l l F in a l l y , succes* h,irpauCra t ic c o -o rd in a t io n and ra p id a c t io n which
require a capacity to r ^ S(Jggest ed th a t a P r e s id e n t ia l body bedoes not demonstrably exi • n v i s i b -|e a u t h o r i t y and support toestablished w ^ h o e t delay, and ^ ^ i a l Rev iva l Program, spearhead and co-ordinate
. , thpcp measures can succeed, i f implemented, inI t is argued that th e s ^ je js In p a r t ic u la r > they addressre v iv in g a P o t io n o const ra in ts , as w e ll as the main reasons f o rmost c u rre n t ly iden recovery in 1983-85. Less o p t i m i s t i c views ftthe fa l te r in g o f 1 conCerning the a b i l i t y o f p re se n t in d u s t r ia l manto eg e íei íd ú s t r y moving, and the fundamental v i a b i l i t y o f some o f the in* in nuestion There is in s u ff ic ie n t t im e, however to complete m ajor manat tra in^ng o r ' conduct detailed f e a s ib i l i t y s tu d ie s , a lthough a l l p o s s ib le , term e f fo r ts are important. Given the importance and p r i o r i t y a ttachedt in d u s t r ia l recovery, there appears to be no good a l t e r n a t i v e to proceedi, on a concerted basis.
A d is t in c t caution should, however, be sounded. W hile t h is recovery program is argued to be feasib le , i t is not c le a r th a t i t s i n i t i a l impact re s u l t in a doubling of production in perhaps 75*> o f the la r g e -s c a le in d u s t r ia l sector. The small-scale sector (50% o f in d u s t r ia l va lu e addet is at capacity and although production w i l l expand, growth w i l l be slow. The in d u s tr ia l sector contributes some 5% to monetary GDP and some 10% to to ta l goods production. Thus, o p t im is t i c a l l y , i f h a l f o f in d u s t r ia l production were doubled, GDP would be increased by some 2.5% and goods production by some 10%. While very s i g n i f i c a n t , t h i s would n o t be expect to have a dramatic impact on aggregate a v a i l a b i l i t y and p r ic e o f goods, p a r t i c u la r l y as a considerable part o f the increased p ro d u c t io n w i l l (d e s ira b ly ) be at the expense of imports. T let f o r e ig n exchange savings an a lso presently not estimated, although probably p o s i t i v e . In individual markets, one would expect s ign if ica n t p r ic e - re d u c in g ( o r price-containinc e f fe c ts only where production expansion is la rg e r e l a t i v e to the present (domestic goods plus imports) market. On b r i e f e xa m in a t io n , t h i s might be the case fo r under 1/3 of the products covered . In s h o r t , a n a lys is is very incomplete, and conjecture about the gaps does not sup p ort the view the i n i t i a l recovery program w i l l have a dram atic s h o r t - te rm impact on re in f la t io n or saving foreign exchange except under the p r ic e c o n t ro l scene1
discussed in section (iv) of this Report. But i t does appear to be a necessary s ta r t , and should be seen in the l i g h t o f la r q e r p o te n t ia l futi1 b e n e f its .
I I Further Short Term Issues
w i re 3 k ^ W h ig h -p ro f i le issues which need to be addressed ay, ut may have only marginal impact on immediate re v iv a l .
o f D H v a t i 7 flHnn n i 1l? ^ ructed to proceed w ith s tudy and implemented r toP ! ^ Wlth the 3im 0f s e l l i n 9 some companies and/or sel
envisaqinq funds hp^nn 1nV6St°rS 0r the Pub1 ic a t la r g e . UDC is agree; although lo y a l ty in t ^ U D M ^ d ^ fu r th e r in d u s t r i a l development lrnt should be a c t ive ly evaluated fn k Whi1e p e e i n g th a t privatif o r reasons mainly of donor r l j substantlve reasons, and v i s i b l y under-
esponse, immediate r e s u l t s should not be ex--

Exceptions would be cases where there i s no o th e r way o f reactiva t ing production from e x is t in g assets in the near fu t u r e o r where Privatization would s p ^ d the p í i l e » ? no such cases have so f a r been id e n t i f ie d For present UDC companies, some i n i t i a l r e v iv a l i s argued to be warranted prior to p r i v a t i z a t io n . The argument is based on the need f o r s P^ed in rev ita liza tion , the norm ally le n g th y process in vo lve d i n p r i v i t i z a t i o n , and the unattractiveness o f most companies. In s h o r t , proceed w ith re c o v e ry w h i le proceeding with p r i v a t i z a t io n , and make the process v i s i b l e to Ugandans and donors. As a re la te d p o in t , i t i s suggested th a t h o te l and ra nch in g operations , now under d i r e c t m in is t r y c o n t r o l , be t ra n s fe r re d (back) to UDC. Experience w ith m in is t r y management o f commercial ven tu res has been a most uniformly bad, and p r i v a t i z a t io n prospects appear b e t t e r under UÜL.
2. In d u s t r ia l WagesOver t im e , in d u s t r ia l wages are re p o rte d to be q u ite c losely
t ie d to p u b lic s e c to r wages, so th a t even h ig h e r le v e l wages are now below s u rv iv a l l e v e l . Mast companies add some com bination o f food , accommodation, schoo ling ( r a r e l y ) , hea lth ca re , and p a y m e n ts - in -k in d to provide an overall s u rv iv a l package. To ta l compensation ro u g h ly keeps pace w ith in f la t io n of n e ce s s it ie s fo r a l l contacted companies e xce p t one. Workers a lso pursue other a c t i v i t i e s - food g row in g , o th e r jo b s , e t c . - to s u b s is t . Th is undoubtedly reduces p r o d u c t i v i t y in in d u s t r y . W h ile o th e r a na lyses address wage issues in d e t a i l , i t i s noted t h a t , as in d u s t r ia l re c o v e ry p roceed s , there appears to be a need to a d ju s t wages s i g n i f i c a n t l y upward o r r a is e the purchasing power o f present incomes i f o n ly to in c re a s e p r o d u c t i v i t y .
3. Fore ign InvestmentForeign investm ent w i l l be im p orta n t to medium-term rehabilitation
and expansion. Review o f the c u r re n t l e g i s l a t i o n and in c e n t ive s is proceeding w ith a view to n e a r - fu tu re announcement o f a new package; i t is h ig h ly d e s ira b le th a t d e la y in t h is process be m in im ized . A c t ive encouragement o f fo re ig n development should be v i s i b l e a t a l l levels o f Government.
4. Non T r a d i t io n a l ExportsPresent and past in d u s t r ia l e xp o r ts noted from documents and
d iscussions a r e : ' f a b r i c a t e d metal products (UGUMA - p re s e n t ly exporting to coun tr ies in the r e g io n ) ; t e x t i l e ya rn (Uganda S p in n in g M i l l - set up to export to the USSR, but looted and not c u r r e n t l y o p e r a t in g ) ; p la st ic ware (Ship Toothbrush L td . - beginning to e x p o r t to w este rn Kenya); and waraghi (E .A . D i s t i l l e r i e s - fo rm e r ly e x p o r t in g to the USA). F u rth e r prospects suggested as r e a l i s t i c in c lu d e : phosphate f e r t i l i z e r (T IC A F - re g io n a l production by Uganda re c e n t ly g iven PTA a p p ro va l, but p r o je c t v i a b i l i t y is questionable and o the r coun tr ies such as Zimbabwe may move f i r s t ) ; ju i c e s (pineapple); instant c o f fe e ; s a l t (Lake Katwe S a l t , i f te c h n ic a l problems u l t im a t e ly permit r e h a b i l i t a t i o n ) ; asbestos sheets; f ishmeal and f i s h o i l (Tufmac); canned meat (Uganda Meat Packers, a lthough f e a s i b i l i t y o f p la n t r e h a b i l i t a t io n is in q u e s t io n ) ; f in is h e d le a th e r p roducts ; ce ra m ics ; and processed/dried vegetables. Some n o n - t ra d i t io n a l e xp o rts w i l l ( re)em erge o r expand as recovery proceeds. Others can be expected to be i d e n t i f i e d and pursued by private companies. At p re se n t , no immediate government resources o r measures have
ld ®n t l f ]®d needed to support expansion o f non t ra d i t io n a l exports, o the r than a l lo c a t io n s fo r those companies l i s t e d in Table A. I t is further

rP industria l export p r o je c ts , envisaged to require suggested that a l l tutu're thoroughly appraised be fore any commitmentsgovernment resources, be ^ import - s u b s t i t u t io n p r o je c ts beingmade. This applies equa y ai cohol from s u g a r/ b y -p ro d u c ts , vehicle suggested fo r the long ru vk v ia b i l i t y is probably n i l , and whose perform assembly) whose potential in the region has been disastro .
5. Asset Re v a lu a t i o n f a s se ts , w i th i n f l a t i o n , isThe d eter io ra t on of » * « t j a f fe c t jn g a b i l1 t y t 0 b o r ro ¿ . , t
regarded by many comp $ and banks were o p e ra t in g e f f e c t i v e l y .should not, i f both c p argued to lack in t e r e s t in companyC om e rc ia l banks, i > P « t i c la rd a re o j ^ ^ co , l a t e r a l and #
?o lePthereafte?er To the extent that th is w i l l c o n t in u e , a sse t re v a lu a t i . i ^ y be h e lp fu l , p a rt icu la r ly as a catch-up f o r past ye a rs o f i n f l a t i o n , unr is oresentiv revaluing assets of most o f i t s companies and severa l p r iv a te firms have recently done or are doing l i k e w is e . With continu ing in f la t io n however, revaluations are cont inuous ly outdated and should not be regarded as major contributors to educate Banks management enhanced cred itw orth iness.
6 . S k i l le d Manpower Supply and Tra in ingOn questioning, none of the companies contacted in d ic a te d shorta;
o f s k i l l s as a serious constraint to production expans ion . Nevertheless, gaps w i l l appear as broader rehab il ita t ion and expansion proceed. Other analyses examine tra in ing p r io r i t ie s , and a p p ro p r ia te i d e n t i f i c a t i o n and t ra in in g a c t iv i t ie s should unquestionably proceed in p a r a l le l w ith production expansion measures.
I l l Long Term Industr i l Strategy and P o l ic y
Time has not permitted an adequate a n a lys is o f t h is s u b je c t . Propos; by the M in is try of Industry (11th March, 1986) are a l im i t e d but reasonat s t a r t although many projects, as noted above, are q u e s t io n a b le and w i l l requ ire thorough appraisal where governmental resources are envisaged.The focus on resource-based industries appears a p p ro p r ia te , but not to tl exc lus ion of emerging s k i l ls -based products. Planned te ch n o lo g y develops e f f o r t s w arrant,the ir renewed emphas>sé. However, the s m a l l -s c a le indusf s t ra te g y appears unduly top-heavy and b u re a u c ra t ic . I d e n t i f y i n g needs an: p o s s ib i l i t ie s on the ground is essentia l; prospects f o r expansion and technology assimilation/development are m ajor, and support needed from government is minimal i f based on close contact w ith the in d u s t r ie s and f
Without detailed reviews of project ana lyses , i t is d i f f i c u l t to suggest p r io r i t ie s among industrial p ro jects conta ined in the Investment nn H prt^pne! f Si? PP0arSi Very imProbable that a l l these p ro je c ts can be Dortíon of t n t a *’■ Whlle donor fundin9 p rov ides a s ig n i f i c a n t substantia l and f un. lng ln most cases, loca l fund ing requirem ents are Dro iects w i l l t h n s T 9? °inS need to be re Paid w i t h i n t e r e s t . Sequent;kk/i:: ¡Sírí,:; aa, s. » * - «

. . . th rpe maior c r i t e r i a , in a d d i t io n to basicGovernment has 1 ndica te d th re e j be usgd , n assessiProject (socio-economic v i a b i l i t y . h {he output j$ a basicp r i o r i t i e s . The f i r s t i s the e x ie . ^ ^ t h js c a te g o ry jnclu(jes p e c i f i c in d u s t r ia l products ’ " d i “ The second maj o r c r i te r io n is ’sugar, b la n ke ts , hoes, t e x t i l es and p n Q t a b l e t h a t P r o j e c t P r o f i l . net fo re ig n exchange sav ing/earn n g ^ f o r e i g n exchange savings, but do notthe Investment Plan make s a v in gs . I t i s extremely importan?t h a t ’ these c a lc u la t io n s be done c o r r e c t l y as part o f project appraisal pr1or t0 that these ca lcu la t ion s De the above recolmendat,on ff u r t h e r p ro je c t commitments be ing ma , p c r i te r io nte ch n ica l a ss is tan ce in p r o je c t ® P P r " d i ¿ a t e s a r e the beverage and tobacco
government revenue earned Obv P ^ ^ , t h a t n e t revenue c a l c u l a t i o n s be in d u s t r ie s . Aga in boweve * , t aDDr a i s a l . P r o je c ts t h a t promote an
in tegra tecTan d s e l f - [ u s t a i n i n g economy: A g r o - In d u s t r ie s - Industr ies like s tee l which produce inpu ts f o r o th e rs .
Given l im i te d in fo rm a t io n a v a i la b le , o n ly a crude s t a r t can be made a t suggesting p r o je c t p r i o r i t i e s . Tab le 1 summarizes the ™jsuJ ts a s e t o f c a lc u la t io n s in which major i n d u s t r ia l p r o je c t s in the Investment P an were c ru d e ly assessed in terms o f the th re e c r i t e r i a o u t l in e d above. Local funding requirements and p r o je c t l in k a g e s were a ls o taken in o^account.There are a lso some cases where "Uganda I n d u s t r i a l S e c to r Memo of 1985 flags the fo l lo w in g p rodu ction processes as fu n d a m e n ta l ly econ om ica lly inefficient in 1983, even w ith c a p i ta l costs t re a te d as sunk. (C u lc u la t io n s of Domestic Resource Cost need u p d a t in g , but the re la te d p r o je c t s need to be assessedw ith p a r t i c u la r c a r e . ) : .-h e ss ia n ckoth (Uganda Bags) -p loyw ood ( K i r i r a S a w m il ls ) .-c o v e r paer (Papco) —lim e and cement (Uganda Cement)- b i c y c le tubes (Dunlop) - c o t t o n seed o i l (Emco)-dom estic cables (Cable C o rp .) - g lo s s p a in t ( In t e r n a t io n a l Paints)-paper sacks (A ssoc ia ted Paper) - f i s h n e t (Uganda F is h n e t)
Table 1 leaves out many o f the 33 in d u s tr ie s/ co m p a n ie s included in P ro je c t IT -0 7 . W hile most o f these companies a re earmarked fo r support in the immediate re co ve ry program, to g e t them back on t h e i r fe e t , i t is recommended th a t most not be g iven p r i o r i t y f o r r e h a b i l i t a t i o n and expansion in the In ve stm e n t 'P la n , except f o r those produ cts (on Ta b le 1) indicated as basic needs o r having im portant l in ka ge s w ith o th e r p r i o r i t y industries. The p r i o r i t i e s in d ic a te d in Table 1 can and should be q u e st io n e d . In the end, there i s no good a l t e r n a t i v e to thorough a p p ra is a l and sequencing within fu tu re budgetary and borrowing c o n s t r a in ts .


C O N T E N T SPage
11. Back ground ....................................................
2. The m a j o r m inera ls whose p ro d u c t io n
could add s i g n i g i c a n t l y to the
c o u n t r y 's economy .
(a ) Copper .................................................... 2
(b ) Wolfram and c o s s i t e r i t e ............ 18
(c ) Phosphate ............................................. 21
(d) L im e s to n e ............................................. 25
(e ) C la y and K a o l i n ............................... 25
( f ) B rine ...................................................... 26
3. In te g ra t in g the mineral in d u s t r y
in Uganda................ ........................................... 27
4. The Role o f the G eo log ica l Survey
and Mines Department................................ 28
5. M ineral E xp lo ra t io n by Te ch n ica l
A id teams and External companies .. 30
6 . Proposal to in trodu ce
new Mining P o l ic y ................................... 30

1. Background
. The mining industry in Uganda has been on the decline
since 1970 as i s c l e a r l y shown i n t a b l e
The p r in c ip a l reasons f o r the d e c l in e a re .
(a) the u n c e r ta in ty and i 1 1 -co n c e ive d changes in the investment codes
in s t i t u t e d by the May 1970 Nakivubo d e c la r a t io n s and axacerbated
th e re a f te r during subsequent reg im es.
(b ) Inadequate f in a n c in g to support m in ing o p e ra t io n s .
(c ) World i n f l a t i o n , heightened by the petro leum p r ic e r ises of 1973
r e s u l t in g in increased mining o p e ra t io n s o f p a r t i c u la r y developing
c o u n t r ie s . A c t u a l l y as the i n d u s t r i a l i s e d c o u n t r ie s paid more for
t h e i r petroleum imports , they passed on these increases through
t h e i r exp orts o f manufactured goods to n o n - in d u s t r ia l countries.
I t has to be apprec iated th a t Uganda as a d e ve lo p in g non-i ndustrial i sed
cou n try had to import spare p a r ts ,e q u ip m e n t , m achinery, consummates
such as e x p lo s iv e s , chem ica ls , fu e l e t c . a t e ve r increasing costs.
Cut backs in needed replacements e .g J i n j a Copper Smelter were
in s t i t u t e d r e s u l t in g in i n e f f i c i e n t o p e ra t io n s and subsequently to
a d e c l in e - in mineral p ro d u ct io n .
(d) Dep le t ion o f the r ic h and e a s i l y a c c e s s ib le ore reserves.
(e ) H igher labour costs at e s p e c ia l l y the small t i n and wolfram
mine opera tions located in the South-W est o f Uganda.
( i ) Breakdown in in f r a s t r u c tu r a l s e rv ic e s o f e s p e c i a l l y the East
A f r ic a n ra i lw a y System which re s u l te d in the increase of freight
charges to and from Mombasa p o rt
( g ) A b s e n c e o f m a n a g e r , a ) and t e c h n i c a l s k i l l s r e s u l t i n g f r o m many
q u a l i f i e d U g a n d a n s l e a v i n g t h e c o u n t r y d u r i n g t h e l a s t 1 5 years.

- i - . -hncp n r o d u c t i o n c o u l d a d d s i g n i f i c a n t l y2. Th e ma. ior m ine r ^ w n o s e j j r u ------------------------------------------------ — ¿ --------------------------- j
t o t h e c o u n t r y ' s e c o nomy.
(a) COPPER
( i j pphahilitation of Mining O perations a t K ilem be:
The success o f copper mining a t Kilembe depends on the succe
implementation of three op era tions . These a r e : -
(a) The e x t r a t i o n o f ore from the ground.
(b) M in e r a l p r o c e s s i n g in v o lv in g ore c o n c e n t ra t io n to fora
copp er s u l f i d e c o n c e n t r a t e s .
(c) The s m e l t i n g o f copper s u l f id e co n c e n tra te s in t o blistf
copper.
A l l the three a c t iv i t ie s d e te r io ra te d s in ce 1973 u n t i l
mining operations were halted in A p r i l , 1979. I t should be
appreciated that a lo t o f money in the form o f fo re ig n
exchange w i l l be required i n i t i a l l y to re p la c e o r to
repair worn-out equipment and m achinery.
Also i t should be noted that the in d u s t r y c o n t r ib u te s sub
s ta n t ia l ly to employment and to fo r e ig n exchange earnings
as indicated in table 2 and a lso helps in the development
of s k i l ls which can be u t i l i s e d : n o th e r i n d u s t r ie s ; a nece
ssary and desirable element in the development process.

r
- 3 -
TABLE 1: MINERAL PRODUCTION
Uni t 1970 1971 1972 1973 1974 1975 1976 1977 1978 1979 1980 1981 1982 1983 1984 1985
Gold Grams 93 67 - 18 6 8 2 0 32 365 489 62 282 304 215 1
C a s s i t e r i t e ( T in Ore) Tonnes 182 189 113 1 0 0 246 8 8 1 2 26 7 1 1 - 3 25
Wolframe (Cone) Tonnes 235 2 1 0 227 172 188 89 71 69 47 8 9 2 7 7
B ery l Ore Tonnes 367 221 73 133 156 40 14 21 - - - - -
B l i s t e r Copper Tonnes 16958 15731 1407T 9643 8912 8231 5366 2273 1302 762 - - - - ,
A p a t i te Tonnes 30318 15024 14582 17451 13501 4892 2116 t •
11
1 Bismuth Tonnes • • 13.6 1 . 2 2 . 8 . . . . . . . . . . . TC olum bite - T a n t a l i t e Tonnes 3 4.1 1 . 8 6.5 5 2 . 1 0 .............................. 1Limestone 2 T 27 8 291361 232245 199771 156195 na na 35305? ..............................
Notes: Kilembe stopped p roduction in A p r i l , 1979 f o r the lack o f spare p a r ts .
(♦ P r o v is io n a l )
" — " means N i lmeans not a v a i la b le
Source: G eo log ica l Survey & Mines Department,Kilembe Mines L td .
r

/ k \ - 1956 1960 1964 1968 1972 1976 1979/80 1987 (d )(b)
i l a r i e s (Ug. S H s . ) 7,460,000 14,690,000 18,862,000 29,403,380 33,182,000r _ ..................■ij
US % 1 ,044,380 2,056,560 2,640,630 4,116,390 4,278,780 | 5,000,000
(c))cai purchases( U g . Shs. ) 1 ,044,380 1
1 ,577 ,630 3,928,040i
4,523,080 2,871,050j
¡ 3,000,000
US 2 '1!i
verseas Purchases 1 ,892,762 1 ,695,926 1 ,070,139 1 ,914,545 1 ,854,288 .. j 4 , 0 0 0 , 0 0 0US $ i
ii
opper e xp o rts (tonne) 14,752 18,265 15,602 14,071 500 184
j
| 8,500
J alue exp orts U S 2 7 ,947 ,300 9 ,614 ,200 17 ,737,260 19 ,443 ,230 15 ,319,870 5 ,772 ,192 296,700 ’ 13 ,000 ,000
^ve^age cost per tonne ( U S 2 ) 652 971 1 ,246 1 ,089 1 ,154 1 , 6 1 2
■1 ,500
Notes
Source:
Inc ludes fo re ig n exchange element: E xp a tr ia te s t a f fIncludes fu e ls and o i l s e tc . costs re q u ir in g fo re ig n exchange by o i l companies Includes manufactured good which have fo re ig n elementPro jected
Not a v a i la b le N il
Kilembe Mines L t d . , June 1986.