Embed Size (px)
Citation preview

Graduated Driver Licensing A regional analysis of potential casualty savings in Great Britain
Neale Kinnear, Louise Lloyd, Jennifer Scoons & Shaun Helman TRLMay 2014
b
The Royal Automobile Club Foundation for Motoring Ltd is a transport policy and research organisation which explores the economic, mobility, safety and environmental issues relating to roads and their users. The Foundation publishes independent and authoritative research with which it promotes informed debate and advocates policy in the interest of the responsible motorist.
RAC Foundation 89–91 Pall Mall London SW1Y 5HS
Tel no: 020 7747 3445 www.racfoundation.org
Registered Charity No. 1002705 May 2014 © Copyright Royal Automobile Club Foundation for Motoring Ltd
c
Graduated Driver Licensing A regional analysis of potential casualty savings in Great Britain
Neale Kinnear, Louise Lloyd, Jennifer Scoons & Shaun Helman TRLMay 2014
i
About the AuthorsDr Neale KinnearNeale is a principal psychologist in the study of human behaviour and transport at TRL, the UK’s Transport Research Laboratory. His PhD investigated the psychological processes through which novice drivers learn to anticipate hazards. Subsequently, he has led and contributed to numerous studies evaluating driver training and education, advanced methods for driver instruction, and studies to understand the needs of novice drivers. In 2013 Neale was the lead author of an international evidence review of best practice for improving novice-driver safety in Great Britain for the Department for Transport (DfT). Neale has also served as a collision investigator, attending crash scenes and providing psychological input to crash reconstruction.
Dr Louise LloydLouise is a Chartered Statistician specialising in road safety statistics at TRL. She is an expert in British accident and exposure data and in European road safety data, having been involved in several EC Road Safety projects. Louise recently led research to determine the reasons for the reduction in fatalities across Great Britain between 2007 and 2010, which concluded that economic factors influenced driver behaviour and reduced dangerous driving during this period. She was second author for DfT’s recent publication on best practice for improving novice-driver safety in Great Britain. She has just completed a PhD in Bayesian modelling of road accident and exposure data in collaboration with Southampton University.
Jennifer ScoonsJennifer is a researcher in the road safety group at TRL with extensive experience of analysing road collision and casualty data. Jennifer regularly uses collision, vehicle, casualty and contributory factor data from STATS19, in combination with exposure data such as traffic or population data, to compare risk. Her work includes annual production of the data used by the Road Safety Foundation to produce the risk rating of Britain’s main roads, analysis of blood alcohol and drug data relating to road fatalities, and extracting figures from the STATS19 database for DfT’s recent publication on best practice for improving novice-driver safety in Great Britain.
Dr Shaun HelmanShaun is TRL’s Head of Transport Psychology, and has over a decade of experience working in road safety. His research focus is on improving the safety of high-risk road user groups including young and novice drivers, motorcyclists and cyclists, and those who drive for work. He has led studies on a range of road safety topics including the safety of young and novice drivers, a topic on which he has published widely in peer-reviewed journals, at international conferences, in sponsored reports, and in the popular media. He was an author and the technical reviewer on the recent DfT international evidence review of best practice for improving novice-driver safety in Great Britain.

ii
Acknowledgements
DisclaimerThis report has been prepared for the RAC Foundation by Neale Kinnear, Louise Lloyd, Jennifer Scoons and Shaun Helman of TRL. The report content reflects the views of the authors and not necessarily those of the RAC Foundation.
The authors would like to thank Elizabeth Box and Ivo Wengraf of the RAC Foundation, Scott Le Vine of the Centre for Transport Studies at Imperial College London, and the three anonymous peer-reviewers for their contributions to this report.
STATS19 data used in this report are Crown copyright and are reproduced with the permission of the Department for Transport.
iii
ContentsForeword v
Introduction 1
Background 5
2.1 Data 7
2.2 Effectiveness 8
2.3 Regions 10
2.4 Assumptions and limitations 11
The Potential Impact of a GDL System in Great Britain 13
3.1 England 21
3.2 Scotland 22
3.3 Wales 22
The Potential Impact of Night-Time & Passenger GDL Components 23
4.1 Night-time component 24
4.1.1 Great Britain 25
4.1.2 England 33
4.1.3 Scotland 33
4.1.4 Wales 34
4.1.5 Night-time component summary 34
4.2 Passenger component 35
4.2.1 Great Britain 35
4.2.2 England 43
4.2.3 Scotland 44
4.2.4 Wales 44
4.2.5 Passenger component summary 45
4.3 Night-time and passenger components combined 45
Conclusions 47
References 51
Appendix A 54
1
2
3
4
5
6

iv
Regions 54
Appendix B 55
Tables of Data 55
List of TablesTable 2.1: Strong and weak passenger and night-time component criteria 6
Table 2.2: Spectrum of overall effectiveness of GDL in Great Britain on casualties from collisions involving a 17- to 19-year-old driver 9
Table 3.1: Annual regional casualty cost savings and value of benefits from the implementation of a GDL system in Great Britain 14
Table 4.1: Night-time component criteria 24
Table 4.2: Expected reduction in collisions and casualties attributable to the implementation of GDL night-time component (strong vs weak) 34
Table 4.3: Passenger component criteria 35
Table 4.4: Expected reduction in collisions and casualties attributable to the implementation of GDL passenger component (strong vs weak) 45
Table 4.5: Expected reduction in collisions and casualties attributable to the implementation of both GDL night-time and passenger components (strong vs weak) 46
Table A.1: Regions used for analysis 54
Table B.1: Overall young driver casualty and collision numbers and expected reduction attributable to a full GDL system 55
Table B.2: Expected reduction in casualties and collisions attributable to GDL night-time strong component 59
Table B.3: Expected reduction in casualties and collisions attributable to GDL night-time weak component 63
Table B.4: Expected reduction in casualties and collisions attributable to GDL passenger strong component 67
Table B.5: Expected reduction in casualties and collisions attributable to GDL passenger weak component 71
Table B.6: Expected reduction in casualties and collisions attributable to GDL combined night-time and passenger strong components 75
Table B.7: Expected reduction in casualties and collisions attributable to GDL combined night-time and passenger weak components 79
Table B.8: Regional characteristics 83
v
List of FiguresFigure 3.1: Young driver KSI collision rate by region (number of KSI collisions involving a 17- to 19-year-old driver per 10,000 17- to 19-year-olds in the region) 18
Figure 3.2: KSI-casualty proportion by region (proportion of all KSI casualties from collisions involving a 17- to 19-year-old driver) 20
Figure 4.1: Likely absolute reduction in casualties attributable to strong night-time component (9 p.m. to 6 a.m.) 26
Figure 4.2: Likely proportional reduction in casualties attributable to strong night-time component (9 p.m. to 6 a.m.) 28
Figure 4.3: Likely absolute reduction in casualties attributable to weak night-time component (midnight to 5 a.m.) 30
Figure 4.4: Likely proportional reduction in casualties attributable to weak night-time component (midnight to 5 a.m.) 32
Figure 4.6: Likely proportional reduction in casualties attributable to strong young-passenger component (no 15- to 24-year-old passengers) 38
Figure 4.7: Likely absolute reduction in casualties attributable to weak young-passenger component (no more than one 15- to 19-year-old passenger) 40
Figure 4.8: Likely proportional reduction in casualties attributable to weak young-passenger component (no more than one 15- to 19-year-old passenger) 42

Those parents – and it must be almost all of them – who worry when their children start to drive solo have good reason to be concerned.
Recently qualified drivers – particularly those in their teenage years – face a disproportionate risk of being involved in a tragic accident that may involve death or serious injury, not only to themselves but also to their passengers and other road users.
But how does that hazard vary depending on where in the country you live, and whether it is urban or rural? This report addresses these questions. But it also assesses the likely effectiveness of a system of graduated driver licensing (GDL), something common in many other countries.
We have previously published persuasive evidence derived from good practice abroad that some degree of restriction on newly qualified drivers would reduce these risks. If we were to introduce this life-saving measure in Great Britain, where would the greatest benefits be – in the big cities or the remote countryside? Would there be a North/South divide? Do Scotland and Wales stand to gain more, or less, than England? What would happen where you live?
Additionally, this report presents new information on the numbers of young drivers who might suffer detriment to their ability to work as a result of these restrictions.
The RAC Foundation fully recognises that driving is the key to mobility for most people and, in particular, that it is vital in enabling many young adults to commute to work – indeed, there are those for whom it is their work. Restrictions are undesirable from this point of view. And that is why in other jurisdictions, in certain circumstances, exemptions have been introduced. But this report tells us that the numbers directly inconvenienced would be quite small. Against that, the gain from graduated licensing would be huge: potentially thousands more road-users saved from harm every year. Further, motor insurance premiums for young people would fall across the board, reflecting the reduction in risk and reduced claims made on insurers; and we know that insurance is itself a significant barrier to mobility of younger drivers.
People naturally hear about and care about things that happen in their own localities. I hope this report will help in building a consensus between individuals, local politicians, professions and the media that it is worthwhile to introduce GDL for the benefit of those they live alongside, and for the well-being of the nation as a whole.
Professor Stephen Glaister
Director of the RAC Foundation
vi
Foreword
vii
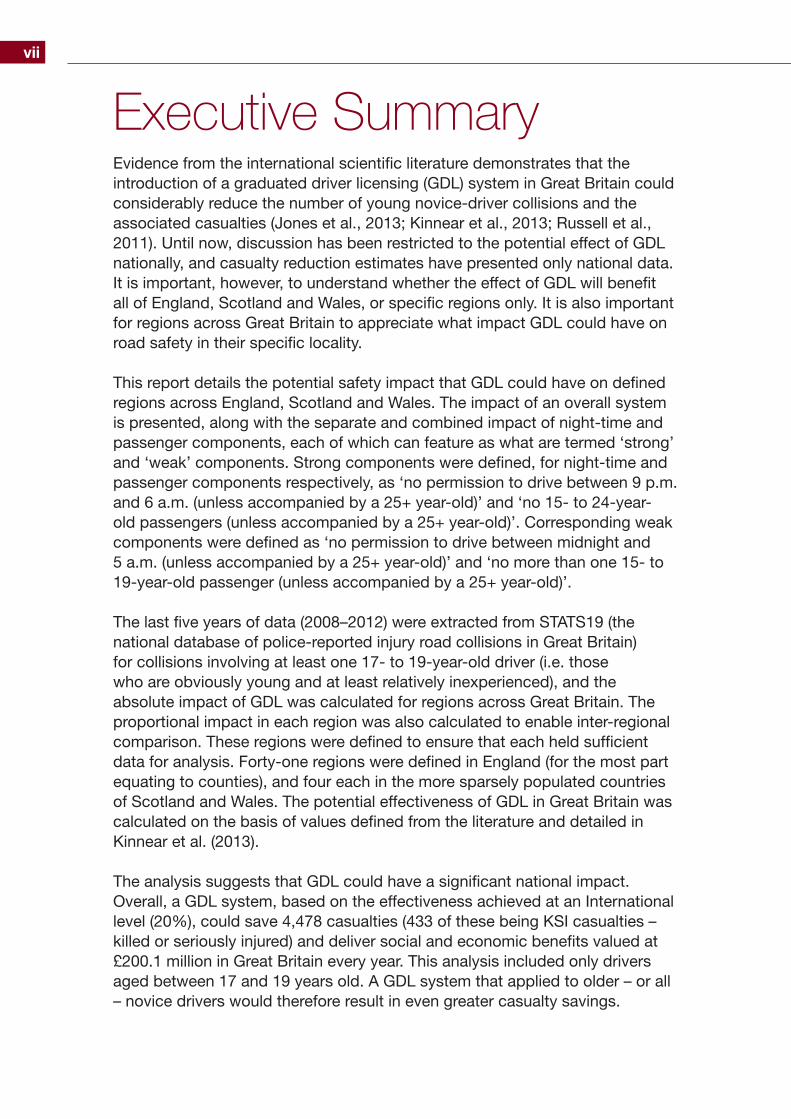
Executive SummaryEvidence from the international scientific literature demonstrates that the introduction of a graduated driver licensing (GDL) system in Great Britain could considerably reduce the number of young novice-driver collisions and the associated casualties (Jones et al., 2013; Kinnear et al., 2013; Russell et al., 2011). Until now, discussion has been restricted to the potential effect of GDL nationally, and casualty reduction estimates have presented only national data. It is important, however, to understand whether the effect of GDL will benefit all of England, Scotland and Wales, or specific regions only. It is also important for regions across Great Britain to appreciate what impact GDL could have on road safety in their specific locality.
This report details the potential safety impact that GDL could have on defined regions across England, Scotland and Wales. The impact of an overall system is presented, along with the separate and combined impact of night-time and passenger components, each of which can feature as what are termed ‘strong’ and ‘weak’ components. Strong components were defined, for night-time and passenger components respectively, as ‘no permission to drive between 9 p.m. and 6 a.m. (unless accompanied by a 25+ year-old)’ and ‘no 15- to 24-year-old passengers (unless accompanied by a 25+ year-old)’. Corresponding weak components were defined as ‘no permission to drive between midnight and 5 a.m. (unless accompanied by a 25+ year-old)’ and ‘no more than one 15- to 19-year-old passenger (unless accompanied by a 25+ year-old)’.
The last five years of data (2008–2012) were extracted from STATS19 (the national database of police-reported injury road collisions in Great Britain) for collisions involving at least one 17- to 19-year-old driver (i.e. those who are obviously young and at least relatively inexperienced), and the absolute impact of GDL was calculated for regions across Great Britain. The proportional impact in each region was also calculated to enable inter-regional comparison. These regions were defined to ensure that each held sufficient data for analysis. Forty-one regions were defined in England (for the most part equating to counties), and four each in the more sparsely populated countries of Scotland and Wales. The potential effectiveness of GDL in Great Britain was calculated on the basis of values defined from the literature and detailed in Kinnear et al. (2013).
The analysis suggests that GDL could have a significant national impact. Overall, a GDL system, based on the effectiveness achieved at an International level (20%), could save 4,478 casualties (433 of these being KSI casualties – killed or seriously injured) and deliver social and economic benefits valued at £200.1 million in Great Britain every year. This analysis included only drivers aged between 17 and 19 years old. A GDL system that applied to older – or all – novice drivers would therefore result in even greater casualty savings.
viii
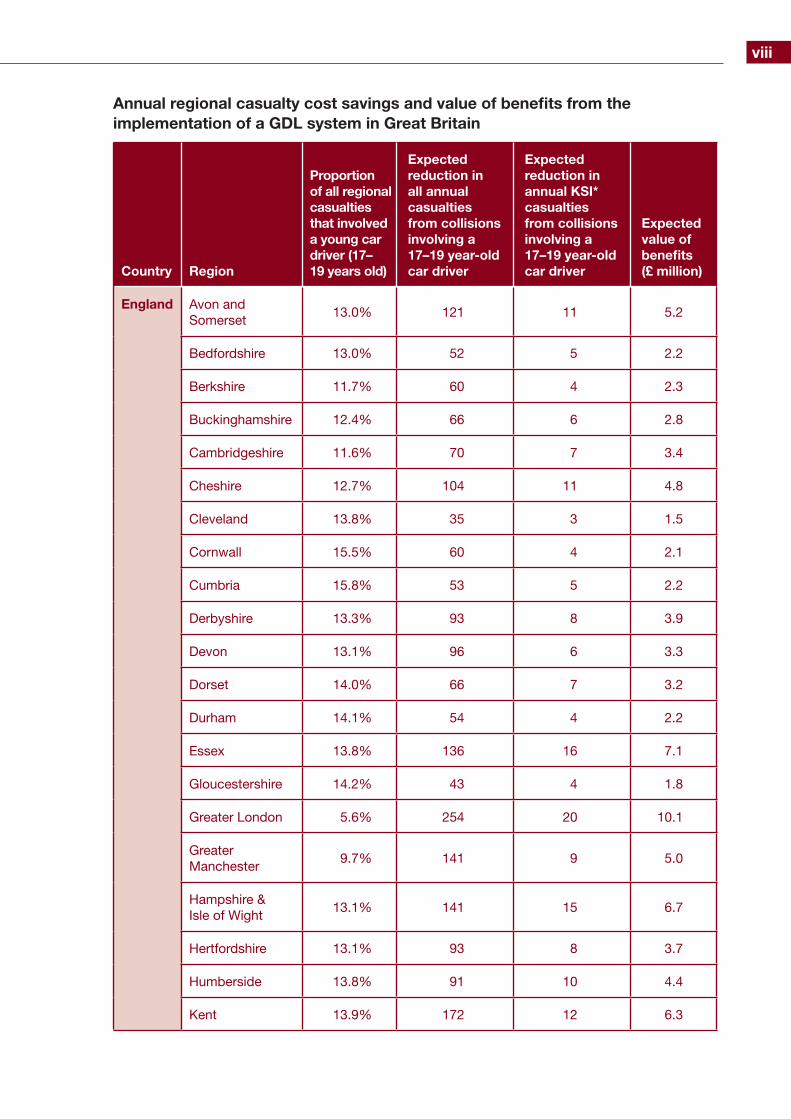
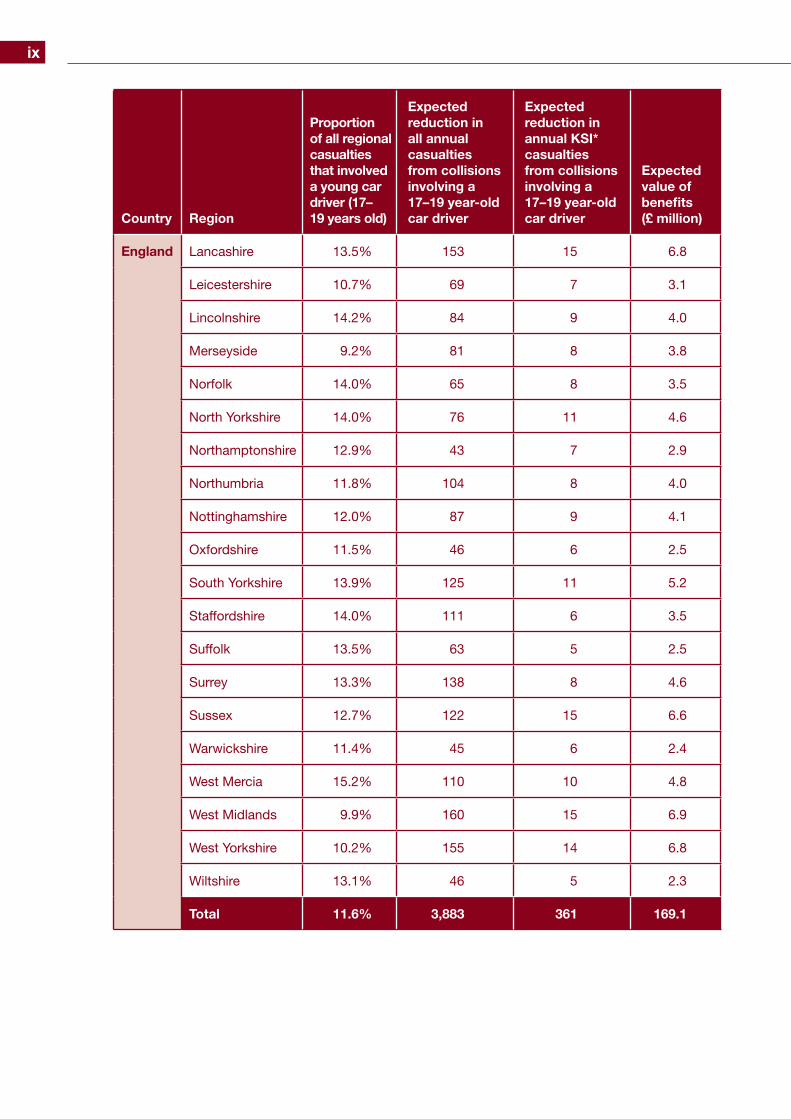
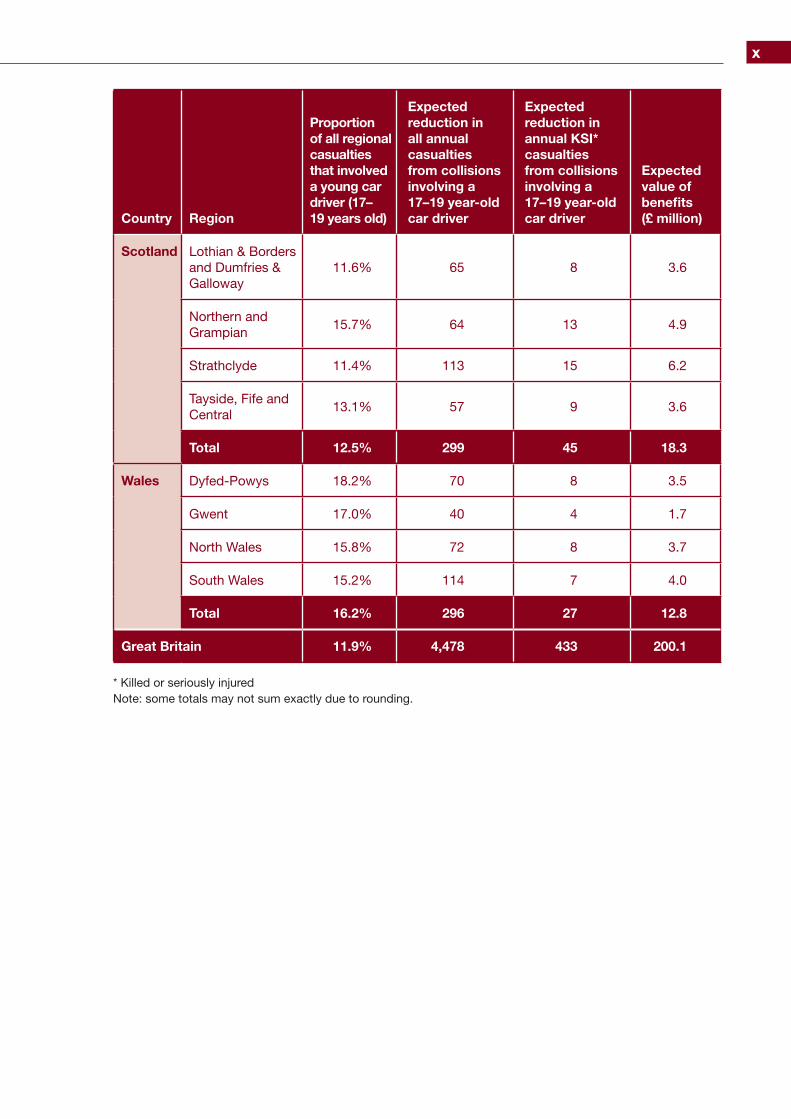
Annual regional casualty cost savings and value of benefits from the implementation of a GDL system in Great Britain
Country Region
Proportion of all regional casualties that involved a young car driver (17–19 years old)
Expected reduction in all annual casualties from collisions involving a 17–19 year-old car driver
Expected reduction in annual KSI* casualties from collisions involving a 17–19 year-old car driver
Expected value of benefits (£ million)
England Avon and Somerset
13.0% 121 11 5.2
Bedfordshire 13.0% 52 5 2.2
Berkshire 11.7% 60 4 2.3
Buckinghamshire 12.4% 66 6 2.8
Cambridgeshire 11.6% 70 7 3.4
Cheshire 12.7% 104 11 4.8
Cleveland 13.8% 35 3 1.5
Cornwall 15.5% 60 4 2.1
Cumbria 15.8% 53 5 2.2
Derbyshire 13.3% 93 8 3.9
Devon 13.1% 96 6 3.3
Dorset 14.0% 66 7 3.2
Durham 14.1% 54 4 2.2
Essex 13.8% 136 16 7.1
Gloucestershire 14.2% 43 4 1.8
Greater London 5.6% 254 20 10.1
Greater Manchester
9.7% 141 9 5.0
Hampshire & Isle of Wight
13.1% 141 15 6.7
Hertfordshire 13.1% 93 8 3.7
Humberside 13.8% 91 10 4.4
Kent 13.9% 172 12 6.3
Country Region
Proportion of all regional casualties that involved a young car driver (17–19 years old)
Expected reduction in all annual casualties from collisions involving a 17–19 year-old car driver
Expected reduction in annual KSI* casualties from collisions involving a 17–19 year-old car driver
Expected value of benefits (£ million)
England Lancashire 13.5% 153 15 6.8
Leicestershire 10.7% 69 7 3.1
Lincolnshire 14.2% 84 9 4.0
Merseyside 9.2% 81 8 3.8
Norfolk 14.0% 65 8 3.5
North Yorkshire 14.0% 76 11 4.6
Northamptonshire 12.9% 43 7 2.9
Northumbria 11.8% 104 8 4.0
Nottinghamshire 12.0% 87 9 4.1
Oxfordshire 11.5% 46 6 2.5
South Yorkshire 13.9% 125 11 5.2
Staffordshire 14.0% 111 6 3.5
Suffolk 13.5% 63 5 2.5
Surrey 13.3% 138 8 4.6
Sussex 12.7% 122 15 6.6
Warwickshire 11.4% 45 6 2.4
West Mercia 15.2% 110 10 4.8
West Midlands 9.9% 160 15 6.9
West Yorkshire 10.2% 155 14 6.8
Wiltshire 13.1% 46 5 2.3
Total 11.6% 3,883 361 169.1
ix
Country Region
Proportion of all regional casualties that involved a young car driver (17– 19 years old)
Expected reduction in all annual casualties from collisions involving a 17–19 year-old car driver
Expected reduction in annual KSI* casualties from collisions involving a 17–19 year-old car driver
Expected value of benefits (£ million)
Scotland Lothian & Borders and Dumfries & Galloway
11.6% 65 8 3.6
Northern and Grampian
15.7% 64 13 4.9
Strathclyde 11.4% 113 15 6.2
Tayside, Fife and Central
13.1% 57 9 3.6
Total 12.5% 299 45 18.3
Wales Dyfed-Powys 18.2% 70 8 3.5
Gwent 17.0% 40 4 1.7
North Wales 15.8% 72 8 3.7
South Wales 15.2% 114 7 4.0
Total 16.2% 296 27 12.8
Great Britain 11.9% 4,478 433 200.1
* Killed or seriously injuredNote: some totals may not sum exactly due to rounding.
x
xi
The greatest absolute number of these casualties would be saved in the more populated, often more urban, regions of England, Scotland and Wales. In these regions, young driver collisions (those in which at least one young driver is involved) make up a smaller proportion of all collisions than is the case in more rural – and less populated – areas of Great Britain. Nevertheless, the predicted collision and casualty savings and values of associated benefits are significant in these regions due to population sizes, and it would therefore be expected that GDL would have a measurable impact on their communities.
Analysis of the relative effect of GDL suggests that it is the more rural regions that would benefit most. In these regions, young driver collisions make up a greater proportion of the total than is the case in the more populated ones. While these areas are therefore less populated, in relative terms the reduction in young driver collisions and associated casualties in such regions will be felt more keenly.
With regard to the night-time component, analysis revealed that a strong component would be substantially more effective in reducing collisions and casualties than a weaker component. Little variation was found geographically, although some regions appeared to show evidence of peaks in collisions at certain times that sat either side of the defined restriction. Defining the times at which a GDL restriction might be imposed is therefore important. A weak component will still be effective and may not have much impact on young drivers’ need to drive to a place of work; analysis of National Travel Survey data suggests that 13.5% of all 17-to 19-year-old full licence holders report driving to or from work between 9 p.m. and 6 a.m. and 1.9% report driving for work between these hours, while only 2.6% of 17- to 19-year-old full licence holders report driving to or from work between midnight and 5 a.m., and a mere 0.5% drive as part of their job during this time. A stronger component would clearly save a greater number of casualties, but would obviously have a greater impact on travel within the first year of licensure.
Results also suggested large differences between the effects of implementing a strong and a weak passenger component. The safety benefits afforded by the strong component appear to be spread reasonably evenly across the regions, although results suggested that collisions involving multiple young passengers are more prevalent in some regions than in others.
In conclusion, this analysis provides the basis for discussion at a local level about the safety benefits that a national GDL system could bring. Taken as a whole, the evidence and the analyses presented here add to those revealed in the DfT review (Kinnear et al., 2013) in suggesting that a substantial contribution to improving the safety of young and novice drivers in Great Britain, and other road users with whom they interact, would be provided by the introduction of a strong GDL system. A summary of the potential casualty savings and expected social and economic benefits of GDL in each region can be seen in Table 1. The potential effect of individual passenger and night-time components is also presented.

xii

1. Introduction
Graduated Driver Licensing: A regional analysis of potential casualty savings in Great Britain1
The current system of driver licensing in Great Britain requires that new drivers develop the skills necessary to pass a theory test, a computer-based hazard perception test and a practical driving test. The aim is to develop and license new drivers who are competent and knowledgeable, and can safely integrate with the general driving population. While the driver training and the testing format has been updated and improved over the years, it is reasonable to suggest that the current system overall does not support all of these aims; novice drivers are not nearly as safe as experienced drivers.
Introduction
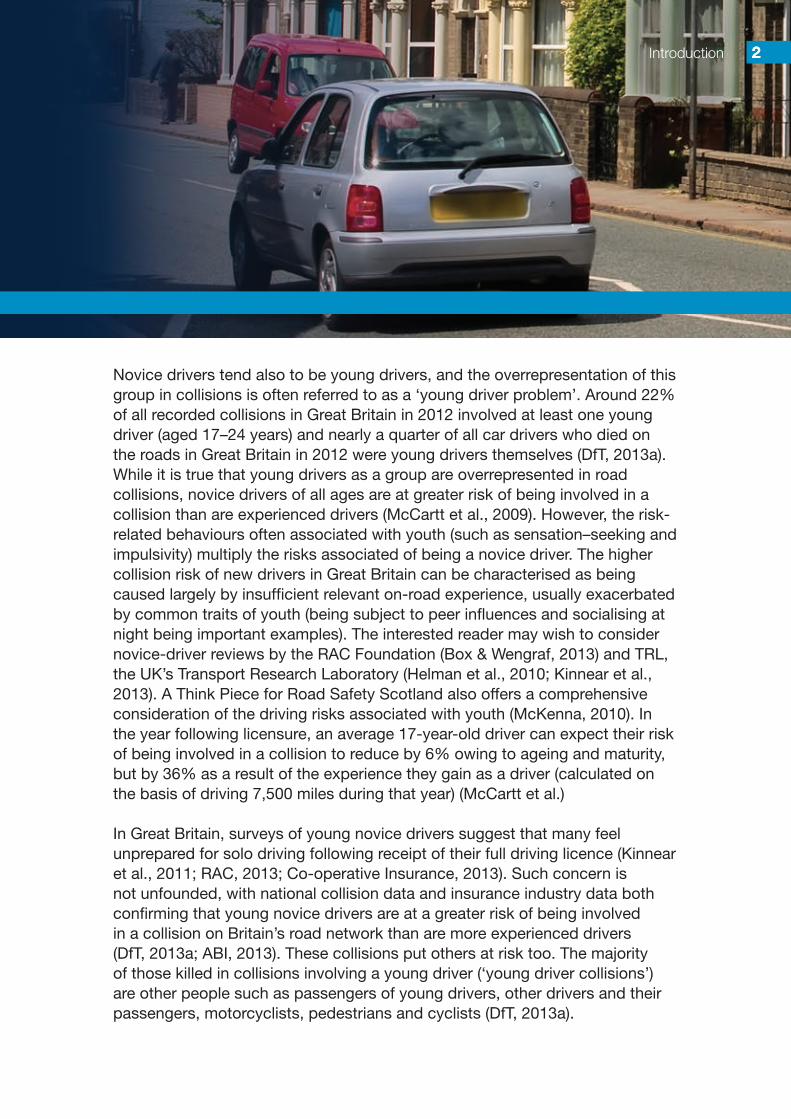
Novice drivers tend also to be young drivers, and the overrepresentation of this group in collisions is often referred to as a ‘young driver problem’. Around 22% of all recorded collisions in Great Britain in 2012 involved at least one young driver (aged 17–24 years) and nearly a quarter of all car drivers who died on the roads in Great Britain in 2012 were young drivers themselves (DfT, 2013a). While it is true that young drivers as a group are overrepresented in road collisions, novice drivers of all ages are at greater risk of being involved in a collision than are experienced drivers (McCartt et al., 2009). However, the risk-related behaviours often associated with youth (such as sensation–seeking and impulsivity) multiply the risks associated of being a novice driver. The higher collision risk of new drivers in Great Britain can be characterised as being caused largely by insufficient relevant on-road experience, usually exacerbated by common traits of youth (being subject to peer influences and socialising at night being important examples). The interested reader may wish to consider novice-driver reviews by the RAC Foundation (Box & Wengraf, 2013) and TRL, the UK’s Transport Research Laboratory (Helman et al., 2010; Kinnear et al., 2013). A Think Piece for Road Safety Scotland also offers a comprehensive consideration of the driving risks associated with youth (McKenna, 2010). In the year following licensure, an average 17-year-old driver can expect their risk of being involved in a collision to reduce by 6% owing to ageing and maturity, but by 36% as a result of the experience they gain as a driver (calculated on the basis of driving 7,500 miles during that year) (McCartt et al.)
In Great Britain, surveys of young novice drivers suggest that many feel unprepared for solo driving following receipt of their full driving licence (Kinnear et al., 2011; RAC, 2013; Co-operative Insurance, 2013). Such concern is not unfounded, with national collision data and insurance industry data both confirming that young novice drivers are at a greater risk of being involved in a collision on Britain’s road network than are more experienced drivers (DfT, 2013a; ABI, 2013). These collisions put others at risk too. The majority of those killed in collisions involving a young driver (‘young driver collisions’) are other people such as passengers of young drivers, other drivers and their passengers, motorcyclists, pedestrians and cyclists (DfT, 2013a).
22
The UK government has acknowledged that the overrepresentation of young novice drivers in road collisions is not sustainable. The Department for Transport (DfT) has published a review of the evidence for the effectiveness of various measures aimed at improving the safety of new drivers in Great Britain (Kinnear et al., 2013). The DfT review supported numerous previous reviews that conclude that the evidence as a whole does not support the assertion that traditional driver training and education reduces novice-driver collision risk (for previous reviews see Christie, 2001; Clinton & Lonero, 2006; Helman et al., 2010; Ker et al., 2003; Mayhew et al., 1998; Mayhew et al., 2002; Roberts & Kwan, 2001; Vernick et al., 1999). The research does not support the idea that such approaches could have a direct impact on reducing the number of novice-driver collisions on Britain’s roads. However, the introduction of a graduated driver licensing (GDL) system was recommended, as this approach has been supported by a large quantity of good-quality scientific evidence from around the world. A conservative estimate suggested that the introduction of a GDL system in Great Britain could reduce the number of casualties from collisions involving a 17- to 19-year-old driver by 20%, although the reduction may range between 10% and 40% depending on the strength of the system implemented. In addition to reducing the number of people who are affected by the trauma associated with road traffic collisions, the collision reduction equates to a potential economic and social benefit valued at approximately £224 million per year (Kinnear et al., 2013).
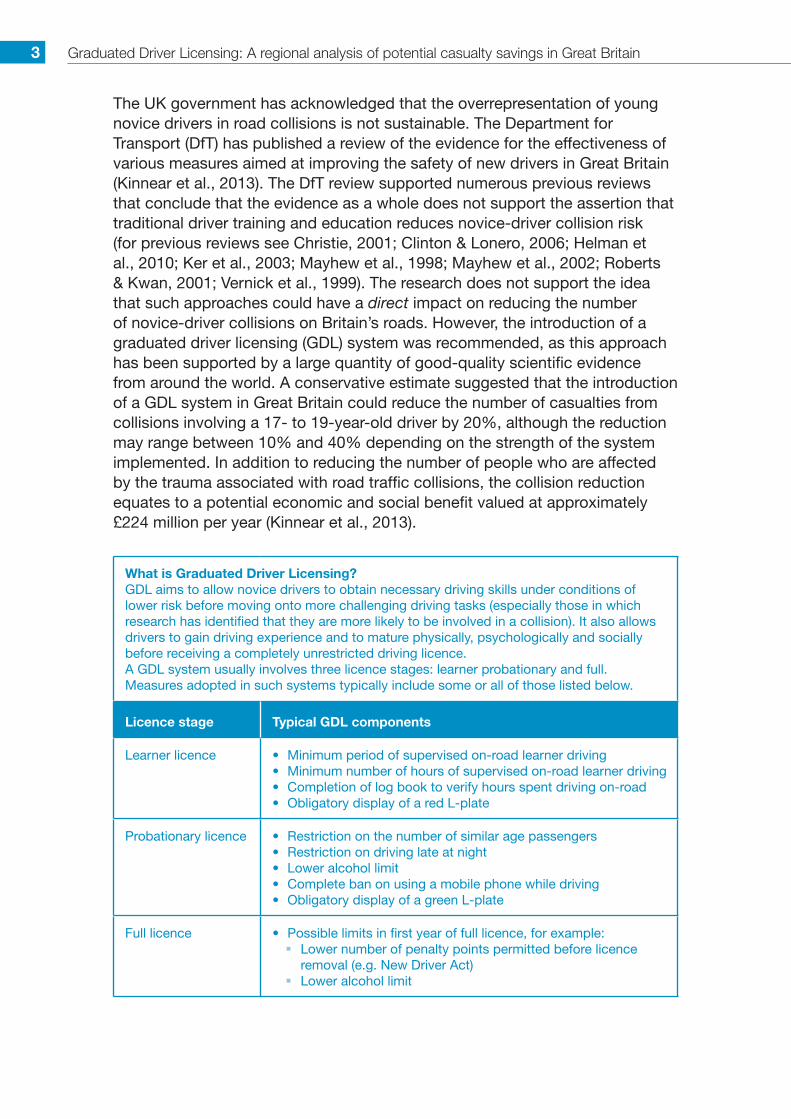
What is Graduated Driver Licensing?GDL aims to allow novice drivers to obtain necessary driving skills under conditions of lower risk before moving onto more challenging driving tasks (especially those in which research has identified that they are more likely to be involved in a collision). It also allows drivers to gain driving experience and to mature physically, psychologically and socially before receiving a completely unrestricted driving licence.A GDL system usually involves three licence stages: learner probationary and full.Measures adopted in such systems typically include some or all of those listed below.
Licence stage Typical GDL components
Learner licence • Minimum period of supervised on-road learner driving• Minimum number of hours of supervised on-road learner driving• Completion of log book to verify hours spent driving on-road• Obligatory display of a red L-plate
Probationary licence • Restriction on the number of similar age passengers• Restriction on driving late at night• Lower alcohol limit• Complete ban on using a mobile phone while driving• Obligatory display of a green L-plate
Full licence • Possible limits in first year of full licence, for example: � Lower number of penalty points permitted before licence
removal (e.g. New Driver Act) � Lower alcohol limit
Graduated Driver Licensing: A regional analysis of potential casualty savings in Great Britain3
From a public health perspective, the evidence for the implementation of a GDL system has been described as indisputable (Russell et al., 2011). Nevertheless, the debate about the applicability of GDL in Great Britain continues. Kinnear et al. (2013) looked for evidence for the validity of commonly cited concerns relating to the implementation of GDL and found no evidence that they cannot be managed, or that they offset the safety benefits of the system. Given that workable and effective GDL systems are in place in New Zealand, Australia, the USA and Canada, it is evident that such concerns and barriers to implementation can be overcome. GDL systems have been considered and implemented in Australasia and North America since the late 1970s, gaining most traction in the 1990s. Buoyed by evaluations demonstrating evidence for the effectiveness of the concept, and by increased public acceptance and a minimal impact on mobility, GDL has spread and evolved into all jurisdictions in these countries; in fact GDL, in some form, is a requirement for all new drivers in them.
One of the main concerns that has been highlighted is the potential for a GDL system to affect young drivers’ ability to get to and from, or drive for the purposes of, work. It is worth noting that GDL restrictions on night-time driving typically last for only the first 6–12 months after passing the driving test. Nevertheless, analysis of National Travel Survey data by the Centre for Transport Studies at Imperial College for this report suggests that only 2.6% of 17- to 19-year-olds report driving to or from work between midnight and 5 a.m., and a mere 0.5% drive as part of their job during this time. A stronger GDL night-time restriction, one that applies between 9 p.m. and 6 a.m., would affect only the 13.5% of 17- to 19-year-olds who are driving to or from work (and the 1.9% driving for work) in this period. This data suggests that the majority of young novice drivers commuting or driving for work would be unaffected by GDL night-time restrictions, even if a restriction between 9 p.m. and 6 a.m. was applied. In addition, not even 1% of 17- to 19-year-olds report driving to or from education between 9 p.m. and 6 a.m. Countries with GDL have also used permit systems to allow those who need to drive to or from (or during the course of) work during restricted hours to do so (although these can reduce the effectiveness of the restriction).
It is important that debate about improving novice-driver safety in Great Britain should be based on the best available evidence. This report therefore aims to provide the most detailed breakdown of the potential impact of GDL on road safety in Great Britain published to date.
Until now, consideration of GDL in Great Britain has been from a national perspective (Jones et al., 2013; Kinnear et al., 2013). The research reported here details the impact of the projected safety benefits of GDL in pre-defined regions of Great Britain. It has already been shown that characteristics of young driver collisions in rural areas are different to those in urban areas; in particular, collision severity is likely to be greater in rural collisions (Fosdick, 2013). Such geographic differences mean that it is appropriate for the debate to include consideration of what GDL might mean in road safety terms to people in their own area of the country.
Introduction 4

2. Background
Graduated Driver Licensing: A regional analysis of potential casualty savings in Great Britain5
Two estimates, using STATS19 data (see section 2.1), of the impact that GDL could have if implemented in Great Britain have been published to date (Jones et al., 2013; Kinnear et al., 2013). Jones et al. analysed the potential impact of a passenger restriction and a night-time restriction in Great Britain, and defined weak and strong boundaries for these components (‘no 15- to 24-year-old passengers’ versus ‘one 15- to 19-year-old passenger’, and ‘no driving between 9 p.m. and 6 a.m.’ versus ‘no driving between 10 p.m. and 5 a.m.’). It should be noted that GDL is not limited to these two forms of restriction, although they are common features of many GDL systems. Kinnear et al. repeated this analysis and addressed some limitations by using more recent data (2009–2011 rather than 2000–2007), and applying a weighting to account for uninjured passengers not recorded in STATS19. Kinnear et al. also extended the analysis to account for overall likely effectiveness of a GDL system following a review of the international evidence.
Background
This report details the results of a further application of the methods developed in these previous studies to calculate the impact of GDL on the occurrence of casualties at a regional level across Great Britain, using the latest available data. The results detail the regional impact of GDL for the following:
• an overall GDL system;• a strong night-time component only;• a weak night-time component only;• a strong passenger restriction component only; and• a weak passenger restriction component only.
A notable difference between this analysis and those of both Jones et al. (2013) and Kinnear et al. (2013) is that the boundaries of the weak night-time component have been altered. As mentioned above, Jones et al. originally defined a weak night-time component as no driving for young drivers between 10 p.m. and 5 a.m. Compared with many jurisdictions that currently implement night-time restrictions, this was considered to be fairly strong. For the purposes of the present analysis the weak night-time GDL component was therefore redefined as no driving between midnight and 5 a.m. Table 2.1 shows the definitions of ‘strong’ and ‘weak’ versions of the passenger and night-time components used here (Please note that the source of all tables and figures in this report is the authors’ own analysis.)
Table 2.1: Strong and weak passenger and night-time component criteria
Passenger component Night-time component
Strong No 15- to 24-year-old passengers (unless accompanied by a 25+ year-old)
No permission to drive between 9 p.m. and 6 a.m. (unless accompanied by a 25+ year-old)
Weak No more than one 15- to 19-year-old passenger (unless accompanied by a 25+ year-old)
No permission to drive between midnight and 5 a.m. (unless accompanied by a 25+ year-old)
6
Data
The national database of reported injury road collisions in Great Britain, STATS19, is assembled from data collected by police officers who attend such collisions or receive reports from people involved, usually drivers. A copy is held at TRL. The database is updated every July with the latest calendar year of data. Data relating to collisions involving young drivers (17- to 19-year-olds) from 2008–2012, including those at night and those with passengers aged 15–24, was extracted from the STATS19 database. STATS19 does not list the length of time a driver has had a driving licence, hence analysis was restricted to collisions involving drivers aged between 17 and 19 to ensure that all drivers in the analysis could be classified as relative novices, as well as being young. Five years of data were used, in order to ensure that recent trends were represented and that sufficient collision and casualty data was available for analysis.
As STATS19 records the presence of only those passengers who were injured in the collision, values obtained from the database have been factored to account for additional (uninjured) supervising passengers (those over 25 years) and for additional (uninjured) passengers aged 15–24. The weighting was based on data from the ‘On the Spot’ (OTS) database, which includes information on all occupants of all vehicles involved in a collision – whether or not they were injured. The OTS study was an in-depth accident research project involving teams from TRL and Loughborough University. The DfT-commissioned study sought to investigate police-reported traffic accidents minutes after they occurred, to gather all information possible. Around 4,000 crashes involving all road users and all injury severities were examined between 2000 and 2010.
2.1
Graduated Driver Licensing: A regional analysis of potential casualty savings in Great Britain7

The potential value of benefits arising from the reduction in casualties was calculated using the average value of the prevention of a road casualty from DfT’s (2013b) Reported Road Casualties Great Britain 2012.
The total number of collisions, and the number of collisions which involved a young driver, will differ from one region to another because of variations in, for example:
• the size of the region;• the size of the driving population;• the age distribution of the driving population; and• road length and types.
For this reason, two forms of data are presented:
1. absolute data – this simply describes the number of casualties that would be prevented in each region; and
2. comparable data – this is expressed as collision rates per head of population and the proportion of casualties in a region that involved a young driver; these rates are presented as measures that can be meaningfully compared between regions.1
Effectiveness
Throughout the world, GDL systems vary from jurisdiction to jurisdiction; however, there is a growing body of evidence available to assist in the estimation of the range of effectiveness that could be realistically expected if a full GDL system (i.e. one incorporating learner and post-licence components, and not necessarily limited to the passenger and night-time driving components which are the focus of detailed analysis in Section 4) was implemented in Great Britain. On the basis of the best available evidence, Kinnear et al. (2013) proposed that the effect of implementing a full GDL system in Great Britain would be a 20% reduction in casualties from collisions involving a 17- to 19-year-old driver, with the true effectiveness being likely to range between 10% and 40% depending on the strength of the system implemented. The impact of any GDL system implemented in Great Britain would depend on:
1. the number of components implemented;2. the strength of those components; and3. the conviction with which the system is implemented by authorities.
1 Using the collision rate per licensed driver would have been another valid approach. Both approaches are commonly utilised in GDL evaluation studies. As Russell et al. (2011, p13) explain: “While both denominators are valid and important, they are answering slightly different questions. Rates per licensed drivers demonstrate the direct effects of GDL legislation. Whereas population-based rates also capture the indirect effects of the legislation, such as driving exposure.” In the absence of a specific GDL system to evaluate in Great Britain, the authors decided to use population-based rates.
2.2
Background 8
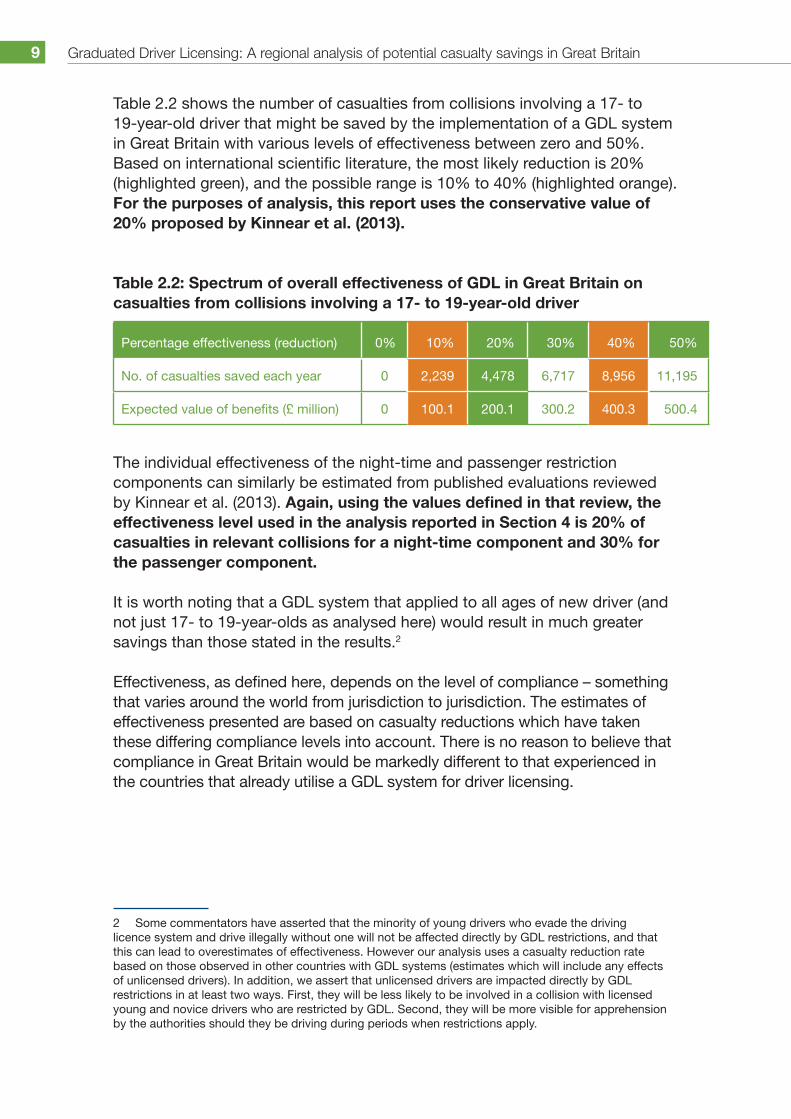
Table 2.2 shows the number of casualties from collisions involving a 17- to 19-year-old driver that might be saved by the implementation of a GDL system in Great Britain with various levels of effectiveness between zero and 50%. Based on international scientific literature, the most likely reduction is 20% (highlighted green), and the possible range is 10% to 40% (highlighted orange). For the purposes of analysis, this report uses the conservative value of 20% proposed by Kinnear et al. (2013).
Table 2.2: Spectrum of overall effectiveness of GDL in Great Britain on casualties from collisions involving a 17- to 19-year-old driver
Percentage effectiveness (reduction) 0% 10% 20% 30% 40% 50%
No. of casualties saved each year 0 2,239 4,478 6,717 8,956 11,195
Expected value of benefits (£ million) 0 100.1 200.1 300.2 400.3 500.4
The individual effectiveness of the night-time and passenger restriction components can similarly be estimated from published evaluations reviewed by Kinnear et al. (2013). Again, using the values defined in that review, the effectiveness level used in the analysis reported in Section 4 is 20% of casualties in relevant collisions for a night-time component and 30% for the passenger component.
It is worth noting that a GDL system that applied to all ages of new driver (and not just 17- to 19-year-olds as analysed here) would result in much greater savings than those stated in the results.2
Effectiveness, as defined here, depends on the level of compliance – something that varies around the world from jurisdiction to jurisdiction. The estimates of effectiveness presented are based on casualty reductions which have taken these differing compliance levels into account. There is no reason to believe that compliance in Great Britain would be markedly different to that experienced in the countries that already utilise a GDL system for driver licensing.
2 Some commentators have asserted that the minority of young drivers who evade the driving licence system and drive illegally without one will not be affected directly by GDL restrictions, and that this can lead to overestimates of effectiveness. However our analysis uses a casualty reduction rate based on those observed in other countries with GDL systems (estimates which will include any effects of unlicensed drivers). In addition, we assert that unlicensed drivers are impacted directly by GDL restrictions in at least two ways. First, they will be less likely to be involved in a collision with licensed young and novice drivers who are restricted by GDL. Second, they will be more visible for apprehension by the authorities should they be driving during periods when restrictions apply.
Graduated Driver Licensing: A regional analysis of potential casualty savings in Great Britain9
Regions
Regions in Great Britain were defined generally by grouping the local authority codes that feature in STATS19 into county or former county areas; more detail on these can be seen in STATS20 (instructions for the completion of the STATS19 road accident reports). In some circumstances areas usually referred to separately had to be grouped, so as to ensure that sufficient data was available within each region for analysis. A list and map of the defined regions can be found in Appendix A. There are 41 defined regions in England, four in Scotland and four in Wales.
A number of variables were identified by the authors and the RAC Foundation that could have an effect on the prevalence of young drivers and associated collisions within each region, and may help to explain any regional differences found.
These variables, and their definitions, are:
• deprivation: proportion living in the most deprived areas;• accessibility: proportion living in areas with least accessibility to public
transport;• urbanity: proportion of the region classified as urban;3
• population: usual resident population by year of age, from the 2011 census;
• young population: percentage of population that is aged 17–19, from the 2011 census; and
• road network length: total length of motorways and A-roads.
Deprivation4 is defined as the proportion of Lower Super Output Areas (LSOAs) in the region that feature in the most deprived decile nationally, as measured by Indices of Multiple Deprivation (IMD) statistics from England (2010), Wales (2011) and Scotland (2012). Accessibility is defined as the proportion of LSOAs in the region that feature in the least accessible decile nationally, as measured by IMD statistics from England (2010), Wales (2011) and Scotland (2012). Measures of deprivation and accessibility from the IMD are not comparable across England, Wales and Scotland; therefore these countries have been treated separately in later analyses.
3 For England and Wales this is the proportion of Lower Super Output Areas classified as urban in the region in question; for Scotland it is the percentage of the population classified as living in urban areas.4 Deprivation, accessibility and urbanity are combinations of more detailed data across many smaller areas. In combining the smaller areas some detail is lost; however, it remains possible to identify different average characteristics in different regions.
2.3
Background 10
Also included in the detailed characteristics of each region, for comparison purposes, are:
• the percentage of collision-involved young drivers who had alcohol recorded as a contributory factor; and
• the percentage of collision-involved young drivers who had mobile phone use recorded as a contributory factor.
The characteristics of each region are shown in Table B.8 in Appendix B. These characteristics may help readers to identify possible reasons for some of the differences between regions described in the results in Section 3.
Assumptions and limitations
The analysis conducted here is constrained by the data available. For example, as STATS19 does not include the length of time a driver has held their licence, the analysis is restricted to analysing 17- to 19-year-old drivers only, as these drivers are obviously both young and at least relatively inexperienced. This constraint is likely to mean that the analyses presented in this report underestimate the number of collisions that would be prevented if a GDL system which applied also to drivers outside of this age range was implemented.
It was also necessary to apply the same assumptions as those reported in Jones et al. (2013) and Kinnear et al. (2013), which could not be controlled for – namely that there was no accounting for alcohol consumption or for non-casualty passengers (including possible supervising drivers), nor for whether the journeys were expressly for the purpose of travelling to or from work or school, which would put them outside the scope of GDL if exemptions were in place. In addition, the assumption was made that any collision involving a novice driver would not have happened if the novice driver had not been present. This may result in an overestimation of the likely benefits, although any such distortion is considered likely to be small in comparison to the deliberate underestimation of the effect of GDL overall that results from the conservative level of effectiveness applied in the analysis.
Additional constraints of the analysis reported here involved the use of proxy variables, such as the 17- to 19-year-old population, for calculating proportional effects. Young driver mileage in each region would be a more accurate measure, but such data is not available across Great Britain.
2.4
Graduated Driver Licensing: A regional analysis of potential casualty savings in Great Britain11
Background 12
3. The Potential Impact of a GDL System in Great Britain
Graduated Driver Licensing: A regional analysis of potential casualty savings in Great Britain13
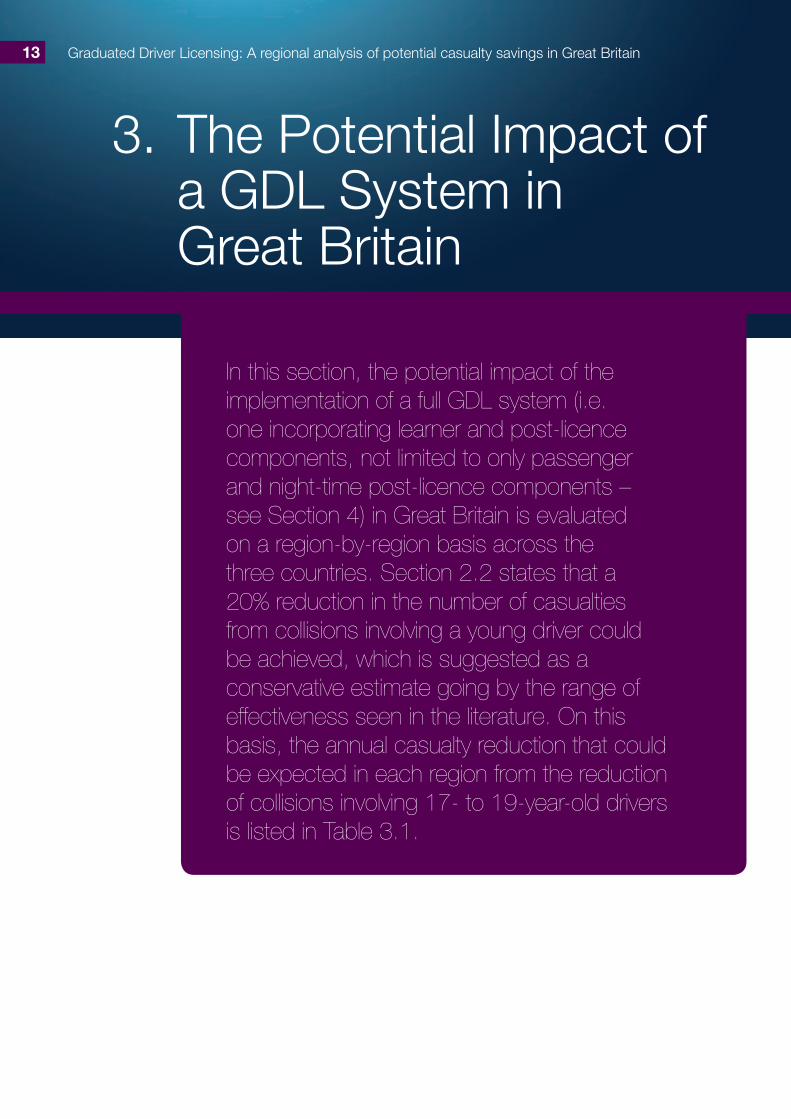
In this section, the potential impact of the implementation of a full GDL system (i.e. one incorporating learner and post-licence components, not limited to only passenger and night-time post-licence components – see Section 4) in Great Britain is evaluated on a region-by-region basis across the three countries. Section 2.2 states that a 20% reduction in the number of casualties from collisions involving a young driver could be achieved, which is suggested as a conservative estimate going by the range of effectiveness seen in the literature. On this basis, the annual casualty reduction that could be expected in each region from the reduction of collisions involving 17- to 19-year-old drivers is listed in Table 3.1.

The Potential Impact of a GDL System in Great Britain
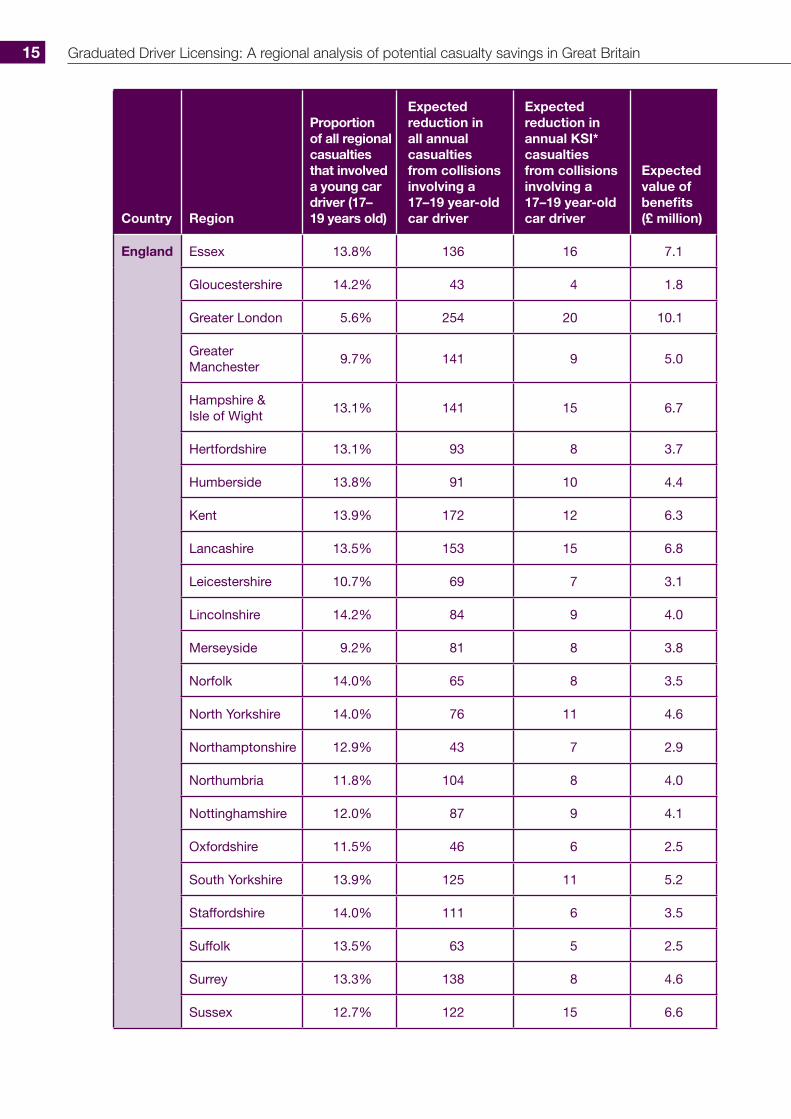
Table 3.1: Annual regional casualty cost savings and value of benefits from the implementation of a GDL system in Great Britain
Country Region
Proportion of all regional casualties that involved a young car driver (17–19 years old)
Expected reduction in all annual casualties from collisions involving a 17–19 year-old car driver
Expected reduction in annual KSI* casualties from collisions involving a 17–19 year-old car driver
Expected value of benefits (£ million)
England Avon and Somerset
13.0% 121 11 5.2
Bedfordshire 13.0% 52 5 2.2
Berkshire 11.7% 60 4 2.3
Buckinghamshire 12.4% 66 6 2.8
Cambridgeshire 11.6% 70 7 3.4
Cheshire 12.7% 104 11 4.8
Cleveland 13.8% 35 3 1.5
Cornwall 15.5% 60 4 2.1
Cumbria 15.8% 53 5 2.2
Derbyshire 13.3% 93 8 3.9
Devon 13.1% 96 6 3.3
Dorset 14.0% 66 7 3.2
Durham 14.1% 54 4 2.2
14
Country Region
Proportion of all regional casualties that involved a young car driver (17–19 years old)
Expected reduction in all annual casualties from collisions involving a 17–19 year-old car driver
Expected reduction in annual KSI* casualties from collisions involving a 17–19 year-old car driver
Expected value of benefits (£ million)
England Essex 13.8% 136 16 7.1
Gloucestershire 14.2% 43 4 1.8
Greater London 5.6% 254 20 10.1
Greater Manchester
9.7% 141 9 5.0
Hampshire & Isle of Wight
13.1% 141 15 6.7
Hertfordshire 13.1% 93 8 3.7
Humberside 13.8% 91 10 4.4
Kent 13.9% 172 12 6.3
Lancashire 13.5% 153 15 6.8
Leicestershire 10.7% 69 7 3.1
Lincolnshire 14.2% 84 9 4.0
Merseyside 9.2% 81 8 3.8
Norfolk 14.0% 65 8 3.5
North Yorkshire 14.0% 76 11 4.6
Northamptonshire 12.9% 43 7 2.9
Northumbria 11.8% 104 8 4.0
Nottinghamshire 12.0% 87 9 4.1
Oxfordshire 11.5% 46 6 2.5
South Yorkshire 13.9% 125 11 5.2
Staffordshire 14.0% 111 6 3.5
Suffolk 13.5% 63 5 2.5
Surrey 13.3% 138 8 4.6
Sussex 12.7% 122 15 6.6
Graduated Driver Licensing: A regional analysis of potential casualty savings in Great Britain15

The Potential Impact of a GDL System in Great Britain
Country Region
Proportion of all regional casualties that involved a young car driver (17–19 years old)
Expected reduction in all annual casualties from collisions involving a 17–19 year-old car driver
Expected reduction in annual KSI* casualties from collisions involving a 17–19 year-old car driver
Expected value of benefits (£ million)
England Warwickshire 11.4% 45 6 2.4
West Mercia 15.2% 110 10 4.8
West Midlands 9.9% 160 15 6.9
West Yorkshire 10.2% 155 14 6.8
Wiltshire 13.1% 46 5 2.3
Total 11.6% 3,883 361 169.1
Scotland Lothian & Borders and Dumfries & Galloway
11.6% 65 8 3.6
Northern and Grampian
15.7% 64 13 4.9
Strathclyde 11.4% 113 15 6.2
Tayside, Fife and Central
13.1% 57 9 3.6
Total 12.5% 299 45 18.3
Wales Dyfed-Powys 18.2% 70 8 3.5
Gwent 17.0% 40 4 1.7
North Wales 15.8% 72 8 3.7
South Wales 15.2% 114 7 4.0
Total 16.2% 296 27 12.8
Great Britain 11.9% 4,478 433 200.1
* Killed or seriously injuredNote: some totals may not sum exactly due to rounding.
16

As the regions differ in size and population characteristics, it is necessary to calculate a measure that takes this into account so that the regions can be compared. Two measures were calculated:
1. the number of killed or seriously injured (KSI) collisions involving a 17- to 19-year-old driver relative to the population of 17- to 19-year-olds in the region – this measure is calculated as a rate per 10,000 17- to 19-year-olds, and is referred to in the text as the ‘young driver KSI collision rate’; and
2. the proportion of all KSI casualties in the region which arose from collisions involving a 17- to 19-year-old car driver – this is a percentage, and is referred to in the text as the ‘KSI-casualty proportion’.
The KSI casualties referred to in the second measure - and which are involved in computing the KSI-casualty proportion - are casualties which arose from a collision involving at least one car. The casualty may or may not have been in the car (they may have been a pedestrian, a heavy goods vehicle driver, a cyclist or any other road user). In most regions this kind constitutes the large majority of casualties. All future references to casualties in this report, whether KSI casualties or casualties of all severities, should be taken to imply the involvement of at least one car in the associated collision.
Figure 3.1 maps the range of young driver KSI collision rates, and Figure 3.2 the KSI-casualty proportions, in each region of Great Britain.
Graduated Driver Licensing: A regional analysis of potential casualty savings in Great Britain17
The Potential Impact of a GDL System in Great Britain
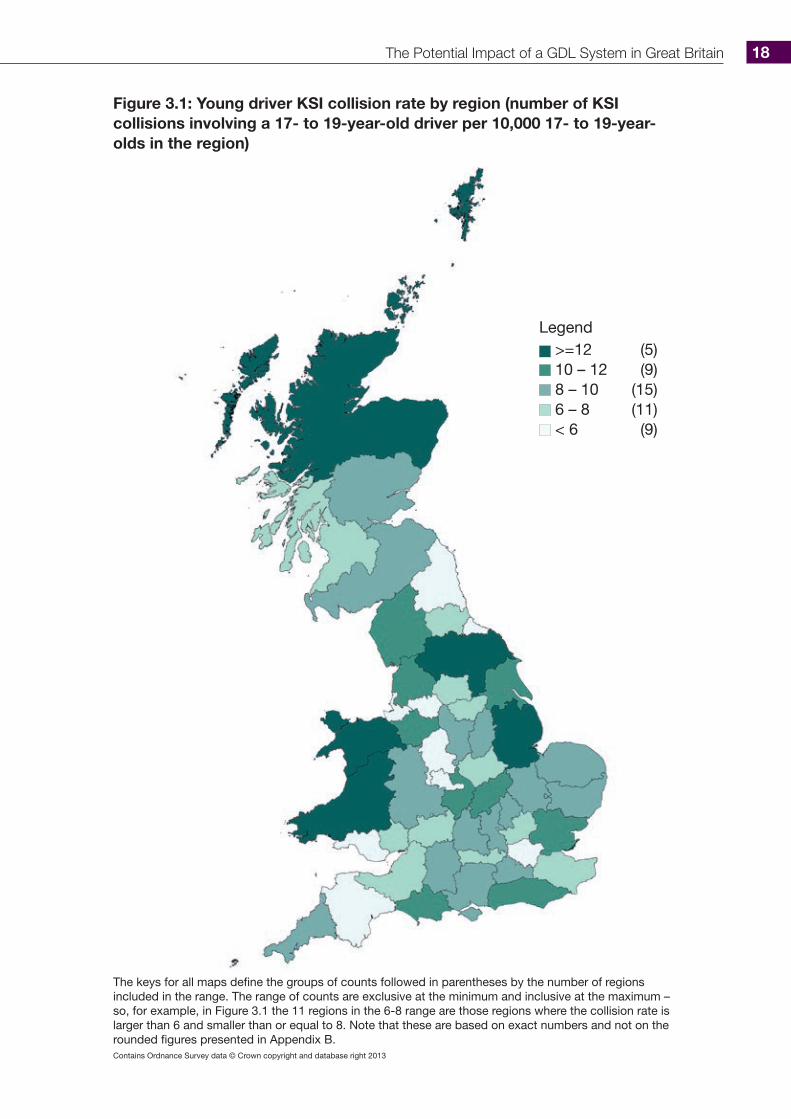
Figure 3.1: Young driver KSI collision rate by region (number of KSI collisions involving a 17- to 19-year-old driver per 10,000 17- to 19-year-olds in the region)
Contains Ordnance Survey data © Crown copyright and database right 2013
>=12 (5)10 – 12 (9)8 – 10 (15)6 – 8 (11)< 6 (9)
Legend
The keys for all maps define the groups of counts followed in parentheses by the number of regions included in the range. The range of counts are exclusive at the minimum and inclusive at the maximum – so, for example, in Figure 3.1 the 11 regions in the 6-8 range are those regions where the collision rate is larger than 6 and smaller than or equal to 8. Note that these are based on exact numbers and not on the rounded figures presented in Appendix B.
18
In Figure 3.1, high values (dark colours on the map) relate to higher numbers of collisions involving young drivers per 10,000 17- to 19-year-olds in that region. These higher values could occur for a number of reasons, of which the most influential are likely to be:
• a higher proportion of young people holding a driving licence in these regions;
• the young driver population in these regions driving greater distances;• the number of young drivers active in these regions being increased by
young drivers coming in from other regions.
Graduated Driver Licensing: A regional analysis of potential casualty savings in Great Britain19

The Potential Impact of a GDL System in Great Britain
Figure 3.2: KSI-casualty proportion by region (proportion of all KSI casualties from collisions involving a 17- to 19-year-old driver)
Contains Ordnance Survey data © Crown copyright and database right 2013
>=13% (7)12 – 13% (9)11 – 12% (12)10 – 11% (8)< 10% (13)
Legend
20

Figure 3.2 shows the proportion of all KSI casualties which arose from collisions involving a 17- to 19-year-old driver – the KSI-casualty proportion. These are collisions that a GDL system is most likely to impact were it implemented.
Detailed data for each of the regions can be seen in Table B.1 in Appendix B. Data in this table shows the KSI-casualty proportion and the expected reduction in casualties in each region. These figures are discussed in the remainder of Section 3.
For the 16 regions shown in Figure 3.2 that have more than 12% of KSI casualties occurring in collisions involving a 17- to 19-year-old driver, the percentage range is from 12.1% to 15.1%. The implementation of a GDL system therefore has the potential to reduce the total number of KSI casualties in these regions by 2.4–3.0% each year (using the 20% effectiveness figure discussed in section 2.2). In real terms, while the proportion of all KSI casualties from collisions involving a young driver in Greater London is relatively low at 4.7%, a saving of 20 KSI casualties a year could be realised as a result of the large population in this region. In Northern and Grampian though, 17- to 19-year-old drivers are involved in collisions resulting in 15.1% of KSI casualties, which equates to a potential annual reduction of 13 KSI casualties. The KSI savings that would be possible in other regions are listed in Table 3.1.
England
The data suggests that in England, the biggest reductions in the young driver KSI collision rate would be likely to occur in North Yorkshire (where it would fall from 13.9 to 11.2 on the basis of the effectiveness presupposed in section 2.2) and Lincolnshire (from 13.1 to 10.5), as these regions are where the highest KSI collision rates are found. Both of these regions have low population, low urbanity and a low accessibility score (they are in fact classified as having ‘limited accessibility’). The regions with lowest young driver KSI collision rates are Greater London (3.0), Greater Manchester, West Midlands, Merseyside, Northumbria, Staffordshire, Cleveland and Devon (5.9). In these regions, which tend to be more highly populated areas, a general GDL is likely to have less impact per young person than in other regions. However, because of the greater population in these types of areas, even modest reductions in these rates equate to significant numbers of KSI-casualty savings (e.g. 20 in Greater London, 15 in the West Midlands).
In relation to the KSI-casualty proportion, the regions with the highest values are West Mercia (14.0%), Norfolk and South Yorkshire (13.0%). As these regions demonstrate a high proportion of collisions involving 17- to 19-year-old drivers, they would relatively speaking benefit most from a GDL system. The regions with the lowest values are Greater London (4.7%), Greater Manchester, West Midlands, Suffolk, Gloucestershire, Merseyside, West Yorkshire, Surrey, Berkshire, Northumbria, Wiltshire, Nottinghamshire and Hampshire & Isle of Wight (9.8%).
3.1
Graduated Driver Licensing: A regional analysis of potential casualty savings in Great Britain21

The Potential Impact of a GDL System in Great Britain
The expected total reduction in England per year is 361 KSI casualties, ranging from 3 in Cleveland to 20 in London. A total of 3,883 casualties could be saved for all severities, yielding a benefit valued at £169.1 million per year.
Scotland
In Scotland the region likely to gain the greatest benefit from GDL is Northern & Grampian, which has both the highest KSI-casualty proportion (15.1%) and the highest young driver KSI collision rate (14.8). GDL would reduce this rate to 11.8.
The region of Strathclyde is predicted to see the least relative benefit within the Scottish regions, with a young driver KSI collision rate of 6.5 per 10,000 population, and a KSI-casualty proportion of 11.0%. Nevertheless, as a result of its greater population, Strathclyde would see the greatest annual reduction in KSI casualties (15).
The expected total reduction in Scotland per year is 45 KSI casualties. A total of 299 casualties could be saved for all severities, resulting in a benefit valued at £18.3 million per year.
Wales
Two regions in Wales would benefit most if GDL was introduced: North Wales and Dyfed-Powys, which have high young driver KSI collision rates and KSI-casualty proportions (as can be seen in Figure 3.1 and Figure 3.2 respectively). Gwent also has a high KSI-casualty proportion.
South Wales also has a high KSI-casualty proportion (12.4%), although its young driver KSI collision rate is around a third that of Dyfed-Powys (5.0 compared with 15.4). This means that while GDL would be beneficial in this region, the likely benefit of GDL would be smaller per head of population in South Wales than elsewhere in Wales.
The expected total reduction in Wales per year is 27 KSI casualties. A total of 296 casualties could be saved for all severities, equating to a benefit valued at £12.8 million per year.
3.2
3.3
22
Graduated Driver Licensing: A regional analysis of potential casualty savings in Great Britain23
Two of the most common and most effective components of a GDL system are night-time and passenger restrictions. These restrictions are applied following successful completion of the driving test and presentation of a probationary licence. The restrictions are usually applied for a period of 6–12 months (the period when novice drivers are at most risk), although some jurisdictions apply these components for up to two years. The restrictions directly target and reduce exposure to areas of known risk for novice drivers, particularly drivers who are young as well as being novices. Drivers therefore gain valuable on-road solo driving experience during times of the day, and in social situations, that are known to be less risky. Once a driver graduates to a full, unrestricted driving licence they are likely to have gained more on-road experience and will also be older; both of these factors contribute to a reduction in overall risk for that driver.
4. The Potential Impact of Night-Time & Passenger GDL Components

The Potential Impact of Night-Time and Passenger GDL Components
This section therefore estimates the impact in Great Britain that each of these factors, and both of them in combination, could have on collisions involving 17- to 19-year-old drivers and on the associated casualties. Casualties of all severities are considered in the following sections in order to provide robust estimates based on larger numbers.
It should be noted that the analysis that follows, since it looks at only these two components of a possible GDL system for Great Britain, forecasts benefits which are somewhat smaller than those presented in the previous sections, where the impact of a comprehensive system was estimated.
Night-time component
In this section, the likely reduction in casualties from collisions involving a young driver which results from the implementation of a GDL night-time component in isolation is discussed. A strong and a weak component, as defined in Table 4.1, were each considered.
Table 4.1: Night-time component criteria
Night-time component
Strong No permission to drive between 9 p.m. and 6 a.m. (unless accompanied by a 25+ year-old)
Weak No permission to drive between midnight and 5 a.m. (unless accompanied by a 25+ year-old)
Full detailed results for both strong and weak criteria in each region can be seen in Table B.2 and Table B.3 in Appendix B respectively. The results discussed in the text originate from these tables.
4.1
24
4. The Potential Impact of Night-Time & Passenger GDL Components
4.1.1 Great Britain
4.1.1.1 Strong night-time component
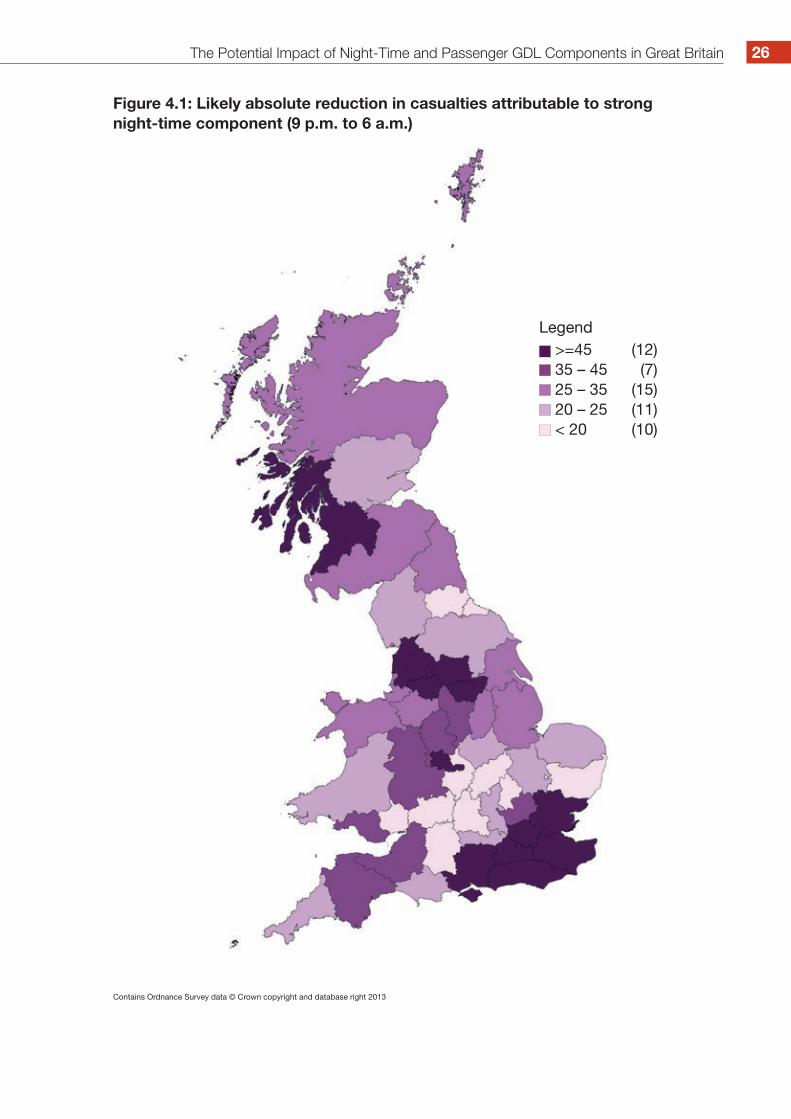
Figure 4.1 presents the variation in the reduction in the number of casualties per year attributable to a strong GDL night-time restriction. The regions which are likely to benefit the most in absolute terms are more highly populated and have more collisions. Overall, a strong component is likely to result in the reduction of 220 KSI casualties and 1,613 casualties of all severities.
Graduated Driver Licensing: A regional analysis of potential casualty savings in Great Britain25
The Potential Impact of Night-Time and Passenger GDL Components in Great Britain
Figure 4.1: Likely absolute reduction in casualties attributable to strong night-time component (9 p.m. to 6 a.m.)
Contains Ordnance Survey data © Crown copyright and database right 2013
>=45 (12)35 – 45 (7)25 – 35 (15)20 – 25 (11)< 20 (10)
Legend
26
In order to compare regions, it is necessary to use a measure that accounts for differences between them in the overall numbers of collisions. Figure 4.2 therefore shows the likely reduction in all casualties from collisions involving a young driver in each region, if a strong night-time GDL restriction was introduced, as a proportion of the total number of casualties (i.e. not only of all severities, but also regardless of whether or not a young driver was involved) in the region. Darker colours on the map suggest larger potential benefits in that region.
Graduated Driver Licensing: A regional analysis of potential casualty savings in Great Britain27

The Potential Impact of Night-Time and Passenger GDL Components in Great Britain
Figure 4.2: Likely proportional reduction in casualties attributable to strong night-time component (9 p.m. to 6 a.m.)
Contains Ordnance Survey data © Crown copyright and database right 2013
>=1.2% (4)1.0 – 1.2% (11)0.9 – 1.0% (14)0.7 – 0.9% (15)< 0.7% (5)
Legend
28
Results across Britain vary from a 0.5% reduction in total in Greater London (equating to a saving of 105 casualties) to a 1.6% reduction in Northern & Grampian (representing 32 fewer casualties). The regional differences may reflect variations in a number of factors, including:
• the proportion of the young population who hold a driving licence and the distances they travel;
• the amount of night-time driving that young drivers do in these regions;• the proportion of the region’s road network that is rural (rural roads are by
design characteristically more risky than other road types).
4.1.1.2 Weak night-time component
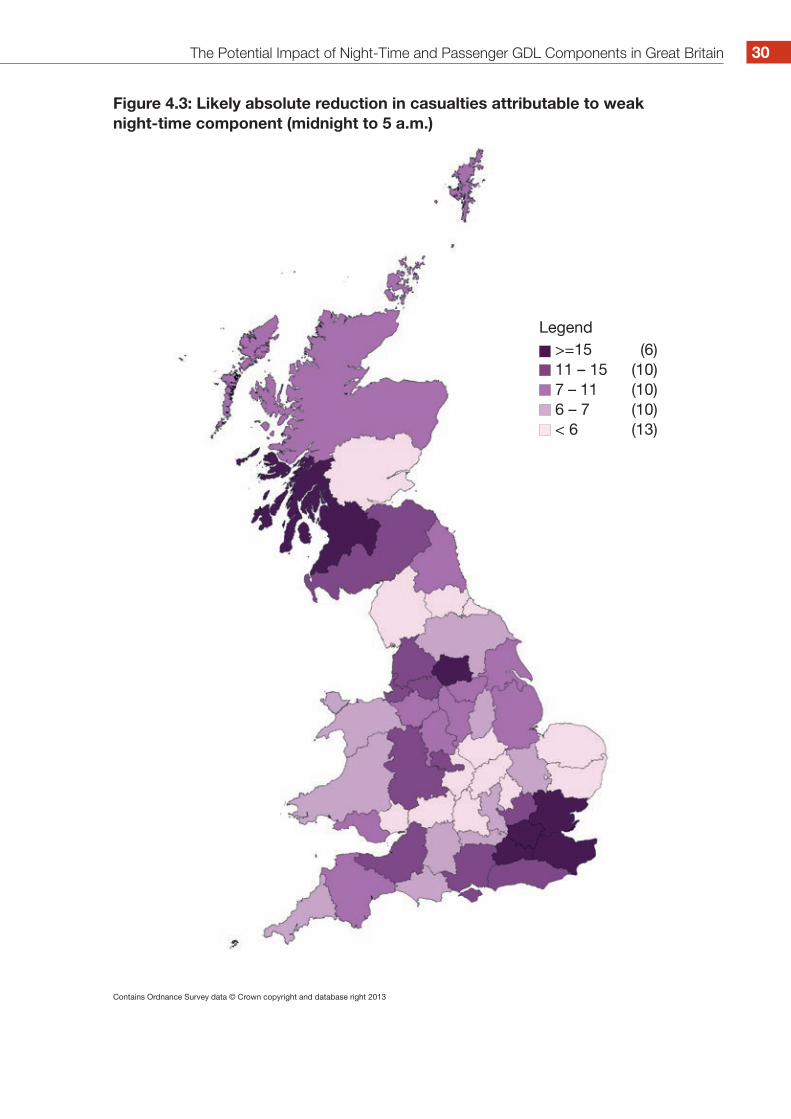
A weaker night-time component, restricting driving from midnight to 5 a.m., is estimated to result in a reduction of 75 KSI casualties and 453 casualties of all severities. A weaker component would therefore prevent 145 fewer KSIs and 1,160 fewer casualties overall than the strong component.
Geographically, the differences between regions for the strong component are similar to the regional differences for the weak component; they can be seen in Figure 4.3. It is worth noting that each map is set against its own scale to highlight regional differences. For this reason it is not possible to directly compare the maps for the strong and weak components in terms of the dark/light scale. A summary table that enables such a comparison, across England, Scotland and Wales, can be found in Table 4.2 in section 4.1.5.
Graduated Driver Licensing: A regional analysis of potential casualty savings in Great Britain29
The Potential Impact of Night-Time and Passenger GDL Components in Great Britain
Figure 4.3: Likely absolute reduction in casualties attributable to weak night-time component (midnight to 5 a.m.)
Contains Ordnance Survey data © Crown copyright and database right 2013
>=15 (6)11 – 15 (10)7 – 11 (10)6 – 7 (10)< 6 (13)
Legend
30
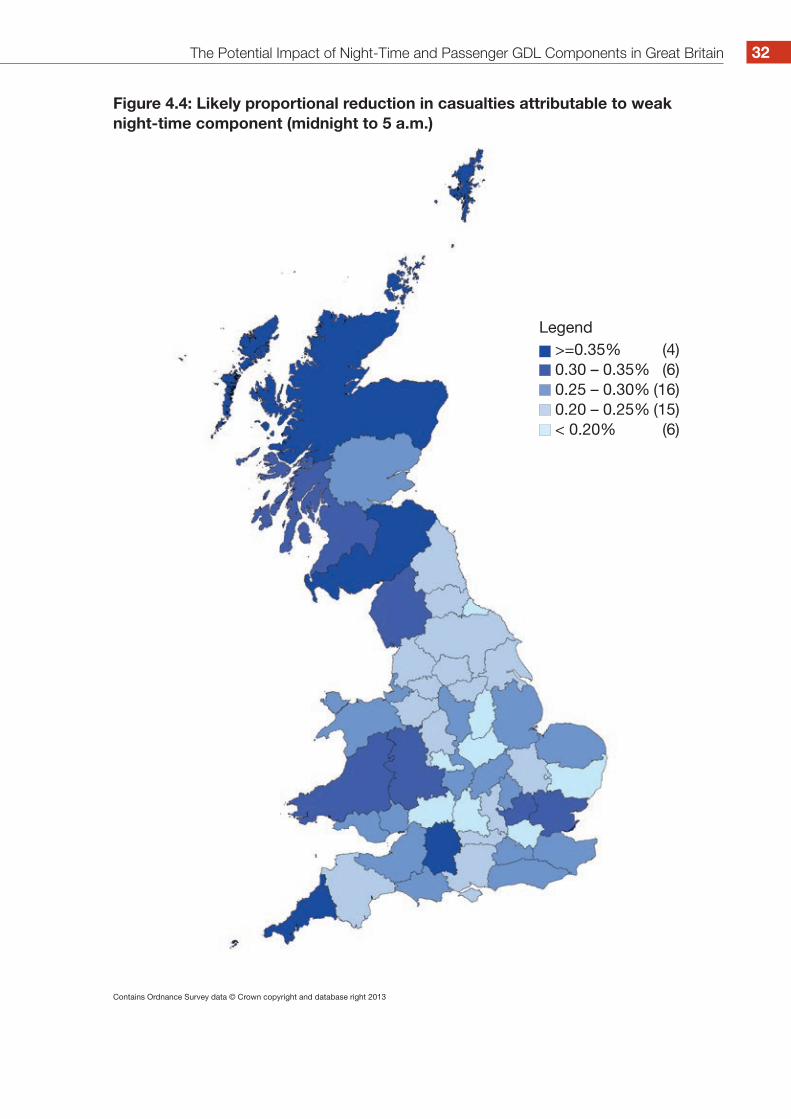
The same method was used as for the strong night-time component to enable regions to be compared with each other: Figure 4.4 shows the likely reduction in all casualties in each region, if a weak night-time GDL restriction was introduced, again as a proportion of the total number of casualties in the region. As before, darker colours on the map suggest where the larger potential benefits lie.
Graduated Driver Licensing: A regional analysis of potential casualty savings in Great Britain31
The Potential Impact of Night-Time and Passenger GDL Components in Great Britain
Figure 4.4: Likely proportional reduction in casualties attributable to weak night-time component (midnight to 5 a.m.)
Contains Ordnance Survey data © Crown copyright and database right 2013
>=0.35% (4)0.30 – 0.35% (6)0.25 – 0.30% (16)0.20 – 0.25% (15)< 0.20% (6)
Legend
32
With a weak component, the map is similar across Great Britain to that representing a strong one, but the effects are smaller in size: strong results range from a 0.5% to a 1.6% reduction, while weak results vary between a 0.1% and a 0.5% reduction. However, five regions change more than others:
• the regions of Wiltshire and Lothian & Borders and Dumfries & Galloway move from the middle proportional casualty reduction category in the strong component up into the highest casualty reduction category in the weak component, suggesting that relatively more young drivers in this region are having collisions between midnight and 5 a.m. than between 9 p.m. and midnight or from 5 a.m. to 6 a.m. than is the case in other regions;
• the benefit in the regions of South Yorkshire, North Wales and Gloucester falls, suggesting a lower collision rate among young drivers in the post-midnight hours than in the late evening or early morning, compared with other regions.
4.1.2 England
Figure 4.2 shows that in England only Cumbria falls into the highest benefit category in the strong night-time component, with the biggest proportional reduction in casualties. It is surrounded by regions in the North of England with lower proportional benefits; one of the adjacent regions is in the lowest category of all, Northumbria. Cornwall and Wiltshire fall into the highest benefit category if a weak night-time component were to be introduced (Figure 4.4).
The regions in the lowest proportional benefit category for both the strong and weak components are Cleveland, Greater London and West Midlands. These regions are highly populated and primarily urban.
While these casualties are a smaller proportion of all casualties in a region, in absolute terms the biggest benefits in terms of reductions in casualties of all severities are found in some of the same highly populated areas. Tables B.2 and B.3 show that the regions with the largest absolute benefit for the strong component are (in descending order from the highest): Greater London (strong=105; weak=36), Kent, West Midlands, West Yorkshire, Lancashire, Essex, Surrey, Greater Manchester, Hampshire & Isle of Wight, Sussex and South Yorkshire (strong=45; weak=10).
4.1.3 Scotland
In Scotland, the biggest proportional reduction likely is in the region of Northern & Grampian. There appears to be a larger proportion of collisions at night that involve young drivers here than across the rest of Scotland, and therefore the likely proportional benefit is greatest in this region. In absolute terms, the greatest benefit is likely to be in Strathclyde, with a predicted potential reduction in all casualties of 48 (equivalent to £3.1 million), including 8 KSI casualties, for the strong component; the equivalent reduction for the
Graduated Driver Licensing: A regional analysis of potential casualty savings in Great Britain33
The Potential Impact of Night-Time and Passenger GDL Components in Great Britain
weak component is 16 casualties of all severities, including 3 KSI (equivalent to £1.1 million). In absolute numbers, the benefits are lower relative to regions across Britain as a whole, as the population is, in general, smaller.
4.1.4 Wales
In Wales, the regions of North Wales and Dyfed-Powys are in the biggest potential reduction category (for all severities) for strong night-time GDL restrictions. In absolute numbers, the benefits are lower relative to regions across Britain as a whole, as the population is, in general, smaller, mirroring the situation in Scotland.
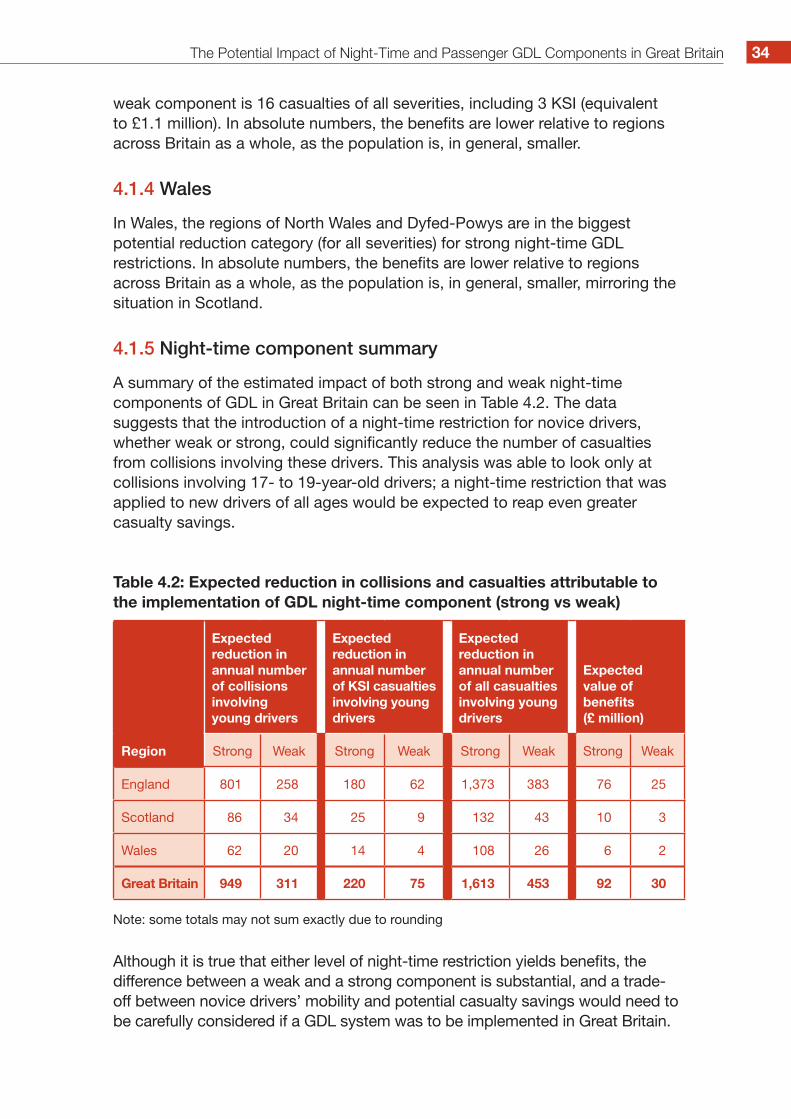
4.1.5 Night-time component summary
A summary of the estimated impact of both strong and weak night-time components of GDL in Great Britain can be seen in Table 4.2. The data suggests that the introduction of a night-time restriction for novice drivers, whether weak or strong, could significantly reduce the number of casualties from collisions involving these drivers. This analysis was able to look only at collisions involving 17- to 19-year-old drivers; a night-time restriction that was applied to new drivers of all ages would be expected to reap even greater casualty savings.
Table 4.2: Expected reduction in collisions and casualties attributable to the implementation of GDL night-time component (strong vs weak)
Region
Expected reduction in annual number of collisions involving young drivers
Expected reduction in annual number of KSI casualties involving young drivers
Expected reduction in annual number of all casualties involving young drivers
Expected value of benefits (£ million)
Strong Weak Strong Weak Strong Weak Strong Weak
England 801 258 180 62 1,373 383 76 25
Scotland 86 34 25 9 132 43 10 3
Wales 62 20 14 4 108 26 6 2
Great Britain 949 311 220 75 1,613 453 92 30
Note: some totals may not sum exactly due to rounding
Although it is true that either level of night-time restriction yields benefits, the difference between a weak and a strong component is substantial, and a trade-off between novice drivers’ mobility and potential casualty savings would need to be carefully considered if a GDL system was to be implemented in Great Britain.
34
Passenger component
In this section, the likely reduction in casualties from collisions involving a young driver which is attributable to a GDL passenger component alone is discussed. A strong and a weak component, as defined in Table 4.3, were each considered.
Table 4.3: Passenger component criteria
Passenger component
Strong No 15- to 24-year-old passengers (unless accompanied by a 25+ year-old)
Weak No more than one 15- to 19-year-old passenger (unless accompanied by a 25+ year-old)
Full detailed results for both strong and weak criteria in each region can be seen in Table B.4 and Table B.5 in Appendix B. The results discussed in the text originate from these tables.
4.2.1 Great Britain
4.2.1.1 Strong passenger component
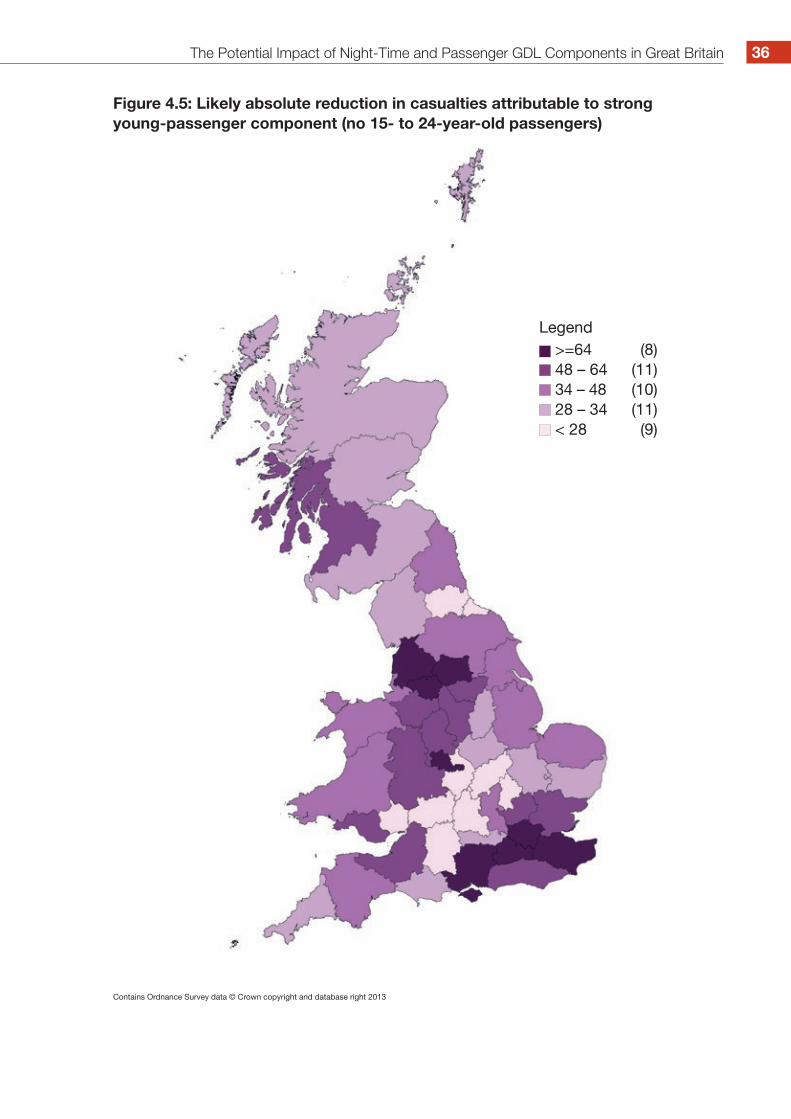
Figure 4.5 presents the annual reduction in casualties likely if a strong passenger restriction was introduced for new drivers. The highest numbers are, naturally, in the highly populated areas. Overall, a strong component is likely to result in the reduction of 231 KSI casualties and 2,191 casualties of all severities.
4.2
Graduated Driver Licensing: A regional analysis of potential casualty savings in Great Britain35
The Potential Impact of Night-Time and Passenger GDL Components in Great Britain
Figure 4.5: Likely absolute reduction in casualties attributable to strong young-passenger component (no 15- to 24-year-old passengers)
Contains Ordnance Survey data © Crown copyright and database right 2013
>=64 (8)48 – 64 (11)34 – 48 (10)28 – 34 (11)< 28 (9)
Legend
36

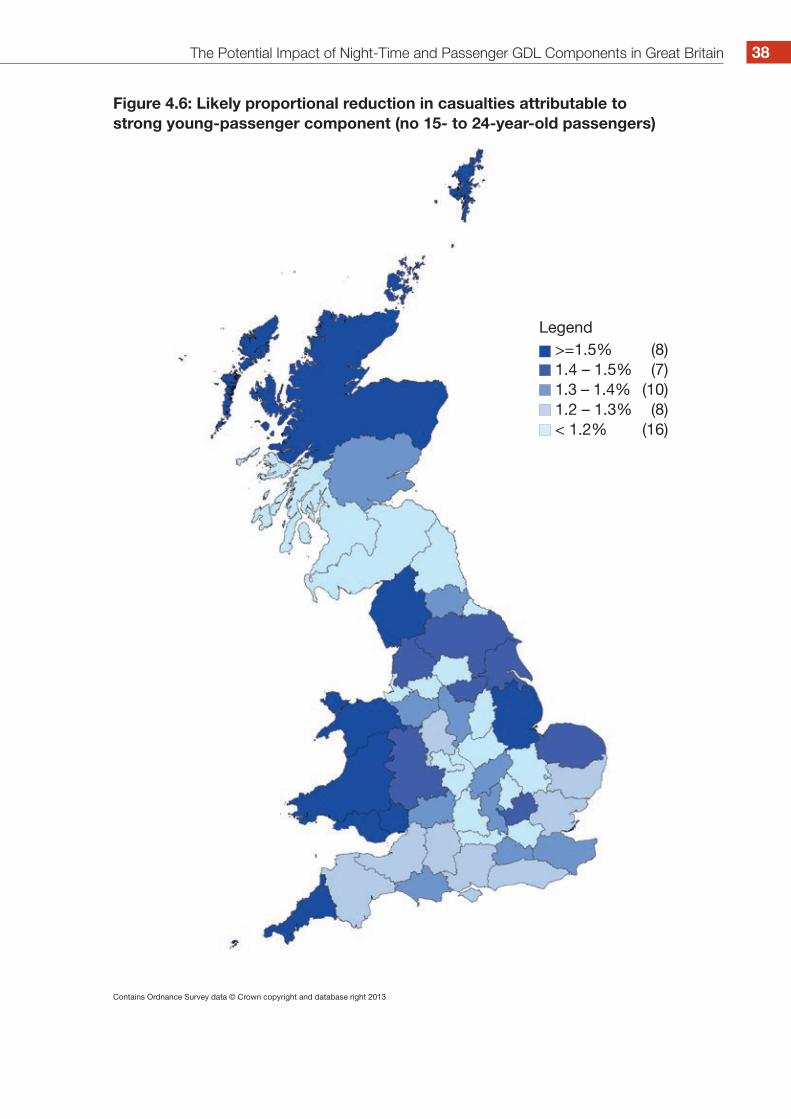
To enable one region to be compared with another, Figure 4.6 shows the likely reduction in all casualties in each region, if a strong passenger GDL restriction was introduced, as a proportion of the total number of all casualties in the region. As above, darker colours on the map suggest larger potential benefits in that region.
Graduated Driver Licensing: A regional analysis of potential casualty savings in Great Britain37
The Potential Impact of Night-Time and Passenger GDL Components in Great Britain
Figure 4.6: Likely proportional reduction in casualties attributable to strong young-passenger component (no 15- to 24-year-old passengers)
Contains Ordnance Survey data © Crown copyright and database right 2013
>=1.5% (8)1.4 – 1.5% (7)1.3 – 1.4% (10)1.2 – 1.3% (8)< 1.2% (16)
Legend
38
At the regional level, the likely reduction in the number of casualties which is attributable to strong young-passenger restrictions on young novice drivers will bring the all-casualties count down by between 0.4% in Greater London (equivalent to 91 casualties) and 1.9% in Dyfed-Powys (in absolute terms, a drop of 37 casualties).
Differences across Great Britain may be influenced by a number of factors, including, but not limited to:
• the proportion of the young population who hold a driving licence and the distances they travel;
• the availability of public transport and social activities (these factors are likely to influence exposure to both driving risk in general and driving risk associated with alcohol and other relevant social influences).
4.2.1.2 Weak passenger component
A weaker young-passenger component, permitting driving only when there is no more than one 15- to 19-year-old passenger (unless accompanied by a 25+ year-old) is estimated to result in a reduction of 159 KSI casualties and 1,166 casualties of all severities. Compared with the strong component, a weaker component would thus prevent 72 fewer KSIs and 1,030 fewer casualties overall.
Geographically, the pattern of casualty reductions is similar for the weak and the strong criteria, suggesting that the differing impact of these two levels of implementation of passenger-related GDL is spread relatively evenly across all regions. This can be seen in Figure 4.7. Again, it should be remembered that each map is set against its own scale to highlight regional differences, so it is not possible to directly compare the strong and weak maps. A summary table that enables comparison of the strong and weak components in England, Scotland and Wales can be found in Table 4.4 in section 4.2.5.
Graduated Driver Licensing: A regional analysis of potential casualty savings in Great Britain39

The Potential Impact of Night-Time and Passenger GDL Components in Great Britain
Figure 4.7: Likely absolute reduction in casualties attributable to weak young-passenger component (no more than one 15- to 19-year-old passenger)
Contains Ordnance Survey data © Crown copyright and database right 2013
>=34 (9)27 – 34 (10)19 – 27 (8)14 – 19 (11)< 14 (11)
Legend
40

As with the previous analyses, the regions have been compared with each other. Figure 4.8 shows the likely reduction in all casualties in each region resulting from the introduction of a weak young-passenger GDL restriction, as a proportion of the total number of casualties in the region, with darker colours highlighting the regions experiencing the larger potential benefits.
Graduated Driver Licensing: A regional analysis of potential casualty savings in Great Britain41

The Potential Impact of Night-Time and Passenger GDL Components in Great Britain
Figure 4.8: Likely proportional reduction in casualties attributable to weak young-passenger component (no more than one 15- to 19-year-old passenger)
Contains Ordnance Survey data © Crown copyright and database right 2013
>=0.8% (11)0.7 – 0.8% (11)0.6 – 0.7% (12)0.55 – 0.6% (7)< 0.55% (8)
Legend
42
There are a number of differences between the strong and the weak components in terms of the proportional reduction in casualties region by region. Overall, the likely reductions with a weak component are around half of those predicted with a strong one, and range from 0.2% to 1.1% across the regions with the weak restrictions in place, compared with the range of 0.4% to 1.9% with the strong restrictions, noted in section 4.2.1.1 above. There are also some notable differences in the maps:
• Comparatively, Strathclyde, Merseyside, Oxfordshire, Bedfordshire, Devon, Avon & Somerset, Wiltshire, Hampshire & Isle of Wight and Sussex benefit less than most other regions from implementation of the strong component, but more than many others with the weak component of a young-passenger GDL restriction in place. This suggests that in these regions, where the difference between the proportional reduction in casualties resulting from strong and from weak young-passenger components of GDL is most pronounced, young drivers who are carrying passengers are more likely to carry more than one young passenger than is the case in the rest of Great Britain. It could be hypothesised that the majority of such trips with more than one passenger are related to social activities. Most of these regions relate to areas with a rural/urban mix and medium-sized populations.
• In the other direction, Lincolnshire goes from a relatively large predicted benefit (compared with other regions) under the strong component, to a relatively somewhat smaller benefit when the weak component is applied. It might be hypothesised that in this region, 17- to 19-year-old drivers more commonly carry just one young passenger.
4.2.2 England
In England, three regions have large predicted benefits in terms of proportional all-casualties reductions from implementation of the strong passenger component (Table B.4): Cornwall, Cumbria and Lincolnshire. Regions for which a strong passenger restriction has relatively less of an impact are (starting with the least affected): Greater London, Greater Manchester, Nottinghamshire, Leicestershire, Cambridgeshire, West Midlands, Northumbria, Merseyside, Warwickshire, West Yorkshire, Oxfordshire, Berkshire, Cleveland and Bedfordshire. These regions are spread throughout the country, but are more likely to have higher deprivation scores and to be highly urban (and therefore highly accessible), with a large population of young people and a small total length of major-road network.
As was the case with night-time GDL restrictions, some of these same areas which benefit least proportionally can be said to benefit most in terms of absolute reductions in casualties of all severities. In order from the highest to lowest under strong young-passenger GDL, these are: Greater London (strong=91; weak=48), Kent, West Yorkshire, Lancashire, West Midlands, Surrey, Greater Manchester and Hampshire & Isle of Wight (strong=65; weak=34).
Graduated Driver Licensing: A regional analysis of potential casualty savings in Great Britain43
The Potential Impact of Night-Time and Passenger GDL Components in Great Britain
4.2.3 Scotland
In Scotland, the Northern & Grampian region displays the biggest likely proportional impact on the overall casualty total, with a potential reduction of 1.6% (for the strong component). Given that this is consistent with the findings reported for night-time GDL in section 4.1.3, this underlines the fact that Northern & Grampian region young driver collisions form a higher proportion of all collisions than in general across Great Britain (a situation paralleled in Wales).
The region of Lothian & Borders and Dumfries & Galloway, and the Strathclyde region too, reap lower proportional benefits, with 1.1% and 1.2% respectively (using the strong component statistics). When it comes to absolute benefit, though, the largest would likely be seen in Strathclyde (58 casualties, of which 8 would be KSI).
4.2.4 Wales
All four regions in Wales fall into the high proportional benefit category, with proportions ranging from 1.7% in South Wales to 1.9% in Dyfed-Powys. This, combined with the evidence on the effect of night-time GDL presented in section 4.1.4, underlines the fact that young driver collisions form a higher proportion of all collisions in Wales than elsewhere in Great Britain. In absolute numbers, though, of the four Welsh regions it is South Wales that is likely to experience the greatest benefit (63 casualties, of which 5 would be KSI).
44

4.2.5 Passenger component summaryA summary of the estimated impact of both a strong and a weak passenger component of GDL in Great Britain can be seen in Table 4.4. The data suggests that the introduction of a passenger restriction, in any form, for novice drivers could significantly reduce the number of casualties from collisions involving these drivers. This analysis was limited to considering collisions involving 17- to 19-year-old drivers; a passenger restriction that was applied to all new drivers aged between 17 and 30 would be expected to result in even greater casualty savings.
Table 4.4: Expected reduction in collisions and casualties attributable to the implementation of GDL passenger component (strong vs weak)
Region
Expected reduction in annual number of collisions involving young drivers
Expected reduction in annual number of KSI casualties involving young drivers
Expected reduction in annual number of all casualties involving young drivers
Expected value of benefits (£ million)
Strong Weak Strong Weak Strong Weak Strong Weak
England 784 327 189 131 1,875 995 86 55
Scotland 66 29 25 15 150 82 10 6
Wales 60 27 17 12 165 89 8 5
Great Britain 910 383 231 159 2,191 1,166 104 66
Note: some totals may not sum exactly due to rounding.
Evidence suggests that the most effective age range for application of passenger restrictions to novice drivers is 17–30 years (Williams & Ferguson, 2002). The effect is actually reversed for older drivers. Chen et al. (2000) found that the collision risk for 30- to 59-year-old drivers actually reduces when they carry passengers. It is likely that this is due to carrying ‘older’ passengers who are actually of a similar age to the driver. For young novice drivers, carrying older passengers (35+ years) is also associated with a reduction in collision risk (Preusser et al., 1998).
As with the night-time component, the difference between a weak and strong passenger component is substantial.
Night-time and passenger components combined
It is common for jurisdictions to implement both a night-time and a passenger component as part of a GDL system. Clearly there is some overlap between
4.3
Graduated Driver Licensing: A regional analysis of potential casualty savings in Great Britain45
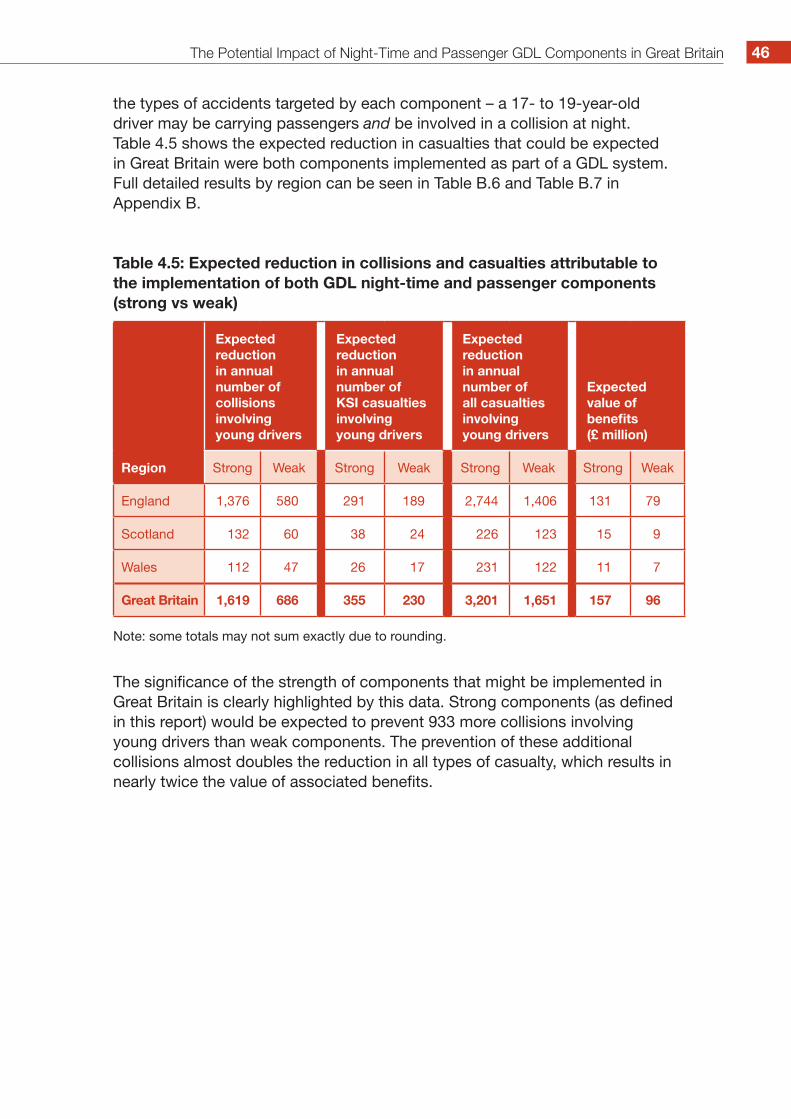
The Potential Impact of Night-Time and Passenger GDL Components in Great Britain
the types of accidents targeted by each component – a 17- to 19-year-old driver may be carrying passengers and be involved in a collision at night. Table 4.5 shows the expected reduction in casualties that could be expected in Great Britain were both components implemented as part of a GDL system. Full detailed results by region can be seen in Table B.6 and Table B.7 in Appendix B.
Table 4.5: Expected reduction in collisions and casualties attributable to the implementation of both GDL night-time and passenger components (strong vs weak)
Region
Expected reduction in annual number of collisions involving young drivers
Expected reduction in annual number of KSI casualties involving young drivers
Expected reduction in annual number of all casualties involving young drivers
Expected value of benefits (£ million)
Strong Weak Strong Weak Strong Weak Strong Weak
England 1,376 580 291 189 2,744 1,406 131 79
Scotland 132 60 38 24 226 123 15 9
Wales 112 47 26 17 231 122 11 7
Great Britain 1,619 686 355 230 3,201 1,651 157 96
Note: some totals may not sum exactly due to rounding.
The significance of the strength of components that might be implemented in Great Britain is clearly highlighted by this data. Strong components (as defined in this report) would be expected to prevent 933 more collisions involving young drivers than weak components. The prevention of these additional collisions almost doubles the reduction in all types of casualty, which results in nearly twice the value of associated benefits.
46
5. Conclusions
Graduated Driver Licensing: A regional analysis of potential casualty savings in Great Britain4747
This report provides the most in-depth analysis of the potential impact of graduated driver licensing (GDL) in Great Britain to date, and further informs the debate regarding how novice-driver safety in Great Britain can be improved. The Department for Transport evidence review (Kinnear et al., 2013) concluded that there is a considerable body of consistent scientific evidence that supports the introduction of a GDL system in Great Britain. The data presented here suggests that acting on this support and introducing GDL could yield substantial safety benefits.
Until now, the predicted impacts of GDL in Great Britain have been based on national data and have not provided enough detail about the potential effects that it would have on different regions. This report therefore presents two important kinds of information about the potential effect of a GDL system, both in its complete form and also for night-time and passenger components analysed separately:
1. the absolute number of casualties that would be saved each year in each region; and
2. the proportional benefit of GDL in a given region when compared with other regions.
The analysis suggests that GDL could have a significant national impact. Overall, a GDL system including multiple components (i.e. a full system as outlined in Section 3, not limited to only night-time and passenger components of the kind outlined in Section 4) could save 4,478 casualties (433 of these being KSI casualties – killed or seriously injured) and deliver benefits valued at £200.1 million annually. This analysis included only drivers aged between 17 and 19 years old. A GDL system that applied to older – or all – novice drivers would therefore result in even greater casualty savings.
The greatest absolute number of these casualties would be saved in the more populated, often more urban, regions of England, Scotland and Wales. In these regions, young driver collisions (those in which at least one young driver is involved) make up a smaller proportion of all collisions than is the case in more rural – and less populated – areas of Great Britain. Nevertheless, the predicted collision and casualty savings and values of associated benefits are significant in these regions due to population sizes, and it would therefore be expected that GDL would have a measurable impact on their communities.
Analysis of the relative effect of GDL suggests that it is the more rural regions that would benefit most. In these regions, young driver collisions make up a greater proportion of the total than is the case in the more populated ones.
Conclusions 4848
While these areas are therefore less populated, in relative terms the reduction in young driver collisions and associated casualties in such regions will be felt more keenly.
With regard to the night-time component, analysis revealed that a strong component would be substantially more effective in reducing collisions and casualties than a weaker component. Little variation was found geographically, although some regions appeared to show evidence of peaks in collisions at certain times that sat either side of the defined restriction. Defining the times at which a GDL restriction might be imposed is therefore important. A weak component will still be effective and may not have much impact on young drivers’ need to drive to a place of work. A stronger component would clearly save a greater number of casualties, but would obviously have a greater effect on travel within the first year of licensure.
If a GDL system was implemented in Great Britain, the trade-off between mobility and safety would need to be carefully considered. For example, the analysis completed for this report suggests that a novice-driver night-time restriction from 9 p.m. to 6 a.m. could save 1,613 casualties (of which 220 would be KSIs) and affect the 13.5% of 17- to 19-year-olds who currently drive to and from work, and the 1.9% driving for their job, between these times. For an initial period (e.g. 6 –12 months), these drivers would need to find alternative means of travel, or could be exempted by means of introducing an ‘exemption for work permit’. However, it has been suggested that such exemptions reduce the effectiveness of the restriction if they are issued too freely. Alternatively, a restriction from midnight to 5 a.m. could save 453 casualties (of which 75 would be KSIs) and affect the 2.6% of 17- to 19-year-olds that drive to and from work, and the 0.5% driving for their job, between these times. This would affect the mobility of fewer young drivers, but at the expense of forgoing the potential saving of an additional 1,160 casualties (including 145 more KSIs).
Results also suggested large differences between the effects of implementing a strong and a weak passenger component. The safety benefits afforded by the strong component appear to be spread reasonably evenly across the regions, although results suggested that collisions involving multiple young passengers are more prevalent in some regions than in others.
Future research could seek to explore the effect of a GDL system in even more detail. For example, it would be interesting to explore the potential impact of a GDL system in selected communities using public health measures of socioeconomic status and social deprivation. In addition, it would be valuable to understand the potential impact to rural communities in more detail.
In conclusion, this analysis provides a basis for discussion at a local level about the safety benefits that a national GDL system could bring. In more populated areas of Great Britain, the road safety benefit is due largely to the greater number of new drivers who would be affected by the GDL process.
Graduated Driver Licensing: A regional analysis of potential casualty savings in Great Britain49
Relatively speaking though, it is the more rural regions that will benefit most. In these regions, young driver collisions make up a greater proportion of all collisions and a reduction in these collisions would have a greater impact. For these reasons it can be concluded that GDL can be of benefit to all regions across Great Britain, not merely to a select few.
Taken as a whole, the evidence and the analyses presented here add to those presented in the DfT review (Kinnear et al., 2013) in suggesting that a substantial contribution to improving the safety of young and novice drivers in Great Britain, and the road users with whom they interact, would be provided by the introduction of a strong GDL system.
Conclusions 50
References
ABI (Association of British Insurers) (2013). Young Drivers: Young lives not young votes. How the insurance industry can help tackle young driver road safety and reduce premiums for young drivers. London: ABI.
Box, E. & Wengraf, I. (2013). Young Driver Safety: Solutions to an age old problem. RAC Foundation. London: RAC. Retrieved 31 January 2014 from www.racfoundation.org/assets/rac_foundation/content/downloadables/young_driver_safety-box_wengraf-july2013.pdf.
Chen, L. H., Baker, S. P., Braver, E. R. & Li, G. (2000). Carrying Passengers as a Risk Factor for Crashes Fatal to 16- and 17-Year-Old Drivers. JAMA: the Journal of the American Medical Association, 283(12): 1578–1582.
Christie, R. (2001). The effectiveness of driver training as a road safety measure. A review of the literature. Victoria, Australia: Royal Automobile Club of Victoria.
Clinton, K. & Lonero, L. (2006). Guidelines for evaluating driver education programs. Washington, D.C.: AAA Foundation for Traffic Safety.
Co-operative Insurance (2013). Young Drivers Report: Are they ready for the road? Retrieved 31 January 2014 from www.co-operative.coop/corporate/Young_Drivers_are_they_ready_for_the_road.pdf.
DfT (Department for Transport) (2013a). Reported Road Casualties Great Britain: Annual report 2012. London: DfT. Retrieved 31 January 2014 from www.gov.uk/government/publications/reported-road-casualties-great-britain-annual-report-2012.
DfT (2013b). Reported Road Casualties in Great Britain: 2012 annual report. A valuation of road accidents and casualties in Great Britain in 2012. London: DfT. Retrieved 31 January 2014 from www.gov.uk/government/uploads/system/uploads/attachment_data/file/244913/rrcgb2012-02.pdf.
Fosdick, T. (2013). Too Much, Too Young, Too Fast: Understanding the risks of living and driving in the countryside. Banbury: Road Safety Analysis. Retrieved 31 January 2014 from www.roadsafetyanalysis.org/wp-content/uploads/sites/13/2013/05/Too-Much-Too-Young-Too-Fast-Summary-2013.pdf.
Helman, S., Grayson, G. B. & Parkes, A. M. (2010). How Can We Produce Safer New Drivers? A review of the effects of experience, training and limiting exposure on the collision risk of new drivers. TRL Insight Report INS005. Crowthorne: Transport Research Laboratory. Retrieved 31 January 2014 from www.trl.co.uk/online_store/reports_publications/trl_reports/cat_paper_insight_reports/report_how_can_we_produce_safer_new_drivers.htm.
6
Graduated Driver Licensing: A regional analysis of potential casualty savings in Great Britain51
References
Jones, S. J., Begg, D. J. & Palmer, S. R. (2013). Reducing Young Driver Crash Casualties in Great Britain: Use of routine police crash data to estimate the potential benefits of graduated driver licensing. International Journal of Injury Control and Safety Promotion, 20(4): 321–330.
Ker, K., Roberts, I. G., Collier, T., Beyer, F. R., Bunn, F. & Frost, C. (2003). Post-licence driver education for the prevention of road traffic crashes. Cochrane Database of Systematic Reviews 2003, Issue 3. Art. No.: CD003734.
Kinnear, N., Helman, S. & Walter, L. (2011). A Segmentation of Novice Drivers in Great Britain: Factors associated with intention to take advanced driver training. Project report PPR590. Crowthorne: Transport Research Laboratory. Retrieved 31 January 2014 from www.trl.co.uk/online_store/reports_publications/trl_reports/cat_road_user_safety/report_a_segmentation_of_novice_drivers_in_great_britain:_factors_associated_with_intention_to_take_advanced_driver_training.htm.
Kinnear, N., Lloyd, L., Helman, S., Husband, P., Scoons, J., Jones, S., Stradling, S., McKenna, F. & Broughton J. (2013). Novice Drivers: evidence review and evaluation: pre-driver education and training, graduated driver licensing, and the New Drivers Act. Project report PPR673. Crowthorne: Transport Research Laboratory. Retrieved 31 January 2014 from www.trl.co.uk/online_store/reports_publications/trl_reports/cat_road_user_safety/report_novice_drivers_-_evidence_review_and_evaluation.htm.
Mayhew, D.R., Simpson, H.M., Williams, A.F. & Ferguson, S.A. (1998). Effectiveness and role of driver education and training in a graduated licensing system. Journal of Public Health Policy, 19, 51–67.
Mayhew, D.R., Simpson, H.M. & Robinson, A. (2002). The safety value of driver education and training. Injury Prevention, 8 (supplement II), ii3–ii8.
McCartt, A. T., Mayhew, D. R., Braitman, K. A., Ferguson, S. A. & Simpson, H. M. (2009). Effects of Age and Experience on Young Driver Crashes: Review of recent literature. Traffic Injury Prevention, 10(3): 209–219.
McKenna, F. P. (2010). The Public Health Benefits of Road Safety Education for Teenagers. Think Piece for Road Safety Scotland. Edinburgh: Transport Scotland. Retrieved 31 January 2014 from www.road-safety.org.uk/downloads/1281709104-McKennathinkpiece2.doc.
Preusser, D. F., Ferguson, S. A. & Williams, A.F. (1998). The Effect of Teenage Passengers on the Fatal Crash Risk of Teenage Drivers. Accident Analysis & Prevention, 30(2): 217–222.
RAC (2013). RAC reports on motoring 2013. Retrieved 31 January 2014 from www.rac.co.uk/advice/reports-on-motoring/.
52

Roberts, I.G. & Kwan, I. (2001). School-based driver education for the prevention of traffic crashes. Cochrane Database of Systematic Reviews, Issue 3. Art. No.:CD003201.DOI: 10.1002/14651858. CD003201.
Russell, K. F., Vandermeer, B. & Hartling, L. (2011). Graduated Driver Licensing for Reducing Motor Vehicle Crashes Among Young Drivers. Cochrane Database of Systematic Reviews, DOI: 10.1002/14651858.CD003300.pub3.
Vernick, J.S., Li, G., Ogaitis, S., MacKenzie, E.J., Baker, S.P. & Gielen, A.C. (1999). Effects of high school driver education on motor vehicle crashes, violations and licensure. American Journal of Preventative Medicine, 16, 40–46.
Williams, A. F. & Ferguson, S. A. (2002). Rationale for Graduated Licensing and the Risks it Should Address. Injury Prevention, 8(Suppl 2): ii9–ii16.
Graduated Driver Licensing: A regional analysis of potential casualty savings in Great Britain53
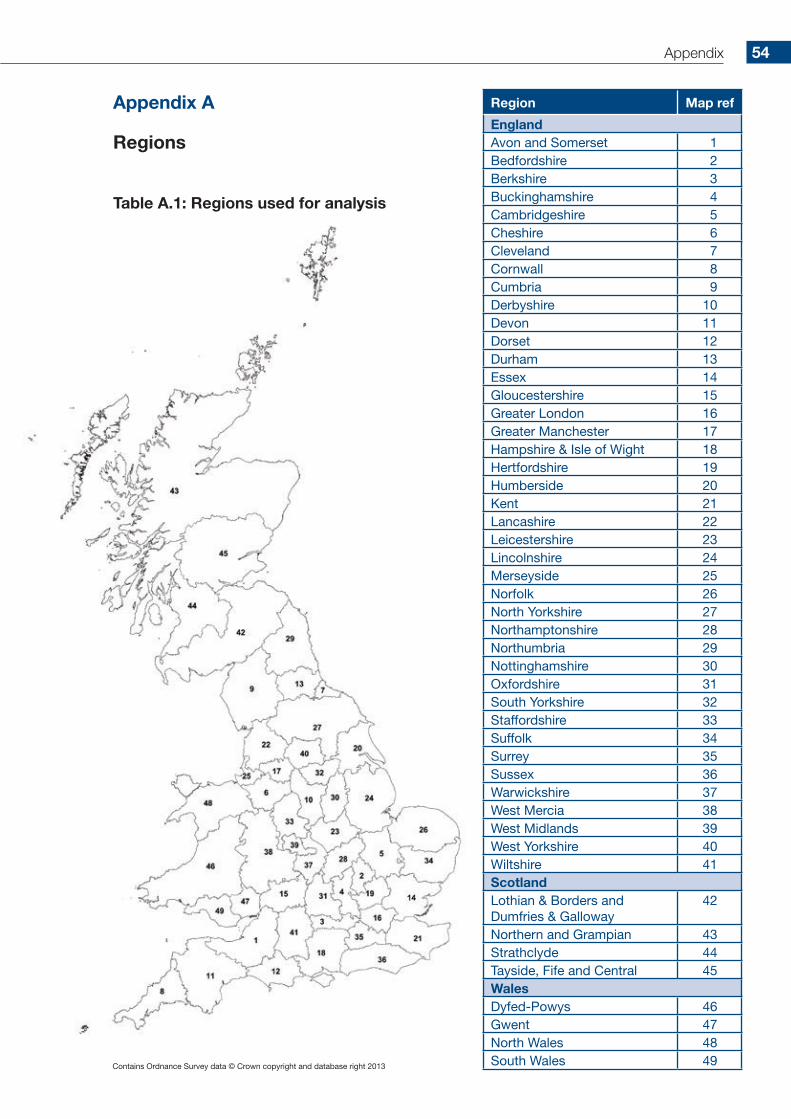
Appendix
Appendix A
Regions
Table A.1: Regions used for analysis
Region Map ref
EnglandAvon and Somerset 1Bedfordshire 2Berkshire 3Buckinghamshire 4Cambridgeshire 5Cheshire 6Cleveland 7Cornwall 8Cumbria 9Derbyshire 10Devon 11Dorset 12Durham 13Essex 14Gloucestershire 15Greater London 16Greater Manchester 17Hampshire & Isle of Wight 18Hertfordshire 19Humberside 20Kent 21Lancashire 22Leicestershire 23Lincolnshire 24Merseyside 25Norfolk 26North Yorkshire 27Northamptonshire 28Northumbria 29Nottinghamshire 30Oxfordshire 31South Yorkshire 32Staffordshire 33Suffolk 34Surrey 35Sussex 36Warwickshire 37West Mercia 38West Midlands 39West Yorkshire 40Wiltshire 41ScotlandLothian & Borders and Dumfries & Galloway
42
Northern and Grampian 43Strathclyde 44Tayside, Fife and Central 45WalesDyfed-Powys 46Gwent 47North Wales 48South Wales 49Contains Ordnance Survey data © Crown copyright and database right 2013
54

Ap
pen
dix
B
Tab
les
of
Dat
a
Tab
le B
.1: O
vera
ll yo
ung
dri
ver
casu
alty
and
co
llisi
on
num
ber
s an
d e
xpec
ted
red
ucti
on
attr
ibut
able
to
a f
ull G
DL
syst
em
Country
Reg
ion
Youn
g
dri
vers
KS
Ico
llisi
on
rate
* (F
igur
e 3.
1)
KS
I-ca
sual
ty
pro
po
rtio
n**
(Fig
ure
3.2)
Pro
po
rtio
n o
f al
l re
gio
nal
colli
sio
ns
that
in
volv
ed a
17
–19
year
-o
ld d
rive
r
Pro
po
rtio
n o
f al
l re
gio
nal
casu
alti
es
that
in
volv
ed a
17
–19
year
-o
ld d
rive
r
Exp
ecte
d
red
ucti
on
in
annu
al K
SI
colli
sio
ns
invo
lvin
g
17–1
9 ye
ar-
old
dri
vers
Exp
ecte
d
red
ucti
on
in a
nnua
l co
llisi
ons
in
volv
ing
17
–19
year
-o
ld d
rive
rs
Exp
ecte
d
red
ucti
on
in
annu
al K
SI
casu
alti
es
fro
m
colli
sio
ns
invo
lvin
g a
17
–19
year
-o
ld d
rive
r
Exp
ecte
d
red
ucti
on
in a
nnua
l ca
sual
ties
fr
om
co
llisi
ons
in
volv
ing
a
17–1
9 ye
ar-
old
dri
ver
Exp
ecte
d
valu
e o
f b
enefi
ts
(£ m
illio
n)
England
Avo
n an
d
Som
erse
t7.
212
.1%
11.4
%13
.0%
656
1112
15.
2
Bed
ford
shire
8.4
11.7
%11
.0%
13.0
%3
235
522.
2
Ber
kshi
re6.
39.
6%9.
9%11
.7%
329
460
2.3
Buc
king
ham
shire
8.4
11.3
%10
.8%
12.4
%3
316
662.
8
Cam
brid
gesh
ire9.
510
.8%
10.2
%11
.6%
434
770
3.4
Che
shire
11.6
10.6
%11
.0%
12.7
%6
4411
104
4.8
Cle
vela
nd5.
911
.1%
11.9
%13
.8%
214
335
1.5
Cor
nwal
l9.
211
.5%
13.5
%15
.5%
228
460
2.1
Cum
bria
10.0
12.5
%13
.7%
15.8
%3
255
532.
2
Der
bys
hire
8.6
10.9
%11
.1%
13.3
%5
438
933.
9
Dev
on5.
910
.5%
11.3
%13
.1%
447
696
3.3
Dor
set
10.7
11.8
%11
.9%
14.0
%4
297
663.
2
Dur
ham
7.5
11.6
%12
.3%
14.1
%3
234
542.
2
Ess
ex10
.312
.7%
11.6
%13
.8%
964
1613
67.
1
Graduated Driver Licensing: A regional analysis of potential casualty savings in Great Britain55
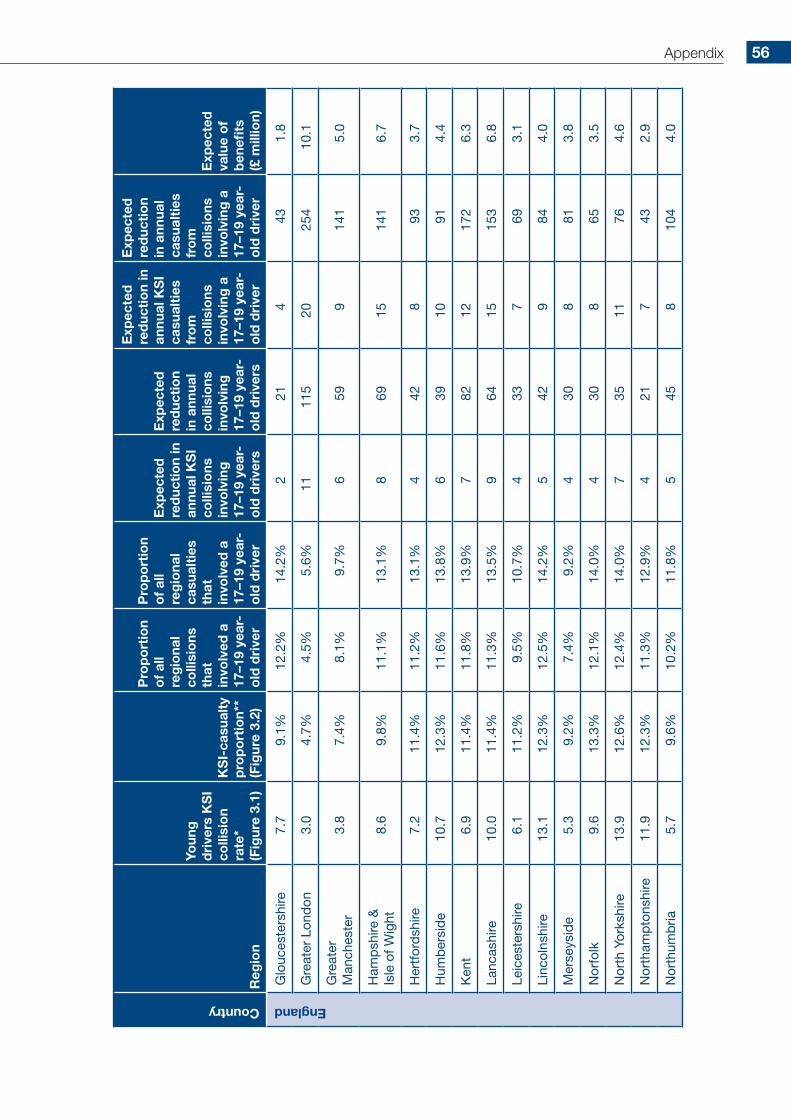
Country
Reg
ion
Youn
g
dri
vers
KS
Ico
llisi
on
rate
* (F
igur
e 3.
1)
KS
I-ca
sual
ty
pro
po
rtio
n**
(Fig
ure
3.2)
Pro
po
rtio
n o
f al
l re
gio
nal
colli
sio
ns
that
in
volv
ed a
17
–19
year
-o
ld d
rive
r
Pro
po
rtio
n o
f al
l re
gio
nal
casu
alti
es
that
in
volv
ed a
17
–19
year
-o
ld d
rive
r
Exp
ecte
d
red
ucti
on
in
annu
al K
SI
colli
sio
ns
invo
lvin
g
17–1
9 ye
ar-
old
dri
vers
Exp
ecte
d
red
ucti
on
in a
nnua
l co
llisi
ons
in
volv
ing
17
–19
year
-o
ld d
rive
rs
Exp
ecte
d
red
ucti
on
in
annu
al K
SI
casu
alti
es
fro
m
colli
sio
ns
invo
lvin
g a
17
–19
year
-o
ld d
rive
r
Exp
ecte
d
red
ucti
on
in a
nnua
l ca
sual
ties
fr
om
co
llisi
ons
in
volv
ing
a
17–1
9 ye
ar-
old
dri
ver
Exp
ecte
d
valu
e o
f b
enefi
ts
(£ m
illio
n)
England
Glo
uces
ters
hire
7.7
9.1%
12.2
%14
.2%
221
443
1.8
Gre
ater
Lon
don
3.0
4.7%
4.5%
5.6%
1111
520
254
10.1
Gre
ater
M
anch
este
r3.
87.
4%8.
1%9.
7%6
599
141
5.0
Ham
psh
ire &
Is
le o
f Wig
ht8.
69.
8%11
.1%
13.1
%8
6915
141
6.7
Her
tfor
dsh
ire7.
211
.4%
11.2
%13
.1%
442
893
3.7
Hum
ber
sid
e10
.712
.3%
11.6
%13
.8%
639
1091
4.4
Ken
t6.
911
.4%
11.8
%13
.9%
782
1217
26.
3
Lanc
ashi
re10
.011
.4%
11.3
%13
.5%
964
1515
36.
8
Leic
este
rshi
re6.
111
.2%
9.5%
10.7
%4
337
693.
1
Linc
olns
hire
13.1
12.3
%12
.5%
14.2
%5
429
844.
0
Mer
seys
ide
5.3
9.2%
7.4%
9.2%
430
881
3.8
Nor
folk
9.6
13.3
%12
.1%
14.0
%4
308
653.
5
Nor
th Y
orks
hire
13.9
12.6
%12
.4%
14.0
%7
3511
764.
6
Nor
tham
pto
nshi
re11
.912
.3%
11.3
%12
.9%
421
743
2.9
Nor
thum
bria
5.7
9.6%
10.2
%11
.8%
545
810
44.
0
Appendix 56
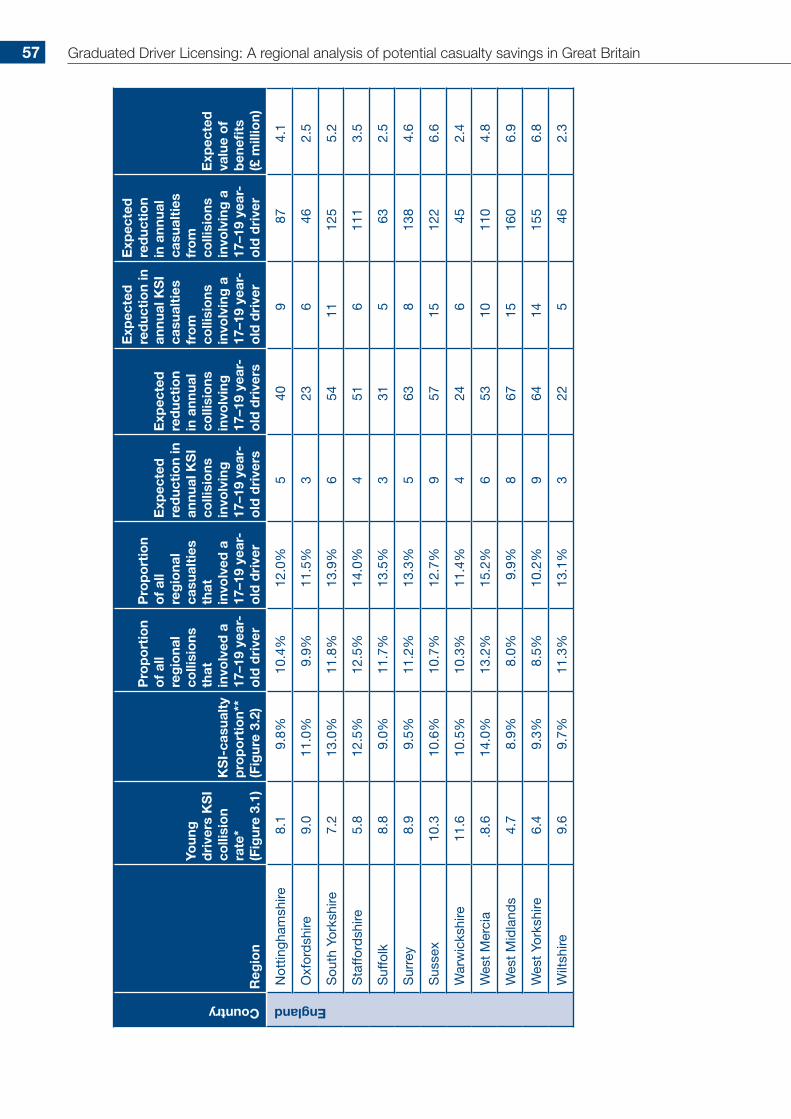
Country
Reg
ion
Youn
g
dri
vers
KS
Ico
llisi
on
rate
* (F
igur
e 3.
1)
KS
I-ca
sual
ty
pro
po
rtio
n**
(Fig
ure
3.2)
Pro
po
rtio
n o
f al
l re
gio
nal
colli
sio
ns
that
in
volv
ed a
17
–19
year
-o
ld d
rive
r
Pro
po
rtio
n o
f al
l re
gio
nal
casu
alti
es
that
in
volv
ed a
17
–19
year
-o
ld d
rive
r
Exp
ecte
d
red
ucti
on
in
annu
al K
SI
colli
sio
ns
invo
lvin
g
17–1
9 ye
ar-
old
dri
vers
Exp
ecte
d
red
ucti
on
in a
nnua
l co
llisi
ons
in
volv
ing
17
–19
year
-o
ld d
rive
rs
Exp
ecte
d
red
ucti
on
in
annu
al K
SI
casu
alti
es
fro
m
colli
sio
ns
invo
lvin
g a
17
–19
year
-o
ld d
rive
r
Exp
ecte
d
red
ucti
on
in a
nnua
l ca
sual
ties
fr
om
co
llisi
ons
in
volv
ing
a
17–1
9 ye
ar-
old
dri
ver
Exp
ecte
d
valu
e o
f b
enefi
ts
(£ m
illio
n)
England
Not
tingh
amsh
ire8.
19.
8%10
.4%
12.0
%5
409
874.
1
Oxf
ord
shire
9.0
11.0
%9.
9%11
.5%
323
646
2.5
Sou
th Y
orks
hire
7.2
13.0
%11
.8%
13.9
%6
5411
125
5.2
Sta
fford
shire
5.8
12.5
%12
.5%
14.0
%4
516
111
3.5
Suf
folk
8.8
9.0%
11.7
%13
.5%
331
563
2.5
Sur
rey
8.9
9.5%
11.2
%13
.3%
563
813
84.
6
Sus
sex
10.3
10.6
%10
.7%
12.7
%9
5715
122
6.6
War
wic
kshi
re11
.610
.5%
10.3
%11
.4%
424
645
2.4
Wes
t M
erci
a.8
.614
.0%
13.2
%15
.2%
653
1011
04.
8
Wes
t M
idla
nds
4.7
8.9%
8.0%
9.9%
867
1516
06.
9
Wes
t Yo
rksh
ire6.
49.
3%8.
5%10
.2%
964
1415
56.
8
Wilt
shire
9.6
9.7%
11.3
%13
.1%
322
546
2.3
Graduated Driver Licensing: A regional analysis of potential casualty savings in Great Britain57
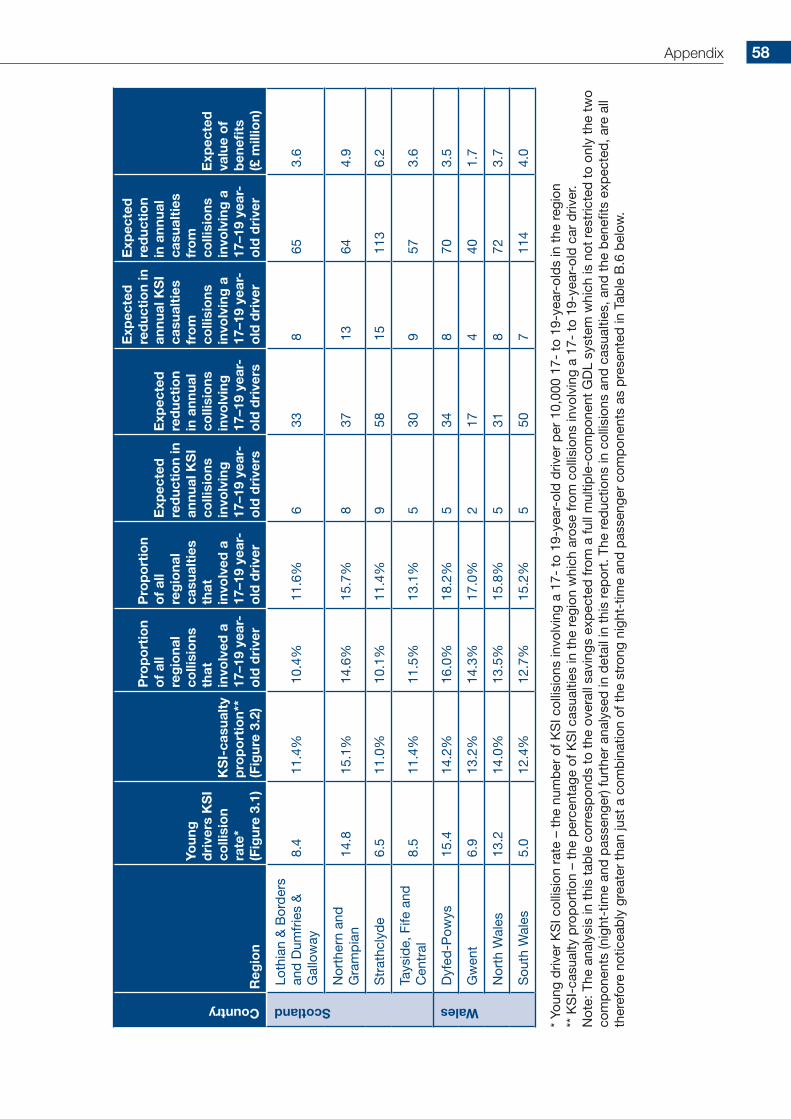
Country
Reg
ion
Youn
g
dri
vers
KS
Ico
llisi
on
rate
* (F
igur
e 3.
1)
KS
I-ca
sual
ty
pro
po
rtio
n**
(Fig
ure
3.2)
Pro
po
rtio
n o
f al
l re
gio
nal
colli
sio
ns
that
in
volv
ed a
17
–19
year
-o
ld d
rive
r
Pro
po
rtio
n o
f al
l re
gio
nal
casu
alti
es
that
in
volv
ed a
17
–19
year
-o
ld d
rive
r
Exp
ecte
d
red
ucti
on
in
annu
al K
SI
colli
sio
ns
invo
lvin
g
17–1
9 ye
ar-
old
dri
vers
Exp
ecte
d
red
ucti
on
in a
nnua
l co
llisi
ons
in
volv
ing
17
–19
year
-o
ld d
rive
rs
Exp
ecte
d
red
ucti
on
in
annu
al K
SI
casu
alti
es
fro
m
colli
sio
ns
invo
lvin
g a
17
–19
year
-o
ld d
rive
r
Exp
ecte
d
red
ucti
on
in a
nnua
l ca
sual
ties
fr
om
co
llisi
ons
in
volv
ing
a
17–1
9 ye
ar-
old
dri
ver
Exp
ecte
d
valu
e o
f b
enefi
ts
(£ m
illio
n)
Scotland
Loth
ian
& B
ord
ers
and
Dum
frie
s &
G
allo
way
8.4
11.4
%10
.4%
11.6
%6
338
653.
6
Nor
ther
n an
d
Gra
mp
ian
14.8
15.1
%14
.6%
15.7
%8
3713
644.
9
Str
athc
lyd
e6.
511
.0%
10.1
%11
.4%
958
1511
36.
2
Tays
ide,
Fife
and
C
entr
al8.
511
.4%
11.5
%13
.1%
530
957
3.6
Wales
Dyf
ed-P
owys
15.4
14.2
%16
.0%
18.2
%5
348
703.
5
Gw
ent
6.9
13.2
%14
.3%
17.0
%2
174
401.
7
Nor
th W
ales
13.2
14.0
%13
.5%
15.8
%5
318
723.
7
Sou
th W
ales
5.0
12.4
%12
.7%
15.2
%5
507
114
4.0
* Yo
ung
driv
er K
SI c
ollis
ion
rate
– t
he n
umb
er o
f KS
I col
lisio
ns in
volv
ing
a 17
- to
19-
year
-old
driv
er p
er 1
0,00
0 17
- to
19-
year
-old
s in
the
reg
ion
** K
SI-
casu
alty
pro
por
tion
– th
e p
erce
ntag
e of
KS
I cas
ualti
es in
the
reg
ion
whi
ch a
rose
from
col
lisio
ns in
volv
ing
a 17
- to
19-
year
-old
car
driv
er.
Not
e: T
he a
naly
sis
in t
his
tab
le c
orre
spon
ds
to t
he o
vera
ll sa
ving
s ex
pec
ted
from
a fu
ll m
ultip
le-c
omp
onen
t G
DL
syst
em w
hich
is n
ot r
estr
icte
d t
o on
ly t
he t
wo
com
pon
ents
(nig
ht-t
ime
and
pas
seng
er) f
urth
er a
naly
sed
in d
etai
l in
this
rep
ort.
The
red
uctio
ns in
col
lisio
ns a
nd c
asua
lties
, and
the
ben
efits
exp
ecte
d, a
re a
ll th
eref
ore
notic
eab
ly g
reat
er t
han
just
a c
omb
inat
ion
of t
he s
tron
g ni
ght-
time
and
pas
seng
er c
omp
onen
ts a
s p
rese
nted
in T
able
B.6
bel
ow.
Appendix 58
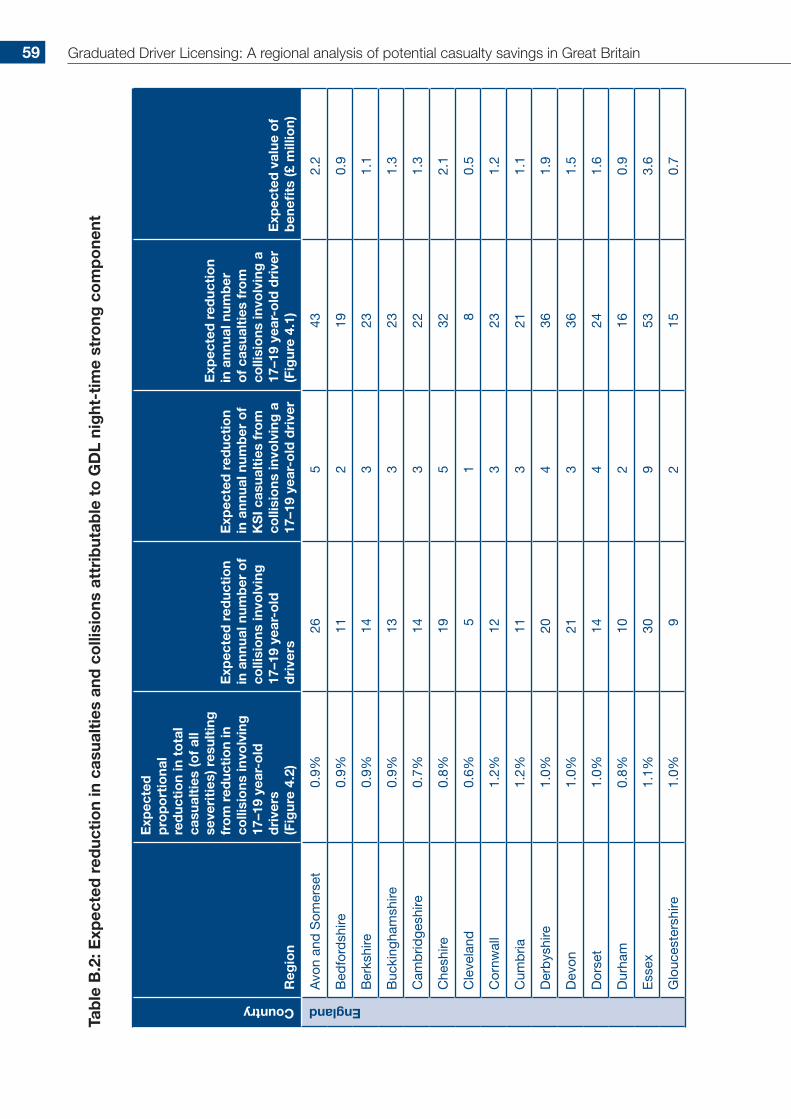
Tab
le B
.2: E
xpec
ted
red
ucti
on
in c
asua
ltie
s an
d c
olli
sio
ns a
ttri
but
able
to
GD
L ni
ght
-tim
e st
rong
co
mp
one
ntCountry
Reg
ion
Exp
ecte
d
pro
po
rtio
nal
red
ucti
on
in t
ota
l ca
sual
ties
(of
all
seve
riti
es) r
esul
ting
fr
om
red
ucti
on
in
colli
sio
ns in
volv
ing
17
–19
year
-old
d
rive
rs
(Fig
ure
4.2)
Exp
ecte
d r
educ
tio
n in
ann
ual n
umb
er o
f co
llisi
ons
invo
lvin
g
17–1
9 ye
ar-o
ld
dri
vers
Exp
ecte
d r
educ
tio
n in
ann
ual n
umb
er o
f K
SI c
asua
ltie
s fr
om
co
llisi
ons
invo
lvin
g a
17
–19
year
-old
dri
ver
Exp
ecte
d r
educ
tio
n in
ann
ual n
umb
er
of
casu
alti
es f
rom
co
llisi
ons
invo
lvin
g a
17
–19
year
-old
dri
ver
(Fig
ure
4.1)
Exp
ecte
d v
alue
of
ben
efits
(£ m
illio
n)
England
Avo
n an
d S
omer
set
0.9%
265
432.
2
Bed
ford
shire
0.9%
112
190.
9
Ber
kshi
re0.
9%14
323
1.1
Buc
king
ham
shire
0.9%
133
231.
3
Cam
brid
gesh
ire0.
7%14
322
1.3
Che
shire
0.8%
195
322.
1
Cle
vela
nd0.
6%5
18
0.5
Cor
nwal
l1.
2%12
323
1.2
Cum
bria
1.2%
113
211.
1
Der
bys
hire
1.0%
204
361.
9
Dev
on1.
0%21
336
1.5
Dor
set
1.0%
144
241.
6
Dur
ham
0.8%
102
160.
9
Ess
ex1.
1%30
953
3.6
Glo
uces
ters
hire
1.0%
92
150.
7
Graduated Driver Licensing: A regional analysis of potential casualty savings in Great Britain59

Country
Reg
ion
Exp
ecte
d
pro
po
rtio
nal
red
ucti
on
in t
ota
l ca
sual
ties
(of
all
seve
riti
es) r
esul
ting
fr
om
red
ucti
on
in
colli
sio
ns in
volv
ing
17
–19
year
-old
d
rive
rs
(Fig
ure
4.2)
Exp
ecte
d r
educ
tio
n in
ann
ual n
umb
er o
f co
llisi
ons
invo
lvin
g
17–1
9 ye
ar-o
ld
dri
vers
Exp
ecte
d r
educ
tio
n in
ann
ual n
umb
er o
f K
SI c
asua
ltie
s fr
om
co
llisi
ons
invo
lvin
g a
17
–19
year
-old
dri
ver
Exp
ecte
d r
educ
tio
n in
ann
ual n
umb
er
of
casu
alti
es f
rom
co
llisi
ons
invo
lvin
g a
17
–19
year
-old
dri
ver
(Fig
ure
4.1)
Exp
ecte
d v
alue
of
ben
efits
(£ m
illio
n)
England
Gre
ater
Lon
don
0.5%
6612
105
5.2
Gre
ater
Man
ches
ter
0.7%
284
492.
1
Ham
psh
ire &
Is
le o
f Wig
ht0.
9%29
646
2.5
Her
tfor
dsh
ire1.
0%19
436
1.7
Hum
ber
sid
e0.
9%16
529
2.1
Ken
t1.
0%36
664
2.8
Lanc
ashi
re0.
9%27
1053
3.8
Leic
este
rshi
re0.
7%15
323
1.1
Linc
olns
hire
1.0%
175
281.
9
Mer
seys
ide
0.7%
165
311.
9
Nor
folk
1.0%
134
231.
4
Nor
th Y
orks
hire
0.9%
144
231.
7
Nor
tham
pto
nshi
re1.
0%10
416
1.4
Nor
thum
bria
0.7%
194
311.
7
Not
tingh
amsh
ire0.
8%17
427
1.7
Appendix 60

Country
Reg
ion
Exp
ecte
d
pro
po
rtio
nal
red
ucti
on
in t
ota
l ca
sual
ties
(of
all
seve
riti
es) r
esul
ting
fr
om
red
ucti
on
in
colli
sio
ns in
volv
ing
17
–19
year
-old
d
rive
rs
(Fig
ure
4.2)
Exp
ecte
d r
educ
tio
n in
ann
ual n
umb
er o
f co
llisi
ons
invo
lvin
g
17–1
9 ye
ar-o
ld
dri
vers
Exp
ecte
d r
educ
tio
n in
ann
ual n
umb
er o
f K
SI c
asua
ltie
s fr
om
co
llisi
ons
invo
lvin
g a
17
–19
year
-old
dri
ver
Exp
ecte
d r
educ
tio
n in
ann
ual n
umb
er
of
casu
alti
es f
rom
co
llisi
ons
invo
lvin
g a
17
–19
year
-old
dri
ver
(Fig
ure
4.1)
Exp
ecte
d v
alue
of
ben
efits
(£ m
illio
n)
England
Oxf
ord
shire
0.7%
92
151.
0
Sou
th Y
orks
hire
1.0%
245
452.
2
Sta
fford
shire
1.0%
233
381.
4
Suf
folk
0.8%
132
190.
9
Sur
rey
1.0%
295
502.
2
Sus
sex
1.0%
278
463.
2
War
wic
kshi
re0.
8%11
317
1.1
Wes
t M
erci
a1.
1%25
540
2.0
Wes
t M
idla
nds
0.7%
307
553.
0
Wes
t Yo
rksh
ire0.
7%28
854
3.2
Wilt
shire
0.9%
103
171.
1
Graduated Driver Licensing: A regional analysis of potential casualty savings in Great Britain61

Country
Reg
ion
Exp
ecte
d
pro
po
rtio
nal
red
ucti
on
in t
ota
l ca
sual
ties
(of
all
seve
riti
es) r
esul
ting
fr
om
red
ucti
on
in
colli
sio
ns in
volv
ing
17
–19
year
-old
d
rive
rs
(Fig
ure
4.2)
Exp
ecte
d r
educ
tio
n in
ann
ual n
umb
er o
f co
llisi
ons
invo
lvin
g
17–1
9 ye
ar-o
ld
dri
vers
Exp
ecte
d r
educ
tio
n in
ann
ual n
umb
er o
f K
SI c
asua
ltie
s fr
om
co
llisi
ons
invo
lvin
g a
17
–19
year
-old
dri
ver
Exp
ecte
d r
educ
tio
n in
ann
ual n
umb
er
of
casu
alti
es f
rom
co
llisi
ons
invo
lvin
g a
17
–19
year
-old
dri
ver
(Fig
ure
4.1)
Exp
ecte
d v
alue
of
ben
efits
(£ m
illio
n)
Scotland
Loth
ian
& B
ord
ers
and
D
umfr
ies
& G
allo
way
1.0%
185
282.
0
Nor
ther
n an
d
Gra
mp
ian
1.6%
218
322.
9
Str
athc
lyd
e1.
0%31
848
3.1
Tays
ide,
Fife
and
C
entr
al1.
1%16
425
1.6
Wales
Dyf
ed-P
owys
1.3%
153
241.
2
Gw
ent
1.1%
71
130.
7
Nor
th W
ales
1.2%
165
281.
9
Sou
th W
ales
1.1%
245
432.
2
Appendix 62
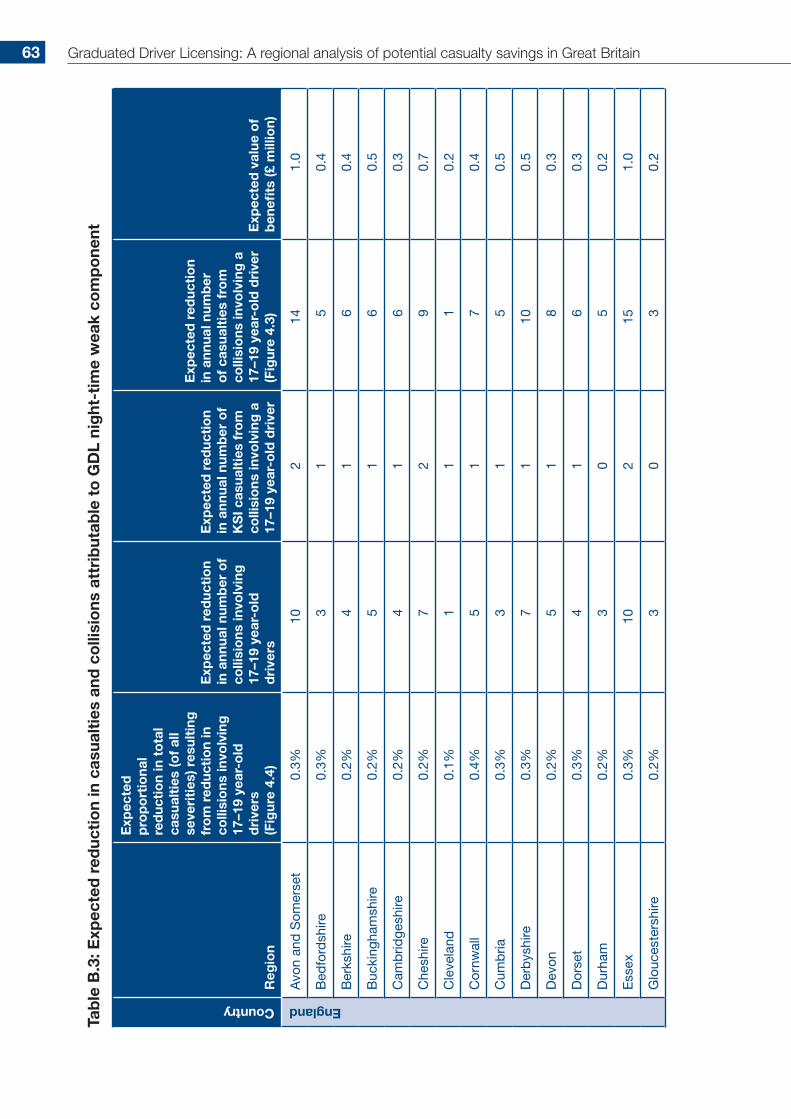
Tab
le B
.3: E
xpec
ted
red
ucti
on
in c
asua
ltie
s an
d c
olli
sio
ns a
ttri
but
able
to
GD
L ni
ght
-tim
e w
eak
com
po
nent
Country
Reg
ion
Exp
ecte
d
pro
po
rtio
nal
red
ucti
on
in t
ota
l ca
sual
ties
(of
all
seve
riti
es) r
esul
ting
fr
om
red
ucti
on
in
colli
sio
ns in
volv
ing
17
–19
year
-old
d
rive
rs(F
igur
e 4.
4)
Exp
ecte
d r
educ
tio
n in
ann
ual n
umb
er o
f co
llisi
ons
invo
lvin
g
17–1
9 ye
ar-o
ld
dri
vers
Exp
ecte
d r
educ
tio
n in
ann
ual n
umb
er o
f K
SI c
asua
ltie
s fr
om
co
llisi
ons
invo
lvin
g a
17
–19
year
-old
dri
ver
Exp
ecte
d r
educ
tio
n in
ann
ual n
umb
er
of
casu
alti
es f
rom
co
llisi
ons
invo
lvin
g a
17
–19
year
-old
dri
ver
(Fig
ure
4.3)
Exp
ecte
d v
alue
of
ben
efits
(£ m
illio
n)
England
Avo
n an
d S
omer
set
0.3%
102
141.
0
Bed
ford
shire
0.3%
31
50.
4
Ber
kshi
re0.
2%4
16
0.4
Buc
king
ham
shire
0.2%
51
60.
5
Cam
brid
gesh
ire0.
2%4
16
0.3
Che
shire
0.2%
72
90.
7
Cle
vela
nd0.
1%1
11
0.2
Cor
nwal
l0.
4%5
17
0.4
Cum
bria
0.3%
31
50.
5
Der
bys
hire
0.3%
71
100.
5
Dev
on0.
2%5
18
0.3
Dor
set
0.3%
41
60.
3
Dur
ham
0.2%
30
50.
2
Ess
ex0.
3%10
215
1.0
Glo
uces
ters
hire
0.2%
30
30.
2
Graduated Driver Licensing: A regional analysis of potential casualty savings in Great Britain63
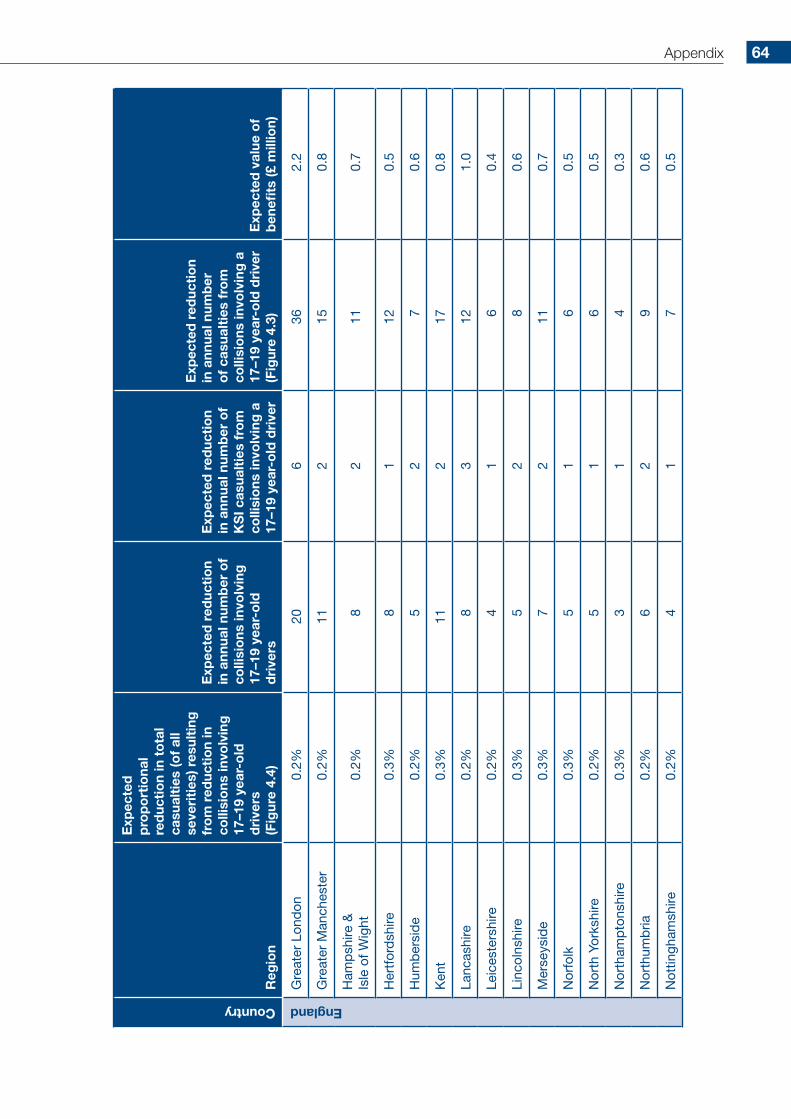
Country
Reg
ion
Exp
ecte
d
pro
po
rtio
nal
red
ucti
on
in t
ota
l ca
sual
ties
(of
all
seve
riti
es) r
esul
ting
fr
om
red
ucti
on
in
colli
sio
ns in
volv
ing
17
–19
year
-old
d
rive
rs(F
igur
e 4.
4)
Exp
ecte
d r
educ
tio
n in
ann
ual n
umb
er o
f co
llisi
ons
invo
lvin
g
17–1
9 ye
ar-o
ld
dri
vers
Exp
ecte
d r
educ
tio
n in
ann
ual n
umb
er o
f K
SI c
asua
ltie
s fr
om
co
llisi
ons
invo
lvin
g a
17
–19
year
-old
dri
ver
Exp
ecte
d r
educ
tio
n in
ann
ual n
umb
er
of
casu
alti
es f
rom
co
llisi
ons
invo
lvin
g a
17
–19
year
-old
dri
ver
(Fig
ure
4.3)
Exp
ecte
d v
alue
of
ben
efits
(£ m
illio
n)
England
Gre
ater
Lon
don
0.2%
206
362.
2
Gre
ater
Man
ches
ter
0.2%
112
150.
8
Ham
psh
ire &
Is
le o
f Wig
ht0.
2%8
211
0.7
Her
tfor
dsh
ire0.
3%8
112
0.5
Hum
ber
sid
e0.
2%5
27
0.6
Ken
t0.
3%11
217
0.8
Lanc
ashi
re0.
2%8
312
1.0
Leic
este
rshi
re0.
2%4
16
0.4
Linc
olns
hire
0.3%
52
80.
6
Mer
seys
ide
0.3%
72
110.
7
Nor
folk
0.3%
51
60.
5
Nor
th Y
orks
hire
0.2%
51
60.
5
Nor
tham
pto
nshi
re0.
3%3
14
0.3
Nor
thum
bria
0.2%
62
90.
6
Not
tingh
amsh
ire0.
2%4
17
0.5
Appendix 64
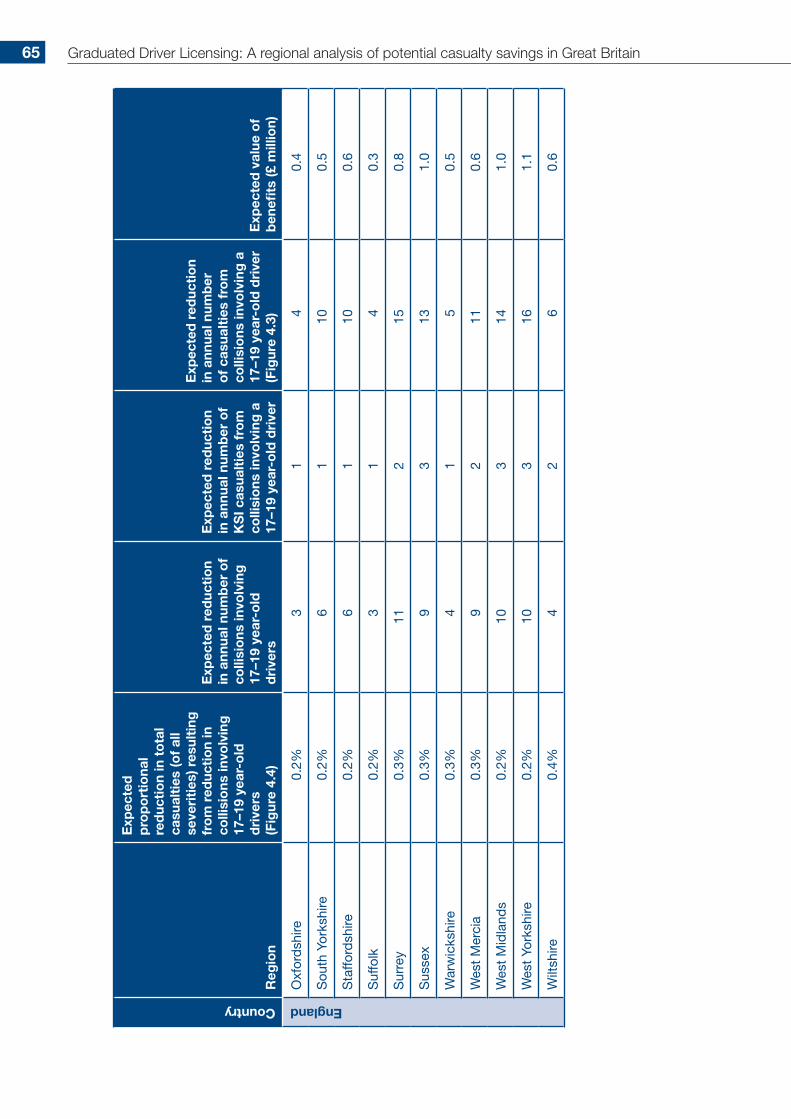
Country
Reg
ion
Exp
ecte
d
pro
po
rtio
nal
red
ucti
on
in t
ota
l ca
sual
ties
(of
all
seve
riti
es) r
esul
ting
fr
om
red
ucti
on
in
colli
sio
ns in
volv
ing
17
–19
year
-old
d
rive
rs(F
igur
e 4.
4)
Exp
ecte
d r
educ
tio
n in
ann
ual n
umb
er o
f co
llisi
ons
invo
lvin
g
17–1
9 ye
ar-o
ld
dri
vers
Exp
ecte
d r
educ
tio
n in
ann
ual n
umb
er o
f K
SI c
asua
ltie
s fr
om
co
llisi
ons
invo
lvin
g a
17
–19
year
-old
dri
ver
Exp
ecte
d r
educ
tio
n in
ann
ual n
umb
er
of
casu
alti
es f
rom
co
llisi
ons
invo
lvin
g a
17
–19
year
-old
dri
ver
(Fig
ure
4.3)
Exp
ecte
d v
alue
of
ben
efits
(£ m
illio
n)
England
Oxf
ord
shire
0.2%
31
40.
4
Sou
th Y
orks
hire
0.2%
61
100.
5
Sta
fford
shire
0.2%
61
100.
6
Suf
folk
0.2%
31
40.
3
Sur
rey
0.3%
112
150.
8
Sus
sex
0.3%
93
131.
0
War
wic
kshi
re0.
3%4
15
0.5
Wes
t M
erci
a0.
3%9
211
0.6
Wes
t M
idla
nds
0.2%
103
141.
0
Wes
t Yo
rksh
ire0.
2%10
316
1.1
Wilt
shire
0.4%
42
60.
6
Graduated Driver Licensing: A regional analysis of potential casualty savings in Great Britain65
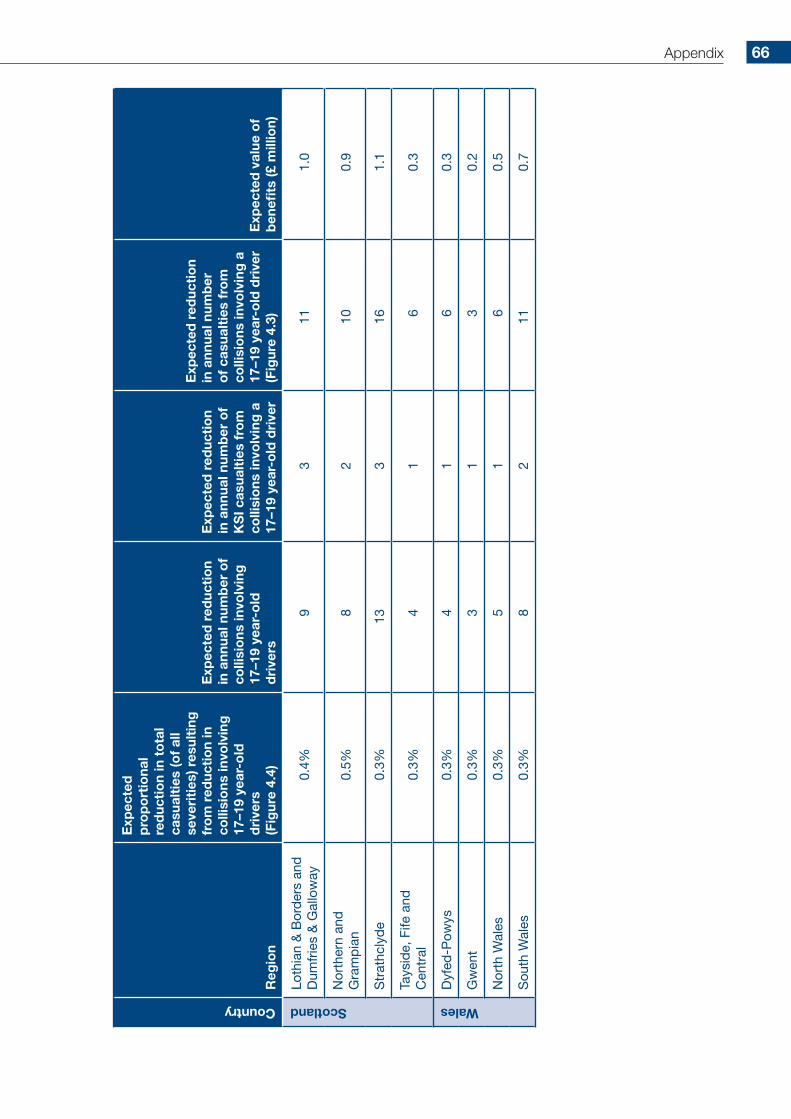
Country
Reg
ion
Exp
ecte
d
pro
po
rtio
nal
red
ucti
on
in t
ota
l ca
sual
ties
(of
all
seve
riti
es) r
esul
ting
fr
om
red
ucti
on
in
colli
sio
ns in
volv
ing
17
–19
year
-old
d
rive
rs(F
igur
e 4.
4)
Exp
ecte
d r
educ
tio
n in
ann
ual n
umb
er o
f co
llisi
ons
invo
lvin
g
17–1
9 ye
ar-o
ld
dri
vers
Exp
ecte
d r
educ
tio
n in
ann
ual n
umb
er o
f K
SI c
asua
ltie
s fr
om
co
llisi
ons
invo
lvin
g a
17
–19
year
-old
dri
ver
Exp
ecte
d r
educ
tio
n in
ann
ual n
umb
er
of
casu
alti
es f
rom
co
llisi
ons
invo
lvin
g a
17
–19
year
-old
dri
ver
(Fig
ure
4.3)
Exp
ecte
d v
alue
of
ben
efits
(£ m
illio
n)
Scotland
Loth
ian
& B
ord
ers
and
D
umfr
ies
& G
allo
way
0.4%
93
111.
0
Nor
ther
n an
d
Gra
mp
ian
0.5%
82
100.
9
Str
athc
lyd
e0.
3%13
316
1.1
Tays
ide,
Fife
and
C
entr
al0.
3%4
16
0.3
Wales
Dyf
ed-P
owys
0.3%
41
60.
3
Gw
ent
0.3%
31
30.
2
Nor
th W
ales
0.3%
51
60.
5
Sou
th W
ales
0.3%
82
110.
7
Appendix 66
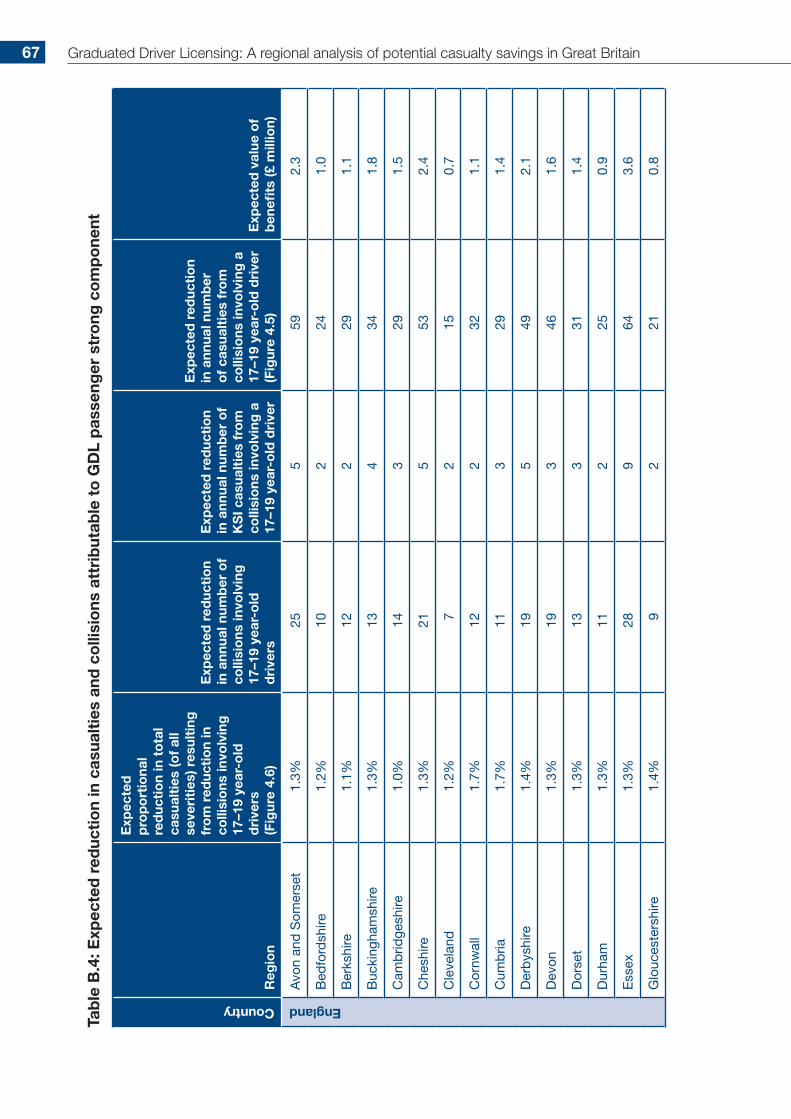
Tab
le B
.4: E
xpec
ted
red
ucti
on
in c
asua
ltie
s an
d c
olli
sio
ns a
ttri
but
able
to
GD
L p
asse
nger
str
ong
co
mp
one
ntCountry
Reg
ion
Exp
ecte
d
pro
po
rtio
nal
red
ucti
on
in t
ota
l ca
sual
ties
(of
all
seve
riti
es) r
esul
ting
fr
om
red
ucti
on
in
colli
sio
ns in
volv
ing
17
–19
year
-old
d
rive
rs
(Fig
ure
4.6)
Exp
ecte
d r
educ
tio
n in
ann
ual n
umb
er o
f co
llisi
ons
invo
lvin
g
17–1
9 ye
ar-o
ld
dri
vers
Exp
ecte
d r
educ
tio
n in
ann
ual n
umb
er o
f K
SI c
asua
ltie
s fr
om
co
llisi
ons
invo
lvin
g a
17
–19
year
-old
dri
ver
Exp
ecte
d r
educ
tio
n in
ann
ual n
umb
er
of
casu
alti
es f
rom
co
llisi
ons
invo
lvin
g a
17
–19
year
-old
dri
ver
(Fig
ure
4.5)
Exp
ecte
d v
alue
of
ben
efits
(£ m
illio
n)
England
Avo
n an
d S
omer
set
1.3%
255
592.
3
Bed
ford
shire
1.2%
102
241.
0
Ber
kshi
re1.
1%12
229
1.1
Buc
king
ham
shire
1.3%
134
341.
8
Cam
brid
gesh
ire1.
0%14
329
1.5
Che
shire
1.3%
215
532.
4
Cle
vela
nd1.
2%7
215
0.7
Cor
nwal
l1.
7%12
232
1.1
Cum
bria
1.7%
113
291.
4
Der
bys
hire
1.4%
195
492.
1
Dev
on1.
3%19
346
1.6
Dor
set
1.3%
133
311.
4
Dur
ham
1.3%
112
250.
9
Ess
ex1.
3%28
964
3.6
Glo
uces
ters
hire
1.4%
92
210.
8
Graduated Driver Licensing: A regional analysis of potential casualty savings in Great Britain67

Country
Reg
ion
Exp
ecte
d
pro
po
rtio
nal
red
ucti
on
in t
ota
l ca
sual
ties
(of
all
seve
riti
es) r
esul
ting
fr
om
red
ucti
on
in
colli
sio
ns in
volv
ing
17
–19
year
-old
d
rive
rs
(Fig
ure
4.6)
Exp
ecte
d r
educ
tio
n in
ann
ual n
umb
er o
f co
llisi
ons
invo
lvin
g
17–1
9 ye
ar-o
ld
dri
vers
Exp
ecte
d r
educ
tio
n in
ann
ual n
umb
er o
f K
SI c
asua
ltie
s fr
om
co
llisi
ons
invo
lvin
g a
17
–19
year
-old
dri
ver
Exp
ecte
d r
educ
tio
n in
ann
ual n
umb
er
of
casu
alti
es f
rom
co
llisi
ons
invo
lvin
g a
17
–19
year
-old
dri
ver
(Fig
ure
4.5)
Exp
ecte
d v
alue
of
ben
efits
(£ m
illio
n)
England
Gre
ater
Lon
don
0.4%
499
914.
0
Gre
ater
Man
ches
ter
0.9%
273
662.
0
Ham
psh
ire &
Is
le o
f Wig
ht1.
2%31
665
2.9
Her
tfor
dsh
ire1.
4%19
551
2.2
Hum
ber
sid
e1.
4%18
547
2.3
Ken
t1.
4%35
684
3.2
Lanc
ashi
re1.
4%30
982
4.1
Leic
este
rshi
re1.
0%15
331
1.4
Linc
olns
hire
1.6%
185
472.
4
Mer
seys
ide
1.0%
156
462.
4
Nor
folk
1.5%
145
352.
1
Nor
th Y
orks
hire
1.4%
167
392.
8
Nor
tham
pto
nshi
re1.
3%9
422
1.7
Nor
thum
bria
1.0%
214
441.
9
Not
tingh
amsh
ire0.
9%17
434
1.9
Appendix 68
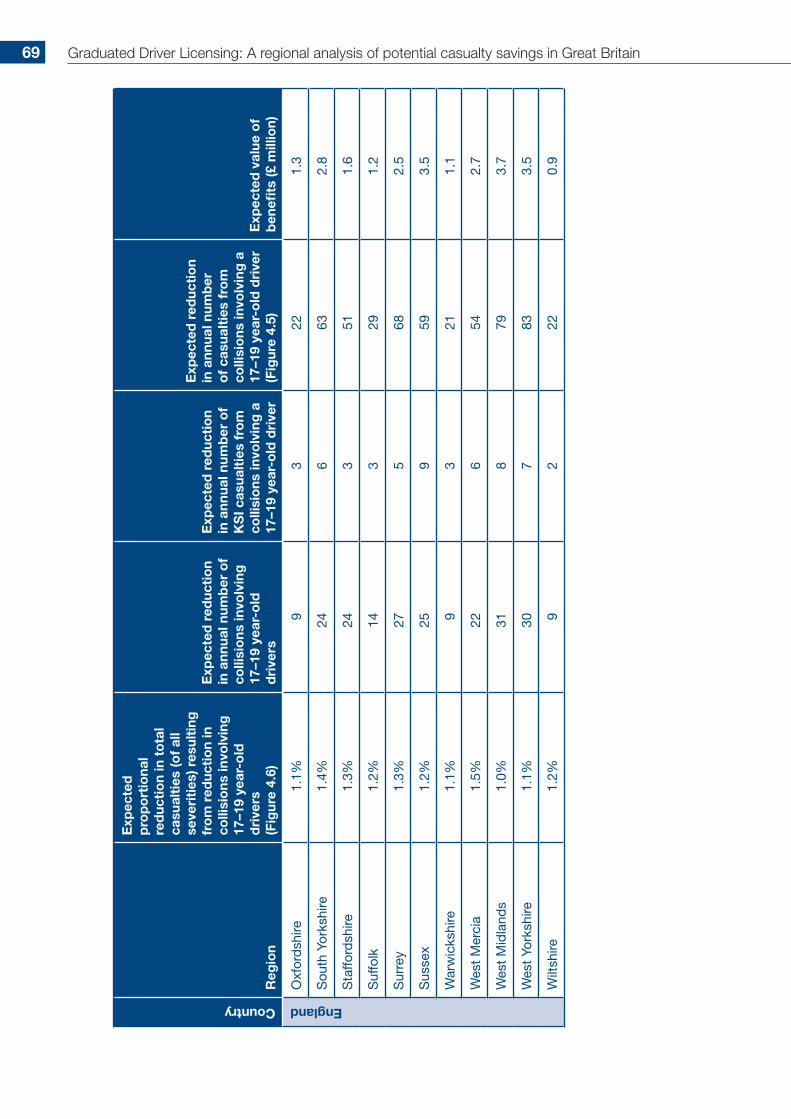
Country
Reg
ion
Exp
ecte
d
pro
po
rtio
nal
red
ucti
on
in t
ota
l ca
sual
ties
(of
all
seve
riti
es) r
esul
ting
fr
om
red
ucti
on
in
colli
sio
ns in
volv
ing
17
–19
year
-old
d
rive
rs
(Fig
ure
4.6)
Exp
ecte
d r
educ
tio
n in
ann
ual n
umb
er o
f co
llisi
ons
invo
lvin
g
17–1
9 ye
ar-o
ld
dri
vers
Exp
ecte
d r
educ
tio
n in
ann
ual n
umb
er o
f K
SI c
asua
ltie
s fr
om
co
llisi
ons
invo
lvin
g a
17
–19
year
-old
dri
ver
Exp
ecte
d r
educ
tio
n in
ann
ual n
umb
er
of
casu
alti
es f
rom
co
llisi
ons
invo
lvin
g a
17
–19
year
-old
dri
ver
(Fig
ure
4.5)
Exp
ecte
d v
alue
of
ben
efits
(£ m
illio
n)
England
Oxf
ord
shire
1.1%
93
221.
3
Sou
th Y
orks
hire
1.4%
246
632.
8
Sta
fford
shire
1.3%
243
511.
6
Suf
folk
1.2%
143
291.
2
Sur
rey
1.3%
275
682.
5
Sus
sex
1.2%
259
593.
5
War
wic
kshi
re1.
1%9
321
1.1
Wes
t M
erci
a1.
5%22
654
2.7
Wes
t M
idla
nds
1.0%
318
793.
7
Wes
t Yo
rksh
ire1.
1%30
783
3.5
Wilt
shire
1.2%
92
220.
9
Graduated Driver Licensing: A regional analysis of potential casualty savings in Great Britain69

Country
Reg
ion
Exp
ecte
d
pro
po
rtio
nal
red
ucti
on
in t
ota
l ca
sual
ties
(of
all
seve
riti
es) r
esul
ting
fr
om
red
ucti
on
in
colli
sio
ns in
volv
ing
17
–19
year
-old
d
rive
rs
(Fig
ure
4.6)
Exp
ecte
d r
educ
tio
n in
ann
ual n
umb
er o
f co
llisi
ons
invo
lvin
g
17–1
9 ye
ar-o
ld
dri
vers
Exp
ecte
d r
educ
tio
n in
ann
ual n
umb
er o
f K
SI c
asua
ltie
s fr
om
co
llisi
ons
invo
lvin
g a
17
–19
year
-old
dri
ver
Exp
ecte
d r
educ
tio
n in
ann
ual n
umb
er
of
casu
alti
es f
rom
co
llisi
ons
invo
lvin
g a
17
–19
year
-old
dri
ver
(Fig
ure
4.5)
Exp
ecte
d v
alue
of
ben
efits
(£ m
illio
n)
Scotland
Loth
ian
& B
ord
ers
and
D
umfr
ies
& G
allo
way
1.1%
135
301.
9
Nor
ther
n an
d
Gra
mp
ian
1.6%
147
332.
8
Str
athc
lyd
e1.
2%25
858
3.2
Tays
ide,
Fife
and
C
entr
al1.
3%13
529
2.0
Wales
Dyf
ed-P
owys
1.9%
155
372.
1
Gw
ent
1.9%
82
220.
9
Nor
th W
ales
1.9%
156
442.
5
Sou
th W
ales
1.7%
225
632.
3
Appendix 70
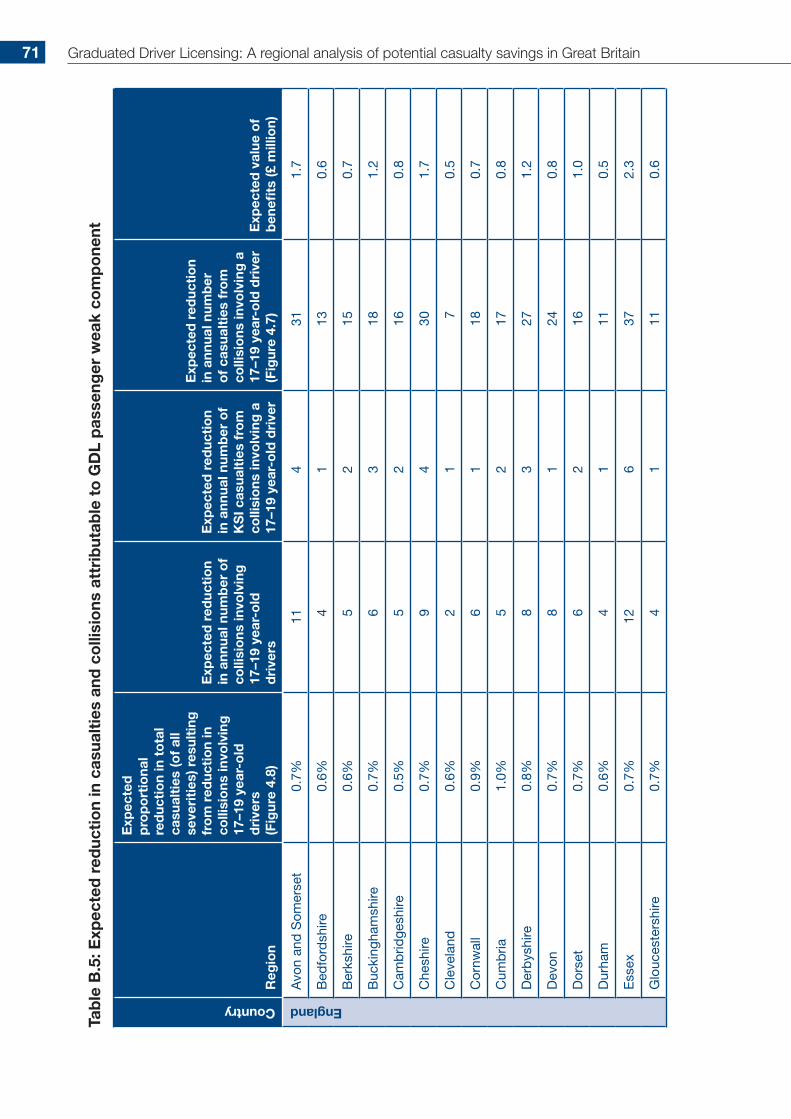
Tab
le B
.5: E
xpec
ted
red
ucti
on
in c
asua
ltie
s an
d c
olli
sio
ns a
ttri
but
able
to
GD
L p
asse
nger
wea
k co
mp
one
ntCountry
Reg
ion
Exp
ecte
d
pro
po
rtio
nal
red
ucti
on
in t
ota
l ca
sual
ties
(of
all
seve
riti
es) r
esul
ting
fr
om
red
ucti
on
in
colli
sio
ns in
volv
ing
17
–19
year
-old
d
rive
rs
(Fig
ure
4.8)
Exp
ecte
d r
educ
tio
n in
ann
ual n
umb
er o
f co
llisi
ons
invo
lvin
g
17–1
9 ye
ar-o
ld
dri
vers
Exp
ecte
d r
educ
tio
n in
ann
ual n
umb
er o
f K
SI c
asua
ltie
s fr
om
co
llisi
ons
invo
lvin
g a
17
–19
year
-old
dri
ver
Exp
ecte
d r
educ
tio
n in
ann
ual n
umb
er
of
casu
alti
es f
rom
co
llisi
ons
invo
lvin
g a
17
–19
year
-old
dri
ver
(Fig
ure
4.7)
Exp
ecte
d v
alue
of
ben
efits
(£ m
illio
n)
England
Avo
n an
d S
omer
set
0.7%
114
311.
7
Bed
ford
shire
0.6%
41
130.
6
Ber
kshi
re0.
6%5
215
0.7
Buc
king
ham
shire
0.7%
63
181.
2
Cam
brid
gesh
ire0.
5%5
216
0.8
Che
shire
0.7%
94
301.
7
Cle
vela
nd0.
6%2
17
0.5
Cor
nwal
l0.
9%6
118
0.7
Cum
bria
1.0%
52
170.
8
Der
bys
hire
0.8%
83
271.
2
Dev
on0.
7%8
124
0.8
Dor
set
0.7%
62
161.
0
Dur
ham
0.6%
41
110.
5
Ess
ex0.
7%12
637
2.3
Glo
uces
ters
hire
0.7%
41
110.
6
Graduated Driver Licensing: A regional analysis of potential casualty savings in Great Britain71
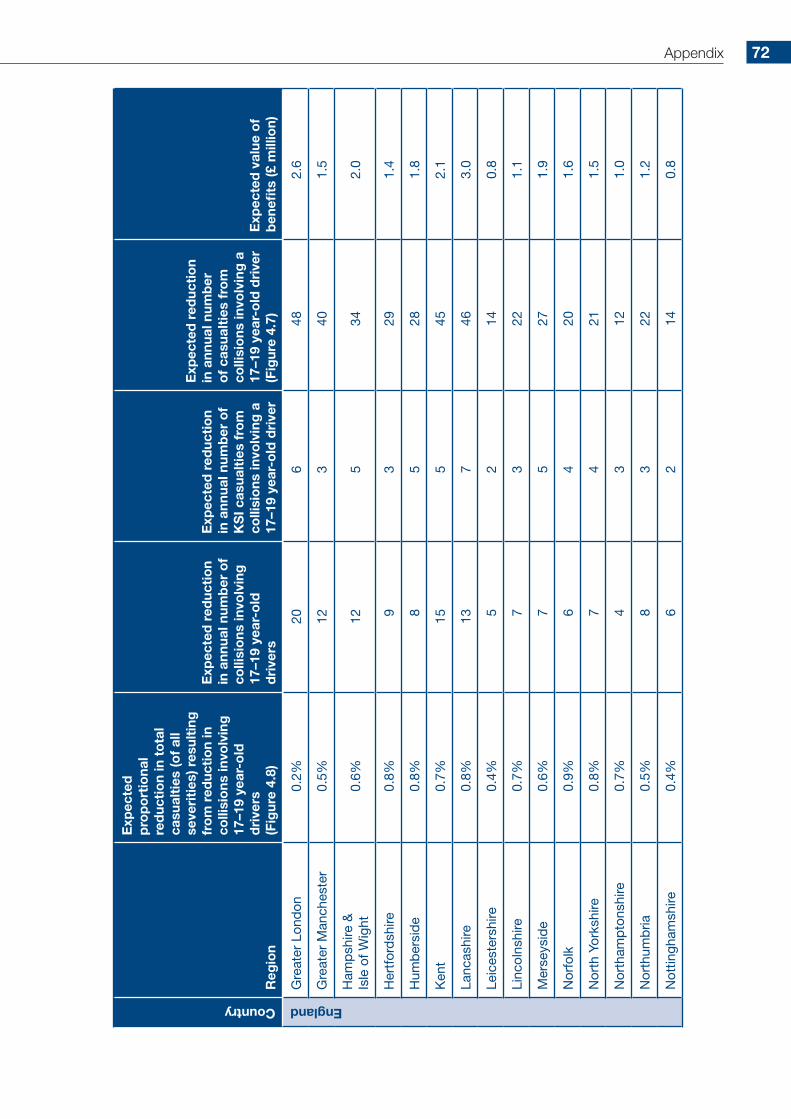
Country
Reg
ion
Exp
ecte
d
pro
po
rtio
nal
red
ucti
on
in t
ota
l ca
sual
ties
(of
all
seve
riti
es) r
esul
ting
fr
om
red
ucti
on
in
colli
sio
ns in
volv
ing
17
–19
year
-old
d
rive
rs
(Fig
ure
4.8)
Exp
ecte
d r
educ
tio
n in
ann
ual n
umb
er o
f co
llisi
ons
invo
lvin
g
17–1
9 ye
ar-o
ld
dri
vers
Exp
ecte
d r
educ
tio
n in
ann
ual n
umb
er o
f K
SI c
asua
ltie
s fr
om
co
llisi
ons
invo
lvin
g a
17
–19
year
-old
dri
ver
Exp
ecte
d r
educ
tio
n in
ann
ual n
umb
er
of
casu
alti
es f
rom
co
llisi
ons
invo
lvin
g a
17
–19
year
-old
dri
ver
(Fig
ure
4.7)
Exp
ecte
d v
alue
of
ben
efits
(£ m
illio
n)
England
Gre
ater
Lon
don
0.2%
206
482.
6
Gre
ater
Man
ches
ter
0.5%
123
401.
5
Ham
psh
ire &
Is
le o
f Wig
ht0.
6%12
534
2.0
Her
tfor
dsh
ire0.
8%9
329
1.4
Hum
ber
sid
e0.
8%8
528
1.8
Ken
t0.
7%15
545
2.1
Lanc
ashi
re0.
8%13
746
3.0
Leic
este
rshi
re0.
4%5
214
0.8
Linc
olns
hire
0.7%
73
221.
1
Mer
seys
ide
0.6%
75
271.
9
Nor
folk
0.9%
64
201.
6
Nor
th Y
orks
hire
0.8%
74
211.
5
Nor
tham
pto
nshi
re0.
7%4
312
1.0
Nor
thum
bria
0.5%
83
221.
2
Not
tingh
amsh
ire0.
4%6
214
0.8
Appendix 72
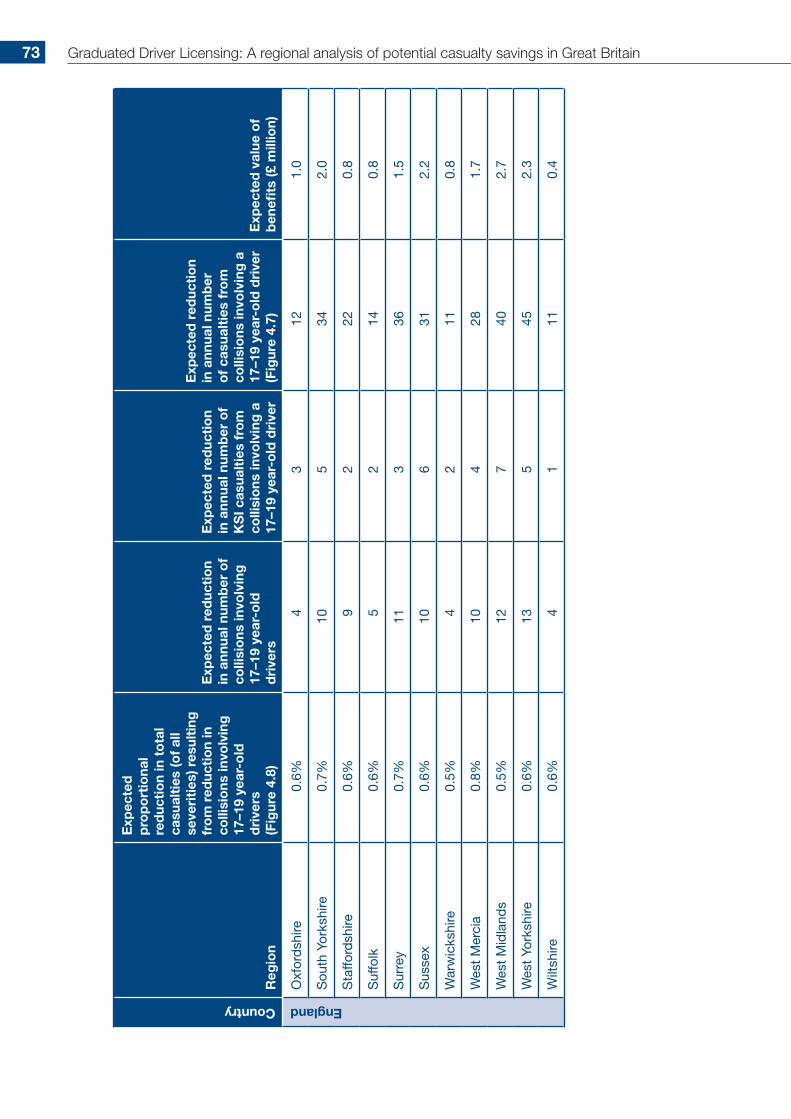
Country
Reg
ion
Exp
ecte
d
pro
po
rtio
nal
red
ucti
on
in t
ota
l ca
sual
ties
(of
all
seve
riti
es) r
esul
ting
fr
om
red
ucti
on
in
colli
sio
ns in
volv
ing
17
–19
year
-old
d
rive
rs
(Fig
ure
4.8)
Exp
ecte
d r
educ
tio
n in
ann
ual n
umb
er o
f co
llisi
ons
invo
lvin
g
17–1
9 ye
ar-o
ld
dri
vers
Exp
ecte
d r
educ
tio
n in
ann
ual n
umb
er o
f K
SI c
asua
ltie
s fr
om
co
llisi
ons
invo
lvin
g a
17
–19
year
-old
dri
ver
Exp
ecte
d r
educ
tio
n in
ann
ual n
umb
er
of
casu
alti
es f
rom
co
llisi
ons
invo
lvin
g a
17
–19
year
-old
dri
ver
(Fig
ure
4.7)
Exp
ecte
d v
alue
of
ben
efits
(£ m
illio
n)
England
Oxf
ord
shire
0.6%
43
121.
0
Sou
th Y
orks
hire
0.7%
105
342.
0
Sta
fford
shire
0.6%
92
220.
8
Suf
folk
0.6%
52
140.
8
Sur
rey
0.7%
113
361.
5
Sus
sex
0.6%
106
312.
2
War
wic
kshi
re0.
5%4
211
0.8
Wes
t M
erci
a0.
8%10
428
1.7
Wes
t M
idla
nds
0.5%
127
402.
7
Wes
t Yo
rksh
ire0.
6%13
545
2.3
Wilt
shire
0.6%
41
110.
4
Graduated Driver Licensing: A regional analysis of potential casualty savings in Great Britain73

Country
Reg
ion
Exp
ecte
d
pro
po
rtio
nal
red
ucti
on
in t
ota
l ca
sual
ties
(of
all
seve
riti
es) r
esul
ting
fr
om
red
ucti
on
in
colli
sio
ns in
volv
ing
17
–19
year
-old
d
rive
rs
(Fig
ure
4.8)
Exp
ecte
d r
educ
tio
n in
ann
ual n
umb
er o
f co
llisi
ons
invo
lvin
g
17–1
9 ye
ar-o
ld
dri
vers
Exp
ecte
d r
educ
tio
n in
ann
ual n
umb
er o
f K
SI c
asua
ltie
s fr
om
co
llisi
ons
invo
lvin
g a
17
–19
year
-old
dri
ver
Exp
ecte
d r
educ
tio
n in
ann
ual n
umb
er
of
casu
alti
es f
rom
co
llisi
ons
invo
lvin
g a
17
–19
year
-old
dri
ver
(Fig
ure
4.7)
Exp
ecte
d v
alue
of
ben
efits
(£ m
illio
n)
Scotland
Loth
ian
& B
ord
ers
and
D
umfr
ies
& G
allo
way
0.6%
63
161.
2
Nor
ther
n an
d
Gra
mp
ian
0.9%
65
181.
8
Str
athc
lyd
e0.
6%11
532
2.1
Tays
ide,
Fife
and
C
entr
al0.
7%6
216
0.9
Wales
Dyf
ed-P
owys
0.9%
63
181.
2
Gw
ent
1.1%
42
120.
7
Nor
th W
ales
1.1%
74
251.
6
Sou
th W
ales
0.9%
104
331.
6
Appendix 74

Tab
le B
.6: E
xpec
ted
red
ucti
on
in c
asua
ltie
s an
d c
olli
sio
ns a
ttri
but
able
to
GD
L co
mb
ined
nig
ht-t
ime
and
pas
seng
er s
tro
ng
com
po
nent
sCountry
Reg
ion
Exp
ecte
d
pro
po
rtio
nal
red
ucti
on
in t
ota
l ca
sual
ties
(of
all
seve
riti
es) r
esul
ting
fr
om
red
ucti
on
in
colli
sio
ns in
volv
ing
17
–19
year
-old
d
rive
rs
Exp
ecte
d r
educ
tio
n in
ann
ual n
umb
er o
f co
llisi
ons
invo
lvin
g
17–1
9 ye
ar-o
ld
dri
vers
Exp
ecte
d r
educ
tio
n in
ann
ual n
umb
er o
f K
SI c
asua
ltie
s fr
om
co
llisi
ons
invo
lvin
g a
17
–19
year
-old
dri
ver
Exp
ecte
d r
educ
tio
n in
ann
ual n
umb
er
of
casu
alti
es f
rom
co
llisi
ons
invo
lvin
g a
17
–19
year
-old
dri
ver
Exp
ecte
d v
alue
of
ben
efits
(£ m
illio
n)
England
Avo
n an
d S
omer
set
1.8%
448
853.
7
Bed
ford
shire
1.8%
183
361.
6
Ber
kshi
re1.
7%23
443
1.7
Buc
king
ham
shire
1.8%
246
492.
6
Cam
brid
gesh
ire1.
5%24
544
2.3
Che
shire
1.8%
348
723.
5
Cle
vela
nd1.
7%10
221
1.0
Cor
nwal
l2.
3%22
445
1.8
Cum
bria
2.4%
204
401.
8
Der
bys
hire
2.0%
347
713.
3
Dev
on1.
9%36
568
2.6
Dor
set
1.9%
235
442.
3
Dur
ham
1.9%
183
361.
5
Ess
ex1.
9%49
1495
5.7
Glo
uces
ters
hire
2.0%
163
311.
2
Graduated Driver Licensing: A regional analysis of potential casualty savings in Great Britain75
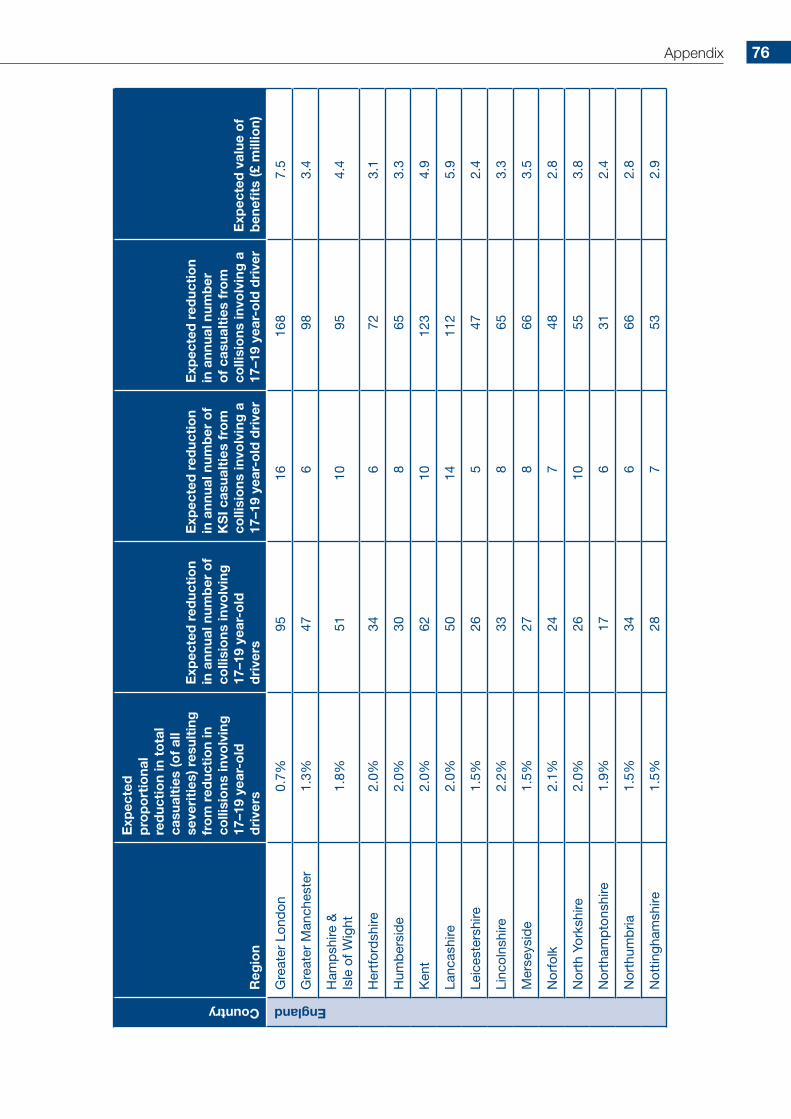
Country
Reg
ion
Exp
ecte
d
pro
po
rtio
nal
red
ucti
on
in t
ota
l ca
sual
ties
(of
all
seve
riti
es) r
esul
ting
fr
om
red
ucti
on
in
colli
sio
ns in
volv
ing
17
–19
year
-old
d
rive
rs
Exp
ecte
d r
educ
tio
n in
ann
ual n
umb
er o
f co
llisi
ons
invo
lvin
g
17–1
9 ye
ar-o
ld
dri
vers
Exp
ecte
d r
educ
tio
n in
ann
ual n
umb
er o
f K
SI c
asua
ltie
s fr
om
co
llisi
ons
invo
lvin
g a
17
–19
year
-old
dri
ver
Exp
ecte
d r
educ
tio
n in
ann
ual n
umb
er
of
casu
alti
es f
rom
co
llisi
ons
invo
lvin
g a
17
–19
year
-old
dri
ver
Exp
ecte
d v
alue
of
ben
efits
(£ m
illio
n)
England
Gre
ater
Lon
don
0.7%
9516
168
7.5
Gre
ater
Man
ches
ter
1.3%
476
983.
4
Ham
psh
ire &
Is
le o
f Wig
ht1.
8%51
1095
4.4
Her
tfor
dsh
ire2.
0%34
672
3.1
Hum
ber
sid
e2.
0%30
865
3.3
Ken
t2.
0%62
1012
34.
9
Lanc
ashi
re2.
0%50
1411
25.
9
Leic
este
rshi
re1.
5%26
547
2.4
Linc
olns
hire
2.2%
338
653.
3
Mer
seys
ide
1.5%
278
663.
5
Nor
folk
2.1%
247
482.
8
Nor
th Y
orks
hire
2.0%
2610
553.
8
Nor
tham
pto
nshi
re1.
9%17
631
2.4
Nor
thum
bria
1.5%
346
662.
8
Not
tingh
amsh
ire1.
5%28
753
2.9
Appendix 76
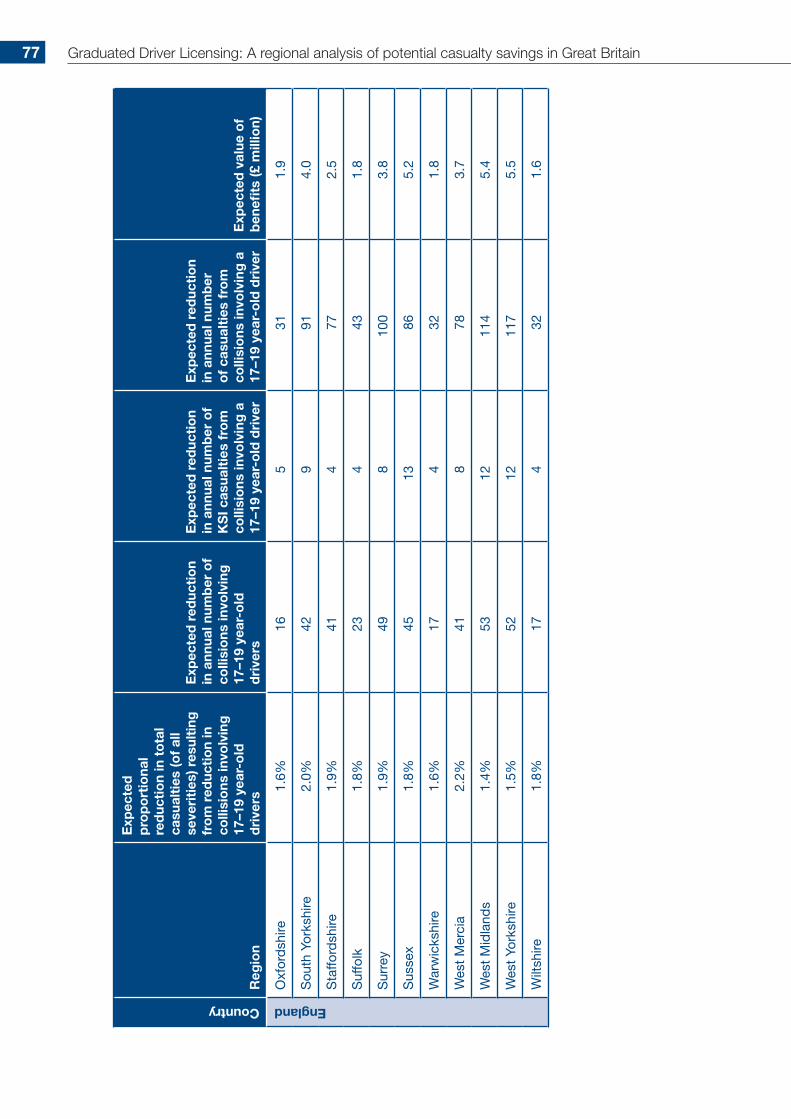
Country
Reg
ion
Exp
ecte
d
pro
po
rtio
nal
red
ucti
on
in t
ota
l ca
sual
ties
(of
all
seve
riti
es) r
esul
ting
fr
om
red
ucti
on
in
colli
sio
ns in
volv
ing
17
–19
year
-old
d
rive
rs
Exp
ecte
d r
educ
tio
n in
ann
ual n
umb
er o
f co
llisi
ons
invo
lvin
g
17–1
9 ye
ar-o
ld
dri
vers
Exp
ecte
d r
educ
tio
n in
ann
ual n
umb
er o
f K
SI c
asua
ltie
s fr
om
co
llisi
ons
invo
lvin
g a
17
–19
year
-old
dri
ver
Exp
ecte
d r
educ
tio
n in
ann
ual n
umb
er
of
casu
alti
es f
rom
co
llisi
ons
invo
lvin
g a
17
–19
year
-old
dri
ver
Exp
ecte
d v
alue
of
ben
efits
(£ m
illio
n)
England
Oxf
ord
shire
1.6%
165
311.
9
Sou
th Y
orks
hire
2.0%
429
914.
0
Sta
fford
shire
1.9%
414
772.
5
Suf
folk
1.8%
234
431.
8
Sur
rey
1.9%
498
100
3.8
Sus
sex
1.8%
4513
865.
2
War
wic
kshi
re1.
6%17
432
1.8
Wes
t M
erci
a2.
2%41
878
3.7
Wes
t M
idla
nds
1.4%
5312
114
5.4
Wes
t Yo
rksh
ire1.
5%52
1211
75.
5
Wilt
shire
1.8%
174
321.
6
Graduated Driver Licensing: A regional analysis of potential casualty savings in Great Britain77
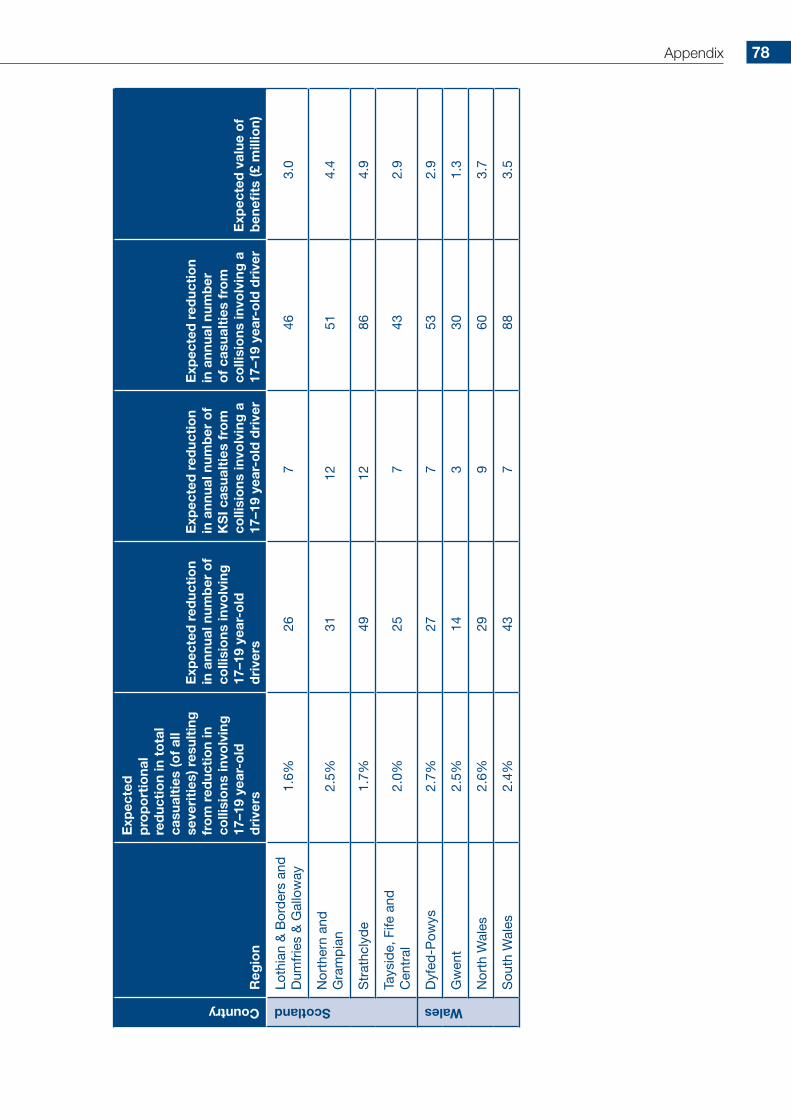
Country
Reg
ion
Exp
ecte
d
pro
po
rtio
nal
red
ucti
on
in t
ota
l ca
sual
ties
(of
all
seve
riti
es) r
esul
ting
fr
om
red
ucti
on
in
colli
sio
ns in
volv
ing
17
–19
year
-old
d
rive
rs
Exp
ecte
d r
educ
tio
n in
ann
ual n
umb
er o
f co
llisi
ons
invo
lvin
g
17–1
9 ye
ar-o
ld
dri
vers
Exp
ecte
d r
educ
tio
n in
ann
ual n
umb
er o
f K
SI c
asua
ltie
s fr
om
co
llisi
ons
invo
lvin
g a
17
–19
year
-old
dri
ver
Exp
ecte
d r
educ
tio
n in
ann
ual n
umb
er
of
casu
alti
es f
rom
co
llisi
ons
invo
lvin
g a
17
–19
year
-old
dri
ver
Exp
ecte
d v
alue
of
ben
efits
(£ m
illio
n)
Scotland
Loth
ian
& B
ord
ers
and
D
umfr
ies
& G
allo
way
1.6%
267
463.
0
Nor
ther
n an
d
Gra
mp
ian
2.5%
3112
514.
4
Str
athc
lyd
e1.
7%49
1286
4.9
Tays
ide,
Fife
and
C
entr
al2.
0%25
743
2.9
Wales
Dyf
ed-P
owys
2.7%
277
532.
9
Gw
ent
2.5%
143
301.
3
Nor
th W
ales
2.6%
299
603.
7
Sou
th W
ales
2.4%
437
883.
5
Appendix 78
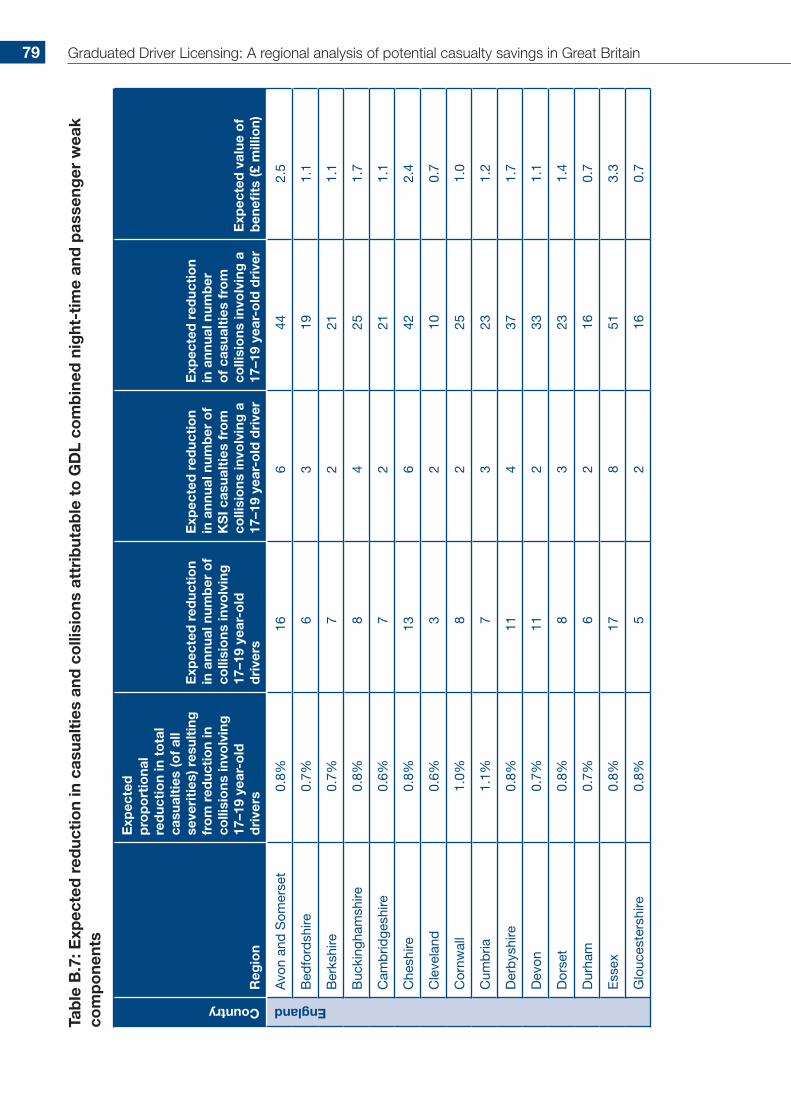
Tab
le B
.7: E
xpec
ted
red
ucti
on
in c
asua
ltie
s an
d c
olli
sio
ns a
ttri
but
able
to
GD
L co
mb
ined
nig
ht-t
ime
and
pas
seng
er w
eak
com
po
nent
sCountry
Reg
ion
Exp
ecte
d
pro
po
rtio
nal
red
ucti
on
in t
ota
l ca
sual
ties
(of
all
seve
riti
es) r
esul
ting
fr
om
red
ucti
on
in
colli
sio
ns in
volv
ing
17
–19
year
-old
d
rive
rs
Exp
ecte
d r
educ
tio
n in
ann
ual n
umb
er o
f co
llisi
ons
invo
lvin
g
17–1
9 ye
ar-o
ld
dri
vers
Exp
ecte
d r
educ
tio
n in
ann
ual n
umb
er o
f K
SI c
asua
ltie
s fr
om
co
llisi
ons
invo
lvin
g a
17
–19
year
-old
dri
ver
Exp
ecte
d r
educ
tio
n in
ann
ual n
umb
er
of
casu
alti
es f
rom
co
llisi
ons
invo
lvin
g a
17
–19
year
-old
dri
ver
Exp
ecte
d v
alue
of
ben
efits
(£ m
illio
n)
England
Avo
n an
d S
omer
set
0.8%
166
442.
5
Bed
ford
shire
0.7%
63
191.
1
Ber
kshi
re0.
7%7
221
1.1
Buc
king
ham
shire
0.8%
84
251.
7
Cam
brid
gesh
ire0.
6%7
221
1.1
Che
shire
0.8%
136
422.
4
Cle
vela
nd0.
6%3
210
0.7
Cor
nwal
l1.
0%8
225
1.0
Cum
bria
1.1%
73
231.
2
Der
bys
hire
0.8%
114
371.
7
Dev
on0.
7%11
233
1.1
Dor
set
0.8%
83
231.
4
Dur
ham
0.7%
62
160.
7
Ess
ex0.
8%17
851
3.3
Glo
uces
ters
hire
0.8%
52
160.
7
Graduated Driver Licensing: A regional analysis of potential casualty savings in Great Britain79

Country
Reg
ion
Exp
ecte
d
pro
po
rtio
nal
red
ucti
on
in t
ota
l ca
sual
ties
(of
all
seve
riti
es) r
esul
ting
fr
om
red
ucti
on
in
colli
sio
ns in
volv
ing
17
–19
year
-old
d
rive
rs
Exp
ecte
d r
educ
tio
n in
ann
ual n
umb
er o
f co
llisi
ons
invo
lvin
g
17–1
9 ye
ar-o
ld
dri
vers
Exp
ecte
d r
educ
tio
n in
ann
ual n
umb
er o
f K
SI c
asua
ltie
s fr
om
co
llisi
ons
invo
lvin
g a
17
–19
year
-old
dri
ver
Exp
ecte
d r
educ
tio
n in
ann
ual n
umb
er
of
casu
alti
es f
rom
co
llisi
ons
invo
lvin
g a
17
–19
year
-old
dri
ver
Exp
ecte
d v
alue
of
ben
efits
(£ m
illio
n)
England
Gre
ater
Lon
don
0.3%
3211
824.
7
Gre
ater
Man
ches
ter
0.6%
185
552.
2
Ham
psh
ire &
Is
le o
f Wig
ht0.
7%16
748
2.9
Her
tfor
dsh
ire0.
9%13
440
1.9
Hum
ber
sid
e0.
9%11
636
2.3
Ken
t0.
8%21
663
2.8
Lanc
ashi
re0.
8%17
1060
4.0
Leic
este
rshi
re0.
5%8
321
1.3
Linc
olns
hire
0.8%
104
311.
8
Mer
seys
ide
0.7%
106
382.
6
Nor
folk
0.9%
95
272.
0
Nor
th Y
orks
hire
0.8%
95
281.
9
Nor
tham
pto
nshi
re0.
8%6
417
1.5
Nor
thum
bria
0.6%
113
321.
5
Not
tingh
amsh
ire0.
5%9
323
1.4
Appendix 80

Country
Reg
ion
Exp
ecte
d
pro
po
rtio
nal
red
ucti
on
in t
ota
l ca
sual
ties
(of
all
seve
riti
es) r
esul
ting
fr
om
red
ucti
on
in
colli
sio
ns in
volv
ing
17
–19
year
-old
d
rive
rs
Exp
ecte
d r
educ
tio
n in
ann
ual n
umb
er o
f co
llisi
ons
invo
lvin
g
17–1
9 ye
ar-o
ld
dri
vers
Exp
ecte
d r
educ
tio
n in
ann
ual n
umb
er o
f K
SI c
asua
ltie
s fr
om
co
llisi
ons
invo
lvin
g a
17
–19
year
-old
dri
ver
Exp
ecte
d r
educ
tio
n in
ann
ual n
umb
er
of
casu
alti
es f
rom
co
llisi
ons
invo
lvin
g a
17
–19
year
-old
dri
ver
Exp
ecte
d v
alue
of
ben
efits
(£ m
illio
n)
England
Oxf
ord
shire
0.6%
53
161.
2
Sou
th Y
orks
hire
0.8%
146
472.
7
Sta
fford
shire
0.7%
123
331.
3
Suf
folk
0.7%
73
201.
2
Sur
rey
0.8%
175
502.
2
Sus
sex
0.7%
158
443.
1
War
wic
kshi
re0.
6%6
316
1.2
Wes
t M
erci
a0.
9%14
539
2.2
Wes
t M
idla
nds
0.6%
179
553.
5
Wes
t Yo
rksh
ire0.
6%18
961
3.6
Wilt
shire
0.8%
62
170.
9
Graduated Driver Licensing: A regional analysis of potential casualty savings in Great Britain81

Country
Reg
ion
Exp
ecte
d
pro
po
rtio
nal
red
ucti
on
in t
ota
l ca
sual
ties
(of
all
seve
riti
es) r
esul
ting
fr
om
red
ucti
on
in
colli
sio
ns in
volv
ing
17
–19
year
-old
d
rive
rs
Exp
ecte
d r
educ
tio
n in
ann
ual n
umb
er o
f co
llisi
ons
invo
lvin
g
17–1
9 ye
ar-o
ld
dri
vers
Exp
ecte
d r
educ
tio
n in
ann
ual n
umb
er o
f K
SI c
asua
ltie
s fr
om
co
llisi
ons
invo
lvin
g a
17
–19
year
-old
dri
ver
Exp
ecte
d r
educ
tio
n in
ann
ual n
umb
er
of
casu
alti
es f
rom
co
llisi
ons
invo
lvin
g a
17
–19
year
-old
dri
ver
Exp
ecte
d v
alue
of
ben
efits
(£ m
illio
n)
Scotland
Loth
ian
& B
ord
ers
and
D
umfr
ies
& G
allo
way
0.8%
115
262.
0
Nor
ther
n an
d
Gra
mp
ian
1.1%
117
282.
7
Str
athc
lyd
e0.
8%18
847
3.2
Tays
ide,
Fife
and
C
entr
al0.
8%8
322
1.2
Wales
Dyf
ed-P
owys
1.0%
94
251.
6
Gw
ent
1.1%
52
160.
9
Nor
th W
ales
1.2%
106
332.
3
Sou
th W
ales
1.0%
155
472.
4
Appendix 82
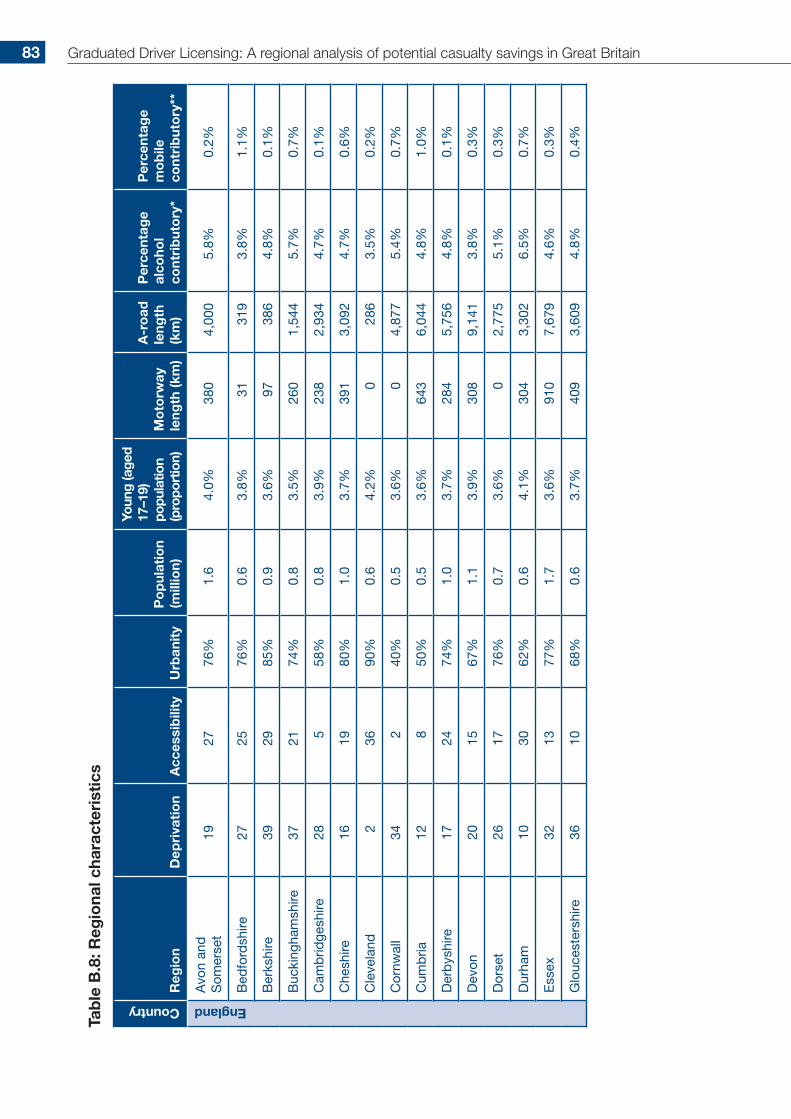
Tab
le B
.8: R
egio
nal c
hara
cter
isti
csCountry
Reg
ion
Dep
riva
tio
nA
cces
sib
ility
Urb
anit
yP
op
ulat
ion
(mill
ion)
Youn
g (a
ged
17
–19)
po
pula
tion
(pro
port
ion)
Mo
torw
ay
leng
th (k
m)
A-r
oad
le
ngth
(k
m)
Per
cent
age
alco
hol
cont
rib
uto
ry*
Per
cent
age
mo
bile
co
ntri
but
ory
**
England
Avo
n an
d
Som
erse
t19
2776
%1.
64.
0%38
04,
000
5.8%
0.2%
Bed
ford
shire
2725
76%
0.6
3.8%
3131
93.
8%1.
1%
Ber
kshi
re39
2985
%0.
93.
6%97
386
4.8%
0.1%
Buc
king
ham
shire
3721
74%
0.8
3.5%
260
1,54
45.
7%0.
7%
Cam
brid
gesh
ire28
558
%0.
83.
9%23
82,
934
4.7%
0.1%
Che
shire
1619
80%
1.0
3.7%
391
3,09
24.
7%0.
6%
Cle
vela
nd2
3690
%0.
64.
2%0
286
3.5%
0.2%
Cor
nwal
l34
240
%0.
53.
6%0
4,87
75.
4%0.
7%
Cum
bria
128
50%
0.5
3.6%
643
6,04
44.
8%1.
0%
Der
bys
hire
1724
74%
1.0
3.7%
284
5,75
64.
8%0.
1%
Dev
on20
1567
%1.
13.
9%30
89,
141
3.8%
0.3%
Dor
set
2617
76%
0.7
3.6%
02,
775
5.1%
0.3%
Dur
ham
1030
62%
0.6
4.1%
304
3,30
26.
5%0.
7%
Ess
ex32
1377
%1.
73.
6%91
07,
679
4.6%
0.3%
Glo
uces
ters
hire
3610
68%
0.6
3.7%
409
3,60
94.
8%0.
4%
Graduated Driver Licensing: A regional analysis of potential casualty savings in Great Britain83
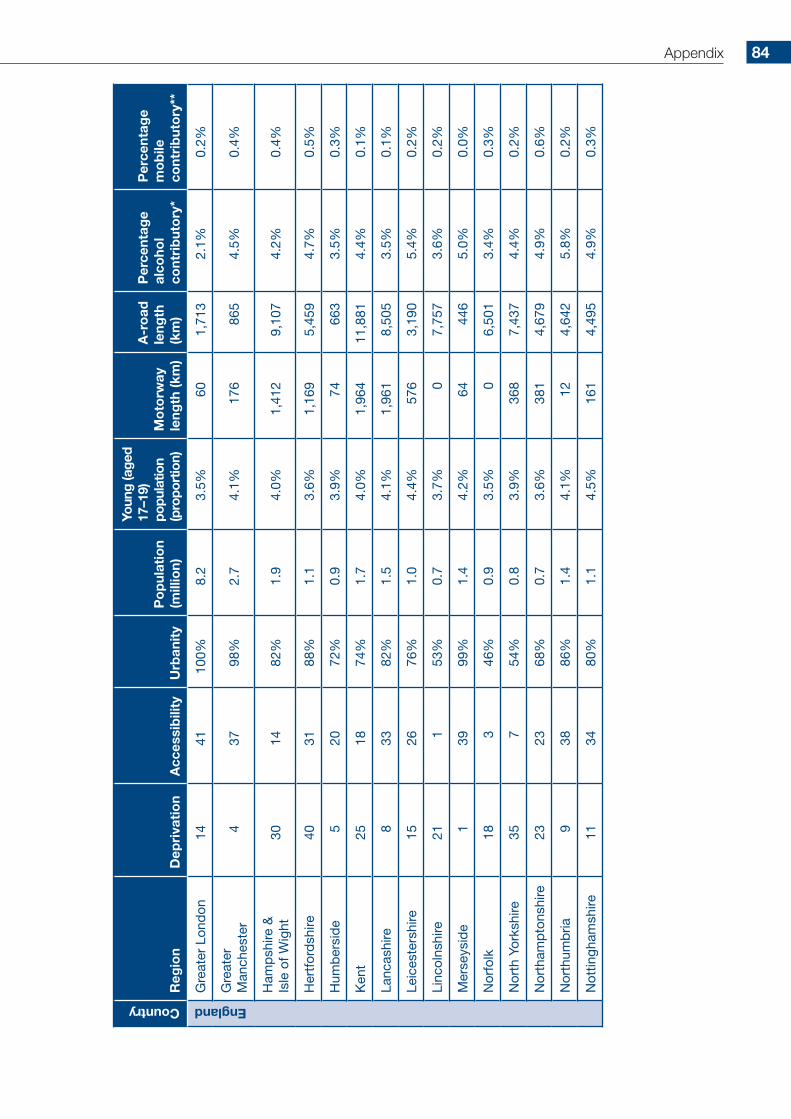
Country
Reg
ion
Dep
riva
tio
nA
cces
sib
ility
Urb
anit
yP
op
ulat
ion
(mill
ion)
Youn
g (a
ged
17
–19)
po
pula
tion
(pro
port
ion)
Mo
torw
ay
leng
th (k
m)
A-r
oad
le
ngth
(k
m)
Per
cent
age
alco
hol
cont
rib
uto
ry*
Per
cent
age
mo
bile
co
ntri
but
ory
**
England
Gre
ater
Lon
don
1441
100%
8.2
3.5%
601,
713
2.1%
0.2%
Gre
ater
M
anch
este
r4
3798
%2.
74.
1%17
686
54.
5%0.
4%
Ham
psh
ire &
Is
le o
f Wig
ht30
1482
%1.
94.
0%1,
412
9,10
74.
2%0.
4%
Her
tfor
dsh
ire40
3188
%1.
13.
6%1,
169
5,45
94.
7%0.
5%
Hum
ber
sid
e5
2072
%0.
93.
9%74
663
3.5%
0.3%
Ken
t25
1874
%1.
74.
0%1,
964
11,8
814.
4%0.
1%
Lanc
ashi
re8
3382
%1.
54.
1%1,
961
8,50
53.
5%0.
1%
Leic
este
rshi
re15
2676
%1.
04.
4%57
63,
190
5.4%
0.2%
Linc
olns
hire
211
53%
0.7
3.7%
07,
757
3.6%
0.2%
Mer
seys
ide
139
99%
1.4
4.2%
6444
65.
0%0.
0%
Nor
folk
183
46%
0.9
3.5%
06,
501
3.4%
0.3%
Nor
th Y
orks
hire
357
54%
0.8
3.9%
368
7,43
74.
4%0.
2%
Nor
tham
pto
nshi
re23
2368
%0.
73.
6%38
14,
679
4.9%
0.6%
Nor
thum
bria
938
86%
1.4
4.1%
124,
642
5.8%
0.2%
Not
tingh
amsh
ire11
3480
%1.
14.
5%16
14,
495
4.9%
0.3%
Appendix 84
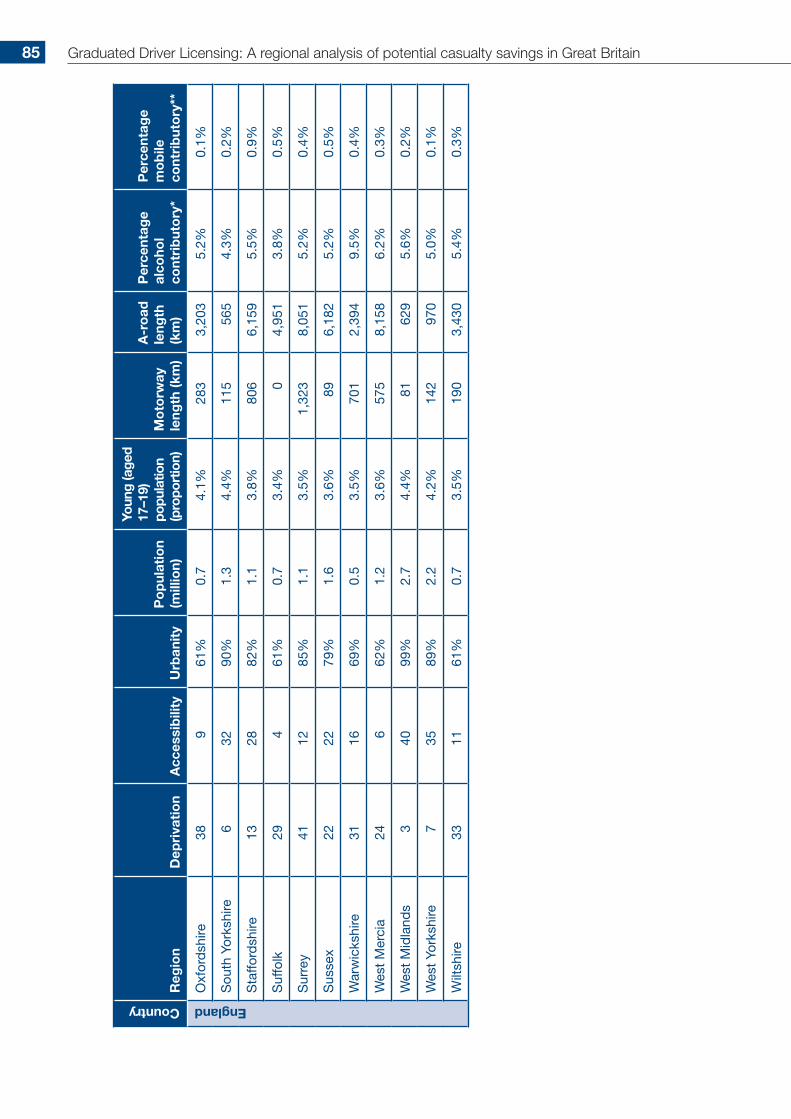
Country
Reg
ion
Dep
riva
tio
nA
cces
sib
ility
Urb
anit
yP
op
ulat
ion
(mill
ion)
Youn
g (a
ged
17
–19)
po
pula
tion
(pro
port
ion)
Mo
torw
ay
leng
th (k
m)
A-r
oad
le
ngth
(k
m)
Per
cent
age
alco
hol
cont
rib
uto
ry*
Per
cent
age
mo
bile
co
ntri
but
ory
**
England
Oxf
ord
shire
389
61%
0.7
4.1%
283
3,20
35.
2%0.
1%
Sou
th Y
orks
hire
632
90%
1.3
4.4%
115
565
4.3%
0.2%
Sta
fford
shire
1328
82%
1.1
3.8%
806
6,15
95.
5%0.
9%
Suf
folk
294
61%
0.7
3.4%
04,
951
3.8%
0.5%
Sur
rey
4112
85%
1.1
3.5%
1,32
38,
051
5.2%
0.4%
Sus
sex
2222
79%
1.6
3.6%
896,
182
5.2%
0.5%
War
wic
kshi
re31
1669
%0.
53.
5%70
12,
394
9.5%
0.4%
Wes
t M
erci
a24
662
%1.
23.
6%57
58,
158
6.2%
0.3%
Wes
t M
idla
nds
340
99%
2.7
4.4%
8162
95.
6%0.
2%
Wes
t Yo
rksh
ire7
3589
%2.
24.
2%14
297
05.
0%0.
1%
Wilt
shire
3311
61%
0.7
3.5%
190
3,43
05.
4%0.
3%
Graduated Driver Licensing: A regional analysis of potential casualty savings in Great Britain85
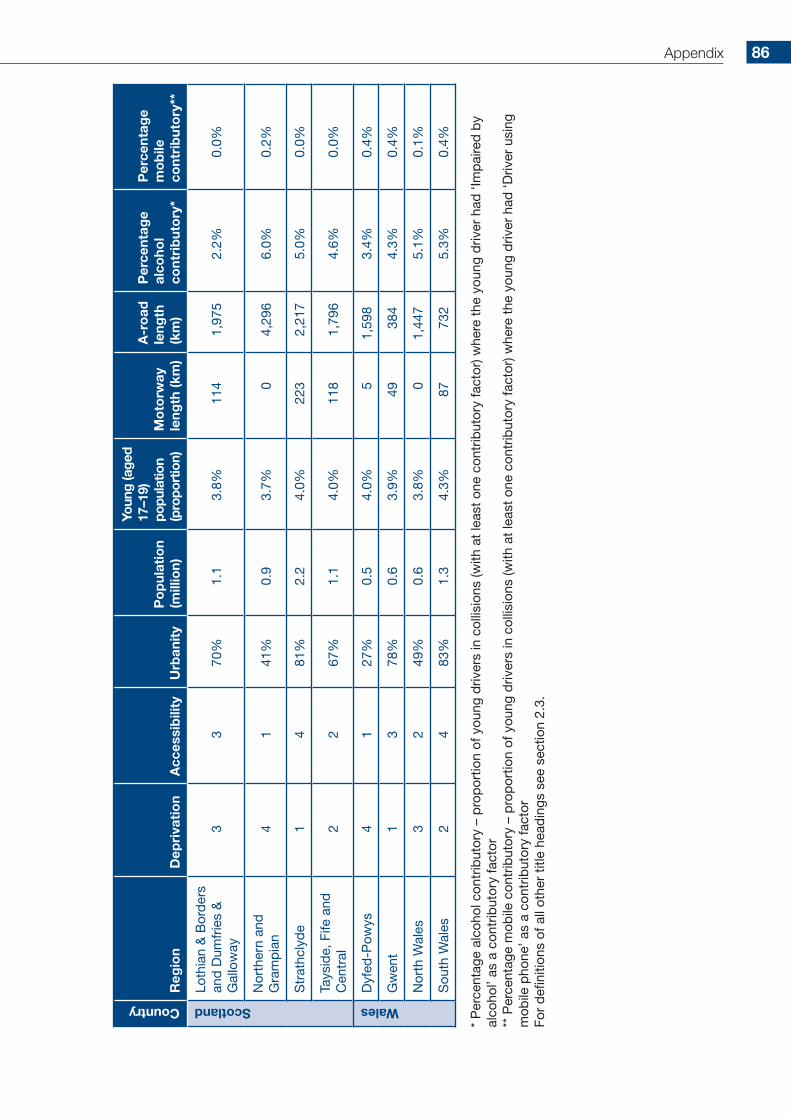
Country
Reg
ion
Dep
riva
tio
nA
cces
sib
ility
Urb
anit
yP
op
ulat
ion
(mill
ion)
Youn
g (a
ged
17
–19)
po
pula
tion
(pro
port
ion)
Mo
torw
ay
leng
th (k
m)
A-r
oad
le
ngth
(k
m)
Per
cent
age
alco
hol
cont
rib
uto
ry*
Per
cent
age
mo
bile
co
ntri
but
ory
**
Scotland
Loth
ian
& B
ord
ers
and
Dum
frie
s &
G
allo
way
33
70%
1.1
3.8%
114
1,97
52.
2%0.
0%
Nor
ther
n an
d
Gra
mp
ian
41
41%
0.9
3.7%
04,
296
6.0%
0.2%
Str
athc
lyd
e1
481
%2.
24.
0%22
32,
217
5.0%
0.0%
Tays
ide,
Fife
and
C
entr
al2
267
%1.
14.
0%11
81,
796
4.6%
0.0%
Wales
Dyf
ed-P
owys
41
27%
0.5
4.0%
51,
598
3.4%
0.4%
Gw
ent
13
78%
0.6
3.9%
4938
44.
3%0.
4%
Nor
th W
ales
32
49%
0.6
3.8%
01,
447
5.1%
0.1%
Sou
th W
ales
24
83%
1.3
4.3%
8773
25.
3%0.
4%
* P
erce
ntag
e al
coho
l con
trib
utor
y –
pro
por
tion
of y
oung
driv
ers
in c
ollis
ions
(with
at
leas
t on
e co
ntrib
utor
y fa
ctor
) whe
re t
he y
oung
driv
er h
ad ‘I
mp
aire
d b
y al
coho
l’ as
a c
ontr
ibut
ory
fact
or**
Per
cent
age
mob
ile c
ontr
ibut
ory
– p
rop
ortio
n of
you
ng d
river
s in
col
lisio
ns (w
ith a
t le
ast
one
cont
ribut
ory
fact
or) w
here
the
you
ng d
river
had
‘Driv
er u
sing
m
obile
pho
ne’ a
s a
cont
ribut
ory
fact
orFo
r d
efini
tions
of a
ll ot
her
title
hea
din
gs s
ee s
ectio
n 2.
3.
Appendix 86

The Royal Automobile Club Foundation for Motoring Ltd is a transport policy and research organisation which explores the economic, mobility, safety and environmental issues relating to roads and their users. The Foundation publishes independent and authoritative research with which it promotes informed debate and advocates policy in the interest of the responsible motorist.
RAC Foundation 89–91 Pall Mall London SW1Y 5HS
Tel no: 020 7747 3445 www.racfoundation.org
Registered Charity No. 1002705
May 2014 © Copyright Royal Automobile Club Foundation for Motoring Ltd
Designed and Printed by The Javelin Partnership Ltd. Tel: 0118 907 3494
Produced on paper from a managed sustainable source which is FSC certified as containing 50% recycled waste.