Embed Size (px)
Citation preview
A REDUCED-RISK PEST MANAGEMENT PROGRAM FOR WALNUTS
CONTRACT NUMBER: 97-0280
Final Report Year 1: June 15,1998-December 31,1999
SUBMITTED BY:
WALNUT MARKETING BOARD DENNIS A. BALINT, EXECUTIVE DIRECTOR
1540 RIVER PARK DRIVE, SUITE 203 SACRAMENTO, CA 95815
(916) 922-5888 Fax (916) 923-2548 E-mail: [email protected]
February 29,2000
Prepared for California Department of Pesticide Regulation
DISCLAIMER
The statements and conclusions in this report are those of the contractor and not necessarily those of the California Department of Pesticide Regulation. The mention of commercial products, their source, or their connection with material reported herein is not to be construed as actual or implied endorsement of such products.
ACKNOWLEDGMENTS
Walnut Marketing Board: Dennis Balint, Executive Director David Ramos, WMB Research Director
BIOS Program, Community Alliance with Family Farmers: Molly Espley, BIOS Program Coordinator, CAFF
University of California Cooperative Extension Farm Advisors: Carolyn Pickel, Area UCIPM Advisor, Sacramento Valley Walt Bentley, UCIPM Entomologist, Kearney Agricultural Center Tim Prather, UCIPM Weed Ecologist, Kearney Agricultural Center Joe Grant, San Joaquin Co. UCCE Bill Olson, Butte Co. UCCE Rick Buchner, Tehama Co. UCCE Bob Beede, Kings Co. UCCE Steve Sibbett, Tulare Co. UCCE Mark Freeman, Fresno Co. UCCE Janine Hasey, SutterNuba Cos. UCCE Kathy Kelley, Stanislaus Co. UCCE Janet Caprile, Contra Costa Co. UCCE Bill Krueger, Glenn Co. UCCE
University of California Cooperative Extension Specialists: Terry Prichard, Extension Water Management Specialist, San Joaquin Co. Beth Teviotdale, Extension Plant Pathologist, Kearney Agricultural Center Bob Van Steenwyk, Extension Entomologist, UC Berkeley
University of California Research Scientists: Nick Mills, Entomologist UC Berkeley Gale McGranahan, Pomologist, UC Davis Steve Lindow, Plant Pathologist, UC Berkeley Jim Adaskaveg, Plant Pathologist, UC Riverside
Pest Control Advisors: Russ Stocker, Arena Pest Management, aerial applicator Tom Walgenbach, Agribusiness Consultant Rick Baake, Consep
Insectaries: Cynthia Douglas, Rincon Vitova Sinthya Penn, Beneficial Insectary
Field Assistants: Nicole Darby, Sacramento Valley Lisa Klima, Southern San Joaquin Valley Michelle Rego, Northern San Joaquin Valley
PMA Demonstration Site Cooperators: Red Bluff Farms, Tehama County Jim Bremner, Butte County Ren FairbanksMike Bennett, Yuba County Jack Gilbert, Yuba County Barton Orchards, San Joaquin County John Brichetto, Stanislaus County Joe Campos, Fresno County Paul Stanfield, Kings County Bab Sak, Tulare County Chan Wilcox, Tulare County Jerry Tennant, Houston Ranch, Contra Costa County
This report was submitted in fulfillment of Contract number 97-0280, A Reduced-Risk Pest Management Program for Walnuts, by the Walnut Marketing Board under the partial sponsorship of the California Department of Pesticide Regulation. Work was completed as of 3 1 December 1999.
TABLE OF CONTENTS
Abstract ...................................................................................................................................... 1
Executive Summary .................................................................................................................... 2
Objective 1: To develop a Walnut Pest Management Alliance Team for implementation of reduced-risk strategies ............................................................................................................. 4
pomonella .................................................................................................................................. 6
Xunthomonus cumpestris ........................................................................................................... 14
Objective 2: Demonstrate reduced-risk strategies to control codling moth, Cydia
Objective 3: To Demonstrate Reduced-Risk Strategies to Control Walnut Blight,
Objective 4: To demonstrate orchard floor management techniques. cover crops and . . . rrlgatlon ................................................................................................................................... 16
Objective 5 : Economic cost comparison between conventional treatments and PMA treatments ................................................................................................................................. 18
Summary and Conclusions . . . . . . . . . . . . . . . . . . . . . . . . . . . . . . . . . . . . . . . . . . . . . . . . . . . . . . . . . . . . . . . . . . . . . . . . . . . . . . . . . . . . . . . . . . . . . . . . . . . . . . . . 19
References ................................................................................................................................ 21
List of Publications Produced ....................... i . . . . . . . . . . . . . . . . . . . . . . . . . . . . . . . . . . . . . . . . . . . . . . . . . . . . . . . . . . . . . . . . . . . . . . . . . . . . 22
Appendix I ................................................................................................................................ 38
Appendix 11 ............................................................................................................................... 39
Appendix 111 ............................................................................................................................. 40
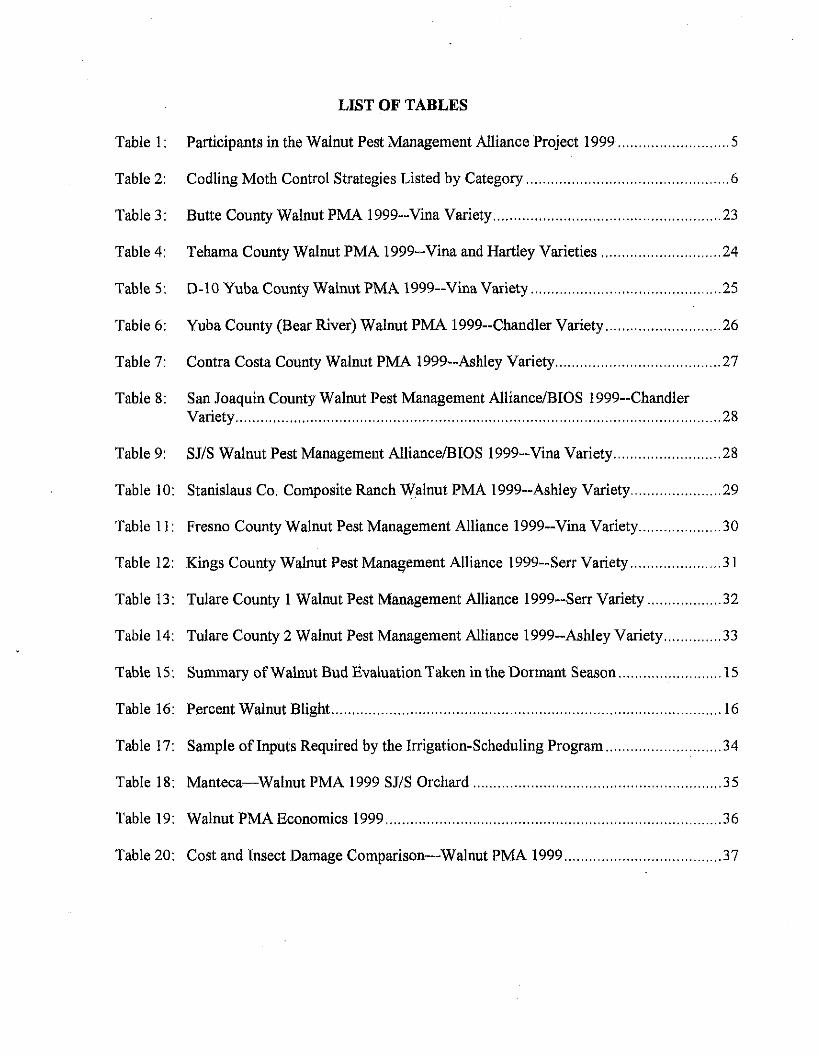
LIST OF TABLES
Table 1 : Participants in the Walnut Pest Management Alliance Project 1999 ........................... 5
Table 2: Codling Moth Control Strategies Listed by Category ................................................. 6
Table 3 : Butte County Walnut PMA 1999-- Vina Variety ....................................................... 23
Table 4: Tehama County Walnut PMA 1999-- Vina and Hartley Varieties ............................. 24
Table 5: D-10 Yuba County Walnut PMA 1999-- Vina Variety .............................................. 25
Table 6: Yuba County (Bear River) Walnut PMA 1999-Chandler Variety ............................ 26
Table 7: Contra Costa County Walnut PMA 1999-- Ashley Variety ........................................ 27
Table 8: San Joaquin County Walnut Pest Management Alliance/BIOS 1999Xhandler Variety . . . . . . . . . . . . . . . . . . . . . . . . . . . . . . . . . . . . . . . . . . . . . . . . . . . . . . . . . . . . . . . . . . . . . . . . . . . . . . . . . . . . . . . . . . . . . . . . . . . . . . . . . . . . . . . . . . . . . 28
Table 9: SJ/S Walnut Pest Management Alliance/BIOS 1999-- Vina Variety .......................... 28
Table 10: Stanislaus Co . Composite Ranch Walnut PMA 1999-- Ashley Variety ...................... 29
Table 11: Fresno County Walnut Pest Management Alliance 1999-- Vina Variety .................... 30
Table 12: Kings County Walnut Pest Management Alliance 1999-- Serr Variety ...................... 31
Table 13: Tulare County 1 Walnut Pest Management Alliance 1999- Serr Variety .................. 32
Table 14: Tulare County 2 Walnut Pest Management Alliance 1999-- Ashley Variety .............. 33
Table 15: Summary of Walnut Bud Evaluation Taken in the Dormant Season ......................... 15
Table 16: Percent Walnut Blight . . . . . . . . . . . . . . . . . . . . . . . . . . . . . . . . . . . . . . . . . . . . . . . . . . . . . . . . . . . . . . . . . . . . . . . . . . . . . . . . . . . . . . . . . . . . . . 16
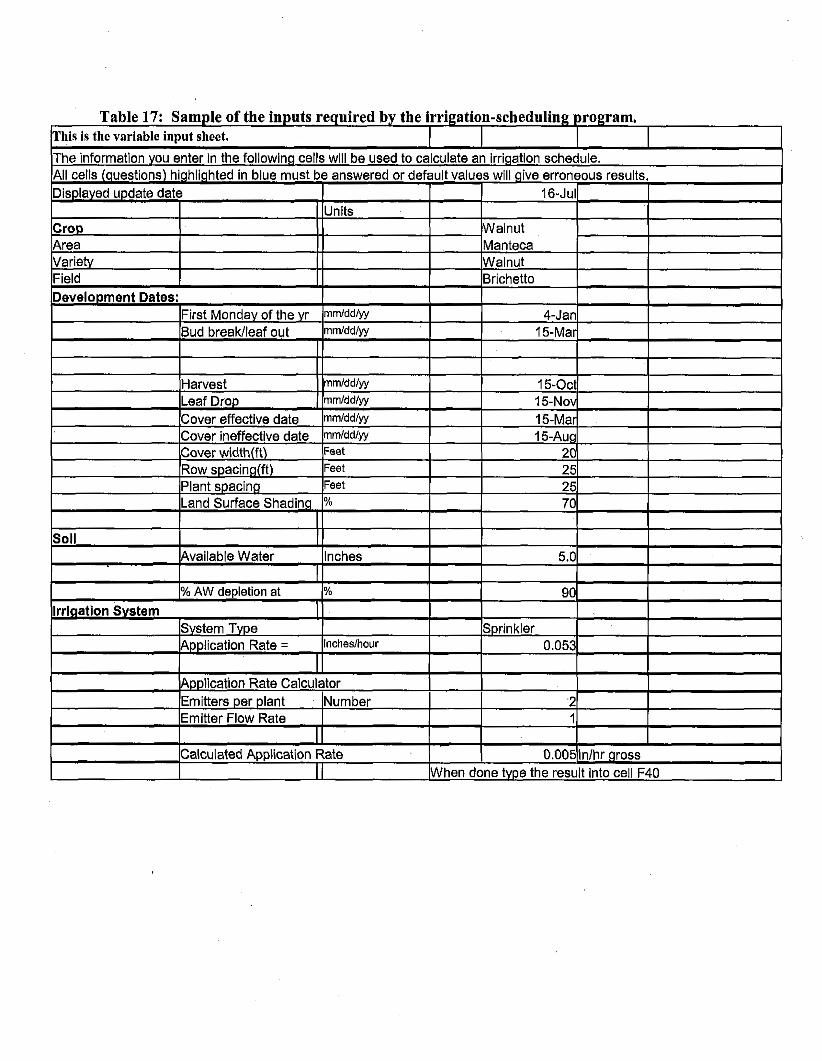
Table 17: Sample of Inputs Required by the Irrigation-Scheduling Program ............................ 34
Table 18: Manteca-Walnut PMA 1999 SJ/S Orchard ............................................................ 35
Table 19: Walnut PMAEconomics 1999 ................................................................................. 36
Table 20: Cost and Insect Damage Comparison-Walnut PMA 1999 ...................................... 37
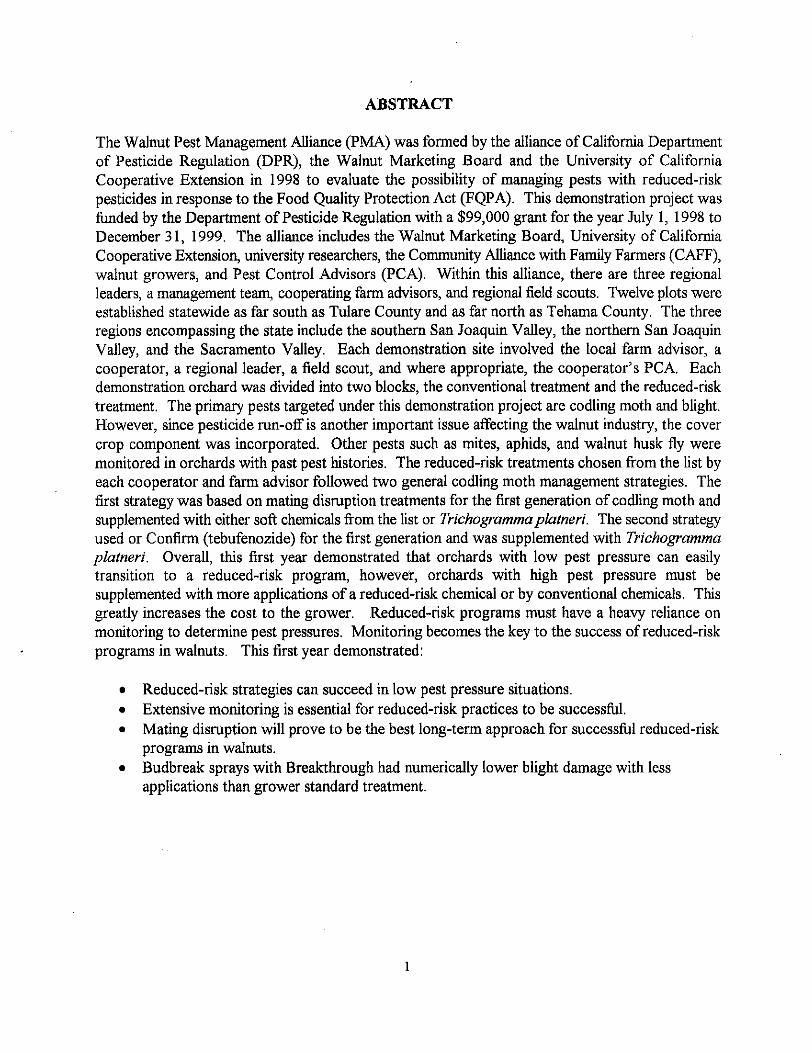
ABSTRACT
The Walnut Pest Management Alliance (PMA) was formed by the alliance of California Department of Pesticide Regulation (DPR), the Walnut Marketing Board and the University of California Cooperative Extension in 1998 to evaluate the possibility of managing pests with reduced-risk pesticides in response to the Food Quality Protection Act (FQPA). This demonstration project was funded by the Department of Pesticide Regulation with a $99,000 grant for the year July 1, 1998 to December 31, 1999. The alliance includes the Walnut Marketing Board, University of California Cooperative Extension, university researchers, the Community Alliance with Family Farmers (CAFF), walnut growers, and Pest Control Advisors (PCA). Within this alliance, there are three regional leaders, a management team, cooperating farm advisors, and regional field scouts. Twelve plots were established statewide as far south as Tulare County and as far north as Tehama County. The three regions encompassing the state include the southern San Joaquin Valley, the northern San Joaquin Valley, and the Sacramento Valley. Each demonstration site involved the local farm advisor, a cooperator, a regional leader, a field scout, and where appropriate, the cooperator’s PCA. Each demonstration orchard was divided into two blocks, the conventional treatment and the reduced-risk treatment. The primary pests targeted under this demonstration project are codling moth and blight. However, since pesticide run-off is another important issue affecting the walnut industry, the cover crop component was incorporated. Other pests such as mites, aphids, and walnut husk fly were monitored in orchards with past pest histories. The reduced-risk treatments chosen from the list by each cooperator and farm advisor followed two general codling moth management strategies. The first strategy was based on mating disruption treatments for the first generation of codling moth and supplemented with either soft chemicals from the list or Trichogrummuplutneri. The second strategy used or Confirm (tebufenozide) for the first generation and was supplemented with Trichogrummu plutneri. Overall, this first year demonstrated that orchards with low pest pressure can easily transition to a reduced-risk program, howevek, orchards with high pest pressure must be supplemented with more applications of a reduced-risk chemical or by conventional chemicals. This greatly increases the cost to the grower. Reduced-risk programs must have a heavy reliance on monitoring to determine pest pressures. Monitoring becomes the key to the success of reduced-risk programs in walnuts. This first year demonstrated:
Reduced-risk strategies can succeed in low pest pressure situations. Extensive monitoring is essential for reduced-risk practices to be successful. Mating disruption will prove to be the best long-term approach for successful reduced-risk
Budbreak sprays with Breakthrough had numerically lower blight damage with less programs in walnuts.
applications than grower standard treatment.
1
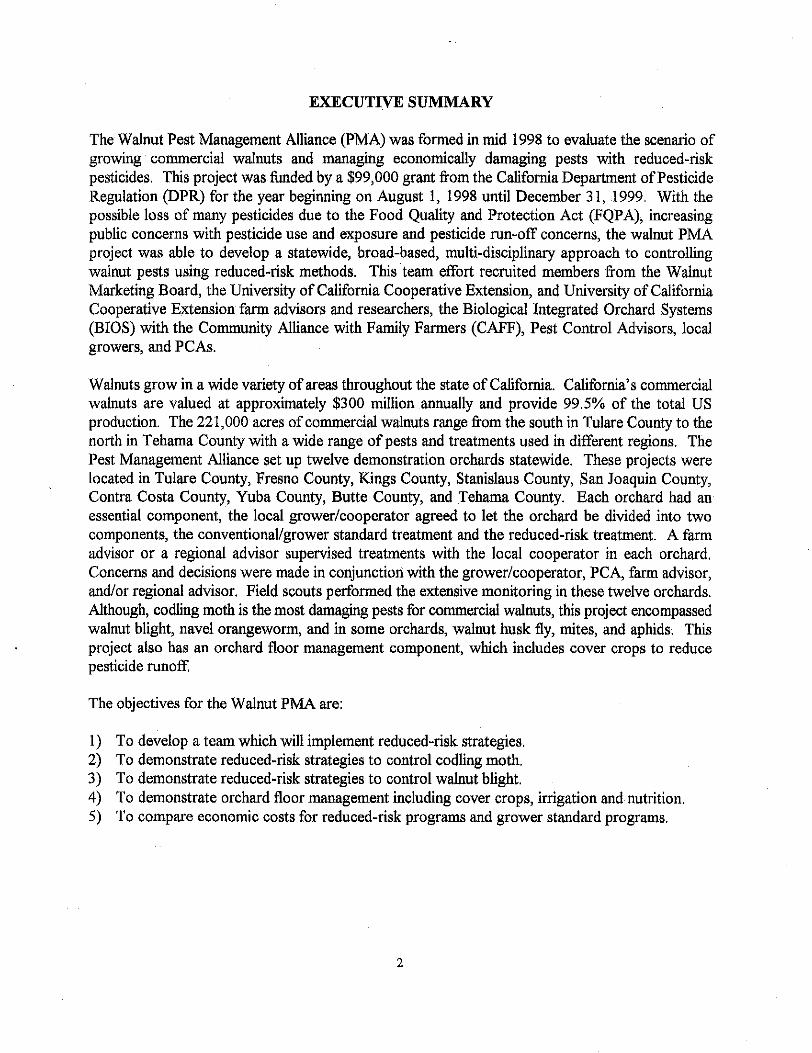
EXECUTIVE SUMMARY
The Walnut Pest Management Alliance (PMA) was formed in mid 1998 to evaluate the scenario of growing commercial walnuts and managing economically damaging pests with reduced-risk pesticides. This project was h d e d by a $99,000 grant &om the California Department of Pesticide Regulation (DPR) for the year beginning on August 1, 1998 until December 31, 1999. With the possible loss of many pesticides due to the Food Quality and Protection Act (FQPA), increasing public concerns with pesticide use and exposure and pesticide run-off concerns, the walnut PMA project was able to develop a statewide, broad-based, multi-disciplinary approach to controlling walnut pests using reduced-risk methods. This team effort recruited members from the Walnut Marketing Board, the University of California Cooperative Extension, and University of California Cooperative Extension farm advisors and researchers, the Biological Integrated Orchard Systems (BIOS) with the Community Alliance with Family Farmers (CAFF), Pest Control Advisors, local growers, and PCAs.
Walnuts grow in a wide variety of areas throughout the state of California. California’s commercial walnuts are valued at approximately $300 million annually and provide 99.5% of the total US production. The 221,000 acres of commercial walnuts range fkom the south in Tulare County to the north in Tehama County with a wide range of pests and treatments used in different regions. The Pest Management Alliance set up twelve demonstration orchards statewide. These projects were located in Tulare County, Fresno County, Kings County, Stanislaus County, San Joaquin County, Contra Costa County, Yuba County, Butte County, and Tehama County. Each orchard had an essential component, the local growedcooperator agreed to let the orchard be divided into two components, the conventional/grower standard treatment and the reduced-risk treatment. A farm advisor or a regional advisor supervised treatments with the local cooperator in each orchard, Concerns and decisions were made in conjunctiod with the grower/cooperator, PCA, farm advisor, and/or regional advisor. Field scouts performed the extensive monitoring in these twelve orchards. Although, codling moth is the most damaging pests for commercial walnuts, this project encompassed walnut blight, navel orangeworm, and in some orchards, walnut husk fly, mites, and aphids. This project also has an orchard floor management component, which includes cover crops to reduce pesticide runoff.
The objectives for the Walnut PMA are:
1) To develop a team which will implement reduced-risk strategies. 2) To demonstrate reduced-risk strategies to control codling moth. 3) To demonstrate reduced-risk strategies to control walnut blight. 4) To demonstrate orchard floor management including cover crops, irrigation and nutrition 5) To compare economic costs for reduced-risk programs and grower standard programs.
2
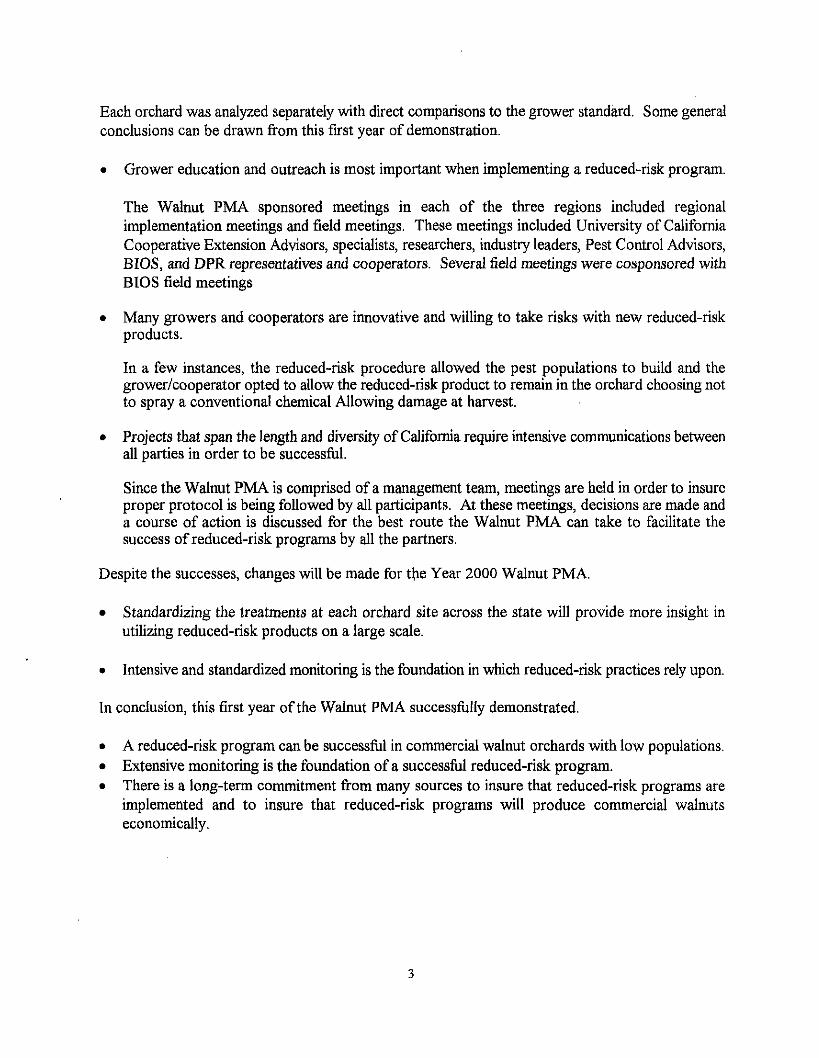
Each orchard was analyzed separately with direct comparisons to the grower standard. Some general conclusions can be drawn from this first year of demonstration.
Grower education and outreach is most important when implementing a reduced-risk program.
The Walnut PMA sponsored meetings in each of the three regions included regional implementation meetings and field meetings. These meetings included University of California Cooperative Extension Advisors, specialists, researchers, industry leaders, Pest Control Advisors, BIOS, and DPR representatives and cooperators. Several field meetings were cosponsored with BIOS field meetings
Many growers and cooperators are innovative and willing to take risks with new reduced-risk products.
In a few instances, the reduced-risk procedure allowed the pest populations to build and the grower/cooperator opted to allow the reduced-risk product to remain in the orchard choosing not to spray a conventional chemical Allowing damage at harvest.
Projects that span the length and diversity of California require intensive communications between all parties in order to be successful.
Since the Walnut PMA is comprised of a management team, meetings are held in order to insure proper protocol is being followed by all participants. At these meetings, decisions are made and a course of action is discussed for the best route the Walnut PMA can take to facilitate the success of reduced-risk programs by all the partners.
Despite the successes, changes will be made for the Year 2000 Walnut PMA.
Standardizing the treatments at each orchard site across the state will provide more insight in utilizing reduced-risk products on a large scale.
0 Intensive and standardized monitoring is the foundation in which reduced-risk practices rely upon.
In conclusion, this first year of the Walnut PMA successhlly demonstrated.
0 A reduced-risk program can be successll in commercial walnut orchards with low populations. Extensive monitoring is the foundation of a successful reduced-risk program. There is a long-term commitment from many sources to insure that reduced-risk programs are implemented and to insure that reduced-risk programs will produce commercial walnuts economically.
3
OBJECTIVE 1: TO DEVELOP A WALNUT PEST MANAGEMENT ALLIANCE TEAM. FOR IMPLEMENTATION OF REDUCED-RISK STRATEGIES.
The Walnut PMA encompasses a broad spectrum of partners requiring intensive communication statewide while allowing for local input from farm advisors, grower cooperators, and PCAs. The overall structure is the management team represented by different expertise and disciplines with BIOS and DPR representation. The management team includes Dave Ramos, Carolyn Pickel, Walt Bentley, Terry Prichard, Bill Olson, Rich Buchner, Joe Grant, Tim Prather, Marcia Gibbs, and Bob Elliott, Carolyn Pickel is the co-leader of the project with Dave Ramos. The codling moth expertise is from Carolyn Pickel, Walt Bentley, and Bill Olson. The walnut blight expertise is provided by Bill Olson and Rick Buchner. Cover crop, orchard floor management, and irrigation expertise is Tim Prather and Teny Prichard. Local implementation input is from the farm advisors Rick Buchner, Joe Grant, and Bill Olson. Coordination of the walnut PMA and walnut BIOS project occurs through Joe Grant and the Marcia Gibbs and now Molly Espley as the BIOS member on the management team. All the cooperating farm advisors are also members of the management team.
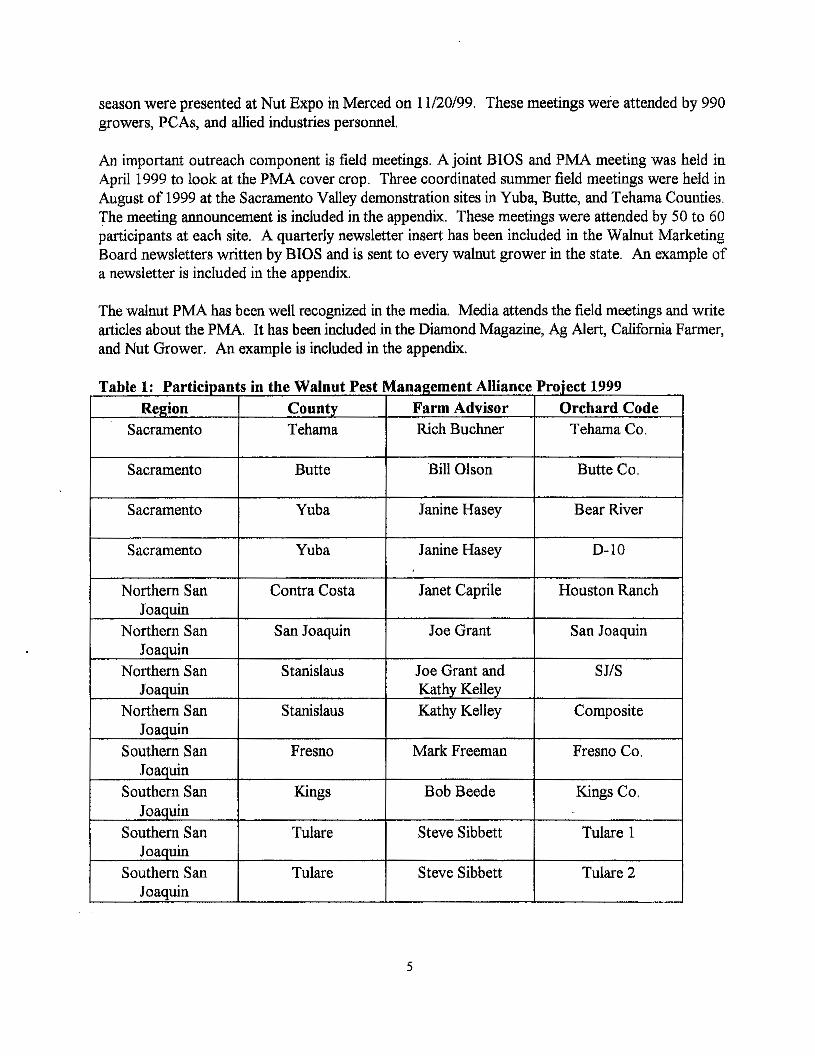
The statewide project is then divided into three regions, the southern San Joaquin Valley, the northern San Joaquin Valley, and the Sacramento Valley. Each region has a regional leader. The regional leaders are Walt Bentley, Terry Prichard, and Carolyn Pickel respectively. Each region has a regional implementation team made up of local farm advisors, grower-cooperators, walnut marketing board research committee members, insectaries, and local PCAs. The regional implementation team is responsible for developing plans for each region andgetting input form local growers and PCAs. The cooperating farm advisors attend the management and implementation team meetings. The Walnut PMA county demonstration sites are listed in Table 1 with the respective farm advisors and cooperator. Each region employed a field scout to monitor the Walnut PMA orchards. The Walnut PMA also sought advice from university researchers, Dr. Steve Lindow, Dr. N.J. Mills, and Dr. Robert Van Steenwyk.
The Walnut PMA a l l i c e has improved communication between farm advisors statewide on reduced- risk practices as well as improved communication between the alliance partners. Both the BIOS project in Yolo/Solano and San Joaquin have benefited from participating in the walnut PMA and use the information from the researchers and farm advisors in their programs. The BIOS project is cooperating with PMA field meetings and the field meetings are well received by the walnut growing community.
The management team met on 6/29/98 and 10/17/99. The walnut PMA has also met with UC researchers, Dr. Steve Welter, Dr. Nick Mills, and Dr. Bob Van Steenwyk on 10/28/99 to evaluate the codling moth data from the 1999 season. There has been a walnut PMA meeting at the Walnut Research Conference on 1/28/99. Regional implementation meetings were held in August 1998 and March and June of 1999. The walnut PMA has been discussed at the walnut farm advisors summer tour, the walnut marketing board research committee, and the Walnut Marketing Board/Walnut Commission meeting in 1998. Presentations on the Walnut PMA have been made at grower meetings at the Butte/Glenn County Walnut Day on 2/2/99, Tri-County Walnut Day in Visalia on 2/3/99, SutterNubalColusa walnut meeting on 2/18/99, Tehama County Walnut Day on 2/24/99 and the Community Alliance with Family Farm Tour on 4/23/99. Results from the 1999 demonstratir
4
season were presented at Nut Expo in Merced on 11/20/99. These meetings were attended by 990 growers, PCAs, and died industries personnel.
An important outreach component is field meetings. A joint BIOS and PMA meeting was held in April 1999 to look at the PMA cover crop, Three coordinated summer field meetings were held in August of 1999 at the Sacramento Valley demonstration sites in Yuba, Butte, and Tehama Counties. The meeting announcement is included in the appendix. These meetings were attended by 50 to 60 participants at each site. A quarterly newsletter insert has been included in the Walnut Marketing Board newsletters written by BIOS and is sent to every walnut grower in the state. An example of a newsletter is included in the appendix.
The walnut PMA has been well recognized in the media. Media attends the field meetings and write articles about the PMA. It has been included in the Diamond Magazine, Ag Alert, California Farmer, and Nut Grower. An example is included in the appendix.
Table 1: Participants in the Walnut Pest Management Alliance Project 1999
Region Orchard Code Farm Advisor County Sacramento Tehama Co. Rich Buchner Tehama
I I I
Sacramento Butte Co. Bill Olson Butte
5
OBJECTIVE 2: DEMONSTRATE REDUCED-RISK STRATEGIES TO CONTROL CODLING MOTH, CYDIA POMONELLA
Introduction
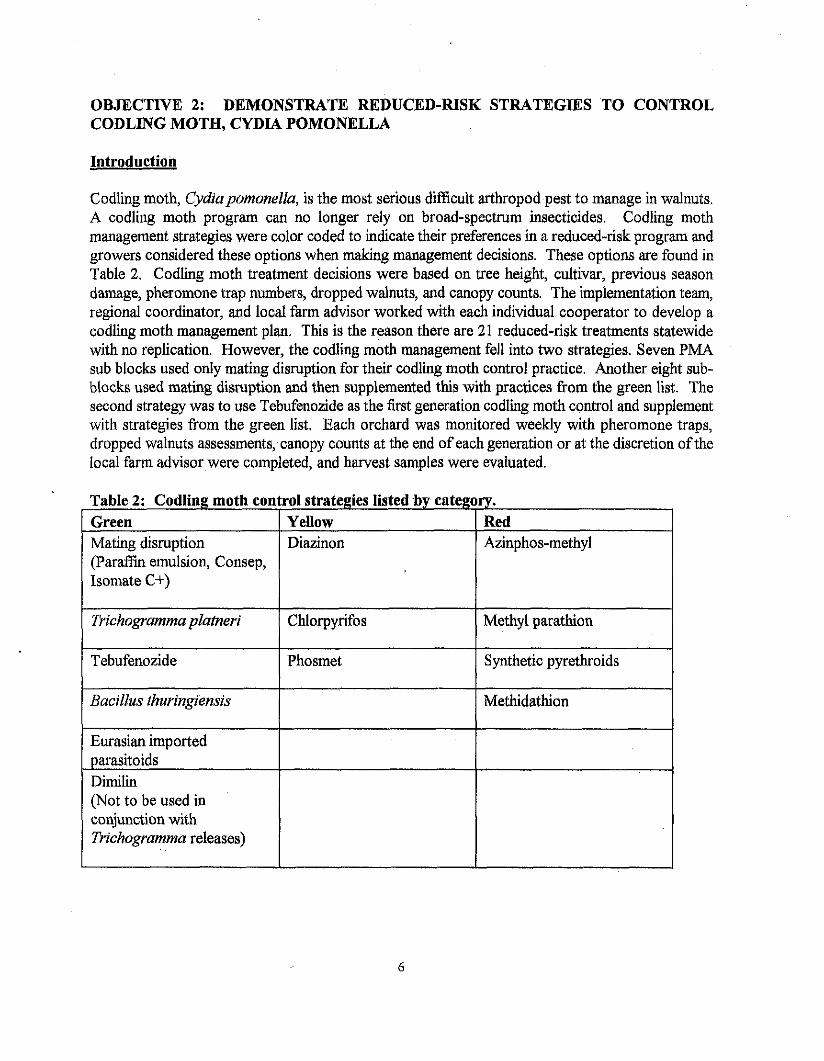
Codling moth, Cydzapomonella, is the most serious difficult arthropod pest to manage in walnuts. A codling moth program can no longer rely on broad-spectrum insecticides. Codling moth management strategies were color coded to indicate their preferences in a reduced-risk program and growers considered these options when making management decisions. These options are found in Table 2. Codling moth treatment decisions were based on tree height, cultivar, previous season damage, pheromone trap numbers, dropped walnuts, and canopy counts. The implementation team, regional coordinator, and local farm advisor worked with each individual cooperator to develop a codling moth management plan. This is the reason there are 21 reduced-risk treatments statewide with no replication. However, the codling moth management fell into two strategies. Seven PMA sub blocks used only mating disruption for their codling moth control practice. Another eight sub- blocks used mating disruption and then supplemented this with practices from the green list. The second strategy was to use Tebufenozide as the first generation codlig moth control and supplement with strategies from the green list. Each orchard was monitored weekly with pheromone traps, dropped walnuts assessments, canopy counts at the end of each generation or at the discretion of the local farm advisor were completed, and harvest samples were evaluated.
Table 2: Codling moth control strategies listed 'by category. Green Yellow Red Mating disruption Diazinon Azinphos-methyl (Paraffin emulsion, Consep, Isomate C+)
Trichogramma platneri Chlorpyrifos Methyl parathion
Tebufenozide Phosmet Synthetic pyrethroids
Bacillus thuringiensis Methidathion
Eurasian imported parasitoids Dimilin (Not to be used in conjunction with Trichogramma releases)
6
Materials and Methods
Mating Disruption When choosing mating disruption for a reduced-risk practice, it must be applied for at first moth. Research on other crops shows that mating disruption works by delaying mating and subsequent egg laying. When egg laying is delayed by three days, the female begins to reabsorb her eggs. However, mating disruption does not halt mating and mated females may be found in the orchard. Due to these factors, mating disruption works best in low codling moth population orchards and requires successive multiple years to lower the population and work effectively. Currently, there are two commercially available products for mating disruption. Another experimental mating disruption product, par& emulsion, which is in the development stage, was tested in walnuts under the Walnut Pest Management Alliance.
The two commercially available products are Isomate C+ and Checkmate. Isomate C+ lasts 140-150 days and requires one application at a rate of 400 ties per acre, or approximately eight point sources per tree. This product is used extensively in apples and pears but is not cost effective for tall walnut trees. Checkmate's commercial dispenser available in 1999 required two applications per season to ensure season long control, however, only one point source is required per tree.
Paraffin Emulsion was developed by a University of California, Davis researcher under a project funded by the California Cling Peach Advisory Board. This experimental paraffin emulsion was applied on approximately 130 acres participating in the Walnut Pest Management Alliance. The Walnut Pest Management Alliance is interested in this product because it will be easier to apply in the taller walnut canopy. Since codling moth is solid at room temperature, the manufacture had trouble with their formulation. The material was applied using a pressurized handgun applicator that projected a stream of the paraffin emulsion into 'the canopy. The 1999 season product required dilution to use the applicator and the actual dilution rate varied for each orchard. Dilution shortens the life of the product and varies the results from block to block. The paraffin emulsion was to be applied near the biofix. Biofix was determined by the first male caught in a codling moth trap baited with a 1X lure. Paraffin emulsion was supplied by Agrium, Inc.
Reduced-Risk Products Orchards that used tebufenozide as the reduced-risk program typically supplemented with aerially applied Trichogramma platneri for the Znd and 3rd generations. Orchards that successfully used tebufenozide supplemented ground applications with aerial applications. Several orchards had trouble with this product when no spray was applied for the 1B peak or spray coverage was not adequate. Spray coverage, proper spray timing and applying in low populations is important to good efficacy when using tebufenozide.
Other Products Demonstrated Trichogrammaplatneri was applied for the second generation and third generation at 200,000 per acre. Trichograrnrnaplutneri was aerially applied over reduced-risk treatments and applied as a sole means of control in one block. Aerial applications occurred one time per week for the four weeks spanning the codling moth generations. In the orchard where Trichogramma was only applied for the second generation saw in increase in codling moth damage in the 3'd generation. The para-
I
sitoids of codling moth and navel orangeworm, Mastrus and Gonroms respectively, were also released in selected orchards. Bacillus thuringiensis was supplemented over parafin emulsion and checkmate to provide adequate control when trap catches indicated a potential problem.
Trap Monitoring The orchards were monitored usimg 1X and 1OX Biolures with Scenturion Delta Traps. Traps were placed at a density of approximately one trap per five-acres. This is a much higher density than typically used. This is done to predict population levels that may determine potential damage problems and to compare the treatment blocks in each orchard. The 1OX lures are used in mating disruption orchards of pears and apples. The 1OX lure is loaded with 10 times the normal amount of codlemone (codling moth pheromone) than the commercial lure. Using this lure had been a useful indicator of how well mating disruption is working in pears and apples. However, this has not been widely tested in walnuts. In orchards using mating disruption as the reduced-risk treatment, there should be no moths caught in the pheromone traps if the mating disruption is working. If there was no reduction in trap catches, then we could conclude the mating disruption is not working in that orchard. Lures were changed every four to six weeks and trap liners were changed as necessary. Traps were monitored weekly by the field scout and weekly trap catches were made available upon request to farm advisors, growers, and PCAs.
Nut Drop Monitoring To evaluate the over-wintering generation of codling moth, dropped walnuts are assessed. Randomly selected walnut trees were chosen for each of the treatment blocks and the grower standard treatment block. When walnuts were noticed dropping to the ground, assessments began. Weekly assessments of the number of infested walnuts per tree were taken. When the walnuts ceased dropping or when the appropriate day degrees were accumulated, this assessment was stopped.
Canopy Counts Canopy counts were conducted at the end of each codling moth generation or at the discretion of the f m advisor or regional advisor. They were conducted with ladders to monitor codling moth infested walnuts using the same trees marked for walnut nut drop. Assessments were taken high and low in the canopy. In some assessments, damage was recorded as being either in the husk or in the meat of the walnut.
Harvest Harvest samples were taken after the trees were shaken for harvest to ensure a random sample. Walnuts were collected from the same trees, in the PMA treatments and the grower standard treatments, used for walnut nut drop and canopy counts. A 500 nut sample was taken for each treatment or sub block. Samples were divided into those with husks attached and those with no husks attached. Husks were inspected for codling moth damage before cracking. Walnuts were inspected for codling moth and navel orangeworm. If no worm was present but damage was evident, then the frass of the'insect was inspected and an educated assessment was made. Damage was recorded as a percent.
8
Results
Each orchard wiU be assessed separately due to independent treatments. There are twelve different grower standard treatments, which are compared to the PMA reduced-risk treatments.
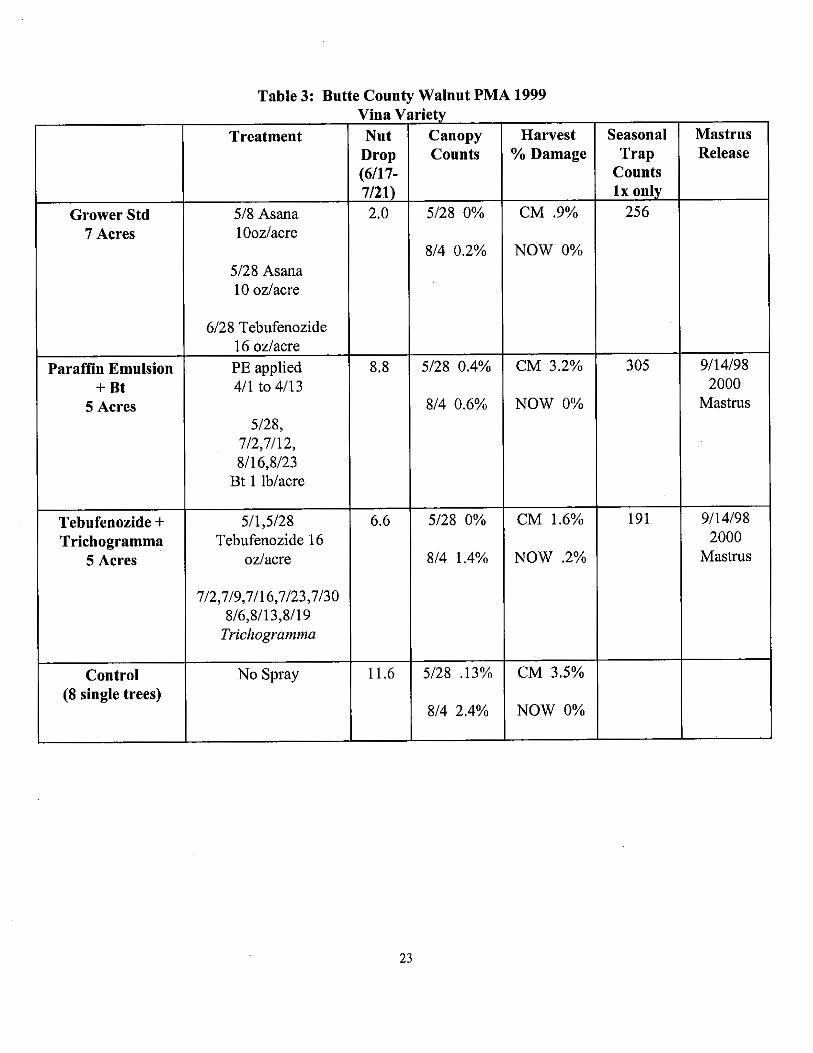
Butte County The Butte County Walnut PMA applied paraffin emulsion with a Bt supplement on five acres, a tebufenozide and Trichogramma on five acres, a seven-acre grower standard and the only unsprayed control of the Walnut PMA (Table 3). The paraffin emulsion was supplemented with five sprays of Bt throughout the season. The rate of the parailin emulsion is variable due to dilution factors occur- ring in the field at the time of application. The parafftn emulsion application began on 4/1, how-ever, due to mechanical difficulties, the application was halted and did not resume until 4/13. This delay, most likely, did not affect the codling moth generation, as biofix did not occur until 4/15. Seasonal trap counts suggest that this orchard had the potential for codling moth damage but damage was not seen in any of the treatments including the untreated trees. Canopy counts, taken on 5/28 and 8/4, showed that damage due to codling moth may be increasing but not to the point of economic damage. The 2000 Masfrus released in the autumn of 1998 were not recovered in the codling moth larvae pupating in corrugated cardboard bands surrounding randomly chosen trees and therefore their impact was not measured. The tebufenozide treatment had less damage at harvest than the paraflin emulsion block. Despite the encouraging results from the tebufenozide and Trichogramma, the grower standard, two applications of esfenvalerate and one application of tebufenozide, had the least amount of codling moth damage at harvest.
Tehama County The Tehama County Walnut PMA block consisted of both the Hartley and Vina cultivars. Table 4 shows season long results. The seasonal trap counts suggests this orchard has a low population of codling moth. The low damage at harvest fkther indicates low codling moth populations. The grower standard treatment consisted of a phosmet application for the first generation, chlorpyrifos for the second generation, and another Phosmet for the third generation treatment. Phosmet was inadvertently applied to the reduced-risk treatment, however monitoring continued throughout the. season. Nut drop assessments were not taken since much of the crop was lost to an April freeze, however canopy counts were taken. Canopy count assessments suggested only a slight infestation. Two separate releases of Masfrus were made, however, no results were seen from the autumn 9/98 releases. The accidental phosmet application would have eliminated the Masmts. More Mastrus released on September 9, 1999 will be assessed next season.
Yuba County D-10 This orchard had a total of five treatments, one grower standard and four reduced-risk blocks. Results from this orchard and application timing can be seen on Table 5 . The grower standard treatment consisted of one azinphos-methyl for the first generation, esfenvalerate for the second generation, and azinphos-methyl for the third generation. Paraffin emulsion was applied to ten acres on 4/1 at 15.5 grams per tree. Ten acres received one application of p a r a n emulsion, however, due to high trap catches, supplemental applications of Bt were applied. Ten acres received Consep’s Checkmate. Since total seasonal trap catch is above 500, this indi-cates a high population of codliig moth. The estimated cost for the paraffin emulsion is $70.00 per acre, not including labor.
9
Consep's Checkmate was applied at 4 per tree or 200 per acre in the top 1/3 of tree. The cost for checkmate is $84.67 per acre, not including labor. Due to problems with the paraffin emulsion, Consep's Checkmate was applied on July 20, 1999 to the paraffin emulsion reduced-risk treatment. This delay will contribute to codling moth damage seen at harvest. Nut drop from this orchard ranged fiom 4.6 damaged dropped nuts per tree in the grower standard to 11.0 in the PMA blocks. Canopy counts were assessed twice during the season. Codling moth damage at harvest is highest in the reduced-risk treatments. Each of the reduced-risk treatments had above 3% damage whereas the grower standard sustained under 0.5% codling moth damage. However, these results are much higher than the grade-sheets given to the grower at the end of the harvest. This suggests that the codling moth population may have been able to build in the reduced-risk treatments.
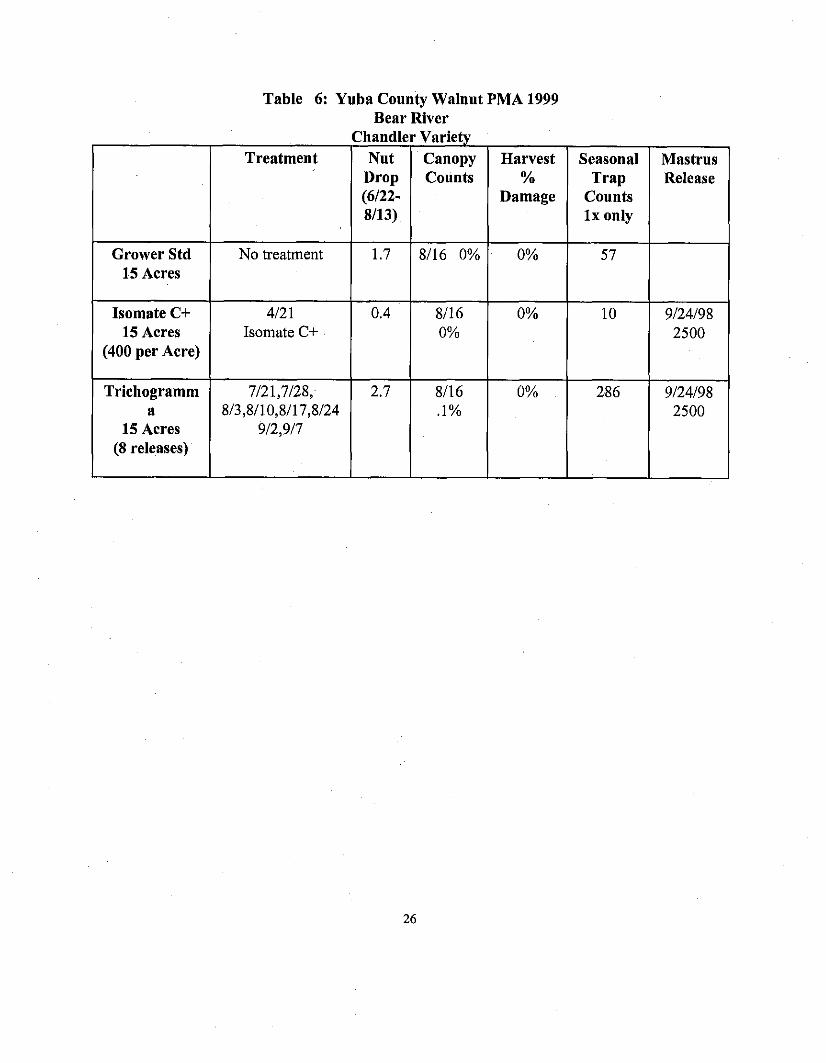
Yuba County - Bear River Orchard This orchard has a low codling moth population, which is evident in the nut drop, canopy count, and harvest results in Table 6. Due to the low trap numbers and history of the orchard, only one canopy count was completed. The low population is evident in that the grower standard, the grower opted to apply no chemical control for codling moth. However, in September, a malathion sprays was applied due to walnut husk fly, Rhagolefis complefu. Mastrus released in the autumn of 1998 were not recovered and therefore their significance is unknown.
Contra Costa County The Contra Costa County Walnut PMA had four treatments: the grower standard, tebufenozide plus eight Trichogramma releases, Paraffin emulsion plus two Trichogramma releases, and Paraffin emulsion with 2 Trichogramma releases plus tebufenozide. A summary of results for the Contra Costa County site can be seen in Table 7. The paraffin emulsion treatment was supplemented with Trichogramma for the 1B flight as trap catches indicated the paraffin emulsion was no longer effective and no additional product was available for reapplication. The paraffin emulsion was reapplied for the 2A flight in one third of the treatment; however, due to applicator breakdowns, the remainder of this block was treated with tebufenozide for the 2A flight. No additional flight was made for the 3rd generation. Contra Costa County had a relatively high population of codling moth as indicated by total seasonal trap counts. The paraffin emulsion blocks did show a decrease in trap catches, which is expected in a mating disruption block. However, the decrease was not enough to provide control. A medium codling moth population was indicated by the nut drop sample in the grower standard with 16.8 codling moth infested nuts per tree. Since the nut drop was substantially less in the reduced-risk treatments, this would indicate there was some control provided by the reduced risk treatments during the first generation. Canopy counts were assessed three times during the growing season, aRer the lA, lB, and 2B flights. At each time, codling moth infestation was less in the grower standard treatment than in each of the reduced-risk treatments. Damage assessment at harvest ranged from 4.7% codling moth damage in the Methyl parathion grower standard to and unacceptable 10.6% codling moth damage in the paraffin emulsion only treatment. The single application of methyl parthion for the 2"d flight was more effective than the multiple treatments in the PMA blocks. An important part of the PMA project is to develop reliable monitoring programs that predict the need for stronger codling moth controls - such thresholds would have been helpful in reducing the damage in this orchard.
San Joaquin County The San Joaquin County PMA orchard is divided into a twenty-acre grower standard and a twenty-acre reduced-risk treatment block, which also serves as a BIOS demonstration site
10
headed by Joe Grant, Farm Advisor San Joaquin County. The Walnut PMA project as strong ties with the San Joaquin Bios project started last year. The San Joaquin summary is found on Table 8. The grower standard applied chlorpyrifos for the first codling moth generation and tebufenozide for the second codliig moth generation. The reduced-risk treatment received paraffin emulsion mating disruption. The 1X traps caught no codling moth in the reduced-risk treatment, suggesting the paraffin emulsion was working. The grower standard treatment caught a season total of 80 codling moths per trap. Nut drop counts were extremely low in both treatments and the two canopy counts conducted showed no codling moth damage. The harvest results showed virtually no damage. It can be concluded that the paraffin emulsion mating disruption worked well in this demonstration, however, this was a low codling moth population orchard.
SJ/S County This Vina orchard is divided into a 10-acre grower standard and a 10-acre reduced-risk treatment and is a BIOS demonstration block headed by Joe Grant, Farm Advisor San Joaquin County. The summary can be viewed on Table 9. The grower standard applied chlorpyrifos for the first and second codling moth generation, and esfenvalerate for the third codling moth generation. The reduced-risk treatment made one application of Isomate C+ for the entire season. The seasonal trap counts were 4 codling moth in the reduced-risk mating disruption treatment and 652 codling moths in the grower standard. Despite the high number of codling moth, the harvest results showed very little damage sustained by codling moth. This orchard was our reduced-risk success story. This commercially available product successfilly controlled codling moth in a high population orchard on the Vina variety, which is known to have high codling moth damage. However, this orchard is a smaller stature orchard with a 25 fi. tree canopy. We do not yet know if we would get similar results in trees higher than 30 feet, which many of the PMA orchards have.
Composite Ranch The Composite Ranch in Stanislaus County contained a grower standard treatment of methyl parathion and phosmet. Table 10 summarizes the season long results. One of the reduced-risk blocks used tebufenozide for the first generation of codling moth and then was broken into two smaller treated areas of phosmet and methyl parathion. The seasonal trap catches were high, suggesting the need for broad-spectrum pesticides. The dropped nut assessment for the overwintering generation suggests the tebufenozide is adequately controlled the codling moth. However, the canopy counts suggests a different view. The grower standard shows no damage at canopy counts whereas the reduced-risk treatments show some infestation at the June canopy count. At the July canopy counts, the tebufenozide treated block had 11% infestation. Due to the high infestation, a conventional chemical was applied to the tebufenozide treatments. The tebufenozide treatment was divided into two separate treatments, one receiving an application of phosmet and the other receiving an application of methyl parathion. The final canopy counts taken two weeks after the chemical applications show a dramatic decrease in codling moth infestation. This shows that the canopy counts can be used to predict the need for a broad-spectrum insecticide. The grower standard had the least amount of damage at harvest. The tebufenozide treated with phosmet and methyl parathion showed 5.5% and 3.4% codling moth damage respectively. The grower standard had 0.2% codling moth damage.
11
Fresno County This Vina cultivar orchard had a low codling moth population, very little nut drop, no damage at the two canopy counts, and therefore virtually no damage at harvest. An orchard summary of results can be seen on Table 11. The reduced-risk treatments concluded no codling moth damage and the grower standard had 0.2% damage. Seven aerial applications of Trichogramma were applied. However, due to the low population, the impact in this orchard is largely unknown. This orchard is an ideal candidate for successful mating disruption program.
Kings County This Serr orchard comprises of approximately 16 acres of grower standard and three reduced-risk treatments. This orchard consists of trees 50 fi tall. A full s u m m a r y can be found on Table 12. These reduced-risk treatments are: 12 acres of tebufenozide applied by air and by ground plus Trichogramrna, and chlorpyrifos, 4 acres of tebufenozide Trichogramma, and 5 acres of tebufenozide applied by ground only, Trichogramma, and the grower standard had a chlorpyrifos for the third generation. AI1 the Trichogramma were applied 4 times for the second generation of codling moth, Harvest samples were taken on only two of the reduced-risk treatments. This orchard had a high codling moth population. Nut drop and canopy count assessments were similar across all treatments. Canopy counts showed a substantial codling moth increase in the last generation. If Trichogrmma had been applied for the 3d generation, damage may have been held. The grower was concerned about the costs of 8 applications of Trichogramma. The harvest between the three different treatments was also very similar, supporting that a high population is difficult to treat not only with reduced-risk treatments but also with conventional chemicals. Applications of broad- spectrum insecticides late in the season were not able to decrease codling moth damage.
Tulare County 1 This is a forty-acre Serr orchard; twenty was grower standard and twenty for reduced-risk practices. Tulare County 1 summary is on Table 13. The grower standard treatment was two applications of tebufenozide by air and by ground, and azinphos-methyl by air and by ground for second codling moth generation. Tebufenozide by air and by ground accompanied by four applications of aerially applied Tvichogramma was the treatment for the reduced-risk treatment. Despite the high numbers of codling moth in the traps, there was no damage in the nut drop, in the canopy count taken late in the season, or in the harvest samples. This orchard is an example of successfidly using tebufenozide in a moderate codling moth population with good spray coverage using ground and aerial applications.
Tulare County 2 Tulare County 2 had a high seasonal trap count as seen on Table 14. The nut drop assessments showed the reduced-risk treatment of parafin emulsion to have three times as many codling moth infested dropped nuts as the grower standard. This difference was also seen in the canopy counts. The reduced-risk treatment had considerably more infestation than the grower standard treatment and therefore an application of chlorpyrifos was applied on 8/4. The harvest samples showed infestations in the reduced-risk treatments far greater than the grower standard treatment. The paraflin emulsion alone was not able to control the high codling moth population.
12
Discussion
The orchards using Param emulsion with supplemental sprays, including a chemical application when necessary:
e Butte County 0 Contra Costa County e Tehama County e San Joaquin County e Yuba County, D- 10 e Tulare County 2
Those with low codling moth populations were Butte County, Tehama County, and San Joaquin County. These orchards also have relatively low amounts of damage at harvest in the grower standard. However, Yuba County D-10, Contra Costa County, and Tuiare County 2 all had relatively high populations and sustained codling moth damage at harvest. The Tulare 2 orchard had a supplemental spray applied late in the season was unable to reduce the damage to an acceptable level. Paraffin emulsion, still has a potential tool for mating disruption, especially in taller tree canopies. However, the product is not ready for large-scale use in Commercial orchards. There are formulation and application issues that require more research before re-introducing this technology back into commercial settings. All but the San Joaquin orchard had to apply supplemental sprays in order to adequately control codling moth. Several orchards should have been sprayed but the cooperator wanted to see the full impact of the reduced-risk practice.
Orchards using Isomate C+ as a reduced-risk mating disruption option: Yuba County, Bear River SJ/S in Stanislaus County
Both of these orchards had low codling moth damage at harvest. The trees in both orchards were under 25 feet allowing better dispersal of Isomate C+ throughout the canopy. The trap counts in these mating disruption sites were shut down when compared to grower standards indicating that the mating disruption was working. The SJ/S orchard had one of the higher seasonal long trap catches of all the orchards. Results fiom this orchard will serve as the foundation for the 2000 work plan.
Orchards using Consep Checkmate as a reduced-risk mating disruption option: Yuba County, D-10
Despite the two applications of Checkmate per season, a supplemental treatment of Bt was applied to half of the Checkmate treatment. The additional BT spray did decrease the damage numerically. In the checkmate treatments the trap catches were not shut down indicating that we were not getting adequate mating disruption for control. Even though the growers grade sheets showed almost no damage from this block, the harvest sample shows that the codling moth population increased over the season. This would indicate that with continued use the grower might eventually see damage.
Orchards using a combination of tebufenozide and Trichogrammaplatneri: Butte County e Kings County
e Contra Costa County e Tulare 1 e Stanislaus County
13
Coverage is the primary issue when applying tebufenozide. It is known that Trichogramma works better in low population orchards and three of these orchards had high populations. The orchards with high codling moth populations, Contra Costa and Kings County, sustained codling moth damage at the end of the season. The Stanislaus orchard did not have damage at harvest but canopy counts indicated a spray was needed to prevent substantial damage. The July Trichogrummu applications were then canceled. The Contra Costa County orchard did not make bvo tebufenozide treatments for the 1” generation, which may have also contributed to the harvest damage. The two blocks that successfully used this treatment were Butte County with a low codlig moth population and Tulare 1 orchard with excellent spray coverage.
The key to successfully implementing reduced-risk practices is heavy reliance on monitoring to indicate population levels of codling moth and the need to resort to stronger insecticides. For any of this strategies to work the codling moth population must be low and must be maintained at a low level, None of these strategies except with great expense to the grower will bring the population level d o h . The 2000 work plan will develop a strategy for growers to use mating disruption successfully in high population and to maintain low populations when applied year after year.
OBJECTIVE 3: TO DEMONSTRATE REDUCED-RISK STRATEGIES TO CONTROL WALNUT BLIGHT, x4NTHoMoNAS CMPESTRLS
Introduction
Walnut blight caused by the bacteria Xanthomonas campestris continues to be a destructive disease for California commercial walnut production. Fortunately for walnut growers, 1999 was not a particularly severe blight year. The low incidence of spring rainfall resulted in relatively low disease pressure, which made it difficult to evaluate treatment efficacy.
Materials and Methods
Ten orchards were surveyed during the winter of 1998-1999 by collecting dormant walnut buds (Table 15). Bioassays of these buds were conducted for the presence of the walnut blight bacteria at the Dr. Steve Lindow’s laboratory at University of California, Berkeley for:
Percent of buds containing walnut blight bacteria The amount of bacteria colony forming units (CFU) in the buds and The level of copper resistance in each orchard surveyed.
Farm advisors used this information to advise their cooperating growers of the risk level to walnut blight in their orchards and to recommend treatment strategies based on this level. The lack of rainfall this spring produced very little walnut blight. Consequently, no orchard surveyed had any significant level of walnut blight infection. This project will have to continue several years to fully measure its impact.
14
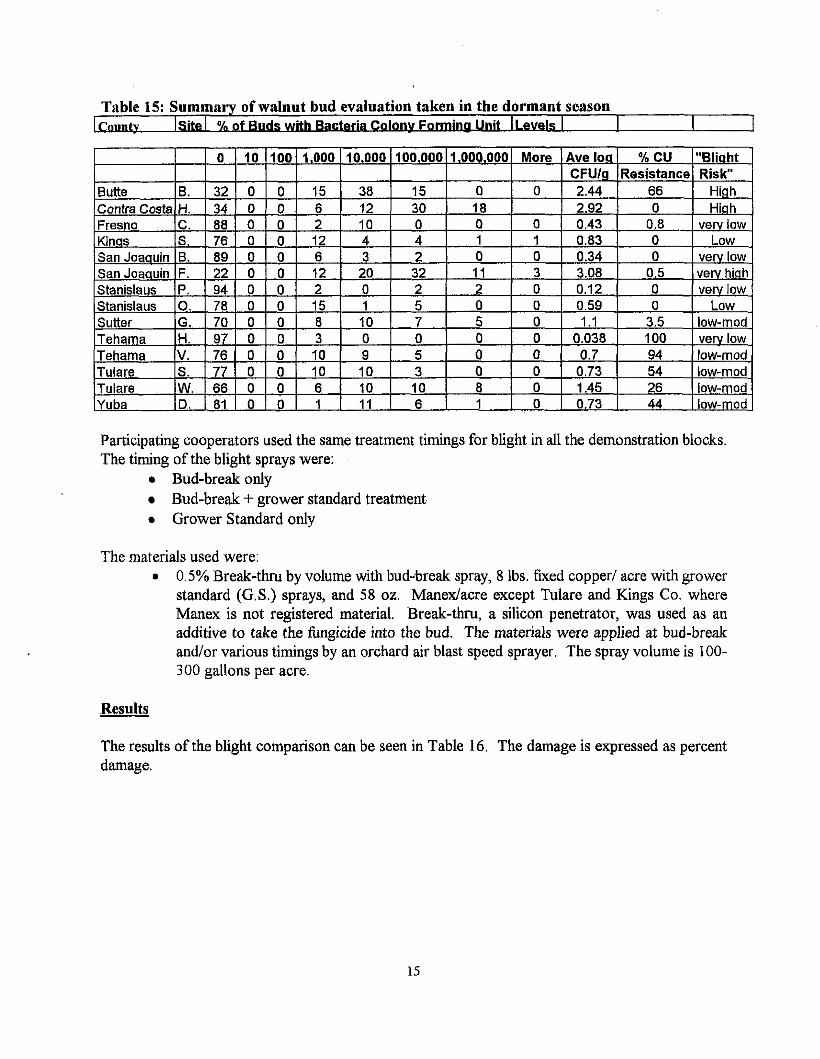
Table 15: Summary of walnut bud evaluation taken in the dormant season Site 0, of Unit I1 evels I I I 1
1 I 0 I 10 11001 1,000 ~10.000~100.000~1.000.000~ More lAve loa] % CU I"Bliaht ]
Participating cooperators used the same treatment timings for blight in all the demonstration blocks The timing of the blight sprays were:
Bud-break only Bud-break + grower standard treatment. Grower Standard only
The materials used were: 0.5% Break-thru by volume with bud- break spray, 8 Ibs. fixed copped acre with grower standard (G.S.) sprays, and 58 oz. Manedacre except Tulare and Kings Co. where Manex is not registered material. Break-thru, a silicon penetrator, was used as an additive to take the hngicide into the bud. The materials were applied at bud-bred and/or various timings by an orchard air blast speed sprayer. The spray volume is 100- 300 gallons per acre.
Results
The results of the blight comparison can be seen in Table 16. The damage is expressed as percent damage.
15
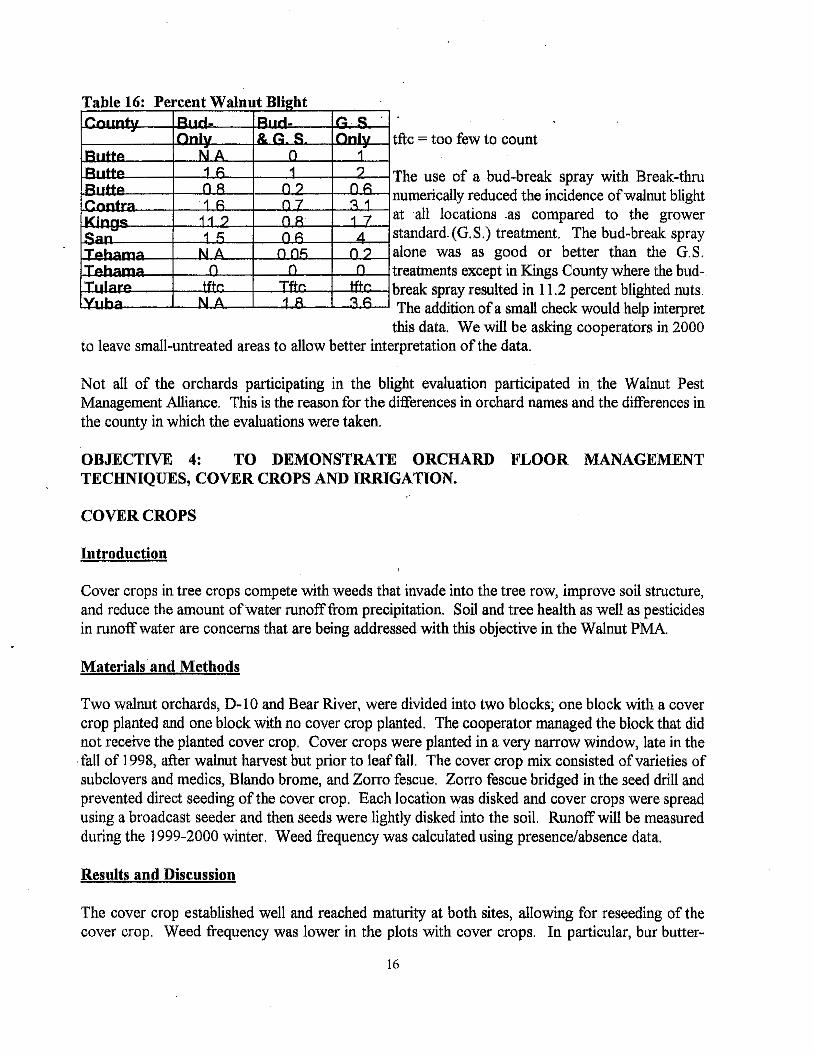
tftc = too few to count
The use of a bud-break spray with Break-thru numerically reduced the incidence ofwalnut blight at -all locations .as compared to the grower standard. (G.S.) treatment. The bud-break spray alone was as good or better than the G.S. treatments except in Kings County where the bud- break spray resulted in 11.2 percent blighted nuts. The addition of a small check would help interpret this data. We will be asking cooperators in 2000
to leave small-untreated areas to allow better interpretation of the data.
Not all of the orchards participating in the blight evaluation participated in the Walnut Pest Management Alliance. This is the reason for the differences in orchard names and the differences in the county in which the evaluations were taken.
OBJECTIVE 4: TO DEMONSTRATE ORCHARD FLOOR MANAGEMENT TECHNIQUES, COVER CROPS AND IRRIGATION.
COVER CROPS
Introduction
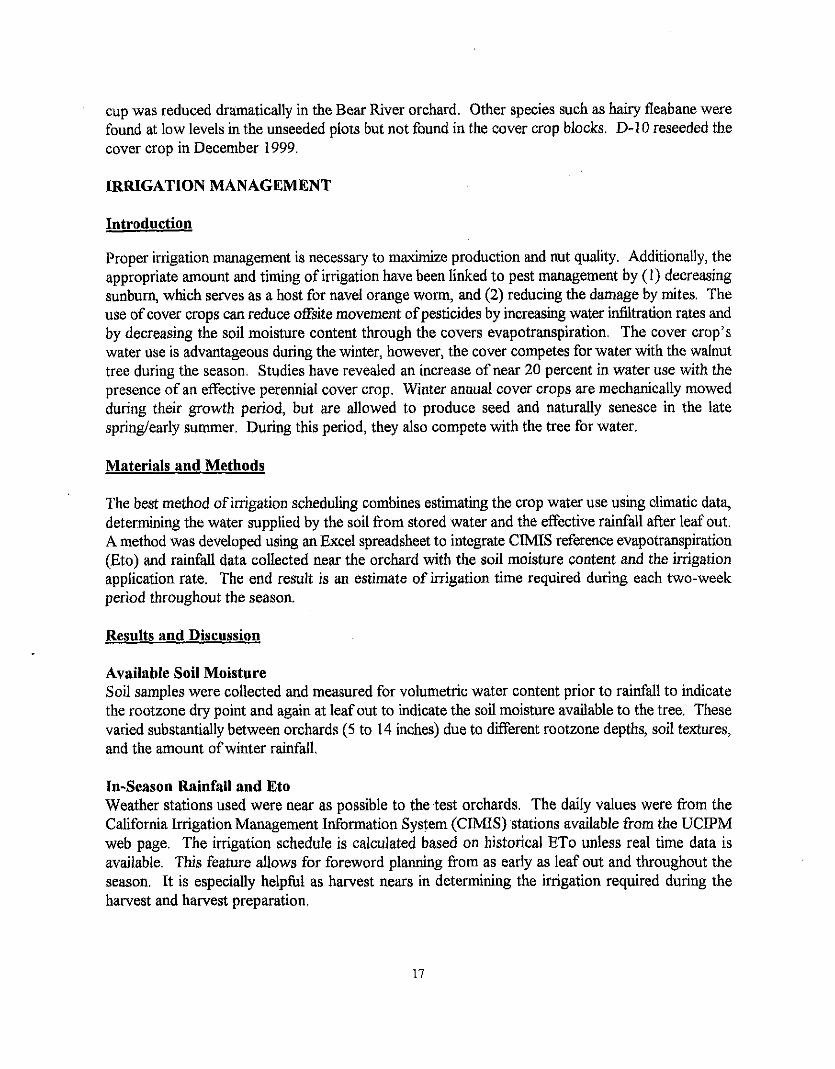
Cover crops in tree crops compete with weeds that invade into the tree row, improve soil structure, and reduce the amount of water runoff from precipitation. Soil and tree health as well as pesticides in runoff water are concerns that are being addressed with this objective in the Walnut PMA.
Materials and Methods
Two walnut orchards, D-10 and Bear River, were divided into two blocks; one block with a cover crop planted and one block with no cover crop planted. The cooperator managed the block that did not receive the planted cover crop. Cover crops were planted in a very narrow window, late in the .fall of 1998, after walnut harvest but prior to leaf fall. The cover crop mix consisted of varieties of subclovers and medics, Blando brome, and Zorro fescue. Zorro fescue bridged in the seed drill and prevented direct seeding of the cover crop. Each location was disked and cover crops were spread using a broadcast seeder and then seeds were lightly disked into the soil. Runoff will be measured during the 1999-2000 winter. Weed frequency was calculated using presence/absence data.
Results and Discussion
The cover crop established well and reached maturity at both sites, allowing for reseeding of the cover crop. Weed frequency was lower in the plots with cover crops. In particular, bur butter-
16
cup was reduced dramatically in the Bear River orchard. Other species such as hairy fleabane were found at low levels in the unseeded plots but not found in the cover crop blocks. D-10 reseeded the cover crop in December 1999.
IRRIGATION MANAGEMENT
Introduction
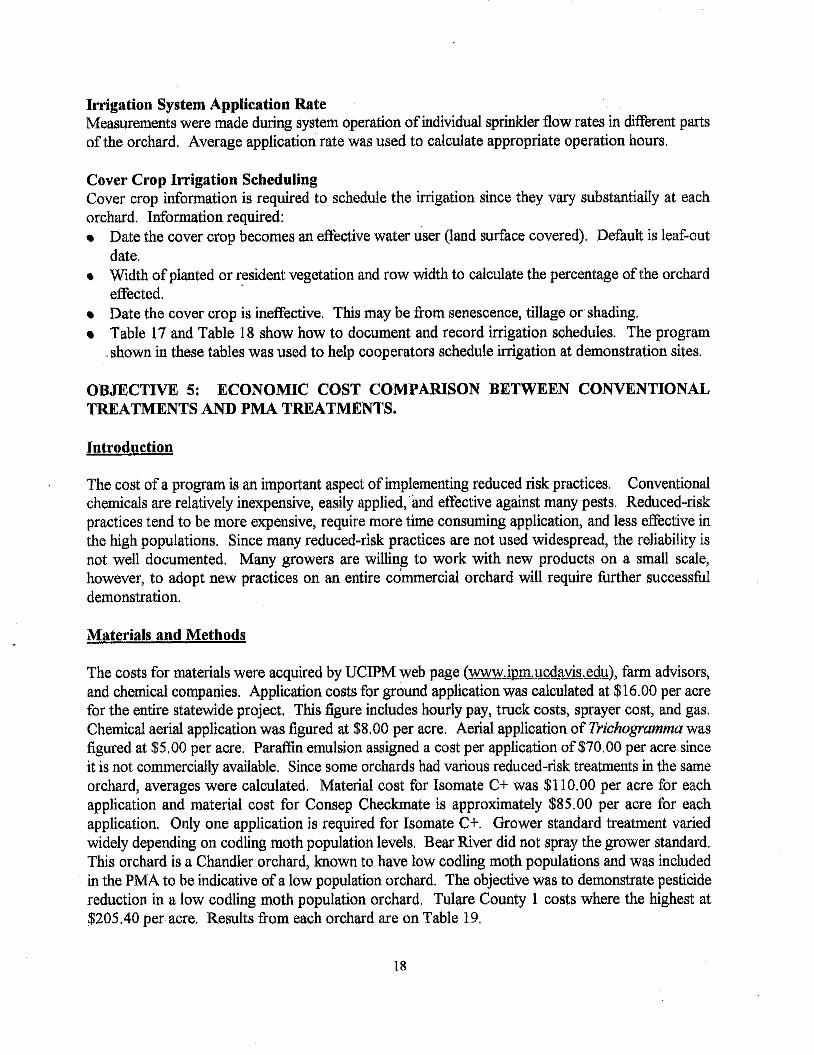
Proper irrigation management is necessary to maximize production and nut quality. Additionally, the appropriate amount and timing of irrigation have been linked to pest management by (1) decreasing sunburn, which serves as a host for navel orange worm, and (2) reducing the damage by mites. The use of cover crops can reduce offsite movement ofpesticides by increasing water infiltration rates and by decreasing the soil moisture content through the covers evapotranspiration. The cover crop’s water use is advantageous during the winter, however, the cover competes for water with the walnut tree during the season. Studies have revealed an increase of near 20 percent in water use with the presence of an effective perennial cover crop. Winter annual cover crops are mechanically mowed during their growth period, but are allowed to produce seed and naturally senesce in the late spring/early summer. During this period, they also compete with the tree for water.
Materials and Methods
The best method of irrigation scheduling combines estimating the crop water use using climatic data, determining the water supplied by the soil from stored water and the effective rainfall after leaf out. A method was developed using an Excel spreadsheet to integrate CIMIS reference evapotranspiration (Eto) and rainfall data collected near the orchard with the soil moisture content and the irrigation application rate. The end result is an estimate of irrigation time required during each two-week period throughout the season.
Results and Discussion
Available Soil Moisture Soil samples were collected and measured for volumetric water content prior to rainfall to indicate the rootzone dry point and again at leaf out to indicate the soil moisture available to the tree. These varied substantially between orchards (5 to 14 inches) due to different rootzone depths, soil textures, and the amount ofwinter raidall.
In-Season Rainfall and Eto Weather stations used were near as possible to the.test orchards. The daily values were from the California Irrigation Management Information System (CIMIS) stations available from the UCIPM web page. The irrigation schedule is calculated based on historical ET0 unless real time data is available. This feature allows for foreword planning from as early as leaf out and throughout the season. It is especidy helpful as harvest nears in determining the irrigation required during the harvest and harvest preparation.
17
Irrigation System Application Rate Measurements were made during system operation of individual sprinkler flow rates in different parts of the orchard. Average application rate was used to calculate appropriate operation hours.
Cover Crop Irrigation Scheduling Cover crop information is required to schedule the irrigation since they vary substantially at each orchard. Information required:
Date the cover crop becomes an effective water u'ser (land surface covered). Default is leaf-out
Width of planted or resident vegetation and row width to calculate the percentage of the orchard
Date the cover crop is ineffective. This may be from senescence, tillage or shading. Table 17 and Table 18 show how to document and record irrigation schedules. The program
date.
effected.
shown in these tables was used to help cooperators schedule irrigation at demonstration sites.
OBJECTIVE 5: ECONOMIC COST COMPARISON BETWEEN CONVENTIONAL TREATMENTS AND PMA TREATMENTS.
Introduction
The cost of a program is an important aspect of implementing reduced risk practices. Conventional chemicals are relatively inexpensive, easily applied,'and effective against many pests. Reduced-risk practices tend to be more expensive, require more time consuming application, and less effective in the high populations, Since many reduced-risk practices are not used widespread, the reliability is not well documented. Many growers are willing to work with new products on a small scale, however, to adopt new practices on an entire commercial orchard will require further successful demonstration.
Materials and Methods
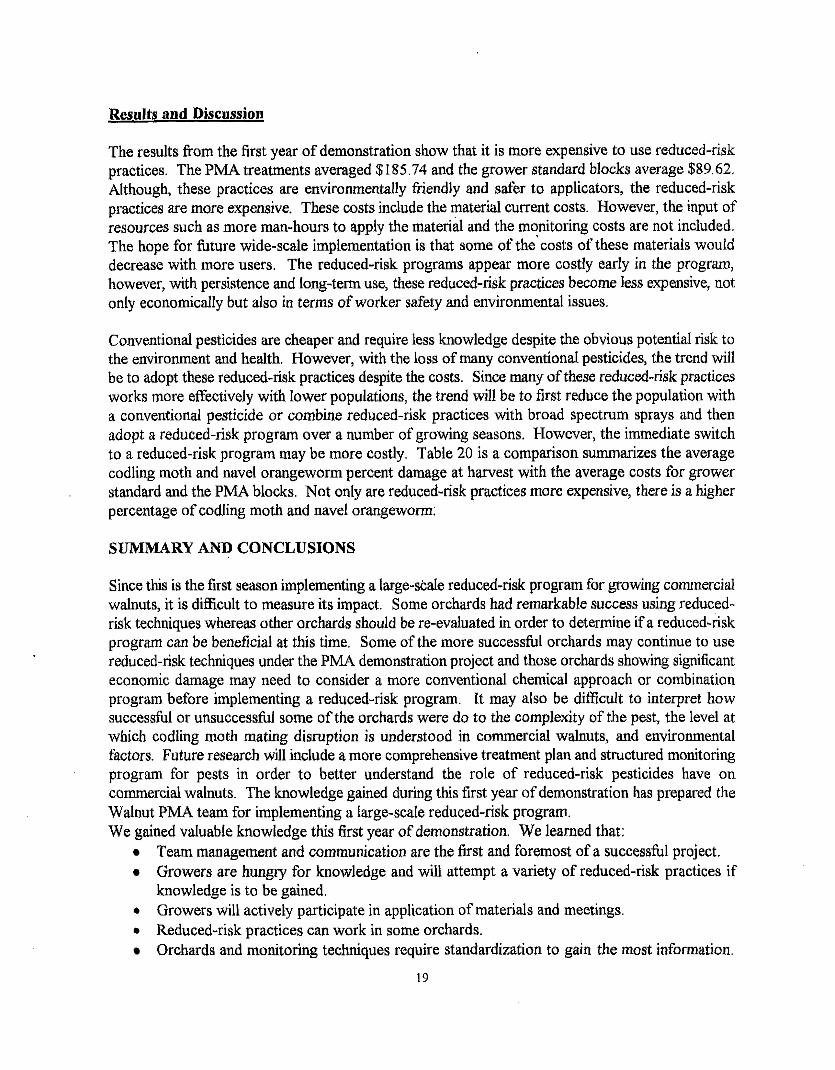
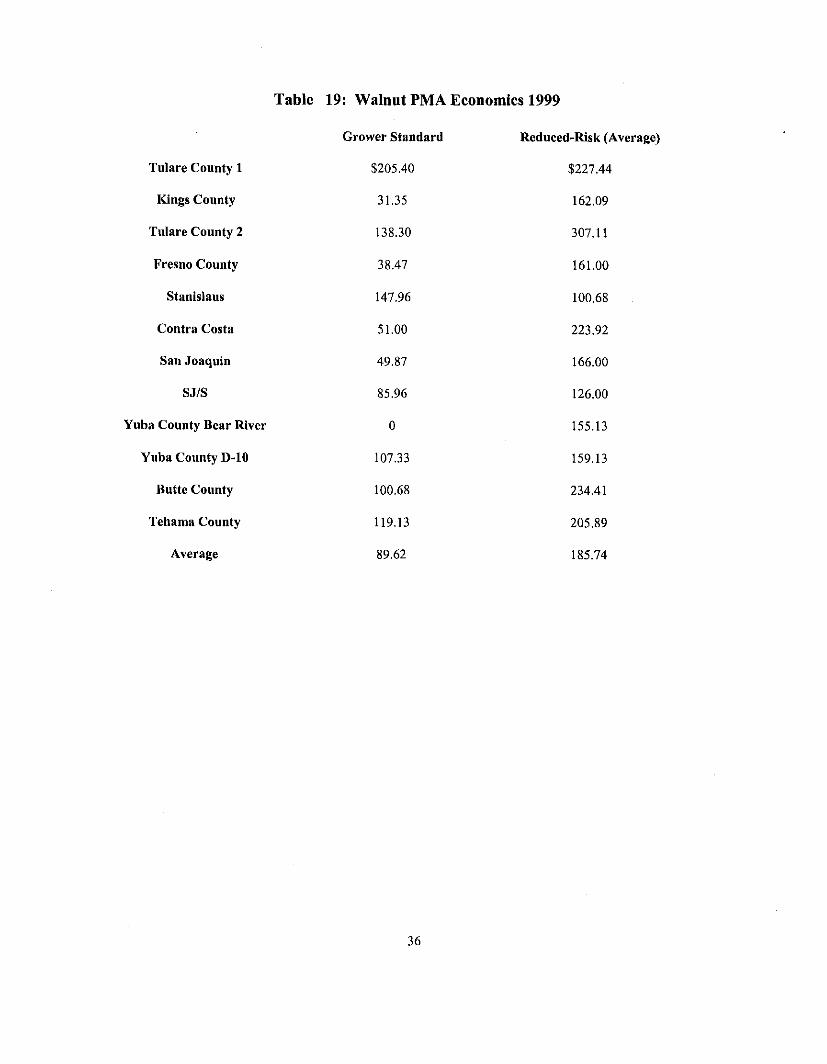
The costs for materials were acquired by UCIF" web page ( w ~ w , ~ ~ . m ~ . u c s . ~ ~ d ~ ) , farm advisors, and chemical companies, Application costs for ground application was calculated at $16.00 per acre for the entire statewide project. This figure includes hourly pay, truck costs, sprayer cost, and gas. Chemical aerial application was figured at $8.00 per acre. Aerial application of Trichogramma was figured at $5.00 per acre. Paraffin emulsion assigned a cost per application of $70.00 per acre since it is not commercially available. Since some orchards had various reduced-risk treatments in the same orchard, averages were calculated. Material cost for Isomate C+ was $110.00 per acre for each application and material cost for Consep Checkmate is approximately $85.00 per acre for each application. Only one application is required for Isomate C+. Grower standard treatment varied widely depending on codling moth population levels. Bear River did not spray the grower standard. This orchard is a Chandler orchard, known to have low codliig moth populations and was included in the PMA to be indicative of a low population orchard. The objective was to demonstrate pesticide reduction in a low codling moth population orchard. Tulare County 1 costs where the highest at $205.40 per acre. Results from each orchard are on Table 19.
18
Results and Discussion
The results kom the first year of demonstration show that it is more expensive to use reduced-risk practices. The PMA treatments averaged $185.74 and the grower standard blocks average $89.62. Although, these practices are environmentally friendly and safer to applicators, the reduced-risk practices are more expensive. These costs include the material current costs. However, the input of resources such as more man-hours to apply the materid and the monitoring costs are not included. The hope for future wide-scale implementation is that some of thecosts of these materials would decrease with more users, The reduced-risk programs appear more costly early in the program, however, with persistence and long-term use, these reduced-risk practices become less expensive, not only economically but also in terms of worker safety and environmental issues.
Conventional pesticides are cheaper and require less knowledge despite the obvious potential risk to the environment and health. However, with the loss of many conventional pesticides, the trend will be to adopt these reduced-risk practices despite the costs. Since many of these reduced-risk practices works more effectively with lower populations, the trend will be to first reduce the population with a conventional pesticide or combine reduced-risk practices with broad spectrum sprays and then adopt a reduced-risk program over a number of growing seasons. However, the immediate switch to a reduced-risk program may be more costly. Table 20 is a comparison summarizes the average codling moth and navel orangeworm percent damage at harvest with the average costs for grower standard and the PMA blocks. Not only are reduced-risk practices more expensive, there is a higher percentage of codling moth and navel orangeworm.
SUMMARY AND CONCLUSIONS
Since this is the first season implementing a large-sbale reduced-risk program for growing commercial walnuts, it is difficult to measure its impact. Some orchards had remarkable success using reduced- risk techniques whereas other orchards should be re-evaluated in order to determine if a reduced-hsk program can be beneficial at this time. Some of the more successful orchards may continue to use reduced-risk techniques under the PMA demonstration project and those orchards showing significant economic damage may need to consider a more conventional chemical approach or combination program before implementing a reduced-risk program. It may also be difficult to interpret how successful or unsuccessful some of the orchards were do to the complexity of the pest, the level at which codling moth mating disruption is understood in commercial walnuts, and environmental factors. Future research will include a more comprehensive treatment plan and structured monitoring program for pests in order to better understand the role of reduced-risk pesticides have on commercial walnuts. The knowledge gained during this first year of demonstration has prepared the Walnut PMA team for implementing a large-scale reduced-risk program. We gained valuable knowledge this first year of demonstration. We learned that:
Team management and communication are the first and foremost of a successful project. Growers are hungry for knowledge and will attempt a variety of reduced-risk practices if
0 Growers will actively participate in application of materials and meetings. 0 Reduced-risk practices can work in some orchards.
Orchards and monitoring techniques require standardization to gain the most information.
knowledge is to be gained.
19
Conventional practices using conventional chemical techniques may be required ifpopulations build to a point of economic damage.
Outlook for Year 2000 Orchards will be standardized in terms of size, cultivar, monitoring techniques and treatments.
a Demonstration sites will be reduced from twelve to seven cooperators. This will ensure proper monitoring and better communication between the team. The cover crop demonstration sites will be maintained. The management team will meet more often to improve communication between all team members.
Reduced-risk strategies are important to pursue due to the loss of many conventional treatments. By joining forces with Biologically Integrated Orchard Systems (BIOS), UC Researchers, Farm Advisors, Industry Leaders, Pest Control Advisor, and the walnut growers, the introduction and adoption of reduced-risk practices will become more widely accepted.
20
REFERENCES
Bentley, W., J. Hasey, L. Hendricks, W. H. Olson, C. Pickel, G. S. Sibbett, and R. VanSteenwyk. 1999. Walnut Pest Management Guidelines. UCIPM, pub. Dec. 1999.
Buchner, R. P., W. H. Olson, C. Gilles and N. Shawareb. 2000. Walnut Blight Control Investigations. Walnut Research Reports 1999. Walnut Marketing Board.
Mills, N. J., R Buchner, L. Dixon, J. Edstrom, J. Hasey, W. Krueger, W. Olson, and C. Pickel. 1998. Trzchogramma augmentation as a component of the management of codliig moth in walnuts. Walnut Research Reports 1998. Walnut Marketing Board.
Mills, N. J., W. Bentley, R. Buchner, L. Dixon, W.Olson, C. Pickel, W. Rei1 and S. Sibbett. 1999. Importing Parasitoids for Areawide Management of Codling Moth in Walnuts. Walnut Research Reports 1998. Walnut Marketing Board.
Mills, N. J., W. Bentley, M. Bezemer, R. Buchner, W. Olson, C. Pickel, W. Reil, and S. Sibbett. 2000. Importing Parasitoids for Areawide Management of Codling Moth in Walnuts. Walnut Research Reports 1999. Walnut Marketing Board.
Mills, N. J., W. Bentley, M. Bezemer, M. Bianchi, R. Buchner, J. Caprile, B. Coates, J. Edstom, J. Hasey, L. Hendrix, B. Holtz, B. Krueger, W. 0lson;C. Pickel, W. Rei1 and S. Sibbett. 2000. Walnut Susceptibility to Codling moth Damage: Cultivars and Orchards. Walnut Research Reports 1999. Walnut Marketing Board.
Pickel, C., W. Bentley, N. Mills, W. Olson, R. Buchner, N. Darby, and L. Martin. 1999. Investigations in Long-Term Codling Moth Management in Walnuts. Walnut Research Reports 1998. Walnut Marketing Board.
21
LIST OF PUBLICATIONS PRODUCED
Bentley, W., C. Pickel and T. Prichard. 1999. Walnut Pest Management Alliance Completes First Year. Nut Grower Magazine. Oct. 1999, p. 17.
Bentley, W., C. Pickel, B. Olson, N. Mills, and L. Martin. 2000. Investigations in Long-Term Management of Codling Moth in Walnuts. Walnut Research Reports 1999. Walnut Marketing Board.
W. Bentley, C. Pickel, T. Prichard,.W. H. Olson, R. Buchner, J. Grant, T. Prather, M. Gibbs, and B. Elliott. 2000. Walnut Pest Management Alliance: First Year Demonstration Project for 1999. Walnut Research Reports 1999. Walnut Marketing Board.
Lindow, S. E., B. Teviotdale, R. Buchner, B. Olson, S. Sibbett, L. Hendricks, B. Beede, A. Haxo, and S . Magnard. 2000. Epidemiological Approaches to the Control of Walnut Blight Disease. Walnut Research Reports 1999. Walnut Marketing Board.
22
I Grower Std 7 Acres
Paraffin Emulsion -!- Bt
5 Acres
Tebnfenozide + Trichogramma
5 Acres
Control (8 single trees)
I
c
Treatment
518 Asana lOoz/acre
5/28 Asana 10 ozlacre
6/28 Tebufenozide 16 ozlacre PE applied 4/1 to 4/13
5/28, 7/2,7/12, 8116,8123
Bt 1 lblacre
511,5128 Tebufenozide 16
ozlacre
7/2,7/9,7/16,7/23,7/30 8/6,8/13,8/19
Trichogramma
No Spray
Nut Drop (6/17-
2.0 7/21)
- 8.8
- 6.6
- 11.6
7iety Canopy Counts
5/28 0%
814 0.2%
5/28 0.4%
814 0.6%
~
5/28 0%
814 1.4%
5/28 .13%
814 2.4%
Harvest '/o Damage
CM .9%
NOW 0%
CM 3.2%
NOW 0%
CM 1.6%
NOW .2%
CM 3.5%
NOW 0%
Seasonal Trap
Counts lx only
256
305
191
Mastrus Release
9/14/98 2000
Mastms
9/14/98 2000
Mastrus
23
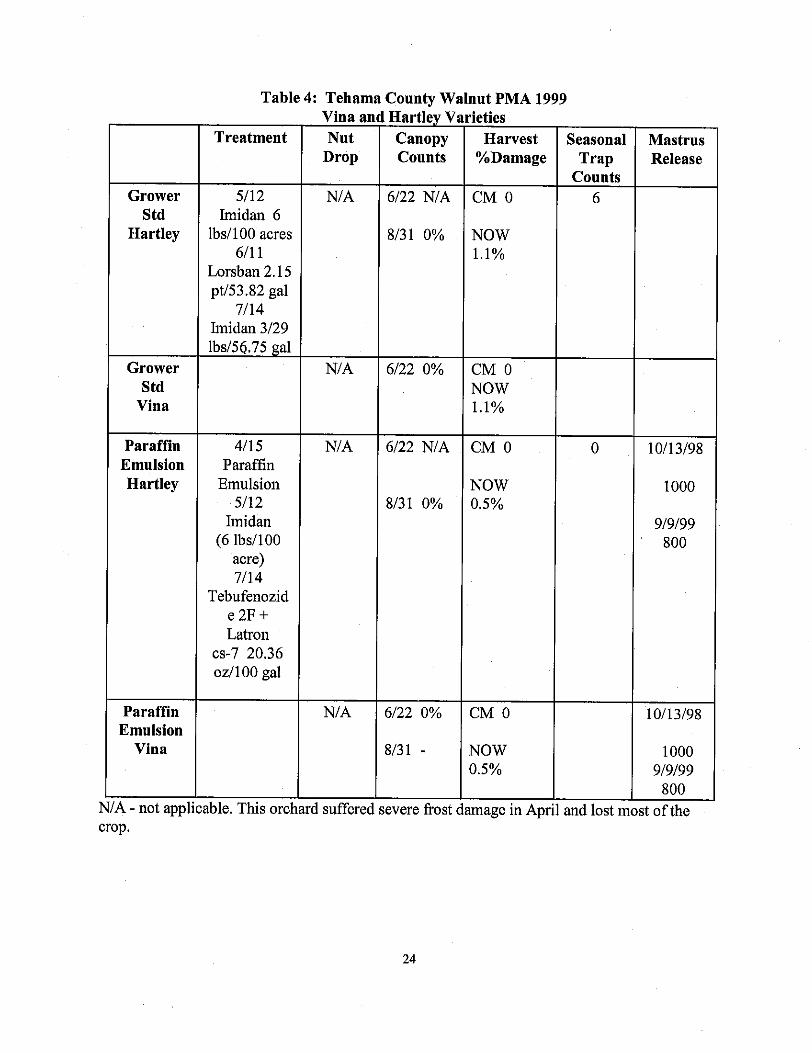
Table 4: Tehama County Walnut PMA 1999
Grower Std
Hartley
Grower Std
Vina
Paraffin Emulsion Hartley
Paraffin Emulsion
Vina
\ - not appl
Treatment
5/12 Imidan 6
lbsI100 acres 611 1
Lorsban 2.15 ptl53.82 gal
711 4 Imidan 3/29 lbsl56.75 gal
411 5 Paraffin
Emulsion 5/12
Imidan (6 lbs/lOO
acre) 7/14
Tebufenozid e 2 F + Latron
oz/lOO gal CS-7 20.36
Vina a1 Nut
Drop
N/A
N/A
N/A
I Hartley V Canopy counts
6/22 N/A
8/31 0%
6/22 0%
6/22 N/A
8/31 0%
6/22 0%
8/31 -
:evere frost
rieties Harvest
%Damage
CM 0
NOW 1.1%
CM 0 NOW 1.1%
CM 0
NOW 0.5%
CM 0
NOW 0.5%
mage in Apr
Seasonal Trap
counts 6
0
Mastrus Release
10/13/98
1000
9/9/99 800
10/13/98
1000 9/9/99
800
crop.
24
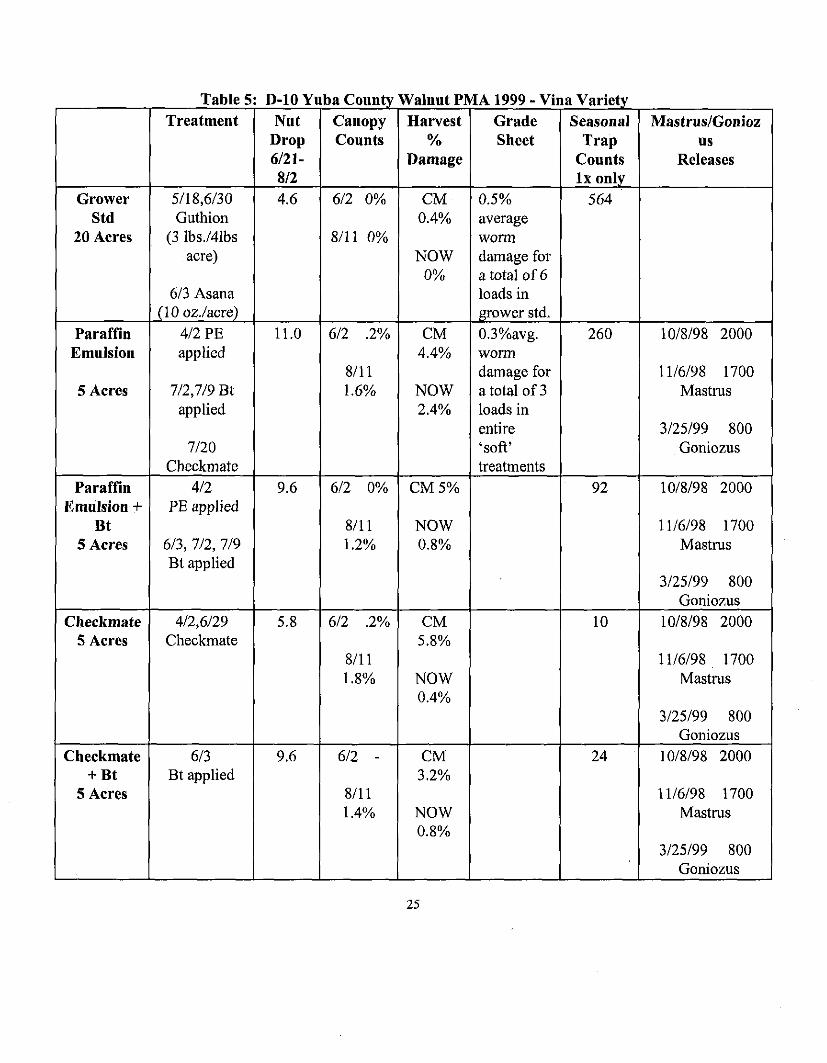
Table 5: D-10 Y
61‘21-
Std Guthion
acre)
6/3 Asana ~
Paraffin 4/2 PE 11.0 Emulsion applied
5 Acres 7/2,7/9 B t applied
7/20 Checkmate
Emulsion + PE applied
5 Acres 613, 7J2, 719 Bt applied
Paraffin 4/2 9.6
Bt
Checkmate 1 412,6129 1 5.8 5 Acres Checkmate
Checkmate 613 9.6 + Bt Bt applied
5 Acres
Counts Damage
6/2 0%
8/11 0% 0.4%
NOW 0%
4.4%
1.6% NOW 2.4%
612 0% CM5%
8/11 NOW 1.2% 0.8%
612 .2% CM 5.8%
8/11 1.8% NOW
0.4%
6/2 - CM 3.2%
8/11 1.4% NOW
0.8%
Sheet Trap us Counts Releases 1 x only
0.5% 564 average
damage for a total of 6 loads in grower std. 0.3Y0avg. 260 1 OM98 2000
damage for 11/6/98 1700 a total of 3 Mastrus loads in entire 3/25/99 800 ‘soft’ Goniozus treatments
worm
worm
92 10/8/98 2000
11/6/98 1700 Mastrus
3/25/99 800 Goniozus
10 10/8/98 2000
11/6/98 , 1700 Mastrus
3/25/99 800 Goniozus
24 10/8/98 2000
11/6/98 1700 Mastrus
3/25/99 800 Goniozus
25
Grower Std 15 Acres
Isomate C+ 15 Acres
(400 per Acre)
Trichogramm a
15 Acres (8 releases)
Table 6: Yuba County Walnut PMA 1999 Bear River
Chaudk
(6122- 8/13)
No treatment
Isomate C+
712 1,7128,. 2.7 8/3,8/10,8/17,8/24
912,917
Variety Canopy Harvest Seasonal Mastrus Counts % Trap Release
Damage Counts lx only
8/16 0% 0% 57
9/24/98 0% 2500 .'"- .l% 9/24/98
26
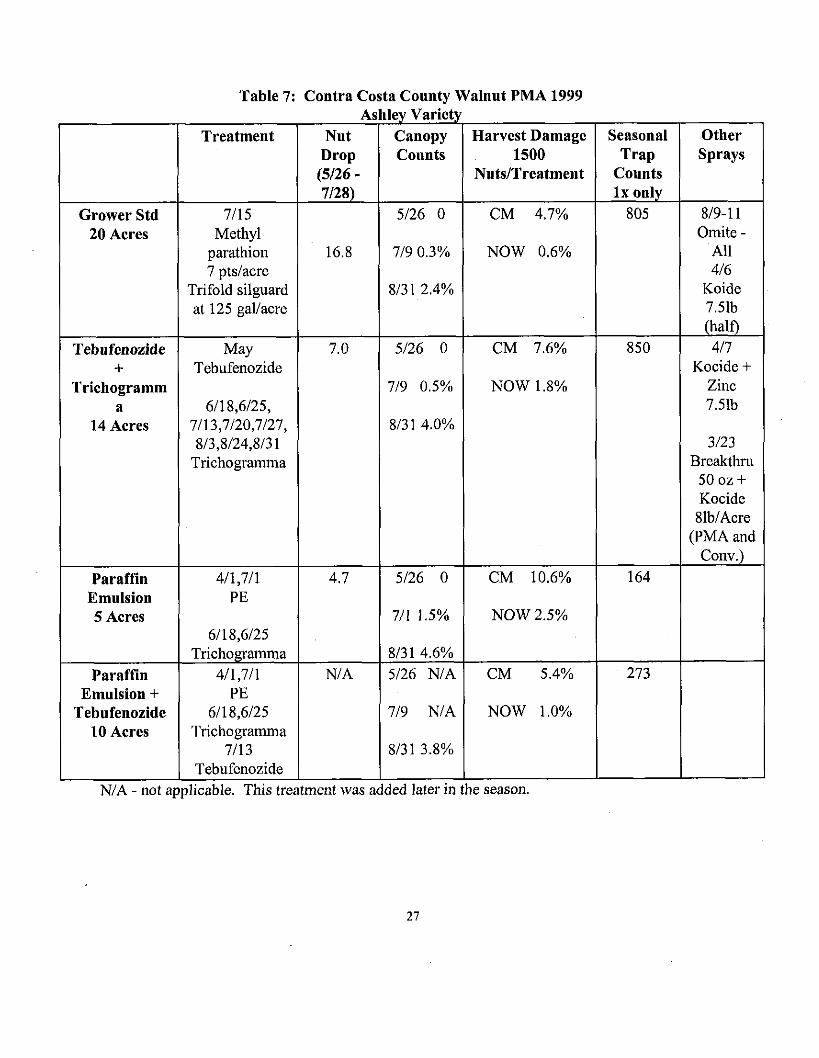
Table 7: Contra Costa Counts Walnut PMA 1999
Grower Std 20 Acres
Tebufenozide +
Trichogramm a
14 Acres
Paraffin Emulsion 5 Acres
Paraffin Emulsion +
Tebufenozide 10 Acres
N/A - not a
Treatment
7/15 Methyl
parathion 7 pts/acre
Trifold silguard at 125 gallacre
May Tebufenozide
6118,6125, 7113,7120,7127, 8/3,8/24,8/3 1
Trichogramma
411,711 PE
6118,6125 Trichogramma
411,711 PE
6118,6125 Trichogramma
1/13 Tebufenozide
Counts (5126 - NutdTreatment
5/26 0 CM 4.7%
16.8 I 719 0.3% I NOW 0.6%
8131 2.4%
5/26 0 CM 7.6%
719 0.5% NOW 1.8%
8/31 4.0%
711 1.5% NOW2.5%
8/31 4.6% NIA 5/26 NIA CM 5.4%
719 NIA NOW 1.0%
8/31 3.8%
Seasonal Trap
Counts l x only
805
850
164
273
Other Sprays
819-1 1 Omite -
All 4/6
Koide 7.51b (half) 417
Kocide + Zinc 7.51b
3/23 Breakthru
50 oz + Kocide 8lblAcre
(PMA and Conv.)
21
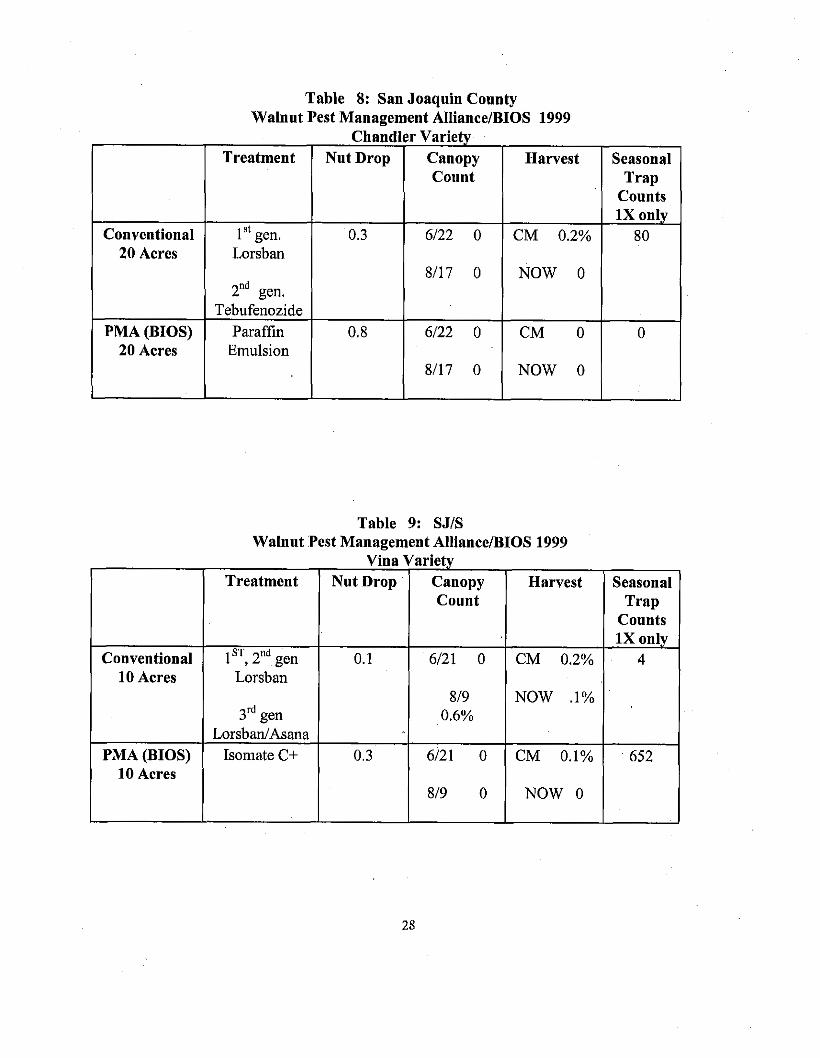
Table 8: San Joaquin County Walnut Pest Management Alliance/BIOS 1999
Chandler Variety Treatment
1X only Counts
Seasonal Harvest Canopy Nut Drop Count Trap
Conventional 80 CM 0.2% 6/22 0 0.3 1'' gen. 20 Acres
Tebufenozide Y d gen.
Lorsban 8/17 0 NOW 0
PMA (BIOS) 0 CM 0 6/22 0 0.8 Paraffin 20 Acres Emulsion
8/17 0 NOW 0
Table 9: SJIS Walnut Pest Management Alliance/BIOS 1999
Vina Variety Treatment Seasonal Harvest Canopy Nut Drop
Count Trap Counts 1X only
Conventional 1 , 2 gen Lorsban 10 Acres
4 CM 0.2% 6/21 0 0.1 ST nd
819 NOW .1% 3Td gen 0.6%
LorsbadAsana PMA (BIOS) 652 CM 0.1% 6/21 0 0.3 Isomate C+
10 Acres 819 0 NOW 0
28
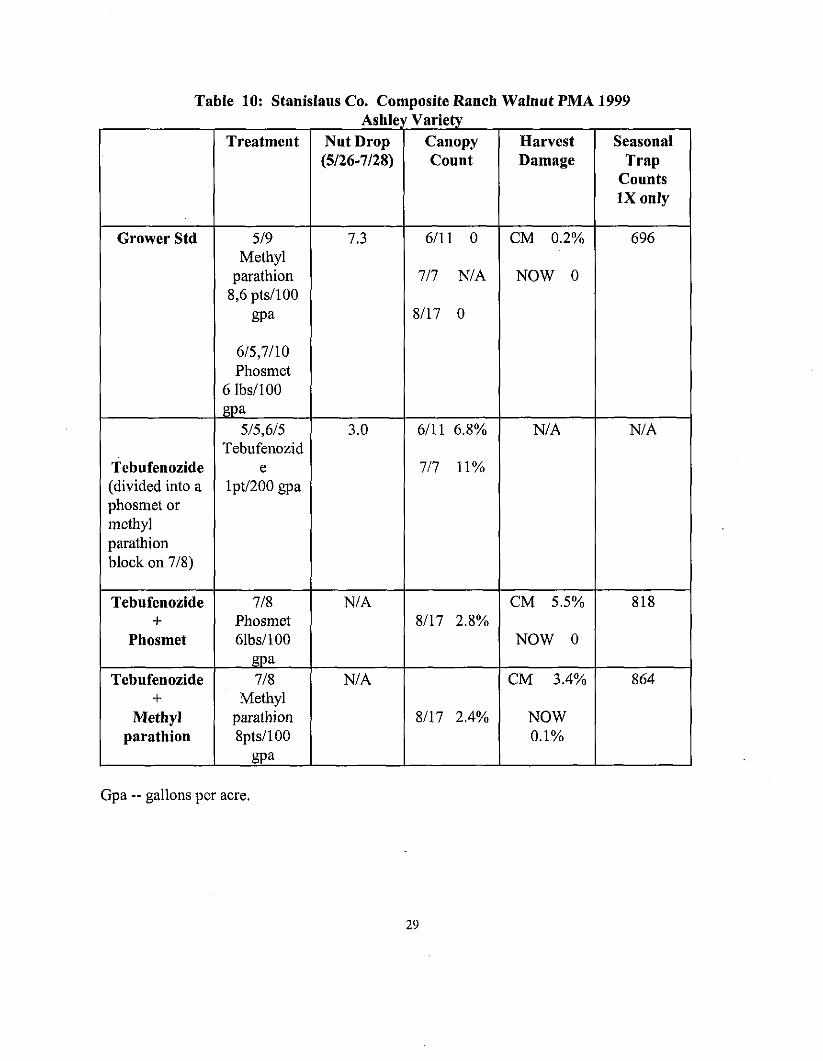
Table 10: Stanislaus Co. Comoosite Ranch Walnut PMA 1999 Ash11
(5/26-7/28)
Grower Std Methyl
parathion 8,6 ptsI100
@a
6/5,7/10 Phosmet
6 lbsllOO gpa
Tebufenozid Tebufenozide e :divided into a lpt/200 gpa 3hosmet or nethyl 3arathion dock on 718)
Tebufenozide 718 N/A
515,615 3.0
+ Phosmet Phosmet 61bs/100
Tebufenozide Methyl
Methyl parathion parathion
'i"-- e Varie Canopy count
6/11 0
717 N/A
8/17 0
6/11 6.8%
717 11%
8/17 2.8%
Harvest Damage
CM 0.2%
NOW 0
N/A
CM 5.5%
NOW 0
CM 3.4%
NOW 0.1%
Seasonal Trap
counts 1x only
696
N/A
818
864
Gpa -- gallons per acre.
29
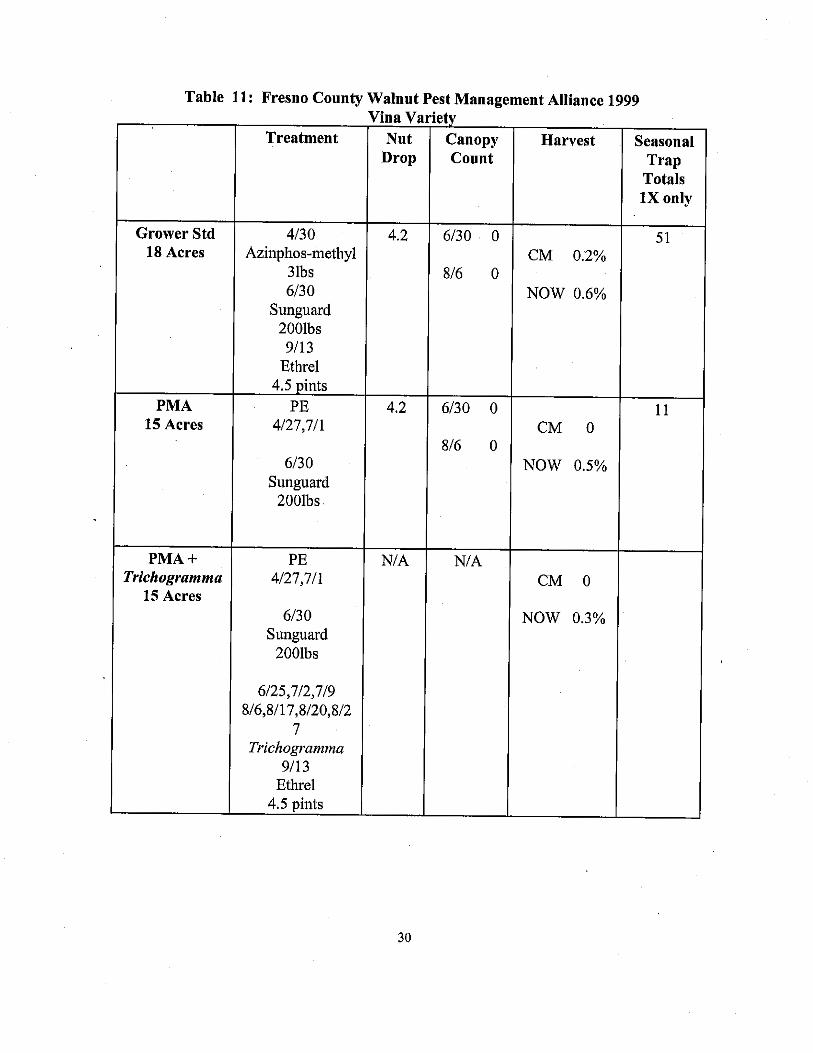
Table 11: Fresno Count:
Grower Std 18 Acres
PMA 15 Acres
PMA + rrichogramma
15 Acres
Treatment
4/30 Azinphos-methyl
31bs 6/30
Snnguard 2001bs 9/13
Ethrel
4127,711
6130 Sunguard
2001bs
PE 4127,711
613 0 Sunguard
2001bs
6125,712,719 i/6,8/17,8/20,8/2
7 Trichogramma
911 3 Ethrel
4.5 pints
Valnnt Pest Management Alliance 1999 Tina Vr
Nut Drop
4.2
4.2
N/A
-
wit T
:ty Canopy Count
6/30 0
816 0
6/30 0
816 0
N/A
Harvest
CM 0.2%
NOW 0.6%
CM 0
NOW 0.5%
CM 0
NOW 0.3%
Seasonal Trap
Totals 1X only
51
11
30
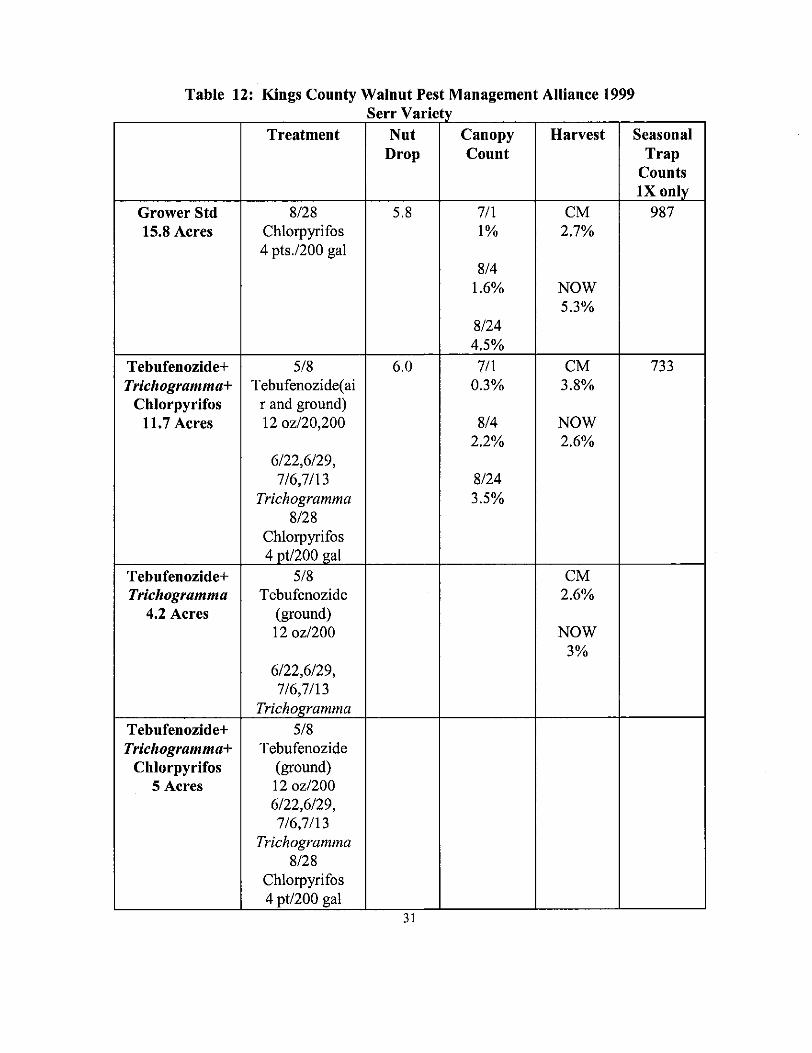
Table 12: Kings County Walnut Pest Management Alliance 1999
15.8 Acres
Tebufenozide+ Trichogrammat
Chlorpyrifos 11.7 Acres
I Tebufenozide+ Trichogramma
4.2 Acres
r Tebufenozide+ Trichogrammat
Chlorpyrifos 5 Acres
Treatment
8/28 Chlorpyrifos 4 pts.1200 gal
518 Tebufenozide(ai
r and ground) 12 02120,200
6122,6129, 716,7113
Trichogramma 8/28
Chlorpyrifos 4 pt1200 gal
518 Tebufenozide
(ground) 12 021200
6122,6129, 716,7113
Trichogramma 518
Tebufenozide
12 0z1200 6122,6129, 716,7113
Trichogramma 8/28
Chlorpyrifos 4 pt1200 gal
(ground)
err Vari' Nut
Drop
5.8
6.0
31
i
Canopy Count
71 1 1%
814 1.6%
8/24 4.5% 71 1
0.3%
814 2.2%
8/24 3.5%
Harvest
CM 2.7%
NOW 5.3%
CM 3.8%
NOW 2.6%
CM 2.6%
NOW 3%
Seasonal Trap
Counts 1X only
987
733
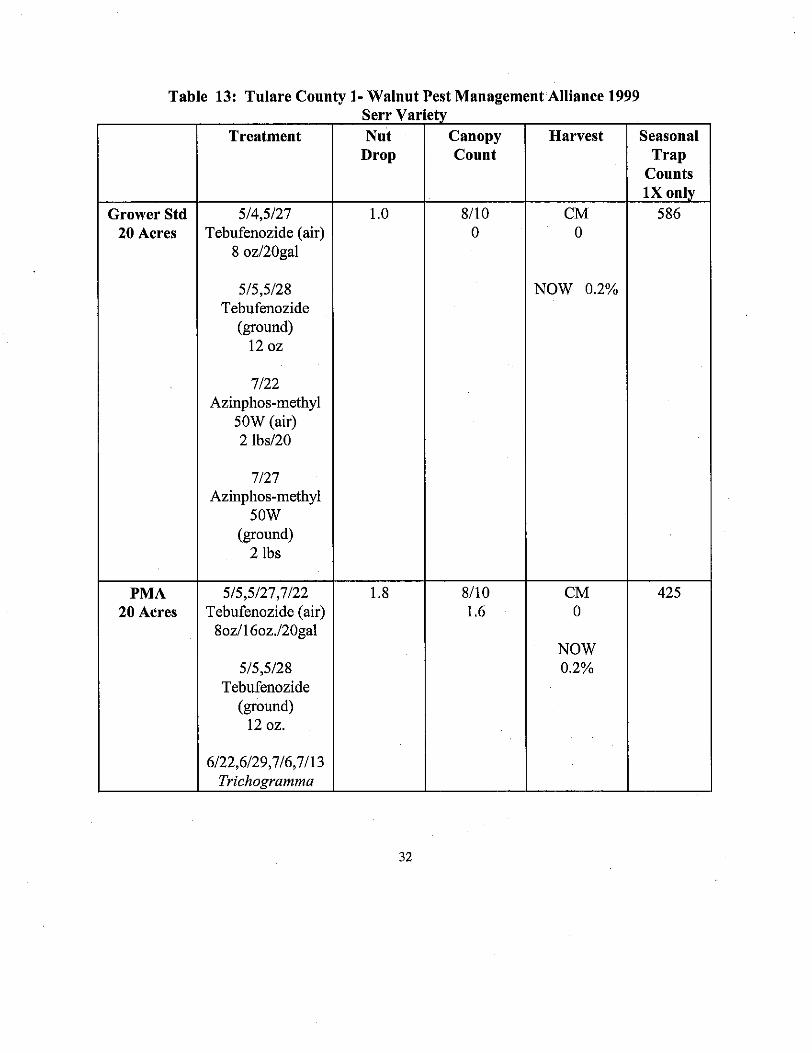
Table 13: Tulare County 1- Walnut Pest Management Alliance 1999
Grower Std 20 Acres
PMA 20 Acres
Treatment
514,5127 Tebufenozide (air)
8 ozl20gal
515,5128 Tebufenozide
12 oz
7122 Azinphos-methyl
50W (air) 2 lbs120
7127 Azinphos-methyl
50W (ground)
2 lbs
(ground)
515,5127,7122 Tebufenozide (air) 8ozI16oz.120gal
515,5128 Tebufenozide
12 oz.
6122,6129,716,7113 Trichogramma
(ground)
Serr Val Nut
Drop
1 .o
1.8
L Canopy Count
8110 0
8110 1.6
Harvest
CM 0
NOW 0.2%
CM 0
NOW 0.2%
Seasonal Trap
Counts 1X only
586
425
32
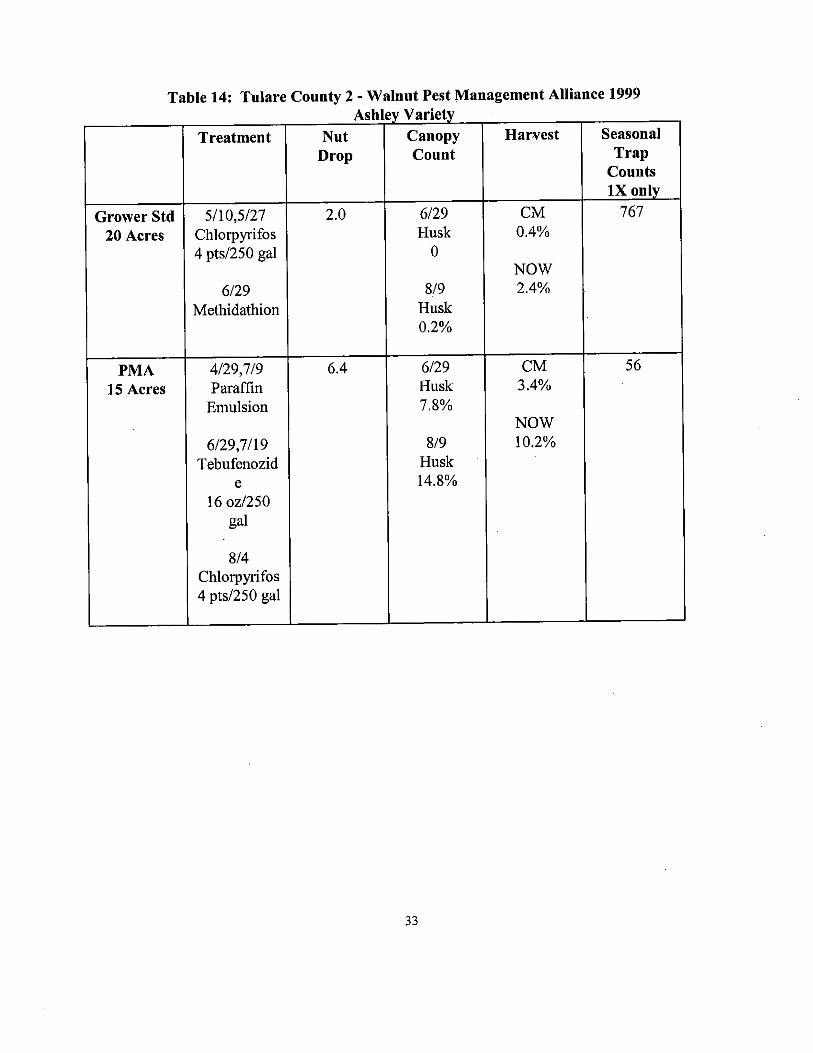
Table 14: Tulare County 2 - Walnut Pest Management Alliance 1999 Ash
Treatment Drop Nut
Grower Std 2.0 5/10,5/27 20 Acres
4 ptd250 gal Chlorpyrifos
6/29 Methidathion
4129,719 Paraffin
Emulsion
6/29,1/19 Tebufenozid
e 16 0~1250
gal
8/4 Chlorpyrifos 4 ptsI250 gal
6.4
Variety Canopy count
6/29 Husk
0
819 Husk 0.2%
6/29 Husk 7.8%
8/9 Husk 14.8%
Harvest
CM 0.4%
NOW 2.4%
CM 3.4%
NOW 10.2%
Seasonal Trap
counts 1x only
161
56
33
I II I I I I lCalculated Application Rate 0.005)lnlhr woss
~
I I I1 when done type the result into cell F40
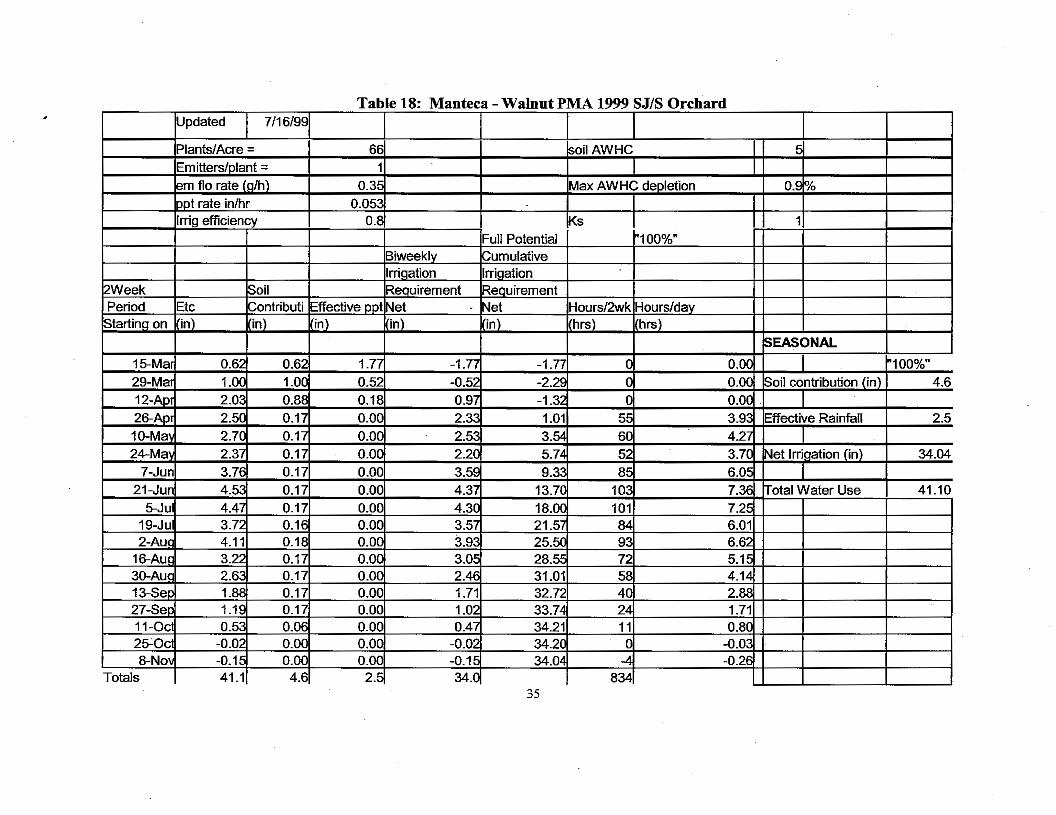
Table 18: Manteca -Walnut PiVlA 1999 SJ/S Orchard
35
Tulare County 1
Kings County
Tnlare County 2
Fresno County
Stanislaus
Contra Costa
San Joaquin
S JIS
Yuba County Bear River
Yuba County D-10
Butte County
Tehama County
Average
Table 19: Walnut PMA Economics 1999
Grower Standard Reduced-Risk (Average)
$205.40 $221.44
31.35 162.09
138.30 307.11
38.47 161.00
147.96 100.68
51.00 223.92
49.87 166.00
85.96 126.00
0
107.33
100.68
119.13
89.62
155.13
159.13
234.41
205.89
185.74
36
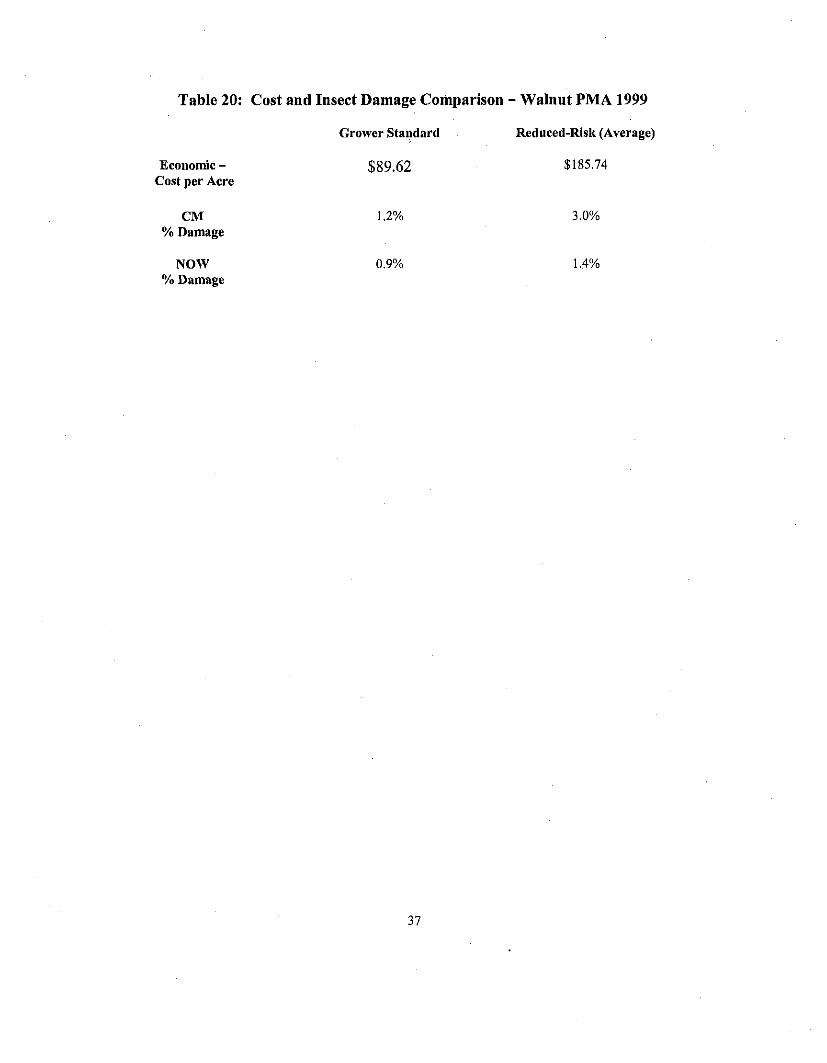
Table 20: Cost and Insect Damage Comparison -Walnut PMA 1999
Cost per Acre Economic -
CM % Damage
NOW YO Damage
Grower Standard Reduced-Risk (Average)
$89.62 $185.74
1.2% 3.0%
0.9% 1.4%
37
APPENDIX I
Walnut Pest Management Alliance Field Meetings Announcement
3s
APPENDIX I1
Walnut PMA Notes in California Walnut Commission, Fall Report, 1999-2000, October 1999. Fall 1999:vol3.
39
APPENDIX 111
Allied Forces in Diamond of California, News and Review, Summer 1999, Environmental Stewardship.
40