Embed Size (px)
Citation preview

U . S . D e p a r t m e n t o f E d u c a t i o n
February 2017
Making an Impact
A randomized experiment using absenteeism information
to “nudge” attendance
Todd Rogers Harvard Kennedy School
Teresa Duncan ICF International
Tonya Wolford School District of Philadelphia
John Ternovski Shruthi Subramanyam
Harvard Kennedy School
Adrienne Reitano School District of Philadelphia
Key findings
This randomized controlled trial, conducted in collaboration with the School District of Philadelphia, finds that a single postcard that encouraged guardians to improve their student’s attendance reduced absences by roughly 2.4 percent. Guardians received one of two types of message: one encouraging guardians to improve their student’s attendance or one encouraging guardians to improve their student’s attendance that also included specific information about the student’s attendance history. There was no statistically significant difference in absences between students according to which message their guardians received. The effect of the postcard did not differ between students in grades 1–8 and students in grades 9–12.
At ICF International

Institute of Education Sciences Thomas W. Brock, Commissioner for Education Research Delegated the Duties of Director
National Center for Education Evaluation and Regional Assistance Audrey Pendleton, Acting Commissioner Elizabeth Eisner, Acting Associate Commissioner Amy Johnson, Action Editor Felicia Sanders, Project Officer
REL 2017–252
The National Center for Education Evaluation and Regional Assistance (NCEE) conducts unbiased large-scale evaluations of education programs and practices supported by federal funds; provides research-based technical assistance to educators and policymakers; and supports the synthesis and the widespread dissemination of the results of research and evaluation throughout the United States.
February 2017
This report was prepared for the Institute of Education Sciences (IES) under Contract ED-IES-12-C-0006 by Regional Educational Laboratory Mid-Atlantic administered by ICF International. The content of the publication does not necessarily reflect the views or policies of IES or the U.S. Department of Education, nor does mention of trade names, commercial products, or organizations imply endorsement by the U.S. Government.
This REL report is in the public domain. While permission to reprint this publication is not necessary, it should be cited as:
Rogers, T., Duncan, T., Wolford, T., Ternovski, J., Subramanyam, S., & Reitano, A. (2017). A randomized experiment using absenteeism information to “nudge” attendance (REL 2017– 252). Washington, DC: U.S. Department of Education, Institute of Education Sciences, National Center for Education Evaluation and Regional Assistance, Regional Educational Laboratory Mid-Atlantic. Retrieved from http://ies.ed.gov/ncee/edlabs.
This report is available on the Regional Educational Laboratory website at http://ies.ed.gov/ ncee/edlabs.

Summary
Reducing student absenteeism is a key part of the School District of Philadelphia’s plan to boost graduation rates. One of the district’s goals is to increase guardians’ awareness of absenteeism, with the hope that greater awareness will lead to guardians’ taking a more active role in improving their student’s attendance and academic performance.
In an effort to increase guardians’ awareness of absenteeism, the School District of Philadelphia partnered with Regional Educational Laboratory (REL) Mid-Atlantic to conduct a randomized controlled trial, which is based on the principles of “nudge” theory. Nudge theory is an approach used in the behavioral sciences that involves unobtrusive interventions to promote desired behaviors (Thaler & Sunstein, 2008). In this study the “nudge” was a single postcard sent to guardians to test whether it could reduce absenteeism and whether one message on the postcard had a greater impact on reducing absenteeism than another did.
In October 2014 postcards with different messages—one encouraging guardians to improve their student’s attendance and the other encouraging guardians to improve their student’s attendance and adding specific information about the child’s attendance history—were sent to the homes of students in grades 1–12 to see what impact, if any, the message would have on absenteeism through the end of December 2014. A control group received no mailings from the district. The absence information provided on the postcard was for the previous school year (2013/14).
The study found that a single postcard that encouraged guardians to improve their student’s attendance reduced absences by roughly 2.4 percent. There was no statistically significant difference in absences between students whose guardians were sent one message rather than the other. An additional analysis to examine whether there was a differential impact of the postcards on elementary versus secondary students’ absences showed that the effect of the postcard did not differ between students in grades 1–8 and students in grades 9–12.
This study has three main limitations. First, the unexpectedly large number of unique school-grade combinations limited statistical power by yielding an average of 40 students per school-grade combination. Second, students who did not have reliable mailing addresses were excluded from the study. Third, the number of school days analyzed in the study occurred within a short timeframe (there were 43 school days between October 9 and December 31). Even without any outreach from the district, the average student missed very few days of school in this timeframe. So if the average student whose household did not receive a postcard was absent for only three days of school, any intervention could reduce the average absence by a maximum of three days.
i

Contents
Summary i
Why this study? 1 Attendance and dropout 1 Engaged guardians can influence school attendance 2
What the study examined 3 Treatment conditions 3 Control group 4 Research questions 4
What the study found 5 Contacting guardians and encouraging them to improve their student’s attendance reduced
absences 5 There was no statistically significant difference in student absences between the two types of
messages 5 There was no evidence that the intervention impact varied by grade level 6
Implications of the study findings 6
Limitations of the study 7
Appendix A. Treatment materials A-1
Appendix B. Data and methods B-1
Notes Notes-1
References Ref-1
Figures 1 Absences among School District of Philadelphia students varied slightly during the study
period, October 9–December 31, 2014 5 2 Absences among School District of Philadelphia students during the study period did not
differ between grades 1–8 and grades 9–12, October 9 through December 31, 2014 6
Tables 1 Comparison of the study conditions 3 B1 Exclusion criteria B-1 B2 Total sample sizes by treatment group and absenteeism group B-3 B3 Preintervention sample sizes and characteristics for the baseline sample, pooled treatment
conditions and control group B-3 B4 Preintervention sample sizes and characteristics for the analytic sample, pooled treatment
conditions and control group B-4 B5 Preintervention sample sizes and characteristics for the analytic sample, encourage condition
and control group B-4
ii

B6 Preintervention sample sizes and characteristics for the analytic sample, encourage + self condition and encourage condition B-4
B7 Postintervention outcomes for the analytic sample and estimated effects, encouragement
B8 Postintervention outcomes for the analytic sample and estimated effects, encouragement +
B9 Postintervention outcomes for the analytic sample and estimated effects, pooled treatment
condition and control group B-5
self condition and encouragement condition B-5
conditions and control group B-6
iii

Why this study?
To benefit from instruction, students must attend school regularly. Studies show that school attendance is a strong predictor of course performance and the strongest predictor of high school dropout (Allensworth & Easton, 2007; Balfanz & Byrnes, 2012; Byrnes & Reyna, 2012; Ginsburg, Jordan, & Chang, 2014). But each year an estimated 5–7.5 million students in the United States (10–15 percent1) miss nearly a month of school (Balfanz & Byrnes, 2012; Ginsburg et al., 2014).
Attendance and dropout
Getting students to school is an essential part of reducing high school dropout rates— indeed, absenteeism is the “A” in the ABCs of individual-level predictors of school dropout (behavior problems is the “B”, and course failure is the “C”; Balfanz & Byrnes, 2012; Mac Iver & Mac Iver, 2009).2 Each day approximately 10 percent of students in the School District of Philadelphia are absent, and about half the absences are unexcused (Stoneleigh Foundation, 2013). Although the nationwide graduation rate was 81 percent during the 2012/13 school year (National Center for Education Statistics, 2015), graduation rates in large, urban districts lag behind that figure (Swanson, 2009). In the School District of Philadelphia, 57 percent of students graduate from high school in four years, and less than 20 percent of students graduate high school, enroll in college, and persist to the second year of college (School District of Philadelphia, 2015). Students who attend school less than 80 percent of the time have a 10–20 percent chance of graduating on time from high school; the likelihood of dropout increases for students who also have behavioral problems or poor course performance (Balfanz & Herzog, 2005).
Reducing student absenteeism is thus a key part of the School District of Philadelphia’s plan to boost graduation rates. One of the district’s goals is to increase guardians’ awareness of absenteeism, with the expectation that greater awareness will lead to guardians’ taking a more active role in improving their student’s attendance and academic performance. To increase guardians’ awareness of absenteeism, the district partnered with Regional Educational Laboratory (REL) Mid-Atlantic to conduct a randomized controlled trial to test whether a single postcard sent to guardians could reduce absenteeism. This study is based on the principles of “nudge” theory, an approach in the behavioral sciences that uses unobtrusive interventions to promote desired behaviors. Nudges are ways of encouraging, not mandating, change and can take different forms (Thaler & Sunstein, 2008). For example, putting fruit at eye level at shops and cafes may encourage healthier eating or sending mailers with information about one’s consumption of electricity compared with the neighborhood average may encourage conservation. The governments of the United Kingdom and the United States have established “nudge” working groups to explore how academic findings from the social and behavioral sciences can be used to design and improve public policies.
A postcard with one of two types of messages was sent in October 2014 to the homes of students in grades 1–12 during the 2014/15 school year who had had any absences the previous year (while they were in grades K–11 during the 2013/14 school year) to see what impact, if any, the message might have on absenteeism through the end of December 2014. Members of a control group did not receive a postcard. Two types of messages were tested to try to identify message content that had the greater impact on increasing guardian engagement.
A postcard with one of two types of messages was sent in October 2014 to the homes of students who had had any absences the previous year to see what impact, if any, the message might have on absenteeism
1

Engaged guardians can influence school attendance
Guardians play an important role in supporting their student’s academic success in school (Barnard, 2004; Fan & Chen, 2001; Houtenville & Conway, 2008). National task forces, federally funded parent information resource centers, and federal legislation consistently identify increased parent involvement as a central goal of education reform (National Education Goals Panel, 1999). Two recent small-scale randomized experiments designed to deliver a range of academic information to guardians of high school students showed surprisingly large increases in student attendance (Bergman, 2012; Kraft & Rogers, 2015).
The first of these studies was a randomized field experiment during a five-week summer credit recovery program in a large urban school district, in which high school students had a chance to earn credits in up to two different courses that they had failed the previous school year (Kraft & Rogers, 2015). The study recruited 435 students and their guardians to participate and randomly assigned student–guardian pairs to the positive information condition, the improvement information condition, or the control group. Those in the positive information condition received weekly text messages highlighting what the student was doing well in class (behaviorally or academically). Those in the improvement condition received weekly text messages highlighting areas where the student could improve in class (behaviorally or academically). Those in the control group did not receive any text messages. While there was no statistically significant difference in performance between the positive information and improvement information conditions, students whose guardians were in one of the treatment conditions were 6.5 percentage points (p = .048) more likely to earn a course credit than were students whose guardians were in the control group. Additionally, students whose guardians were in one of the treatment conditions had a 2.4 percentage point decrease in the likelihood of being absent on a given day compared with students whose guardians were in the control group (p = .01).
The second study examined the impact on student achievement of sending text messages to guardians whenever an assignment was due, missing, or graded (Bergman, 2012). Conducted in a high school in the Los Angeles Unified School District, the study lasted one semester and included 462 students and their guardians. Student–guardian pairs were randomly assigned to the treatment group (which received text messages) or the control group (which did not receive text messages). On average, guardians in the treatment group received a little over two text messages per week. Students whose guardians were in the treatment condition made statistically significant gains in grade point average and math standardized test scores and missed fewer classes.
Bergman (2012) and Kraft and Rogers (2015) show that providing guardians with information about their student’s academic work can affect achievement and attendance. But these two studies have several limitations. First, it is unclear why or how the information provided to guardians resulted in increased attendance because the studies used different types of messages in their communications with guardians. Second, the small, nondiverse samples and modest statistical power did not allow for inferences to be drawn about demographic groups. Third, the studies examined only guardians of high school students and not those of students in lower grade levels.
Providing guardians with comparative information might also be useful. Recent research suggests that guardians are unaware of how their student’s attendance rates compare with
Studies show that providing guardians with information about their student’s academic work can affect achievement and attendance
2

those of their classmates. Qualitative and quantitative research suggests that most guardians of students who are highly truant believe that their student’s attendance records are average or above average for their student’s grade and school (Rogers, 2014; Svenson, 1981). A pilot survey conducted in the School District of Philadelphia in spring 2014 found that 61 percent of guardians of the students in the bottom fifth in terms of attendance (missing on average 27 days of school by the time of the survey) believed that their student’s attendance rate was the same as the rate of their student’s classmates, believed that it was better than the rate of their student’s classmates, or did not know how it compared with the rate of their student’s classmates (Rogers & Feller, 2016).
The current study of the effects of different types of communications to guardians in Philadelphia—a large, diverse, urban district—addresses the limitations of prior research and can help the district identify message content that may increase productive engagement of guardians.
What the study examined
This study examined whether either of two types of messages was more effective in increasing the attendance of School District of Philadelphia elementary, middle, and high school students with higher than typical absenteeism rates. See table 1 for a summary of the study conditions and appendix A for treatment materials.
Treatment conditions
The study examined two types of messages: • Encouraging guardians to improve their student’s attendance (encouragement condi
tion). This message was intended to suggest that guardians have influence over their student’s attendance and that improving attendance is part of the guardian’s role. It included a statement about the importance of attendance and said that missing school disrupts a student’s education and that the school district needs guardians’ help in improving their student’s school attendance. Research on parent efficacy shows that the more guardians believe that they have influence over their student’s behavior, the more likely they are to try to influence that behavior. At the same time, the more guardians think that a given action is part of their role, the more likely they
Table 1. Comparison of the study conditions
This study of the effects of different types of communications to guardians in Philadelphia addresses the limitations of prior research and can help the district identify message content that may increase productive engagement of guardians
Message Control group Encouragement
condition Encouragement + self condition
Attendance matters and we need your help this year. A few absences every month can add up to weeks of lost learning over the year. Missing school, whether for excused or unexcused reasons, disrupts a student’s education.
[Student First Name] missed [Student Absences] day(s) of school last year.
You can play a big role in improving [Student First Name]’s attendance. If you have questions, please call…
No postcards were sent to the control group
No postcards were sent to the control group
No postcards were sent to the control group
✔
✔
✔
✔
✔
Note: See appendix A for treatment materials.
Source: Authors’ summary.
3

are to try to perform that role (Hoover-Dempsey & Sandler, 1997). Little research has explored ways to influence how guardians think about their roles in their student’s academic success. Given the limited communication that guardians receive from schools (Herrold & O’Donnell, 2008), it is possible that this simple encouragement could influence how guardians think about their roles. This condition tests whether a simple encouraging statement can “nudge” the behavior of guardians.
• Providing guardians with specific and personalized data about their student’s attendance history (encouragement + self condition). This message included a statement about the importance of attendance, said that missing school disrupts a student’s education and that the school district needs guardians’ help in improving their student’s school attendance, and informed the guardian of the number of school days their student missed during the previous school year. Factual information about their student’s attendance record might change some guardians’ inaccurate perceptions of how often their student has missed school (Rogers, 2014). Additionally, the message had the potential to heighten guardians’ perceptions that people were monitoring them and their student’s attendance. Research on accountability effects shows that under many conditions, people conform to the expectations of those monitoring them (Lerner & Tetlock, 1999).
The messages were delivered by postcards that were mailed home as a supplement to the school report card (in contrast to the Bergman, 2012 and Kraft & Rogers, 2015 studies, which sent text messages). At the School District of Philadelphia, guardians’ home addresses are more available and accurate than guardians’ cell phone numbers. Sent through bulk mailing services, each postcard cost approximately $0.22.
Control group
Members of the control group did not receive a postcard.
Research questions
The study addressed three research questions:
1. Does contacting guardians and encouraging them to improve their student’s attendance reduce absences? (Encouragement condition and encouragement + self condition compared with control group)
2. Does communicating to guardians the total number of days that their student has missed reduce absences? (Encouragement + self condition compared with encouragement condition)
3. Does the effect of the postcards differ between students in grades 1–8 and students in grades 9–12?
The first two research questions are confirmatory and test the differences between the two treatment conditions and the control group. The third research question is exploratory and examines whether the effects of either treatment condition differ by student grade level. Because this study took place during fall 2014, the attendance information sent to guardians represented the number of absences during the previous school year.
This study examined whether either of two types of messages was more effective in increasing the attendance of elementary, middle, and high school students with higher than typical absenteeism rates
4
A multilevel mixed-effects linear regression with control covariates was used to statistically model the impact of the postcards. Students were nested within schools. See appendix B for a description of the data sources and outcomes and a summary of the steps taken to create the sample.
What the study found
This section presents the study findings on the effects of different messages on student absenteeism in terms of the raw number of days absent and the percentage reduction in absences.3
Contacting guardians and encouraging them to improve their student’s attendance reduced absences
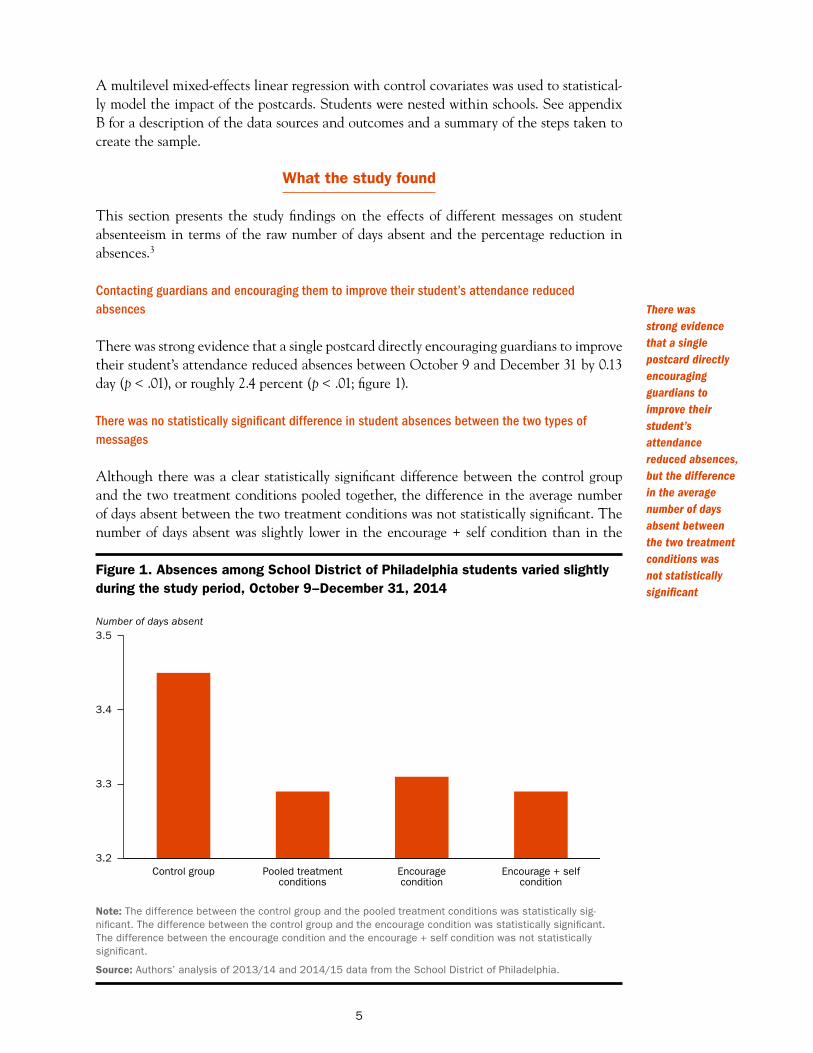
There was strong evidence that a single postcard directly encouraging guardians to improve their student’s attendance reduced absences between October 9 and December 31 by 0.13 day (p < .01), or roughly 2.4 percent (p < .01; figure 1).
There was no statistically significant difference in student absences between the two types of messages
Although there was a clear statistically significant difference between the control group and the two treatment conditions pooled together, the difference in the average number of days absent between the two treatment conditions was not statistically significant. The number of days absent was slightly lower in the encourage + self condition than in the
Figure 1. Absences among School District of Philadelphia students varied slightly during the study period, October 9–December 31, 2014
Number of days absent 3.5
3.4
3.3
3.2 Control group Pooled treatment Encourage Encourage + self
conditions condition condition
Note: The difference between the control group and the pooled treatment conditions was statistically significant. The difference between the control group and the encourage condition was statistically significant. The difference between the encourage condition and the encourage + self condition was not statistically significant.
Source: Authors’ analysis of 2013/14 and 2014/15 data from the School District of Philadelphia.
There was strong evidence that a single postcard directly encouraging guardians to improve their student’s attendance reduced absences, but the difference in the average number of days absent between the two treatment conditions was not statistically significant
5

encourage condition, but the difference was not statistically significant (0.04 day, p = .361, or 1.4 percent lower, p = .086). Communicating to guardians the total number of days that their student missed school had no greater effect on absences than did a simple message that attendance is important.
There was no evidence that the intervention impact varied by grade level
There was no evidence that the postcard affected the attendance of students in grades 1–8 differently from how it affected the attendance of students in grades 9–12 (p = 0.322). The difference in the average number of days absent between the pooled treatment conditions and the control group varied by grade level: 0.13 day for grades 1–8 and 0.23 day for grades 9–12 (figure 2). The average number of days absent was more than one day greater among students in grades 9–12 than among students in grades 1–8 (see figure 2). But there is no differential impact of the postcards on attendance across grade levels—the difference between the pooled treatment conditions and the control group at the elementary school (grades 1–8) level was similar to the difference between the pooled treated conditions and control group at the secondary school (grades 9–12) level.
Implications of the study findings
The results of this study indicate that communicating with guardians about attendance reduces student absences and could be a powerful tool for educators and school leaders. However, further research is necessary. Studying multiple rounds of mailings over a longer time period could improve understanding of the impact of messaging content on student absences, of any cumulative effect of multiple messaging, and of differences between the
Figure 2. Absences among School District of Philadelphia students during the study period did not differ between grades 1–8 and grades 9–12, October 9 through December 31, 2014
Number of days absent 5.5
4.5
3.5
2.5
1.5
Control group Pooled treatment Control group Pooled treatment conditions conditions
Grades 1–8 Grades 9–12
Note: The difference in impact between grades 1–8 and grades 9–12 was not significant.
Source: Authors’ analysis of 2013/14 and 2014/15 data from the School District of Philadelphia.
There was no evidence that the postcard affected the attendance of students in grades 1–8 differently from how it affected the attendance of students in grades 9–12
6

effects of messages on elementary and secondary school students, if any. The current study aimed to raise guardian awareness of absenteeism at the onset of the following school year by using information on absences from the previous year. However, shifting the sending of the messages to later in the school year and focusing on absences from the current school year could be more compelling.
The main finding of this study was that a single postcard directly encouraging guardians to improve their student’s attendance reduced absences by 0.13 day or roughly 2.4 percent. While this effect may not seem large, missing school for even part of a day matters because any time out of school reduces a student’s opportunity to learn (National Forum on Education Statistics, 2009). Indeed, the importance of maximizing time in school is shown in school attendance and antitruancy policies: school districts track not only full day absences, but also partial absences and tardies; antitruancy laws place a heavy emphasis on students skipping classes, not just full days. The fact that a $0.22 postcard could have a positive impact on attendance is noteworthy.
Future research might examine out-of-school time in greater detail to assess the time unit for counting attendance (such as minutes, hours, periods, or days; see National Forum on Education Statistics, 2009). For example, REL Mid-Atlantic partnered with Spring Cove School District in Pennsylvania to examine and automate the tallying of instruction time lost because of unexcused tardies. Unexcused minutes of lost instruction quickly add up to lost hours and days of instruction, and simple counts of unexcused tardiness or early pickups do not precisely measure the amount of instruction lost (Schoeneberger & Tate, 2016). The Every Student Succeeds Act of 2015 requires states to report chronic absenteeism rates for schools and to use federal dollars to train school staff in reducing absenteeism. Understanding the different types of absenteeism (excused, unexcused, partial day), the degree of absenteeism (instructional time lost), and patterns of absenteeism (for example, chronic class-cutting because of bullying or because of conflict between teacher and student) can help define the appropriate interventions—including, perhaps, the appropriate messaging—to reduce absenteeism.
Limitations of the study
This study had three main limitations.
First, it lacked statistical power to find significant differences between treatment conditions or grade levels. The study included approximately 51,000 students, or about 40 percent of the population of the School District of Philadelphia. These students attended 217 regular-status schools and were part of 1,290 unique school-grade combinations (for example, all eligible grade 2 students at Franklin Elementary School). This unexpectedly large number of unique school-grade combinations limited statistical power by yielding an average of 40 students per school-grade combination. Including additional variables to statistically adjust for student- and school-level characteristics reduced the power to find significant differences between treatment conditions or grade levels.
Second, students who did not have reliable mailing addresses were excluded from the study. Therefore, the study was unable to address student homelessness and foster care status. Although the study team attempted to identify data sources that included homelessness or
The fact that a $0.22 postcard could have a positive impact on attendance is noteworthy
7

foster care status, the data were not readily available, and the information that was available was underreported and not current.
Third, the number of school days analyzed in the study occurred within a short timeframe (there were 43 school days between October 9 and December 31). Even without any outreach from the district, the average student missed very few days of school in this time. So if the average student whose household did not receive a postcard was absent for only three days of school, any intervention could reduce average absence by a maximum of three days.
8

Appendix A. Treatment materials
This appendix provides samples of the postcards sent to study participants in the treatment conditions.
Exterior of all postcards
The School District of Philadephia Office of Research and Evaluation 440 N. Broad St. 2nd Floor, Portal A Philadelphia, PA 19130
To the Parent/Guardian of: [Student First Name] [Student Last Name] [Address] [City], [State] [Zip] [Unique Code]
Important School Attendance Information
A-1

Interior of encouragement mailer
Attendance Information
Dear Parent/Guardian of [Student Full Name]:
Attendance matters and we need your help this year. A few absences every month can add up to weeks of lost learning over the year. Missing school, whether for excused or unexcused reasons, disrupts a student’s education.
You can play a big role in improving [Student First Name]’s attendance. If you have questions, please call (267)-570-3819 or email [email protected].
Sincerely,
Dr. William Hite Superintendent The School District of Philadelphia
Attendance Matters
A-2

Interior of encouragement + self mailer
Attendance Information Dear Parent/Guardian of [Student Full Name]:
Attendance matters and we need your help this year. [Student First Name] missed [Student Absences] day(s) of school last year [Multiplier Text]. A few absences every month can add up to weeks of lost learning over the year. Missing school, whether for excused or unexcused reasons, disrupts a student’s education.
You can play a big role in improving [Student First Name]’s attendance. If you have questions, please call (267)-282-1155 or email [email protected].
Sincerely,
Dr. William Hite Superintendent The School District of Philadelphia
[Student First Name] missed [Student Absences] day(s) [Multiplier].
[Student Absences] day(s) [Student FIRST Name]‘S ABSENCE RECORD
total absences LAST school year
[Student Full Name]
A-3

Appendix B. Data and methods
This appendix details the data sources for the study and the methods used in the analysis.
Data sources
The School District of Philadelphia data used in this study included student demographic and enrollment data, guardian contact information, attendance data, and academic performance for the 2013/14 and 2014/15 school years.
Outcome measures
The study measured changes in attendance by drawing on full attendance data from the district. The attendance roll of participating students was limited to the time period immediately after the postcards were sent (October 9, 2014) and before the district sent subsequent attendance mailings not included in this report (December 31, 2014). Forty-three instructional days were included within this timeframe.
Eligibility criteria
Students were included in the experimental universe (and were sent consent forms) if the district had data for them during the 2013/14 school year. Because the district did not have access to preschool information, most of the experimental universe comprises students who were enrolled in grades 1–12 in the 2014/15 school year (kindergarten students were excluded before consent forms were sent).4
A total of 103,408 households were sent consent forms. The study universe was selected after excluding students based on several criteria (see table B1 for the number of students excluded under each criterion):
• School type. The study excluded students who enrolled in private schools or non– regular status public schools, defined as any public school in the district with a special designation, including specialized schools (like schools for the blind), alternative education schools, charter schools, and online schools.
Table B1. Exclusion criteria
Criterion Remaining sample
of students Students excluded
by this criterion
Students that were sent consent forms (equivalent to 103,408 households) 161,922
School type 109,407 52,515
Opt-outs or invalid address 108,798 609
Unlikely to enroll in 2014/15 98,508 10,290
Atypically burdensome circumstances 82,554 15,954
Household language 77,018 5,536
Participated in pilot study 73,309 3,709
Perfect attendance in 2013/14 69,407 3,902
Multiple students within a household 51,197 18,210
Final sample 51,197
Source: Authors’ analysis of 2013/14–2014/15 data from the School District of Philadelphia.
B-1

• Opt-outs or invalid addresses. The study excluded households that opted out after receiving the informed consent form and households for which postcards were returned because of out-of-date mailing addresses.
• Unlikely to enroll in 2014/15. The study excluded students who were in grade 12 at the end of 2013/14 and students whose administrative records indicated that the student had graduated, withdrawn, or was otherwise not enrolled as of June 2014.
• Atypically burdensome circumstances. The study excluded students who were flagged as having a disability or as homeless.
• Household language. The study excluded households for which district data indicated a home language other than the languages in which the consent form was sent (English, Albanian, Arabic, French, Khmer, Mandarin, Russian, Spanish, and Vietnamese) and households for which home language was missing in administrative records.
• Participated in pilot study. The study excluded students who participated in a small-scale pilot version of this experiment during spring 2014 as well as all schools that were part of the pilot study.
• Perfect attendance in 2013/14. The study excluded all students who had a perfect attendance record in the previous school year.
• Multiple students within a household. The study targeted only one student in each household. If multiple students at an address met the criteria for inclusion in the study, one student from that address was randomly selected into the sample universe, and the treatment’s messages focused on this student. This ensured that there was no cross-treatment contamination (only one student from each household represented within the study as a member of one of the study conditions).
All households meeting the criteria for inclusion in the study were divided into three groups: • High absence group, defined as all students having three or more absences more
than the typical student in their school-grade in the 2013/14 school year but fewer absences than two standard deviations above their school-grade mean.
• Extreme absence group, defined as all students who missed an unusual amount of school (at least as many days as two standard deviations above their school-grade mean) in the 2013/14 school year.
• Low absence group, defined as all students not already in the previous groups who missed at least one day but fewer than three days of school in in the 2013/14 school year.
The aggregate of these three universes was 51,197 eligible students, or around 40 percent of the total school population. These students attended 217 regular-status School District of Philadelphia schools and formed 1,290 unique school-grade combinations (for example, all eligible grade 2 students at Franklin Elementary School). This yielded an average of 40 students per school-grade combination.
Condition assignment
All eligible student–guardian pairs were randomly assigned (using a random variable in STATA and then assigning observations to groups) to one of four groups, stratified by school, grade, and frequency of absence (see table B2 for a breakdown of students by group and universe and tables B3–B6 for demographic information on the sample):
• An untreated control group that received no additional outreach as part of this experiment.
B-2

=
-
Table B2. Total sample sizes by treatment group and absenteeism group
Absence group Control group
Encourage condition
Encourage + self
condition
Encourage + self
+ social norms conditiona Total
Extreme absence group 522 513 523 526 2,084
High absence group 8,118 8,121 8,096 8,110 32,445
Low absence group 5,552 5,556 5,560 0 16,668
Total 14,192 14,190 14,179 8,636 51,197
a. This condition was removed to simplify the report findings, since there were no statistically significant differences between the encourage + self and encourage + self + social norms conditions. All analyses excluded this condition.
Source: Authors’ analysis of 2013/14–2014/15 data from the School District of Philadelphia.
Table B3. Preintervention sample sizes and characteristics for the baseline sample, pooled treatment conditions and control group
Characteristic
Pooled treatment conditions
(n = 28,369) Control group (n 14,192) Test of equivalence
Mean Standard
error Mean Standard
error Mean
difference Effect size p value
Female students (percent) 51.05 0.0030 51.44 0.0042 –0.39 –0.0078 0.45
Black students (percent) 54.00 0.0030 53.56 0.0042 0.44 0.0088 0.85
Home language not English (percent) 14.43 0.0021 14.44 0.0030 –0.01 –0.0003 0.98
English learner students (percent) 7.23 0.0015 7.18 0.0022 0.05 0.0019 0.85
Eligible for the federal school lunch program (percent) 69.35 0.0027 69.60 0.0039 –0.26 –0.0056 0.59
Pretreatment absences (days) 13.84 0.0901 13.81 0.1274 0.02 0.0016 0.87
Source: Authors’ analysis of 2013/14–2014/15 data from the School District of Philadelphia.
• The encourage condition, which received one postcard that stressed the importance of attendance, guardian efficacy (guardian influence on attendance), and absence reduction as part of the guardian’s role.
• The encourage + self condition, which received one postcard that had the same content as the encourage condition postcard as well as the number of days the student missed.
• The encourage + self + social norms condition, which received one postcard that had the same content as the encourage + self condition as well as a component on social norms. Since there were no statistically significant differences between this condition and the encourage + self condition, this condition was removed. All analyses excluded this condition.
The postcards were sent on October 9, 2014, and reached most households by October 11, 2014. The postcards reflected attendance information from the 2013/14 school year.5
Statistical adjustments
The impact analysis controlled for the variables used for stratification (2013/14 absences and grade), as is standard practice. Random effects were included for 2013/14 school, with
B-3
=

=
-
=
=
-
=
-
Table B4. Preintervention sample sizes and characteristics for the analytic sample, pooled treatment conditions and control group
Characteristic
Pooled treatment conditions
(n = 25,477) Control group (n 12,710) Test of equivalence
Mean Standard
error Mean Standard
error Mean
difference Effect size p value
Female students (percent) 50.89 0.0031 51.51 0.0044 0.62 0.0124 0.26
Black students (percent) 53.34 0.0031 52.82 0.0044 –0.52 –0.0104 0.34
Home language not English (percent) 14.50 0.0022 14.55 0.0031 –0.05 –0.0015 0.89
English learner students (percent) 7.22 0.0016 7.19 0.0023 0.03 0.0012 0.91
Eligible for the federal school lunch program (percent) 69.28 0.0029 69.42 0.0041 –0.14 –0.0030 0.78
Pretreatment absences (days) 13.12 0.0816 13.03 0.1156 0.10 0.0074 0.50
Source: Authors’ analysis of 2013/14–2014/15 data from the School District of Philadelphia.
Table B5. Preintervention sample sizes and characteristics for the analytic sample, encourage condition and control group
Characteristic
Encourage condition
(n 12,756) Control group (n 12,710) Test of equivalence
Mean Standard
error Mean Standard
error Mean
difference Effect size p value
Female students (percent) 50.67 0.0044 51.51 0.0044 0.84 0.0167 0.18
Black students (percent) 53.03 0.0044 52.82 0.0044 –0.21 –0.0042 0.74
Home language not English (percent) 14.31 0.0031 14.55 0.0031 0.23 0.0066 0.60
English learner students (percent) 7.28 0.0023 7.19 0.0023 –0.08 –0.0032 0.80
Eligible for the federal school lunch program (percent) 69.41 0.0041 69.42 0.0041 0.01 0.0016 0.99
Pretreatment absences (days) 13.17 0.1155 13.03 0.1156 –0.14 –0.0108 0.39
Source: Authors’ analysis of 2013/14–2014/15 data from the School District of Philadelphia.
Table B6. Preintervention sample sizes and characteristics for the analytic sample, encourage + self condition and encourage condition
Characteristic
Encourage + self condition
(n = 12,721)
Encourage condition
(n 12,756) Test of equivalence
Mean Standard
error Mean Standard
error Mean
difference Effect size p value
Female students (percent) 51.11 0.0044 50.67 0.0044 –0.44 –0.0088 0.48
Black students (percent) 53.65 0.0044 53.03 0.0044 –0.62 –0.0124 0.32
Home language not English (percent) 14.68 0.0031 14.31 0.0031 –0.36 –0.0103 0.41
English learner students (percent) 7.17 0.0023 7.28 0.0023 0.11 0.0041 0.74
Eligible for the federal school lunch program (percent) 69.15 0.0041 69.41 0.0041 0.26 0.0057 0.65
Pretreatment absences (days) 13.08 0.1155 13.17 0.1155 0.09 0.0067 0.59
Source: Authors’ analysis of 2013/14–2014/15 data from the School District of Philadelphia.
B-4
=
-
= =
=

=
-
=
-
students nested within schools. The analysis also included control covariates to increase the efficiency of the estimators. These controls included gender, race/ethnicity, home language, English learner status, and eligibility for the federal school lunch program. Sensitivity analyses that excluded covariates showed results that were similar to those in the primary analyses.
Analytic approach
The two confirmatory research questions correspond to a difference between two specific experimental conditions. The study team fit an overall regression model and compared coefficients. The models included random effects, with students nested within schools, and fixed-effects of grade level. Although hierarchical (multilevel) modeling was used for the analyses, the equations shown below exclude the full hierarchical model notation for the sake of clarity.
Specifically, the study team fit the following model:
Absenceigs = α + β1 Γ + ZT1igs + β2T2igs + Xigs gs μ + εigs
where the subscript is for student i in grade g in school s, β1 and β2 are the coefficients of interest on the treatment indicators T1 (the encouragement condition) and T2 (the encouragement + self condition), X is a vector of student-level controls (demographics and prior absences, among others), and Z is a vector of school-by-grade indicators.
The study team then performed the following tests on coefficients: • Research question 1 is a test for whether β1 = 0. • Research question 2 is a test for whether β1 = β2. • The results of these tests are shown in tables B7–B9.
Table B7. Postintervention outcomes for the analytic sample and estimated effects, encouragement condition and control group
Measure
Encouragement condition
(n = 12,756) Control group (n 12,710) Estimated effect
Mean Standard
error Mean Standard
error Mean
difference Effect size p value
Posttreatment absences (days) 3.31 0.054 3.45 0.054 –0.13 –0.028 .004
Source: Authors’ analysis of 2013/14–2014/15 data from the School District of Philadelphia.
Table B8. Postintervention outcomes for the analytic sample and estimated effects, encouragement + self condition and encouragement condition
Measure
Encouragement + self condition
(n = 12,721)
Encouragement condition
(n 12,756) Estimated effect
Mean Standard
error Mean Standard
error Mean
difference Effect size p value
Posttreatment absences (days) 3.27 0.054 3.31 0.054 –0.04 –0.010 .361
Source: Authors’ analysis of 2013/14–2014/15 data from the School District of Philadelphia.
B-5
=
=

=
-
Table B9. Postintervention outcomes for the analytic sample and estimated effects, pooled treatment conditions and control group
Measure
Pooled treatment conditions
(n = 25,477) Control group (n 12,710) Estimated effect
Mean Standard
error Mean Standard
error Mean
difference Effect size p value
Posttreatment absences (days) 3.29 0.049 3.45 0.054 –0.16 –0.033 .0001
Source: Authors’ analysis of 2013/14–2014/15 data from the School District of Philadelphia.
For the third research question, which was exploratory, the estimation was the same as that for the first two research questions with the addition of interaction terms (pooled treatment indicator by high school status).
B-6
=

Notes
1. Based on National Center for Education Statistics data indicating that approximately 50.1 million students attended public elementary and secondary schools in the United States in fall 2015 (http://nces.ed.gov/fastfacts/display.asp?id=372).
2. According to Mac Iver & Mac Iver (2009), student engagement is at the core of a student’s decision to stay in school.
3. To examine treatment impact in terms of percent, log transformations were done on the number of days absent. Log transformation is commonly used to adjust for data that is not normally distributed. A skewness and kurtosis test rejects the hypothesis that the data are normal at the 99.99 percent confidence interval.
4. Kindergarten students were excluded before consent forms were sent because the study team did not have access to absenteeism in preschool (the year preceding kindergarten). The study team focused on grades 1–12 and used absenteeism information from the previous year (that is, grades K–11). A trivial number of students repeated kindergarten.
5. The study team’s random assignments used roster and attendance data from the 2013/14 school year. However, approximately 5 percent of the experimental universe transferred out of the School District of Philadelphia before generating any absences in the attendance roll. Because there are no attendance data for these students, the research team did not include these students in the analysis. As expected, the number of students that moved was comparable across treatment conditions (Pearson χ2 (2) = 0.0252, p = .987). Additionally, there were students who moved or dropped out for whom absence records were incomplete. The numbers of these students in each treatment condition did not differ significantly (Pearson χ2 (2) = .8736, p = 0.646). Thus, the study team excluded these students (about 10 percent of the study’s entire universe) from the analysis as well.
Notes-1

References
Allensworth, E. M., & Easton, J. Q. (2007). What matters for staying on track and graduating in Chicago Public High Schools. Chicago, IL: Consortium on Chicago School Research. http://eric.ed.gov/?id=ED498350
Balfanz, R., & Byrnes, V. (2012). Chronic absenteeism: Summarizing what we know from nationally available data. Baltimore, MD: Johns Hopkins University Center for Social Organization of Schools. Retrieved April 4, 2014, from http:// www.ccrscenter.org/products-resources/resource-database/chronic-absenteeism -summarizing-what-we-know-nationally.
Balfanz, R., & Herzog, L. (2005, March). Keeping middle grades students on track to graduation: Initial analysis and implications. Presentation given at the second Regional Middle Grades Symposium, Philadelphia, PA.
Barnard, W. M. (2004). Parent involvement in elementary school and educational attainment. Children and Youth Services Review, 26(1), 39–62.
Bergman, P. (2012). The more you know: Evidence from a field experiment on parent-child information frictions and human capital investment (Working Paper). Los Angeles, CA: UCLA. Retrieved April 4, 2014, from http://www.aefpweb.org/sites/default/files/ webform/PBergmanJMP3–1.pdf.
Byrnes, V., & Reyna, R. (2012). Summary of state level analysis of early warning indicators. Baltimore, MD: Everyone Graduates Center.
Fan, X., & Chen, M. (2001). Parental involvement and students’ academic achievement: A meta-analysis. Educational Psychology Review, 13(1), 1–22. http://eric.ed.gov/?id= ED430048
Ginsburg, A., Jordan, P., & Chang, H. (2014). Absences add up: How school attendance influences student success. Washington, DC: Attendance Works. Retrieved October 14, 2015, from http://www.attendanceworks.org/wordpress/wp-content/uploads/2014/09/ Absenses-Add-Up_September-3rd-2014.pdf.
Herrold, K., & O’Donnell, K. (2008). Parent and family involvement in education, 2006–07 school year, from the National Household Education Surveys Program of 2007 (NCES No. 2008–050). National Center for Education Statistics Working Paper. Washington, DC: U.S. Department of Education. http://eric.ed.gov/?id=ED502237
Hoover-Dempsey, K. V., & Sandler, H. M. (1997). Why do parents become involved in their children’s education? Review of Educational Research, 67(1), 3–42. http://eric. ed.gov/?id=EJ548327
Houtenville, A. J., & Conway, K. S. (2008). Parental effort, school resources, and student achievement. Journal of Human Resources, 43(2), 437–453. http://eric.ed.gov/ ?id=EJ792701
Ref-1

Kraft, M., & Rogers, T. (2015). The underutilized potential of teacher-to-parent communication: Evidence from a field experiment. Economics of Education Review, 47(1), 49–63.
Lerner, J. S., & Tetlock, P. E. (1999). Accounting for the effects of accountability. Psychological Bulletin, 125(2), 255–275.
Mac Iver, M. A. & Mac Iver, D. J. (2009). Beyond the indicators: An integrated school-level approach to dropout prevention. Arlington, VA: The Mid-Atlantic Equity Center, The George Washington University Center for Equity and Excellence in Education. http:// eric.ed.gov/?id=ED543512
National Center for Education Statistics. (2015). Public high school graduation rates. Washington, DC: Author. Retrieved October 14, 2015, from http://nces.ed.gov/programs/coe/ indicator_coi.asp.
National Education Goals Panel. (1999). National education goals report: Building a nation of learners. Washington, DC: Author. Retrieved April 4, 2014, from http://govinfo.library. unt.edu/negp/reports/99rpt.pdf.
National Forum on Education Statistics. (2009). Every school day counts: The Forum guide to collecting and using attendance data (NFES No. 2009–804). National Center for Education Statistics Working Paper. Washington, DC: U.S. Department of Education.
Rogers, T. (2014). Parent survey. Unpublished manuscript.
Rogers, T., & Feller, A. (2016, March). Parental miscalibration of their children’s relative attendance and performance. Paper presented at the annual meeting of the Society for Research on Educational Effectiveness, Washington, DC.
Schoeneberger, J., & Tate, R. H. (2016, May). Tracking school tardiness: Automating data acquisition and analysis for monitoring school attendance. Paper resented at the annual meeting of the Pennsylvania Department of Education Data Summit, Hershey, PA.
School District of Philadelphia. (2015). Action Plan. Philadelphia, PA: Author. Retrieved October 14, 2015, from http://webgui.phila.k12.pa.us/offices/a/action-plan.
Stoneleigh Foundation. (2013). Truancy reduction project. Philadelphia, PA: Author. Retrieved April 4, 2014, from http://stoneleighfoundation.org/node/406.
Svenson, O. (1981). Are we all less risky and more skillful than our fellow drivers? Acta Psychologica, 47(2), 143–148.
Swanson, C. B. (2009). Cities in crisis: Closing the graduation gap. Washington, DC: America’s Promise Alliance and the Bill & Melinda Gates Foundation. http://eric. ed.gov/?id=ED505594
Thaler, R. H., & Sunstein, C. R. (2008). Nudge: Improving decisions about health, wealth, and happiness. New Haven, CT: Yale University Press.
Ref-2

The Regional Educational Laboratory Program produces 7 types of reports
Making Connections Studies of correlational relationships
Making an Impact Studies of cause and effect
What’s Happening Descriptions of policies, programs, implementation status, or data trends
What’s Known Summaries of previous research
Stated Briefly Summaries of research findings for specific audiences
Applied Research Methods Research methods for educational settings
Tools Help for planning, gathering, analyzing, or reporting data or research