Embed Size (px)
Citation preview
EMPATHIC RESPONSIVENESS: EVIDENCE FROM A RANDOMIZED EXPERIMENT ON
GIVING TO WELFARE RECIPIENTS*
Christina M. Fong
May 2004
Abstract
This paper reports a surprising finding from an experiment on giving to welfare recipients. The experiment tests how offers of money in n-donor dictator games are affected by 1) donors’ humanitarian and egalitarian values and 2) direct information about the recipients’ work-preferences. People who are self-reported humanitarians and egalitarians have giving that is highly elastic with respect to the apparent worthiness of the recipient. Among high scoring humanitarian-egalitarians, the median offer to a recipient who appeared industrious was $5.00, while the median offer to a recipient who appeared lazy was only $1.00. Among low scoring humanitarian-egalitarians, the median offer was $1.00 in both conditions. I refer to this combination of altruism and equity/reciprocity as empathic responsiveness. This finding can be rationalized by a model of inequity aversion.
Keywords: Fairness, Social Preferences, Redistributive Politics, Empathy, Equity, Attitudinal Measures,
Dictator Games, Public Goods Experiments
JEL Classification: D63, D64, A12, A13, C90
*I am grateful to Erika Burkhalter for outstanding research assistance; to George Loewenstein, Jörgen Weibull, Lise Vesterlund, Urs Fischbacher, Linda Skitka, Alan Durell, Julie Downs, John Miller, Peter Thompson, and seminar participants at Carnegie Mellon University, Boston University, and Wharton for helpful comments and discussion; and to Marcela Fields, Terence Chau and Tanya Ziegler for research assistance. Financial support was provided by a Behavioral Economics Small Grant from the Russell Sage Foundation and an Innovation Seed Grant from Carnegie Mellon University.
Contact: Christina Fong, Department of Social and Decision Sciences, Carnegie Mellon University, Pittsburgh, PA 15213. Tel. 412-268-8168. email: [email protected]
1. Introduction
The purpose of this paper is to report and interpret a surprising finding from an experiment on
the determinants of giving to the poor. In the experiment, each donor received a sum of money
(the pie) and then gave an amount of his or her choosing – from 0% to 100% of the pie – to a
real-life welfare recipient. Prior to the experiment, I took an attitudinal measure of donors’ self-
reported altruistic motives. The measure is the Katz-Hass (1989) humanitarianism-
egalitarianism scale (henceforth the HE scale) which increases in agreement with the following
statements (scaled from 1, “disagree strongly”, to 5, “agree strongly”):
One should be kind to all people. One should find ways to help others less fortunate than oneself. A person should be concerned about the well being of others. There should be equality for everyone – because we are all human beings. Those who are unable to provide for their basic needs should be helped by others. A good society is one in which people feel responsible for one another. Everyone should have an equal chance and an equal say in most things. Acting to protect the rights and interests of other members of the community is a major obligation for all persons. Prosperous nations have a moral obligation to share some of their wealth with poor nations.
The donors were then matched with recipients who differed according to how industrious or lazy
they appeared on the basis of their answers to a survey about their demographic characteristics,
work preferences, and work histories.
The surprising finding of this paper is that donors who scored high on the HE scale gave
significantly more to recipients who appeared industrious (and thus morally worthy of support)
than to recipients who appeared lazy (and thus morally unworthy of support). Subjects who
scored low on this measure gave little regardless of the characteristics of the recipient.
Furthermore, when the recipient appeared lazy, there was virtually no difference between the
offers from those who scored high on the HE scale and those who scored low. Only when the
recipient appeared industrious did those who scored high on the measure give significantly more
1
than those who scored low. The result is surprising because many researchers (including this
one) would have expected people who score high on the measure to give unconditionally, like
Jesus, and people who score low to give conditionally. Instead, those who scored higher on the
HE scale gave like Martin Luther who, in 1523, wrote a proposal for organized poor relief that
was to benefit only those who were clearly needy and had “honourably labored at their craft or in
agriculture.” (Martin Luther, 1523, cited in Piven and Cloward (1971) p. 9.)
I term the combined motive to help others but to help conditionally as empathic
responsiveness. Below, I present a model of inequity aversion – an extended version of the
model of inequity aversion by Fehr and Schmidt (1999) – that offers a formal interpretation of
empathic responsiveness. The model shows that for a donor’s giving to respond to the perceived
worthiness of recipients, she must have a high level of inequity aversion and be focused
primarily on inequity between herself and the potential recipient (as opposed to caring about
inequity between herself and all players in the game, which may include people who she does
not interact with and is in no position to help). This definition of empathic responsiveness is
similar to a definition of empathy by Preston and De Waal (2001). They define empathy as the
ability to attend and respond to another being.1 Empathy in this sense may result not only in
positive responses to another person, such as sympathy followed by helping behavior, but also in
negative responses such as anger followed by revenge. The common element of these two
1 Another well-known interpretation of altruism is the empathy-altruism hypothesis of Daniel Batson and
colleagues. The empathy-altruism hypothesis is that empathy is an emotion that can evoke altruistic motives
(Batson, 1997b). This area of research focuses on the determinants of empathy-induced helping. For example,
imagining how another feels can increase empathy for that person (Batson, 1997a). Adam Smith had similar
insights in his Theory of Moral Sentiments (1759), where he wrote about the role that one’s imagination about the
experiences of another may play in social behavior (Smith, 2002).
2
definitions is that they both require two things: i) a heightened focus on the potential recipient
and ii) responsiveness to judgments about whether or not the potential recipient deserves help or
punishment (which, broadly defined, may take the form of withholding of assistance).
The findings have implications for our understanding of two classes of social preferences:
reciprocal altruism and unconditional altruism. By reciprocal altruism, I mean a class of motives
that are alike in that they all motivate costly rewards and punishments to others on the basis of
what they deserve. For example, it is widely accepted that people are less generous to the poor if
they believe that the poor are responsible for their own poverty (e.g., because they are lazy), and
that people are more generous if they think the poor are not responsible for their own poverty
(e.g., if they are poor despite hard efforts).2 This effect could be driven either by concerns about
the equity principle of distributive justice or by various notions of reciprocity.3 In contrast,
2 This idea has long been held outside of economics. See Williamson (1974) for early evidence, Miller (1992) for a
review, and Weiner (1995) for more recent research in psychology. Recently, a growing number of economists have
studied this and related ideas (Alesina and Angeletos, 2002; 2001; Benabou and Tirole, 2002; Besley and Coate,
1992; Bowles and Gintis, 2000; Fong, 2001; Fong et al., forthcoming; Konow, 2002; Lindbeck et al., 1999; Moffitt
et al., 1998; Piketty, 1995).
3 According to the principle of equity, people should receive resources from a system that are proportional to their
contributions to it (see Walster et al. (1978) for a review). Reciprocity, on the other hand, has been defined in a
number of ways, at least two of which are pertinent here. It can be interpreted as one’s reaction to the perceived
good or bad intentions of others (Rabin, 1993). Individuals may withhold assistance to the poor if they believe that
the poor intentionally rely on taxpayer generosity to consume leisure. They may support assistance to the poor if
they believe that the poor intended to work hard and make it on their own but failed despite their efforts. Another
definition of reciprocity that could explain the effects discussed here is strong reciprocity, which is a motive to
reward people (at a cost to oneself) who generate benefits for a third party and punish people (at a cost to oneself)
who impose costs on a third party (Bowles and Gintis, 2002; Fehr et al., 2002).
3
unconditional altruism motivates people to help others at a cost to themselves, without regard for
the characteristics or intentions of the recipients. Examples of unconditional altruism include
simple altruism (Becker, 1974), warm-glow altruism (Andreoni, 1989) and egalitarianism (see
Deutsch (1985) for a review). For the purposes of this paper, neither distinctions between
different types of reciprocal altruism nor distinctions between different types of unconditional
altruism are important. What matters is the difference between reciprocal altruism and
unconditional altruism.
The findings of this paper open the possibility that the concept of unconditional altruism is a
misinterpretation of pro-social behavior. If one were to take a snapshot of a social situation in
which everyone has the same information and beliefs about a recipient and then observe who
gives more, one might previously have interpreted the high-givers as simple altruists. The
problem is that perceptions of the worthiness of recipients may vary considerably from one
situation to the next, so people who are empathically responsive will give a lot in some situations
and little in others. In this case, unconditional altruism will not accurately predict an individual’s
behavior across situations. In contrast, the empathic responsiveness interpretation says that if we
know what beliefs people have about the worthiness of recipients, we can predict who will give
by knowing who is empathically responsive. This interpretation suggests that there may be a
single pro-social trait that can predict behavior in many different settings (e.g., charity,
incomplete labor contracts, public redistribution) as a result of the information and beliefs that
people have about others.
The findings do not fundamentally change what we know about reciprocal altruism. They
do, however, improve our understanding of how reciprocal altruism works and who the altruistic
reciprocators are. The findings suggest that it is the people who want to help others – that is, the
4
people who are the most focused on inequity between themselves and people whom they can
help – whose giving is the most likely to be elastic with respect to the perceived worthiness of
the recipient. This is illuminating, because, as mentioned above, prior to this experiment, we
might have expected those who say they want to help others to give unconditionally to everyone.
We also might have expected those who give conditionally to be the ones who give less on
average and are less willing to help others – but this is not the case. The results also identify a
useful methodological tool for identifying who is likely to reciprocate. Measures such as the HE
scale may enable future research to identify potential reciprocal altruists and test whether or not
reciprocal altruism is a stable motive that drives behavior in predictable ways across very
different settings.
This paper was originally motivated by the literature on redistributive politics, which has
been paying increasing attention to the fact that people support more redistribution if they
believe that the poor are industrious rather than lazy. Perhaps the most important question this
literature faces is where beliefs about causes of income come from. In an influential paper,
Thomas Piketty (1995) focuses on the role of personal economic experiences in learning about
the causes of income. According to this view, the key problem is to understand the determinants
of left-wing or right-wing beliefs, i.e. political orientation. A different view assumes that beliefs
about the worthiness of recipients are highly dependent on direct information that people get
from their economic environment about causes of income or worthiness of recipients. According
to this view, understanding left-wing or right-wing political orientation is not sufficient to
understand redistributive politics. Beliefs about causes of income or judgments about the
worthiness of recipients are at least partially endogenous to choices about how to redistribute and
5
how much to redistribute (Alesina and Angeletos, 2002; Fong et al., forthcoming; Gilens, 1999;
Heclo, 1986; Romer, 1994).
Following this literature, I designed this experiment to test the effects of direct information
against the effects of prior beliefs and values. The idea was to test whether or not prior beliefs
and values are stable characteristics of donors with robust effects on redistribution or whether
people use new information when it is available to form judgments of worthiness and make
redistributive decisions. I originally predicted that prior beliefs and values would determine
offers when information about the work preferences of recipients was low while direct
information would determine offers when information was high. The experiment provided no
evidence that new information overrides prior beliefs or values. Instead, the experiment
produced the surprise finding of empathic responsiveness described above.
The remainder of this paper is organized as follows: Section 2 presents the design and
procedures of the experiment. Section 3 presents the results. Section 4 interprets the findings by
extending the Fehr-Schmidt model of inequity aversion to accommodate perceptions of the
worthiness of others and the ability to focus on inequity between oneself and people whom one
can help. Section 5 concludes.
2. Experimental Design and Procedures
The experiment was an n-donor dictator game. In each of three treatment conditions, about 45
donors were matched with a single real-life welfare recipient.4 Each donor was given a five
4 Donors were primarily students from Carnegie Mellon University and the University of Pittsburgh, although a
couple of non-students participated, including one homeless man. I recruited welfare recipients from a child care
center in Pittsburgh that serves low-income mothers.
6
7
dollar show-up fee and ten dollars for participating in the experiment. Each donor read some
information about the recipient, then privately and anonymously gave any amount of the ten
dollar pie of his or her choosing – from zero to ten dollars – to the welfare recipient and kept the
rest. So, the donor earned the five dollar participation fee plus ten dollars minus the donation to
the recipient. Each recipient earned the sum of the donations from the donors she was matched
with.
The experiment used three welfare recipients, one for each treatment. Each recipient
provided information about herself in a short survey. All three were single African-American
women with dependent children who did not have full-time jobs, received government
assistance, had annual household incomes of less than $25,000, and were less than 55 years old.TP
5PT
However, they differed according to their answers to the three final questions on our recipient
recruitment survey, which were the following:
• If you don’t work full-time, are you looking for more work? ______Yes, I am looking for more work. ______No, I am not looking for more work. • If it were up to you, would you like to work full-time? ______Yes, I would like to work full-time.______No, I would not like to work full-time. • During the last five years, have you held one job for more than a one-year period? Yes_____ No____
In one treatment condition, the welfare recipient answered “yes” to all three of these questions
(“industrious”-recipient condition), in another, the recipient answered “no” to all three questions
(“lazy”-recipient condition), and in a third, the last three questions were omitted (low-
information condition).
TP
5PT I chose these broad demographic categories in order to facilitate finding a suitable recipient for each condition.
Donors visited a web site to register for the experiment and complete the attitudinal survey
during the week prior to the experiment.6 When subjects arrived for the experiment,
experimenters seated each of them alone in a private room and handed them instructions, ID
stickers, a $5.00 bill for completing the web survey and $10.00 in one dollar bills for
participating in the experiment. Subjects received their payment in cash right away in order to
increase their sense of entitlement to the money. The procedures also provided as much
anonymity as possible, allowing subjects to make anonymous and private decisions, but
requiring them to place ID stickers on their offer envelope and exit survey.7 In order to assure
subjects that there was no deception in the experiment, I obtained a letter from an Associate
Provost of Carnegie Mellon University stating that I have certified that there is no deception in
our experiment. Each subject received a copy of this letter with the instructions. I gave each
subject verbal instructions according to a script (see Appendix B) and then told him or her to
read the written instructions carefully.8
Next, subjects randomly matched themselves to one of three welfare recipients by drawing a
copy of the recipient’s survey from a box. Dictators received no information about the recipients,
6 They had a three day window during which they could stop by anytime during certain hours to participate in the
experiment. To prevent survey responses from affecting behavior in the experiment, subjects were not allowed to
complete the survey and participate in the experiment on the same day. The number of elapsed days between
completing the survey and participating on the experiment had no effect on the results.
7 The ID number was assigned to them by the webpage and was automatically entered along with their web survey
responses.
8 I made minor changes to the procedures over the course of the first day (the first 20 subjects) to reduce noise and
encourage subjects to read their recipient’s survey. I gave no verbal instructions to the first 20 subjects. The results
presented below are even stronger when I drop the first twenty observations.
8
except that they were real people, until they went over to the box to draw a survey.9 The fact that
the recipient was a welfare recipient was stated both on a sign near the box of envelopes and in
the recipient’s survey. The only additional information subjects received about their recipients
was that contained in the recipients’ surveys.
Finally, the donor read the recipients’ survey, chose how much of the ten dollar pie to give to
the recipient, then sealed his or her donation together with the recipient’s survey into an envelope
and deposited it into a box. The donors completed exit surveys before leaving the experiment.
2.1. Design Considerations
There are two institutions in the real world that are most pertinent to this paper. These are
private charities – which are n-donor dictator games – and voting over taxes and transfers.
Simple dictator games are not well suited for this study, which seeks to increase the external
validity of research on social preferences by increasing the social content in and realism of the
decisions subjects are asked to make. In a traditional dictator game, a gift may express concern
about inequality in the earnings that two players make from the game itself. In contrast, in n-
donor games, the recipient is likely to earn more than the donor from the game, but to be
perceived as poorer than the donor in real life. If subjects give to a recipient when 44 other
subjects are also giving, then either they are masochistic or they are acting on beliefs that this
person is, in real life, poorer than they are. Charity does have one well-known complication,
9 The box always contained several envelopes in order to reinforce the fact that the decision was anonymous.
Experimenters placed dummy envelopes in the box for the first arrivals each day. Subjects affixed ID stickers to the
seal of the envelope so that I could verify that no money was stolen.
9
however: an individual’s donation may decrease in the total amount donated by others. I discuss
this issue in more detail below.
Voting is an important institution to study in future research, but is beyond the scope of this
study. Under voting, the probability that a vote wins is inversely related to the number of voters.
This introduces a number of issues that have unknown behavioral consequences. If a subject
wishes to appear generous when she is not, either to herself or to the experimenter, or if she has a
point to express with her vote, it will be cheaper for her to do so under voting. She will also
have less control over how much she ultimately gives and this may have unknown behavioral
consequences.
2.2. Web Survey Design and Constructed Measures
The two main design challenges for the attitudinal survey were to choose the appropriate
questions and to keep the survey as short as possible. There is a tradeoff between collecting
more information from respondents and reducing the quality of the data by exhausting their
attention. To maintain high-quality data, I imposed a page limit on the survey and only included
the questions that were most pertinent to the study. Readers interested in other potential
determinants of actual giving – including religiosity, and detailed socioeconomic data – may
begin by consulting the large social surveys and the literature that uses them and then develop
and test customized surveys for use in experiments like the one presented in this paper. Readers
may also consult several other papers that have tested the effects of various personality and
attitudinal measures on behavior in bargaining experiments.10
10 It is beyond the scope of this paper to review all of the personality and attitudinal measures that have been
developed and used to attempt to predict behavior. However, for some recent research using various measures in
10
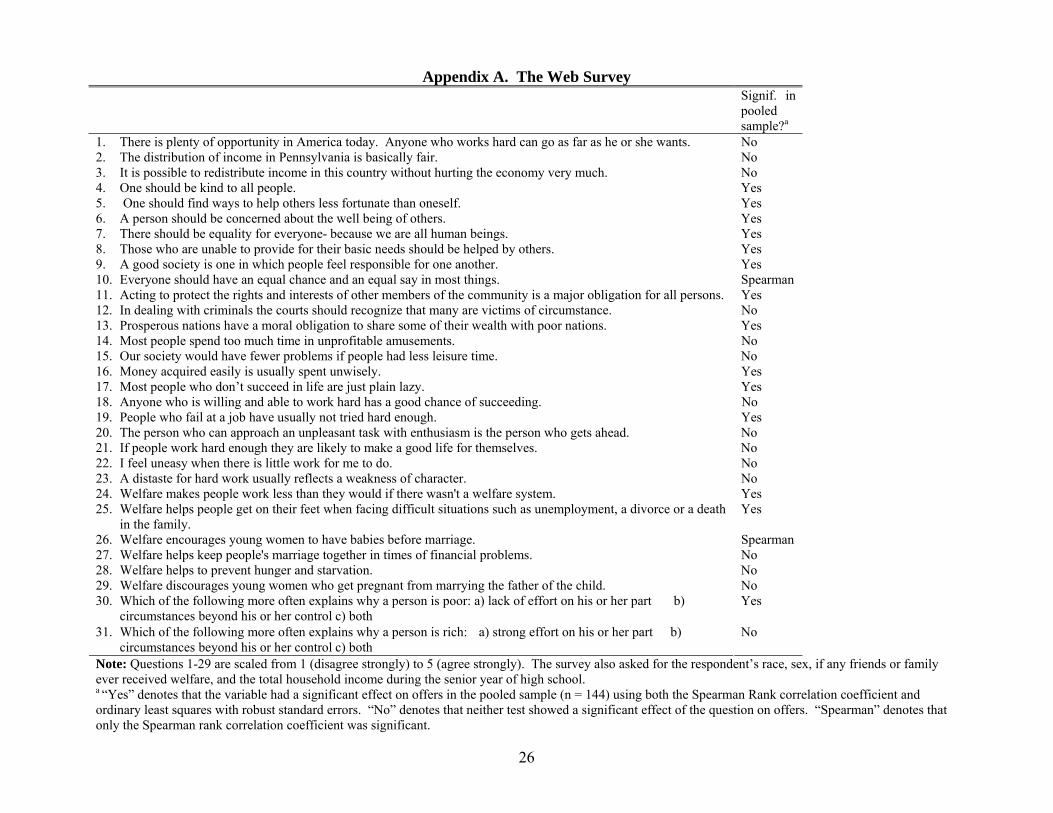
The questions from the web survey are presented in the first column of the table in Appendix
A. The survey contains attitudinal measures recommended by psychologist Linda Skitka (in
correspondence, 2002) as likely to predict giving to welfare recipients. These measures include:
scales designed by Katz and Hass (1989) on humanitarianism and egalitarianism (questions 4-13)
and the Protestant work ethic (questions 14-23); and a battery of questions about welfare
recipients from the General Social Survey (questions 24-29). The survey also contains questions
(1, 30, and 31) that are strong predictors of attitudes to redistribution and inequality in nationally
representative data from the 1998 Gallup Organization Social Audit, “Haves and Have-nots”
(Fong 2001). I also included questions on general beliefs about the fairness of the income
distribution and efficiency of redistribution (questions 2 and 3) to compare their effects of those
of the variables that I was most interested in (humanitarianism and prior beliefs about the causes
of income). Questions 2 and 3 had no significant effects on offers, which is consistent with my
predictions.
Katz and Hass (1989) designed the HE scale to measure communalism which, according to
sociologists, embraces humanitarianism and egalitarianism and is one of two core American
values (Lipset, 1967). The other core value according to this body of literature is the Protestant
work ethic. Katz and Hass predicted that humanitarians would respond with more empathy to
blacks. They found that their humanitarianism scale correlated with a measure of “pro-black
attitudes” and their Protestant work ethic scale correlated with “anti-black attitudes”. In
subsequent research, the humanitarianism scale and various beliefs about the causes of income
have been used in combination with other measures, including whether the respondent is liberal
bargaining experiments, see Ben-Ner et al. (2001), Carpenter (2003), Glaeser et al. (2000), Gunnthorsdottir et al.
(2002), and van Dijk and van Winden (2002).
11
or conservative, to create a single measure of “conservative-liberal ideology” (Skitka and
Tetlock, 1993). However, “liberalism” and “conservatism” are part of what I seek to explain, so
results from that literature combine concepts that I treat as explanatory variables with concepts
that I treat as dependent variables. The goals of that literature are sufficiently different from
mine that the results that have been published using the humanitarianism scale are not pertinent
to this paper.
From these questions, I constructed two measures for the analysis. One is the standardized
(to a mean of zero and standard deviation of one) sum of all of the questions in the HE scale
except question 12.11 I excluded question 12 from the analysis because it asks about the causes
of criminality and is more related to the measure of causes of poverty and failure than to the
importance of helping others. The second measure combines the questions about the causes of
poverty and failure (17, 19, and 30) and increases in beliefs that circumstances beyond control
rather than lack of effort cause poverty. These questions do not all have the same response
scales, so I used their first principle component rather than the sum of the responses and then
standardized it (to a mean of zero and standard deviation of one).12 The second column of the
table in Appendix A states whether each question had a significant relationship with offers in the
pooled sample. A “yes” in this column means that both the ordinary least squares coefficient
(with robust standard errors) and the Spearman rank correlation were significant, a “no” means
neither was significant, and “Spearman” indicates that only the Spearman rank correlation was
11 Combining several questions into a single scale increases the measurement reliability.
12 Principal components analysis organizes the data into orthogonal linear combinations. The first principal
component is the linear combination of the data that has the maximal variance. None of the results are sensitive to
the choice of the sum or the first principle component of responses to form these measures.
12

significant. All of the individual questions used to construct the two measures used in this paper
had significant correlations with offers in the pooled sample.13
3. Results
We conducted the web survey and the experiment in June of 2002. One hundred and forty-four
subjects participated as dictators and three as recipients. Twenty dictators participated on the
first day of the experiment, 31 on the second day, and 93 on the third day. There were 44
subjects each in the low-information and lazy-recipient conditions and 56 in the industrious-
recipient condition.
3.1. Treatment effects
Table 1 presents summary statistics for selected variables. The mean offers in the lazy-recipient,
low-information, and industrious-recipient conditions were $1.84, $3.21, and $2.79,
respectively.14 According to a Mann-Whitney test, the distributions of offers in the lazy- and
13 There was a noteworthy null finding in the table in Appendix A: questions about the causes of wealth and success
and about the prevalence of opportunity to get ahead had no significant effects on offers (except for one that had a
significant effect in one of the tests). Elsewhere I have replicated this finding using nationally representative survey
data from a Gallup Organization Social Audit (Gallup Organization, 1998) and the General Social Survey. Beliefs
about the specific category of person who is the recipient of redistribution have much larger effects on support for
governmental redistribution than general beliefs that the economy is a meritocracy (Fong, 2004).
14 One subject in the low-information condition gave $15.00 even though the maximum allowed offer was $10.00.
If this observation is top-coded to $10.00, then the mean offer in the low-information condition falls to $3.09.
However, rather than top-code that observation to $10.00, I present median regression results along with ordinary
least squares results so that readers may judge the sensitivity or lack thereof of the results to this and other potential
outliers.
13
industrious-recipient conditions were significantly different at the ten percent level (p = 0.053)
and offers in the low-information condition and lazy-recipient condition were significantly
different at the five-percent level (p = 0.031). Note that the mean offer was higher in the low-
information condition than the industrious-recipient condition, which was unexpected. However,
none of the tests used in the analysis for this paper showed a significant difference between
offers in these two treatment conditions. In fact, none of the treatment effects on offers were
robust. For example, in median regressions predicting offers, there were no significant effects of
the treatment dummies.
The failure to find significant treatment effects is not due to a manipulation failure, because
the treatment conditions had highly significant effects on the donors’ posterior beliefs about why
their recipients were poor. Table 1 presents, for each treatment condition, the frequencies of
responses to the following exit survey question: “Which of the following explains why your
recipient is poor: a) lack of effort on his or her part, b) circumstances beyond his or her control,
c) both.” Table 1 clearly shows that beliefs that the recipient was poor because of lack of effort
were much stronger in the lazy-recipient condition and beliefs that the recipient was poor
because of circumstances were much stronger in the industrious-recipient condition. According
to the Kruskal-Wallis test, the distribution of responses was significantly different across
treatments at the one-percent level. Ordered probit analyses predicting ordered responses to the
exit survey question also show highly significant treatment effects in the expected direction.
One possible reason for the small treatment effects on the offers is that this experiment is
tightly controlled; all three recipients belong to the same social category (single, poor, black
mothers on public assistance). Other studies that compare offers to recipients from extremely
different social categories show much larger effects. For example, Eckel and Grossman (1996)
14
found that subjects gave roughly three times more to the American Red Cross than to anonymous
subjects.
Offers in the lazy-recipient treatment condition were higher than the mean offers in double-
blind single-donor dictator games, but lower than offers in many other single-donor dictator
games that have been reported.15 The design of the experiment encourages low offers in a
number of ways. First, following Hoffman, McCabe, and Smith (1996), we offered as much
anonymity to donors as possible, except that ID numbers were attached to responses. Second,
we used language intended to make subjects feel entitled to the ten dollar pie.16 Third, this
experiment is an n-donor dictator game rather than a two-person game, which may cause an
individual’s offer to decrease in the total amount given by others.17 Fourth, people do not like to
support welfare recipients. Nationally representative survey experiments that randomly vary
descriptions of recipients and ask about attitudinal support for governmental assistance to them
show dramatically less support for government spending on “welfare” than on other types of
means-tested aid (Gilens, 1999; Heclo, 1986). It has also been found that there is a negative
exposure effect on support for welfare. People register less support for welfare if they live in
Census tracts where a higher fraction of the residents are welfare recipients (Luttmer, 2001).
There is, however, at least one effect that may operate in the other direction. People exhibit
15 See Camerer (2003) for a review of bargaining game results.
16 We told subjects that they had “earned” the ten dollars that was to be divided for their participation in the
experiment. Subjects who have earned their money (e.g., by performing well on a quiz) as opposed to simply
receiving it from an experimenter earn more in bargaining games; they offer less to other subjects and other subjects
demand less from them (Cherry et al., 2002; Hoffman and Spitzer, 1985).
17 See Andreoni (1989) for a discussion of this problem when the motive is pure altruism. See also the inequity
aversion model below.
15
more generosity to recipients who been identified and when the social distance between players
has been reduced by providing information about the identity of those who play against one
another (Bohnet and Frey, 1999; Jenni and Loewenstein, 1997; Small and Loewenstein, 2003).
3.2. Overview of attitudinal effects
There is no evidence to support the prediction that prior beliefs and values would have stronger
effects on offers in the low-information treatment condition than in the two high-information
conditions. Instead, beliefs about the causes of poverty and failure had their strongest effect in
the lazy-recipient condition and the HE scale had its strongest effect in the industrious-recipient
condition. The Spearman rank correlations between offers and beliefs about the causes of
poverty and failure were 0.393 (p = 0.008) in the lazy-recipient condition, 0.355 (p = .018) in the
low-information condition, and 0.016 (p = 0.905) in the industrious-recipient condition. The
Spearman rank correlations between the HE scale and offers were 0.478 (p = 0.0002) in the
industrious-recipient condition, 0.382 (p = 0.011) in the low-information condition and 0.075 (p
= 0.629) in the lazy-recipient condition.
In unreported analysis, I found that of the correlation between the beliefs about the causes of
poverty and failure in the lazy-recipient condition is sensitive to specification. For example, in
median regressions predicting offers in the lazy-recipient condition, the effect of the beliefs
about causes of poverty and failure on offers becomes insignificant after including either a
dummy for male or a dummy for U.S. born, even though neither of these demographic
characteristics have robust significant effects on offers in any treatment condition.
In contrast, the correlation between the HE scale and offers in the industrious-recipient
condition is very robust. In median regressions predicting offers in the industrious-recipient
16
condition with the HE scale and various other variables, the effect of the HE scale remains
highly significant when other variables – including dummies for male and US born and the prior
beliefs about causes of poverty and failure – are included. This strong effect of the HE scale in
the industrious-recipient condition and its weak effect in the lazy-recipient condition reflects the
empathic responsiveness effect. The empathic responsiveness effect, which is the only robust
finding from this experiment, is presented in more detail in the following section.
3.3. The empathic responsiveness effect
Table 2 presents regressions predicting offers for each treatment condition with dummy variables
for having an HE score in the upper third and middle third of the sample. The omitted category
is having an HE score in the lowest third of the sample. The table presents both OLS and median
regressions for each treatment condition. First, a very important point is that in all columns, the
estimated constants are very similar in magnitude. This means that the mean and median offers
from those in the lowest third of the distribution of the HE score do not vary with the treatment
conditions. Second, it shows that the effect of scoring in the middle of the distribution of the HE
scale is weak at best.
The interesting effects are driven by those who score in the upper third of the distribution of
the HE scale. These effects are highlighted with bold type in Table 2. In the industrious-
recipient condition, those who scored high on the HE scale gave significantly more than those
who scored low, but in the lazy-recipient condition, they gave virtually the same amount.18 In
the industrious-recipient condition, the response from high HE scorers was dramatic. The
18 In the low-information condition, there is no robust evidence that high HE scorers give more (the OLS and
median regressions fail to produce consistent findings.
17
median offer from high HE scorers was $5.00, or 50% of the pie, which was $4.00 more than the
median offer from those who scored low on the HE scale. The mean offer from those who
scored high on the HE scale was $4.79, which was $3.26 more than the mean offer from those
who scored low on the HE scale.
Looking across the rows of Table 2 shows that those who scored low on the HE scale gave
virtually the same amount in all three treatment conditions while those who scored high on the
HE scale gave substantially more in the industrious-recipient condition than in the lazy-recipient
condition. The behavior of those who scored in the middle of the HE score appears somewhat
erratic. A simple way to present the significance levels of these differences is to estimate the
interaction effects the other way: to estimate treatment effects within the sub-samples of subjects
who had low, middle and high scores on the HE scale. Table 3 presents these estimates. The
estimated means and medians for each treatment condition in each sub-group can be read from
either Table 2 or Table 3. What Table 3 shows is that the treatment effects of those who score
high on the HE scale are highly significant using both estimators (columns 5 and 6). In contrast,
none of the treatment effects were significant among those who scored in the bottom or the
middle of the distribution of the HE scale (columns 1-4).
4. Model
This section extends the Fehr-Schmidt (1999) model of inequity aversion – which is one of the
more tractable fairness models – to show how judgments of worthiness may matter and how
18
19
empathic responsiveness may occur.TP
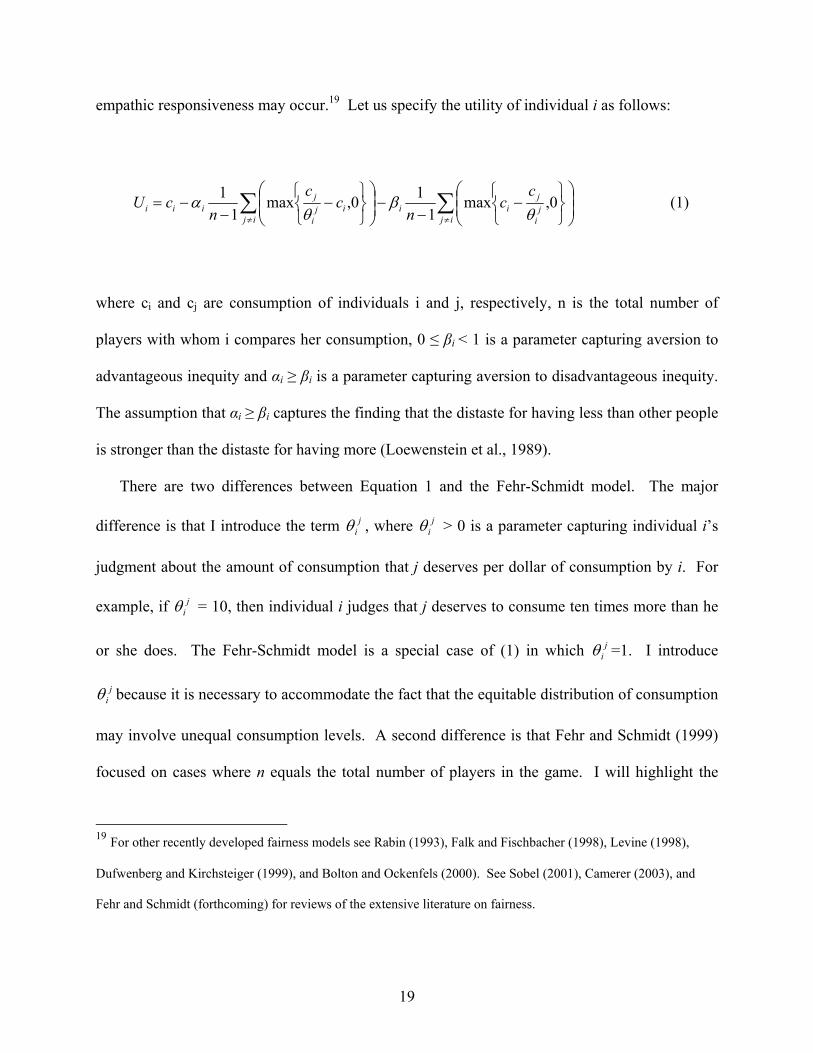
19PT Let us specify the utility of individual i as follows:
∑ ∑≠ ≠
⎟⎟⎠
⎞⎜⎜⎝
⎛
⎭⎬⎫
⎩⎨⎧
−−
−⎟⎟⎠
⎞⎜⎜⎝
⎛
⎭⎬⎫
⎩⎨⎧
−−
−=ij ij
ji
jiiij
i
jiii
cc
nc
cn
cU 0,max1
10,max1
1θ
βθ
α (1)
where cBi B and c Bj B are consumption of individuals i and j, respectively, n is the total number of
players with whom i compares her consumption, 0 ≤ βBi B< 1 is a parameter capturing aversion to
advantageous inequity and α Bi B ≥ β Bi B is a parameter capturing aversion to disadvantageous inequity.
The assumption that αBi B ≥ β Bi B captures the finding that the distaste for having less than other people
is stronger than the distaste for having more (Loewenstein et al., 1989).
There are two differences between Equation 1 and the Fehr-Schmidt model. The major
difference is that I introduce the term jiθ , where j
iθ > 0 is a parameter capturing individual i’s
judgment about the amount of consumption that j deserves per dollar of consumption by i. For
example, if jiθ = 10, then individual i judges that j deserves to consume ten times more than he
or she does. The Fehr-Schmidt model is a special case of (1) in which jiθ =1. I introduce
jiθ because it is necessary to accommodate the fact that the equitable distribution of consumption
may involve unequal consumption levels. A second difference is that Fehr and Schmidt (1999)
focused on cases where n equals the total number of players in the game. I will highlight the
TP
19PT For other recently developed fairness models see Rabin (1993), Falk and Fischbacher (1998), Levine (1998),
Dufwenberg and Kirchsteiger (1999), and Bolton and Ockenfels (2000). See Sobel (2001), Camerer (2003), and
Fehr and Schmidt (forthcoming) for reviews of the extensive literature on fairness.
20
effects of focusing on inequity between oneself and those one can potentially help (so that n may
be less than the total number of players in the game). I will refer to the n-1 people to whom
individual i compares her consumption level as i’s focus of inequity. The second term of (1) says
that the individual bears a utility cost from the average amount of disadvantageous inequity
between herself and the people who are the focus of her inequity aversion. Similarly, the third
term of (1) measures aversion to the average amount of advantageous inequity that i experiences
between herself and those who are the focus of her inequity aversion.
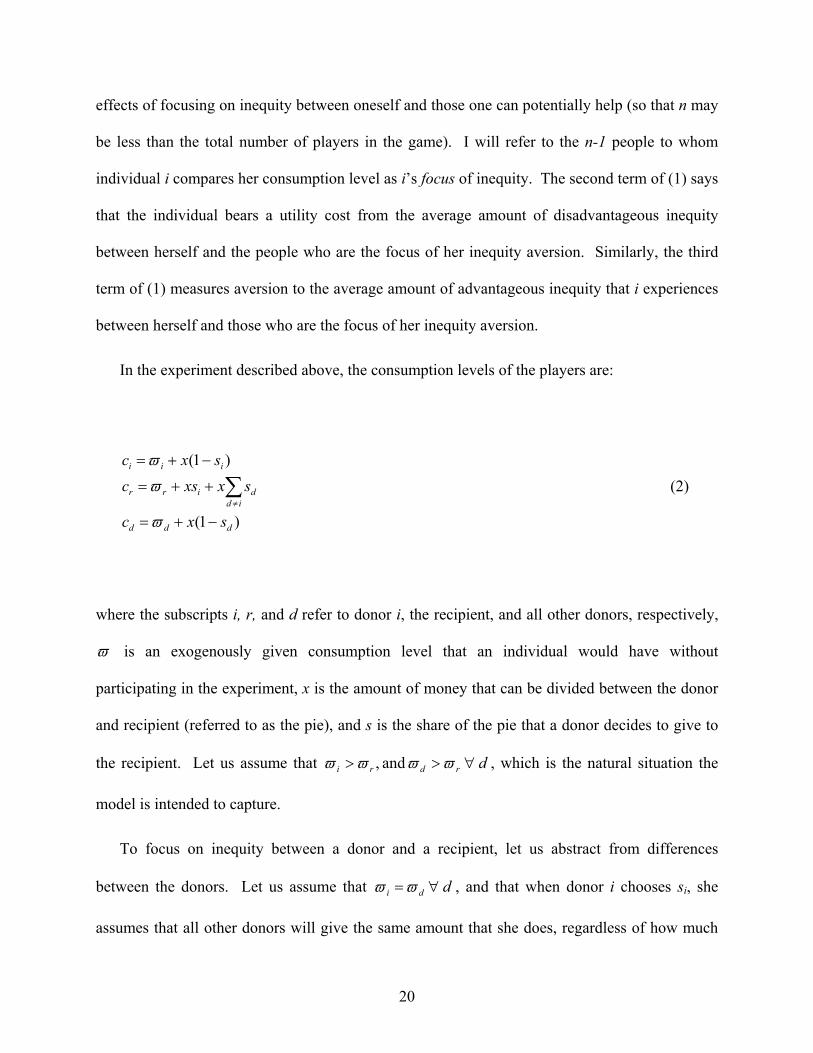
In the experiment described above, the consumption levels of the players are:
)1(
)1(
ddd
iddirr
iii
sxc
sxxscsxc
−+=
++=
−+=
∑≠
ϖ
ϖ
ϖ
(2)
where the subscripts i, r, and d refer to donor i, the recipient, and all other donors, respectively,
ϖ is an exogenously given consumption level that an individual would have without
participating in the experiment, x is the amount of money that can be divided between the donor
and recipient (referred to as the pie), and s is the share of the pie that a donor decides to give to
the recipient. Let us assume that drdri and , ∀>> ϖϖϖϖ , which is the natural situation the
model is intended to capture.
To focus on inequity between a donor and a recipient, let us abstract from differences
between the donors. Let us assume that ddi ∀=ϖϖ , and that when donor i chooses sBi B, she
assumes that all other donors will give the same amount that she does, regardless of how much
21
she gives. That is, for any sBi B, dss di ∀= .TP
20PT Finally, let us assume that from i’s perspective,
ddi 1∀=θ . This is the assumption that Fehr and Schmidt make, namely that in traditional
laboratory experiments using traditional subjects who are similar to each other (e.g., university
students), the equitable distribution of payoffs is equality.
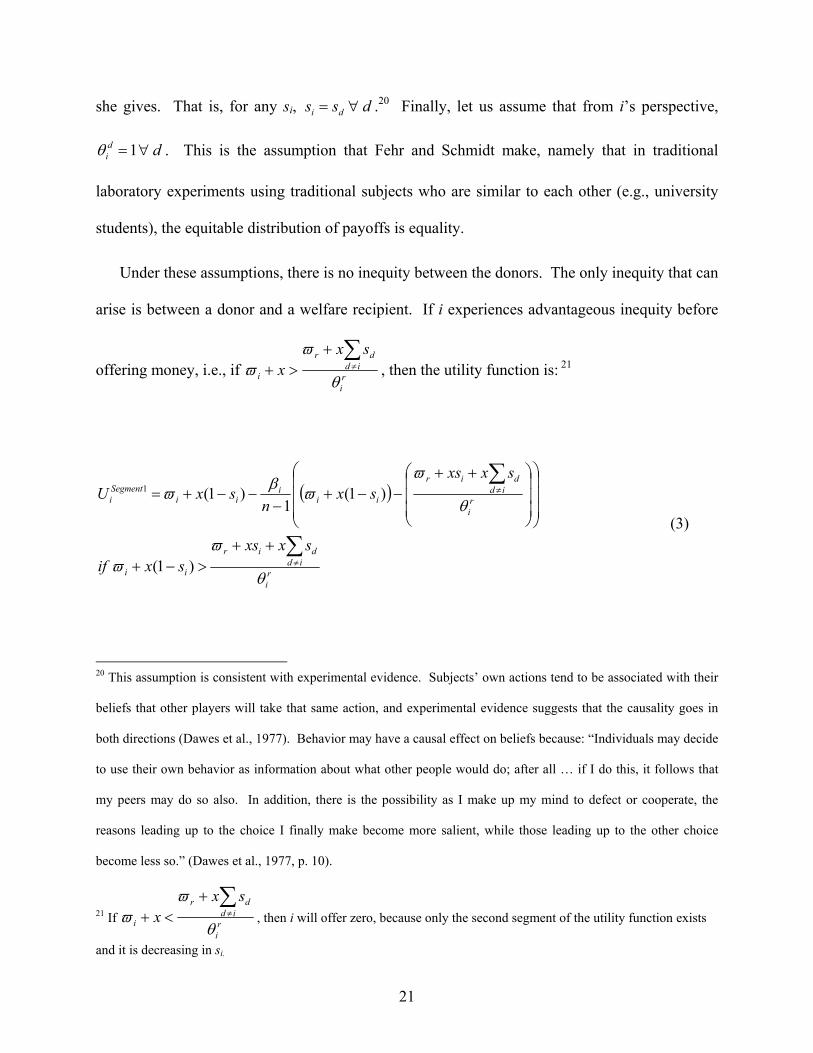
Under these assumptions, there is no inequity between the donors. The only inequity that can
arise is between a donor and a welfare recipient. If i experiences advantageous inequity before
offering money, i.e., if ri
iddr
i
sxx
θ
ϖϖ
∑≠
+>+ , then the utility function is:TP
21PT
( )
ri
iddir
ii
ri
iddir
iii
iiSegmenti
sxxssxif
sxxssx
nsxU
θ
ϖϖ
θ
ϖϖβϖ
∑
∑
≠
≠
++>−+
⎟⎟⎟
⎠
⎞
⎜⎜⎜
⎝
⎛
⎟⎟⎟
⎠
⎞
⎜⎜⎜
⎝
⎛ ++−−+
−−−+=
)1(
)1(1
)1(1
(3)
TP
20PT This assumption is consistent with experimental evidence. Subjects’ own actions tend to be associated with their
beliefs that other players will take that same action, and experimental evidence suggests that the causality goes in
both directions (Dawes et al., 1977). Behavior may have a causal effect on beliefs because: “Individuals may decide
to use their own behavior as information about what other people would do; after all … if I do this, it follows that
my peers may do so also. In addition, there is the possibility as I make up my mind to defect or cooperate, the
reasons leading up to the choice I finally make become more salient, while those leading up to the other choice
become less so.” (Dawes et al., 1977, p. 10).
TP
21PT If r
i
iddr
i
sxx
θ
ϖϖ
∑≠
+<+ , then i will offer zero, because only the second segment of the utility function exists
and it is decreasing in sBi.B
22
( )
ri
iddir
ii
iiri
iddir
iii
Segmenti
sxxssxif
sxsxxs
nsxU
θ
ϖϖ
ϖθ
ϖαϖ
∑
∑
≠
≠
++<−+
⎟⎟⎟
⎠
⎞
⎜⎜⎜
⎝
⎛−+−
⎟⎟⎟
⎠
⎞
⎜⎜⎜
⎝
⎛ ++
−−−+=
)1(
)1(1
)1(2
(4)
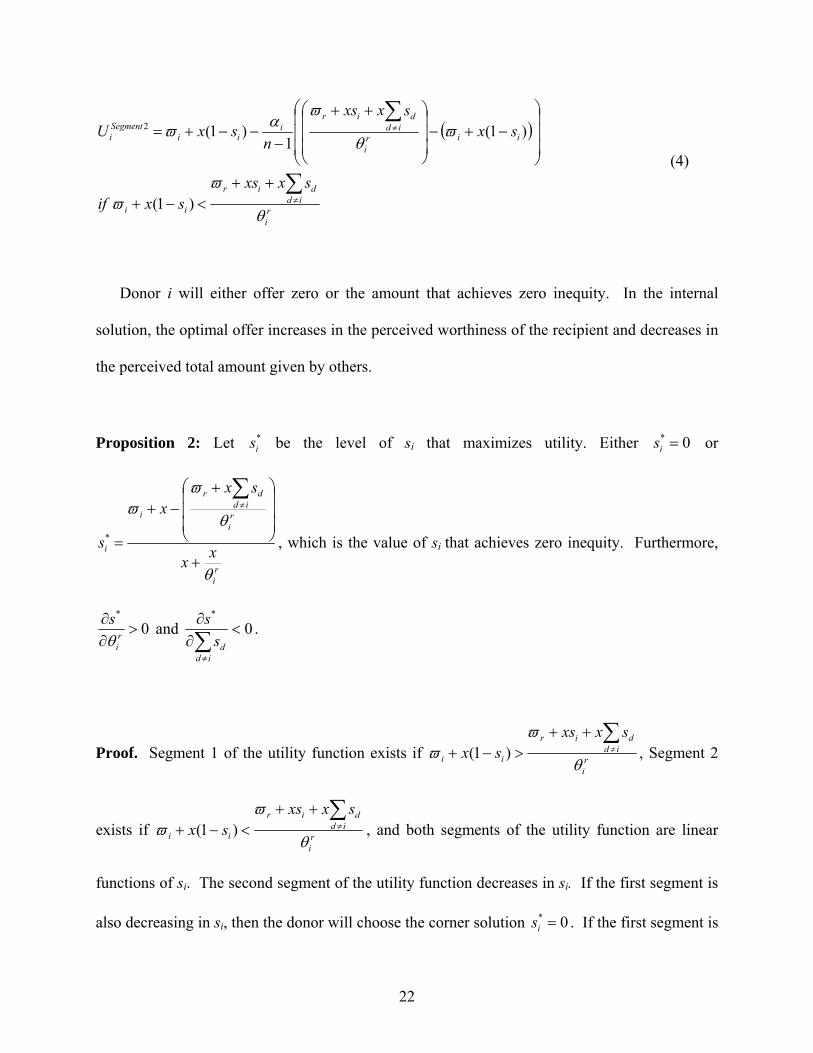
Donor i will either offer zero or the amount that achieves zero inequity. In the internal
solution, the optimal offer increases in the perceived worthiness of the recipient and decreases in
the perceived total amount given by others.
Proposition 2: Let *is be the level of sBi B that maximizes utility. Either 0* =is or
ri
ri
iddr
i
i xx
sxx
s
θ
θ
ϖϖ
+
⎟⎟⎟
⎠
⎞
⎜⎜⎜
⎝
⎛ +−+
=
∑≠
* , which is the value of s Bi Bthat achieves zero inequity. Furthermore,
0*
>∂∂
ri
sθ
and 0*
<∂∂
∑≠id
dss .
Proof. Segment 1 of the utility function exists if ri
iddir
ii
sxxssx
θ
ϖϖ
∑≠
++>−+ )1( , Segment 2
exists if ri
iddir
ii
sxxssx
θ
ϖϖ
∑≠
++<−+ )1( , and both segments of the utility function are linear
functions of s Bi B. The second segment of the utility function decreases in sBi B. If the first segment is
also decreasing in sBi B, then the donor will choose the corner solution 0* =is . If the first segment is

23
increasing in s Bi B, the donor will choose an interior solution. This occurs at the value of s Bi B where
the first segment ends and the second segment begins, which is where
ri
iddir
ii
sxxssx
θ
ϖϖ
∑≠
++=−+ )1( . This is the point of zero inequity. The partial derivatives
follow directly.■
Next, let us consider the conditions under which the interior solution will occur. It occurs
when the first segment of the utility function is increasing in sBi B. This condition can be expressed
as a threshold condition on iβ , which says that iβ must be greater than the ratio of the marginal
pecuniary cost of the offer to the marginal effect of the offer on advantageous inequity. This
condition can be simplified to:
ri
in
θ
β 11
1
+
−> (5)
This condition is more likely to be satisfied the lower n-1 is. If donor i is only concerned about
inequity between herself and the recipient, then n-1 = 1. In this case, if we assume that
10 ≤< riθ , there are two extremes. As r
iθ approaches zero, the threshold value that iβ must
exceed approaches zero and if 1=riθ the donor will choose the internal solution if 21>iβ .
Now, if the donor is also concerned about inequity between herself and other donors in the game,
then n-1 becomes large and condition (5) becomes difficult or impossible to satisfy, unless riθ is
small. Note that Riθ must be sufficiently low for there to be an internal solution. The intuition of
this is that offering money becomes a less effective tool for alleviating inequity as riθ increases,
while the marginal effect of the offer on consumption does not depend on riθ .
24
To summarize, the model suggests a definition of empathic responsiveness and shows why
conditional giving increases in empathic responsiveness. Empathic responsiveness can be
interpreted as a combination of i) a high value of iβ and ii) a focus on inequity between oneself
and the potential recipient rather than a focus on inequity between oneself and everyone in the
game (including those whom donor i does not interact with and cannot help). By this definition,
empathic responsiveness makes people more likely to choose the interior solution where offers
depend on the perceived worthiness of the recipient. Those who are low in empathic
responsiveness will choose the corner solution where offers are independent of the perceived
worthiness of the recipient.
5. Conclusion
This paper presented and interpreted a finding that people who score high on a measure of
humanitarian and egalitarian values have giving that is highly responsive to the perceived
worthiness of recipients. This is surprising because we might have expected people who score
high on this measure to behave like unconditional altruists, giving equally to all recipients, and
people who score low on the measure giving only when the recipient appears worthy. In fact,
subjects who scored high on this measure were the only subjects whose giving depended on the
perceived worthiness of recipients. Their median offer to the recipient who appeared industrious
was $5.00 out of a $10.00 pie, while the median offer of those who scored low on the measure
was only $1.00. In contrast, when the recipient appeared lazy, the median offer from those who
scored high on the measure was only $1.00 and did not differ from the median offer of those who
scored low on the measure.

25
As I have shown, this phenomenon can be interpreted by extending the Fehr-Schmidt model
of inequity aversion to accommodate perceptions of worthiness of recipients and the extent to
which inequity aversion is focused on potential recipients rather than also being applied to other
players in the game. That is, empathic responsiveness is a combination of a heightened concern
for those whom one can help and a stronger desire for equity.
The results of this paper suggest that empathic responsiveness can predict behavior across
situations that differ according to individuals’ perceptions of the worthiness of the recipients.
Unconditional altruism cannot do this. For example, inter-generational transfers have often been
modeled as motivated by unconditional altruism. Yet, are those who behave altruistically to their
aging parents or their children necessarily altruistic to the poor? The empathic responsiveness
interpretation suggests not; a single trait could predict large transfers to one’s parents but little
generosity to the poor if one believes that one’s parents deserve help but the poor do not.
26
Appendix A. The Web Survey Signif. in
pooled sample?a
1. There is plenty of opportunity in America today. Anyone who works hard can go as far as he or she wants. No 2. The distribution of income in Pennsylvania is basically fair. No 3. It is possible to redistribute income in this country without hurting the economy very much. No 4. One should be kind to all people. Yes 5. One should find ways to help others less fortunate than oneself. Yes 6. A person should be concerned about the well being of others. Yes 7. There should be equality for everyone- because we are all human beings. Yes 8. Those who are unable to provide for their basic needs should be helped by others. Yes 9. A good society is one in which people feel responsible for one another. Yes 10. Everyone should have an equal chance and an equal say in most things. Spearman 11. Acting to protect the rights and interests of other members of the community is a major obligation for all persons. Yes 12. In dealing with criminals the courts should recognize that many are victims of circumstance. No 13. Prosperous nations have a moral obligation to share some of their wealth with poor nations. Yes 14. Most people spend too much time in unprofitable amusements. No 15. Our society would have fewer problems if people had less leisure time. No 16. Money acquired easily is usually spent unwisely. Yes 17. Most people who don’t succeed in life are just plain lazy. Yes 18. Anyone who is willing and able to work hard has a good chance of succeeding. No 19. People who fail at a job have usually not tried hard enough. Yes 20. The person who can approach an unpleasant task with enthusiasm is the person who gets ahead. No 21. If people work hard enough they are likely to make a good life for themselves. No 22. I feel uneasy when there is little work for me to do. No 23. A distaste for hard work usually reflects a weakness of character. No 24. Welfare makes people work less than they would if there wasn't a welfare system. Yes 25. Welfare helps people get on their feet when facing difficult situations such as unemployment, a divorce or a death
in the family. Yes
26. Welfare encourages young women to have babies before marriage. Spearman 27. Welfare helps keep people's marriage together in times of financial problems. No 28. Welfare helps to prevent hunger and starvation. No 29. Welfare discourages young women who get pregnant from marrying the father of the child. No 30. Which of the following more often explains why a person is poor: a) lack of effort on his or her part b)
circumstances beyond his or her control c) both Yes
31. Which of the following more often explains why a person is rich: a) strong effort on his or her part b) circumstances beyond his or her control c) both
No
Note: Questions 1-29 are scaled from 1 (disagree strongly) to 5 (agree strongly). The survey also asked for the respondent’s race, sex, if any friends or family ever received welfare, and the total household income during the senior year of high school. a “Yes” denotes that the variable had a significant effect on offers in the pooled sample (n = 144) using both the Spearman Rank correlation coefficient and ordinary least squares with robust standard errors. “No” denotes that neither test showed a significant effect of the question on offers. “Spearman” denotes that only the Spearman rank correlation coefficient was significant.
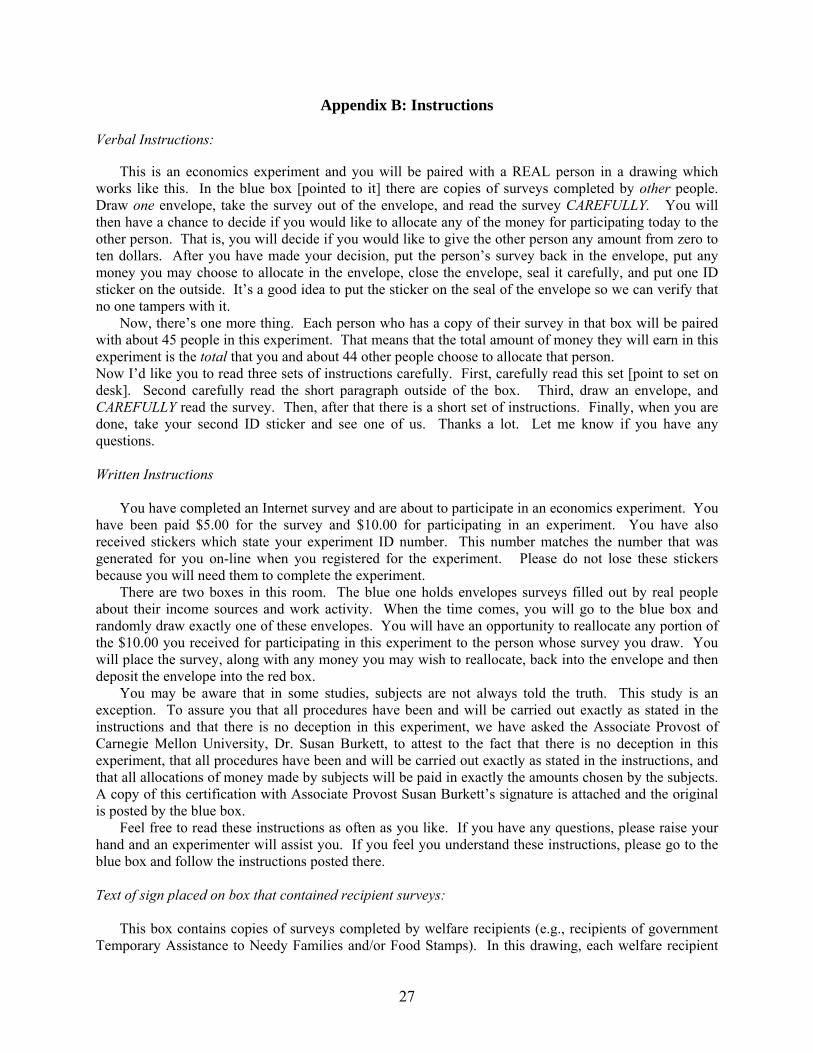
Appendix B: Instructions Verbal Instructions:
This is an economics experiment and you will be paired with a REAL person in a drawing which works like this. In the blue box [pointed to it] there are copies of surveys completed by other people. Draw one envelope, take the survey out of the envelope, and read the survey CAREFULLY. You will then have a chance to decide if you would like to allocate any of the money for participating today to the other person. That is, you will decide if you would like to give the other person any amount from zero to ten dollars. After you have made your decision, put the person’s survey back in the envelope, put any money you may choose to allocate in the envelope, close the envelope, seal it carefully, and put one ID sticker on the outside. It’s a good idea to put the sticker on the seal of the envelope so we can verify that no one tampers with it.
Now, there’s one more thing. Each person who has a copy of their survey in that box will be paired with about 45 people in this experiment. That means that the total amount of money they will earn in this experiment is the total that you and about 44 other people choose to allocate that person. Now I’d like you to read three sets of instructions carefully. First, carefully read this set [point to set on desk]. Second carefully read the short paragraph outside of the box. Third, draw an envelope, and CAREFULLY read the survey. Then, after that there is a short set of instructions. Finally, when you are done, take your second ID sticker and see one of us. Thanks a lot. Let me know if you have any questions. Written Instructions
You have completed an Internet survey and are about to participate in an economics experiment. You have been paid $5.00 for the survey and $10.00 for participating in an experiment. You have also received stickers which state your experiment ID number. This number matches the number that was generated for you on-line when you registered for the experiment. Please do not lose these stickers because you will need them to complete the experiment.
There are two boxes in this room. The blue one holds envelopes surveys filled out by real people about their income sources and work activity. When the time comes, you will go to the blue box and randomly draw exactly one of these envelopes. You will have an opportunity to reallocate any portion of the $10.00 you received for participating in this experiment to the person whose survey you draw. You will place the survey, along with any money you may wish to reallocate, back into the envelope and then deposit the envelope into the red box.
You may be aware that in some studies, subjects are not always told the truth. This study is an exception. To assure you that all procedures have been and will be carried out exactly as stated in the instructions and that there is no deception in this experiment, we have asked the Associate Provost of Carnegie Mellon University, Dr. Susan Burkett, to attest to the fact that there is no deception in this experiment, that all procedures have been and will be carried out exactly as stated in the instructions, and that all allocations of money made by subjects will be paid in exactly the amounts chosen by the subjects. A copy of this certification with Associate Provost Susan Burkett’s signature is attached and the original is posted by the blue box.
Feel free to read these instructions as often as you like. If you have any questions, please raise your hand and an experimenter will assist you. If you feel you understand these instructions, please go to the blue box and follow the instructions posted there. Text of sign placed on box that contained recipient surveys:
This box contains copies of surveys completed by welfare recipients (e.g., recipients of government Temporary Assistance to Needy Families and/or Food Stamps). In this drawing, each welfare recipient
27
will be paired with roughly 45 subjects. Therefore, the welfare recipient you draw will be paired with 44 other subjects. Please draw a survey and read it carefully. Instructions included with recipient survey in the envelope drawn from the box:
If you would like to reallocate any of the $10.00 that you received for participating in this experiment to the welfare recipient whose survey you drew, please place the money in the large yellow envelope that contained the survey.
Regardless of the amount you allocate please put the welfare recipient’s survey back into the large yellow envelope, seal it, and affix one ID sticker to the outside. Now deposit this envelope in the red box on your right. At the end of the day we will record all reallocations by ID number and then we will write a check to each recipient in the amount of her earnings from the experiment. We will send the check by certified mail.
When you have made your decision and deposited the envelope containing the survey and any money you wish to reallocate, please see an experimenter. Be sure to take your remaining ID sticker with you.
28
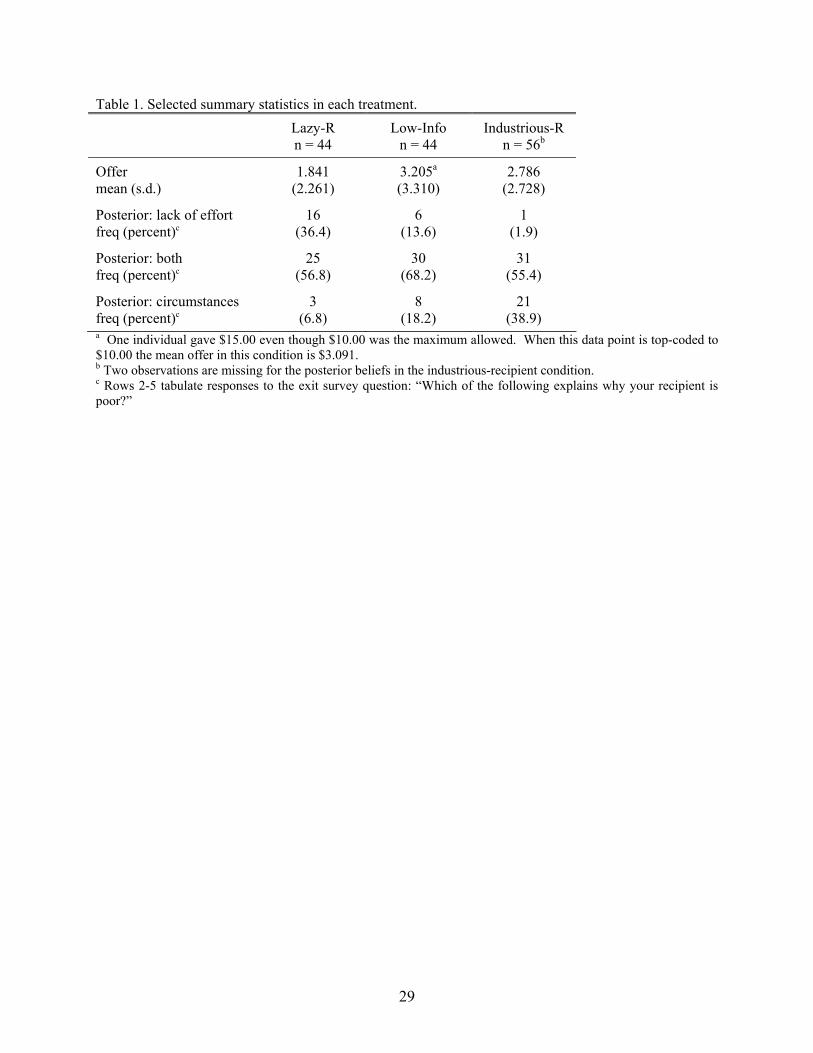
Table 1. Selected summary statistics in each treatment. Lazy-R
n = 44 Low-Info
n = 44 Industrious-R
n = 56b
Offer mean (s.d.)
1.841 (2.261)
3.205a
(3.310) 2.786
(2.728)
Posterior: lack of effort freq (percent)c
16 (36.4)
6 (13.6)
1 (1.9)
Posterior: both freq (percent)c
25 (56.8)
30 (68.2)
31 (55.4)
Posterior: circumstances freq (percent)c
3 (6.8)
8 (18.2)
21 (38.9)
a One individual gave $15.00 even though $10.00 was the maximum allowed. When this data point is top-coded to $10.00 the mean offer in this condition is $3.091. b Two observations are missing for the posterior beliefs in the industrious-recipient condition. c Rows 2-5 tabulate responses to the exit survey question: “Which of the following explains why your recipient is poor?”
29
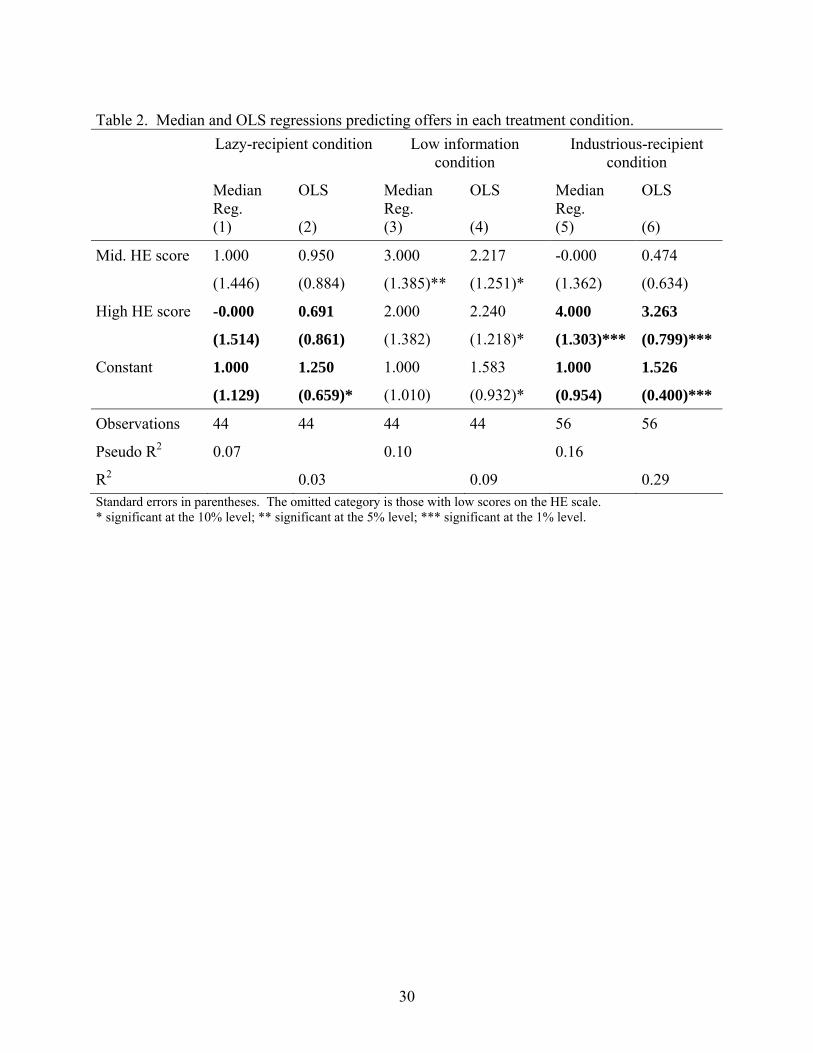
Table 2. Median and OLS regressions predicting offers in each treatment condition. Lazy-recipient condition Low information
condition Industrious-recipient
condition
Median Reg. (1)
OLS (2)
Median Reg. (3)
OLS (4)
Median Reg. (5)
OLS (6)
Mid. HE score 1.000 0.950 3.000 2.217 -0.000 0.474
(1.446) (0.884) (1.385)** (1.251)* (1.362) (0.634)
High HE score -0.000 0.691 2.000 2.240 4.000 3.263
(1.514) (0.861) (1.382) (1.218)* (1.303)*** (0.799)***
Constant 1.000 1.250 1.000 1.583 1.000 1.526
(1.129) (0.659)* (1.010) (0.932)* (0.954) (0.400)***
Observations 44 44 44 44 56 56
Pseudo R2 0.07 0.10 0.16
R2 0.03 0.09 0.29 Standard errors in parentheses. The omitted category is those with low scores on the HE scale. * significant at the 10% level; ** significant at the 5% level; *** significant at the 1% level.
30
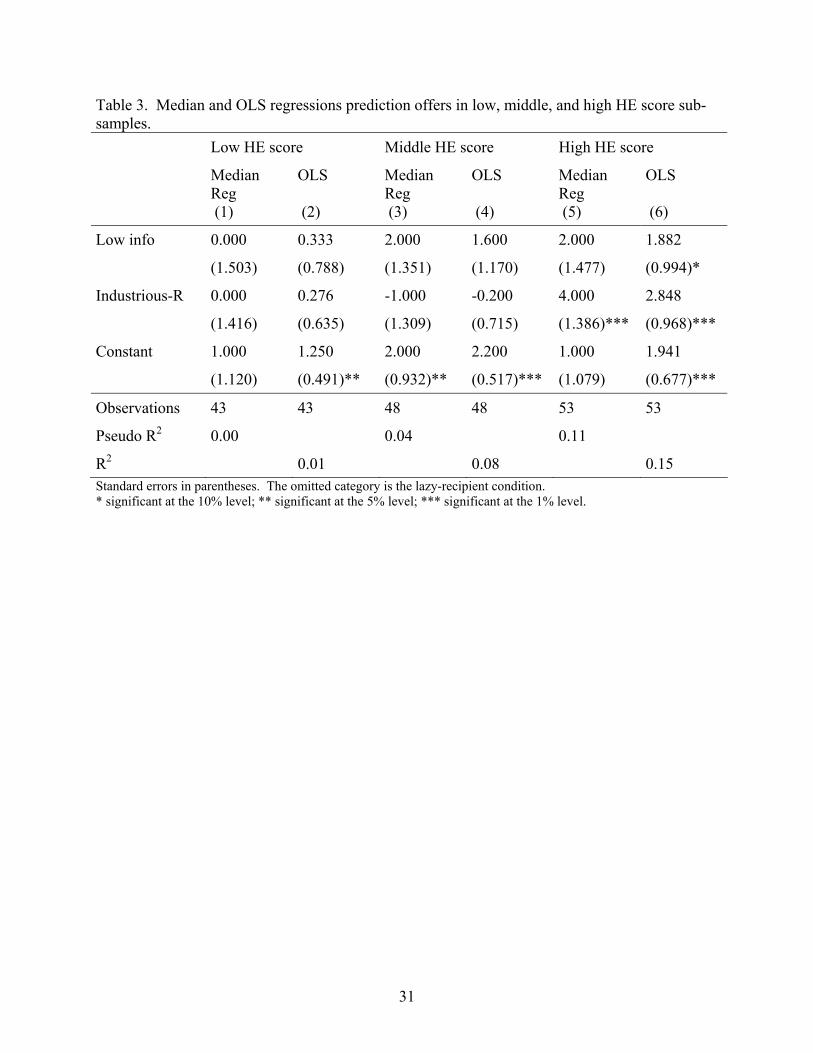
Table 3. Median and OLS regressions prediction offers in low, middle, and high HE score sub-samples. Low HE score Middle HE score High HE score
Median Reg (1)
OLS (2)
Median Reg (3)
OLS (4)
Median Reg (5)
OLS (6)
Low info 0.000 0.333 2.000 1.600 2.000 1.882
(1.503) (0.788) (1.351) (1.170) (1.477) (0.994)*
Industrious-R 0.000 0.276 -1.000 -0.200 4.000 2.848
(1.416) (0.635) (1.309) (0.715) (1.386)*** (0.968)***
Constant 1.000 1.250 2.000 2.200 1.000 1.941
(1.120) (0.491)** (0.932)** (0.517)*** (1.079) (0.677)***
Observations 43 43 48 48 53 53
Pseudo R2 0.00 0.04 0.11
R2 0.01 0.08 0.15 Standard errors in parentheses. The omitted category is the lazy-recipient condition. * significant at the 10% level; ** significant at the 5% level; *** significant at the 1% level.
31
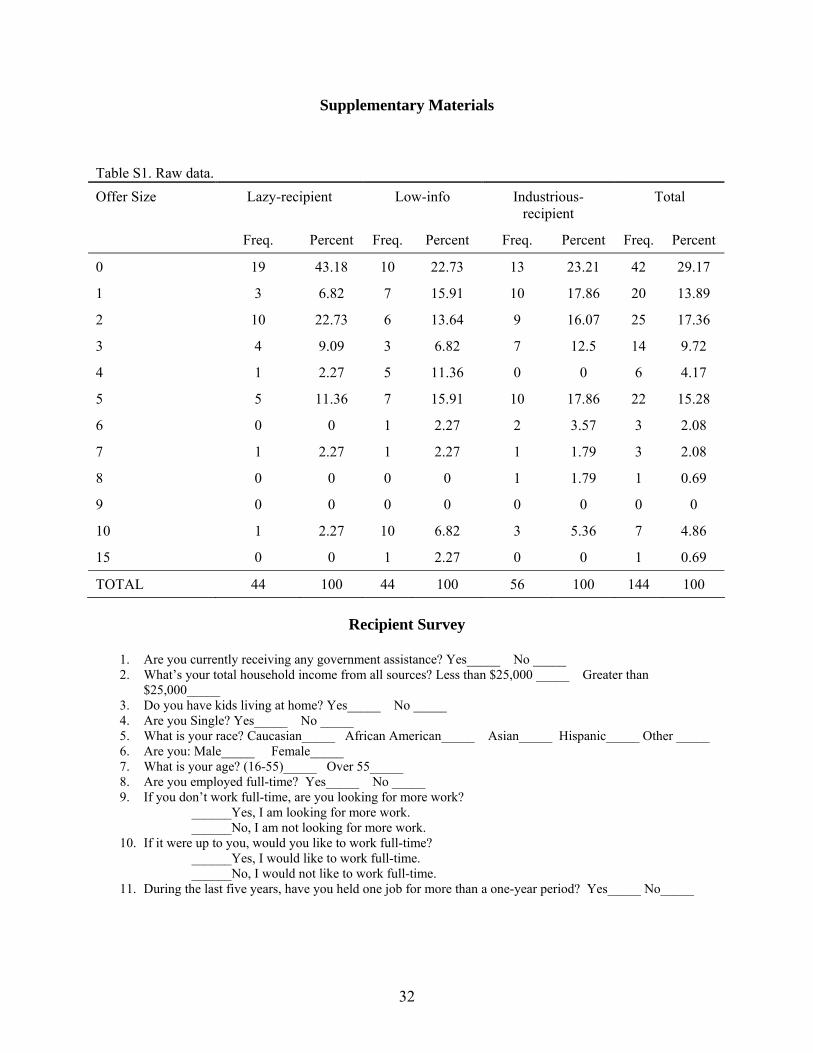
Supplementary Materials
Table S1. Raw data. Offer Size Lazy-recipient Low-info Industrious-
recipient Total
Freq. Percent Freq. Percent Freq. Percent Freq. Percent
0 19 43.18 10 22.73 13 23.21 42 29.17
1 3 6.82 7 15.91 10 17.86 20 13.89
2 10 22.73 6 13.64 9 16.07 25 17.36
3 4 9.09 3 6.82 7 12.5 14 9.72
4 1 2.27 5 11.36 0 0 6 4.17
5 5 11.36 7 15.91 10 17.86 22 15.28
6 0 0 1 2.27 2 3.57 3 2.08
7 1 2.27 1 2.27 1 1.79 3 2.08
8 0 0 0 0 1 1.79 1 0.69
9 0 0 0 0 0 0 0 0
10 1 2.27 10 6.82 3 5.36 7 4.86
15 0 0 1 2.27 0 0 1 0.69
TOTAL 44 100 44 100 56 100 144 100
Recipient Survey
1. Are you currently receiving any government assistance? Yes_____ No _____ 2. What’s your total household income from all sources? Less than $25,000 _____ Greater than
$25,000_____ 3. Do you have kids living at home? Yes_____ No _____ 4. Are you Single? Yes_____ No _____ 5. What is your race? Caucasian_____ African American_____ Asian_____ Hispanic_____ Other _____ 6. Are you: Male_____ Female_____ 7. What is your age? (16-55)_____ Over 55_____ 8. Are you employed full-time? Yes_____ No _____ 9. If you don’t work full-time, are you looking for more work?
______Yes, I am looking for more work. ______No, I am not looking for more work.
10. If it were up to you, would you like to work full-time? ______Yes, I would like to work full-time. ______No, I would not like to work full-time.
11. During the last five years, have you held one job for more than a one-year period? Yes_____ No_____
32
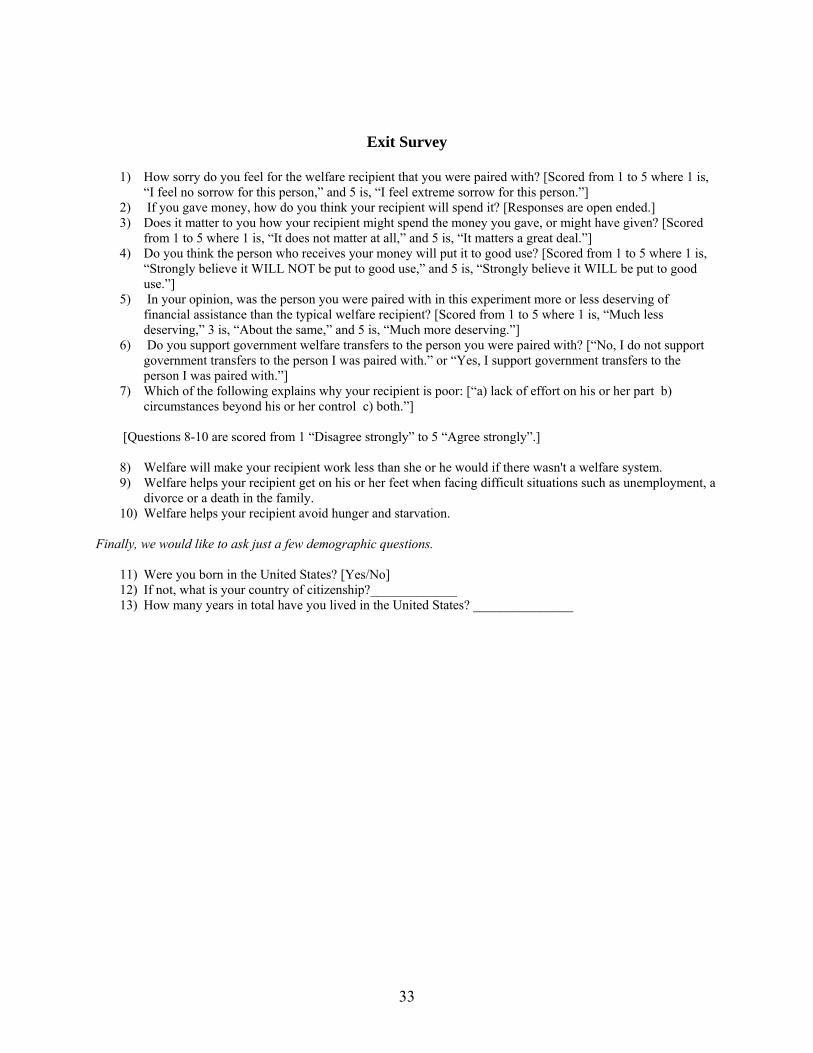
Exit Survey
1) How sorry do you feel for the welfare recipient that you were paired with? [Scored from 1 to 5 where 1 is, “I feel no sorrow for this person,” and 5 is, “I feel extreme sorrow for this person.”]
2) If you gave money, how do you think your recipient will spend it? [Responses are open ended.] 3) Does it matter to you how your recipient might spend the money you gave, or might have given? [Scored
from 1 to 5 where 1 is, “It does not matter at all,” and 5 is, “It matters a great deal.”] 4) Do you think the person who receives your money will put it to good use? [Scored from 1 to 5 where 1 is,
“Strongly believe it WILL NOT be put to good use,” and 5 is, “Strongly believe it WILL be put to good use.”]
5) In your opinion, was the person you were paired with in this experiment more or less deserving of financial assistance than the typical welfare recipient? [Scored from 1 to 5 where 1 is, “Much less deserving,” 3 is, “About the same,” and 5 is, “Much more deserving.”]
6) Do you support government welfare transfers to the person you were paired with? [“No, I do not support government transfers to the person I was paired with.” or “Yes, I support government transfers to the person I was paired with.”]
7) Which of the following explains why your recipient is poor: [“a) lack of effort on his or her part b) circumstances beyond his or her control c) both.”]
[Questions 8-10 are scored from 1 “Disagree strongly” to 5 “Agree strongly”.] 8) Welfare will make your recipient work less than she or he would if there wasn't a welfare system. 9) Welfare helps your recipient get on his or her feet when facing difficult situations such as unemployment, a
divorce or a death in the family. 10) Welfare helps your recipient avoid hunger and starvation.
Finally, we would like to ask just a few demographic questions.
11) Were you born in the United States? [Yes/No] 12) If not, what is your country of citizenship?_____________ 13) How many years in total have you lived in the United States? _______________
33
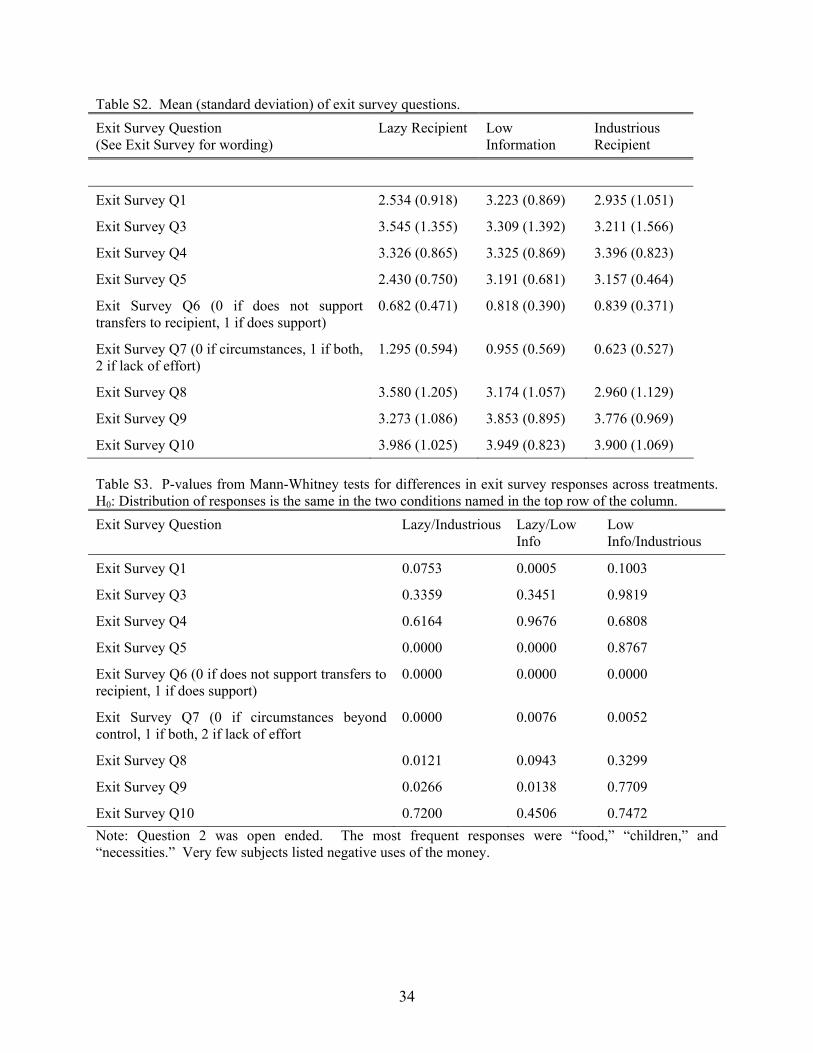
Table S2. Mean (standard deviation) of exit survey questions. Exit Survey Question (See Exit Survey for wording)
Lazy Recipient Low Information
Industrious Recipient
Exit Survey Q1 2.534 (0.918) 3.223 (0.869) 2.935 (1.051)
Exit Survey Q3 3.545 (1.355) 3.309 (1.392) 3.211 (1.566)
Exit Survey Q4 3.326 (0.865) 3.325 (0.869) 3.396 (0.823)
Exit Survey Q5 2.430 (0.750) 3.191 (0.681) 3.157 (0.464)
Exit Survey Q6 (0 if does not support transfers to recipient, 1 if does support)
0.682 (0.471) 0.818 (0.390) 0.839 (0.371)
Exit Survey Q7 (0 if circumstances, 1 if both, 2 if lack of effort)
1.295 (0.594) 0.955 (0.569) 0.623 (0.527)
Exit Survey Q8 3.580 (1.205) 3.174 (1.057) 2.960 (1.129)
Exit Survey Q9 3.273 (1.086) 3.853 (0.895) 3.776 (0.969)
Exit Survey Q10 3.986 (1.025) 3.949 (0.823) 3.900 (1.069) Table S3. P-values from Mann-Whitney tests for differences in exit survey responses across treatments. H0: Distribution of responses is the same in the two conditions named in the top row of the column. Exit Survey Question Lazy/Industrious Lazy/Low
Info Low Info/Industrious
Exit Survey Q1 0.0753 0.0005 0.1003
Exit Survey Q3 0.3359 0.3451 0.9819
Exit Survey Q4 0.6164 0.9676 0.6808
Exit Survey Q5 0.0000 0.0000 0.8767
Exit Survey Q6 (0 if does not support transfers to recipient, 1 if does support)
0.0000 0.0000 0.0000
Exit Survey Q7 (0 if circumstances beyond control, 1 if both, 2 if lack of effort
0.0000 0.0076 0.0052
Exit Survey Q8 0.0121 0.0943 0.3299
Exit Survey Q9 0.0266 0.0138 0.7709
Exit Survey Q10 0.7200 0.4506 0.7472 Note: Question 2 was open ended. The most frequent responses were “food,” “children,” and “necessities.” Very few subjects listed negative uses of the money.
34
References
Alesina, A. and Angeletos, G.-M., (2002). 'Fairness and redistribution: US versus Europe',
Mimeo, vol.
Alesina, A., Glaeser, E. and Sacerdote, B., (2001). 'Why doesn't the United States have a
European-style welfare state?' Brookings Papers on Economic Activity, vol. 2.
Andreoni, J., (1989). 'Giving with impure altruism: Applications to charity and Ricardian
equivalence', Journal of Political Economy, vol. XCVII, 1447-1458.
Batson, C. D., (1997a). 'Perspective taking: Imagining how another feels versus imagining how
you would feel', Personality and Social Psychology Bulletin, vol. 23, (7), 751-758.
Batson, C. D., (1997b). 'Self-other merging and the empathy-altruism hypothesis: Reply to
Neuberg et al. (1997)', Journal of Personality and Social Psychology, vol. 73, (3), 517-
522.
Becker, G., (1974). 'A theory of social interactions', Journal of Political Economy, vol. 82,
(Nov./Dec.), 1063-1093.
Benabou, R. and Tirole, J., (2002). 'Belief in a just world and redistributive politics', Mimeo, vol.
Ben-Ner, A., Kong, F. and Putterman, L., (2001), 'Share and share alike? Intelligence,
socialization, personality, and gender-pairing as determinants of giving'.
Besley, T. and Coate, S., (1992). 'Understanding taxpayer resentment and statistical
discrimination', Journal of Public Economics, vol. XLVIII, 165-183.
Bohnet, I. and Frey, B. S., (1999). 'Social distance and other-regarding behavior in dictator
games: Comment', American Economic Review, vol. 89, (1), 335-339.
Bolton, G. and Ockenfels, A., (2000). 'ERC-a theory of equity, reciprocity, and competition',
American Economic Review, vol. 90, 166-193.
35
Bowles, S. and Gintis, H., (2000). 'Reciprocity, self-interest and the welfare state', Nordic
Journal of Political Economy, vol. XXVI, 33-53.
Bowles, S. and Gintis, H., (2002), 'The evolution of strong reciprocity', 'Santa Fe Institute
Working Paper'.
Camerer, C., (2003). Behavioral game theory: Experiments on strategic interaction, Princeton:
Princeton University Press.
Carpenter, J., (2003). 'Is fairness used instrumentally? Evidence from sequential bargaining',
Journal of Economic Psychology, vol. 24, 467-489.
Cherry, T., Frykblom, P. and Shogren, J., (2002). 'Hardnose the dictator', American Economic
Review, vol. 92, (4), 1218-1221.
Dawes, R. M., McTavish, J. and Shaklee, H., (1977). 'Behavior, communication, and
assumptions about other people's behavior in a commons dilemma situation', Journal of
Personality and Social Psychology, vol. 35, (1), 1-11.
Deutsch, M., (1985). Distributive justice, New Haven: Yale University Press.
Dufwenberg, M. and Kirchsteiger, G., (1999). 'A theory of sequential reciprocity', Games and
Economic Behavior, vol. forthcoming.
Eckel, C. and Grossman, P., (1996). 'Altruism in anonymous dictator games', Games and
Economic Behavior, vol. 16, 181-191.
Falk, A. a. U. F., (1998). 'A theory of reciprocity', University of Zurich Working Paper, vol.
Fehr, E., Fischbacher, U. and Gächter, S., (2002). 'Strong reciprocity, human cooperation and the
enforcement of social norms', Human Nature, vol. 3, 1-25.
Fehr, E. and Schmidt, K., (1999). 'A theory of fairness, competition and cooperation', Quarterly
Journal of Economics, vol. 114, 817-868.
36

Fehr, E. and Schmidt, K., (forthcoming). 'Theories of fairness and reciprocity - evidence and
economic applications', In: (M. Dewatripont, L. Hansen and St. Turnovsky, eds.),
Advances in economics and econometrics, eighth world congress of the econometric
society, Cambridge: Cambridge University Press.
Fong, C., (2001). 'Social preferences, self-interest, and the demand for redistribution', Journal of
Public Economics, vol. 82, (2), 225.
Fong, C. M., 2004. Which beliefs matter for redistribution politics? Target-specific versus
general beliefs about the causes of income, Mimeo.
Fong, C. M., Bowles, S. and Gintis, H., (forthcoming). 'Reciprocity and the welfare state', In:
(Serge-Christophe Kolm and Jean Mercier Ythier, eds.), Handbook on the economics of
giving, reciprocity, and altruism, Amsterdam: North-Holland/Elsevier.
Gallup Organization, (1998), 'Haves and have-nots: Perceptions of fairness and opportunity'.
Gallup Organization.
Gilens, M., (1999). Why Americans hate welfare: University of Chicago Press.
Glaeser, E., Laibson, D., Scheinkman, J. and Soutter, C., (2000). 'Measuring trust', The Quarterly
Journal of Economics, vol. 115, 811-846.
Gunnthorsdottir, A., McCabe, K. and Smith, V., (2002). 'Using the Machiavellianism instrument
to predict trustworthiness in a bargaining game', Journal of Psychology and Economics,
vol. 23, 49-66.
Heclo, H., (1986). 'The political foundations of antipoverty policy', In: (Sheldon H. Danziger and
Daniel H. Weinberger, eds.), Fighting poverty, Cambridge: Harvard University Press.
Hoffman, E., McCabe, K. and Smith, V., (1996). 'Social distance and other regarding behavior in
dictator games', American Economic Review, vol. 86, (3), 209-215.
37
Hoffman, E. and Spitzer, M. L., (1985). 'Entitlements, rights, and fairness: An experimental test
of subjects' concepts of distributive justice', Journal of Legal Studies, vol. 14, (June).
Jenni, K. E. and Loewenstein, G., (1997). 'Explaining the 'identifiable victim effect'', Journal of
Risk and Uncertainty, vol. 14, (3), 235-257.
Katz, I. and Hass, G. R., (1989). 'Racial ambivalence and American value conflict: Correlational
and priming studies of dual cognitive structures', Journal of Personality and Social
Psychology, vol. 55, (6), 893.
Konow, J., (2002), 'Which is the fairest one of all? A positive analysis of justice theories'.
Levine, D., 'Modeling altruism and spitefulness in experiments', Review of Economic Dynamics,
vol. 1, 593-622.
Lindbeck, A., Nyberg, S. and Weibull, J., (1999). 'Social norms and economic incentives in the
welfare state', The Quarterly Journal of Economics, vol. CXIV, 1-35.
Lipset, S. M., (1967). The first new nation, Garden City, NY: Doubleday.
Loewenstein, G., Thompson, L. and Bazerman, M., (1989). 'Social utility and decision making in
interpersonal contexts', Journal of Personality and Social Psychology, vol. LVII, 426-
441.
Luttmer, E., (2001). 'Group loyalty and the taste for redistribution', Journal of Political
Economy, vol. 109, (3), 500-528.
Miller, D., (1992). 'Distributive justice: What the people think.' Ethics, vol. 102, (April), 555-
593.
Moffitt, R., Ribar, D. and Wilhelm, M., (1998). 'The decline of welfare benefits in the US: The
role of wage inequality.' Journal of Public Economics, vol. 68, (3), 421-452.
38
Piketty, T., (1995). 'Social mobility and redistributive politics', The Quarterly Journal of
Economics, vol. 110, 551-584.
Piven, F. and Cloward, R., (1971). Regulating the poor, New York: Random House.
Preston, S. and de Waal, F. B. M., (2001). 'Empathy: Its ultimate and proximate bases',
Behavioral and Brain Sciences, vol.
Rabin, M., (1993). 'Incorporating fairness into game theory and economics', American Economic
Review, vol. 83, (5), 1281-1292.
Romer, P., (1994). Preferences, promises, and the politics of entitlement, Chicago and New
York: University of Chicago Press.
Skitka, L. and Tetlock, P., (1993). 'Providing public assistance: Cognitive and motivational
processes underlying liberal and conservative policy preferences', Journal of Personality
and Social Psychology, vol. 65, (6), 1205-1223.
Small, D. A. and Loewenstein, G., (2003). 'Helping a victim or helping the victim: Altruism and
identifiability', Journal of Risk and Uncertainty, vol. 26, (1), 5-16.
Smith, A., (2002). Theory of moral sentiments (1759), Cambridge: Cambridge University Press.
Sobel, J., (2001), 'Interdependent preferences and reciprocity'.
Van Dijk, F., Sonnemans, J. and van Winden, F., (2002). 'Social ties in a public good
experiment', Journal of Public Economics, vol. 85, 275-299.
Walster, E. G., Walster, W. and Berscheid, E., (1978). Equity: Theory and research, Boston:
Allyn and Bacon.
Weiner, B., (1995). Judgments of responsibility, New York: The Guilford Press.
Williamson, J. B., (1974). 'Beliefs about the motivation of the poor and attitudes toward poverty
policy', Social Problems, vol. 21, (5), 734-747.
39