Embed Size (px)
Citation preview

:
http://www.wiwi.uni-konstanz.de/econdoc/working-paper-series/
Un ive rs i ty o f K on s ta n z De pa rtmen t o f Econ om ics
A Randomized Controlled Trial of Teaching Methods: Do Classroom Experiments Improve
Economic Education in High Schools?
Gerald Eisenkopf and Pascal Sulser
Working Paper Series 2013-17
A Randomized Controlled Trial of Teaching Methods:
Do Classroom Experiments improve Economic
Education in High Schools?∗
by Gerald Eisenkopf† and Pascal Sulser†
This version: July 21, 2013
First version: February 15, 2013
Abstract: We present results from a field experiments at Swiss high schools in which we
compare the effectiveness of teaching methods in economics. We randomly assigned classes
into an experimental and a conventional teaching group, or a control group that received
no specific instruction. Both of our teaching treatments improve economic understand-
ing considerably while effect sizes are almost identical. However, student ability crucially
affects learning outcomes as more able students seem to benefit disproportionately from
classroom experiments while weaker students lose out. Supplemental data indicates that
our experimental treatment crowded out time for adequately discussing the subject, which
may have limited less able students to generate a profound understanding. Furthermore
there is no robust impact of economic training on social preferences, measured as both
individual behavior in incentivized decisions or political opinions.
JEL Classification: A21, C93, I21
Keywords: Education of Economics, Classroom Experiments, Conventional Teaching,
Field Experiments, Indoctrination
∗Special thanks go to Michael Manz without whom this study would not have been possible. Special thanksalso go to Urs Fischbacher for his great support throughout the entire research project. Furthermore, we wouldlike to thank all seminar participants at the University of Konstanz, the Thurgau Institute of Economics, theSwiss Leading House Economics of Education, and the Economics of Education Committee of the Verein fürSocialpolitk for helpful comments. Anne Wunderlich provided valuable research assistance. Data was collectedwhile both Manz and Sulser where employees of the Research Coordination and Education unit at the SwissNational Bank. We gratefully acknowledge financial and logistical support from the Swiss National Bank.†Department of Economics, University of Konstanz, 78457 Konstanz, Germany, and Thurgau Institute of
Economics, Hauptstrasse 90, 8280 Kreuzlingen 2, Switzerland. Eisenkopf: [email protected]: [email protected].

I. IntroductionWhile classroom experiments are perennially popular in the natural sciences, scholars of eco-
nomic sciences promote this teaching instrument since only recently (e.g. Bergstrom and Miller,
2000). On the notion that rather abstract economic theory is best understood through actual
application, various kinds of experiments were developed to demonstrate certain characteristics
of economic interactions.1 Unlike experiments in physics or chemistry, however, economic class-
room experiments rely on introspection, and as such students are not merely spectators but
active participants in the investigation themselves. It is argued that this participatory expe-
rience enhances students’ interest into economics and thus stimulates learning more effectively
than conventional instruction (e.g. Becker and Watts, 1998; Walstad and Saunders, 1998; Kolb,
1983). Yet student behavior may also contradict economic assumptions, causing harm to both
the reputation of teachers and economic theory. In the early 1990s, Fels (1993) pointed out the
irony that no proponent of classroom experiments had performed a controlled study to evaluate
the impact of this teaching method, and that conclusion was drawn primarily from anecdotal
evidence. Since then, some effort has been put into closing that research gap (Cardell et al.,
1996; Gremmen and Potters, 1997; Frank, 1997; Cebula and Toma, 2002; Emerson and Taylor,
2004, 2007; Dickie, 2006; Ball et al., 2006; Durham et al., 2007; Mitchell, 2008; Dufwenberg and
Swarthout, 2009). However, a systematic evaluation at education levels other than universities
is missing.
We address this issue within a comprehensive field experiment at high schools. Economics at
the upper secondary level is typically part of an integrated curriculum. Hence, the composition
of the student body is less selective in high schools than in undergraduate economics courses
at universities. Educational environments are varying, too. Classes, for example, can easily
account for over one hundred students in tertiary education. In upper secondary schools these
figures are typically in the lower twenties. In addition, university teachers increasingly rely on
experiments in their own research, and thus might be more receptive to the methodological value
of experiments as a teaching instrument. Apart from concentrating on a different education level,
existing studies also face methodological drawbacks that we address later in this introduction.2
These drawbacks relate to the role of teachers. Most of these studies involve only few teachers
and rarely are they assigned randomly into different educational settings. Some authors also
participated as teachers in their own studies, which is challenging an unprejudiced judgement.
Our data comes from several high schools in the German-speaking part of Switzerland. 311There is certainly no shortage in interactive teaching concepts. Some are already used in undergraduate
and graduate courses in higher education, and new proposals for classroom experiments appear frequently (Ro-jas, 2011; Diduch, 2010; Gächter and Königstein, 2009; Basuchoudhary et al., 2008; Pickhardt, 2005; Holt andLaury, 1997). However, there are only few tailored to the level of secondary education. Readers who like toconduct classroom experiments on their own find plenty of useful information in Holt (1999) or Bergstrom andMiller (2000), whereas Dickie (2006) and Cheung and Fujii (2006) discuss the problem of adequate incentives inparticular.
2Most of the systematic evidence in educational research is derived from meta-analyses (Fraser et al., 1987;Scheerens and Bosker, 1997; Seidel and Shavelson, 2007). The studies discussed therein rarely make use ofcontrolled experiments and largely ignore the impact of self-selection.
1

teachers participated with 42 classes, totaling in 720 students observed. We randomly assigned
the classes into different teaching contexts. One group of classes received no instructions prior
to the evaluation. This we label the Control group. A second group participated in a class-
room experiment on the matter of common-pool resources (CPR) problems while keeping to
standardized instructions for a follow-up lesson on the same topic. This set of instructions
comprised worksheets with comprehension questions, a summary text with various examples
of CPR problems as well as a case-study illustrating the problem of overfishing. We refer to
this as the Experiment group. Classes of a third group also relied on the aforementioned set
of instructions, but instead of carrying out the experiment we requested teachers to prepare
an introductory lecture on the nature of CPR problems on their own. This is denoted the
Standard group. Thus, we compare the effectiveness of a classroom experiment in comparison
to common (non-experimental) teaching practices. Treatment effects are captured threefold:
students’ performance in a test of economic understanding, social preferences in the form of
both individual behavior in incentivized economic decisions and statements on political views,
and an assessment of experimental and conventional instruction from participating teachers.
We took great care to ensure a conservative identification of differences between treatment
groups. First, we investigated economic understanding rather than knowledge of economic
terminology by using jargon-free language. For this we rely on our own set of test questions in
which students are asked specifically on those domains that relate to our teaching instructions.
Second, teachers of both treatment groups were required to spend the same amount of time
teaching on this particular subject. Hence, we also capture the opportunity costs of classroom
experiments. Third, teachers of the Standard group were given a reasonable amount of leeway in
doing so. Their sole confinement was a strict prohibition of the conduct of any type of classroom
experiment. Last, we ensured that there was always at least one working day and a weekend
between a treatment intervention and the evaluation.
Our study extends on two different areas independently. First and foremost, we provide evi-
dence on the effectiveness of experimental instruction in economics, which is typically measured
by the treatment differences in student test scores. Many researches rely on the standardized
Test of Understanding in College Economic (TUCE). In some cases this test allows to draw
comparisons in effect sizes between different studies, but it might fail to capture the essence
of what was taught in class and thus only vaguely reflect true learning effects. While scholars
like Becker (1997) criticize the validity of such a crude measure quite generally, reliance on this
approach seems appropriate in particular when the experimental group is exposed to a series of
classroom experiments on different topics, and over a longer period of time.
One of those studies is Emerson and Taylor (2004). In a rather comprehensive endeavor,
they observe how students in two experiment sections (59 students) and seven lecture-oriented
sections (241 students) prevail in the microeconomics portion of the TUCE. Eleven pencil and
paper experiments were drawn from the Bergstrom and Miller (2000) textbook. Their main
finding is a significant improvement in the test score for participants of the experiment group
2

while also controlling for various student characteristics.3 A largely similar approach is followed
in Dickie (2006). Using a sample of 142 students and a set of seven microeconomics experiments,
TUCE score improvements are significantly larger in the experimental group, but adding grade
incentives for success in the experiments negatively impacts these benefits. Some evidence is
also found that higher-achieving students experience the largest benefits from the experimental
approach, and in that his results contradict previous findings by Emerson and Taylor (2004).
Durham et al. (2007) also investigate multiple economic concepts experimentally. The au-
thors, however, diverge from the above studies in two important domains. Not only did they
observe both micro- and macroeconomic issues, they also created their own instrument with
the intent to measure more precisely whether students are learning what the experiments were
designed to teach. The authors included eight introductory microeconomics and eight introduc-
tory macroeconomics sections, totaling in 1585 student participants. Their results too indicate
that classroom experiments improve student performance. In addition, they also look into how
these gains vary across students with different learning styles. Here they observe that benefits
apply differently. In particular, multimodal and kinesthetic learners, who together account for
over 85% of all of their students, significantly improved performance with the use of experi-
ments in comparison to traditional lecture-style teaching. Similarly, Ball et al. (2006) also rely
on their own instrument using exam scores. Their particular innovation lies in the observation
of a wireless interactive teaching system, which is arguably better suited for experiments in large
classes. They too report a (weakly significant) positive overall effect. They also find that exper-
iments have generated a larger impact on freshmen, a cohort—although exposed distinctively
to self-selection—with similar economic experience as students from our sample.
In terms of instructional content, the study by Frank (1997) is the most similar to ours, as
he observes the efficacy of a single experiment in lectures on the “tragedy of the commons”.
Conceptually, however, his study is different. Participating teachers gave their usual lecture
on the topic and evaluation followed right after, except for the experiment group that carried
out a five to ten minutes game in between. However, only few students of each experiment
group actually participate in the classroom game while the large majority was expected to
learn from their behavior. Hence, where he observes passive learning from an experiment that
is conceptually separate from a teacher’s lecture, we observe active learning from a largely
standardized intervention that is conceptualized as comprehensive and coherent teaching unit.
All in all, we have shown that there is a general tone of sympathy towards experimental
instruction in these previous studies.4 Only Cardell et al. (1996), Mitchell (2008), and Dufwen-
berg and Swarthout (2009) do not identify a positive effect of classroom experiments. To our3In a follow-up study on the same data, Emerson and Taylor (2007) furthermore observed whether associations
exist between students’ personality types and performance in economics classes. Results indicate that experimentsbenefit, or are at least neutral with respect to many of the 16 Myers-Briggs type indicators.
4Evidence from classroom experiments in subjects other than economics indicate that they are beneficialfor developing reading skills (Fraser, Walberg, Welch, and Hattie, 1987), and for improving the understandingof natural sciences. Yet even in the latter context, evidence is not unambiguous (e.g. Kirschner and Huisman,1998).
3
knowledge, there is no study finding an overall negative effect of experiments on students’ per-
formance.
Apart from the contribution to the education of economics literature our study is the first
to investigate systematically the role of teaching methods as a source of indoctrination. With
their strong emphasis on free-riding incentives, both of our teaching interventions might cause
participants to display a more accentuated behavior of self-interest in our set of incentivized
economic decisions. First-hand experiences on the effectiveness of self-serving strategies might
cause students of the Experiment group to internalize such behavior even more strongly.
Several studies suggest that students of economics tend to behave more selfishly than other
people (e.g. Marwell and Ames, 1981; Carter and Irons, 1991; Frank et al., 1993; Selten and
Ockenfels, 1998; Frank and Schulze, 2000). But to what extent self-interested behavior is due
to instruction rather than selection into the economics discipline, is a matter of ongoing debate.
Frey and Meier (2003) provide evidence from a natural setting. They study voluntary donation
behavior into two social funds of the University of Zurich. They conclude that the willingness
to donate decreases generally over the time students (of any major) are enlisted. Significantly
lower contribution by students of business administration seem due to self-selection rather than
indoctrination. Moreover, students with a history of economic education in high schools give
less as well (although the authors miss the opportunity to control for interaction effects between
pre-university economic education and major field of study). Bauman and Rose (2011) confirm
these findings. They take a very similar approach observing voluntary contributions to social
programs of the University of Washington. In contrast to the previous study, the authors
are able to control for non-major students who nonetheless took courses in microeconomics.
Economics majors appear less pro-social but unaffected by indoctrination. Interestingly though,
economics training seems to have an indoctrination effect on non-majors as these students reduce
contribution if introductory or intermediate microeconomics courses had been attended.
The paper is structured as follows: In the next section we introduce our research design in
greater detail. In section 3 we present our predictions. Section 4 provides the data and section
5 the results. Section 6 summarizes and concludes.
II. Design and ProceduresWe describe essential features of our treatment interventions at first and deal with the evaluation
procedure—which is the same for all participants—in the following. We then present informa-
tion regarding the recruiting procedure and the random assignment of classes into control or
treatment groups, and conclude with a description of our sample selection.
4
II.1. Treatment Interventions
We have a Control group and two teaching treatments. We deliberately altered didactic instru-
ments in the two teaching treatments in order to identify the effect of classroom experiments on
individual learning. The inclusion of a Control group provides a reference point for comparing
knowledge acquisition and behavioral change. For that reason, students in the Control group
only participated in the test and the questionnaire, which are detailed below.
In both teaching treatments teachers relied on material from a teaching module on common-
pool resources (CPR) problems provided by the Swiss National Bank.5 We chose this particular
module because of its potential impact on social preferences and political opinions. It was devel-
oped in close cooperation with educational experts and covers a rather broad range of aspects.
For example, it consists not only of standard solutions to CPR problems—i.e. privatization or
governmental control—but also incorporates the role of social norms, collective decision-making
or collective sanctioning. Teachers participating in treatment sessions obtained the same over-
all teaching goals. In particular, students received instructions on distinctive features of CPR
goods and the predicaments arising from the incentive structure. Educational objectives aimed
at the identification of situations that share similarities with typical CPR problems, anticipating
behavior of rationally thinking and (potentially) self-serving individuals within various institu-
tional environments, and proposing solutions to the problem of overexploitation. Teachers were
encouraged to spend two lessons (of 45 minutes each) on the topic, which is a rather typical di-
mension for lecturing in a particular subject. We provided a package with all necessary teaching
material in advance. Common to both treatments were worksheets for students with compre-
hension questions and a sample solution for teachers as well as a summary text for students,
with various examples and a recapitulation of key aspects of CPR problems. We also provided
teachers with overhead transparencies for a case-study illustrating the problem of overfishing in
the Atlantic sea. A cover letter accompanied the package, including a step-by-step guideline for
all necessary procedures and other aspects worthy of note.
In the Experiment treatment, teachers carried out the module as intended by the Swiss Na-
tional Bank. This means that approximately one lesson was used for the classroom experiment
while the remaining 45 minutes were spent deepening the theoretical understanding for CPR
problems (based on the case study and other material mentioned above). The classroom ex-
periment resembles an interactive fishing game that mirrors the incentive structure of a CPR
problem. Specifically, students make anonymous claims for various amounts of fish per round
(non-excludability) but fishing a higher quota than what the regeneration process allows leads
fish to die out early (rivalry in consumption). At the beginning of the game, the pond contains5The corresponding teaching platform is accessible online under www.iconomix.ch. It is described as a web-
based tool used in the teaching of economics. It offers a range of teaching units that can be either downloadedor ordered. It is primarily intended for use by teachers of economics and humanities at upper secondary schools.It sees itself as “the ideal complement to today’s teaching resources” as it allows you to easily put togetherinteresting, enjoyable, task-based lessons on economics. Many of these teaching units incorporate some sort ofclassroom experiment.
5

four fish per player whereas in each of the 10 rounds, every player may catch between zero
and three fish anonymously (by wearing masks). The number of fish remaining in the pond
doubles between rounds. However, there is a capacity limit. The pond cannot hold more than
four fish per player. Students are told that they can win the game only by catching the most
fish of all participants. As such, profit maximizing participants have an incentive to exceed the
sustainable quota to the detriment of the others. Succeeding in the game may be incentivized
by providing sweets or comparable low-value goods for the winner(s). The game features three
variations comprising the above standard situation, a situation with the option to punish the
action of others while in turn bearing individual costs, and a situation where students can call
a class conference and formulate non-binding agreements whenever they see fit. The standard
situation was mandatory while the other two variants were optional. The game is neutral in
framing in order to provide an experience free of any moral or social prejudice and as such does
not depend on a specific real-world problem. After having completed the game, students were
made aware of the severity of CPR problems in real-world situations by introducing them to
the above mentioned case-study on the collapse of Atlantic cod stocks. The outcome of the
game was discussed in the light of this particular issue while working through the comprehen-
sion questions and the summary text allowed students to deepen their understanding of CPR
problems in a range of different contexts.
Classes in the Standard treatment did not participate in the above classroom experiment.
Other than that, teaching goals and material was the same as described earlier. Specifically,
teachers were encouraged to start their lesson with the previously mentioned case-study and
to work through the same exercises and to read the same résumé. Stripping teachers from the
obligation to conduct the classroom experiment, however, frees up some time. This is why for the
reminder of the two lessons they were free to choose the most suitable way to teach the subject.
We deliberately conceded this amount of freedom in order to establish a credible common
practice comparison for the classroom experiment. The only constraint was that teachers must
not play any sort of classroom games in order to keep the treatment groups separate. About
halve of all teachers reportedly used newspaper articles, movie segments or chapters out of a
book to complement their lesson. The other halve preferred not to supplement their lesson with
additional material but instead spent more time deliberating on the case-study, discussing the
worksheets and/or the summary text. Learning success therefore comes from students being
exposed to a teachers’ best practice approach to a lecture-oriented lesson with a well-defined
educational objective.
In addition to treatment-specific instructions, each teacher received a questionnaire compris-
ing standardized questions. This questionnaire was handed out in two parts. Whereas the first
part was identical between both treatments and the Control group, the second was targeted on
treatment-specific attributes only. Questions common to all treatments were meant to capture
general characteristics of the class under evaluation. Treatment-specific questions allowed for a
comparison of measured learning achievements through CPR test scores with the teachers’ sub-
6
jective view on the success of their lesson. Teachers’ feedback also provided valuable information
on the effort invested into preparing their lesson or the way instructions were implemented. All
material students or teachers received for this study is provided in the appendix.
II.2. Evaluation Procedure
The completion of both the test and the questionnaire took no longer than 45 minutes and
was supervised by one of the authors together with the economics teacher of the respective
class. The procedure was as follows: After a standardized introduction we handed out tests
and questionnaires simultaneously. Both were marked with unique random numbers in order
to guarantee full anonymity. Students were told to start with the tests. These were collected
after a predefined time limit. Students then continued with the questionnaire. On average, a
student received 14.3 Swiss francs (about EUR 9.6 or USD 13.7 over the observation period).
Payment was handed out anonymously in sealed envelopes, labeled with the above mentioned
random numbers, a couple of days later. For both the test and the questionnaire we conducted
pretests with comparable students.
Test of Economic Understanding
All subjects (students) took part in our 12 minutes test of economic understanding. They
faced statements on the subject of CPR problems as well as on questions unrelated to this
matter, like bargaining, the interplay of demand and supply, or effects of market interferences.
Students then had to decide whether a statement was correct or false. Appropriate responses
were rewarded with 0.1 Swiss francs each.6 To discourage guessing, any false answer led to an
equivalent deduction in payment. No money was deducted if one failed to respond or ticked
the “I do not know” checkbox, nor was it possible to close with a deficit. Students faced 30
statements on the grounds of eight different situations, between two and five per situation.
Out of these, 17 statements (4 situations) focused on CPR problems while 13 statements (4
situations) elaborated on a more general nature of economic understanding.
All multiple choice questions are self-developed by the authors and use jargon-free language.
The validity of these statements has been thoroughly examined in two pretests at comparable
high schools. Many related studies administer a selection of test questions from the Test of
Understanding in College Economic (TUCE) to measure student learning. The rather general
nature of the TUCE, however, is not advisable in our case since we aim to observe learning
in a single and very specific domain. In addition, our sample consists of high school students,
and as such, they bring with them quite a different level of economic understanding to begin
with. We are not aware of any existing standardized measure that addresses our topic while
being suitable for high school students, let alone for Swiss or European students in particular.
Existing studies on the effectiveness of classroom experiments exclusively deal with university6One Swiss franc could buy about EUR 0.67 or USD 0.96 in winter 2009/2010 when the study was conducted.
7

students from the US. For all these reasons, we chose to develop our own measure of economic
understanding. No instructor in either the treatment or Control groups was given access to the
test questions in advance and thus deliberate teaching to the test was not possible.
We retain our measure of individual test performance by aggregating a student’s position
on CPR statements. Specifically, we apply the formula scoring method, which adds a “I do not
know” answering option to the true/false items. The number of correct minus incorrect answers
is then used as the test score. As a consequence, the “I do not know” option reveals additional
information about the quality of a statement. For example, a relatively large percentage of “I
do not know” answers may indicate that the statement was not part of the teaching intervention
or that initially the statement was poorly formulated. A disadvantage of this approach is that
students might tend to omit statements which they would have had a better than random
chance of answering correctly had they guessed. This penalizes more able students (Bliss,
1980). However, formula scoring was found to be more reliable than number-right scoring,
which provides only answering options for right and wrong while the sum total of all correctly
answered statements defines the score (Muijtjens et al., 1999).
Questionnaire
After completing the test, students were required to fill in a questionnaire. This questionnaire
was split into three different segments: incentivized economic decisions, students’ political view,
and their socio-economic background.
The segment on incentivized economic decisions replicated standard economic experiments on
social preferences. At first, students participated in a public good game where each student was
endowed with three points at the outset. Student then could keep their endowment or transfer
all or parts of it into a public cash box. The points total in the cash box was then doubled and
back-transferred in equal shares to all class members, regardless of their initial contribution. In
addition, we also conducted a simple distribution game (or “envy” game), a dictator game, an
ultimatum game, and a trust game. For the latter two games, we randomly divided students in
each class in first and second movers. In both the distribution game an the dictator game, each
student could transfer between 0 and 9 points to another class member whereas own income was
kept constant at 4.5 points in the former. For both of our two-party games equivalent transfers
were restricted to the first movers only. Second movers where either encouraged to reject any
(subjectively) unacceptable split in the ultimatum game or to reciprocate trustful behavior as
desired. In all these games, the framing was neutral and the exchange rate for 1 ECU was 0.3
Swiss francs.
In the second segment we asked students about their political view on a variety of topics.
Specifically, we queried them on their stance on carbon emission surcharges for airline tickets,
agricultural subsidies, health insurance regulations, subsidies for investments in green technolo-
gies, free trade, social security, and fishing regulations. All topics reflect either rather prominent
8

topics in Swiss politics at that time and/or aspects of relevance in the light of our treatments.
Thus, the first two segments capture eventual side effects of our treatment interventions on
both preferences and behavior. Information on a participants’ socio-economic background is
used to identify potential shortcomings of the randomization procedure and allows insight into
how distinct sub-groups of students are learning differently.
II.3. Sample Selection
We conducted our study in the German-speaking area of Switzerland. We exclusively eval-
uated students taking economics classes in upper secondary schools of the type “Kantonss-
chule/Gymnasium” (ISCED 3a).7 These schools are authorized to prepare students for a uni-
versity education and as such comprise about the top 20% of students in a cohort.8 They
are comparable to academic high schools or grammar schools in other countries. Federal law
branches out the structure of this type of school into distinct profiles.9 For that reason, curricula
may differ considerably due to students’ self-selection into Physics and Mathematics, Biology and
Chemistry, Modern Languages, or Law and Economics, as well as other less popular profiles.10
Economic education is typically part of the corresponding profile and as such compulsory, or it
is eligible as a compulsory choice subject, which is a subject a student is free to choose out of a
given set of alternatives, whereas making the choice is a compulsory action.11 To assure a high
level of comparability, our sample consists of students from the law and economics profile only.
Such a sample is starkly different from a random draw of economics students at universities.
After all, just about ever second university student of economics (54%) has gone through the Law
and Economics profile at the high school level. The Federal Statistical Office (FSO) suggests
that about 13.6% of all men and 25.8% of all females in our sample will not continue with a
university education. 49.7% of all students in our sample are expected to apply for a university
education other than economics. Only 31.6% of all high school students (40.3% of all males,
respectively 19.7% of all females) within the Law and Economics profile will later on major in
economic sciences.12 This supports the commonly held view that this profile is a one-size fits
all program for students with no particular skills or ambitions in other domains.
II.4. Recruiting and Random Assignment
We contacted 79 schools of the type “Kantonsschule/Gymnasium” in late summer 2009 in writ-
ten form. We addressed both the head of the school as well as (if available) the head of the7ISCED: International Standard Classification of Education.8See Federal Statistical Office (2012).9Federal law also defines the educational goal, the quality of the teaching body, and the duration of schooling.
Cantons (the member states) have a fair amount of freedom in the actual organizing of their education system.Students of this type of school commonly attend the one closest to their vicinity.
10See Maturitäts-Anerkennungsverordnung. Schools are not obliged to run the complete range of profiles attheir campus. Other profiles are ancient languages (Greek, Latin), music, or arts and crafts.
11The set of alternative compulsory choice subjects usually includes various topics from the social and naturalsciences, additional languages, sports or arts.
12All data is from the 2008 high school cohort. Data received upon request.
9

faculty of economics. Only few schools opted out for a lack of general interest. Constraints in
resources and capabilities such as internal changes of personnel, scheduling conflicts, sabbaticals
etc. were limiting factors often stated. Some schools also had to be excluded later on as they
were too small to maintain a Law and Economics profile, providing their students with eco-
nomics as a compulsory choice subject only. Ultimately, 31 teachers from 29 schools announced
their participation, supplying 42 classes in total.
These schools received information that participating classes will either take part as a Control
group or a treatment group that involved two lessons of teaching. Teachers interested in our field
experiment had to confirm their participation before they learned about their group assignment.
Once we received confirmation of participation, we tried to get equally large experimental groups
by applying the following randomization procedure: The first participating class was assigned
to the Standard treatment, the second to the Experiment treatment, and the third to the
Control group. This sequence was repeated until every class was properly attributed with
a group. After assignment was complete, we arranged dates for the teaching treatments as
well as for the standardized evaluation procedure. We demanded at least one weekend and
one working day lying in between the treatment and the evaluation date, with a maximum of
10 days. The most common arrangement was to carry-out the treatment in two consecutive
lessons with the evaluation following exactly one week later. Both treatment interventions and
the subsequent evaluation were carried out between October 2009 and March 2010. Because
economics curricula vary considerably across cantons and schools, differences in starting dates
do not imply a systematic distortion of treatment effects. Teaching material was sent by mail
two weeks prior to the start of a teaching treatment. Any treatment or control session was
carried out by the economics teacher of the respective class.
III. PredictionsOur study measures the impact of different instructional treatments on the understanding of
the economics of common pool resources and on social preferences. Hypotheses 1-3 make pre-
dictions with regards to the CPR test score while hypothesis 4 summarizes expectations about
a treatment-induced shift in social and political preferences.
The first prediction is seemingly trivial and suggests that teaching improves economic un-
derstanding.13 More specifically, we expect that any teaching related to CPR has a positive
impact on the understanding of CPR problems.
Hypothesis 1 Participants in the Control group perform worse in the evaluation than those in
the two teaching treatments.13Some skeptics might argue otherwise. Given that teachers freely opted-in into our experimental study, such
pessimistic views are highly unlikely.
10
We now focus on the comparison of the two teaching treatments. Existing literature sug-
gests that, on the whole, economics classroom experiments are more effective than conventional
teaching.14 We argue along the same lines, expecting that the participatory element of class-
room experiments increases individual awareness and creates clarification for otherwise abstract
economic mechanisms. Furthermore, classroom experiments are simply fun and hence stimulate
students’ willingness to learn. However, existing studies exclusively cover university education
(mostly introductory principles courses). With our focus on high school students we are able
to concentrate on the effectiveness of different teaching methods on a less selective sample (see
section II.3.) in an educational context in which interactive teaching methods are more common
than in university lectures.
Hypothesis 2 Participants in the Experiment treatment perform—on average—better than
those in the Standard treatment.
Comparing average performances, however, is not enough as there is evidence for different
types of individuals being affected differently by each of our teaching methods.15 Specifically,
contradicting results were found for students’ aptitude. On the one hand, Emerson and Taylor
(2004) find that students with higher grade point averages benefit more from lecture-oriented
lessons while the experimental approach is equally effective for all students. To the contrary,
Dickie (2006) concludes that classroom experiments confer greater benefits on abler students.
We expect our evidence to fall in line with the latter. Holding teaching time fixed across
treatments imposes a trade-of when choosing the most suitable teaching method. If the Exper-
iment treatment crowds out time for adequately discussing the subject, less able students (i.e.
those with relatively poor economic understanding) might fail to generate a profound under-
standing. Such a view is consistent with recent findings by Lavy (2011) who studies primary and
middle school student achievements. In particular, he finds that practices aimed at the recalling
of previously learned information benefit lower skilled individuals considerably (opposite to the
instillment of applicative, analytical, and critical skills which seem to benefit abler students).16
Hypothesis 3 Instructional benefits increase with a student’s aptitude for economics. This
increase is particular strong with classroom experiments.14Also conventional teaching has improved over the past decades, but its rather passive nature has been
criticized often. See, for example, Edwin E. Slosson cited in Miller (1927, p. 120): “Lecturing is that mysteriousprocess by means of which the contents of the note-book of the professor are transferred through the instrumentof the fountain pen to the note-book of the student without passing through the mind of either.”
15 Emerson and Taylor (2007), for example, look at how students with different Myers-Briggs personalitytypes perform under a traditional and an experimental approach. Their results suggest that experiments dobenefit, or are at least neutral with respect to, many personality types. Only 2 out of 16 personality types dobetter in lecture-oriented lessons. Durham et al. (2007) observe that students with different learning styles alsobenefit differently from classroom experiments. In particular, multimodal and kinesthetic learners, who togetheraccount for over 85% of all of their students, significantly improved performance with the use of experiments incomparison to traditional lecture-style teaching.
16A plausible counter-argument would be to assume that the concrete nature of classroom experiments willmake it easier for low ability type students to grasp an understanding of the matter which they would not havewhen being confronted with rather abstract theory. However, in comparison to tertiary education the level ofcomplexity is arguably reduced when high school students are involved.
11
With their strong emphasis on free-riding incentives and externalities, both of our teaching
interventions might cause learning effects strong enough to alter students’ behavior and political
views in related domains. Instruction on CPR problems helps students to disclose similar
mechanisms in our set of incentivized economic decisions and makes them more sensitive with
respect to market failures. Moreover, a first-hand observation of cooperation failure in the
classroom experiment can induce conditionally cooperative people to reduce contributions.17
Hypothesis 4 Students in both treatment groups hold more cautious political views on laissez-
faire economics than those in the Control group. Students in the Experiment treatment make
more selfish choices than those in the Standard and Control treatments.
IV. Data42 classes participated in our study—14 in the Control group, 15 in the Standard treatment,
and 13 in the Experiment treatment.18 The average class consists of about 18 students yielding
a total of 720 individual observations. Table IV.1 provides a brief overview of the variation in
data on the class and school level across control and treatment groups. Table IV.3 gives similar
information on individual characteristics of students. The prevalence of missingness is within
the range of what can be expected from a field study and does not show treatment-specific
particularities. We refer to Table A.5 in the appendix for an overview of all variables containing
missing values.
The subjective account of teachers regarding the overall learning environment—measured
as the perceived class motivation and willingness to learn as well as class coherence—is rather
positive and highly comparable between groups. The average class had been taught about three
to four semesters of Economics, with the Control group having the least experience of all.19
Our main interest here, however, is in the composition of the economic background of classes as
performance not only depends on teaching treatments but also on knowledge acquired prior to
our intervention. For that reason, we profiled classes into areas that are considered of immediate
relevance to mastering the CPR test (see Table IV.2).20 Looking at Common-pool Resources
and its closely related field of Public Goods, students in both the Control and the Standard
group are moderately better prepared to solve CPR-related questions while the Standard group
also holds an advantage in the domain of Public Goods. Nonetheless, teaching activities in these
areas are quantitatively close to insignificant, indicating that these topics are not focal in today’s17Frey and Meier (2003) as well as Falk and Zehnder (2007) show the prevalence of this type of people in
Switzerland.18The slightly uneven allocation into groups is due to a cancellation by one class.19Our sample deals exclusively with a specific type of upper secondary schools (Kantonsschule/Gymnasium).
A regular student attends such a school for between six to eight semesters.20The classification of which areas are considered beneficial is somewhat arbitrary, but out of necessity. Data
is collected by teacher feedback and hence we are not able to capture specifics of what their students have beentaught. However, our results are robust to various forms of (reasonable) classifications.
12

Table IV.1 – Class & school level characteristics
Variables Control Standard Experiment
Class size 17.86 15.53 18.23(4.5) (5) (2.49)
Teacher’s perceived class motivation [1,5] 3.5 3.47 3.54(.76) (.74) (1.05)
Teacher’s perceived class coherence [1,5] 3.64 3.47 3.85(.74) (.74) (.9)
Economics as a school subject [no. of semesters] 2.93 4.27 4.54(2.06) (2.43) (2.26)
Number of classes 14 15 13
Number of teachers 13 15 12
Number of schools 13 14 13
Share of schools situated in communities >100k .5 .27 .31(.52) (.46) (.48)
Notes: Mean values per treatment. Standard deviation in parentheses. Values in square brackets indicatethe range of the indices. The [1,5] index reads low (1), rather low (2), average (3), rather high (4), high(5). Based on the Kruskal-Wallis equality-of-populations rank test, it cannot be rejected that all datais drawn from the same population. The number of teachers is given per treatment. Due to eight teach-ers participating with multiple classes, this number does not sum up to the 31 teachers that participated in total.
curriculum. Similarly, experience in other related areas—i.e. market failures and externalities—
is rather low, although the same has to be said for some typical fields of economic theory too, such
as consumer and producer surplus or benefits of trade. Only core aspects of economic theory like
the role of the price mechanism and the workings of demand and supply are established across all
participating classes. This is not surprising given that Economics on the upper secondary level
in Switzerland generally comprises business administration, accounting, and law, too. Moreover
the curriculum differs substantially across cantons and occasionally even within cantons. Our
data suggest that students’ mindset is only mildly affected by preceding exposure to economic
theory and its school of thought. One relatively persistent pattern, however, emerges in that
the Control group bears the least distinctive profile in economics. This is unfortunate given our
assignment procedure is fully randomized. However, statistical tests cannot reject that classes
are drawn from the same population for all of the above items individually, or in the form of
cumulative scores. These results also hold when both treatment groups are pooled.
Variation in individual data is considerably less balanced. We observe, for example, sig-
nificant differences in students’ age profiles or the share of students whose native-language is
German. In addition, the number of books at the place of residence as well as school grades
in mathematics differ strongly between groups.21 We also find that parents’ educational back-
ground varies. The same holds for self-reported interest in economics but we cannot rule out
spillover effects from both treatments here. By aggregating individual data on the class level
and comparing these values across groups, we effectively control for inadvertent selection effects
in the recruiting procedure, for example in the form of some classes having to operate in more21Note that school grades are bound to curricula that are specified at the state-level and subject to teachers’
preferences, which weakens their significance as an objective measure of a student’s absolute level of competence.
13
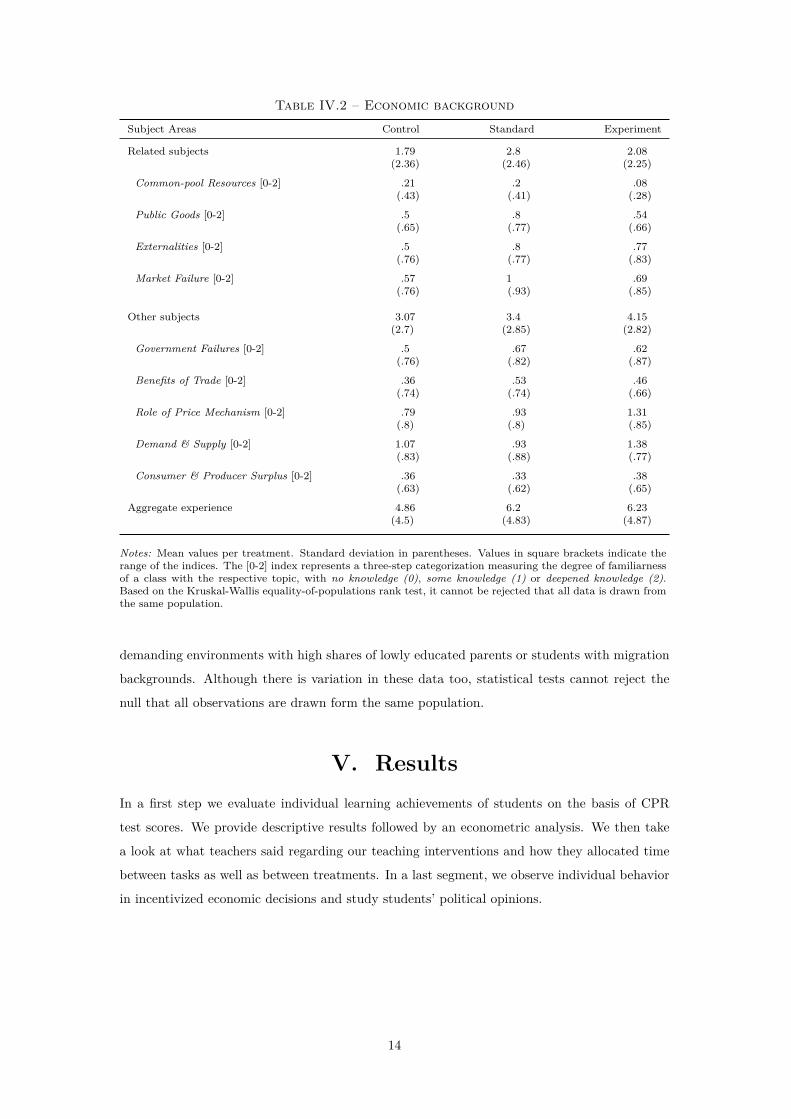
Table IV.2 – Economic background
Subject Areas Control Standard Experiment
Related subjects 1.79 2.8 2.08(2.36) (2.46) (2.25)
Common-pool Resources [0-2] .21 .2 .08(.43) (.41) (.28)
Public Goods [0-2] .5 .8 .54(.65) (.77) (.66)
Externalities [0-2] .5 .8 .77(.76) (.77) (.83)
Market Failure [0-2] .57 1 .69(.76) (.93) (.85)
Other subjects 3.07 3.4 4.15(2.7) (2.85) (2.82)
Government Failures [0-2] .5 .67 .62(.76) (.82) (.87)
Benefits of Trade [0-2] .36 .53 .46(.74) (.74) (.66)
Role of Price Mechanism [0-2] .79 .93 1.31(.8) (.8) (.85)
Demand & Supply [0-2] 1.07 .93 1.38(.83) (.88) (.77)
Consumer & Producer Surplus [0-2] .36 .33 .38(.63) (.62) (.65)
Aggregate experience 4.86 6.2 6.23(4.5) (4.83) (4.87)
Notes: Mean values per treatment. Standard deviation in parentheses. Values in square brackets indicate therange of the indices. The [0-2] index represents a three-step categorization measuring the degree of familiarnessof a class with the respective topic, with no knowledge (0), some knowledge (1) or deepened knowledge (2).Based on the Kruskal-Wallis equality-of-populations rank test, it cannot be rejected that all data is drawn fromthe same population.
demanding environments with high shares of lowly educated parents or students with migration
backgrounds. Although there is variation in these data too, statistical tests cannot reject the
null that all observations are drawn form the same population.
V. ResultsIn a first step we evaluate individual learning achievements of students on the basis of CPR
test scores. We provide descriptive results followed by an econometric analysis. We then take
a look at what teachers said regarding our teaching interventions and how they allocated time
between tasks as well as between treatments. In a last segment, we observe individual behavior
in incentivized economic decisions and study students’ political opinions.
14

Table IV.3 – Student characteristics
Variables Control Standard Experiment
Share of females .47 .49 .45(.5) (.5) (.5)
Age ** 17.92 17.94 17.75(1.55) (1.13) (1.74)
Share of native-language German ** .79 .87 .86(.41) (.33) (.35)
Share of foreign-born students .11 .08 .09(.31) (.27) (.29)
Disposable money, in CHF/month 329.38 315.23 300.21(342.04) (241.11) (253.83)
Number of books at place of residence *** 523.76 561.76 388.97(863.34) (970.28) (848.47)
Interest in economics [1,4] * 2.85 2.98 2.98(.73) (.72) (.72)
Grade in Math [1-6] *** 4.4 4.52 4.62(.82) (.72) (.79)
Grade in German [1-6] 4.71 4.72 4.68(.55) (.49) (.59)
Parents’ highest level of education completed, in % **Primary or lower secondary (ISCED 1 & 2) 2.45 0.94 1.02
(15.50) (9.69) (10.08)Upper secondary education (ISCED 3 & 4) 32.35 50 43.88
(46.90) (50.12) (49.75)Tertiary education (ISCED 5 & 6) 65.2 49.06 55.1
(47.75) (50.11) (49.87)
Number of students 250 233 237
Notes: Mean values per treatment. Standard deviation in parentheses. Values in square brackets indicate therange of the indices. The highest index value is attributed with the best or most pronounced potential outcome.Education of parents is coded according to the International Standard Classification of Education (ISCED).Stars indicate the level of significance for a Kruskal-Wallis equality-of-populations rank test (ordered data) ora chi-squared test (categorical data). * Significant at 10%; ** significant at 5%; *** significant at 1%.
V.1. Performance in CPR test
Table V.1 reports CPR-related test results.22 Absent any treatment intervention, 58% of all
statements were solved correctly while roughly 30% were answered falsely. Hence, the Control
group managed to achieve about 28% of the theoretical maximum score (4.7 score points out
of 17). Students of both treatment groups fare much better, yielding average scores of 50.49%
(8.58 points) in the Standard and 50.41% (8.57 points) in the Experiment treatment. Evidently,
both teaching interventions were able to increase economic understanding considerably, with
an effect size of about 0.8 of a standard deviation each (Wilcoxon rank-sum tests, treatments
vs. Control group: p < 0.001). Results between the Standard and the Experiment group are
remarkably similar (Wilcoxon rank-sum test, Standard vs. Experiment: p = 0.5941), leading us
to reject hypothesis 2 but not hypothesis 1.
In order to show that student ability affects learning outcomes, we first have to identify22Results on the class level (where randomization took place) are largely comparable with student level data
(where we tested economic understanding) which is why we limit our discussion to the latter. Additional data isprovided upon request.
15

Table V.1 – PerformanceControl Standard Experiment
CPR test score, in % *** 27.67 50.49 50.41(25.44) (23.44) (25.22)
Correctly answered, in % *** 58.05 70.84 71.13(14.27) (13.72) (15.41)
Falsely answered, in % *** 30.38 20.35 20.72(13.56) (11.89) (11.49)
Undecided, in % *** 11.58 8.81 8.14(11.29) (10.46) (10.16)
CPR test score (class level), in % *** 28.02 49.91 50.65(9.19) (10.5) (10.86)
GE test score (class mean) *** 6.81 7.69 7.43(.71) (2.09) (1.41)
GE test score (class-mean centered) 0 0 0(3.43) (3.01) (3.3)
Notes: Mean values per treatment. Standard deviation in parentheses. CPR test score: Stars indicate thelevel of significance for a two-sample Wilcoxon rank-sum (Mann-Whitney) test. Samples are grouped asControl vs. both treatments combined. The same test does not reject the null hypothesis when testingthe Standard against the Experiment treatment. GE test score: Stars indicate the level of significance for aKruskal-Wallis equality-of-populations rank test. * Significant at 10%; ** significant at 5%; *** significant at 1%.
a valid measure. Since school grades are bound to curricula that are specified at the state-
level and subject to teachers’ preferences, their significance as an objective measure of student
competence is severely weakened. Thus, our ability measure is constructed on the grounds
of our test on general-economic understanding (GE test score). This test assesses the level
of economic understanding in a standardized way across classes, making it the most precise
measure available. Not addressing the problem of class-level confounding, however, would lead
to misinterpretations of our results. We therefore create an instrument variable for the test
score that is uncorrelated with the level of economic knowledge in a class. In order to obtain
our desired measure, we first generate class-mean scores and then subtract these from individual
test scores. The former then gives between-class information while the latter takes up within-
class information, which allows to make valid statements on students ability relative to their
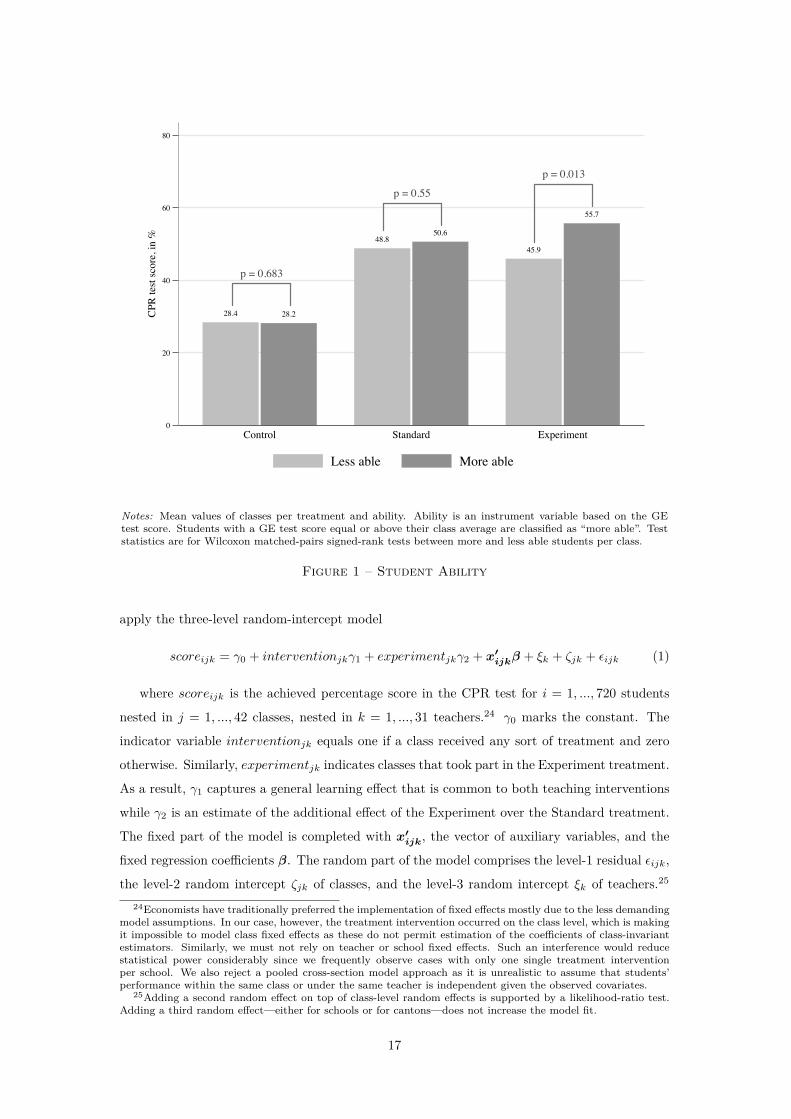
peers. Figure 1 shows evidence that indeed students with a GE test score equal or above their
class average (high ability) do better in the CPR test than students below the class average (low
ability), in particular in the Experiment treatment (Wilcoxon matched-pairs signed-rank test,
p = 0.013). This result is apparently in line with hypothesis 3.
A purely descriptive analysis, however, fails to account for variations in individual and class-
level characteristics across treatments. Controlling for these will make treatment estimates
more precise, most notably in terms of knowledge acquired prior to our intervention. Moreover,
our data exhibits a distinct multilevel structure. Achievements of students and classes are,
for example, likely to be clustered on the teacher-level due to the influence of idiosyncratic
characteristics on teachers quality.23 In order to account for these peculiarities in our data, we23Many observable teacher characteristics such as teaching certification and years of teaching experience are
not highly correlated with teacher quality (Hanushek, 2002). It has been shown a number of times, however,that teacher quality is essential in explaining student performance (see, e.g. Kane and Staiger, 2008; Aaronsonet al., 2007; Rivkin et al., 2005; Rockoff, 2004).
16
28.4 28.2
48.850.6
45.9
55.7
0
20
40
60
80
CPR
test
scor
e, in
%
Control Standard Experiment
Less able More able
p = 0.683
p = 0.55
p = 0.013
Notes: Mean values of classes per treatment and ability. Ability is an instrument variable based on the GEtest score. Students with a GE test score equal or above their class average are classified as “more able”. Teststatistics are for Wilcoxon matched-pairs signed-rank tests between more and less able students per class.
Figure 1 – Student Ability
apply the three-level random-intercept model
scoreijk = γ0 + interventionjkγ1 + experimentjkγ2 + x′ijkβ + ξk + ζjk + εijk (1)
where scoreijk is the achieved percentage score in the CPR test for i = 1, ..., 720 students
nested in j = 1, ..., 42 classes, nested in k = 1, ..., 31 teachers.24 γ0 marks the constant. The
indicator variable interventionjk equals one if a class received any sort of treatment and zero
otherwise. Similarly, experimentjk indicates classes that took part in the Experiment treatment.
As a result, γ1 captures a general learning effect that is common to both teaching interventions
while γ2 is an estimate of the additional effect of the Experiment over the Standard treatment.
The fixed part of the model is completed with x′ijk, the vector of auxiliary variables, and the
fixed regression coefficients β. The random part of the model comprises the level-1 residual εijk,
the level-2 random intercept ζjk of classes, and the level-3 random intercept ξk of teachers.25
24Economists have traditionally preferred the implementation of fixed effects mostly due to the less demandingmodel assumptions. In our case, however, the treatment intervention occurred on the class level, which is makingit impossible to model class fixed effects as these do not permit estimation of the coefficients of class-invariantestimators. Similarly, we must not rely on teacher or school fixed effects. Such an interference would reducestatistical power considerably since we frequently observe cases with only one single treatment interventionper school. We also reject a pooled cross-section model approach as it is unrealistic to assume that students’performance within the same class or under the same teacher is independent given the observed covariates.
25Adding a second random effect on top of class-level random effects is supported by a likelihood-ratio test.Adding a third random effect—either for schools or for cantons—does not increase the model fit.
17
Following standard regression assumptions, the level-1 residual is assumed εijk ∼ [0, σ2ε ]. It is
further assumed that random effects at each level have a multivariate normal distribution and
at different levels are mutually independent and independent of the level-1 residual.
Our baseline specification replicates the descriptive account in a simple difference-in-means
estimation. This specification is augmented by a cumulative score variable based on the four
economic background items we consider most beneficial for mastering our test (see Table IV.2).
We subsequently enhance the baseline model with our measure for individual ability.26 Since we
expect both interaction effects for our economic background measure as well as individual ability,
we subsequently interact both variables with our treatment dummies. Our last specification
includes an extensive set of auxiliary controls such as urban/rural distinctions, class size, school
grades or disposable money.27 We address the issue of data missingness by relying on multiple
imputation techniques, which is regarded as the current state of the art approach in the relevant
methodological literature (Graham, 2009; Schafer and Graham, 2002).28 All standard errors are
clustered at the teacher level. We provide non-clustered results in the appendix.
Table V.2 reveals strong positive (but not statistically different) effects for both teaching
interventions, with an average effect size of 0.67 of a standard deviation, and in that sense
reaffirms the purely descriptive results from above. Results further suggest that classes’ economic
background in CPR-related areas as well their performance in the GE test have significant
explanatory power. Yet it is not only class-mean performance that predicts success in the CPR
test but also a student’s relative performance in comparison to her peers, that is the class-mean
centered GE test score, our measure for student ability.
Table V.3 largely reproduces above estimations but extends their informative power by
introducing interaction terms. Specification 1 reveals that a distinct profile in CPR-related
areas is most beneficial to those who were not exposed to any teaching intervention. For both
the Standard and the Experiment treatment these effects are indistinguishable from zero. Of
particular importance is the strong interaction effect of student ability in specification 2. In
the Experiment treatment, with a value of 2.05 the aggregate size of the estimate is more than
double of that in the Control or Standard group and in that significantly different from both of
them individually (at 5% level). Student ability is also in itself significant for the Experiment26Our ability measure is an instrumental variable for the GE test score that is uncorrelated with the random
intercept ζjk. Statistical tests strongly prefer this approach over including the cluster-mean centered covariateonly. For details see Skrondal and Rabe-Hesketh (2004).
27The full set of controls can be found in Table A.2 of the appendix.28Note that unlike other imputation routines, multiple imputation explicitly accounts for the uncertainty
associated with the missing data. Multiple imputation also holds a clear advantage over ad hoc techniquessuch as listwise deletion (complete-case analysis) or pairwise deletion (available-case analysis). These traditionaltechniques require MCAR data and can produce distorted parameter estimates when this assumption does nothold. Another advantage of multiple imputation is that it avoids large scale sample size attrition. In oursituation, a complete-case regression analysis would be particular wasteful since a sample size reduction of 157observations considerably reduces statistical power. Our working data set consists of 20 imputations. We double-checked model robustness by relying on both imputation using multivariate normal regression and imputationusing chained equations (sequential regression imputation). In our analysis, the choice of the procedure does nothave any meaningful effect on the interpretation of our treatment effects. Results rely on imputed data usingchained equations for reasons of greater flexibility. Imputation generates more conservative results compared toa complete-case analysis in the light of our research question.
18

Table V.2 – CPR LearningDep. var.: CPR test score, in % (1) (2) (3) (4)
Teaching intervention 18.40∗∗∗ 17.35∗∗∗ 18.16∗∗∗ 17.63∗∗∗
(3.740) (2.608) (2.714) (2.388)
Experiment 2.969 3.682 1.987 2.686(2.410) (2.586) (1.999) (2.192)
Economic background 2.020∗∗∗ 1.106∗
(0.456) (0.575)
GE test score (class-mean centered) 1.201∗∗∗ 1.201∗∗∗
(0.316) (0.316)
GE test score (class mean) 3.556∗∗∗ 2.576∗∗∗
(0.617) (0.784)
Constant 31.08∗∗∗ 26.66∗∗∗ 30.61∗∗∗ 28.33∗∗∗
(2.718) (2.141) (2.151) (2.102)
Auxiliary controls no no no no
Number of teachers 31 31 31 31
Number of students 720 720 720 720
Notes: 3-level random effects model. Random effects for teachers and classes. Maximum likelihood estimation.Standard errors clustered on teachers. Constant represents students with average characteristics. * Significantat 10%; ** significant at 5%; *** significant at 1%.
(at 1% level), whereas it is not for both other groups.29 Our ability measure is also economically
relevant as a standard deviation change affects the CPR test score by 6.76% or 0.25 of a standard
deviation. These results imply that classroom experiments (at the high school level) favor more
able students while weaker students are actually worse off than they would be under a regime
that depends on conventional teaching. Our next two specifications combine both interactions,
but they differ in the controls used (see Table A.2 for details). Our key estimates appear robust
to changes in model specifications, giving us confidence that reported results are strong. Most
auxiliary controls are insignificant, but their estimates point to a meaningful direction. With
respect to educational policies our data supports the view that the ability to comprehend test
questions is essential. Receiving good school grades in German helps to significantly improve
test scores. An increase of one standard deviation raises the test score about 3% or 0.11 of a
standard deviation.30 Another aspect worth pointing out is a student’s socialization and her
place of birth. Only including a dummy for foreign-born students reveals a significant estimate.
Complementing this with information on speaking the German language as the mother tongue
makes the birth-place dummy become insignificant.31 The estimate on the mother tongue is
highly significant and, with an effect size of 0.11 of a standard deviation, economically relevant.
Since we control for school grades in German, the dummy on a student’s mother tongue rather
captures socialization effects than German language skills. We further report that the size of
a class has no predictive power.32 Last, take notice that we observe no gender effects, and29The latter finding is most likely due to a small sample size on the class level. P-values are relatively close
to the 10% level.30An increase of one standard deviation equates to a shift from the sample mean of 4.7 to 5.24, roughly
corresponding to a move from B- to B+ for the US grading scale. However note the caveat that (self-reported)school grades in German are not an ideal measure for objective language skills.
31Students are regarded native German-speaking if they either speak one of the many Swiss or Austriandialects, or standard German.
32Typically, a lower class size was attributed with higher student achievements and still is considered as
19
that all of the applied control variables do not show any interactions with one of our treatment
conditions.
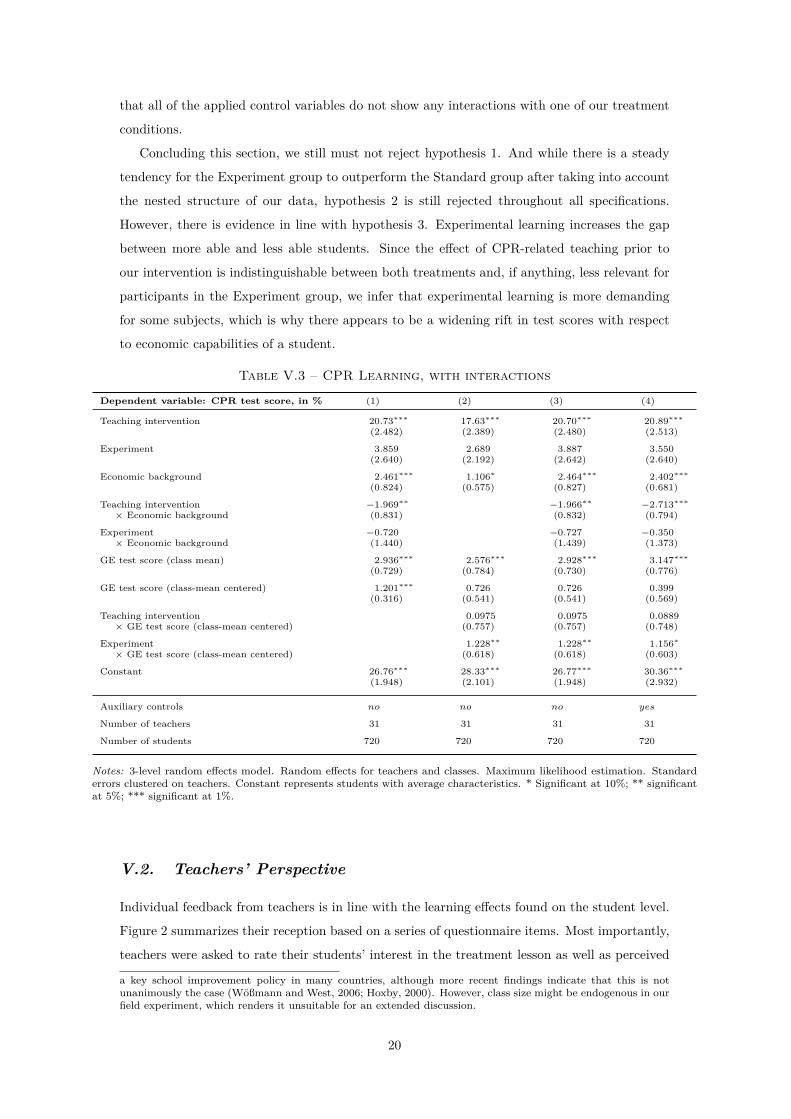
Concluding this section, we still must not reject hypothesis 1. And while there is a steady
tendency for the Experiment group to outperform the Standard group after taking into account
the nested structure of our data, hypothesis 2 is still rejected throughout all specifications.
However, there is evidence in line with hypothesis 3. Experimental learning increases the gap
between more able and less able students. Since the effect of CPR-related teaching prior to
our intervention is indistinguishable between both treatments and, if anything, less relevant for
participants in the Experiment group, we infer that experimental learning is more demanding
for some subjects, which is why there appears to be a widening rift in test scores with respect
to economic capabilities of a student.
Table V.3 – CPR Learning, with interactions
Dependent variable: CPR test score, in % (1) (2) (3) (4)
Teaching intervention 20.73∗∗∗ 17.63∗∗∗ 20.70∗∗∗ 20.89∗∗∗
(2.482) (2.389) (2.480) (2.513)
Experiment 3.859 2.689 3.887 3.550(2.640) (2.192) (2.642) (2.640)
Economic background 2.461∗∗∗ 1.106∗ 2.464∗∗∗ 2.402∗∗∗
(0.824) (0.575) (0.827) (0.681)
Teaching intervention −1.969∗∗ −1.966∗∗ −2.713∗∗∗
× Economic background (0.831) (0.832) (0.794)
Experiment −0.720 −0.727 −0.350× Economic background (1.440) (1.439) (1.373)
GE test score (class mean) 2.936∗∗∗ 2.576∗∗∗ 2.928∗∗∗ 3.147∗∗∗
(0.729) (0.784) (0.730) (0.776)
GE test score (class-mean centered) 1.201∗∗∗ 0.726 0.726 0.399(0.316) (0.541) (0.541) (0.569)
Teaching intervention 0.0975 0.0975 0.0889× GE test score (class-mean centered) (0.757) (0.757) (0.748)
Experiment 1.228∗∗ 1.228∗∗ 1.156∗
× GE test score (class-mean centered) (0.618) (0.618) (0.603)
Constant 26.76∗∗∗ 28.33∗∗∗ 26.77∗∗∗ 30.36∗∗∗
(1.948) (2.101) (1.948) (2.932)
Auxiliary controls no no no yes
Number of teachers 31 31 31 31
Number of students 720 720 720 720
Notes: 3-level random effects model. Random effects for teachers and classes. Maximum likelihood estimation. Standarderrors clustered on teachers. Constant represents students with average characteristics. * Significant at 10%; ** significantat 5%; *** significant at 1%.
V.2. Teachers’ Perspective
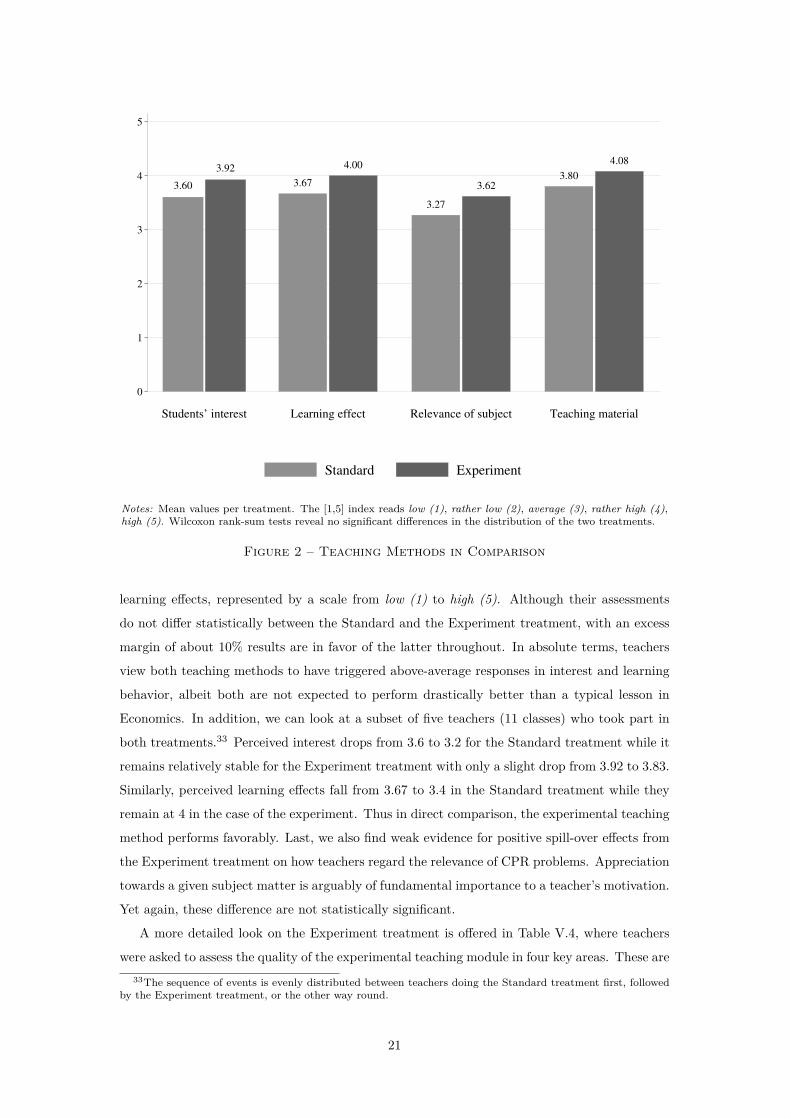
Individual feedback from teachers is in line with the learning effects found on the student level.
Figure 2 summarizes their reception based on a series of questionnaire items. Most importantly,
teachers were asked to rate their students’ interest in the treatment lesson as well as perceived
a key school improvement policy in many countries, although more recent findings indicate that this is notunanimously the case (Wößmann and West, 2006; Hoxby, 2000). However, class size might be endogenous in ourfield experiment, which renders it unsuitable for an extended discussion.
20
3.60
3.92
0
1
2
3
4
5
Students’ interest
3.67
4.00
Learning effect
3.27
3.62
Relevance of subject
3.80
4.08
Teaching material
Standard Experiment
Notes: Mean values per treatment. The [1,5] index reads low (1), rather low (2), average (3), rather high (4),high (5). Wilcoxon rank-sum tests reveal no significant differences in the distribution of the two treatments.
Figure 2 – Teaching Methods in Comparison
learning effects, represented by a scale from low (1) to high (5). Although their assessments
do not differ statistically between the Standard and the Experiment treatment, with an excess
margin of about 10% results are in favor of the latter throughout. In absolute terms, teachers
view both teaching methods to have triggered above-average responses in interest and learning
behavior, albeit both are not expected to perform drastically better than a typical lesson in
Economics. In addition, we can look at a subset of five teachers (11 classes) who took part in
both treatments.33 Perceived interest drops from 3.6 to 3.2 for the Standard treatment while it
remains relatively stable for the Experiment treatment with only a slight drop from 3.92 to 3.83.
Similarly, perceived learning effects fall from 3.67 to 3.4 in the Standard treatment while they
remain at 4 in the case of the experiment. Thus in direct comparison, the experimental teaching
method performs favorably. Last, we also find weak evidence for positive spill-over effects from
the Experiment treatment on how teachers regard the relevance of CPR problems. Appreciation
towards a given subject matter is arguably of fundamental importance to a teacher’s motivation.
Yet again, these difference are not statistically significant.
A more detailed look on the Experiment treatment is offered in Table V.4, where teachers
were asked to assess the quality of the experimental teaching module in four key areas. These are33The sequence of events is evenly distributed between teachers doing the Standard treatment first, followed
by the Experiment treatment, or the other way round.
21
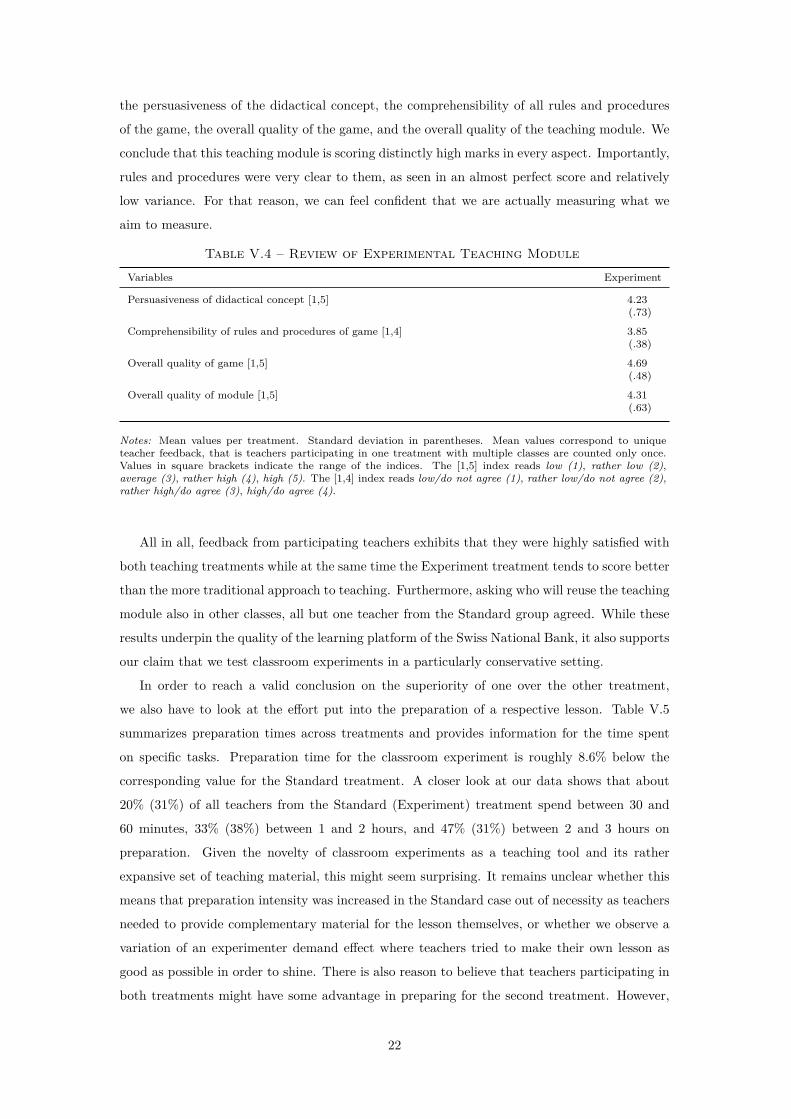
the persuasiveness of the didactical concept, the comprehensibility of all rules and procedures
of the game, the overall quality of the game, and the overall quality of the teaching module. We
conclude that this teaching module is scoring distinctly high marks in every aspect. Importantly,
rules and procedures were very clear to them, as seen in an almost perfect score and relatively
low variance. For that reason, we can feel confident that we are actually measuring what we
aim to measure.
Table V.4 – Review of Experimental Teaching Module
Variables Experiment
Persuasiveness of didactical concept [1,5] 4.23(.73)
Comprehensibility of rules and procedures of game [1,4] 3.85(.38)
Overall quality of game [1,5] 4.69(.48)
Overall quality of module [1,5] 4.31(.63)
Notes: Mean values per treatment. Standard deviation in parentheses. Mean values correspond to uniqueteacher feedback, that is teachers participating in one treatment with multiple classes are counted only once.Values in square brackets indicate the range of the indices. The [1,5] index reads low (1), rather low (2),average (3), rather high (4), high (5). The [1,4] index reads low/do not agree (1), rather low/do not agree (2),rather high/do agree (3), high/do agree (4).
All in all, feedback from participating teachers exhibits that they were highly satisfied with
both teaching treatments while at the same time the Experiment treatment tends to score better
than the more traditional approach to teaching. Furthermore, asking who will reuse the teaching
module also in other classes, all but one teacher from the Standard group agreed. While these
results underpin the quality of the learning platform of the Swiss National Bank, it also supports
our claim that we test classroom experiments in a particularly conservative setting.
In order to reach a valid conclusion on the superiority of one over the other treatment,
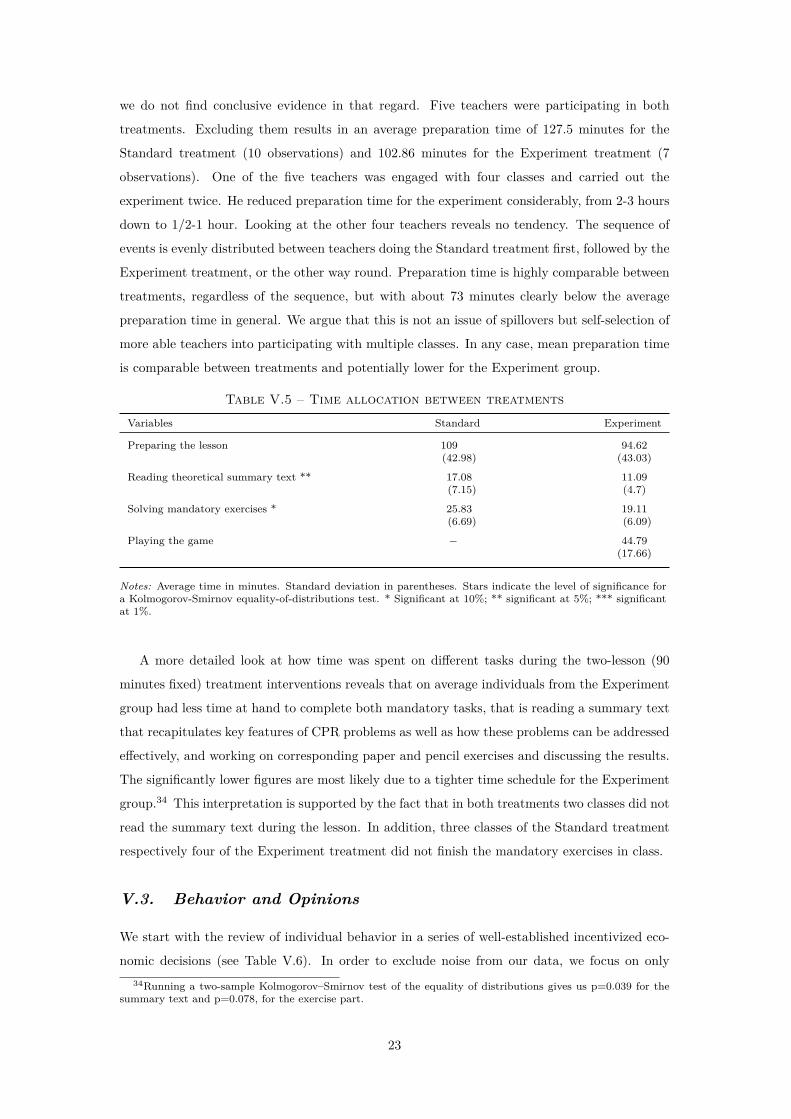
we also have to look at the effort put into the preparation of a respective lesson. Table V.5
summarizes preparation times across treatments and provides information for the time spent
on specific tasks. Preparation time for the classroom experiment is roughly 8.6% below the
corresponding value for the Standard treatment. A closer look at our data shows that about
20% (31%) of all teachers from the Standard (Experiment) treatment spend between 30 and
60 minutes, 33% (38%) between 1 and 2 hours, and 47% (31%) between 2 and 3 hours on
preparation. Given the novelty of classroom experiments as a teaching tool and its rather
expansive set of teaching material, this might seem surprising. It remains unclear whether this
means that preparation intensity was increased in the Standard case out of necessity as teachers
needed to provide complementary material for the lesson themselves, or whether we observe a
variation of an experimenter demand effect where teachers tried to make their own lesson as
good as possible in order to shine. There is also reason to believe that teachers participating in
both treatments might have some advantage in preparing for the second treatment. However,
22
we do not find conclusive evidence in that regard. Five teachers were participating in both
treatments. Excluding them results in an average preparation time of 127.5 minutes for the
Standard treatment (10 observations) and 102.86 minutes for the Experiment treatment (7
observations). One of the five teachers was engaged with four classes and carried out the
experiment twice. He reduced preparation time for the experiment considerably, from 2-3 hours
down to 1/2-1 hour. Looking at the other four teachers reveals no tendency. The sequence of
events is evenly distributed between teachers doing the Standard treatment first, followed by the
Experiment treatment, or the other way round. Preparation time is highly comparable between
treatments, regardless of the sequence, but with about 73 minutes clearly below the average
preparation time in general. We argue that this is not an issue of spillovers but self-selection of
more able teachers into participating with multiple classes. In any case, mean preparation time
is comparable between treatments and potentially lower for the Experiment group.
Table V.5 – Time allocation between treatments
Variables Standard Experiment
Preparing the lesson 109 94.62(42.98) (43.03)
Reading theoretical summary text ** 17.08 11.09(7.15) (4.7)
Solving mandatory exercises * 25.83 19.11(6.69) (6.09)
Playing the game − 44.79(17.66)
Notes: Average time in minutes. Standard deviation in parentheses. Stars indicate the level of significance fora Kolmogorov-Smirnov equality-of-distributions test. * Significant at 10%; ** significant at 5%; *** significantat 1%.
A more detailed look at how time was spent on different tasks during the two-lesson (90
minutes fixed) treatment interventions reveals that on average individuals from the Experiment
group had less time at hand to complete both mandatory tasks, that is reading a summary text
that recapitulates key features of CPR problems as well as how these problems can be addressed
effectively, and working on corresponding paper and pencil exercises and discussing the results.
The significantly lower figures are most likely due to a tighter time schedule for the Experiment
group.34 This interpretation is supported by the fact that in both treatments two classes did not
read the summary text during the lesson. In addition, three classes of the Standard treatment
respectively four of the Experiment treatment did not finish the mandatory exercises in class.
V.3. Behavior and Opinions
We start with the review of individual behavior in a series of well-established incentivized eco-
nomic decisions (see Table V.6). In order to exclude noise from our data, we focus on only34Running a two-sample Kolmogorov–Smirnov test of the equality of distributions gives us p=0.039 for the
summary text and p=0.078, for the exercise part.
23
those students who solved our control questions and therefore understood the mechanism of a
game correctly. Among our set of economic decisions, the one-shot public good game mimics
the incentive structure of CPR problems most closely. Statistical tests suggest that hypothesis 4
must be rejected. A Cuzick trend test finds no significant tendency to lower contributions from
the Control over the Standard to the Experiment group (p = 0.135), nor does it indicate such a
tendency for adjustments in beliefs (p = 0.264).35 A slight tendency for lower contributions in
the Experiment group is likely due to participation in the similarly composed CPR fishing game.
Absent any institutional regularization that restricts (to a certain extent) the possibility to free-
ride, these students know from first-hand experience that they have not been able to maintain a
sustainable fishing quota in the classroom experiment.36 However, the same students are more
likely to understand the design of a public good game as the share of falsely answered control
questions is significantly trending (p = 0.013). While this effect is partly mediated through
factual knowledge acquisition as seen in the difference between the Control and the Standard
group, it also indicates that gains from actually having experienced such a situation has helped
in comprehending the workings of a similar decision framework. Taking into account the behav-
ior in other incentivized decisions strengthens our conclusion further. Again, contributions in
the Experiment group are lowest throughout all other games but differences between treatments
are far from being significant. Both in the dictator and the envy game, this might be seen as
an additional sign for a deteriorated attitude towards others. It is, however, not the case for
the ultimatum game, where the interpretation of contribution levels as a measure for pro-social
behavior is generally less advisable due to the games’ strategic nature. Last, also behavior
in the trust game is statistically indistinguishable between groups. Neither do students trust
less nor do they return fewer coins after having participated in the classroom experiment. All
these results do not support the hypothesis that economics instruction has a harmful impact
on prosocial behavior, as treatment interventions have not changed the way our students act in
incentivized decisions.
Turning our attention to how students provided information on political survey questions
again supports our current findings (see Table V.7). Only two out of seven political views differ
noticeably between groups. However, both are not related to knowledge of CPR goods. There is
only one question that relates directly to that matter: how to best regulate fish catch. Yet even
though we observe lower marks for laissez-faire policies in both treatment groups, these effects
are too small to be statistically significant.37 Still, an overwhelming majority of all students35Similar results are found when relying on a Kruskal-Wallis equality-of-populations rank test. Here, test
statistics are 0.320 for contributions, and 0.493 for anticipated contributions, respectively. Furthermore, ad-dressing the same questions in a regression design using class-level random effects shows that contribution levelsare highly similar between both treatment groups when controls are correctly solved, and statistically indistin-guishable from the Control group (p > 0.5). The same is true for what is believed that others will contribute.Note that, for the sake of clarity, we abstained from showing descriptive statistics on the class level. Also here,both Kruskal-Wallis and Cuzick trend tests generally indicate no significant differences, with the exception ofthe share of correctly solved controls that again shows a slight trend from the Control over the Standard to theExperiment group (p = 0.067). All of these analyses are provided upon request.
36However, classes did on average increase the number of rounds played from the first to the second trialsubstantially (Wilcoxon matched-pairs signed-ranks test: p < 0.01). Table A.4 in the appendix summarizes.
37Opinions might be confounded by running the test questions first. Students from the Control group might
24

Table V.6 – Summary statistics
Public Goods game Control Standard Experiment
Contribution to Public Good [0,3] 1.74 1.65 1.58(1.07) (1.05) (1.02)
Anticipated contribution to Public Good [0,3] 1.66 1.65 1.57(.82) (.69) (.74)
Share of falsely answered control questions [0,1] ** .36 .32 .26(.48) (.47) (.44)
Remaining games Control Standard Experiment
Dictator game, contribution [0,9] 2.92 2.74 2.64(2.56) (2.27) (1.92)
Envy game, contribution [0,9] 7.62 7.73 7.19(2.24) (2.3) (2.74)
Ultimatum game, offer [0,9] 4.29 4.16 3.94(1.72) (1.45) (1.37)
Ultimatum game, rejection threshold [0,10] 1.88 1.92 1.97(1.87) (1.77) (1.64)
Trust game, give away [0,9] 3.91 3.96 3.8(3.02) (3.07) (3)
Trust game, return-to-receive ratio [0,1] .24 .23 .22(.19) (.13) (.12)
Share of falsely answered control questions [0,1] �� .12 .06 .1(.33) (.23) (.3)
Notes: Mean values per treatment. Standard deviation in parentheses. Stars indicate the level of significancefor a Cuzick trend test. Diamonds indicate the level of significance for a Kruskal-Wallis equality-of-populationsrank test. */ � Significant at 10%; **/ �� significant at 5%; ***/ ��� significant at 1%.
already believes that some sort of governmental intervention is needed to regulate fish catch,
and a traditional approach with a comprehensive set of rules for market participants is generally
favored over a marked-based approach based on tradable fishing rights. Quite generally, our
students appear sensitized to an ecologically compatible life style. A large majority would like to
see the government subsidizing investments into carbon emission reduction. The home country
bias, however, is strong as almost halve of these students do not consider that investments
abroad reveal a higher marginal return. Students are also sympathetic of carbon-neutral air
travels (with the revenue appropriated for the protection of the environment, only) but support
is quantitatively rather weak.
In sum, we conclude that hypothesis 4 is soundly rejected. Both behavior and preferences
appear unaffected by our one-time treatment interventions. Preferences slightly differ in some
areas but these do not relate to our field experiment.
have acquired knowledge from participation in the test. However, the fact that these students show even lessuncertainty in this question than those from the Experiment group, casts doubt on the magnitude of such aneffect. If students from the Control group ex-ante believed more strongly in laissez-faire policies but test questionssparked some mistrust, then one should observe increased uncertainty with respect to the proper solution to theproblem in comparison to both teaching interventions.
25

Table V.7 – Political Opinions
Variables Control Standard Experiment
International trade is affected by customs duty such as tariffs. (in %)High tariffs harm the domestic economy 44.8 47.0 47.4High tariffs benefit the domestic economy 22.4 26.3 27.4I do not know 32.8 26.7 25.2
Best governmental strategy to regulate fish catch? (in %)Do nothing: markets determine reasonable amount of fishing 2.4 0.9 0.4Government action: tradable fishing rights 26.1 33.1 26.8Government action: comprehensive set of regulations 64.7 62.2 65.5I do not know 6.8 3.9 7.2
Subsidize domestic companies for their investments into carbon emission reduction? (in %)No, such subsidies are not necessary 5.6 11.6 8.1Yes, for investments carried out in the domestic country only 43.2 50.6 44.1Yes, regardless of the recipient countries of the investments 42.8 33.5 37.3I do not know 8.4 4.3 10.6
Adopt carbon-neutral air travels [-2,2] .28 .33 .33(1.1) (1.06) (1.03)
Reduce agricultural subsidies [-2,2] * .22 .47 .23(1.79) (1.66) (1.67)
Strengthen role of government in health care [-2,2] ** −.18 0 .01(.96) (1.02) (.98)
Welfare state has grown too large [-2,2] −.14 −.01 −.31(1.56) (1.59) (1.54)
Notes: Mean values per treatment. Standard deviation in parentheses (if applicable). Values in square bracketsindicate the range of the indices. The [-2,2] index reads do not favor (-2), rather do not favor (-1), do notknow (0), rather do favor (1), do favor (2). Stars indicate the level of significance for a Kruskal-Wallisequality-of-populations rank test. * Significant at 10%; ** significant at 5%; *** significant at 1%.
VI. ConclusionThis paper provides evidence on the impact of classroom experiments on economic understand-
ing. Contrary to existing literature, which investigates university students exclusively, our focus
lies with high school students. The pervasive opinion that experimental learning is altogether
a more effective teaching practice could not be confirmed. Results from our field experiment
suggest that classroom experiments do not offer a significant benefit over conventional teaching
methods, as overall test scores were remarkably similar in both treatment groups. There are,
however, several potential explanations for this divergence. First, economic education at uni-
versities is generally more abstract than at high schools. Reliance on case studies, newspaper
articles or movie segments in our conventional teaching treatment encourages this view. Also,
conventional instruction on the tertiary level is often teacher-centered (“chalk and talk”) while,
commonly, teaching at high schools emphasizes discussions between a teacher and her students
more strongly. As a consequence, the additional value of the participatory element is less salient
on the high school level.38 Still, students in the Experiment treatment seem to abstract more
easily from what they have learned, leading to a significantly better understanding of public
good games. This confirms the need for an integrated study of learning effects as it has been
pointed out by, for example, Seidel and Shavelson (2007).38At the same time, our results lend support to the educational methodology at (Swiss) high schools, too.
26
In addition, low-ability students and females have been at a disadvantage in economics
classes, historically. Some evidence has been found that experimental instruction benefits fe-
males (Emerson and Taylor, 2004; Ball et al., 2006). We could not replicate those findings.
Our Experiment treatment, however, increased the dispersion in measured learning by offering
greater benefit to abler students while harming weaker students. This result is consistent with
Dickie (2006) but it runs counter to that of Emerson and Taylor (2004).39 We suspect that the
time used for different tasks partly explains low performance. This goes well with more recent
findings. Our classroom experiment does not require more preparation time than conventional
instruction, but it crowds out time spent on reiterating knowledge and working on related issues.
In Lavy (2011), both of these teaching elements are associated with conventional teaching, which
he finds to benefit less able students more. Similarly, Schwerdt and Wuppermann (2011) accen-
tuate the importance of time as a limiting factor in effective teaching practices. In rather general
fashion, they argue against a reduction of traditional lecture style teaching (opposite to teaching
based on problem solving), based on information on in-class time use from the 2003 wave of the
Trends in International Math and Science Study (TIMSS). Furthermore, participating teach-
ers view both traditional and experimental instruction as beneficial in both motivational and
learning domains, but assess the classroom experiment better throughout. This might lead to a
more frequent application of experiments in high schools. Not knowing that less able students
need additional guidance when conducting experiments, however, would stimulate unwanted
divergence in class performance.
Studying eventual side effects of our treatment interventions on both political opinions and
behavior revealed no coherent pattern. With the inclusion of incentivized economic decisions we
made a first systematic inquiry into the study of indoctrination at the high school level. Although
no effects were statistically significant, the slight downward trend in contributions warrants
further investigation. For these reasons we encourage a more extensive study of experimental
teaching at educational levels other than universities. In particular, we call for long term
randomized controlled trials covering multiple semesters. These would allow for the most proper
evaluation. Even though such studies demand substantial resources and coordination efforts of
all parties involved, they make for the most transparent approach to isolate consequences of
different teaching practices.
39Note that some studies also find no interaction effect. See, e.g., Ball et al. (2006).
27
ReferencesAaronson, D., L. Barrow, and W. Sander (2007): “Teachers and Student Achievement
in the Chicago Public High Schools,” Journal of Labor Economics, 25, 95–135.
Ball, S. B., C. Eckel, and C. Rojas (2006): “Technology Improves Learning in Large
Principles of Economics Classes: Using Our WITS,” The American Economic Review, 96,
442–446.
Basuchoudhary, A., C. Metcalf, K. Pommerenke, D. Reiley, C. Rojas, M. Rostek,
and J. Stodder (2008): “Price Discrimination and Resale: A Classroom Experiment,”
Journal of Economic Education, 39, 229–244.
Bauman, Y. and E. Rose (2011): “Selection or indoctrination: Why do economics students
donate less than the rest?” Journal of Economic Behavior & Organization, 79, 318–327.
Becker, W. E. (1997): “Teaching Economics to Undergraduates,” Journal of Economic Lit-
erature, 35, 1347–1373.
Becker, W. E. and M. Watts, eds. (1998): Teaching Economics to Undergraduates: Alter-
natives to Chalk and Talk, Cheltenham, U.K.: Elgar.
Bergstrom, T. and J. Miller (2000): Experiments with Economic Principles: Microeco-
nomics, McGraw-Hill, New York, 2 ed.
Bliss, L. B. (1980): “A Test of Lord’s Assumption regarding Examinee Guessing Behavior on
Multiple-Choice Tests Using Elementary School Students,” Journal of Educational Measure-
ment, 17, 147–153.
Cardell, N. S., R. Fort, W. Joerding, F. Inaba, D. Lamoreaux, R. Rosenman,
E. Stromsdorfer, and R. Bartlett (1996): “Laboratory-Based Experimental and
Demonstration Initiatives in Teaching Undergraduate Economics,” American Economic Re-
view, 86, 454–459.
Carter, J. R. and M. D. Irons (1991): “Are Economists Different, and If So, Why?” The
Journal of Economic Perspectives, 5, 171–177.
Cebula, R. and M. Toma (2002): “The Effect of Classroom Games on Student Learning and
Instructor Evaluations,” Journal of Economics and Finance Education, 1, 1–10.
Cheung, Y. and E. Fujii (2006): “Cross-country Relative Price Volatility: Effects of Market
Structure,” Review of International Economics, 14, 836–848.
Dickie, M. (2006): “Do Classroom Experiments Increase Learning in Introductory Microeco-
nomics?” Journal of Economic Education, 37, 267–288.
28
Diduch, A. (2010): “Patents and R&D: A Classroom Experiment,” International Review of
Economic Education, 9, 67–83.
Dufwenberg, M. and J. T. Swarthout (2009): “Play to Learn? An Experiment,” Working
Paper.
Durham, Y., T. Mckinnon, and C. Schulman (2007): “Classroom Experiments: Not Just
Fun and Games,” Economic Inquiry, 45, 162–178.
Emerson, T. L. N. and B. A. Taylor (2004): “Comparing Student Achievement across Ex-
perimental and Lecture-Oriented Sections of a Principles of Microeconomics Course,” South-
ern Economic Journal, 70, 672–693.
——— (2007): “Interactions between Personality Type and the Experimental Methods,” Journal
of Economic Education, 38, 18–35.
Falk, A. and C. Zehnder (2007): “Discrimination and In-Group Favoritism in a Citywide
Trust Experiment,” Tech. Rep. 2765, Institute for the Study of Labor (IZA).
Federal Statistical Office (2012): “Sekundarstufe II: Allgemein- und Berufsbildung,”
www.bfs.admin.ch/bfs/portal/de/index/themen/15/04/00/blank/uebersicht.html.
Fels, R. (1993): “’This Is What I Do, and I Like It.’,” Journal of Economic Education, 24,
365–370.
Frank, B. (1997): “The Impact of Classroom Experiments on the Learning of Economics: An
Empirical Investigation,” Economic Inquiry, 35, 763–769.
Frank, B. and G. G. Schulze (2000): “Does economics make citizens corrupt?” Journal of
Economic Behavior & Organization, 43, 101–113.
Frank, R. H., T. D. Gilovich, and D. T. Regan (1993): “Does Studying Economics
Inhibit Cooperation?” The Journal of Economic Perspectives, 7, 159–171.
Fraser, B. J., H. J. Walberg, W. W. Welch, and J. A. Hattie (1987): “Syntheses
of Educational Productivity Research,” International Journal of Educational Research, 11,
147–252.
Frey, B. S. and S. Meier (2003): “Are Political Economists Selfish and Indoctrinated?
Evidence from a Natural Experiment,” Economic Inquiry, 41, 448–462.
Gächter, S. and M. Königstein (2009): “Design a Contract: A Simple Principal-Agent
Problem as a Classroom Experiment,” Journal of Economic Education, 40, 173–187.
Graham, J. W. (2009): “Missing data analysis: Making it work in the real world,” Annual
Review of Psychology, 60, 549–576.
29
Gremmen, H. and J. Potters (1997): “Assessing the Efficacy of Gaming in Economic Edu-
cation,” Journal of Economic Education, 28, 291–303.
Hanushek, E. A. (2002): “Publicly Provided Education,” NBER Working Paper No. 8799.
Holt, C. A. (1999): “Teaching Economics with Classroom Experiments: A Symposium,”
Southern Economic Journal, 65, 603–610.
Holt, C. A. and S. K. Laury (1997): “Classroom Games: Voluntary Provision of a Public
Good,” Journal of Economic Perspectives, 11, 209–215.
Hoxby, C. M. (2000): “The Effects of Class Size on Student Achievement: New Evidence from
Population Variation,” Quarterly Journal of Economics, 115, 1239–1285.
Kane, T. J. and D. O. Staiger (2008): “Estimating Teacher Impacts on Student Achieve-
ment: An Experimental Evaluation,” .
Kirschner, P. and W. Huisman (1998): ““Dry Laboratories” in Science Education;
Computer-Based Practical Work,” International Journal of Science Education, 20, 665–682.
Kolb, D. A. (1983): Experiential Learning: Experience as the Source of Learning and Devel-
opment, Englewood, NJ: Prentice-Hall.
Lavy, V. (2011): “What Makes an Effective Teacher? Quasi-Experimental Evidence,” NBER
Working Paper No. 16885.
Marwell, G. and R. E. Ames (1981): “Economists free ride, does anyone else?: Experiments
on the provision of public goods, IV,” Journal of Public Economics, 15, 295–310.
Miller, H. L. (1927): Creative learning and teaching, New York: C. Scribner.
Mitchell, D. M. (2008): “An Examination of the Impact That Classroom Based Experiments
Have on Learning Economic Concepts,” Journal of Economics, 34, 21–34.
Muijtjens, H. van Mameren, Hoogenboom, Evers, and C. P. M. van der Vleuten
(1999): “The effect of a ‘don’t know’ option on test scores: number-right and formula scoring
compared,” Medical Education, 33, 267–275.
Pickhardt, M. (2005): “Teaching Public Goods Theory with a Classroom Game,” Journal of
Economic Education, 36, 145–159.
Rivkin, S. G., E. A. Hanushek, and J. F. Kain (2005): “Teachers, Schools, and Academic
Achievement,” Econometrica, 73, 417–458.
Rockoff, J. E. (2004): “The Impact of Individual Teachers on Student Achievement: Evidence
from Panel Data,” American Economic Review, 94, 247–252.
30
Rojas, C. (2011): “Market Power and the Lerner Index: A Classroom Experiment,” Journal
of Industrial Organization Education, 5.
Schafer, J. L. and J. W. Graham (2002): “Missing data: Our view of the state of the art,”
Psychological Methods, 7, 147–177.
Scheerens, J. and R. J. Bosker (1997): The foundations of educational effectiveness, Perg-
amon, Oxford, New York, N.Y.
Schwerdt, G. and A. C. Wuppermann (2011): “Is traditional teaching really all that bad?
A within-student between-subject approach,” Economics of Education Review, 30, 365–379.
Seidel, T. and R. J. Shavelson (2007): “Teaching Effectiveness Research in the Past Decade:
The Role of Theory and Research Design in Disentangling Meta-Analysis Results,” Review of
Educational Research, 77, 454 –499.
Selten, R. and A. Ockenfels (1998): “An Experimental Solidarity Game,” Journal of
Economic Behavior and Organization, 34, 517–539.
Skrondal, A. and S. Rabe-Hesketh (2004): Generalized Latent Variable Modeling: Multi-
level, Longitudinal, and Structural Equation Models, Chapman and Hall/CRC, 1 ed.
Walstad, W. and P. Saunders (1998): Teaching Undergraduate Economics: A Handbook
for Instructors, New York: McGraw-Hill.
Wößmann, L. and M. West (2006): “Class-size effects in school systems around the world:
Evidence from between-grade variation in TIMSS,” European Economic Review, 50, 695–736.
31
Appendix A
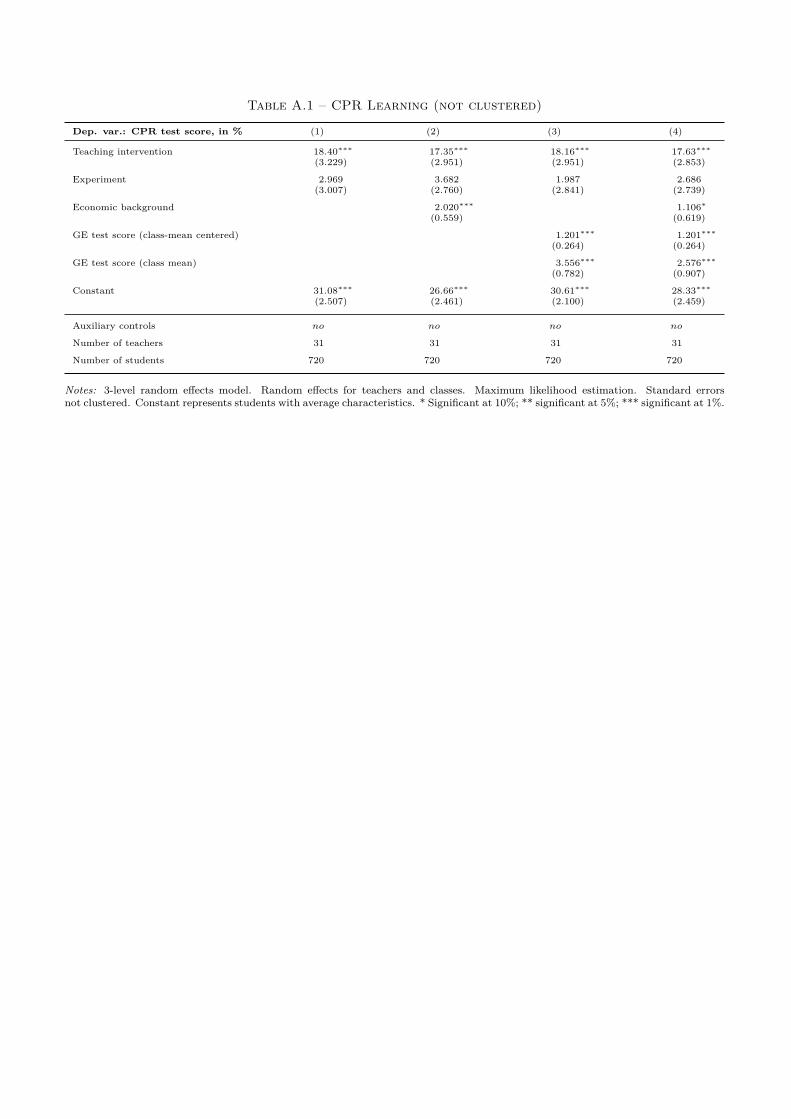
Table A.1 – CPR Learning (not clustered)
Dep. var.: CPR test score, in % (1) (2) (3) (4)
Teaching intervention 18.40∗∗∗ 17.35∗∗∗ 18.16∗∗∗ 17.63∗∗∗
(3.229) (2.951) (2.951) (2.853)
Experiment 2.969 3.682 1.987 2.686(3.007) (2.760) (2.841) (2.739)
Economic background 2.020∗∗∗ 1.106∗
(0.559) (0.619)
GE test score (class-mean centered) 1.201∗∗∗ 1.201∗∗∗
(0.264) (0.264)
GE test score (class mean) 3.556∗∗∗ 2.576∗∗∗
(0.782) (0.907)
Constant 31.08∗∗∗ 26.66∗∗∗ 30.61∗∗∗ 28.33∗∗∗
(2.507) (2.461) (2.100) (2.459)
Auxiliary controls no no no no
Number of teachers 31 31 31 31
Number of students 720 720 720 720
Notes: 3-level random effects model. Random effects for teachers and classes. Maximum likelihood estimation. Standard errorsnot clustered. Constant represents students with average characteristics. * Significant at 10%; ** significant at 5%; *** significant at 1%.

Table A.2 – CPR Learning, with interactions
Dep. var.: CPR test score, in % (1) (2) (3) (4)
Teaching intervention 20.73∗∗∗ 17.63∗∗∗ 20.70∗∗∗ 20.89∗∗∗
(2.482) (2.389) (2.480) (2.513)
Experiment 3.859 2.689 3.887 3.550(2.640) (2.192) (2.642) (2.640)
Economic background 2.461∗∗∗ 1.106∗ 2.464∗∗∗ 2.402∗∗∗
(0.824) (0.575) (0.827) (0.681)
Teaching intervention −1.969∗∗ −1.966∗∗ −2.713∗∗∗
× Economic background (0.831) (0.832) (0.794)
Experiment −0.720 −0.727 −0.350× Economic background (1.440) (1.439) (1.373)
GE test score (class mean) 2.936∗∗∗ 2.576∗∗∗ 2.928∗∗∗ 3.147∗∗∗
(0.729) (0.784) (0.730) (0.776)
GE test score (class-mean centered) 1.201∗∗∗ 0.726 0.726 0.399(0.316) (0.541) (0.541) (0.569)
Teaching intervention 0.0975 0.0975 0.0889× GE test score (class-mean centered) (0.757) (0.757) (0.748)
Experiment 1.228∗∗ 1.228∗∗ 1.156∗
× GE test score (class-mean centered) (0.618) (0.618) (0.603)
Female −1.379(1.760)
Foreign-born −3.160(2.807)
Grade in German 5.279∗∗∗
(1.925)
Grade in mathematics 0.807(0.998)
Disposable money, in CHF/month (in logs) 0.920(0.860)
No. of books at place of residence (in logs) 2.124∗∗∗
(0.655)
Parents’ highest education completed: ISCED 1 & 2 7.170(7.297)
Parents’ highest education completed: ISCED 5 & 6 0.542(2.053)
School is situated in a city (>100k) −2.815(2.504)
Class size 0.0456(0.298)
No. of semesters in Economics 0.973∗∗
(0.432)
Non-German-speaking −8.376∗∗∗
(2.379)
Age (class mean) −0.0311(0.847)
Age (class-mean centered) −2.912∗∗∗
(0.952)
Constant 26.76∗∗∗ 28.33∗∗∗ 26.77∗∗∗ 30.36∗∗∗
(1.948) (2.101) (1.948) (2.932)
Auxiliary controls no no no yes
Number of teachers 31 31 31 31
Number of students 720 720 720 720
Notes: 3-level random effects model. Random effects for teachers and classes. Maximum likelihood estimation. Standard errorsclustered on teachers. Constant represents students with average characteristics. * Significant at 10%; ** significant at 5%; ***significant at 1%.
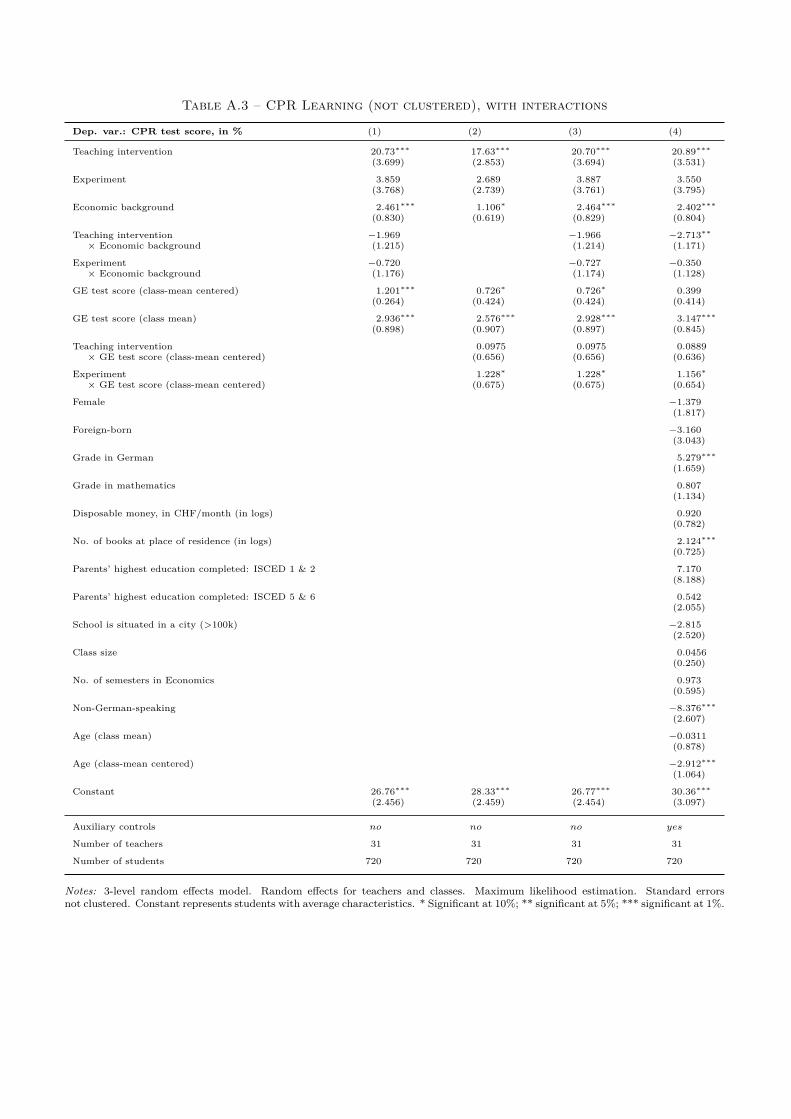
Table A.3 – CPR Learning (not clustered), with interactions
Dep. var.: CPR test score, in % (1) (2) (3) (4)
Teaching intervention 20.73∗∗∗ 17.63∗∗∗ 20.70∗∗∗ 20.89∗∗∗
(3.699) (2.853) (3.694) (3.531)
Experiment 3.859 2.689 3.887 3.550(3.768) (2.739) (3.761) (3.795)
Economic background 2.461∗∗∗ 1.106∗ 2.464∗∗∗ 2.402∗∗∗
(0.830) (0.619) (0.829) (0.804)
Teaching intervention −1.969 −1.966 −2.713∗∗
× Economic background (1.215) (1.214) (1.171)
Experiment −0.720 −0.727 −0.350× Economic background (1.176) (1.174) (1.128)
GE test score (class-mean centered) 1.201∗∗∗ 0.726∗ 0.726∗ 0.399(0.264) (0.424) (0.424) (0.414)
GE test score (class mean) 2.936∗∗∗ 2.576∗∗∗ 2.928∗∗∗ 3.147∗∗∗
(0.898) (0.907) (0.897) (0.845)
Teaching intervention 0.0975 0.0975 0.0889× GE test score (class-mean centered) (0.656) (0.656) (0.636)
Experiment 1.228∗ 1.228∗ 1.156∗
× GE test score (class-mean centered) (0.675) (0.675) (0.654)
Female −1.379(1.817)
Foreign-born −3.160(3.043)
Grade in German 5.279∗∗∗
(1.659)
Grade in mathematics 0.807(1.134)
Disposable money, in CHF/month (in logs) 0.920(0.782)
No. of books at place of residence (in logs) 2.124∗∗∗
(0.725)
Parents’ highest education completed: ISCED 1 & 2 7.170(8.188)
Parents’ highest education completed: ISCED 5 & 6 0.542(2.055)
School is situated in a city (>100k) −2.815(2.520)
Class size 0.0456(0.250)
No. of semesters in Economics 0.973(0.595)
Non-German-speaking −8.376∗∗∗
(2.607)
Age (class mean) −0.0311(0.878)
Age (class-mean centered) −2.912∗∗∗
(1.064)
Constant 26.76∗∗∗ 28.33∗∗∗ 26.77∗∗∗ 30.36∗∗∗
(2.456) (2.459) (2.454) (3.097)
Auxiliary controls no no no yes
Number of teachers 31 31 31 31
Number of students 720 720 720 720
Notes: 3-level random effects model. Random effects for teachers and classes. Maximum likelihood estimation. Standard errorsnot clustered. Constant represents students with average characteristics. * Significant at 10%; ** significant at 5%; *** significant at 1%.
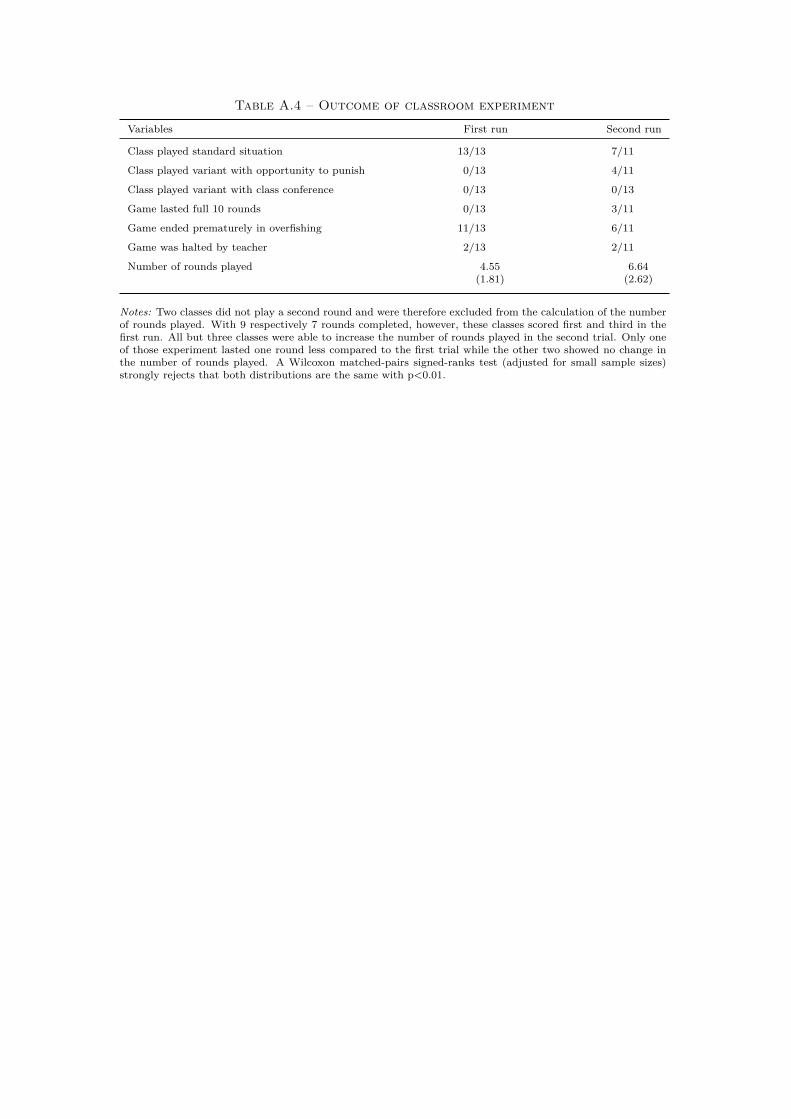
Table A.4 – Outcome of classroom experiment
Variables First run Second run
Class played standard situation 13/13 7/11
Class played variant with opportunity to punish 0/13 4/11
Class played variant with class conference 0/13 0/13
Game lasted full 10 rounds 0/13 3/11
Game ended prematurely in overfishing 11/13 6/11
Game was halted by teacher 2/13 2/11
Number of rounds played 4.55 6.64(1.81) (2.62)
Notes: Two classes did not play a second round and were therefore excluded from the calculation of the numberof rounds played. With 9 respectively 7 rounds completed, however, these classes scored first and third in thefirst run. All but three classes were able to increase the number of rounds played in the second trial. Only oneof those experiment lasted one round less compared to the first trial while the other two showed no change inthe number of rounds played. A Wilcoxon matched-pairs signed-ranks test (adjusted for small sample sizes)strongly rejects that both distributions are the same with p<0.01.
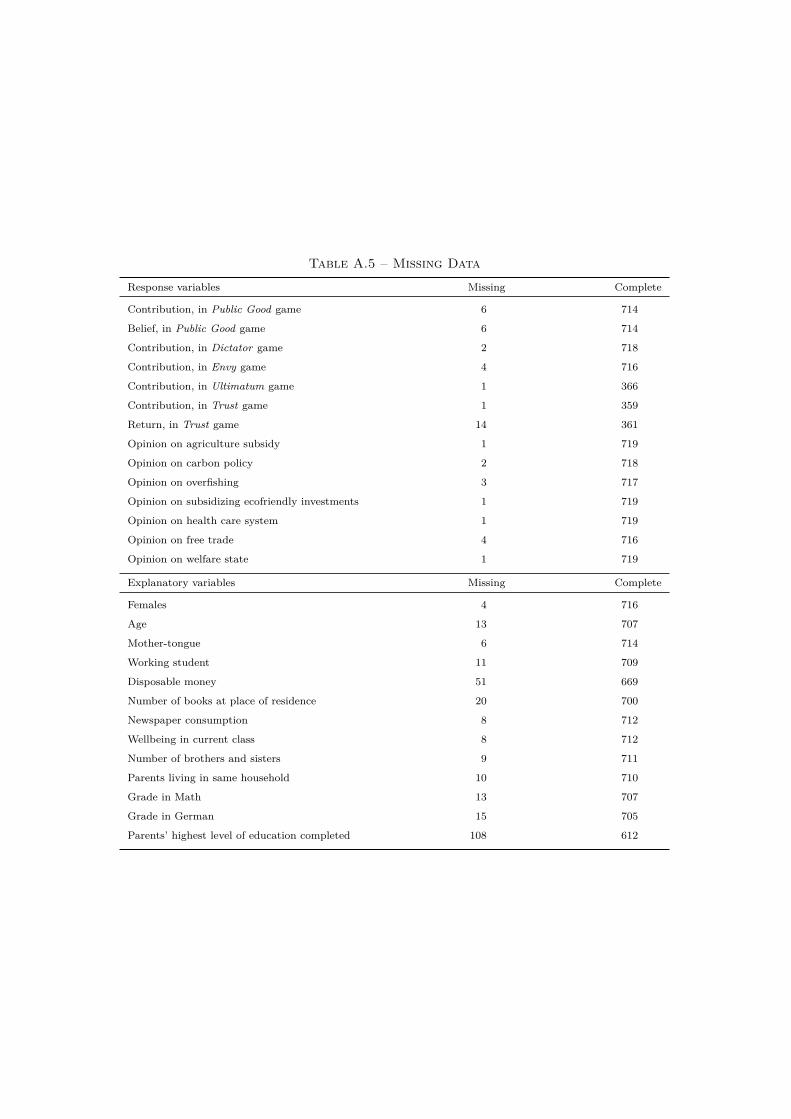
Table A.5 – Missing Data
Response variables Missing Complete
Contribution, in Public Good game 6 714
Belief, in Public Good game 6 714
Contribution, in Dictator game 2 718
Contribution, in Envy game 4 716
Contribution, in Ultimatum game 1 366
Contribution, in Trust game 1 359
Return, in Trust game 14 361
Opinion on agriculture subsidy 1 719
Opinion on carbon policy 2 718
Opinion on overfishing 3 717
Opinion on subsidizing ecofriendly investments 1 719
Opinion on health care system 1 719
Opinion on free trade 4 716
Opinion on welfare state 1 719
Explanatory variables Missing Complete
Females 4 716
Age 13 707
Mother-tongue 6 714
Working student 11 709
Disposable money 51 669
Number of books at place of residence 20 700
Newspaper consumption 8 712
Wellbeing in current class 8 712
Number of brothers and sisters 9 711
Parents living in same household 10 710
Grade in Math 13 707
Grade in German 15 705
Parents’ highest level of education completed 108 612

Appendix B

Instructions and Questionnaires
Students
Below we provide translated versions of the instructions, the test, and the questionnaire for
students first. Students received all material simultaneously. The test was collected after the
12 minutes time limit had expired. All material was collected after every student had finished
his/her questionnaire. Note that the ultimatum game and the trust game require a partner.
Questionnaires were handed out in four variations differing from each other with respect to
students being the first or second mover in the ultimatum game and the trust game, respectively
(first/first, first/second, second/first, and second/second). Students were randomly matched
with a partner of a complementary questionnaire. Questionnaires were given out in randomized
order. The below questionnaire presents the case for students being assigned to first movers
throughout.
Teachers
We also provide instructions and questionnaires for teachers. The first part of any questionnaire
is common to both treatments and the control group. Treatment-specific questions differ, yet
questions for the Standard treatment represent a subset of those in the Experiment treatment,
which is why they are not presented separately.
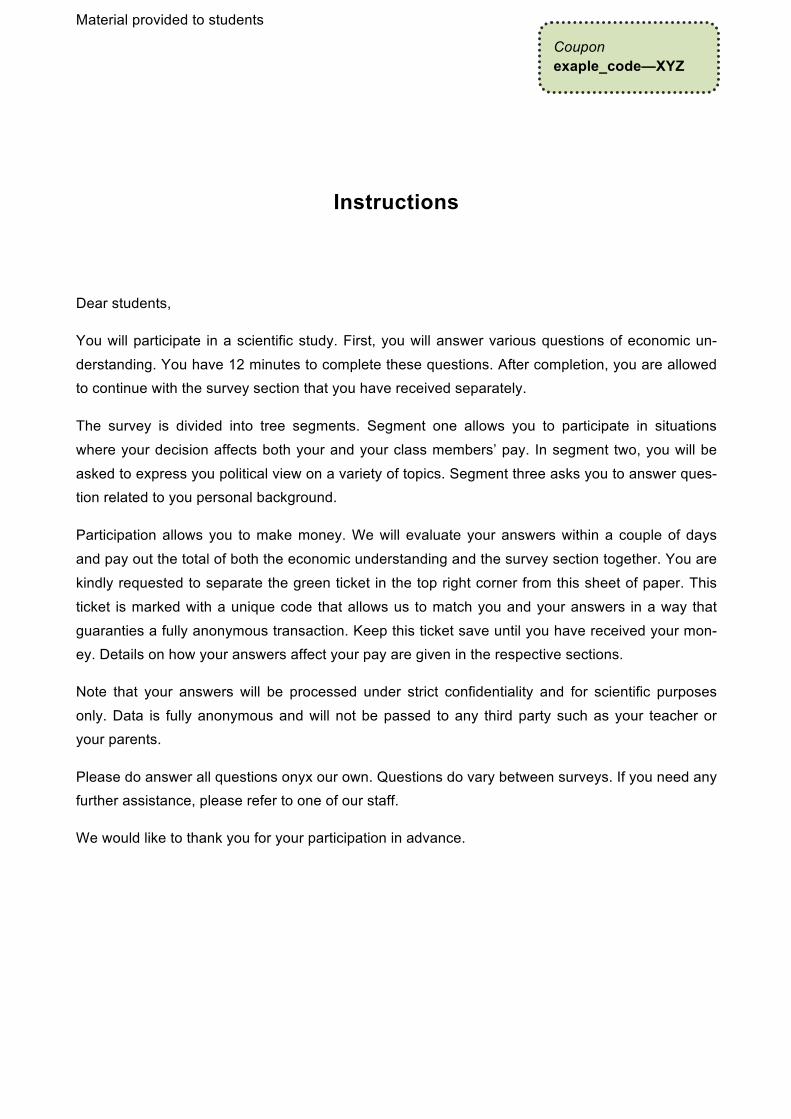
Material provided to students
Instructions
Dear students,
You will participate in a scientific study. First, you will answer various questions of economic un-
derstanding. You have 12 minutes to complete these questions. After completion, you are allowed to continue with the survey section that you have received separately.
The survey is divided into tree segments. Segment one allows you to participate in situations
where your decision affects both your and your class members’ pay. In segment two, you will be
asked to express you political view on a variety of topics. Segment three asks you to answer ques-tion related to you personal background.
Participation allows you to make money. We will evaluate your answers within a couple of days
and pay out the total of both the economic understanding and the survey section together. You are
kindly requested to separate the green ticket in the top right corner from this sheet of paper. This
ticket is marked with a unique code that allows us to match you and your answers in a way that
guaranties a fully anonymous transaction. Keep this ticket save until you have received your mon-ey. Details on how your answers affect your pay are given in the respective sections.
Note that your answers will be processed under strict confidentiality and for scientific purposes
only. Data is fully anonymous and will not be passed to any third party such as your teacher or your parents.
Please do answer all questions onyx our own. Questions do vary between surveys. If you need any further assistance, please refer to one of our staff.
We would like to thank you for your participation in advance.
Coupon exaple_code—XYZ

Material provided to students exaple_code—XYZ
1 | 4
Economic Understanding
You are about to answer multiple-choice questions on various topics of economic understanding. Please indicate whether you perceive an answer to be correct or false.
Every correctly answered question will gain you an additional 20 cents. Every false answer will
result in an equivalent deduction in payment. Example: You perceive the statement to be false and
mark it accordingly. However, the statement is actually true. Hence, 20 cents are deducted from your account.
You are also allowed to mark the "I do not know" checkbox. In that case, you will neither gain nor
lose money from this particular statement. Leaving blank any of the three checkboxes will be counted as an "I do not know" answer as well.
Should you happen to answer more statements falsely that correctly, your pay will be zero. It is not possible to lose money.
You have 12 minutes to answer the following questions.
Situation 1
For some animals living in the wild, the following conditions are true: Humans cannot be hindered
to make use of these animals (e.g. hunting). Each individual making use of these animals (e.g. hunting) will by his action decrease other humans' benefit given they are pursuing similar interests.
One example for the above situation is whales in the sea. What are the consequences of such a situation? Note that every statement is true only if the given justification is also true.
true false don't
know
a) Animals such as whales are often hunted down excessively due to the self-interest of the proprietor.
b) Animals such as whales are often hunted down excessively due to the lack of a proprietor who is able to pursue his property rights against the interest of others.
c) Animals such as whales are often hunted down excessively due to the irrational behavior of hunters and the lack of foresight regard-ing the consequences of their actions.
d) The likelihood of hunting down such animals excessively increases with the size of the group of hunters. Anonymity between hunters further stimulates this mechanism.
e) Animals such as whales will not be hunted down excessively if hunters know that these animals are close to being extinct.

Material provided to students exaple_code—XYZ
2 | 4
Situation 2
Four peasants let their cattle browse on the same pasture. This pasture belongs to the community.
Sadly, every peasant lets to many of his cows browse on the common pasture so that it cannot
recover in due time. The community recognizes the problem and is wiling to help. Which of the following propositions will most likely lead to the end of the overexploitation of the pasture?
true false don't
know
a) The community pays an additional 5'000 Swiss francs a year to each of the peasants.
b) The community divides the pasture into four parcels of land and sells these parcels to the peasants.
c) The community sets up a letter that explains the problem to the peasants. The letter reminds them that they let too many cattle browse on the pasture.
d) The community auctions the exclusive right of use of the pasture. The highest bid wins the right.
e) The community buys additional land so that the common pasture increases fourfold. Usage of the pasture is still free to all four peasants.
Situation 3
There are 30 guests residing in a mountain lodge. Using the shower is free of charge. An average
guest wants to use the shower for about 5 minutes. 10 guests want to shower 10 or more minutes. Warm water supply lasts for 4 minutes per guest only. Which of the following statements is true?
true false don't
know
a) If all guests are informed that the water supply is limited to 4 minutes per guest, then an overuse of warm water does usually not occur.
b) An overuse of warm water is less likely when all of the 30 guests are friends. Social norms help achieving this.
c) It is sensible to limit the usage of the shower to 4 minutes per guest.
d) It is not sensible to ask for a price for warm water, as it is not pos-sible to specify the benefit from using warm water for each of the 30 guests separately.

Material provided to students exaple_code—XYZ
3 | 4
Situation 4
Three independent and democratic countries are situated around a big lake. All three countries
engage in the agricultural business to a large extent and compete with lots of other countries on
the world market. The three countries rely heavily on the water supply from the above lake in order
to produce their agricultural goods. The lake, however, is close to running dry. For that reason, the
governments of the three countries meet. They agree upon reducing water usage from the lake in
the magnitude of 50% within the next 5 years. Each country is free to chose how it achieves this reduction individually.
true false don't
know
a) As we are speaking of democratic countries, it is usually the case that their commitment will be achieved successfully.
b) Whether the conference means a success remains to be seen. These countries are assumed to be fully independent, and hence there is no court at a higher level that can sanction unsuccessful countries.
c) Whether the conference means a success remains to be seen. None of the participating countries has any incentive to unilaterally weaken its agricultural business while others stay put.
Situation 5
Assume that the price for gasoline has risen sharply. What kinds of consequences are to be ex-pected in the short (a few days or weeks) or medium term (a few months)?
true false don't
know
a) Consumers will buy less gasoline.
b) Prices for cars running on fossil fuel will increase.
c) Prices for cars running on fissile fuel will decrease.
d) Prices for electric cars will fall.

Material provided to students exaple_code—XYZ
4 | 4
Situation 6
Assume a merchant and a customer agreeing to trade a banana for a given sum of money. Who will profit from this bargaining process?
true false don't
know
a) Usually, it is only the seller who does benefit from this trade.
b) It is usually both the seller and the buyer who benefit from such a trade.
c) None of the two parties usually benefits from such a trade. Both are as well off as they were before the trade.
d) The seller benefits and the buyer loses out on the trade, or vice versa.
Situation 7
Assume that the local authorities introduce a new maximum rent for all residences. This maximum
rent lies clearly below the current average rent. It is common knowledge that there was neither a
surplus nor a deficit of flats to rent prior to the intervention. Answer below statements considering only long-term effects of the intervention.
true false don't
know
a) Neither a surplus nor a deficit of flats to rent should be expected.
b) There will be more flats than there are people willing to rent. An excess in flats to rent is a likely result.
Situation 8
Sugar is bought and sold daily on an international commodity market. Who is responsible for the market price of a pound of sugar?
true false don't
know
a) Only the buyer willing to pay the highest price.
b) Only the seller willing to sell for the lowest price.
c) All the buyers and sellers together determine the market price for sugar.

Material provided to students exaple_code—XYZ
1 | 9
1. Economic decisions
In the following you will be able to make money based on the decisions you make. Your decision
has a direct impact on the amount of money you will get out of this segment. Income is calculated in points where
1 point equals 30 cents.
In some of the cases, it is not only your decision that affects your payment but also the decision of
other members of the class. Similarly, your decision-making can have an effect on the payment of
other class members. Whenever you are interacting with a class member, he or she is matched
with you purely by chance. Neither you nor the respective class member will be able to infer the identity of the other. Importantly, whenever you are faced with a decision affecting others
you are interacting with a member of the class only once.
As it has been stated before. You will receive the amount of money within a couple of days follow-
ing a strictly confidential procedure. It will not be possible for others to know how much money you made.

Material provided to students exaple_code—XYZ
2 | 9
Decision 1
You as well as every other member of the class are endowed with 3 points at the outset. Each of
you decides independently to keep this initial endowment or transfer all or parts of it into a public
cash box. The points total in the cash box will be doubled and back-transferred in equal shares to each of you, regardless of your initial contribution.
Hence, your income from this decision comprises:
• The points you decided not to transfer into the public cash box, and
• an equal share of the doubled sum transferred from all class members into the public cash box
Example: There are 20 students in a class. Their initial endowment is 3. Each of them transfers
exactly 0 points into the public cash box. As there are no points in the cash box, no points can be
doubled. Hence, students do not receive any income from the public cash box. As each of the stu-dents has kept his or her initial endowment, their final income is 3.
Derive the final income in the following example:
There are 20 students in a class. Their initial endowment is 3. One half of the class transfers 0
while the other halve transfers 3 points into the public cash box. All points transferred are doubled
yielding a total of 60 in the public cash box. As in the example above, each student gets an equal share out of the total sum in the cash box.
What is the final income of a student who has transferred exactly 0 into the public cash box?
Enter your answer in the box to the right (number).
What is the final income of a student who has transferred exactly 3 into the public cash box?
Enter your answer in the box to the right (number).
You are in the same situation as above. How do you decide with respect to your own class?
How many points do you transfer into the public cash box?
Enter your answer in the box to the right (number).
How many points of your endowment remain with you?
Enter your answer in the box to the right (number).
How many points will your average classmate transfer into the public cash box? What do you expect?
Enter your answer in the box to the right (number).
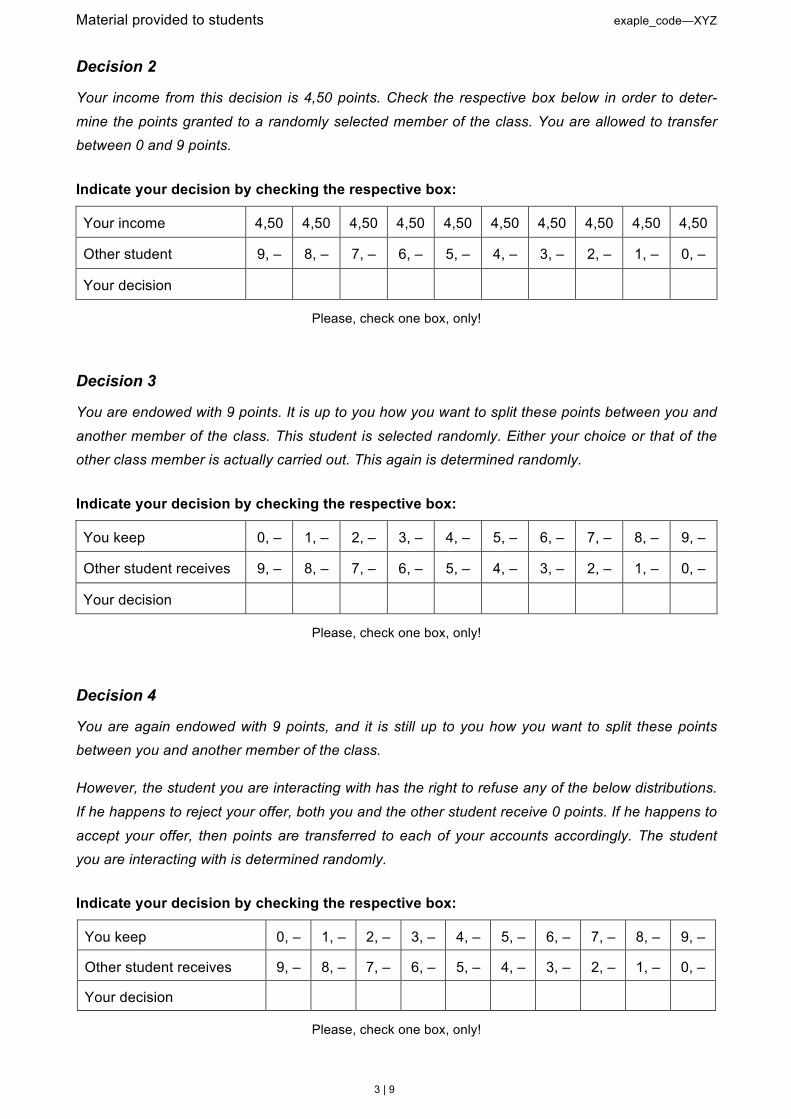
Material provided to students exaple_code—XYZ
3 | 9
Decision 2
Your income from this decision is 4,50 points. Check the respective box below in order to deter-
mine the points granted to a randomly selected member of the class. You are allowed to transfer between 0 and 9 points.
Indicate your decision by checking the respective box:
Your income 4,50 4,50 4,50 4,50 4,50 4,50 4,50 4,50 4,50 4,50
Other student 9, – 8, – 7, – 6, – 5, – 4, – 3, – 2, – 1, – 0, –
Your decision
Please, check one box, only!
Decision 3
You are endowed with 9 points. It is up to you how you want to split these points between you and
another member of the class. This student is selected randomly. Either your choice or that of the other class member is actually carried out. This again is determined randomly.
Indicate your decision by checking the respective box:
You keep 0, – 1, – 2, – 3, – 4, – 5, – 6, – 7, – 8, – 9, –
Other student receives 9, – 8, – 7, – 6, – 5, – 4, – 3, – 2, – 1, – 0, –
Your decision
Please, check one box, only!
Decision 4
You are again endowed with 9 points, and it is still up to you how you want to split these points between you and another member of the class.
However, the student you are interacting with has the right to refuse any of the below distributions.
If he happens to reject your offer, both you and the other student receive 0 points. If he happens to
accept your offer, then points are transferred to each of your accounts accordingly. The student you are interacting with is determined randomly.
Indicate your decision by checking the respective box:
You keep 0, – 1, – 2, – 3, – 4, – 5, – 6, – 7, – 8, – 9, –
Other student receives 9, – 8, – 7, – 6, – 5, – 4, – 3, – 2, – 1, – 0, –
Your decision
Please, check one box, only!

Material provided to students exaple_code—XYZ
4 | 9
Decision 5
You are endowed with 9 points. It is up to you how you want to split these points between you and another member of the class. The points transferred to the other student are now tripled.
The other student is free to decide how many of his points he will transfer back to you. However,
back-transferred points are not tripled. Again, the class member you are interacting with is chosen randomly.
Example: You are endowed with 9 points and decide to transfer 2 points to the other student. The-
se 2 points are tripled, resulting in 6 points total for the other students. You now have 7 points left
(9 minus 2). The other student decides to back-transfer 1 point to your account. His final income is then 5 (6 minus 1) while your final income is 8 (7 plus 1).
Derive the final income in the following example:
You are endowed with 9 points and transfer 5 to the other student. These 5 points are tripled, yield-ing 15 points in total. The other student decides to back-transfer 2 points to your account.
What is your final income?
Enter your answer in the box to the right (number).
What is the final income of the other student?
Enter your answer in the box to the right (number).
You are in the same situation as above. How do you decide yourself?
You keep 0, – 1, – 2, – 3, – 4, – 5, – 6, – 7, – 8, – 9, –
You transfer 9, – 8, – 7, – 6, – 5, – 4, – 3, – 2, – 1, – 0, –
Other student receives 27, – 24, – 21, – 18, – 15, – 12, – 9, – 6, – 3, – 0, –
Your decision
Please, check one box, only!
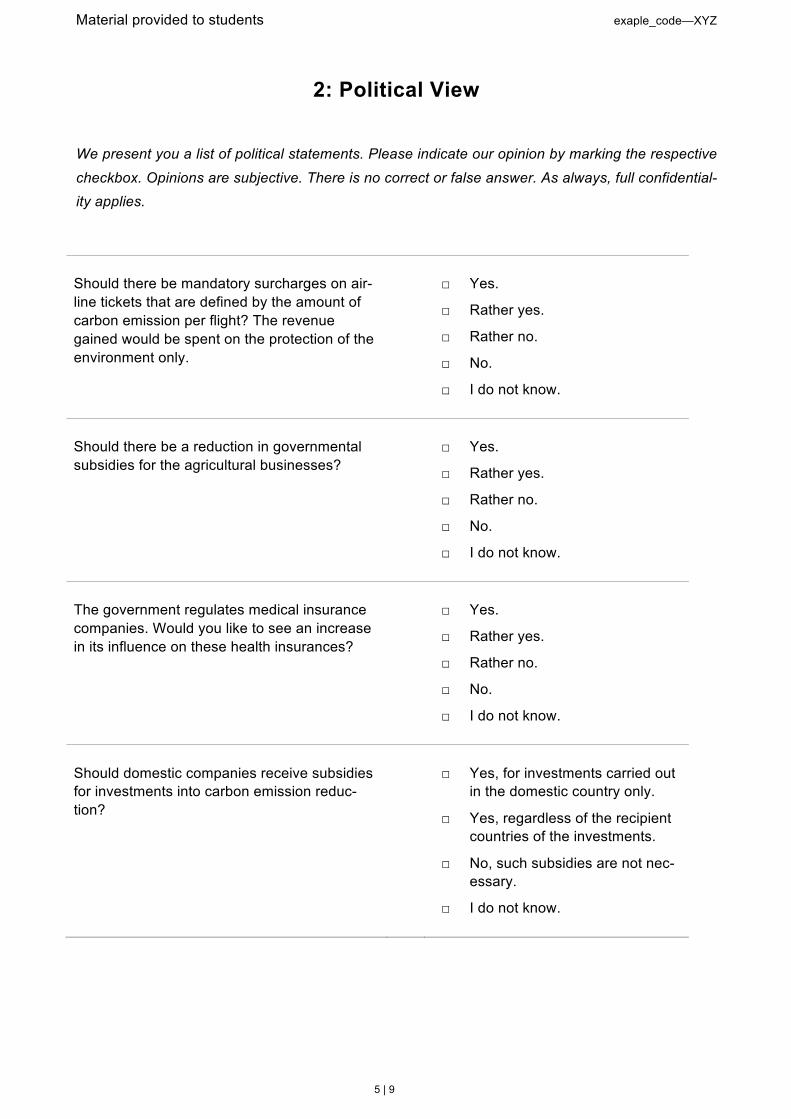
Material provided to students exaple_code—XYZ
5 | 9
2: Political View
We present you a list of political statements. Please indicate our opinion by marking the respective
checkbox. Opinions are subjective. There is no correct or false answer. As always, full confidential-ity applies.
Should there be mandatory surcharges on air-line tickets that are defined by the amount of carbon emission per flight? The revenue gained would be spent on the protection of the environment only.
□ Yes.
□ Rather yes.
□ Rather no.
□ No.
□ I do not know.
Should there be a reduction in governmental subsidies for the agricultural businesses?
□ Yes.
□ Rather yes.
□ Rather no.
□ No.
□ I do not know.
The government regulates medical insurance companies. Would you like to see an increase in its influence on these health insurances?
□ Yes.
□ Rather yes.
□ Rather no.
□ No.
□ I do not know.
Should domestic companies receive subsidies for investments into carbon emission reduc-tion?
□ Yes, for investments carried out in the domestic country only.
□ Yes, regardless of the recipient countries of the investments.
□ No, such subsidies are not nec-essary.
□ I do not know.
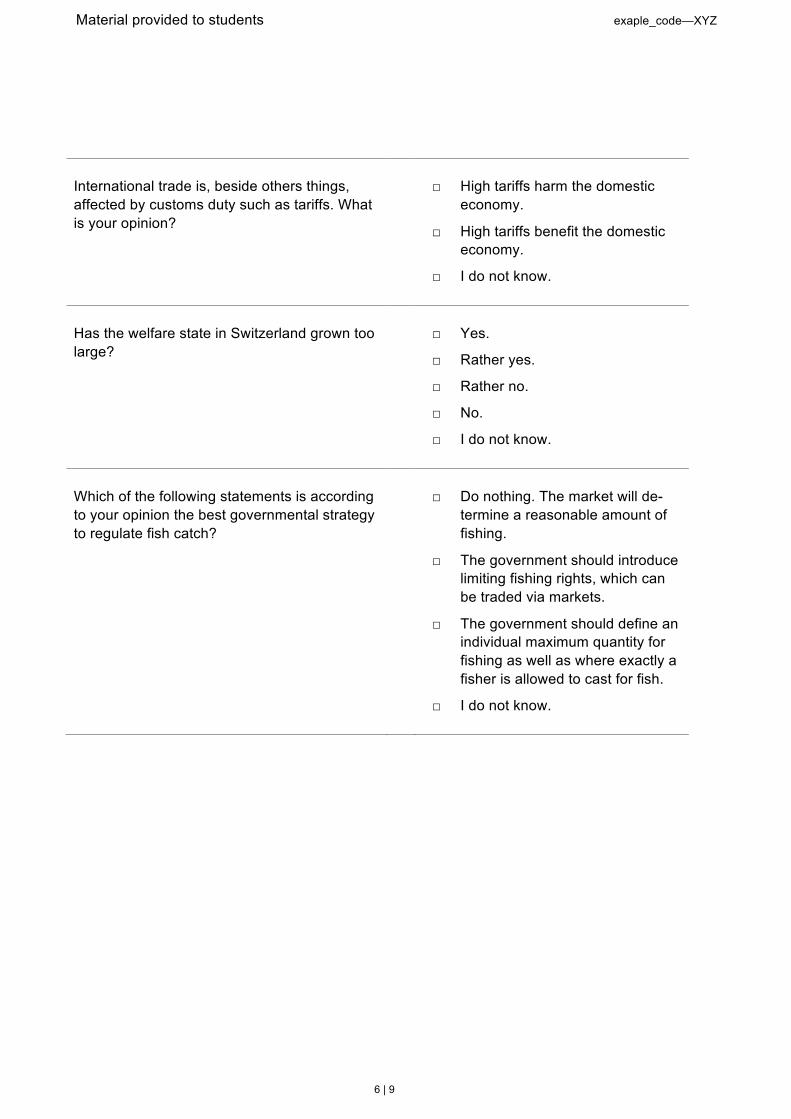
Material provided to students exaple_code—XYZ
6 | 9
International trade is, beside others things, affected by customs duty such as tariffs. What is your opinion?
□ High tariffs harm the domestic economy.
□ High tariffs benefit the domestic economy.
□ I do not know.
Has the welfare state in Switzerland grown too large?
□ Yes.
□ Rather yes.
□ Rather no.
□ No.
□ I do not know.
Which of the following statements is according to your opinion the best governmental strategy to regulate fish catch?
□ Do nothing. The market will de-termine a reasonable amount of fishing.
□ The government should introduce limiting fishing rights, which can be traded via markets.
□ The government should define an individual maximum quantity for fishing as well as where exactly a fisher is allowed to cast for fish.
□ I do not know.

Material provided to students exaple_code—XYZ
7 | 9
3: Personal Information
We would like to know more about your personal background. Information you provide is treated with strict confidentiality and will not be passed to any third party. Please answer truthfully.
• What is your sex?
Male Female Other
• What is your date of birth? (dd/mm/yyyy)
………………………………………………..
• What is your country of birth?
………………………………………………..
• Is your mother tongue German?
Yes No
• Please provide the grades from your last school certificate for the following subjects:
Subject Mathematics German French Sports Economics
Grade
• Where is your current place of residence? (Name + ZIP)
………………………………………………..
• Do your parents live in separate households?
Yes No

Material provided to students exaple_code—XYZ
8 | 9
• What is your parents’ highest level of education completed?
Primary or lower secondary education (compulsory education)
Upper secondary or post-secondary non-tertiary education
(e.g. vocational education, higher vocational education, general qualification for university entrance)
Tertiary education (e.g. university, university of applied sciences)
I do not know
• A bookshelf holds on average 40 books. Please give an estimate on the total number of
books at your place of residence. (Number)
………………………………………………..
• How many times do you on average read the newspapers a weak?
Never 1 - 2 2 - 3 3 - 4 4 - 5 5 - 6 6 - 7 > 7
• What is your general interest in topics revolving around economics?
Not interested Rather not interested
Very interested Rather interested
• How many brothers and sisters do you have? (Number)
………………………………………………..

Material provided to students exaple_code—XYZ
9 | 9
• How happy are you in your current class? (1 = very unhappy, 10 = very happy)
1 2 3 4 5 6 7 8 9 10
• Do you engage in the field of voluntary work?
yes, often yes, occasionally no
• Do you earn money besides going to school?
yes no
• How much pocket money do you get a month? (Average number)
………………………………………………..
• How much money do you have available each month, taking together your pocket money,
job earnings, and other sources of income. (Average number)
………………………………………………..
We value your opinion. You are encouraged to give us feedback on how you liked this question-
naire. In particular, indicate what was unclear to you and where you see scope for improvements.
…………………………………………………………………………………………………………………
…………………………………………………………………………………………………………………
…………………………………………………………………………………………………………………
…………………………………………………………………………………………………………………
………………………………………………………………………………………………………………...

Material provided to teachers
1 | 1
Instructions
Control Group
We would like to thank you for your participation in our field experiment. Your effort will contribute to the understanding of students’ learning behavior and improve the offerings of «iconomix.ch», the learning platform maintained by the Swiss National Bank. You were randomly chosen not to participate in any teaching treatment. This means that you will not have to prepare any lesson prior to the day of the evaluation. Please note the questionnaire attached. We advise you to fill in the questionnaire and hand it over to our staff the day the evaluation takes place. We would like to thank you again for your participation. Do not hesitate to contact our staff for further assistance by email or phone. Mr. Pascal Sulser, [email protected], +41446313926.

Material provided to teachers
1 | 2
Instructions
Standard Treatment
We would like to thank you for your participation in our field experiment. Your effort will contribute to the understanding of students’ learning behavior and improve the offerings of «iconomix.ch», the learning platform maintained by the Swiss National Bank. You were randomly chosen to carry out a lesson on common-pool resources (CPR) problems. In order to achieve a certain degree of comparability between teachers conducting the same treatment, you are kindly requested to follow the below instructions. Please also note the two questionnaires attached. We advise you to fill in the questionnaire on class properties before conducting the lesson. The second questionnaire revolves around your impressions on the treatment lesson and the material provided. Your feedback will help to further improve the learning experience. We encourage you to give critical feedback.
1. Preparation
i. Familiarize yourself with all the material provided. This is arguably the most time consuming part of your preparation.
ii. You have received the following documents by email:
«Overhead Transparencies» including a list of «Key Events», «Worksheets» including a sample solution, and the «Summary» text.
2. Conducting the treatment lesson (2x45 minutes)
Hold a lesson on CPR problems (scheduled time is 45 minutes)
i. Prepare a lesson on CPR problems to your liking. You are free to chose your didactic approach. We strongly encourage you not to use any classroom experiment for this lesson.
ii. You have received an overhead transparency on the decline of fish population in the Atlantic Ocean and a list of related key events in chronological order. Use this slide as an introductory example into the topic. Extend your lesson with additional resources to your liking.
iii. We suggest you discuss the following questions in particular
o What drives the problem of overfishing?
o What behavior is rewarding from an individual perspective?
o Which properties of international fishing lead to overfishing?
iv. What you need in class:
o Overhead transparency on the decline of fish population
o List of related key events
Deepen students’ understanding: CPR and the tragedy of the commons
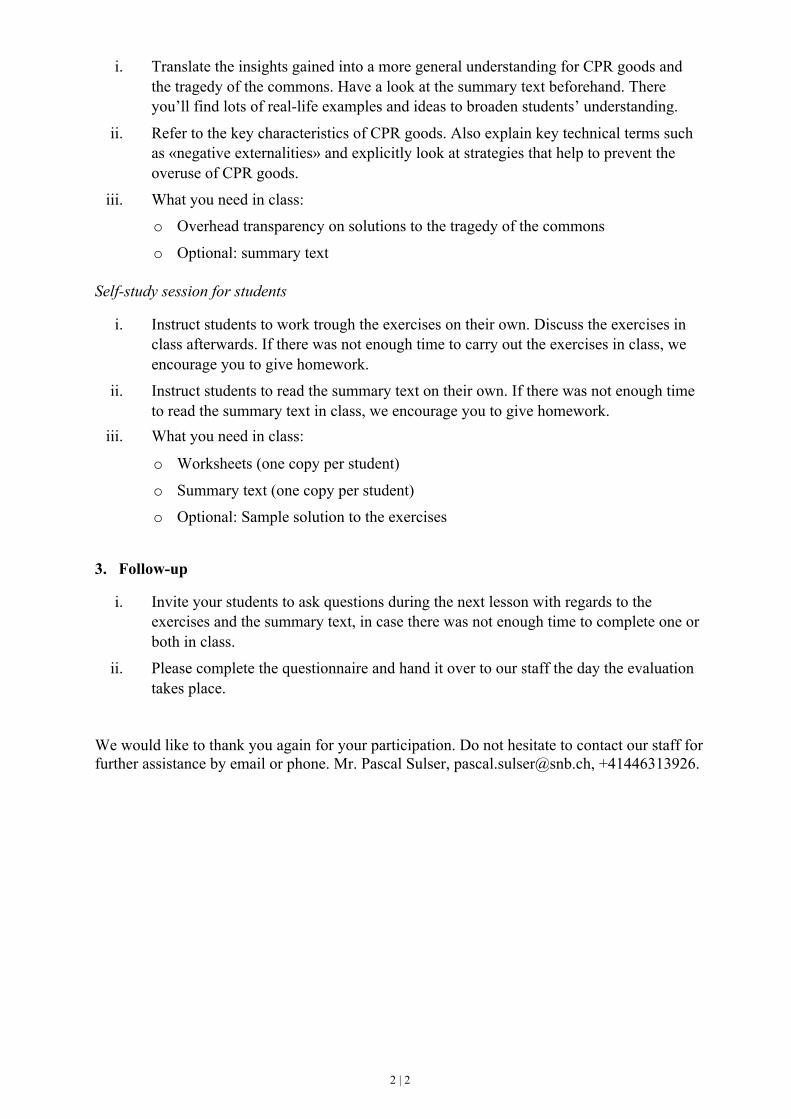
2 | 2
i. Translate the insights gained into a more general understanding for CPR goods and the tragedy of the commons. Have a look at the summary text beforehand. There you’ll find lots of real-life examples and ideas to broaden students’ understanding.
ii. Refer to the key characteristics of CPR goods. Also explain key technical terms such as «negative externalities» and explicitly look at strategies that help to prevent the overuse of CPR goods.
iii. What you need in class:
o Overhead transparency on solutions to the tragedy of the commons
o Optional: summary text
Self-study session for students
i. Instruct students to work trough the exercises on their own. Discuss the exercises in class afterwards. If there was not enough time to carry out the exercises in class, we encourage you to give homework.
ii. Instruct students to read the summary text on their own. If there was not enough time to read the summary text in class, we encourage you to give homework.
iii. What you need in class:
o Worksheets (one copy per student)
o Summary text (one copy per student)
o Optional: Sample solution to the exercises
3. Follow-up
i. Invite your students to ask questions during the next lesson with regards to the exercises and the summary text, in case there was not enough time to complete one or both in class.
ii. Please complete the questionnaire and hand it over to our staff the day the evaluation takes place.
We would like to thank you again for your participation. Do not hesitate to contact our staff for further assistance by email or phone. Mr. Pascal Sulser, [email protected], +41446313926.

Material provided to teachers
1 | 2
Instructions
Experiment Treatment
We would like to thank you for your participation in our field experiment. Your effort will contribute to the understanding of students’ learning behavior and improve the offerings of «iconomix.ch», the learning platform maintained by the Swiss National Bank. You were randomly chosen to carry out a classroom experiment on common-pool resources (CPR) problems. In order to achieve a certain degree of comparability between teachers conducting the same treatment, you are kindly requested to follow the below instructions. Please also note the two questionnaires attached. We advise you to fill in the questionnaire on class properties before conducting the lesson. The second questionnaire revolves around your impressions on the treatment lesson and the material provided. Your feedback will help to further improve the learning experience. We encourage you to give critical feedback.
1. Preparation
i. Familiarize yourself with all the material provided. This is arguably the most time consuming part of your preparation.
ii. In order to successfully carry out the classroom experiment, it is required to have appropriate masks. You can order a set of masks by sending a request to [email protected].
iii. You have received the following documents by email:
«Commentary for teachers», «Game instructions», «Overhead Transparencies», «Worksheets» including a sample solution, and the «Summary» text.
2. Conducting the treatment lesson (2x45 minutes)
Play the CPR simulation game (scheduled time is 45 minutes)
i. Conduct the classroom experiment according to the instructions. Please do not give an introduction to the topic in advance. For instance: «Today, we are going to carry out an experiment. You will see for yourself what it is all about in due time.» Explain the rules of the game with the aid of the overhead transparencies.
ii. We encourage you to play a first run without the option to punish, and a second run with punishment options and/or conferences.
iii. Present the results of both runs afterwards. Discuss the outcomes in class and give a first insight into the problem of CPR as it is suggested in the instructions. It is advised to introduce students to the case of overfishing in the Atlantic ocean. See the respective overhead transparencies and the additional information attached. Also see the commentary for teachers for suggestions on which particularities of the game should be highlighted and how to give explanations.
iv. What you need in class:
o Masks
o Overhead transparencies
2 | 2
v. What you need for preparation:
o Commentary for teachers
o Game instructions
Deepen students’ understanding: CPR and the tragedy of the commons
i. Translate the insights gained into a more general understanding for CPR goods and the tragedy of the commons. Have a look at the summary text beforehand. There you’ll find lots of real-life examples and ideas to broaden students’ understanding.
ii. Refer to the key characteristics of CPR goods. Also explain key technical terms such as «negative externalities» and explicitly look at strategies that help to prevent the overuse of CPR goods.
iii. What you need in class:
o Overhead transparencies
o Optional: summary text
Self-study session for students
i. Instruct students to work trough the exercises on their own. Discuss the exercises in class afterwards. If there was not enough time to carry out the exercises in class, we encourage you to give homework.
ii. Instruct students to read the summary text on their own. If there was not enough time to read the summary text in class, we encourage you to give homework.
iii. What you need in class:
o Worksheets (one copy per student)
o Summary text (one copy per student)
o Optional: Sample solution to the exercises
3. Follow-up
i. Invite your students to ask questions during the next lesson with regards to the exercises and the summary text, in case there was not enough time to complete one or both in class.
ii. Please complete the questionnaire and hand it over to our staff the day the evaluation takes place.
We would like to thank you again for your participation. Do not hesitate to contact our staff for further assistance by email or phone. Mr. Pascal Sulser, [email protected], +41446313926.

Material provided to teachers
1 | 1
Questionnaire
School: ……………………………………………… Class: ………………………
Information on current class
A) How many semesters of economic education has this class been taught up until now?
0 – 1 1 – 2 2 – 3 3 – 4
4 – 5 5 – 6 6 – 7 7 – 8
B) What is your impression with regards to the overall motivation and willingness to learn?
lower than avg. class rather lower than avg. class
average class rather above an avg. class above an avg. class
C) What is your impression with regards to the overall coherence of this class?
lower than avg. class rather lower than avg. class
average class rather above an avg. class above an avg. class
D) Please indicate the educational history of this class with respect to the following topics in economics:
not taught only briefly comprehensively
Conception of Demand & Supply
Consumer & Producer Surplus
Market Failure
Government Failure
Benefits of Trade
Externalities
Role of Prices in Market
Public Goods
Common Pool Resources

Material provided to teachers
1 | 3
Questionnaire
School: ……………………………………………… Class: ………………………
Considering the treatment lesson
A) Did you apply the teaching module on CPR problems already in the past?
never once multiple times
B) Please indicate which of the following material was used in your treatment session. Also indicate the approximate time spent on the respective task.
Summary text: about ………… minutes
Exercises: about ………… minutes
C) Did you use additional material or ideas that was not part of the package you received?
yes no
If your answer is yes, please explain your motivation and the procedure applied. If needed use an extra
sheet of paper to summarize your approach.
……………………………………………………………………………………………………
……………………………………………………………………………………………………
If your answer is yes, how much time did you spend on developing and carrying out your approach?
< ½ h ½ – 1 h 1 – 2 h 2 – 3 h > 3 h
D) How much time did you invest in preparing the treatment lesson?
< ½ h ½ – 1 h 1 – 2 h 2 – 3 h 3 – 4 h > 4 h
E) Would you say that the rules and procedures were clear to your students?
no rather no rather yes yes

2 | 3
F) How did you carry out the CPR simulation game? (Multiple answers possible)
Standard Punishment Conferences
First run:
Second run (if plaid at all):
G) How many rounds did the experiment last?
No. of rounds Pond was empty Game halted
First run: ……………
Second run (if plaid at all): ……………
H) All in all, how much time did it take to play the CPR simulation game? (Number)
………… minutes
I) Did the CPR simulation game trigger any emotional response in students?
weak rather weak rather strong strong
How would you describe the emotions observed: …………………………………………………
……………………………………………………………………………………………………
……………………………………………………………………………………………………
Do you think those emotions helped or hindered achieving the desired educational goal?
hindered rather hindered rather helped helped
J) What is your impression with regards to the interest shown in the treatment lesson?
low rather low average rather high high
K) What is your impression with regards to the achieved learning effect?
low rather low average rather high high
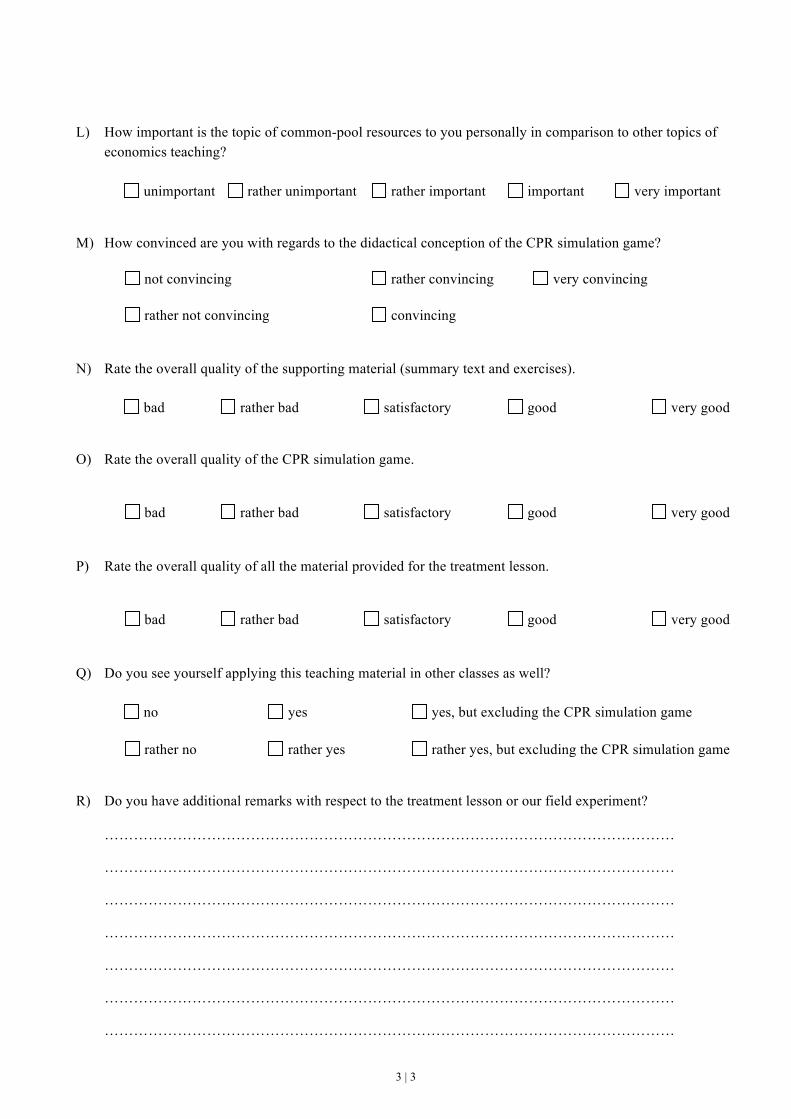
3 | 3
L) How important is the topic of common-pool resources to you personally in comparison to other topics of economics teaching?
unimportant rather unimportant rather important important very important
M) How convinced are you with regards to the didactical conception of the CPR simulation game?
not convincing rather convincing very convincing
rather not convincing convincing
N) Rate the overall quality of the supporting material (summary text and exercises).
bad rather bad satisfactory good very good
O) Rate the overall quality of the CPR simulation game.
bad rather bad satisfactory good very good
P) Rate the overall quality of all the material provided for the treatment lesson.
bad rather bad satisfactory good very good
Q) Do you see yourself applying this teaching material in other classes as well?
no yes yes, but excluding the CPR simulation game
rather no rather yes rather yes, but excluding the CPR simulation game
R) Do you have additional remarks with respect to the treatment lesson or our field experiment?
………………………………………………………………………………………………………
………………………………………………………………………………………………………
………………………………………………………………………………………………………
………………………………………………………………………………………………………
………………………………………………………………………………………………………
………………………………………………………………………………………………………
………………………………………………………………………………………………………

Teaching MaterialThe full set of instructions, as well as all documents required to carry out treatment lessons are
provided below. All teaching material is provided in a translated version by the Swiss National
Bank, which is also accessible online at “iconomix.ch”, although information provided online is
subject to change.
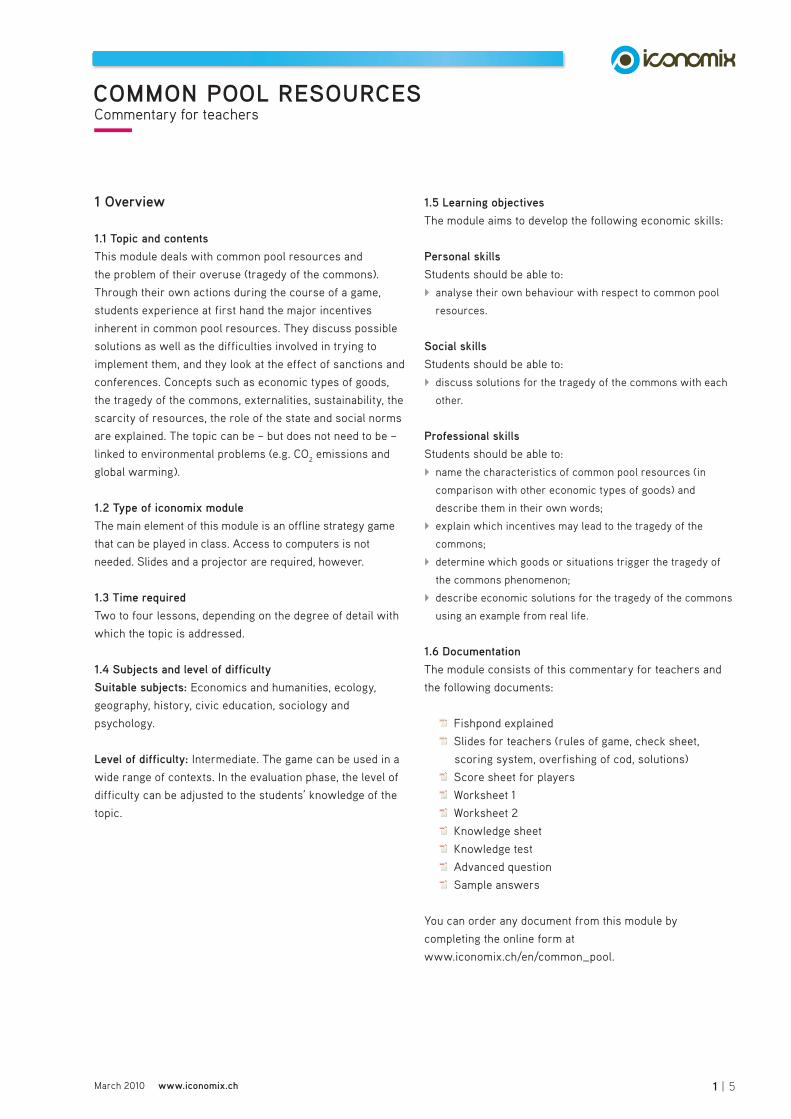
COMMON POOL RESOURCES
March 2010 www.iconomix.ch
1 Overview
1.1 Topic and contentsThis module deals with common pool resources and
the problem of their overuse (tragedy of the commons).
Through their own actions during the course of a game,
students experience at first hand the major incentives
inherent in common pool resources. They discuss possible
solutions as well as the difficulties involved in trying to
implement them, and they look at the effect of sanctions and
conferences. Concepts such as economic types of goods,
the tragedy of the commons, externalities, sustainability, the
scarcity of resources, the role of the state and social norms
are explained. The topic can be – but does not need to be –
linked to environmental problems (e.g. CO2 emissions and
global warming).
1.2 Type of iconomix module The main element of this module is an offline strategy game
that can be played in class. Access to computers is not
needed. Slides and a projector are required, however.
1.3 Time requiredTwo to four lessons, depending on the degree of detail with
which the topic is addressed.
1.4 Subjects and level of difficultySuitable subjects: Economics and humanities, ecology,
geography, history, civic education, sociology and
psychology.
Level of difficulty: Intermediate. The game can be used in a
wide range of contexts. In the evaluation phase, the level of
difficulty can be adjusted to the students’ knowledge of the
topic.
1.5 Learning objectivesThe module aims to develop the following economic skills:
Personal skillsStudents should be able to:
analyse their own behaviour with respect to common pool
resources.
Social skillsStudents should be able to:
discuss solutions for the tragedy of the commons with each
other.
Professional skillsStudents should be able to:
name the characteristics of common pool resources (in
comparison with other economic types of goods) and
describe them in their own words;
explain which incentives may lead to the tragedy of the
commons;
determine which goods or situations trigger the tragedy of
the commons phenomenon;
describe economic solutions for the tragedy of the commons
using an example from real life.
1.6 DocumentationThe module consists of this commentary for teachers and
the following documents:
PDFPDF Fishpond explainedPDFPDF Slides for teachers (rules of game, check sheet,
scoring system, overfishing of cod, solutions)PDFPDF Score sheet for playersPDFPDF Worksheet 1
PDFPDF Worksheet 2PDFPDF Knowledge sheetPDFPDF Knowledge testPDFPDF Advanced questionPDFPDF Sample answers
You can order any document from this module by
completing the online form at
www.iconomix.ch/en/common_pool.
Commentary for teachers
1 | 5

COMMON POOL RESOURCES
March 2010 www.iconomix.ch
2 Working with the module
2.1 Overview of module phasesThe teaching material is based on a three-phase concept:
1. Learning by doing: Offline strategy game (Fishpond)
2. Learning through dialogue: Discussion in class,
knowledge sheet, transfer task
3. Learning by applying: Knowledge test
For information on the educational background, cf.
‘Learning with iconomix’ at www.iconomix.ch/en/learning.
An overview of how to work with the module, including
space for notes and individual modifications, can be found
at the end of this document.
2.2 Learning by doingIn the first phase, the students play the strategy game –
Fishpond – in class. Using a projector and slides, the teacher
guides the students through the game. The rules of the game
and the different stages of each round are described in a
separate document (‘Fishpond explained’).
In this game, a fishpond serves as the common pool
resource. In several rounds, the students anonymously
try to catch as many fish (points) as possible. Each player
can catch up to three fish per round. If they catch no more
than two fish per round on average, the fish population
can recover in a sustainable way between the rounds. This
means, theoretically, that there would always be sufficient
fish in the pond and the game could go on forever. However,
since the players are tempted to catch three fish per round,
the resource is usually overused or even depleted; an
outcome which is bad for everybody. This situation clearly
demonstrates the conflict between the temptation to achieve
personal gain and the desire to act in the interest of the group
as a whole; in other words, a classic case of the tragedy of
the commons.
To make sure that decisions are taken anonymously,
players should wear masks. These can be ordered at
www.iconomix.ch/en/common_pool.
Over the course of the game, penalties for overuse may be
introduced. This means that whoever catches three fish in
any one round may receive penalty points, which are then
deducted from their score. This can only happen if enough
other players participate in an effort to punish them and
are willing to give up one of their own points. While this
may slow the depletion of the resource, the process can
generally not be stopped altogether.
One particularly interesting aspect to the game is the option
to call a class conference. The players get three minutes to
decide on how to proceed and whether to change something
about the way they are playing the game. It is theoretically
possible that, after such a conference, the fish population
in the pond can be sustained for the duration of the game.
The outcome remains to be seen, however. Just like in real
life, it is to be expected that not all players will observe the
resolutions made in the conference.
Ideally, the game should first be played without the
additional options (penalty points, class conference),
which means that it will probably only take a few rounds.
The game can then be played a second time, this time
introducing the penalty option and – if the fish population
continues to fall – calling a class conference. This way, the
students get to experience both the depletion of the fish
stocks (in the first game) and the effect of a conference
(in the second game). An alternative approach would be
to play just one game, introducing the penalty option after
two rounds and, if necessary, calling a class conference at
a later round. Although this eliminates the need to play the
game twice, the students may not get to witness the fish
stock depletion. It also makes it more difficult to compare
the different game outcomes, i.e. with measures to counter
the problem versus without.
Not all teachers can easily identify with the aim of the game.
The aim of the game (to catch as many fish as possible)
is distinct from the learning objective (to understand the
tragedy of the commons). The game exemplifies a problem
that commonly occurs in the real world. While this might
call for a discussion on ethical issues, it is recommended to
play the game first before doing so. Ensuring the survival of
the fishpond may seem like a preferable goal, but this would
only result in a tedious, dull game, which would neither
spark a discussion afterwards nor reflect reality (e.g. the
overfishing of the world’s oceans).
Helpful hints To motivate the students, the teacher could set realistic
goals; for instance, by awarding a small prize to all players
who achieve grade 5 or above, and a more substantial prize
to those who achieve grade 5.5 or above. If all the students
exercise some restraint when playing and only ever take two
Commentary for teachers
2 | 5
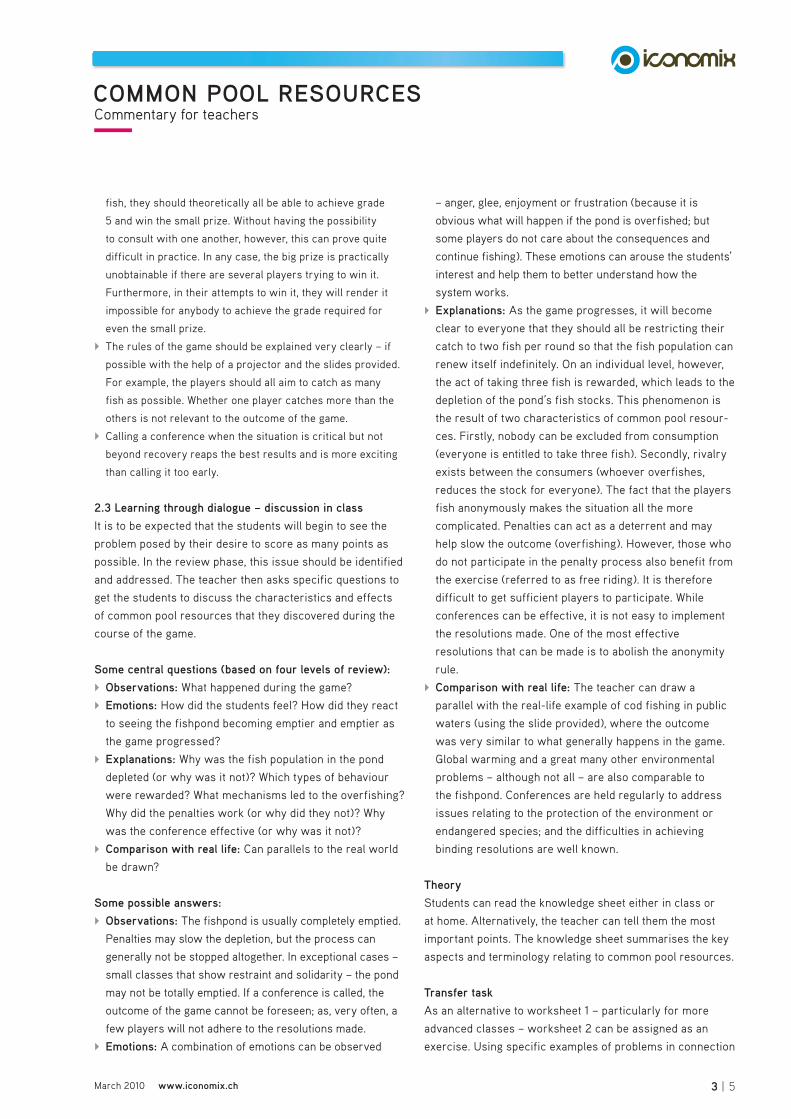
COMMON POOL RESOURCES
March 2010 www.iconomix.ch
fish, they should theoretically all be able to achieve grade
5 and win the small prize. Without having the possibility
to consult with one another, however, this can prove quite
difficult in practice. In any case, the big prize is practically
unobtainable if there are several players trying to win it.
Furthermore, in their attempts to win it, they will render it
impossible for anybody to achieve the grade required for
even the small prize.
The rules of the game should be explained very clearly – if
possible with the help of a projector and the slides provided.
For example, the players should all aim to catch as many
fish as possible. Whether one player catches more than the
others is not relevant to the outcome of the game.
Calling a conference when the situation is critical but not
beyond recovery reaps the best results and is more exciting
than calling it too early.
2.3 Learning through dialogue – discussion in classIt is to be expected that the students will begin to see the
problem posed by their desire to score as many points as
possible. In the review phase, this issue should be identified
and addressed. The teacher then asks specific questions to
get the students to discuss the characteristics and effects
of common pool resources that they discovered during the
course of the game.
Some central questions (based on four levels of review): Observations: What happened during the game?
Emotions: How did the students feel? How did they react
to seeing the fishpond becoming emptier and emptier as
the game progressed?
Explanations: Why was the fish population in the pond
depleted (or why was it not)? Which types of behaviour
were rewarded? What mechanisms led to the overfishing?
Why did the penalties work (or why did they not)? Why
was the conference effective (or why was it not)?
Comparison with real life: Can parallels to the real world
be drawn?
Some possible answers: Observations: The fishpond is usually completely emptied.
Penalties may slow the depletion, but the process can
generally not be stopped altogether. In exceptional cases –
small classes that show restraint and solidarity – the pond
may not be totally emptied. If a conference is called, the
outcome of the game cannot be foreseen; as, very often, a
few players will not adhere to the resolutions made.
Emotions: A combination of emotions can be observed
– anger, glee, enjoyment or frustration (because it is
obvious what will happen if the pond is overfished; but
some players do not care about the consequences and
continue fishing). These emotions can arouse the students’
interest and help them to better understand how the
system works.
Explanations: As the game progresses, it will become
clear to everyone that they should all be restricting their
catch to two fish per round so that the fish population can
renew itself indefinitely. On an individual level, however,
the act of taking three fish is rewarded, which leads to the
depletion of the pond’s fish stocks. This phenomenon is
the result of two characteristics of common pool resour-
ces. Firstly, nobody can be excluded from consumption
(everyone is entitled to take three fish). Secondly, rivalry
exists between the consumers (whoever overfishes,
reduces the stock for everyone). The fact that the players
fish anonymously makes the situation all the more
complicated. Penalties can act as a deterrent and may
help slow the outcome (overfishing). However, those who
do not participate in the penalty process also benefit from
the exercise (referred to as free riding). It is therefore
difficult to get sufficient players to participate. While
conferences can be effective, it is not easy to implement
the resolutions made. One of the most effective
resolutions that can be made is to abolish the anonymity
rule.
Comparison with real life: The teacher can draw a
parallel with the real-life example of cod fishing in public
waters (using the slide provided), where the outcome
was very similar to what generally happens in the game.
Global warming and a great many other environmental
problems – although not all – are also comparable to
the fishpond. Conferences are held regularly to address
issues relating to the protection of the environment or
endangered species; and the difficulties in achieving
binding resolutions are well known.
TheoryStudents can read the knowledge sheet either in class or
at home. Alternatively, the teacher can tell them the most
important points. The knowledge sheet summarises the key
aspects and terminology relating to common pool resources.
Transfer taskAs an alternative to worksheet 1 – particularly for more
advanced classes – worksheet 2 can be assigned as an
exercise. Using specific examples of problems in connection
Commentary for teachers
3 | 5
COMMON POOL RESOURCES
March 2010 www.iconomix.ch
with common pool resources, the students look at causes
and possible solutions. For this purpose, the teacher can
display the slide with possible solutions on the projector or
distribute the document among the students. Answers may
be discussed or reviewed in class. Alternatively, the class
(or teacher) can use the internet or other media to obtain
information about a conference on overfishing or climate
change that actually took place, and analyse any resolutions
made.
Were specific resolutions taken? If not, why not? If so, what
type of resolutions were they (see the slide on possible
solutions)? Why do the measures seem promising (or why
do they not)?
2.4 Learning by applyingTo round off the module, the teacher can have the students
take a short knowledge test. The test aims to secure a
minimum knowledge of the topic and check how much the
students retained.
In addition to the test, a more difficult question – the
advanced question – is available.
An even more demanding question – the challenge
question – is also available. Only students who have
dealt with the topic in detail should tackle this question.
By submitting their answers via the internet, individual
students, student groups or entire classes can participate
in the iconomix award.
Information on the iconomix award is available at:
www.iconomix.ch/en/award.
3 Additional information
In this section, the German and French versions of the
commentary for teachers provide references to textbooks
used in Swiss upper secondary schools in the respective
language regions and to other recommended resources
from the same language regions. Please refer to the
corresponding language versions.
Commentary for teachers
4 | 5

COMMON POOL RESOURCES
March 2010 www.iconomix.ch
4 Overview of module
PHASE 1 Learning by doing
20–45 minutes
Introduction Introduction to strategy game, Fishpond.
Rules of game (slides)Check sheet for teachers (slide)Scoring system (slide)Score sheet for playersProjector
5–10 minutes
Fishpond game Play game; possibly more than once.
Check sheet for teachers (slide)Score sheet for participantsMasksProjector
10–30 minutes
Evaluation of results
Record results. Award prizes. Check sheet for teachers (slide)Scoring system (slide)PrizesProjector
5 minutes
PHASE 2 Learning through dialogue
45–120 minutes
Class discussion and review
Review game using questions provided. Teacher provides explanations and draws parallels to real life.
Commentary for teachers (incl. questions)Overfishing of cod (slide)
5–20 minutes
Theory Read knowledge sheet either in class or at home, or the teacher summarises the most important points.
Knowledge sheet 10–15 minutes
Advanced task Work through worksheet 1 and/or worksheet 2, either in pairs or small groups. Discuss answers in class.
Worksheet 1Worksheet 2Sample answers
20–90 minutes
PHASE 3 Learning by applying
15+ minutes
Knowledge test Work through knowledge test, either as an exercise or a test.
Knowledge test Sample answers
15–30 minutes
Advanced question
Answer advanced question. Teacher provides solutions.
Advanced question Sample answers
Open-ended
Challenge question
Answer challenge question. Participate in award.
Challenge questionInformation on iconomix award
Open-ended
STEPS DESCRIPTION MEDIA/MATERIAL TIME
Commentary for teachers
5 | 5

COMMON POOL RESOURCES
March 2010 www.iconomix.ch
1 Preparation and introduction
Fishpond explained
1.1 Get started
Get everything together: check sheet for teachers, slides on rules of game, slide with scoring system, score sheet for players, projector, masks, prizes (optional).
Seating may be arranged in a U-shape (optional).
If no masks or blindfolds are being used, players need to be seated in a U-shape (facing away from each other), so that they can take anonymous decisions.
1.2 Explain the game
In this role-playing game, players are asked to fish in a pond. At the beginning of the game, the pond contains four fish per
player (e.g. 20 players = 80 fish). The game is played in rounds. In each round, every player may
catch between zero and three fish. The remaining fish multiply between rounds. The game lasts for a maximum of ten rounds.
Explain the rules as clearly and precisely as possible. The slides provided can be used for this purpose.
1.3 Explain the aim and show prizes
The aim of the game is to catch as many fish (points) as possible in ten rounds.
Show the players the slide with the scoring system as well as any prizes for top scorers. Awarding prizes increases motivation.
Option: A prize can be awarded to the whole class if the pond has not been depleted after ten rounds.
1.4 Describe stages of a round
Each round consists of three ‘casts’ (opportunities to catch a fish). In the first cast, players raise their hands if they wish to catch a fish. To catch a second or third fish, players keep their hands raised in the second and third casts.
After each round, players enter their new points and the total points on their score sheets.
The number of fish remaining in the pond doubles between rounds. However, there is a capacity limit. The pond does not hold more than four fish per player.
Players who choose not to catch a fish in a particular cast may not re-enter the round in a subsequent cast. This means that the second cast is only open to those who fished in the first cast, and the third cast is only open to those who fished in the second cast. Anyone wishing to catch just one fish, therefore, must do so in the first cast.
Ensure at this stage that the players know how to complete the score sheet. Penalties can be introduced at a later stage (if the teacher wishes to include this option).
1.5 Additional remarks
Hand out masks. As fishing is done anonymously, masks need to be worn during the rounds.
Players should not talk to each other.
Instead of masks, blindfolds may be used. Alternatively, players may be seated in a U-shape (facing away from each other).
COMMENTS
1 | 3

COMMON POOL RESOURCES
March 2010 www.iconomix.ch
2 The game
Fishpond explained
2.1 Play rounds without penalties
The teacher enters the number of players and the number of fish in the pond at the beginning of the game on the check sheet.
Players put on their masks. Players wishing to catch a fish raise their hands. The teacher enters the number of caught fish on the check sheet. The procedure is repeated for the second and third casts. Players take off their masks. The teacher enters the results (total number of fish caught,
number of fish remaining) and the number of fish in the pond at the beginning of the next round.
Players write down their points.
A test round may be played (use first line to write down results).
Go through the three casts of each round at a steady pace, so that the players cannot guess how many fish have been caught.
2.2 Introduce penalties
After each round, players may anonymously give penalty points to punish those who caught three fish in that round (overuse).
Players wishing to give penalty points raise their hands. Points cannot be given for free, however. Anyone wishing to award a penalty point has to give up one of their own points.
The number of penalty points received by the players who caught three fish corresponds to the number of players giving penalty points minus one. However, no more than three penalty points may be given. These points are then deducted from the score.
The penalty option may be introduced after two to three rounds or at the beginning of a new game. The slides explaining the rules may be used again at this point.
The calculation of penalty points can be explained as follows: a certain effort is involved in punishing overuse; in order for the penalty to be effective, therefore, at least two players have to participate.
In small groups (fewer than ten players), the penalty points may be calculated without the deduction of one point, and in big groups (more than twenty players), two points instead of one may be deducted.
2.3 Play rounds with penalties
Players put on their masks. Play first three casts as before. Introduce penalties: players wishing to give penalty points raise
their hands. The teacher enters the number of caught fish on the check sheet. Players take off their masks. The teacher enters the results (total number of fish caught,
penalty points given/received) and the number of fish in the pond at the beginning of the next round.
Players write down their points, deducting one point if they gave a penalty point or one to several penalty points if they themselves were penalised for having caught three fish.
To increase the suspense when announcing the results to the class, keep the slide covered and reveal the results gradually, moving from left to right. (How many players gave penalty points? How many players received points? And so on.)
2 | 3

COMMON POOL RESOURCES
March 2010 www.iconomix.ch
Fishpond explained
2.4 Call a conference
A further option would be to call a class conference after a few rounds. Players get to discuss how they want to proceed. Any resolutions made may change the players’ behaviour, but will not affect the laws of nature.
Depending on the level of the class, the teacher could have the players themselves organise the conference, intervening only if inadmissible resolutions are made or if certain resolutions could disrupt the game.
The teacher ends the conference after three minutes and starts the next round. The players receive no help in implementing the resolutions nor are they told if someone does not observe them. If necessary, the teacher can call another conference.
Permissible resolutions include all those concerning the players’ (non-binding) behaviour, such as agreeing that all players may take no more than two fish. Improvements to conditions (such as a recovery of the fish population or an adjustment to the cost of awarding penalty points) are not permissible. In case of doubt, the teacher decides whether or not a resolution is permissible.
Decision-making is not easy and implementation can often raise tricky questions. This is also the case in reality at international conferences.
2.5 End of game
The game ends after ten rounds or as soon as the pond is empty (depletion of resource).
If the pond is depleted (which is normally the case), the fish remaining at the end of the previous round are divided among the players as follows: all players who caught a fish in the first cast are each given a fish. If there are fish left over, those who caught a fish in the second cast are given their second fish. This is continued until there are no fish left to allocate.
Example: 15 fish were in the pond; 12 players caught a fish in the first cast, 5 caught a fish in the second cast, and 2 caught a fish in the third cast. First, the 12 players who caught a fish in the first cast are each given a fish. Subsequently, there are 3 fish left in the pond. All 5 players who caught a second fish are given a fish (the number of fish is rounded up to correspond to the number of players). After that, the pond is empty. Nobody receives a third fish.
As an exception, the game may be ended before the ten rounds have been completed, even if the pond has not been depleted (e.g. if a learning effect is visible at an earlier stage).
2.6 Record individual results and marks
Place slide with the scoring system on projector. Players make a note of their marks. Prizes may be awarded to top scorers (optional).
If possible, maintain anonymity also at this stage. Do not ask the players to call out their results.
2.7 Record performance of class as a whole
The teacher calculates the total number of fish caught and the averages (per player, per player and round) and enters them on the check sheet.
The average calculated per player and round is compared with the most sustainable solution, in which all players could have caught two fish per round, i.e. twenty fish.
To calculate the average per player and round, the points are divided by ten, even if the pond was empty before the ten rounds had been completed. (It is possible to play ten rounds if players do not catch more than two fish per round.)
A collective result does not take the penalties (penalty points given and received) into account and cannot be compared directly with individual results.
3 | 3

COMMON POOL RESOURCES
March 2010
Common pool resources
What does the economic term ‘common pool resource’ really
mean? What exactly is a ‘common pool’? The following
example should help shed some light on the origins of the
term.
Imagine a small, rural community. The community owns
a large expanse of common land (also referred to as
commonage or commons), which all the local farmers
are entitled to use as pasture land for their cattle. Having
the cows graze on common pasture offers a number of
advantages over doing so on a private piece of land. For one
thing, fewer herdsmen are needed to watch the livestock.
This free access becomes problematic if the farmers start
putting more and more cows onto the pasture land. Each
additional cow takes its toll on the pasture’s resources. After
all, a pasture can only produce so much grass. Overuse will
eventually lead to overgrazing and the degradation of the
pasture. For the moment, however, it is in each farmer’s best
interest to put as many cows as possible onto the common
pasture land. The farmer receives all of the benefits (in the
form of meat and milk), while the damage to the commonage
is shared by the entire group of farmers (overgrazed and
damaged pasture land).1
The fact that commonage is at risk of being irreparably
damaged was recognised very early on. As a result, many
communities came up with elaborate systems of rules which
restricted access to the common land and penalised any
violation with a hefty fine. Thus, the presence of common
land did not necessarily lead to its overexploitation. Other
communities decided to parcel out the land and sell it
among the farming community, thereby transferring the
responsibility for the sustainable management of land to the
individual farmers.
The economic term ‘common pool resource’ represents
a commodity which has the two characteristics typical
of common land. First, access to the resource is open to
everyone, or rather, no one can be excluded from using
it. Second, there is rivalry in consumption between the
different users of the resource. All this means is that
the resource’s availability is not unlimited. The result is
what is known as the tragedy of the commons: given the
scarcity of the resource, it would be in everyone’s best
interest to exercise some restraint when using the common
pool resource. On an individual level, however, there is
a tendency to try and use as much of the resource as
possible. Because for every additional unit consumed, the
personal benefits increase. However, the costs incurred
are not borne completely by the initiator, but are instead
shared among all users. In economics, this is referred to as
a negative externality. If nothing is undertaken to stop this
behaviour, chances are the result will be overexploitation
and, in severe cases, complete depletion of the resource.
Typical examples of common pool resources include fishing
grounds, drinking water, forests, public traffic routes,
shared laundries in apartment blocks and even common
rooms in youth clubs.
Common pool resources should not be confused with
public goods. Although public goods are also accessible to
everyone, they can be used simultaneously by any number
of people (non-rivalry). Thus, in the case of public goods,
there is no danger of overuse, but rather an undersupply.
The reason for this being that as long as everyone else
makes a contribution to the provision of the public good, it
makes little sense – from a selfish perspective – to make a
personal contribution. This socially unacceptable behaviour
is referred to as free riding. A classic example of a public
good is national defence. Every citizen benefits from their
country’s national defence, regardless of how many other
citizens also benefit. Consequently, only very few are
prepared to voluntarily pay for this protection or do military
service. Solutions to this problem include making military
service obligatory and imposing taxes so as to help finance
the country’s system of national defence.
Most goods, however, are neither common pool resources
nor public goods, but rather private goods. These are
characterised by the fact that other consumers can be
excluded from using them. In addition – as is also the
case with common pool resources – rivalry exists in
their consumption. Because private goods generally
cost something, however, the problem of overuse is
systematically avoided.
Three ways to combat overuse: Privatise: The common pool resource is turned into a
private good. The property rights are redefined, which in
turn makes them easier to enforce. This allows private
owners to exclude everyone else from using the good or
to request appropriate remuneration.
Restrict access: One way to do this is for the government
to introduce rules or bans governing access to the common
Knowledge sheet
1 | 2

COMMON POOL RESOURCES
March 2010
SUMMARYSUMMARY
pool resource. While the good essentially remains a
common pool resource, access is no longer free. Examples
of this include fishing quotas and bans on hunting wild
animals.
Increase the price: The cost of using the common pool
resource is raised to such a point that each consumer
bears the costs they themselves incur. The state could,
for instance, introduce incentive taxes on CO2 emissions
in an effort to slow global warming. In economics, this
approach is referred to as the internalisation of negative
externalities.
Which of these solutions to the tragedy of the commons is
most appropriate depends on the individual situation. It is
worth noting, however, that all three of them incur costs
which should not be underestimated. Take rainforests
for instance – access can only be prevented by investing
in expensive surveillance systems. In addition, specific
proposals have to be formulated and political majorities
drummed up. This is no small feat, particularly on an
international level. Binding agreements in climate policy,
for example, are very difficult to attain. This is because
of the vast number of people affected and the fact that
interests are so diverse. If negotiation costs are low,
however, then private solutions could also be considered.
In small groups in particular, certain types of expected
behaviour (social norms) can be enforced through the
use of sanctions. For instance, a flatmate in shared
accommodation who never helps with the cleaning can be
put under pressure by the other flatmates to contribute.
1 Because the overuse of the commonage seems virtually unavoidable,
this phenomenon also gets referred to as the tragedy of the commons.
The term first appeared in an influential article by Garrett Hardin, in
which the example of common pasture land is used to describe the
aforementioned mechanisms and incentives. The article – entitled
‘The tragedy of the commons’ – was first published in 1968.
A common pool resource, in the economic sense, has two main characteristics:
Nobody can be excluded from consuming the good (non-exclusion). Those who use or consume the good reduce the benefit for other users (rivalry).
Generally, we distinguish between the following economic types of goods:
If the costs incurred by an action are not borne completely by the initiator, the result is referred to as a negative
externality.
The incentives that exist in connection with all common pool resources (and with all activities that generate negative externalities) often lead to an overuse of a good from the vantage point of the community. This phenomenon is referred to as the tragedy of the commons and is an example of market failure.
Ways of solving this include the introduction of private ownership rights (privatisation), government intervention by
means of bans, rules, incentive taxes or fees, as well as privately negotiated solutions and (in small groups) effective
social norms.
Knowledge sheet
Rivalrous Non-rivalrous
Excludable Private goods Club goods
Non-excludable Common pool resources Public goods
2 | 2

COMMON POOL RESOURCES
March 2010
1. Two neighbouring cities, A and B, are connected by just one public road. The road is toll free and no restrictions govern its use. Owing to the ever-growing volume of traffic, the road is frequently congested and delays can be lengthy. Most of the people using the road are from the two cities.
a. What makes this road a common pool resource?
b. One possible solution would be to expand the road from two lanes to four (two lanes in each direction). Would this solve
the problem permanently?
c. Another solution would be to restrict the number of times a vehicle can use the road each week to a maximum of four
trips in each direction, with the police ensuring that this is observed. Does this solution make economic sense?
2. Working in pairs or small groups, come up with possible solutions for a specific example of a tragedy of the commons. (Examples: overfishing in public waters, excessive emissions of CO2 where atmospheric absorption is limited, dirty
rehearsal room owing to constant use by several bands, pilferage of food from fridge by several family members.)
Summarise and explain your preferred solution.
Worksheet 2
1 | 1

COMMON POOL RESOURCES
March 2010
Advanced question
1 | 1
Why are some wild animals such as whales and tigers endangered, but domestic animals such as chickens, sheep and cows are not? Explain your answer using economic argumentation.Answer this question in a few sentences.

COMMON POOL RESOURCES
March 2010
1. Two neighbouring cities, A and B, are connected by just one public road. The road is toll free and no restrictions govern its use. Owing to the ever-growing volume of traffic, the road is frequently congested and delays can be lengthy. Most of the people using the road are from the two cities.
a. What makes this road a common pool resource?
No one is excluded from using the road (although this would be technically possible in this particular case) and, owing to the high volume of traffic, a certain rivalry exists among users.
b. One possible solution would be to expand the road from two lanes to four (two lanes in each direction). Would this solve
the problem permanently?
This would relieve the traffic congestion problem in the short term. However, despite the increased capacity, rivalry in the use of the road may return. This is likely to be the case if the number of road users grows owing to the increased capacity.
c. Another solution would be to restrict the number of times a vehicle can use the road each week to a maximum of four
trips in each direction, with the police ensuring that this is observed. Does this solution make economic sense?
No. Not all road users are equally dependent on the road. Some motorists may have to use the road daily, while others may not have to use it at all. This factor needs to be taken into consideration in order for the solution to make economic sense. For instance, those who appreciate the service (and are willing to pay for it), should be able to use the road more often than others, and also pay more to do so.
2. Working in pairs or small groups, come up with possible solutions for a specific example of a tragedy of the commons. (Examples: overfishing in public waters, excessive emissions of CO2 where atmospheric absorption is limited, dirty
rehearsal room owing to constant use by several bands, pilferage of food from fridge by several family members.)
Summarise and explain your preferred solution.
Individual answers. For suggestions, see the slide on possible solutions.
Worksheet 2
1 | 1

COMMON POOL RESOURCES
March 2010
Advanced question
1 | 1
Why are some wild animals such as whales and tigers endangered, but domestic animals such as chickens, sheep and cows are not? Explain your answer using economic argumentation.Answer this question in a few sentences.
0 point: No answer or incorrect answer.
1 point: Answer that touches on the tragedy of the commons phenomenon (some wild animals are overhunted or their habitat is destroyed).
2 points: Answer that addresses the heart of the issue, using property rights as an argument. Unlike farm animals, wild animals are not subject to private property rights, with the result that certain animals are overhunted and the people responsible for this have no incentive to preserve the species. If property rights were defined for wild animals and if they were enforceable, there would be an incentive for the owners to prevent their animals from dying out (as is the case for farm animals, such as chickens).

COMMON POOL RESOURCES August 2011
Fishpond in brief
You go fishing in a pond.
You fish alone and anonymously (wearing a mask) over several rounds.
The game ends either when all the fish are caught or at the end of the tenth round.
Number of fish at the beginning of the game: number of players x 4.
The number of fish that can be caught in any one round ranges from zero to three per person.
Your aim is to catch as many fish as possible (see scoring system).
Please note: Although the fish population recovers between rounds, it does so only to a limited extent.
COMMON POOL RESOURCES August 2011
Fishpond by round
Players put on their masks before a round begins. Talking is not allowed.
Players wishing to catch a FIRST fish should raise their hand when prompted.
Players wishing to catch a SECOND fish should raise their hand when the second cast is called.
Players wishing to catch a THIRD fish should raise their hand when the third cast is called.
Please note: The second cast is only open to those who fished in the first cast, and the third cast is only open to those who fished in the first and second casts. Players who choose not to catch a fish in the first cast can thus not fish in the second or third cast.
Players take off their masks and note down how many fish they caught on their score sheets.
The number of fish remaining in the pond doubles between rounds. The fish population will never exceed what it was at the beginning of the game, however (four fish per player).

COMMON POOL RESOURCES August 2011
Fishpond with penalties
A penalty system can be introduced.
After each round, the players are asked to raise their hand if they wish to penalise overuse.
Penalty points cannot be given for free, however. Anyone wishing to award one has to give up one of their own points.
This means that anyone who caught three fish in that round will be penalised. The number of penalty points they receive corresponds to the number of players giving penalty points minus one.
No more than three penalty points can be given, however. Two examples: 3 players giving penalty points = 2 penalty points; 7 players giving penalty points = 3 penalty points.
Penalty points are awarded anonymously and before the result of the round is announced (masks should therefore only be taken off afterwards).
COMMON POOL RESOURCES August 2011
Check sheet
PENALTY POINTS
* Four fish per player, i.e. the maximum capacity of the pond.** Divided by 10 (rounds), even if the pond is depleted earlier.
NUMBER OFFISH AT BEGINNINGOF ROUND
FIRST FISH
SECONDFISH
THIRD FISH
TOTAL NUMBEROF FISHCAUGHT
NUMBER OFFISH REMAIN-ING AT END OF ROUND
NUMBER OFPL. GIVING PENALTYPOINTS
NUMBER OFPENALTY POINTS RECEIVED PER PL.
TEST –
1 * –
2 –
3 –
4 –
5 –
6 –
7 –
8 –
9 –
10 –
Total
Average per player
Average per player and round**
Number of players (pl.): Mark:

COMMON POOL RESOURCES August 2011
Scoring system
Note for teacher:This table can also be used if the game ends early as a result of the depletion of the resource (if no fish are left before the ten rounds have been played). If the game is cut short due to lack of time and the resource has not yet been depleted, add half a mark for each round not played (a normal game lasts ten rounds). Example: A student with 15 points receives a mark of 4! after 9 rounds or a 5 after 8 rounds.
0–2 3–4 5–6 7–9 10–11 12–14 15–16 17–19 20–21 22–24 25–30
1 1! 2 2! 3 3! 4 4! 5 5! 6
Points and marks
COMMON POOL RESOURCES August 2011
Privatisation Define and guarantee private property rights. This addresses the heart of the issue (no common
pool resource and no negative externalities). However, this approach can be problematic as it is generally almost impossible or too expensive to
put into effect, particularly with regard to the enforcement.
Government measures** Introduce prohibitions and restrictions, and
enforce them through supervision and the use of sanctions. Restrict the incentive to overuse a resource
by introducing fees and incentive taxes.
Avoid overuse Commonage should remain commonage. Private or government solutions should aim to restrict
overuse and negative externalities, however.
Private measures Effect of social norms (expected behaviour in
a group, which may be enforced with the help of sanctions).
Negotiate and monitor voluntary agreements (rules, bans, compensation), and possibly enforce them through the use of sanctions.
* Universally valid in the case of negative externalities.** To expand on this topic, a look at the following solution might be interesting: the creation of markets on which certificates for the use of a particular resource are negotiated (e.g. rights for CO2 emissions).
Solving the tragedy of the commons*

COMMON POOL RESOURCES August 2011
900 000
800 000
700 000
600 000
500 000
400 000
300 000
200 000
100 000
1860 1880 1900 1920 1940 1960 1980 2000
1992
Collapse of Atlantic cod stocks off the east coast of Newfoundland (Canada)
Fish landings in tonnes
Source: World Resources Institute (2005), Millennium Ecosystem Assessment, Washington, DC, www.maweb.org.


![ars.els-cdn.com€¦ · Web view# 8 randomized controlled trial[Publication Type] OR controlled clinical trial[Publication Type] OR clinical trial[Publication Type] OR randomized](https://img.pdfslide.us/doc/110x75/5f801e6decc6443b005dfd1c/arsels-cdncom-web-view-8-randomized-controlled-trialpublication-type-or-controlled.jpg)