Embed Size (px)
Citation preview
Economic Performance of Bt Cotton Varieties in Pakistan
Hina Nazli
Ph.D Candidate,
Department of Food, Agricultural and Resource Economics
University of Guelph, Canada
email: [email protected]
Rakhal Sarker
Associate Professor
Department of Food, Agricultural and Resource Economics
University of Guelph, Canada
Karl Meilke
Professor
Department of Food, Agricultural and Resource Economics
University of Guelph, Canada
David Orden
Senior Research Fellow
International Food Policy Research Institute (IFPRI)
Washington D.C. 20006-1002 USA
Selected Paper prepared for presentation at the Agricultural and Applied Economics
Association’s 2010 AAEA, CAES & WAEA Joint Annual Meeting, Denver, Colorado, July 25-27,
2010.
Copyright 2010 by H. Nazli, R. Sarker, K. Meilke, and D. Orden. All rights reserved. Readers may
make verbatim copies of this document for non-commercial purposes by any means, provided this
copyright notice appears on all such copies.
We thank Dr. Sohail Malik, Innovative Development Strategies, Islamabad, and Dr. Zafar Altaf, Pakistan
Agricultural Research Council (PARC) for their advice and financial support of the field research and Dr Rashid
Amjad, Pakistan Institute of Development Economics for providing sampling frame of the PRHS.
1
Economic Performance of Bt Cotton Varieties in Pakistan
Abstract
Farmers in Pakistan have been growing cotton that contains the first generation of Bt gene since
2002. The cultivation of these varieties, although formally unapproved and unregulated,
increased rapidly after 2005. In 2007, nearly 60 percent of the cotton area was under BT
varieties. This paper examines the economic performance of Bt cotton in Pakistan based on data
collected through a structured questionnaire survey in January-February 2009 in two districts
(Bahawalpur and Mirpur Khas). The extent of the impact of Bt cotton on costs of production and
yield gains are different across the two districts with their diverse agro-climatic conditions and
pest pressures. Seed expenditures increase in both districts, but a decline in the number of
bollworm sprays and hence in the expenditure for pesticides is observed and total pesticide
control costs (for bollworms and non bollworm pests) declines in both districts. Total production
costs decline in Bahawalpur but rise in Mirpur Khas. The yield increases are higher in Mirpur
Khas as well, resulting in total revenue and gross margins improving more than in Bahawalpur.
The results are similar to other studies of Bt cotton in India and suggest gains for Pakistan from
progressing to a regulated national market for Bt cotton technologies.
Key words: Bt cotton, economic performance, Pakistan, Bahawalpur, Mirpur Khas
2
1. Introduction
Cotton production is important to Pakistan‟s agriculture and to the overall economy. Nearly 26
percent of all farmers grow cotton, and over 15 percent of Pakistan‟s total cultivated area is
devoted to this crop, with production concentrated in two provinces: Punjab (80%) and Sindh
(20%) (Government of Pakistan, 2003). Cotton and its intermediate and final products (such as,
yarn, textiles and apparel) contribute significantly to the gross domestic product (8%), total
employment (17%), and foreign exchange earnings (54%) in Pakistan (Government of Pakistan,
2009a; 2009b). Pakistan is the fourth largest producer and the third largest consumer of cotton in
the world. The cotton-textile sectors have important implications for national economic
performance and poverty reduction (Cororaton and Orden, 2008).
Since the early 1990s cotton production in Pakistan, has been facing the challenge of large scale
pest infestation contributing to unexpected fluctuations in cotton yield and significant economic
losses. A wide range of pesticides has been introduced to control various cotton pests during the
last 15 years, which has notably increased the cost of cotton production. Moreover, as the pests‟
developed resistance to these chemicals, their effectiveness declined over time.
Given the economic importance of this crop, cotton research has always received high priority in
Pakistan. The primary objective of cotton research has been to develop new cotton varieties that
are resistant to pests, heat, and drought, and have high yield potentials with desirable fiber
characteristics. Despite various research efforts, Pakistan has been suffering from huge economic
losses due to persistent pest attacks on the cotton crop. Estimated losses vary from 10-15 percent
in a typical year to 30-40 percent in a bad crop year (Salam, 2008).
3
The introduction of genetically modified (GM) cotton offers significant promise for addressing
the issue of crop loss by controlling some of the pest infestation. Pakistan started work on the
development of GM cotton in 1997. Despite various administrative and research efforts1 that are
required to commercialize a GM crop, Pakistan had not commercially adopted Bt cotton by late
2009. This delay has resulted in the unregulated adoption of Bt-type cotton. Estimates show that
about 60 percent of the cotton growing area was under these varieties in 2007; 50 percent in
Punjab and 80 percent in Sindh. Nearly 40 varieties of Bt cotton were under cultivation (PARC,
2008).
A few studies have attempted to make preliminary comparisons of the performance of existing
Bt type varieties with the recommended non-Bt varieties in Pakistan based on semi-structured
questionnaires and informal interviews (Hayee, 2004; Sheikh et al., 2008; Arshad et al., 2009).
These studies observe a relatively poor performance of existing Bt cotton compared to the
recommended conventional varieties. In addition to these studies, the Pakistan Agricultural
Research Council (PARC) conducted a detailed scientific survey on 126 locations in 21 districts
in 2007. This survey examined the presence of Bt content in claimed Bt plants. The laboratory
results indicate that about 10 percent of the sample in Punjab and 19 percent in Sindh were not
positive for the „Cry‟ protein2. However, to the best of our knowledge, existing studies do not
provide an evaluation of the economic performance of unapproved Bt varieties compared to the
conventional varieties in Pakistan. This paper provides an economic analysis to bridge this gap.
1 The Biosafety Rules and Biosafety Guidelines were approved in 2005, the Pakistan Intellectual Property Right
Organization was established in 2005. In addition, successful field trials of domestically developed Bt varieties have
also been conducted (Rao, 2006). 2 The Bt gene produces various proteins. Among them, the crystalline proteins, prefixed with „Cry‟ are harmful for
the larvae of moths and butterflies, beetles and flies and thus act as a natural pesticide.
4
The analysis is based on survey of cotton farmers, conducted during January-February 2009 in
two districts of Pakistan.
Internationally, many studies have analyzed the impact of Bt cotton in developing countries (see
for example, Pray et al., 2001; Huang et al., 2002; for China; Ismael et al., 2002; Thirtle et al.,
2003; for South Africa; Qaim and de Janvry, 2003 for Argentina; Traxler et al., 2003 for
Mexico; and Qaim, 2003; Qaim and Zilberman, 2003; Orphal, 2005; Gandhi and Namboodiri,
2006; for India). Results from these studies suggest that these countries experienced a decline in
pest infestation and enjoyed stable and higher yields and higher profits after the adoption of Bt
cotton.
Despite encouraging performance reported in the studies cited above, the use of Bt cotton
remains highly controversial in many developing countries. We focus on the experiences from
India as those are most relevant for Pakistan. A large number of cotton farmers committed
suicide in India during the period 2002-2006. Some groups argued the introduction of Bt cotton
to be the main reason for these suicides. The farmers had allegedly accumulated debts to buy
expensive Bt cotton seed and the subsequent crop failures3 drove them to destitution. Some
groups blamed Bt cotton as the cause of death of sheep flocks grazing on cotton fields4. Some
activist groups challenged the effectiveness of Bt cotton in terms of higher cost of production
3 Several news items and some studies conducted by the NGOs indicate that the Bt cotton is the main reason of
farmers‟ suicide (Qayum and Sakkhari, 2005), whereas, the in-depth analysis based on the published data and
empirical studies, Gruère et al. (2008) have not found any connection between farmer suicides and Bt cotton. 4 “Mortality in Sheep Flocks after Grazing on Bt Cotton Fields – Warangal District, Andhra Pradesh”. Report of the
Preliminary Assessment April 2006, http://www.gmwatch.org/archive2.asp?arcid=6494
5
and lower yield than the non-Bt varieties (Qayum and Sakkhari, 2005)5. Due to close
geographical proximity and similarities in production and cultural practices, the Indian
experiences created controversies and apprehensions about the Bt cotton adoption in Pakistan6.
The performance of Bt cotton depends on the agro-climatic conditions, genotype of the variety
and cropping practices. A well-performing Bt variety in one area may not produce desired results
if grown in a different agro-climatic zone. Therefore, only approved Bt varieties, which are
tested for the local agro-climatic conditions, are recommended for use. A country has to follow
bio-safety guidelines to approve a Bt variety for commercial use. In Pakistan, the Bt varieties
were developed by various private sector plant breeders through crossing Bt material with local
germ-plasm so that the Bt trait is transferred to locally developed cotton varieties7. These
varieties are distributed without a formal regulatory framework which raises several concerns
about seed quality, awareness among farmers, and the possible impacts on human and animal
health, and biodiversity. Six of these varieties were approved for field trials in 2009 and expected
to be released for commercial use in 2010. The lack of in-depth research about the economic
performance of these Bt varieties relative to conventional varieties, and the Indian reports about
farmers‟ suicide, death of sheep flocks and lower profitability raise apprehensions about the
commercial adoption of Bt cotton in Pakistan. The civil society organizations and NGOs are
holding demonstrations against the commercial adoption of Bt cotton by citing the Indian
examples. Given these circumstances, this paper presents a much needed assessment of the
5 Analysing the findings presented to support these claims and comparing with the results of empirical studies,
Herring (2009) points out that the reports portraying the negative picture of Bt cotton are inconsistent with both
farmers‟ behaviour and scientific studies. 6 For example, in Financial Post, May 12, 2008, Najma Sadeque wrote “After a disastrous track record in 40
countries, Bt cotton is „welcomed‟ in Pakistan”. Actually only 10 countries adopted Bt cotton commercially by the
end of 2008. 7 Most of these Bt varieties contain the Cry1Ac gene, developed from Monsanto‟s transforming event MON531
(commonly known as Bollgard).
6
performance of unapproved Bt cotton varieties some of which have already been approved for
field trials in 2010. This paper is divided in four sections. Section 2 describes the data collection
methodology. The analysis of the economic performance of Bt cotton in Pakistan is presented in
Section 3. Section 4 focuses on policy implications of the results and concludes the paper.
2. Data and Methods
To examine the economic impact of the adoption of unapproved Bt varieties on costs of
production and yields, a questionnaire-based survey “Bt Cotton Survey 2009” was conducted
during January-February 2009 in two cotton growing districts of Pakistan: Bahawalpur in
province Punjab; and Mirpur Khas in province Sindh8. The selected sample is drawn from the
existing sampling frame of the panel survey, the Pakistan Rural Household Survey (PRHS)9. Out
of four cotton districts in the PRHS, Bt Cotton Survey 2009 was conducted in two districts where
the number of cotton growers was sufficient in the sample. This survey covered 8 villages and
104 cotton growers in each district. This gives a total sample of 208 cotton growers in 16 villages
of two districts. In each village 13 cotton growers were surveyed.
The cotton growing areas of Pakistan can be divided into six zones on the basis of rainfall and
temperature. Because of weather differences, the pressure of pests is different in these zones
(Soomro and Khaliq, 1996). The selected districts have different agro-climatic conditions in
terms of rainfall, minimum and maximum temperature, and humidity. Because of these
differences, the pest pressure on the cotton crop is also different. Low temperature and high
8 The national statistics indicate that Bahawalpur produces 11 percent of Punjab‟s cotton and Mirpur Khas accounts
for 11 percent of cotton produced in Sindh (Government of Pakistan, 2006). The Bt Cotton Survey 2009 received
financial supported from Innovative Development Strategies, Islamabad and the Institute for Society, Culture and
Environment, Virginia Tech, Alexandria, Virginia. PARC provided essential in-kind support for the field research. 9 This survey was conducted jointly by the World Bank and Pakistan Institute of Development Economics (PIDE).
7
relative humidity cause an increase in the bollworm population and decline in the population of
sucking pests. Bahawalpur has hot and dry climate and Mirpur Khas has hot and humid climatic
conditions. Average rainfall is low in both districts. Approximately two-thirds of the Bahawalpur
district is covered by desert. The quality of soil is mostly sandy in Bahawalpur and clay in
Mirpur Khas. Canals are the main source of irrigation in both districts. The selected districts may
not represent all cotton growing areas of Pakistan. However, an attempt is made to capture the
diversity of cotton growing areas in terms of pest pressure through the selection of these districts.
The questionnaire was designed to collect relevant information on individual (age, education),
household (household size, number of dependents), and farm (size of farm, type of tenure)
characteristics. In addition, data on cost of inputs, cotton output, and revenue from cotton sale
were collected. The sample was comprised of Bt adopters as well non-adopters. A comparative
analysis of the economic performance of Bt and non-Bt cotton in Pakistan is developed from this
data set.
3. Results
The data indicates that the majority of farmers are small. Nearly 81.6 percent of the surveyed
farmers operate less than 12.5 acres of land. Most of them are concentrated in the category less
than 5 acres in both districts. These districts differ in the type of land tenure. A majority of owner
farmers is concentrated in Bahawalpur (77.9%) and most of the sharecroppers are in Mirpur
Khas (73.1%). The land distribution in Pakistan, particularly in Sindh, is highly skewed. As a
result, a large number of landless households and small owners are tied into sharecropping
arrangements (World Bank, 2002). Such arrangements are based on the prior understanding
8
between the owner and the tenant about inputs and output. A majority of the sharecroppers in the
present survey indicate that the landlord provides 50 percent of the inputs except labour and the
sharecropper is responsible for 50 percent of the inputs and their timely use. Output is divided on
50-50 basis. Most of the surveyed farm families have been growing cotton for generations.
The adoption of Bt cotton increased rapidly during 2006-2008 in both districts. In 2006, the
adoption rate in Bahawalpur was higher (36%) than Mirpur Khas (32%). However, in 2008,
about 87 percent of the farmers in Mirpur Khas cultivated Bt cotton whereas this proportion was
74 percent Bahawalpur.
The Bt Cotton Survey 2009 asked some qualitative questions about the performance of Bt cotton.
A large number of sampled farmers indicate that because of higher price of seed and higher use
of fertilizer and water, the cost of production is higher for Bt varieties relative to non-Bt
varieties. However, the decline in the intensity of bollworms increased the yield and they are
able to earn larger profits. The level of awareness about Bt technology and its use is extremely
low in both districts. Most of the farmers in both districts do not know the name of seed variety
or the seed company. Most of the farmers do not have any knowledge about the importance of
seed quality and the refuge area10
. To examine the performance of Bt and non-Bt cotton, this
section compares the differences in cost of production, yield and gross margin for both varieties.
To evaluate the significance of the differences in the mean values of these variables, two-group
mean-comparison tests are performed.
10
Farmers are encouraged to plant a certain fraction of their cotton area with conventional varieties or with some
other crop. This area is called refuge area. On these non-Bt refuges, Bt-susceptible insects remain unharmed, so they
can mate with the resistant insects that survive on the nearby Bt plot and produce non-resistant insects. The refuge
area is especially important in the regions where most of the cultivated area is covered by one crop.
9
3.1 Impact on pesticide, seed and other expenditures
Pesticide expenditure
Farmers adopt Bt cotton because of its resistance against pests. About 92.9 percent of the
respondents who are not using Bt cotton reported the infestation of bollworms. Among them,
58.9 percent indicate the high intensity of this infestation. Nearly 35.9 percent of Bt adopters also
report the infestation of bollworms. However, the infestation intensity was moderate to low. A
majority of farmers report the attack of cotton leave curl virus (CLCV) and mealy bug
irrespective of the variety they used. As mentioned earlier that the laboratory tests of the samples
of Bt cotton grown in Pakistan indicates the presence of Cry 1Ab/Ac in most of the samples.
However, the intensity varies from low to high, indicating the possibility of seed mixing (PARC,
2008). In the Bt Cotton Survey 2009, the possibility of spurious seed, as identified by the key
informants, cannot be ruled out as one of the reasons why in 35.9 percent of the cases, the Bt
variety is not effective for bollworms.
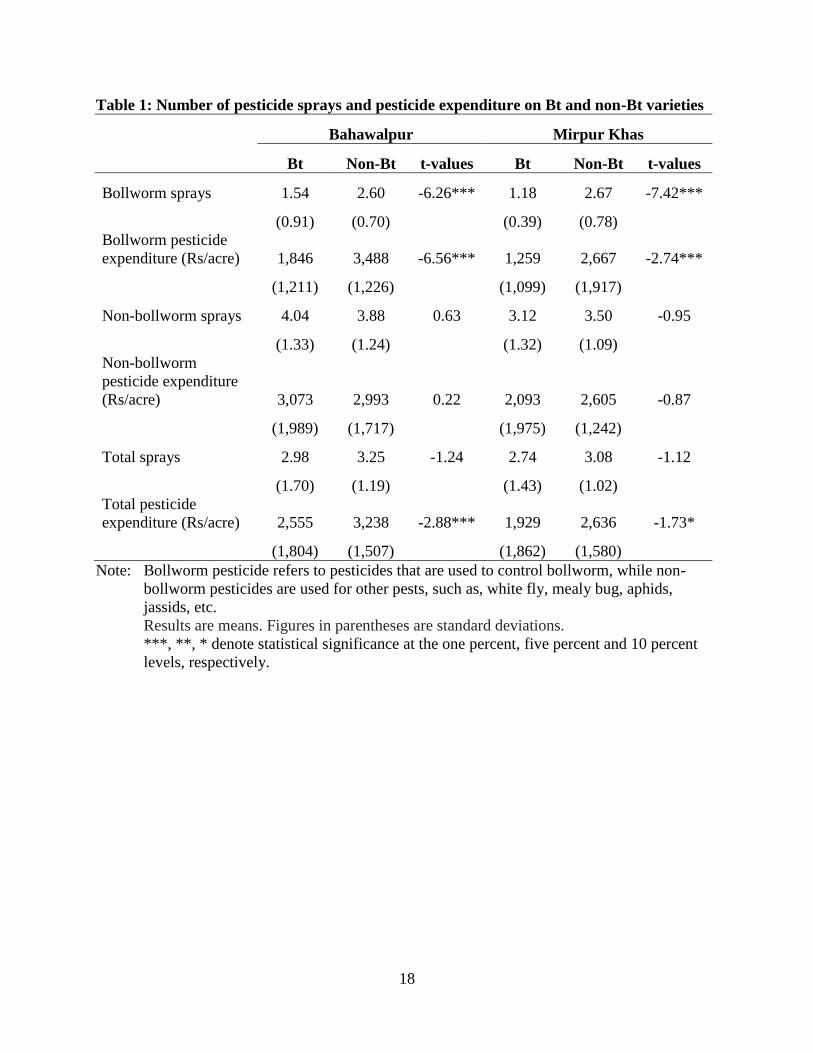
Table 1 reports the means and standard deviations of the number of pesticide sprays and
pesticide expenditure per acre by pest groups on Bt and non-Bt cotton in Bahawalpur and Mirpur
Khas. Pests are divided in two groups: bollworms, includes spotted, pink, American and
armyworm; and non-bollworms, includes all other pests, such as, white fly, mealy bug, aphids,
jassids and others. This table shows a significant difference in the number of sprays on
bollworms in both districts. In Bahawalpur, farmers spray 1.5 times on Bt varieties against 2.6
times on non-Bt varieties. This number is 1.18 and 2.67 for Bt and non-Bt varieties in Mirpur
Khas. As a result, the bollworm pesticide expenditure for Bt varieties is significantly lower for
Bt varieties as compared to non-Bt varieties in both districts. No significant difference in the
10
number of sprays or non-bollworm pesticide expenditure has been found in both districts.
Because of the much lower expenditure on bollworms, total pesticide expenditure appeared
significantly lower on Bt varieties (2,555 Rs/acre in Bahawalpur and 1,929 Rs/acre in Mirpur
Khas) than on non-Bt varieties (3,238 Rs/acre in Bahawalpur and 2,636 Rs/acre in Mirpur Khas).
However, the difference in the total number of sprays is statistically insignificant in both
districts. The quantity of pesticide used per spray can reflect a better picture of the expenditure
on pesticide. This survey, however, has not collected this information.
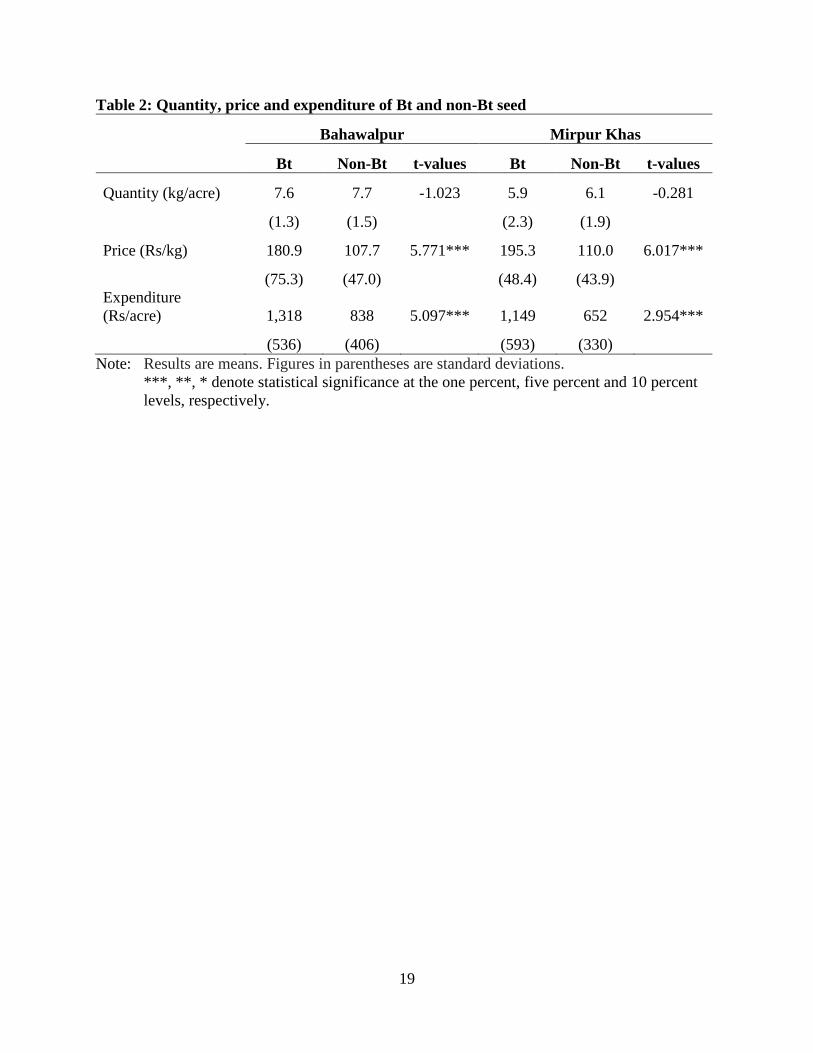
Seed usage and expenditure
The conventional varieties of cotton require 8 to 10 kg of cotton seed per acre. This requirement
is lower for Bt seed11
. However, our survey data shows that the quantity of seed used is not
significantly different for both varieties. This may be due to the fact that most of the farmers are
receiving seed without proper instructions. The survey results reported in Table 2 show that in
Mirpur Khas, farmers, in general, use a lower amount of seed (5.9 kg/acre of Bt and 6.1 kg/acre
of non-Bt), whereas in Bahawalpur, this amount is close to the recommended amount of
conventional varieties (7.6 kg/acre for Bt and 7.7 kg/acre for non-Bt). Low values of standard
deviation indicate little variation in the use of seed in both districts. The survey finds that Bt seed
is more expensive than the non-Bt seed. In Bahawalpur, the reported average price of Bt seed
was Rs 180.9/kg, that is significantly higher than the price of non-Bt seed (Rs 107.7/kg). This
price difference is higher in Mirpur Khas (Rs 195.3s/kg for Bt and Rs 110/kg for non-Bt). Both
types of seeds are expensive in Mirpur Khas as compared to Bahawalpur (see Table 2). The
difference in price is reflected in the expenditure on seed. Because of the lower use of seed in
Mirpur Khas, the seed expenditure in this district is less than the expenditure in Bahawalpur.
11
For example, the seed requirement for a recently approved (not commercialized) variety, AS-803 is 5-7 kg/acre.
11
However, the expenditure on Bt seed in both districts is significantly higher than that on the
conventional varieties. As stated earlier the results of Bt Cotton Survey 2009 may not be
comparable across districts, but within districts, they show a consistent pattern.
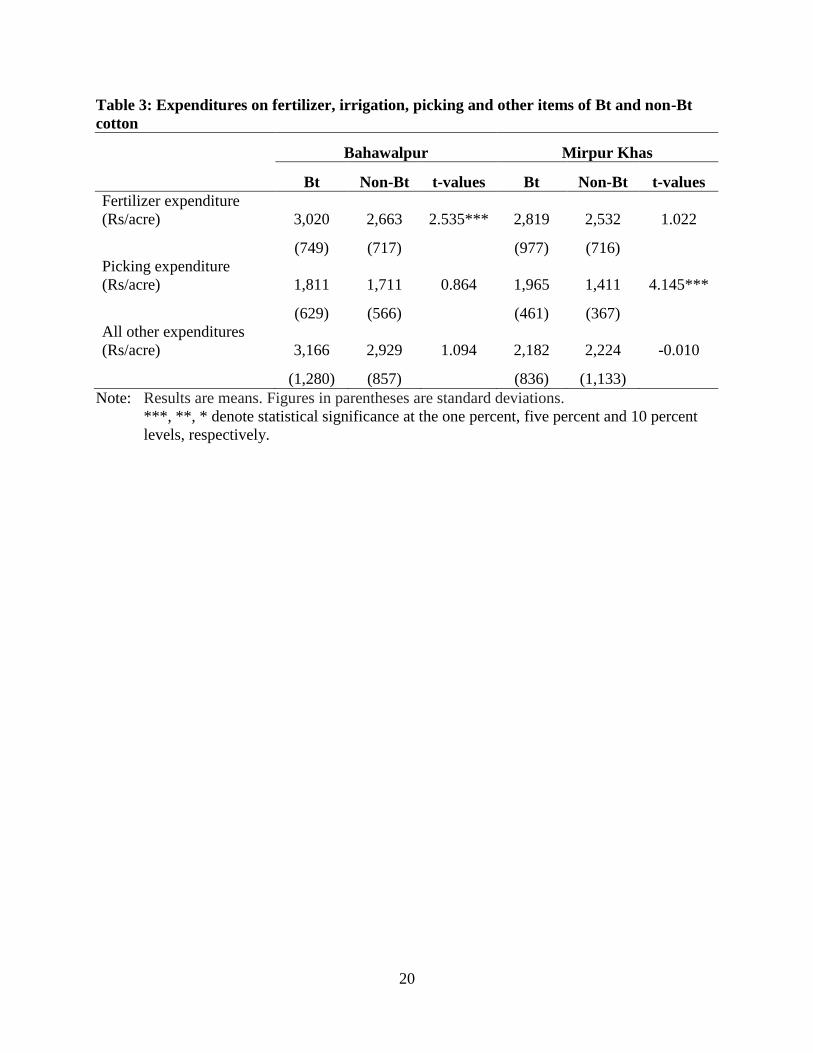
Other expenditures
Table 3 provides the comparative information on the expenditure on fertilizer, cotton picking and
other items, such as, land preparation, sowing, irrigation and other labour charges of Bt and Non-
Bt cotton across both districts. The table indicates that the expenditure on fertilizer and cotton
picking is higher for Bt varieties in both districts. This difference is significant for fertilizer in
Bahawalpur and for cotton picking in Mirpur Khas. Farmers in Bahawalpur spent 358 Rs/acre
more on fertilizer for Bt varieties.
The flowering of the cotton plant generally starts one and half month after its planting. Blooming
continues regularly for several weeks. It takes about two months between the blooming of the
flower and the first opening of bolls. Cotton picking starts with the opening of bolls. The
planting period of cotton in Pakistan is from April to June. Picking starts in August and
continues until December. In Pakistan, cotton is picked manually; mostly by women and
children. Cotton pickers are hired and payments are generally made in kind. Pickers are usually
paid 1/16th
share of the harvest, i.e., 2.5 kg per 40 kg of the harvest. Some of the farmers make
cash payment that is equivalent to the share of harvest mentioned above.
In the Bt Cotton Survey 2009, a majority of the farmers in Mirpur Khas planted cotton in April
and picking started in early August. In Bahawalpur cotton was sown in May and picking started
12
by September. The number of pickings differs between the districts. Cotton was picked two to
three times in Bahawalpur and three to five times in Mirpur Khas. This survey collected
information on the price of cotton received after the sale of each picking. To compute the picking
expenditure, the average price of all pickings is used to calculate the value of 1/16th
share of total
harvest. The surveyed farmers indicated more bolls per plant for Bt varieties than non-Bt
varieties. This is reflected in the higher expenditure on the picking of Bt cotton than non-Bt
cotton. The difference in picking expenditure is statistically insignificant in Bahawalpur and
significantly higher in Mirpur Khas12
. All other expenditures include expenditure on land
preparation, sowing, irrigation, labour cost for different operations, etc. No significant difference
across Bt and non-Bt varieties in both districts has been observed for these expenditures.
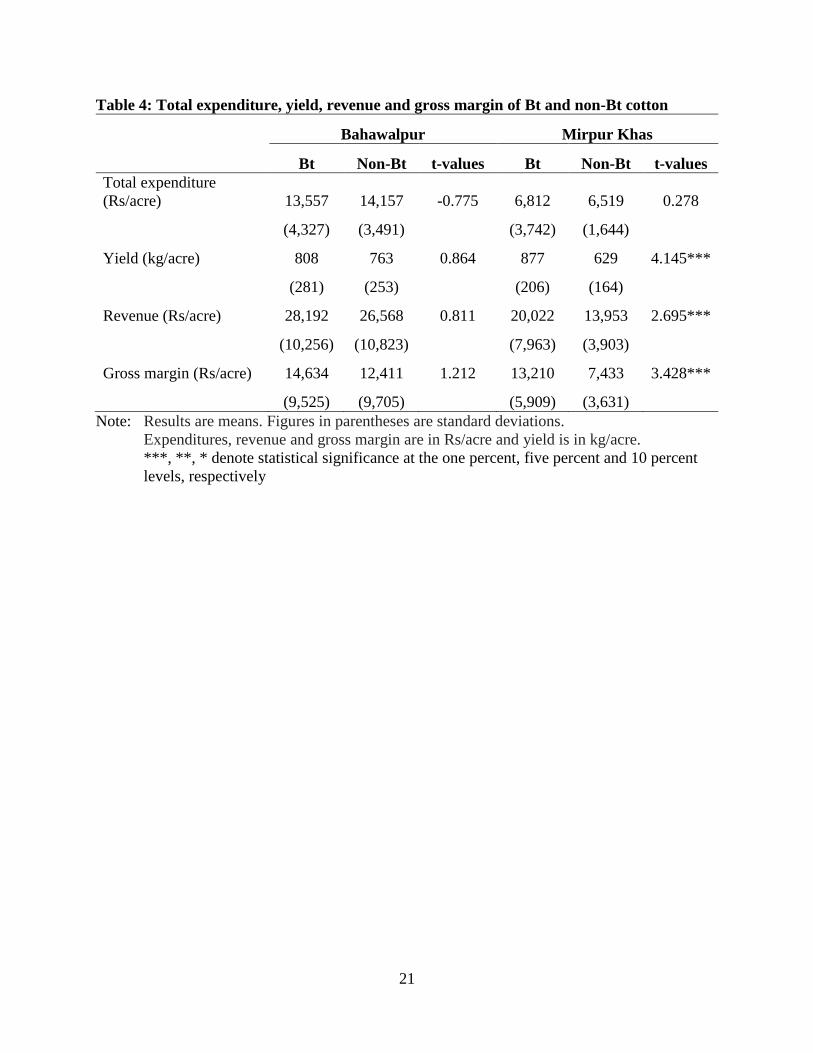
3.2 Impact on total expenditure, yield, revenue and gross margin
The comparison of per acre total expenditure, yield, revenue and gross margin is reported in
Table 4. The revenue is computed by using the quantity sold and the price prevailing at the time
of sale as reported by the farmer. The sample includes a large number of sharecroppers who
share the harvest and input expenditure with the landlord on a 50-50 basis. Total expenditure and
revenue for this group is calculated on the basis of their shares of production costs and output
revenue. Table 4 reports the expenditure and revenue adjusted for the sharecroppers. Gross
margin is the difference between adjusted revenue and adjusted total expenditure. Table 4 shows
that the expenditure on Bt and non-Bt cotton are not statistically significant. However, these
differences are statistically significant between districts (not shown in Table 4).
12
Since expenditure on cotton picking is paid as a fraction of yield. Higher the yield, higher will be the 1/16th
share
that will be paid as picking expenditure.
13
This table shows that total expenditure, yield per acre, revenue and gross margins are
significantly higher for Bt varieties in Mirpur Khas whereas in Bahawalpur no significant
difference has been observed. The Bt Cotton Survey 2009 has not found any difference in the
price of Bt and non-Bt cotton. However, the higher yield of Bt cotton gave higher revenue in
both districts. Resultantly, Bt varieties appeared more profitable.
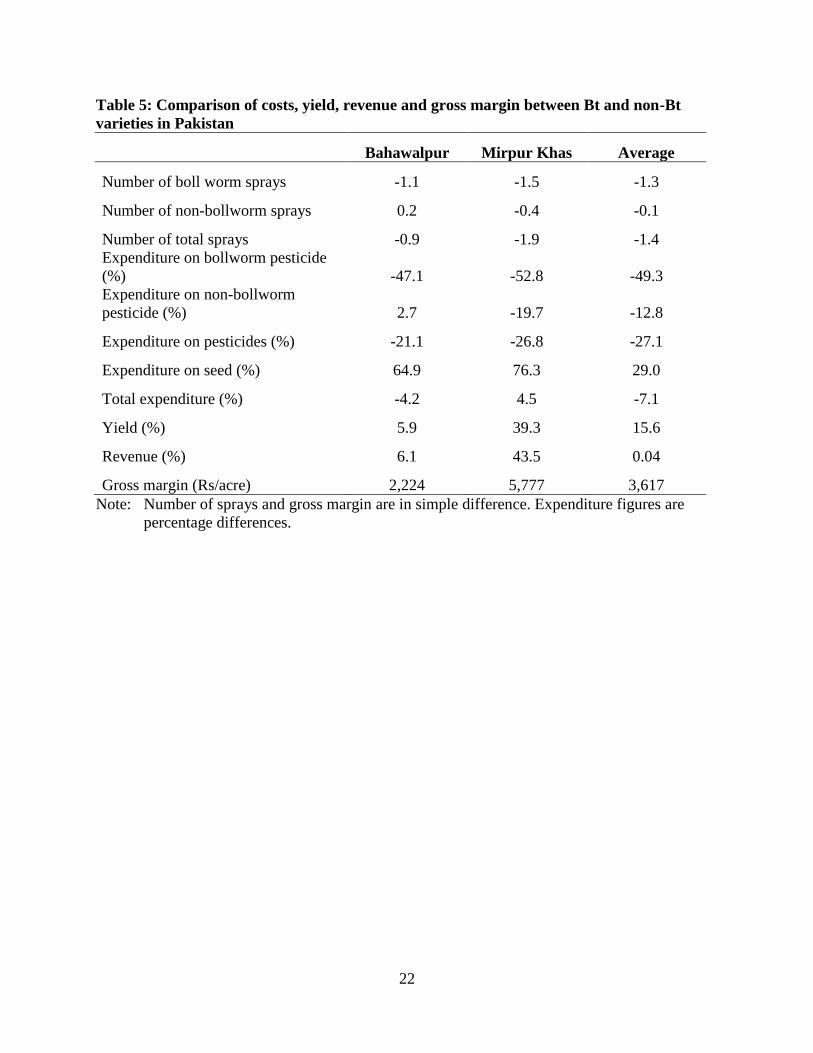
3.3 Performance of Bt versus non-Bt cotton
Table 5 summarizes the results of tables 1 to 4. These results show a relatively better
performance of the existing unapproved varieties of Bt cotton that contain the first generation of
the Bt gene. The number of bollworm sprays declined by 1.2 on average; 1.1 in Bahawalpur and
1.5 in Mirpur Khas. Because of the higher number of sprays for non-bollworms, total number of
sprays decline by 0.3 only. The total pesticide expenditure declined by 21.1 percent in
Bahawalpur, and 26.8 percent in Mirpur Khas. This decline is mainly driven by a substantial
decline in the expenditure on bollworms sprays. This indicates the effectiveness of existing Bt
varieties in controlling the bollworms. This result is comparable with Bennet et al. (2006a) who
found a similar decline in Maharashtra, India. The results show that Mirpur Khas experienced a
much higher increase in yield per acre from Bt varieties as compared to non-Bt varieties (39.3%)
than Bahawalpur (5.9%). Table 4 indicates that the yield increase in Bahawalpur is not
statistically significant. Sheikh et al. (2008) also found no significant difference in the yield of Bt
and non-Bt varieties in Punjab. Despite higher expenditure on seed, fertilizer and cotton picking,
the total expenditure on Bt varieties was 5.3 percent lower than non-Bt varieties in Bahawalpur.
Whereas in Mirpur Khas, Bt varieties incur higher expenditure. A higher yield and the same
14
price for both varieties resulted in a higher gross margin that is Rs 2,224/acre higher in
Bahawalpur and Rs 5,777/acre higher in Mirpur Khas.
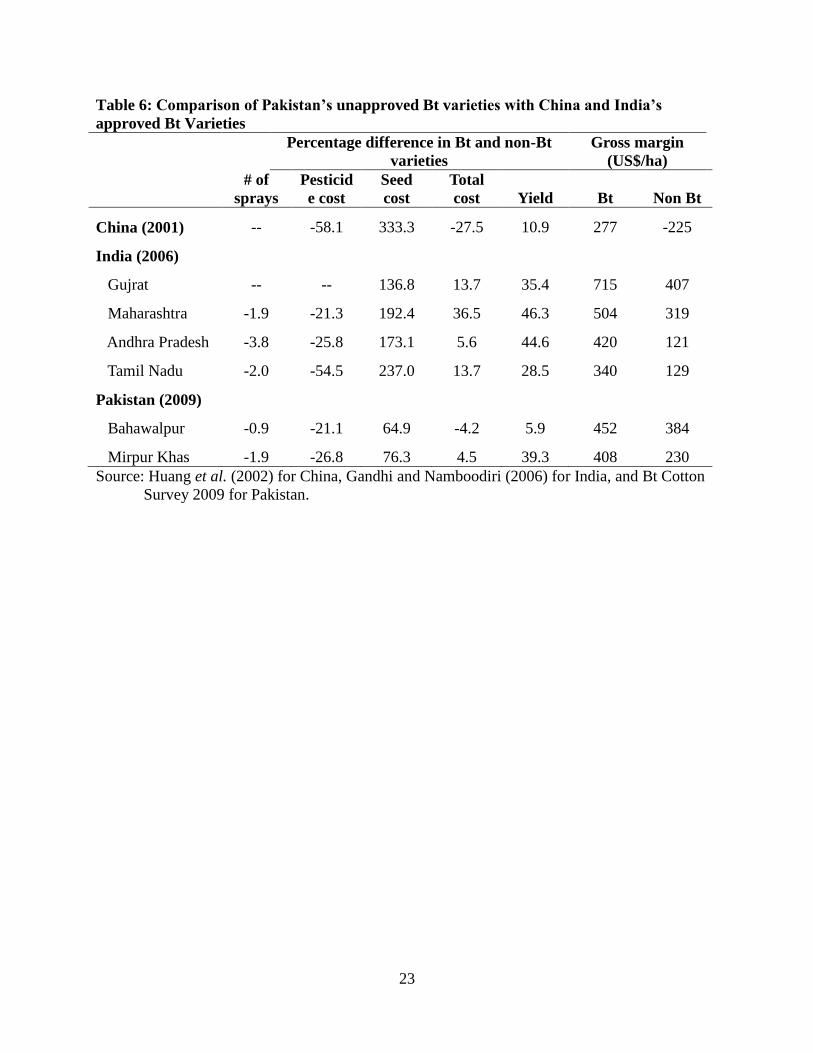
It is useful to compare the results for Pakistan with other countries. Table 6 provides a
comparison of the performance of unapproved Bt varieties in Pakistan with the performance of
approved Bt varieties in India and China. This table shows that the difference in pesticide
expenditure, yield and gross margins in Pakistan is comparable with both these countries. Like
Pakistan, India also exhibits regional differences in the performance of Bt cotton. However, the
difference in seed price of Bt and non-Bt varieties is much lower in Pakistan as compared to
India and China. This may be attributed to the difference in approved and unapproved varieties.
4. Conclusions
This paper examines the performance of unapproved Bt varieties in Pakistan. The analysis is
based on the data collected through structured questionnaires in January-February 2009 in two
cotton growing districts of Pakistan; Bahawalpur and Mirpur Khas. This survey covers 208
cotton growers in sixteen villages in these districts. The agro-climatic conditions of these
districts are different; Mirpur Khas is hot and humid and Bahawalpur is hot and dry. This survey
finds high adoption of available Bt varieties in both districts. A majority of surveyed farmers,
both sharecroppers and owner operators, are using this technology.
Contrary to the findings of earlier studies (Hayee, 2004; Sheikh et al., 2008; Arshad et al., 2009),
the results of this study show a relatively better performance of the existing unapproved varieties
of Bt cotton that contain the first generation of Bt gene compared to conventional (non Bt)
15
varieties. A decline in the number of bollworm sprays hence in the expenditure of pesticides has
been observed. Both districts experienced a decline in pesticide expenditure and an increase in
expenditure on seed, fertilizer, and picking. An increase in yield is observed in both districts that
resulted in a higher gross margin for Bt varieties. The extent of the impact of Bt cotton on cost of
production and yield are different across districts. For example, the number of non-bollworm
sprays increased in Bahawalpur whereas it declined in Mirpur Khas. Total expenditures declined
in Bahawalpur by 5.3 percent and increased in Mirpur Khas by 37.5 percent. Bahawalpur
experienced a yield increase by 5.9 percent and Mirpur Khas by 39.3 percent. This resulted in
differences in total revenue and gross margins.
Farmers‟ knowledge about the use Bt seed is extremely limited. They do not know about the
quality of seed or the importance of refuge areas. The increased incidence of secondary pests,
such as, CLCV and mealy bug, in last five year may be the result of using Bt varieties without
leaving a refuge area, improper use of inputs by farmers, the use of non-CLCV resistant varieties
to transfer the Bt gene, etc. These findings are consistent with the results from other developing
countries. To control the crop losses and spread of secondary pests, there is an urgent to
commercialize the approved varieties.
Despite a small sample, this paper captures the agro-climatic diversity in the selected districts
and points out different effects of Bt cotton in different intensities of pest pressure. Due to high
diversity of cotton growing areas, more location-specific information and larger sample size is
required to capture the impact of Bt technology in the cotton growing areas of Pakistan.
16
References
Arshad, Muhammad, Suhail, Anjum, Gogi, M. Dildar, Yaseen, M., Asghar, M., Tayyib, M.,
Karar, Haider, Hafeez, Faisal and Ullah, Unsar Naeem. 2009. “Farmers‟ perceptions of
insect pests and pest management practices in Bt cotton in the Punjab, Pakistan”.
International Journal of Pest Management, 55:1, 1 – 10.
Cororaton, Caesar B. & Orden, David, 2008. “Pakistan's cotton and textile economy:
Intersectoral linkages and effects on rural and urban poverty,” Research reports 158,
International Food Policy Research Institute (IFPRI), Washington, D.C.
Gandhi, Vasant, and N. Namboodiri 2006. The Adoption and Economics of Bt Cotton in India:
Preliminary Results from a Study, Working Paper No. 20006-09-04 (Indian Institute of
Management, Ahmedabad).
Government of Pakistan (GoP). 2003. Census of Agriculture 2000. Lahore: Agriculture Census
Organization.
Government of Pakistan. 2009a. Pakistan Economic Survey 2008-2009. Federal Bureau of
Statistics, Government of Pakistan.
Government of Pakistan. 2009b. Census of Manufacturing Industries 2005-2006. Federal Bureau
of Statistics, Government of Pakistan.
Gruère, Guillaume P., Purvi Mehta-Bhatt, and Debdatta Sengupta. 2008. Bt Cotton and Farmer
Suicides in India. IFPRI Discussion Paper 00808. Environment and Production
Technology Division, International Food Policy Research Institute, Washington, D.C.
Hayee, Abdul. 2004. Cultivation of Bt Cotton - Pakistan's Experience. Action Aid, Pakistan.
Herring, Ron 2009. Persistent Narratives: Why is the “Failure of Bt Cotton in India” Story Still
with Us? AgBioForum, 12(1): 14-22.
Huang, J., R. Hu, C. Fan, C. Pray, and S. Rozelle. 2002. Bt cotton benefits, costs, and impacts in
China. AgBioForum, 5, 153-166.
Ismael, Yousouf., Richard. Bennett, and Stephen. Morse. 2002. Farm-level economic impact of
biotechnology: Smallholder Bt cotton farmers in South Africa. Outlook on Agriculture,
31, 107-111.
Orphal, Jana., 2005. Comparative analysis of the economics of Bt and non-Bt cotton production.
Pesticide Policy Project Publication Series Special Issue No. 8. Hannover, University of
Hannover.53 pp.
PARC. 2008. Status of Cotton Harboring Bt Gene in Pakistan. Institute of Agr-Biotechnology &
Genetic Resources, National Agricultural Research Centre, Pakistan Agricultural
Research Council, Islamabad.
Pray, C.E., D. Ma, J. Huang, and F. Qiao 2001: “Impact of Bt Cotton in China,” World
Development, 29(5), 813-825.
Qaim, M. 2003. Bt cotton in India: Field trial results and economic projections. World
Development, 31, 2115-2127.
Qaim, M., and A. de Janvry. 2003. "Genetically Modified Crops, Corporate Pricing Strategies,
and Farmers' Adoption: The Case of Bt Cotton in Argentina." American Journal of
Agricultural Economics 85(4): 814-828.
Qaim, Matin, and David Zilberman. 2003. “Yield Effects of Genetically Modified Crops in
Developing Countries,” Science, Vol. 299, pp. 900–902.
17
Qayum, Abdul., and Kiran Sakkhari. 2005. Bt cotton in Andhra Pradesh -3 year assessment. The
first sustained independent scientific study of Bt cotton in India. Andhra Pradesh,
India: Deccan Development Society.
Rao, Ijaz Ahmad 2006. First Bt Cotton Grown in Pakistan. Pak Kissan, 17 March 2006.
http://www.pakissan.com/english/advisory/biotechnology/first.bt.cotton.grown.in.pakistan.
shtml.
Salam, Abdul. 2008. Production, Prices and Emerging Challenges in the Pakistan Cotton Sector.
In Cororaton, Caesar B. et al. ed.) Cotton-Textile-Apparel Sectors of Pakistan: Situation
and Challenges Faced. IFPRI Discussion Paper 00800. Washington, D.C.
Sheikh, A. D., M. Ather Mahmood, Abid Hussain, Arshed Bashir and Rashid Saeed. 2008. Bt-
Cotton Situation in Punjab. Technology Transfer Institute. Faisalabad.
Soomro Badruddin and Pervez Khaliq, 1996. Cotton Production in Pakistan: A Success Story.
Report No. 2. Asia Pacific Association of Agricultural Research Institutions, FAO
Regional Office for Asia and the Pacific, Bangkok.
Thirtle, C., L. Beyers, Y. Ismael, and J. Piesse. 2003. Can GM-technologies help the poor? The
impact of Bt cotton in Makhathini Flats, KwaZulu-Natal. World Development 31 (4):
717–732.
Traxler, G., and J. Falck-Zepeda. 1999. The distribution of benefits from the introduction of
transgenic cotton varieties. AgBioForum, 2(2), 94-98. Traxler, G., S. Godoy-Avila, J.
Falck-Zepeda, and J. J. Espinoza-Arellano. 2003. Transgenic cotton in Mexico:
Economic and environmental impacts of the first generation biotechnologies. In The
economic and environmental impacts of agbiotech: A global perspective, ed. N.
Kalaitzandonakes, 183–202. New York: Kluwer Academic/Plenum.
World Bank (2002). “Pakistan Poverty Assessment: Poverty in Pakistan: Vulnerabilities, Social
Gaps, and Rural Dynamics”. The World Bank. Washington D.C.
18
Table 1: Number of pesticide sprays and pesticide expenditure on Bt and non-Bt varieties
Bahawalpur Mirpur Khas
Bt Non-Bt t-values Bt Non-Bt t-values
Bollworm sprays 1.54 2.60 -6.26*** 1.18 2.67 -7.42***
(0.91) (0.70)
(0.39) (0.78)
Bollworm pesticide
expenditure (Rs/acre) 1,846 3,488 -6.56*** 1,259 2,667 -2.74***
(1,211) (1,226)
(1,099) (1,917)
Non-bollworm sprays 4.04 3.88 0.63 3.12 3.50 -0.95
(1.33) (1.24)
(1.32) (1.09)
Non-bollworm
pesticide expenditure
(Rs/acre) 3,073 2,993 0.22 2,093 2,605 -0.87
(1,989) (1,717)
(1,975) (1,242)
Total sprays 2.98 3.25 -1.24 2.74 3.08 -1.12
(1.70) (1.19)
(1.43) (1.02)
Total pesticide
expenditure (Rs/acre) 2,555 3,238 -2.88*** 1,929 2,636 -1.73*
(1,804) (1,507)
(1,862) (1,580)
Note: Bollworm pesticide refers to pesticides that are used to control bollworm, while non-
bollworm pesticides are used for other pests, such as, white fly, mealy bug, aphids,
jassids, etc.
Results are means. Figures in parentheses are standard deviations.
***, **, * denote statistical significance at the one percent, five percent and 10 percent
levels, respectively.
19
Table 2: Quantity, price and expenditure of Bt and non-Bt seed
Bahawalpur Mirpur Khas
Bt Non-Bt t-values Bt Non-Bt t-values
Quantity (kg/acre) 7.6 7.7 -1.023 5.9 6.1 -0.281
(1.3) (1.5)
(2.3) (1.9)
Price (Rs/kg) 180.9 107.7 5.771*** 195.3 110.0 6.017***
(75.3) (47.0)
(48.4) (43.9)
Expenditure
(Rs/acre) 1,318 838 5.097*** 1,149 652 2.954***
(536) (406)
(593) (330)
Note: Results are means. Figures in parentheses are standard deviations.
***, **, * denote statistical significance at the one percent, five percent and 10 percent
levels, respectively.
20
Table 3: Expenditures on fertilizer, irrigation, picking and other items of Bt and non-Bt
cotton
Bahawalpur Mirpur Khas
Bt Non-Bt t-values Bt Non-Bt t-values
Fertilizer expenditure
(Rs/acre) 3,020 2,663 2.535*** 2,819 2,532 1.022
(749) (717)
(977) (716)
Picking expenditure
(Rs/acre) 1,811 1,711 0.864 1,965 1,411 4.145***
(629) (566)
(461) (367)
All other expenditures
(Rs/acre) 3,166 2,929 1.094 2,182 2,224 -0.010
(1,280) (857)
(836) (1,133)
Note: Results are means. Figures in parentheses are standard deviations.
***, **, * denote statistical significance at the one percent, five percent and 10 percent
levels, respectively.
21
Table 4: Total expenditure, yield, revenue and gross margin of Bt and non-Bt cotton
Bahawalpur Mirpur Khas
Bt Non-Bt t-values Bt Non-Bt t-values
Total expenditure
(Rs/acre) 13,557 14,157 -0.775 6,812 6,519 0.278
(4,327) (3,491)
(3,742) (1,644)
Yield (kg/acre) 808 763 0.864 877 629 4.145***
(281) (253)
(206) (164)
Revenue (Rs/acre) 28,192 26,568 0.811 20,022 13,953 2.695***
(10,256) (10,823)
(7,963) (3,903)
Gross margin (Rs/acre) 14,634 12,411 1.212 13,210 7,433 3.428***
(9,525) (9,705)
(5,909) (3,631)
Note: Results are means. Figures in parentheses are standard deviations.
Expenditures, revenue and gross margin are in Rs/acre and yield is in kg/acre.
***, **, * denote statistical significance at the one percent, five percent and 10 percent
levels, respectively
22
Table 5: Comparison of costs, yield, revenue and gross margin between Bt and non-Bt
varieties in Pakistan
Bahawalpur Mirpur Khas Average
Number of boll worm sprays -1.1 -1.5 -1.3
Number of non-bollworm sprays 0.2 -0.4 -0.1
Number of total sprays -0.9 -1.9 -1.4
Expenditure on bollworm pesticide
(%) -47.1 -52.8 -49.3
Expenditure on non-bollworm
pesticide (%) 2.7 -19.7 -12.8
Expenditure on pesticides (%) -21.1 -26.8 -27.1
Expenditure on seed (%) 64.9 76.3 29.0
Total expenditure (%) -4.2 4.5 -7.1
Yield (%) 5.9 39.3 15.6
Revenue (%) 6.1 43.5 0.04
Gross margin (Rs/acre) 2,224 5,777 3,617
Note: Number of sprays and gross margin are in simple difference. Expenditure figures are
percentage differences.
23
Table 6: Comparison of Pakistan’s unapproved Bt varieties with China and India’s
approved Bt Varieties
Percentage difference in Bt and non-Bt
varieties
Gross margin
(US$/ha)
# of
sprays
Pesticid
e cost
Seed
cost
Total
cost Yield Bt Non Bt
China (2001) -- -58.1 333.3 -27.5 10.9 277 -225
India (2006)
Gujrat -- -- 136.8 13.7 35.4 715 407
Maharashtra -1.9 -21.3 192.4 36.5 46.3 504 319
Andhra Pradesh -3.8 -25.8 173.1 5.6 44.6 420 121
Tamil Nadu -2.0 -54.5 237.0 13.7 28.5 340 129
Pakistan (2009)
Bahawalpur -0.9 -21.1 64.9 -4.2 5.9 452 384
Mirpur Khas -1.9 -26.8 76.3 4.5 39.3 408 230
Source: Huang et al. (2002) for China, Gandhi and Namboodiri (2006) for India, and Bt Cotton
Survey 2009 for Pakistan.