Embed Size (px)
Citation preview
A quantitative analysis of transient kinetic experiments:the oxidation of CO by O2 over PtCitation for published version (APA):Hoebink, J. H. B. J., Huinink, J. P., & Marin, G. B. M. M. (1997). A quantitative analysis of transient kineticexperiments: the oxidation of CO by O2 over Pt. Applied Catalysis. A, General, 160(1), 139-151.https://doi.org/10.1016/S0926-860X(97)00132-4
DOI:10.1016/S0926-860X(97)00132-4
Document status and date:Published: 01/01/1997
Document Version:Publisher’s PDF, also known as Version of Record (includes final page, issue and volume numbers)
Please check the document version of this publication:
• A submitted manuscript is the version of the article upon submission and before peer-review. There can beimportant differences between the submitted version and the official published version of record. Peopleinterested in the research are advised to contact the author for the final version of the publication, or visit theDOI to the publisher's website.• The final author version and the galley proof are versions of the publication after peer review.• The final published version features the final layout of the paper including the volume, issue and pagenumbers.Link to publication
General rightsCopyright and moral rights for the publications made accessible in the public portal are retained by the authors and/or other copyright ownersand it is a condition of accessing publications that users recognise and abide by the legal requirements associated with these rights.
• Users may download and print one copy of any publication from the public portal for the purpose of private study or research. • You may not further distribute the material or use it for any profit-making activity or commercial gain • You may freely distribute the URL identifying the publication in the public portal.
If the publication is distributed under the terms of Article 25fa of the Dutch Copyright Act, indicated by the “Taverne” license above, pleasefollow below link for the End User Agreement:
www.tue.nl/taverne
Take down policyIf you believe that this document breaches copyright please contact us at:
providing details and we will investigate your claim.
Download date: 15. Feb. 2020
/ APPLIED CATALYSIS A: GENERAL
E L S E V I E R Applied Catalysis A: General 160 (1997) 139-151
A quantitative analysis of transient kinetic experiments: The oxidation of CO by 02 over Pt
J . H . B . J . H o e b i n k , J.P. H u i n i n k 1, G . B . M a r i n *
Eindhoven Universio, of Technology, Laboratorium voor Chemische Technologie, PO Box 513, 5600 MB Eindhoven, Netherlands
Abstract
Transient kinetic experiments allow to assess quantitatively the rate coefficients of individual elementary steps. Experiments were performed in the temperature range 300-400 K with temporal analysis of products (TAP) for CO oxidation over polycrystalline platinum, initially fully precovered with O adatoms, at varying degrees of CO and O coverage. Experimental evidence for the existence of islands was found. The results were described with an island model, that accounts for CO chemisorption from a precursor state, followed by either CO incorporation into CO islands or by a surface reaction with O adatoms from adjacent O islands. CO chemisorption was not activated and its rate coefficient was estimated as 40 s ~, while the surface reaction was relatively fast. Indications for the size of the CO and O islands were found.
Kevwords: Transient kinetics; TAP; CO oxidation; Island formation
1. Introduction
The use of transient kinetic methods is a distinct step forwards in the modelling of catalytic reaction pathways. Classical steady-state experiments always lead to rate equations that are based upon bulk or near- to-surface concentrations only, as is the case for Langmuir-Hinshelwood or Eley-Rideal kinetics, without explicitly involving the coverages of species on the catalyst surface that underlie any mechanism. Moreover the accessible kinetic parameters often consist of combinations of the rate coefficients of the individual elementary steps. Transient experi-
*Corresponding author. Tel.: +31 40 2472850; Fax: +31 40 2446653.
Ipresent address: Shell Internationale Petroleum Maatschappij B.V., PO Box 162, 2501 AN The Hague, Netherlands.
0926-860X/97/$17.00 @ 1997 Elsevier Science B.V. All rights reserved. P I I S 0 9 2 6 - 8 6 0 X ( 9 7 ) 0 0 1 3 2 - 4
ments, however, provide information on the elemen- tary steps of a reaction, since the time-resolved observations allow an interpretation in terms of spe- cies accumulation on the surface, as all elementary steps in series do not proceed at the same rate. In general transient experiments can be carried out by perturbing the feed concentrations of a reactor, either stepwise or pulsewise, or by cycling of the feed. An additional advantage is the possibility of investigating c.q. eliminating part of a reaction mechanism by pretreating the catalyst with one of the relevant reac- tants. A special application in this respect is the use of isotopes in a kinetic study, both under steady-state and transient conditions.
Steady-state rate equations are usually based on an even spatial distribution of adsorbates on the catalyst surface, and provide upmost an indirect estimate of an average degree of surface coverage. A restricted
140 J.H.B.J. Hoebink et al./Applied Catalysis A: General 160 (1997) 139-151
mobility of adsorbates, however, may lead to topo- graphic features like island formation, which influ- ences observed rate phenomena, as has been widely indicated in the literature. Transient kinetic experi- ments are a powerful tool to study changes in the surface distribution and their effect on chemical rates.
In this paper the benefits of transient kinetics will be considered in more detail for the oxidation of carbon monoxide over platinum, under application of pulse- type perturbations in a temporal analysis of products reactor TAP [1].
At very low surface coverage, adsorbed carbon monoxide and oxygen adatoms will be randomly distributed over the platinum surface [2]. No CO2 formation takes place if a surface, saturated with adsorbed CO, is exposed to gaseous O2 [3]. At high CO surface coverage there are no pairs of vacant surface sites available to adsorb oxygen dissociatively [4]. On the other hand considerable amounts of CO can adsorb if the surface is saturated with oxygen adatoms [5]. At lower surface coverage both oxygen and CO will adsorb. Both components form separate domains or islands on the surface. LEED results indicate that oxygen adatoms form islands for degrees of surface coverage greater than 10%, and suggest that CO forms islands when it is adsorbed on surfaces containing adsorbed oxygen [6]. Shigeishi and King [7] as well as Haaland and Williams [8] concluded from FTIR measurements that large CO domains were formed at room temperature and pressures up to I bar. LEED observations indicated a mean diameter of the domains of at least 10 nm [2,3]. Field ion microscope (FIM) studies of Gorodetskii et al. [9] revealed that CO islands have diameters between 4 and 5 nm. CO2 production can occur only along the boundaries of these islands, as experimentally demonstrated [8]. Oxygen adatoms exhibit a much lower surface mobi- lity than adsorbed CO, caused by the strong Pt-O bond. Adsorbed CO molecules move within an essen- tially fixed matrix of O atoms [3,8,10]. The activation energy for CO surface diffusion on Pt(1 l 1) is about 50kJ mol - l and coverage independent [10]. Com- pared to other similar surfaces for which CO diffusion data exist, the surface diffusion of CO on Pt(1 1 1) is very slow: at 300 K about 100 times slower than on Rh(1 1 1) and more than three times slower than on Ru(00 1). This slow surface migration explains the
existence of CO surface islands. At high temperatures CO islands are not present any more on the Pt surface, due to a higher CO surface diffusion. Wicke et al. [11] described a simple molecular level approach to show how islands may arise on a surface, which can be used in Monte Carlo simulations to predict the formation of both carbon monoxide and oxygen islands under both steady-state and transient conditions [12,13]. Zhou et al. [14] suggested that CO2 can be formed on Pd via two pathways, involving either CO adsorption on sites adjacent to oxygen or diffusion of adsorbed CO over the surface to an oxygen island. The islands are consumed in a surface reaction on the island periphery. Numerous but small CO islands formed during peri- odic operation are believed, according to the authors, to be responsible for the enhanced rates during per- iodic operation. At steady-state, large areas of the surface are covered with CO, resulting in low reaction rates. CO surface island models were also presented by Mukesh et al. [15], Goodman et al. [16] and Graham [ 17].
Most of the above results were obtained on single crystal surfaces and at conditions, in particular pres- sure, far away from industrial practice. The present work reports results obtained on polycrystalline pla- tinum sponge at pressures around 100 Pa, as part of an effort to bridge the so-called pressure gap and the differences between single crystals and supported platinum.
2. Experimental
The TAP microreactor [1,18,19] is a fixed bed reactor with a typical residence time of 100 ms, which is operated batchwise by submitting pulses of reac- tants with a width at half height of typically 0.2 ms. A well defined state of the catalyst surface can be maintained upon admission of a pulse, since pulse sizes can be made sufficiently small to limit absolute changes in surface coverage to 1% of the actual degree of coverage. Reactor outlet responses, measured with a UTI I00 C quadrupole mass spectrometer, are trans- lated into outlet molar flow rates via absolute calibra- tions of the quadrupole signal. The experiments performed with TAP during this study were pulse experiments or multipulse experiments [1,19,20]. In a pulse experiment the response to a single pulse is
J.H.B.J. Hoebink et al./Applied Catalysis A: General 160 (1997) 139-151 141
monitored at a fixed atomic mass value AMU. In a multipulse experiment a distinct number of pulses is introduced and their responses are monitored at a fixed AMU, but at a reduced number of data points per pulse. The time interval between subsequent pulses is chosen large enough to avoid accumulation of com- ponents in the gas phase of the catalyst bed. A multi- pulse experiment can be used to study the interaction of a component with the catalyst surface at different degrees of coverage.
The catalyst bed was always enclosed between two inert beds of non-porous quartz, each of them having a length of approximately 10 mm and a diameter of 5.6 mm. From thermocouple measurements the cata- lyst containing part of the bed was found to be isothermal.
Gases were used as delivered by the suppliers: 02 (Air Products, 99.995%), Ar (Hoekloos, 99.9999%), CO (Hoekloos, 99.997%). The catalyst used was a polycrystalline platinum sponge catalyst, supplied by Johnson Matthey, and containing 99.9 mass% Pt. The sponge pellet diameters were in the range 250- 350~tm. Each pellet consisted of many sintered non-porous spheres with a diameter of approximately 5 ~m. The quartz pellets used had diameters between 315 and 400 ~tm.
The platinum sponge, typical 0.8 g, was pretreated at 1100 K with a 2x 10 -7 mol s -1 flow of 5% oxygen in argon and with a similar flow of 5% hydrogen in argon, each treatment lasting one and a half hour. To determine the number of oxygen covered platinum sites, the catalyst was saturated with oxygen at reac- tion temperature, followed by holding the catalyst for 5 min at 10-4pa. The surface was subsequently titrated with carbon monoxide pulses and the total carbon dioxide formation was measured. Such titra- tions were repeated at various temperatures between 323 and 788 K. At 323 and 405 K the total CO2 formation was the same. Oxygen adatoms did not desorb from the surface within 5 rain after the oxygen treatment, since equal amounts of CO2 were observed with and without the 5 rain delay. Moreover no oxygen could be adsorbed at these temperatures in an oxygen pulse experiment after that delay. Therefore the abso- lute oxygen coverage at 323 and 405 K was consid- ered as the total amount of surface sites available for oxygen adsorption, and was determined as 9.93×10 7molg ~ for a fresh catalyst and
6,43× 10 7 mol g-1 for a pretreated catalyst. Assum- ing a face centred cubic crystal structure with a lattice constant of 0.393 nm [21], the number of surface atoms per square meter of a Pt(1 00) crystal plane is 1.295 × 10¹⁹. Accordingly the surface area of a fresh platinum sponge catalyst is 0.046 m2g I and for a pretreated catalyst it is 0.030 m 2 g The value obtained with TAP for the fresh platinum sponge catalyst agrees very well with the krypton BET surface area, which was determined as 0.050 m 2 g 1. During the pretreatment the surface area decreases by about 35% as a result of sintering. Sintering did not occur after the pretreatment procedure.
A common multipulse experiment with TAP does not allow to monitor the individual responses without a drastic reduction of the number of data points. Therefore subsequent CO pulse experiments were done, starting with a platinum surface fully covered with oxygen adatoms, and the individual CO and CO2 signals were measured. In this way full responses could be recorded at degrees of oxygen coverage varying from 1 to 0. This procedure was carried out at 323, 344 and 365 K. Submitted pulses always contained 10 vol% argon, which component was used as a reference both for calibration purposes and for modelling the gas transport through the catalyst bed and the inert beds in series. The pulse size was about 5 × 10¹⁵ molecules and the amount of CO adsorbed per pulse was about 1.3% of a monolayer. All experiments were carried out in the Knudsen diffusion regime. Full details on the modelling of the transport, including measured Knudsen diffusivities, were reported else- where [ 19,24].
3. Results from multipulse experiments
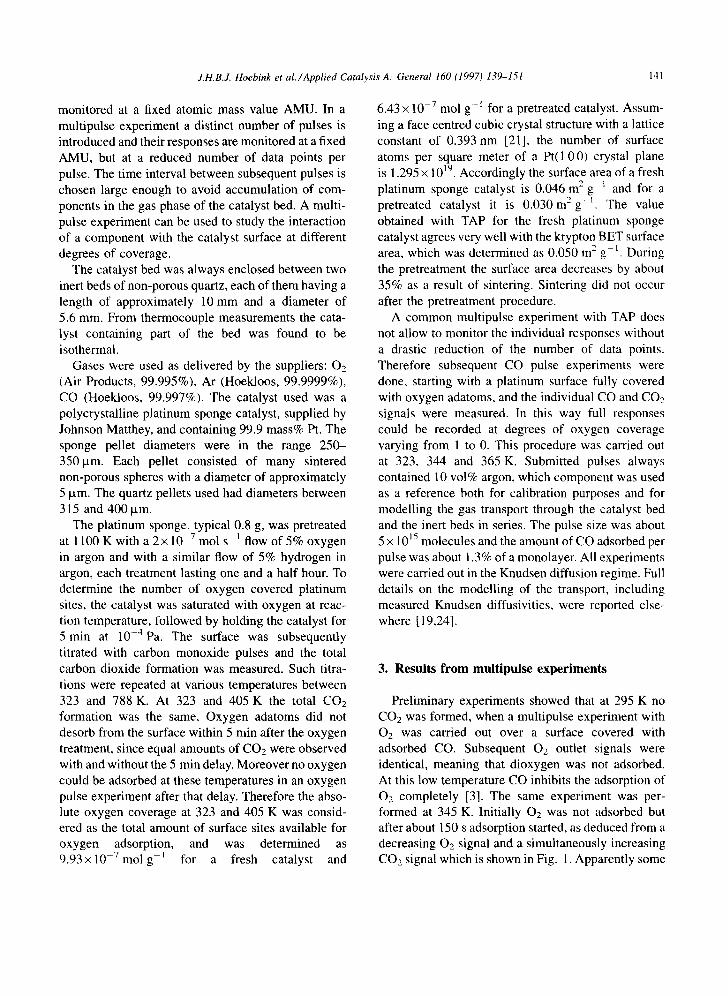
Preliminary experiments showed that at 295 K no CO2 was formed, when a multipulse experiment with 02 was carried out over a surface covered with adsorbed CO. Subsequent O2 outlet signals were identical, meaning that dioxygen was not adsorbed. At this low temperature CO inhibits the adsorption of O2 completely [3]. The same experiment was per- formed at 345 K. Initially 02 was not adsorbed but after about 150 s adsorption started, as deduced from a decreasing 02 signal and a simultaneously increasing CO2 signal which is shown in Fig. 1. Apparently some
142 J.H.B.J. Hoebink et al./Applied Catalysis A." General 160 (1997) 139-151
o5~.-I
I N T E N S ! T y .2B~-I
/
R
0 100 3f l0 TIME / S
Fig. 1. CO 2 responses at 345 K in an 02 multipulse experiment over Pt covered with CO.
4fib
CO desorption occurs to allow 02 adsorption. In Fig. 1 two maxima are shown, indicating the existence of at least two different domains or islands of adsorbed CO on the surface, although this phenomenon could also be ascribed to two different sites for CO adsorption. Similar observations were made at temperatures between 320 and 370 K. The same experiment was carried out at 405 K as well. CO desorption now occurred at a higher rate, as a result of which suffi- ciently vacant surface sites were initially available for 02 adsorption. Almost all pulsed 02 adsorbed imme- diately. The CO2 outlet peaks had equal surface areas, meaning that all 02 was converted into CO2, until all adsorbed CO had disappeared. The behaviour was similar at temperatures above 405 K, till the life time of adsorbed CO became too short. It was also observed that at low temperatures the adsorbed CO could not be removed completely from the surface by titration with oxygen pulses. So at 323 K 44% of the Pt surface sites remained covered with adsorbed CO molecules, which gives further evidence of different CO domains on the surface. At temperatures above 365 K all CO could be removed by oxygen.
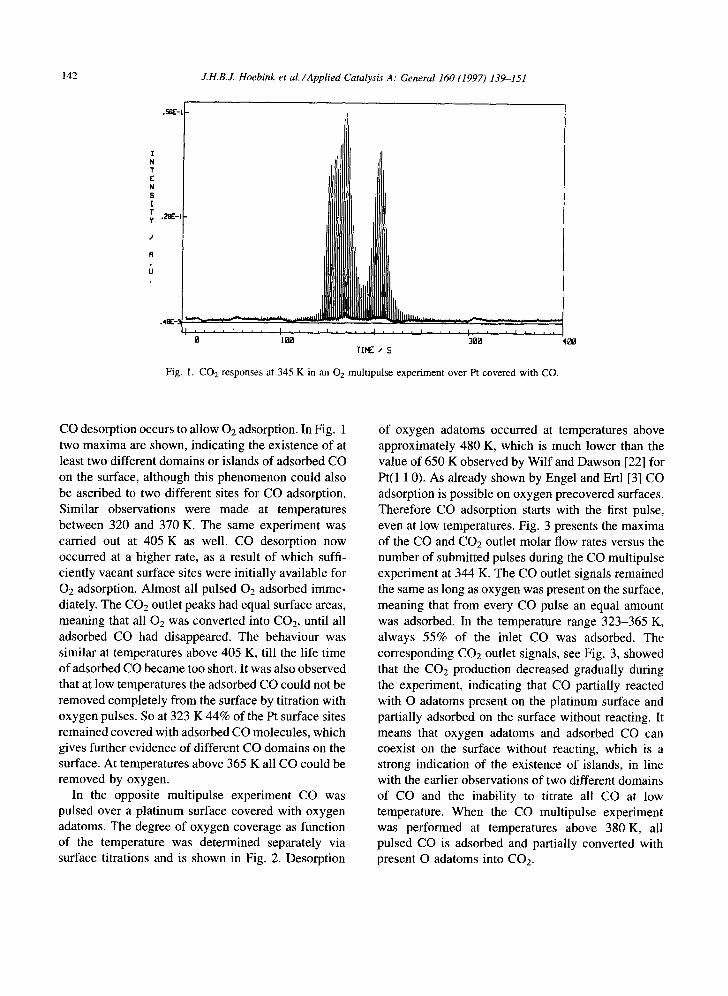
In the opposite multipulse experiment CO was pulsed over a platinum surface covered with oxygen adatoms. The degree of oxygen coverage as function of the temperature was determined separately via surface titrations and is shown in Fig. 2. Desorption
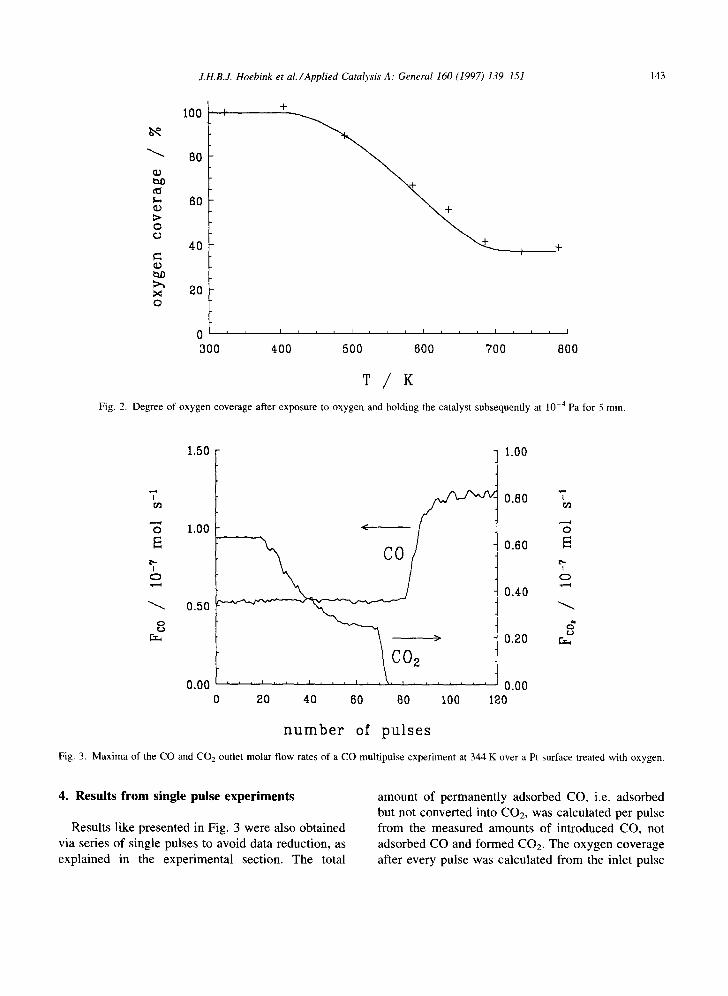
of oxygen adatoms occurred at temperatures above approximately 480 K, which is much lower than the value of 650 K observed by Wilf and Dawson [22] for Pt(l 1 0). As already shown by Engel and Ertl [3] CO adsorption is possible on oxygen precovered surfaces. Therefore CO adsorption starts with the first pulse, even at low temperatures. Fig. 3 presents the maxima of the CO and CO2 outlet molar flow rates versus the number of submitted pulses during the CO multipulse experiment at 344 K. The CO outlet signals remained the same as long as oxygen was present on the surface, meaning that from every CO pulse an equal amount was adsorbed. In the temperature range 323-365 K, always 55% of the inlet CO was adsorbed. The corresponding CO2 outlet signals, see Fig. 3, showed that the CO2 production decreased gradually during the experiment, indicating that CO partially reacted with O adatoms present on the platinum surface and partially adsorbed on the surface without reacting. It means that oxygen adatoms and adsorbed CO can coexist on the surface without reacting, which is a strong indication of the existence of islands, in line with the earlier observations of two different domains of CO and the inability to titrate all CO at low temperature. When the CO multipulse experiment was performed at temperatures above 380 K, all pulsed CO is adsorbed and partially converted with present O adatoms into CO2.
J.H.B.J. Hoebink et al./Applied Catalysis A: General 160 (1997) 139-151 143
oj eo~o
ob
o
o
I00 ÷
80
60
40
20
0 ' J
3OO
+
,+
+
I I J [ I L I I I I i J J I I L , I
400 500 600 700 800
T / K
Fig. 2. Degree of oxygen coverage after exposure to oxygen and holding the catalyst subsequently at lO -4 Pa for 5 rain.
1.50 1.00
T
, . - - , i
0
I o
0
1.00
0.50
0.80 "7
o
0.60 E~
0.40
L ~
0.20 c.~
<
0 20 40 60 80 I00 0.00 0.00
120
number of pulses
Fig. 3. Maxima of the CO and CO2 outlet molar flow rates of a CO rnultipulse experiment at 344 K over a Pt surface treated with oxygen.
4. Results from single pulse experiments
Results like presented in Fig, 3 were also obtained via series of single pulses to avoid data reduction, as explained in the experimental section. The total
amount of permanently adsorbed CO, i.e. adsorbed but not converted into CO2, was calculated per pulse from the measured amounts of introduced CO, not adsorbed CO and formed CO2. The oxygen coverage after every pulse was calculated from the inlet pulse
144 J.H.B.J. Hoebink et al./Applied Catalysis A." General 160 (1997) 139-151
Q
1.00
0.80
0.60
0.40
0.20
0.00
t
eo eco e.
I - , -
0 20 40 60 80 100
i
120
n u m b e r of p u l s e s
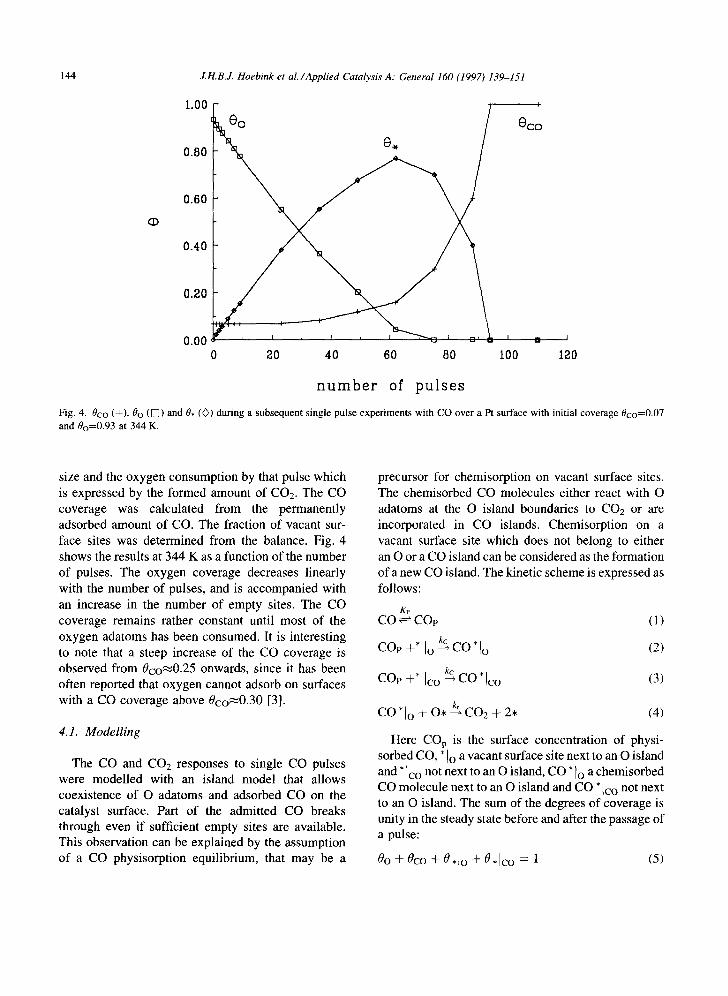
Fig. 4. 0co (+), 0o (V]) and 0, ((}) during a subsequent single pulse experiments with CO over a Pt surface with initial coverage 0co=0.07 and 0o=0.93 at 344 K.
size and the oxygen consumption by that pulse which is expressed by the formed amount of CO2. The CO coverage was calculated from the permanently adsorbed amount of CO. The fraction of vacant sur- face sites was determined from the balance. Fig. 4 shows the results at 344 K as a function of the number of pulses. The oxygen coverage decreases linearly with the number of pulses, and is accompanied with an increase in the number of empty sites. The CO coverage remains rather constant until most of the oxygen adatoms has been consumed. It is interesting to note that a steep increase of the CO coverage is observed from 0co~0.25 onwards, since it has been often reported that oxygen cannot adsorb on surfaces with a CO coverage above 0co~0.30 [3].
4.1. Modelling
The CO and CO2 responses to single CO pulses were modelled with an island model that allows coexistence of O adatoms and adsorbed CO on the catalyst surface. Part of the admitted CO breaks through even if sufficient empty sites are available. This observation can be explained by the assumption of a CO physisorption equilibrium, that may be a
precursor for chemisorption on vacant surface sites. The chemisorbed CO molecules either react with O adatoms at the O island boundaries to CO2 or are incorporated in CO islands. Chemisorption on a vacant surface site which does not belong to either an O or a CO island can be considered as the formation of a new CO island. The kinetic scheme is expressed as follows:
Kp CO ~ COp (I)
COp +* Io ~ C O * l o (2)
kc , COp +* ]co ~ CO [co (3)
CO*Io + O , ~ C O 2 + 2* (4)
Here COp is the surface concentration of physi- sorbed CO, * Io a vacant surface site next to an O island and * Ico not next to an O island, CO * Io a chemisorbed CO molecule next to an O island and CO * [co not next to an O island. The sum of the degrees of coverage is unity in the steady state before and after the passage of a pulse:
0o + 0co + 0,lo + 0,lco = 1 (5)
J.H.B.J. Hoebink et al./Applied Catalysis A: General 160 (1997) 139-151 145
Here 0o and 0co represent the surface coverages of O and CO, 0 , Io is the fraction of vacant surface sites next to O islands and 0 , [co not next to O islands. The latter includes vacant surface sites next to CO islands or neither next to CO or O islands. When a pulse passes, part of the vacant sites may be covered by CO, so 0 c o l o is the fractional coverage by chemisorbed CO molecules next to O islands and 0 co Ico not next to O islands. So it should be noted that
1 - 0 o - 0 c o = 0 , [ o + 0 , 1 c o = 0 , ( 6 )
It seems reasonable that the chemisorption of CO on vacant sites is independent of the presence of O adatoms or CO molecules next to it. Therefore, the CO chemisorption rate coefficient, k~, was set equal in reaction steps (3) and (4), The continuity equations in the catalyst bed are for the current situation:
. . . . OCco 0 2 Cco [e b -~- ( l - e b ) a v / k p ] T : - DeCO,b OX 2
-- (1 -- eb)avkc(1 -- 0o -- Oco)KpCco. (7)
0 C c o , ~ 0 2 C c o , ~b GQ t " -- ~eC%.b ~ + (l -- eb)avkcO,]oKpCco,
(8)
0 0 C O l c o 1 kcO, IcoKpCco. (9)
Ot Lt
The continuity equations for the inert beds contain accumulation and Knudsen diffusion terms only and are omit ted here [19]. Pre l iminary calculat ions showed that the exact value of the rate coefficient, k~, did not influence the shape of the calculated responses provided it was sufficiently large. There- fore the surface reaction was considered to occur ins tantaneously , as ref lec ted by the cont inui ty equation for CO2 and the absence of a continuity equation for CO*lo. The surface coverage of O adatoms was assumed to be constant during the passage of one pulse in view of the small pulse size. The same was done for 0 , [o and 0,1c o. As values for these quantities cannot be established on forehand, the products k~O,Io and k~O,Io were considered as model parameters.
The following initial and boundary conditions apply for the case that one CO pulse is admitted to the catalyst which has a well-known surface coverage of CO and O, resulting from a controlled number of
preceding pulses. Here l~ and 13 denote the lengths of the inert beds and 12 the length of the catalyst bed in between. The initial CO concentration follows from the CO amount in the inlet pulse:
t = O A O < x < l l + l ~ + l ~ : C c o ( x ) = b ~ Np'C° . . ebedlAsl 1
(10)
with 6x a Dirac pulse in axial direction. The COz concentration before admission of a CO pulse is zero in the whole bed:
t = 0 A 0 < x < Ii + 12 + 13 : Cco~ (x) = 0. ( 11 )
Initially the surface coverage of oxygen is uniform in the catalyst bed:
t = O A l l < _ x < ( l l + 1 2 ) : 0o(x) = 0 ° (12)
The initial coverage of chemisorbed CO next to CO islands is zero, because a CO molecule which chemi- sorbs on the boundary of a CO island is incorporated in this island:
t = 0 AIi _< x < (/1 + 12) : Oco[co(X) : : 0. ~13)
The surface coverages in the inert beds are zero, but irrelevant. After the introduction of the gas pulse, the pulse valve is closed meaning a zero flux for each component at the reactor entrance:
OCi t > 0 A x = 0 : -- 0. (14)
- 0 x
Concentrations and fluxes of all components are continuous at the interfaces between the different beds:
t _> 0 A x = 11 : Ci lbedl = Ct[bed2 ~15)
t>OAx=ll : -D K OC,[ _ DK OC, - - et,bedl ?)2( bedl - - - - ei,bed2 ~ X [bed2'
(16~
(17) t _> 0 A x = (ll + 12) : C, I bed2 : Ct I bed3"
t _ > 0 A x = ( / l + /=) :
K OCi = _DI~. OC, -- Dei'bed2 ~OX tbed2 ei,hed3 0_'¢ bed~" (181
The concentration of each component at the end of bed 3 is equal to zero because the reactor outlet is at vacuum conditions:
t > O A x = ( l l + 1 2 - b l 3 ) : C , = 0 . (19)
146 J.H.B.J. Hoebink et al./Applied Catalysis A: General 160 (1997) 139-151
Solution of the complete set of equations provides the concentrations of all components as function of time and the axial reactor coordinate. It allows to calculate, as a function of time, the molar flow rate of each component at the reactor outlet for comparison with the observed responses of CO and CO2 to sub- sequent CO pulses. The solution was performed numerically with the routine D03PGF from the NAG Fortran Library. Estimations of the kinetic para- meters were obtained through non-linear multire- sponse regression, applying Marquart's routine [23], of the model predictions with the data of the full CO and CO2 TAP curves. Knudsen diffusivities were obtained from independent experiments and reported elsewhere [19,24]. The regression included a full statistical analysis, which provided 95% confidence intervals, binary correlation coefficients between the individual parameter estimates and F-values for the model. All parameters were found to be statistically significant with a 95 confidence interval of approxi- mately 10%. The complete data were reported else- where [ 19].
4.2. Modelling results and interpretation
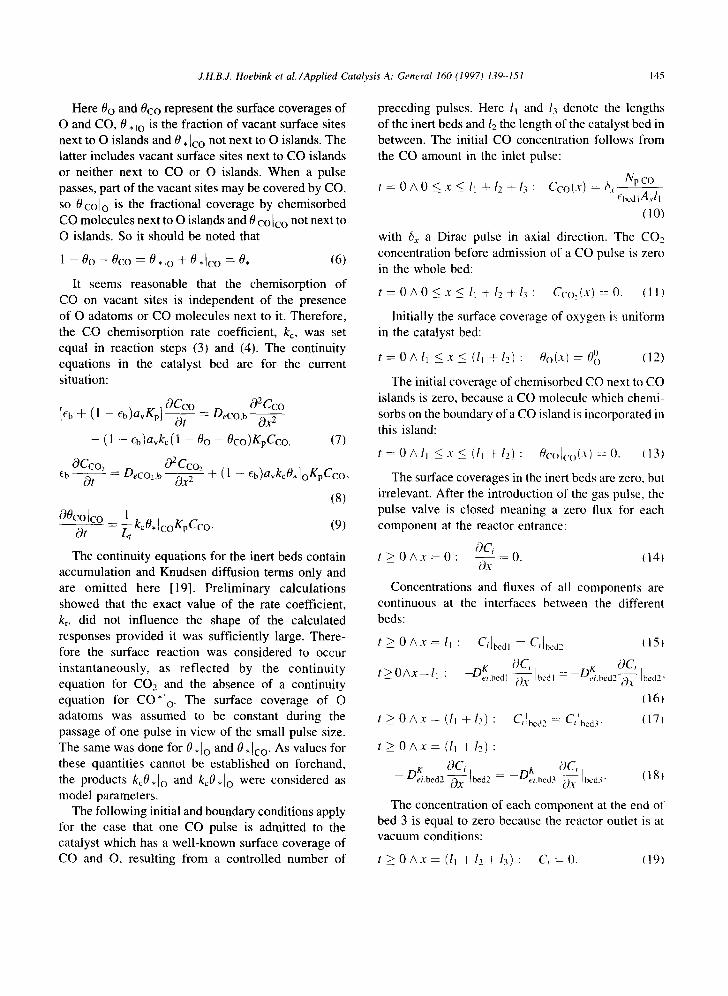
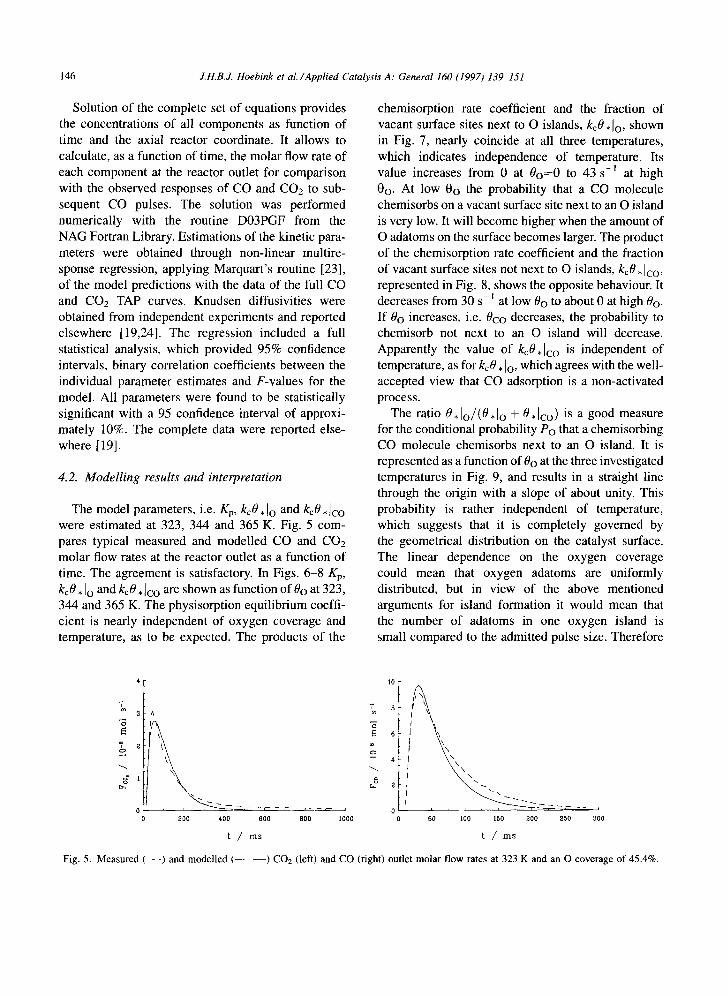
The model parameters, i.e. Kp, kcO, Io and kcO, ]co were estimated at 323, 344 and 365 K. Fig. 5 com- pares typical measured and modelled CO and CO2 molar flow rates at the reactor outlet as a function of time. The agreement is satisfactory. In Figs. 6-8 Kp, kcO. Io and kcO. ]co are shown as function of 0o at 323, 344 and 365 K. The physisorption equilibrium coeffi- cient is nearly independent of oxygen coverage and temperature, as to be expected. The products of the
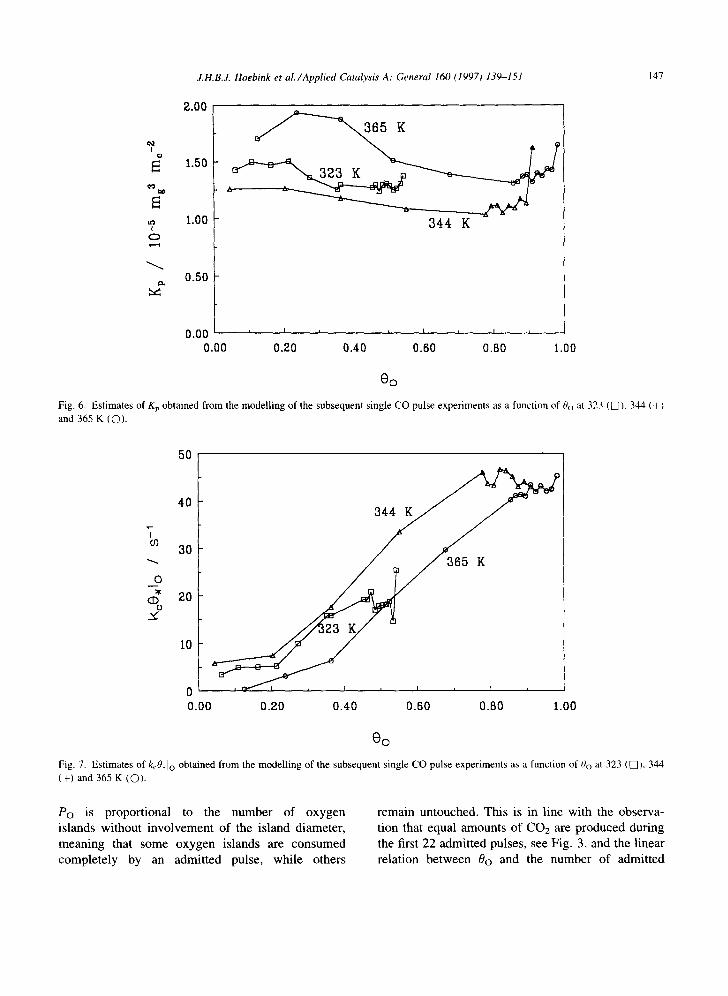
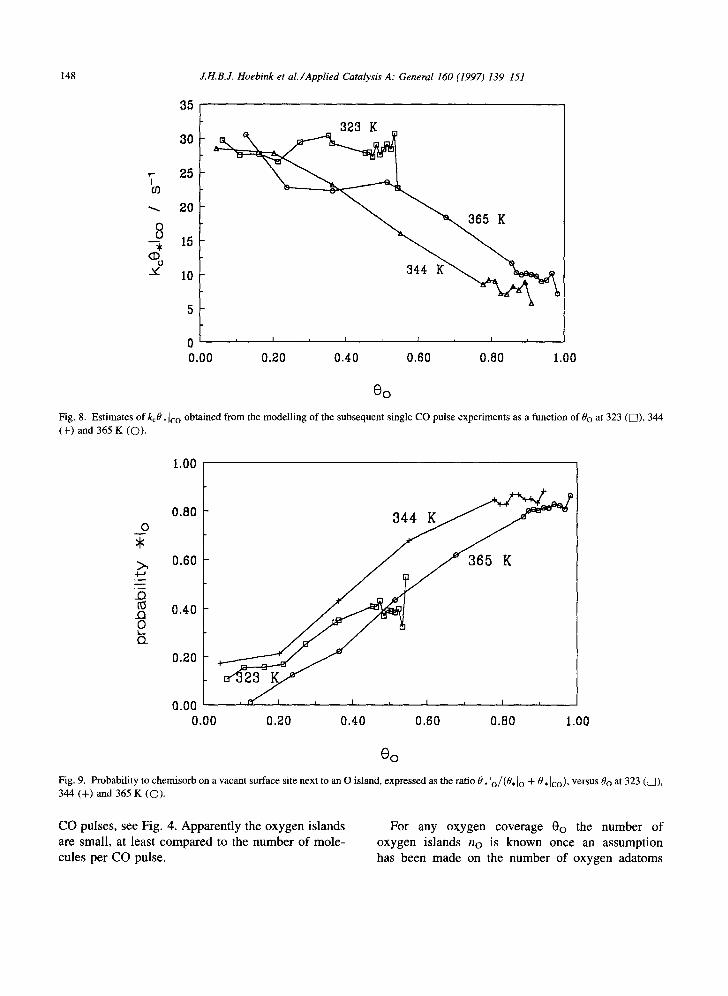
chemisorption rate coefficient and the fraction of vacant surface sites next to O islands, k~O, Io, shown in Fig. 7, nearly coincide at all three temperatures, which indicates independence of temperature. Its value increases from 0 at 0o---0 to 43 s -~ at high 0o. At low 0o the probability that a CO molecule chemisorbs on a vacant surface site next to an O island is very low. It will become higher when the amount of O adatoms on the surface becomes larger. The product of the chemisorption rate coefficient and the fraction of vacant surface sites not next to O islands, kcO, Ico, represented in Fig. 8, shows the opposite behaviour. It decreases from 30 s t at low 0o to about 0 at high 0o. If 0o increases, i.e. 0¢o decreases, the probability to chemisorb not next to an O island will decrease. Apparently the value of kc0,1c o is independent of temperature, as for kcO, Io, which agrees with the well- accepted view that CO adsorption is a non-activated process.
The ratio 0,1o/(0,lo + 0,1co) is a good measure for the conditional probability Po that a chemisorbing CO molecule chemisorbs next to an O island. It is represented as a function of Oo at the three investigated temperatures in Fig. 9, and results in a straight line through the origin with a slope of about unity. This probability is rather independent of temperature, which suggests that it is completely governed by the geometrical distribution on the catalyst surface. The linear dependence on the oxygen coverage could mean that oxygen adatoms are uniformly distributed, but in view of the above mentioned arguments for island formation it would mean that the number of adatoms in one oxygen island is small compared to the admitted pulse size. Therefore
3
~ z
10
" 8 ro
6
o 2
200 400 600 800 1000
t / m s
50 100 150 200 250 300
t / m s
Fig. 5. Measured (- - -) and modelled t ) CO2 (left) and CO (right) outlet molar flow rates at 323 K and an O coverage of 45.4%.
J.H.B.J. Hoebink et al./Applied Catalysis A: General 160 (1997) 139-151 147
2.00
I
1.50
i.00 o
0.50
344 K
0 .00 ~ t . , t ~ I , I ,
0.00 0.20 0.40 0.60 O.BO 1.00
0©
Fig. 6. Estimates of Kp obtained from the modelling of the subsequent single CO pulse experiments as a function of 0o at 323 ( ~ ), 344 (+) and 365 K (O),
"7
0
cI) x,"
50
40
30
20
10
0 0.00
I I I . I , i I L I *
0.20 0.40 0.60 O.BO 1.00
0 o
Fig. 7. Estimates of kcO, Io obtained from the modelling of the subsequent single CO pulse experiments as a function of 00 at 323 ([5]), 344 (+) and 365 K (O).
Po is proportional to the number of oxygen islands without involvement of the island diameter, meaning that some oxygen islands are consumed completely by an admitted pulse, while others
remain untouched. This is in line with the observa- tion that equal amounts of CO2 are produced during the first 22 admitted pulses, see Fig. 3, and the linear relation between 0o and the number of admitted
148 J.H.B.J. Hoebink et al./Applied Catalysis A: General 160 (1997) 139-151
T co
0
CD 0
35
30
25
20
15
10
323 K _
0 I I J I = ,1 ~ I L
0.00 0.20 0.40 0.60 0.80 1.00
00
Fig. 8. Estimates of kcO, Ico obtained from the modelling of the subsequent single CO pulse experiments as a function of/9 o at 323 (IS]), 344 (÷) and 365 K (O).
o
o
o 0 o_
1.00
0.80
0.60
0.40
0.20
0.00 0.00
, J , I
0.20 0.40 0.60 0.80 1.00
8 o
Fig. 9. Probability to chemisorb on a vacant surface site next to an O island, expressed as the ratio/9, Io/(0, Io + 0 , Ico), versus Oo at 323 ([]), 344 (+) and 365 K (O).
CO pulses, see Fig. 4. Apparently the oxygen islands are small, at least compared to the number of mole- cules per CO pulse.
For any oxygen coverage 0o the number of oxygen islands no is known once an assumption has been made on the number of oxygen adatoms
.LH.B.J. Hoebink et al./Applied Catalysis A: General 160 (1997) 139-151 149
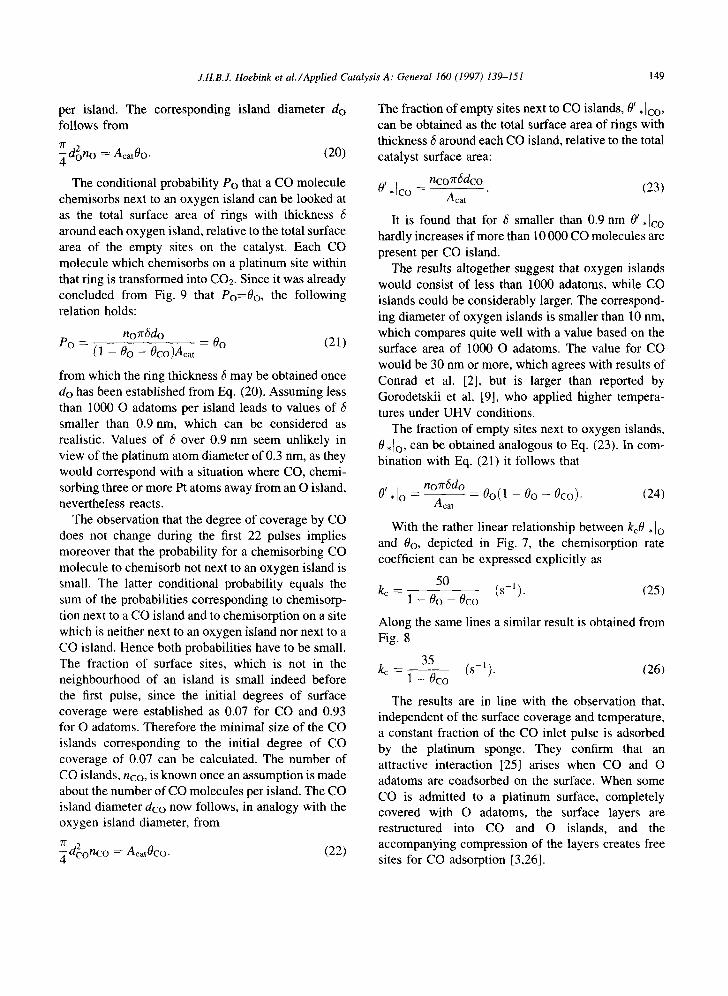
per island. The corresponding island diameter do follows from
71" 2 -~ dono = Aca t0O. ( 2 0 )
The conditional probability Po that a CO molecule chemisorbs next to an oxygen island can be looked at as the total surface area of rings with thickness 6 around each oxygen island, relative to the total surface area of the empty sites on the catalyst. Each CO molecule which chemisorbs on a platinum site within that ring is transformed into CO2. Since it was already concluded from Fig. 9 that Po=-0o, the following relation holds:
noTr~do Po = = Oo (21)
(1 - 0o - 0co)Acat
from which the ring thickness 6 may be obtained once do has been established from Eq. (20). Assuming less than 1000 O adatoms per island leads to values of smaller than 0.9 nm, which can be considered as realistic. Values of 6 over 0.9 nm seem unlikely in view of the platinum atom diameter of 0.3 nm, as they would correspond with a situation where CO, chemi- sorbing three or more Pt atoms away from an O island, nevertheless reacts.
The observation that the degree of coverage by CO does not change during the first 22 pulses implies moreover that the probability for a chernisorbing CO molecule to chemisorb not next to an oxygen island is small. The latter conditional probability equals the sum of the probabilities corresponding to chemisorp- tion next to a CO island and to chemisorption on a site which is neither next to an oxygen island nor next to a CO island. Hence both probabilities have to be small. The fraction of surface sites, which is not in the neighbourhood of an island is small indeed before the first pulse, since the initial degrees of surface coverage were established as 0.07 for CO and 0.93 for O adatoms. Therefore the minimal size of the CO islands corresponding to the initial degree of CO coverage of 0.07 can be calculated. The number of CO islands, n¢o, is known once an assumption is made about the number of CO molecules per island. The CO island diameter dco now follows, in analogy with the oxygen island diameter, from
71" 2 dconco = Acat0Co. (22)
The fraction of empty sites next to CO islands, 0 t , Ico, can be obtained as the total surface area of rings with thickness 6 around each CO island, relative to the total catalyst surface area:
nco zr rdco Ot * l e o - - Acat ( 2 3 )
It is found that for 6 smaller than 0.9 nm 0 ~ *]co hardly increases if more than 10 000 CO molecules are present per CO island.
The results altogether suggest that oxygen islands would consist of less than 1000 adatoms, while CO islands could be considerably larger. The correspond- ing diameter of oxygen islands is smaller than 10 nm, which compares quite well with a value based on the surface area of 1000 O adatoms. The value for CO would be 30 nm or more, which agrees with results of Conrad et al. [2], but is larger than reported by Gorodetskii et al. [9], who applied higher tempera- tures under UHV conditions.
The fraction of empty sites next to oxygen islands, 0 *1o, can be obtained analogous to Eq. (23). In com- bination with Eq. (21) it follows that
noTr6do Ot "10 - - Acat - - 0o(1 - 0o - 0co)- (24)
With the rather linear relationship between kcO. 1o and 0o, depicted in Fig. 7, the chemisorption rate coefficient can be expressed explicitly as
5O k c - - ( s - l ) , (25)
1 - 0 o - 0co
Along the same lines a similar result is obtained from Fig. 8
35 kc - (s-l). (26)
1 - 0co
The results are in line with the observation that, independent of the surface coverage and temperature, a constant fraction of the CO inlet pulse is adsorbed by the platinum sponge. They confirm that an attractive interaction [25] arises when CO and O adatoms are coadsorbed on the surface. When some CO is admitted to a platinum surface, completely covered with O adatoms, the surface layers are restructured into CO and O islands, and the accompanying compression of the layers creates free sites for CO adsorption [3,26].
150 J.H.B.J. Hoebink et al./Applied Catalysis A: General 160 (1997) 139-151
Eqs. (25) and (26) suggest that the chemisorption coefficient for an empty surface would amount around 40 s -1, which is somewhere in the middle of the interval proposed by Zhdanow et al. [27]. A sticking coefficient So can be calculated from
ra = s o F c o = k c K p C c o ( 1 - Oo - 0co) (27)
with ra the adsorption rate and Fco the collision flux. For an empty surface Eq. (27) would give an initial sticking coefficient So of 3 × 10 -5, which is far below the reported values 0.5-0.7 from molecular beam studies on polycrystalline platinum by Pacia et al. [26]. These authors, however, state that due to their low oxygen coverage, only part of the admitted CO reacts, while the rest is chemisorbed. Eq. (27) indi- cates that low sticking coefficients could be expected at high oxygen coverage. Pacia et al. [26] also observed that at temperatures as applied in this work the reactive sticking coefficient for CO decreases in a non-linear way with increasing oxygen partial pres- sure. Moreover, Alnot et al. [28] have shown that the adsorption probability for CO on surfaces covered with O adatoms is relatively low and decreases more than linearly with increasing oxygen coverage.
5. Conclusions
At temperatures below 380 K separated areas of oxygen adatoms and adsorbed CO coexist on a pla- tinum surface without reacting. Transient experiments showed that an equilibrium between gas phase CO and a precursor state has to be taken into account. The CO physisorption equilibrium coefficient was nearly inde- pendent of coverage and temperature. Physisorbed CO molecules chemisorb on vacant surface sites and either react instantaneously with O adatoms or adhere to CO islands, c.q. form new islands. The conditional prob- ability to chemisorb next to an O island is proportional to the total oxygen coverage and independent of temperature. An estimate of the rate coefficient for CO chemisorption on a empty platinum surface amounts to 40 s -1.
The above conclusions could be obtained by quan- titative modelling of transient kinetic experiments. This method, although applied to CO oxidation on platinum powder with the TAP set-up, is generally applicable for the quantitative modelling of transient
kinetic experiments. The application of TAP allows to study catalysts at a well-defined state of the surface which can be installed in advance. It would be valu- able, however, to validate the information obtained about the distribution of adsorbates with more direct techniques.
6. Notation
av
Acat As Ci CO *[co
CO*[o
di
D eKi
F Fco k~ kc Kv
li
ni
Np,i
P
S
t
X
* [CO "1o
external catalyst surface area per unit catalyst volume (mc z mc 3) total catalyst surface area (m~) cross section area of the reactor (n~) concentration of component i (mol m~ 3) chemisorbed CO molecule not next to an O island chemisorbed CO molecule next to an O island island diameter for component i (m) effective Knudsen diffusivity of compo- nent i (m 3 rr~ -1 s- l ) molar flow rate (mol s -1) collision flux for CO (mol m -z s - l ) surface reaction rate coefficient (s - j ) chemisorption rate coefficient (s -1) physisorption equilibrium coefficient (m~ m~ -2)
length of catalyst bed i (m) maximal molar loading per square meter catalyst surface (tool m~ -2) number of islands for component i amount of a component in inlet pulse (mol) probability sticking coefficient time (s) axial coordinate in reactor (mr) vacant surface site not n e x t to an 0 island vacant surface site next to an 0 island
Greek symbols
~b 0i
delta function with respect to axial coordinate=6(x=0) bed porosity (m~ n% -3) degree of coverage on the catalyst sur- face for species i
J.H.B.J. Hoebink et al./Applied Catalysis A: General 160 (1997) 139-151 151
0CO I CO
0 co Io
O.
O~[co
O,[o
degree of coverage of chemisorbed CO molecules not next to O islands degree of coverage of chemisorbed CO molecules next to O islands fraction of vacant surface sites fraction of vacant surface sites not next to O islands fraction of vacant surface sites next to O islands
References
[11 J.T. Gleaves, J.R. Ebner and T.C. Kuechler, Catal. Rev. Sci. Eng., 30 (1988) 49.
[2] H. Conrad, G, Ertl and J. KiJppers, Surf. Sci., 76 (1978) 343. [3] T, Engel and G. Ertl, Adv. Catal., 28 (1979) 1. [4] M. Boudart and E Rumf, React. Kinet. Catal. Lett., 35 (1987) 95. [5] H.P. Bonzel and R. Ku, Surf. Sci., 33 (1972) 91. [6] J.L. Gland and E.B. Kollin, J, Chem Phys., 78 (1983) 963. [7] R.A. Shingeishi and D.A. King, Surf. Sci., 75 (1978) L397. [8] D.M. Haaland and F.L. Williams, J. Catal., 76 (1982) 450. [91 V. Gorodetskii, W. Drachtel, M. Ehsasi and J.H. Block, J.
Chem. Phys., 100 (1994) 6915. [10] V.J. Kwasniewski and L.D. Schmidt, Surf. Sci., 274 (1992)
329. [11] E. Wicke, P. Kumman, W. Keil and J. Schiefler, Bet. Bunsen-
Ges. Phys. Chem., 84 (1980) 315.
[12] M. Dumont, M. Poriaux and R. Dagonier, Surf. Sci., 169 (1986) L307.
[13] B.N. Racine and R.K. Herz, J. Catal., 137 (1992) 158. [14] X. Zhou, Y. Barshad and E. Gulari, Chem. Eng. Sci., 41
(1986) 1277. [15] D. Mukesh, W. Morton, C.N. Kenny and M.B Cutlip, Surf.
Sci., 138 (1984) 237. [16] M.G. Goodman, M.B. Cutlip, C.N. Kenney, W. Morton and
D. Mukesh, Surf. Sci., 120 (1982) L453. [17] W.R.C. Graham, Ph.D. Thesis, University of Alberta,
Edmonton, Alberta (1990). [18] B.S. Zhou, M.P. Duducovic and EL. Mills, J. Catal., 148
(1994) 683. [19] J.P. Huinink, Ph.D. Thesis, Eindhoven University of Technol-
ogy, Eindhoven (1995). [20] E.P.J, Mallens, J.H.B.J. Hoebink and G.B. Matin, J. Catal.,
167 (1997) 43. [21] W.F. Smith, Principles of Materials Science and Engineering,
McGraw-Hill, New York, NY, 1990. [22] M. Wilf and P.T. Dawson, Surf. Sci., 65 (1977) 399. [23] D.W, Marquardt, J. Soc. Indust. Appl. Math.. 11 { 1963) 431. [24] J.P. Huinink, J.H.B.J. Hoebink and G.B. Marin. Can. J. Chem.
Eng., 74 (1996) 580. [25] G.A. Somorjai, Introduction to Surface Chemistry and
Catalysis, Wiley, New York, 1994. pp. 336, 412. [26] N. Pacia, A. Cassuto, A. Pentenero and B.J. Weber. J. Catal..
41 (1976) 455. [27] V.P. Zhdanov, J. Pavlicek and Z. Knor, Catal, Rev. Sci. Eng.,
30 (1988) 501. [28] M. Alnot, J. Fusy and A. Cassuto, Surf. Scl., 57 119761 651.