Embed Size (px)
Citation preview
University of Connecticut University of Connecticut
OpenCommons@UConn OpenCommons@UConn
Doctoral Dissertations University of Connecticut Graduate School
12-27-2019
A Qualitative and Quantitative Inquiry into the Learner A Qualitative and Quantitative Inquiry into the Learner
Engagement Construct Engagement Construct
Charles Dye University of Connecticut - Storrs, [email protected]
Follow this and additional works at: https://opencommons.uconn.edu/dissertations
Recommended Citation Recommended Citation Dye, Charles, "A Qualitative and Quantitative Inquiry into the Learner Engagement Construct" (2019). Doctoral Dissertations. 2403. https://opencommons.uconn.edu/dissertations/2403
A Qualitative and Quantitative Inquiry into the Learner
Engagement Construct
Charles S. Dye, Ph.D.
University of Connecticut, 2020
The present study seeks to develop a situated construct of learner engagement within an
instructional experience. Despite compelling potential benefits to instructional practice, extant
learner engagement research has been limited to either within-the learner constructs or adding a
simplistic behavioral component to a model and largely discounting the effects of diverse learning
environments, instructional techniques and educational technology, and their collective effects on
the learner’s attitudes, behaviors, perceptions, and performance while learning. The present study
seeks to develop a construct of learner engagement applying a situated cognition theoretical
framework to evaluate the effects of diverse learning environments on the learning experience by
addressing the perceived dimensions and characteristics of learner engagement and developing a
model of latent learner engagement construct using a learner-environment interaction as the unit
of analysis.
This study employed an exploratory sequential mixed methods design. Based on qualitative
data from 12 individuals engaged in industry learning and development of adults in professional
settings and a comprehensive literature review, three factors were identified for the latent learner
engagement construct: Affective Learner Engagement, Cognitive Learner Engagement, and
Situated Learner Engagement. Using themes that emerged from the qualitative data, items were
developed and subjected to content validation to produce an affective instrument to measure the
learner engagement construct. Through a content validation, the initial instrument consisted of 17
revised items out of the original 87 candidate items and subjected to an Exploratory Factor

Analysis (EFA) using a 300-participant sample. The EFA results confirmed the hypothesized three
dimensions and all items were retained. Confirmatory Factor Analysis (CFA) was subsequently
conducted with another sample of 300 participants. The identified three-factor structure of the
learner engagement construct model showed an acceptable level of internal consistency, construct
validity, and internal reliability. Moderate inter-item correlation indicated that additional inquiry
into the construct domain as defined by the three factors may be required. The present study
advanced beyond simple behavioral indicia in defining an environmental interaction as part of the
learner engagement construct that will permit more substantive studies seeking to evaluate the
relationship of learner engagement with individual and organizational outcomes.
Charles S. Dye, University of Connecticut, 2020
A Qualitative and Quantitative Inquiry
into the Learner Engagement Construct
Charles S. Dye
B.A., Cornell University, 1987
J.D., University of Connecticut, 2004
A Dissertation
Submitted in Partial Fulfillment of the
Requirements for the Degree of
Doctor of Philosophy at
the
University of Connecticut
2020

ii
Copyright by Charles S. Dye
2020
iii
APPROVAL PAGE
Doctor of Philosophy Dissertation
A Qualitative and Quantitative Inquiry into the Learner
Engagement Construct
Presented by
Charles S. Dye, B.A., J.D. Major Advisor
Scott W. Brown Associate Advisor
Michael F. Young Associate Advisor
Christopher H. Rhoads
University of Connecticut 2020
iv
Table of Contents
Table of Contents ........................................................................................................................... iv
Chapter 1 - Introduction .................................................................................................................. 1
Purpose of Research .................................................................................................................... 6
Conceptual Framework ............................................................................................................... 8
General Overview of the Research ............................................................................................ 11
Research Questions ................................................................................................................... 13
Chapter 2 - Literature Review ....................................................................................................... 15
Workforce Development & the Adult Learner ......................................................................... 15
Constructs of Learner Engagement ........................................................................................... 16
Situated Cognition & Engagement ............................................................................................ 20
Learning Environments & Learner Engagement ...................................................................... 22
Conclusion ................................................................................................................................. 24
Chapter 3 - Methodology .............................................................................................................. 25
Investigating the Construct of Learner Engagement ................................................................. 25
Through Sequential Mixed Methods ......................................................................................... 25
Research Design – Phase I – Basic Interpretive Inquiry ........................................................... 26
Analysis Method– Phase I ......................................................................................................... 30
Research Design – Phase II – Construct/Factor Definition & Instrument Development .......... 30
Sampling Method – Phase II ..................................................................................................... 33
Analysis Method – Phase II ...................................................................................................... 34
Chapter 4 - Results ........................................................................................................................ 39
Introduction ............................................................................................................................... 39
Phase I – Qualitative Study ....................................................................................................... 39
Phase II – Pilot Instrumentation ................................................................................................ 61
Exploratory Factor Analysis ..................................................................................................... 63
Item/Instrument Revision .......................................................................................................... 74
Confirmatory Factor Analysis ................................................................................................... 79
Reliability Analysis ................................................................................................................... 90
Chapter 5 - Model & Theory ........................................................................................................ 96
Introduction ............................................................................................................................... 96
Summary and Implications of the Learner Engagement Model ............................................... 97
Validity Evidence for the Learner Engagement Instrument.................................................... 100
Limitations of the Study .......................................................................................................... 102
Recommendations for Future Research .................................................................................. 105
Conclusion ............................................................................................................................... 112
References ................................................................................................................................... 114
Appendix A – Interview Protocol ............................................................................................... 123

v
Appendix B – Content Validation Survey .................................................................................. 126
Appendix C – Learner Engagement Instrument for EFA ........................................................... 143
Appendix D – Learner Engagement Instrument for CFA ........................................................... 148
1
Chapter 1
Introduction
Workplace training is ubiquitous – the needs of organizations are often addressed with
some form of training or development in a standing workforce. In the United States in 2018 alone,
government and industry organizations spent $87.6B and countless man-hours and other resources
on advancing the skills and knowledge of personnel (ATD, 2018; Carnevale, Strohl, & Gulish,
2015), aligned along various organizational objectives relating to, inter alia, enhanced
performance and productivity, regulatory compliance, or new skill development. Advances in
alternative instructional treatments such as self-paced have enhanced flexibility in delivery and
outreach to more of the targeted population (Arkorful & Abaidoo, 2015), but many in the learner
population have failed to participate in learning in a proactive manner as part of their vocational
“responsibility” – training is often mandated by the organization rather than requested or sought
after by the learner (Rana, Ardichvili, & Polesello, 2016). This challenge is well-understood in
the learning and development industry sector whose task is to enhance the effectiveness and
efficiency of professional training, while making the prospect of attending attractive to the learner
– it is a tough sell, as traditional methods of mandated workforce training often strikes fear and/or
loathing into the hearts of a worker – eliciting images of classrooms, short bathroom and lunch
breaks, stale air, and limited, if any, interest in the subject matter.
Exemplar of the challenge is attrition rates for self-paced online courses - within industry,
personnel who start an online self-paced instructional program required for their occupation are
much more likely to attrite before completing it – attrition approaches 80% for non-compulsory
training (Kaufmann, 2015; Moody, 2004). Typical attendance rates of non-mandatory training
(regardless of treatment or delivery method) in some industry sectors hovers at 10% of those that
2
express interest in the subject matter. To be sure, there are a variety of cause and factors to be
considered in addressing this issue, but many practitioners and organizations have focused on
driving the learner to “engage” in the learning experience to improve outcomes, reduce attrition,
and accomplish the organizational goals of the training program (Wolff, Wagner, Poznanski,
Schiller & Santen, 2015).
A casual review of current literature in academic research finds more than 300 scholarly
articles and more than 2,000 trade articles in 2018 alone that use the term “learner engagement”,
but few commentators define learner engagement explicitly – often researchers conflate
engagement with other constructs, most often motivation (Mayer, 2014; Yoo & Huang, 2013). It
is perhaps the ubiquity of the usage that allows researchers and commentators to continue the
practice without a strict definition – it is assumed everyone knows what is meant by the term.
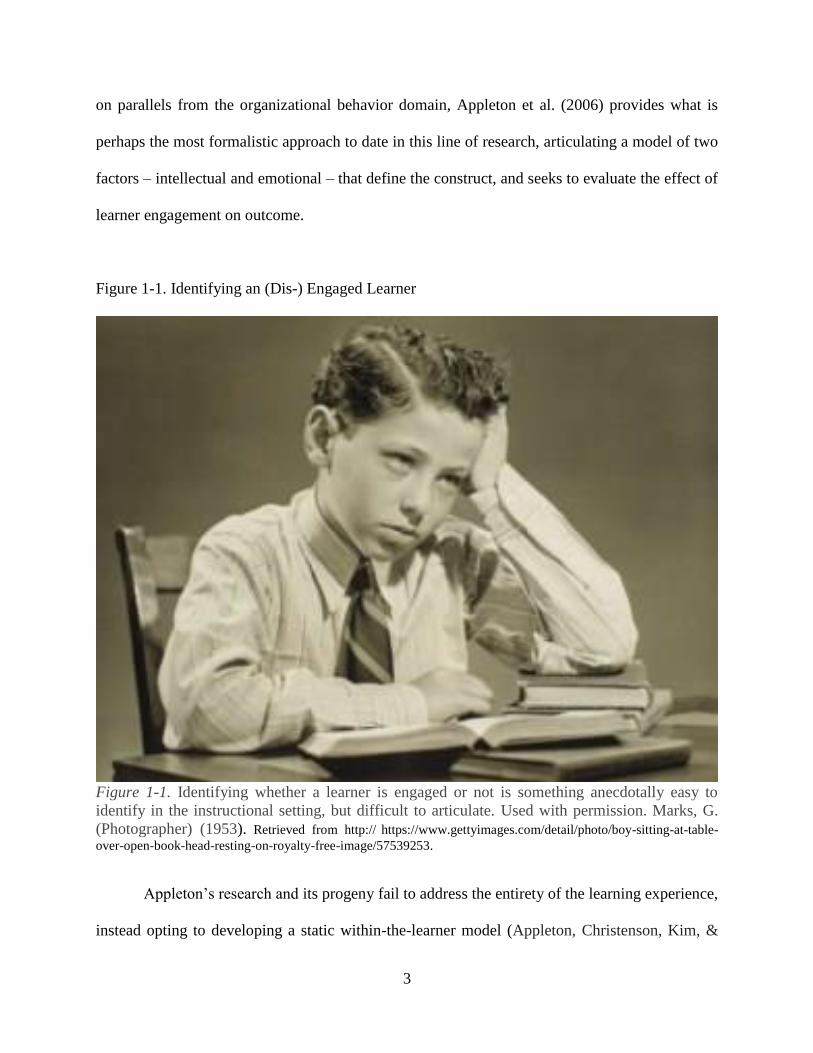
Most practitioners in the learning and development industry, be it K-12 public education, post-
secondary instruction, or industry professional training, can easily distinguish an “engaged”
learner from one that is not engaged, in many cases simply on sight (Figure 1-1). Anecdotally, it
is easy to “see” when someone is not engaged, but much more difficult to articulate what is meant
by “learner engagement.”
In the industry, learner engagement has developed into a short-hand term that loosely
represents an amalgam of learner subject-matter interest/expertise, attitude, motivation, and
mastery. Moreover, it is often explicitly or implicitly assumed that an engaged learner will achieve
better outcomes against measurable rubrics than one who is not engaged (Wolff et al., 2015). Most
researchers that do investigate the phenomenon of learner engagement either confound learner
engagement with motivation (Beal, Qu, & Lee, 2006), or treat engagement as some other trait of
the learner that exists before the learning experience as a means to an enhanced outcome. Drawing
3
on parallels from the organizational behavior domain, Appleton et al. (2006) provides what is
perhaps the most formalistic approach to date in this line of research, articulating a model of two
factors – intellectual and emotional – that define the construct, and seeks to evaluate the effect of
learner engagement on outcome.
Figure 1-1. Identifying an (Dis-) Engaged Learner
Figure 1-1. Identifying whether a learner is engaged or not is something anecdotally easy to
identify in the instructional setting, but difficult to articulate. Used with permission. Marks, G.
(Photographer) (1953). Retrieved from http:// https://www.gettyimages.com/detail/photo/boy-sitting-at-table-
over-open-book-head-resting-on-royalty-free-image/57539253.
Appleton’s research and its progeny fail to address the entirety of the learning experience,
instead opting to developing a static within-the-learner model (Appleton, Christenson, Kim, &
4
Reschly, 2006). Viewed epistemologically from a situation cognition framework, this approach
fails to contemplate the real and meaningful relationships of learning environments and the learner
as a unit of analysis, and the interactions between these factors that can produce variance in the
construct as the environment and the learner change (Anderson, Reder, & Simon, 1996; Young,
Kulikowich, & Barab, 1997). Despite compelling differences and benefits to instructional
practice, little qualitative or quantitative investigation has been conducted with a diverse learner
audience to understand the effect of various aspects of learning environments on/with the learner,
and in particular these effects on the learner’s attitudes, behaviors, perceptions, and performance
while learning (Halverson & Graham, 2019).
With respect to learning environment and instructional treatment, most commentators since
the mid-1970’s have suggested that different treatments or methods of instructional delivery
produce at least comparable learning outcomes relative to traditional classroom-based courses
(Sitzmann, Kraiger, Stewart, & Wisher, 2006), irrespective of the learning environment in which
they are presented. These studies were largely initiated in reaction to the broad adoption of
“correspondence” courses wherein the learner would self-direct study according to a prescriptive
plan, and has since been expanded and confirmed several times by the researcher in meta-analyses
incorporating new development in training delivery methods, all with the same result (Clark,
1994). In a sequence of extensive studies, Clark (1983) claimed that instructional outcomes are
media/modulus independent. These assertions are largely restricted to the specific instructional
application measured – a significant limitation of such comparison studies of learning conducted
in varied learning environments is the focus of the analysis (Buerck, Malmstrom, & Peppers,
2003). Most studies consider a limited set of learner characteristics such as gender (Arbaugh,
2000), learning preferences (Clouse & Evans, 2003), or opportunities for learner activity (Martin,

5
Parker & Deale, 2012) in their designs in measuring course equivalence, the conclusions drawn
are nearly exclusively based on performance in a summative assessment, typically a declarative
recall instrument (Gagne, Wager, Golas, Keller, & Russell, 2005), rather than a more expansive
examination of the learner experience (Clark, 1994).
Indeed, the issue of equivalence of instructional treatment and learning environment should
include the variance of instructional experience in two different delivery methods – a well-
designed virtual instructional program often takes very different methods, activities, and
approaches to delivery from its traditional classroom analog – the environments (and resulting
learner interaction in that environment) are fundamentally different (Dobbs, Waid, & del Carmen,
2009; Sautter, 2007; Yap, Wong, Wong, & Turner, 2001). Additional variance in program
delivery stems from student attitudes, perceptions of, and interaction with a particular environment
(Buerck, Malmstrom, & Peppers, 2003). As such, these factors can, and do, influence the learner’s
experience in an online delivery format (Clarke III, Flaherty & Mottner, 2001; Glasnapp, Poggio,
Poggio, & Yang, 2005).
Another shortcoming in conventional research on learner engagement as a construct is its
characterization as a stable trait of the learner (Appleton, 2006). As mentioned earlier, Appleton
et al. (2006) characterizes learner engagement as an index at a certain point of time. Other
researchers have found, however, compelling evidence to support the notion that the process of
learning involves situated cognitive dynamic cognitive and social processes unique to the specific
intentional trajectory of the learner and the environment in which learning occurs (i.e., deliberate
practice, Ericsson, 2006; learning from others, Grenier, 2009). Rather than a stable characteristic,
learning is better characterized by a continuous interaction within a learning environment to
develop expertise (Kuchinke, 1997; Daley & Cervero, 2016). The challenge for practitioners in
6
learning and development is determining the optimal treatment, technique(s), and learning
environment in which to address a particular training need. What is required is a method of
measuring learner engagement within the learning experience, to allow the evaluation of how it
changes over time and providing standardized measurement rubric that includes valid and reliable
instrumentation to assess the critical dimensions of individuals’ engagement in learning. The
instrument and measurement method can thus be used to advance enhanced instructional
treatments, reduce instructional attrition, and improve workforce development. For learners,
instructional treatments and environments that are tailored to enhance their learning experience
and outcomes.
Purpose of Research
As a first step in a line of research relating to “learner engagement” and outcome, this study
seeks to establish a more expansive and dynamic model of the “learner engagement” construct that
includes the learner, the environment, and the learner-environment interaction. Subsequent
research will evaluate the relationship of learner engagement with individual and organizational
outcomes. The consequences of fully developing a model could not be higher – the wasted
resources of sub-optimal training and professional development opportunities stagnate the
opportunities of individual workers and limit the growth and capabilities of organizations (Herling
& Provo, 2000).
Extant research exploring the impact of different learning environments on learning
outcomes misses a fundamental point - many of the most salient measures of effectiveness for the
classroom experience are highly subjective or not captured at all and informed by the individual
learner’s set of goals and objectives within that environment. Moreover, for a contextual
perspective, online learning is de facto different than a traditional classroom, simply by virtue of
7
being delivered differently than the traditional face-to-face format (Lave & Wenger, 1991). To
date, nearly all research relating to learning engagement has focused on summative assessment of
learning outcomes of an operationalized environment (Clarke III et al., 2001), ignoring personal
subjectivities relating to the learning experience in favor of quantitative data relating to
assessments of outcome, with but a few exceptions as they relate to vocational training and
anecdotal perceptions of worth assigned by the learner (Peltier, Schibrowsky, & Drago, 2007).
This approach to research fails to measure the causal effects on the learner of instructional
treatment and learning environment from the ecological and situated perspective. Despite
compelling differences and benefits to educational practice, little qualitative or quantitative
investigation has been conducted with a diverse learner audience to understand the effects of the
interaction of a learner in a particular learning environment on learner’s attitudes, behaviors,
perceptions, and performance while in the learning experience.
Review of the literature suggests that emotional, and cognitive dimensions of self-reported
engagement are common variables in engagement research and have been found to relate to
numerous desirable academic and behavioral outcomes (Fredricks et al., 2004). For this study, an
additional factor relating to the interaction of the learner in the learning environment is added,
supporting a situated cognitive perspective, and posits that learner engagement is not stable across
time (Betts, Appleton, Reschly, Christenson, & Huebner, 2010) but rather highly dynamic within
the instructional experience.
The purpose of this mixed-method study is to provide a model of learner engagement that
incorporates the learner and the learning environment, and then evaluate the effect of engagement
on learning in academia, industry, and society. Research will be conducted in several stages,
starting with a qualitative inquiry into learning experience and the concept of learner engagement,
8
and culminating in development of a quantitatively supported prescriptive model for instructional
treatment and delivery that leverages specific environments and treatments to achieve particular
learning outcomes. The proposed theoretical framework of this study seeks to link learner
engagement with improved learner outcomes. This theoretical framework examines the situated
experience of the learner, his/her interaction with the environment, and its impact on the ultimate
success of the learner in achieving the particular outcomes desired by that learner and the
organization.
Conceptual Framework
Situated cognition provides a promising framework to address learner engagement that
addresses the rapidly evolving variety of learning environments and instructional techniques extant
in today’s workplace learning domain. Brown, Collins, and Duguid (1989) detail a theory of
situated cognition particularly apropos to the environmental analysis of learner engagement. For
situated cognitivists, the task of learning is the confluence of a set of personal motives with a
particular environment that provides affordances to which the learner attunes his/her perception.
Action and response to stimuli in the learning process is based on those invariances of the
environment that invite action (Hutchins, 1995). Each individual’s experience is thus unique to
their perceptions and the affordances within a particular learning environment that are both present
and perceived in a constructivist context (Jonassen & Rohrer-Murphy, 1999; Mills, Bonner, &
Francis, 2006) – previous studies eschew the perception and motivation of the individual learner
in favor of merely cataloging environment factors and measuring observable simple behaviors
(Breslin, Hodges & Williams, 2009).
Situated cognition, as a theory of learning, conceptualizes learner engagement as a unique
experience for each learner-within-an-environment. Central to a situated framework of cognition

9
is that the dynamic interaction between action and environment in the learning process is real time
and ongoing - the learner takes action, prospectively perceives the effect of action on the
environment within the timeline of goals/objectives in that moment, the subsequent environmental
response, and takes subsequent action. A central tenet of this theoretical framework thus focuses
on the dynamic interaction of perception, action, and environment that forms and dissolves minute
by minute while in the learning process. “A perceiving/acting agent is coupled with a
developing/adapting environment and what matters is how the two interact" (Young et al., 1997,
p. 139) - a learner in a particular environment, by definition, adapts perception and interaction
based on the environment. As this process continues, the learner refines his/her perception to the
environment and learning is the consequence of interacting with those affordances. “The
environmental consequences of actions produce new experiences that can draw the attention of the
perceiver to new affordances of the environment” (Young, 2004, p. 172). To properly address the
intricacies of these interactions, this study seeks first to identify several key elements of learning
environments and learner-environment interactions that affect engagement.
The experience of both student and instructor are highly dynamic in a learning
environment, and collection of this data seems likely to provide insight into those aspects of the
learning experience that inform engagement. To that end, the first step of this research is to
develop a framework for qualitative evaluation of the learner within a learning environment, and
the effects on both the learner and the learning environment that result from the inclusion of
different environmental affordances in a program of study – the focus is not just on the actions and
changes of the learner but also the corresponding changes in the environment. This initial stage
of research will consist of a basic interpretive inquiry into individual subjective effects of
educational technology on learner attitudes, motivations, and perceptions within an online learning

10
environment. The central and related concepts resulting from the basic interpretive study will be
used qualitatively to evaluate particular learning environments through theoretical sampling, and
then quantitatively investigate the relationship between learner engagement and instructional
outcomes as specific phenomena (Ciborra, 2004).
This study is similarly rooted in a constructivist lens – each participant in the learning
environment (educator, learner, and sponsor) constructs a different sense of the efficacy and
consequences of adoption of pedagogical technique or technology in the learning environment.
These experiences and constructs are highly dynamic within the experience of the participants,
and adoption of a constructivist lens in this context will allow the “claims, concerns, and issues of
stakeholders to serve as organizational foci” (Guba & Lincoln, 1989, p. 50). These organizational
foci will, in turn, be used for follow-on studies and additional purposed sampling to fully refine
the theory (Charmaz, 2014) in evaluating the learning environment and defining “new” pedagogies
and technologies as elements of the learning environment. Grounded Theory is particularly
appropriate when viewed against the Situated Cognition/Constructivist framework of the research
– the theory emerges from, and is validated against, the data, rather than “forcing the data into
preconceived categories” (Charmaz, 2006). Situational Cognition/Constructivist theory similarly
relies on individual perception and development of realities within a particular environment
(Brown, Collins, & Duguid, 1989; Charmaz, 2006). In the aggregate, the use of a Constructivist
Interpretive Inquiry will address the process of learning as a social construct, with “the phenomena
of study and sees both data and analysis as created from shared experiences and relationships with
participants and other sources of data” (Charmaz, 2006, p.130).
11
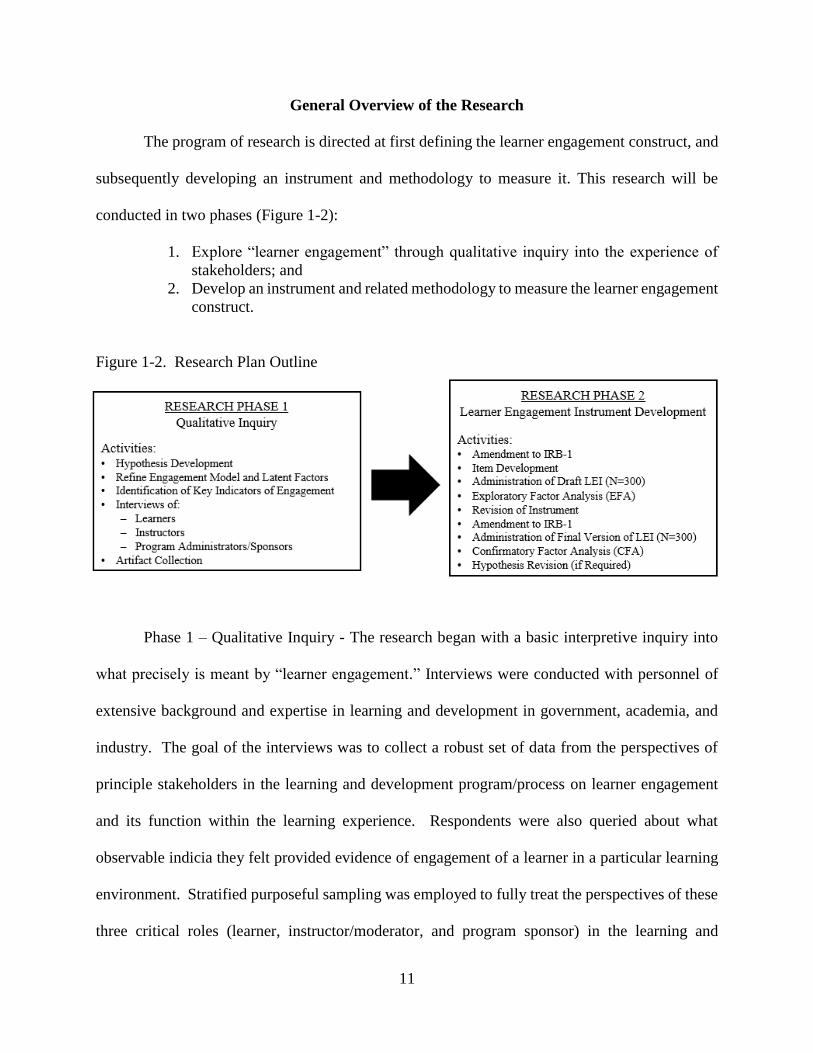
General Overview of the Research
The program of research is directed at first defining the learner engagement construct, and
subsequently developing an instrument and methodology to measure it. This research will be
conducted in two phases (Figure 1-2):
1. Explore “learner engagement” through qualitative inquiry into the experience of
stakeholders; and
2. Develop an instrument and related methodology to measure the learner engagement
construct.
Figure 1-2. Research Plan Outline
Phase 1 – Qualitative Inquiry - The research began with a basic interpretive inquiry into
what precisely is meant by “learner engagement.” Interviews were conducted with personnel of
extensive background and expertise in learning and development in government, academia, and
industry. The goal of the interviews was to collect a robust set of data from the perspectives of
principle stakeholders in the learning and development program/process on learner engagement
and its function within the learning experience. Respondents were also queried about what
observable indicia they felt provided evidence of engagement of a learner in a particular learning
environment. Stratified purposeful sampling was employed to fully treat the perspectives of these
three critical roles (learner, instructor/moderator, and program sponsor) in the learning and
12
development domain. The interpretive inquiry approach began with open coding of data along a
topical or theoretical framework guided by the research question(s) of interest, then reduction of
the data through focused synthesis and aggregation of the codes into themes (Charmaz, 2006).
Code development and memoing were applied iteratively to provide deeper reading of the
qualitative data, informed by the initial open coding effort to fully contextualize the data across
data sources. As codes are identified and evaluated for relevance to the research, axial coding of
the data was applied to align the codes into categories. Categories, in turn, were evaluated by the
researcher to develop themes that provide insight into aspects of the research questions (Strauss &
Corbin, 1998) that would guide the development of items in the development of a learner
engagement instrument.
Phase II – Instrument Development and Validation –The next step in the research was to
operationalize the constructs identified in the qualitative inquiry by generating items for an
instrument designed to measure learner engagement. Based on the emerged themes and concepts
from the Phase I qualitative data along with a literature review, items were developed for the
three factors identified (Affective, Cognitive/Intellectual, and Environmental). Four content
experts were recruited based on their fields of expertise and professional experiences in learning
and development to conduct an Item Alignment Review. These experts reviewed the conceptual
definitions and the correspondence between the conceptual and the operational definitions. These
experts were prompted to provide qualitative feedback and substantive recommendations that
were then be incorporated into the construct definitions. From there, an item pool of 90 items
was developed for an item alignment review by content area experts as part of the instrument
validation. Items were evaluated for both relevance and alignment to the learner engagement
construct factors. The final draft instrument was developed from these candidate items that

13
demonstrated the best characteristics of relevance and alignment, and after IRB review and
approval as an amendment to the research proposal, administered to a sample population
(N=300). An Exploratory Factor Analysis (EFA) was conducted, the instrument revised based
on the factors and items and factor loading. At the conclusion of the EFA analysis, a revised
instrument was prepared, and an IRB-1 amendment filed. Upon approval, an administration of
the final version of the instrument (N=300) and Confirmatory Factor Analysis (CFA) was
conducted
Subsequent research following this study will further operationalize the model in
instructional delivery, using the indicia and artifacts identified in the qualitative study and
additional data collection methods such as Ecological Momentary Assessment (EMA) and
automated learner analytics to assess the dynamics of learner engagement within the learning
experience, and evaluate their effect on learner outcome.
Research Questions
Table 1-1 provides the research questions and underlying hypotheses of this study. It bears
noting that during the first phase of this research, it is likely that the hypothesis will be revised
based on the qualitative data collected. This is a natural and expected consequence of conducting
an interpretive inquiry (Strauss & Corbin, 1998).

14
Table 1-1.
Hypotheses and Corresponding Research Questions
Hypothesis Research Question(s)
The learner engagement
construct is defined in three
factors of:
1. Affective
2. Cognitive/Intellectual
3. Environmental
What are the perceived dimensions and
characteristics of learner engagement? (RQ1)
What experiences and perceptions of the learner, and
the interactions within the environment, affect learner
engagement? (RQ2)
What observable indicia exist of the learner-
environment unit of analysis for engagement of a
learner in a particular environment? (RQ3)
How can those experiences, perceptions, and
interactions be used to develop a model of learner
engagement? (RQ4)

15
Chapter 2
Literature Review
Workforce Development & the Adult Learner
The target population of this study is adult learners that have or are currently engaged in
some form of professional training experience. In contrast to the advanced and well-grounded
theories in early development and education from researchers such as Piaget (1964) and Vygotsky
(1962), the dynamics and characteristics of adult learning in the workforce were not well addressed
until the late 20th century. In the early 1970’s, Dr. Malcolm Knowles noted that this training context
was fraught with unique challenges largely derived from the characteristics of the learner
(Knowles, 1973). Knowles noted that adult learners face a variety of different challenges towards
committing to the instructional experience (the term “engagement” did not emerge until much later
than his original treatise), and as such, the benefit of the instruction must be patent to the learner.
From this analysis, Knowles developed an approach to instructional content and methodology that
required an adaptation to the needs and intentionality of adults as learners – he termed this
approach andragogy, a term “used by my colleagues in Yugoslavia” (Knowles, 1973, p. 40). He
noted that, “most scholars in the field of adult education itself have dealt with the problem of
learning by trying to adapt theories about child learning to the ‘differences in degree’ among
adults” (Knowles, 1973, p.34).
Of interest to this study, Knowles and his research progeny focus entirely on the
externalities of the learner – the content, the job requirement, etc. and the perception of the adult
learner in the value of the instruction (Caffarella, Baumgartner & Lisa, 2007). As professional
development and workplace instruction expanded in both scope and treatment, researchers
repeatedly found that self-direction and readiness to learn (the mitigation of typical barriers to
16
participation – resources, etc.) were predictive of reduced attrition in adult learning contexts (Park
& Choi, 2009). Adult learning researchers, however, take prima facie the concept of perceived
relevance and/or utility when instructing the adult learner (McIver, Fitzsimmons, & Flanagan,
2016). Their andragogical construct stops at the instructional treatment and treats the perception
of the adult learner as a static characteristic resulting from the appropriate instructional design and
delivery method (Mirriahi, Alonzo & Fox, 2015) – essentially saying, “build the content for adults,
and they will come.” Since its introduction and review, Knowles’ characterization of adult learners
as possessing unique requirements and needs has led to extensive criticism that the construct is not
a theory, but rather a simplification of a more complex model for learning (Norman, 1999)
Constructs of Learner Engagement
The challenge of applying an andragogical model from Knowles’ line of research to define
engagement is that the externalities of adult learners are only part of the puzzle – adult learner
engagement as a construct requires a more complex analysis of learners’ experiences and
perceptions rather than relying on implicit assumptions of them based on guidance around content
development and delivery. Perhaps the first constructive approach to learner engagement was in
the pre-secondary education context in the 1980s, derived from a line of research into attrition in
public education (Miller, Leinhardt, & Zigmond, 1987). In Finn (1989), a learner model relating
to the concept of engagement (and subsequent persistence in school) is described as a two-factor
model, consisting of a behavioral component relating to observable participation in class and
school and an affective component relating to a sense of identification with the school community
and a sense of belonging. Citing Miller et al. (1987), Finn (1989) notes “the student’s engagement
in at least one sub-component …is necessary (and may be sufficient) for keeping at risk students
in school” although noting (at the time) “little research to help design interventions” to enhance

17
engagement” (p. 133). This early research did little to define a formal psychometric model of
engagement but rather focused on observable learner behaviors (e.g. deciding to attrite or not to
attrite, participate in activities, etc.).
Also working in the domain of public education, Newmann, Wehlage, and Lamborn (1992)
advanced the definition of student engagement with the introduction of a within-the-learner factor
separate and distinct from learner characteristics such as motivation, noting “conceivably students
can be motivated to perform well in a general sense without being engaged in the specific tasks of
school.” The researchers propose a model derived from “need for competence” that is expressed
through a sense of belonging to the school (belonging) and performance of perceived authentic
work (behavioral) (Newmann et al., 1992, p. 18) (see Figure 2-1).
Figure 2-1 A Model of Engagement (Newmann et al., 1992, p.18)
The sense of belonging with the school derives from a perception of “the general enterprise

18
of schooling as legitimate” and a sense of alignment between the goals of individual and the goals
of the school that develops “when students establish affective, cognitive, or behavioral connections
to the institution” (Newmann et al., 1992 citing to Wehlage et al. (1989), p.20). The model as
proposed relied heavily on observable indicia of engagement, ranging from self-declared intent to
frequency of participative activity, and the authors offered no means of measuring student
engagement other than frequency of discerning learner behaviors.
One of the limitations of Newmann et al. (1992) is the “need for competence” latent factor
as a construct and the lack of any form of measuring it – limitations addressed by Marks (2000)
and its progeny. Marks’ (2000) construct incorporated the learning environment through research
of Bronfenner (1979) in ecological support structures in learner (termed an “exosystem” in the
study), although obliquely as a mechanism for facilitating participative behavior rather than a
factor of engagement in and of itself. In developing measures, Marks (2000) defined a construct
(“student engagement in instructional activity”) with four component measures – two of which
were behavioral in nature (student effort and assignment completion) and two affective in nature
(attentiveness and lack of boredom). Her experimental design controlled for a variety of learner
characteristics employed a 3-level hierarchical linear model to determine whether the measured
factors were sufficient to define the construct. Factor invariance and dependency aside, the
research reflects an important step in the evolution of learner engagement as proposed in this study
– namely, that the learning environment figured in the calculus of learner engagement, and within-
the-learner factors alone were insufficient to address the construct (Marks, 2000). This line of
research has continued in research using analytics derived from learning systems to assess learners
engagement using behavioral measures as part of its calculus, albeit within only one specialized
learning environment and instructional treatment (Kahn, Everington, Kelm, Reid, & Watkins,
19
2017; Manwaring, Larsen, Graham, Henrie & Halverson, 2017).
Appleton et al. (2006) advanced the construct by seeking declarative data from respondents
related directly to their perceived sense of engagement and employing a more advanced within-
the-learner engagement model composed of two factors – intellectual and emotional. Appleton’s
research, like its information processing antecedents, however, failed to contemplate the entirety
of the learning experience, instead developing an entirely within-the-learner model and eschewing
Marks’ (2000) inclusion of an ecological perspective. This approach fails to measure the causal
relationships of learning environments with outcomes from the ecological and situated perspective
(Young, et al., 1997). Despite compelling differences and benefits to educational practice, little
qualitative or quantitative investigation has been conducted with a diverse learner audience to
understand the effect of various aspects of learning environments on the learner, and in particular
these effects on the learner’s attitudes, behaviors, perceptions, and performance while learning.
More recent research has expanded Appleton’s construct to address the lack of observable
behavior (and reverting to that proposed by Marks (2000). Trowler (2010) notes that engagement
is “more than involvement or participation – it requires feelings and sense-making as well as
activity” (Trowler, 2010, p.7). Drawing on research from several sources, Fredericks, Blumenfeld,
& Paris (2004) first proposed a construct of learner engagement with a three-factor model:
behavioral (e.g., positive conduct, effort, participation), cognitive (e.g., self-regulation, learning
goals, investment in learning), while others remained firmly in a within-the-learner construct of
emotional and affective (e.g., interest, belonging, positive attitude about learning) Jimerson,
Campos, & Greif, 2003). As noted in a comprehensive literature review, Trowler (2010)
summarizes the factors of learning engagement construct as:
1. Behavioral: relating to students’ actions. For example, class
attendance, submission of work, contribution to class discussion, or
20
participation in school-related activities (e.g., extra-curricular sports or
school governance).
2. Emotional: relating to students’ affective reactions in relation to their
learning. For example, an emotionally engaged student might report that
they were interested in their course and that they enjoyed learning.
3. Cognitive: relating to students’ psychological investment in their
learning. For example, the desire to go beyond the requirements of the
class and the adoption of metacognitive learning strategies.
In contrast to earlier studies, Trowler (2010) makes several key assertions regarding the construct
of learner engagement:
1. Engagement does not always have to be positive: a student could be negatively engaged if
they report dislike or anxiety towards their learning. Thus, attrition can be the result of
negative engagement rather than an absence of positive engagement;
2. Learner engagement is a dynamic construct within the learning experience; and
3. A measurement of learner engagement relies solely on observable behaviors of the learner
to assess engagement.
Subsequent work on these concepts by Wang and Eccles (2013) used a longitudinal study to look
at learner engagement construct changes over time, applying a construct that measured in years as
the timeframe for measurement of learner engagement.
Situated Cognition & Engagement
Gibson (1986) details a theory of ecological and situated cognition particularly apropos to
the environmental analysis of learner engagement. For situated cognitivists, the task of learning
is the confluence of a set of personal motives with a particular environment that provides
affordances to which the learner attunes his/her perception. Action and response to stimuli in the
learning process is based on those invariances of the environment that invite action (Gibson, 1986).
Each individual’s experience is thus unique to their perceptions and the affordances within a
21
particular learning environment that are both present and perceived in a constructivist context
(Mills, Bonner, & Francis, 2006) – previous studies eschew the perception and motivation of the
individual learner in favor of merely cataloging environment factors or behavioral artifacts and
measuring outcomes at a superficial level (Hodges, 2009).
Situated cognition as a theory of learning has potential in understanding learner
engagement as a dynamic construct within the learning experience for each learner. Central to
Gibson’s situated cognitivist model is that the interaction between action and environment in the
learning process is real time and ongoing - the learner takes action, prospectively perceives the
effect of action on the environment within the timeline of goals/objectives in that moment, the
subsequent environmental response, and takes subsequent action. A central tenet of this theoretical
framework thus focuses on the interaction perception, action, and environment that forms and
dissolves minute by minute while in the learning process. “A perceiving/acting agent is coupled
with a developing/adapting environment and what matters is how the two interact" (Young,
Kulikowich & Barab, 1997) - a learner in a particular environment, by definition, adapts perception
and interaction based on the environment in question. As this process continues, the learner refines
his/her perception to the environment and learning enhanced. “The environmental consequences
of actions produce new experiences that can draw the attention of the perceiver to new affordances
of the environment” (Young, 2004). A simple example is the question-and-answer paradigmatic
interaction between a learner (the one asking the question) and the environment (the rest of the
class, the instructor, etc.) – in asking a question, the environment responds, and the learner and
environment changes – more questions may be prompted from other learners, the instructor may
add a clarifying point of instruction, etc. Rather than simply observable behaviors of the learner,
the more relevant measure is the interaction of the learner and the learning environment and what
22
changes in engagement result in timeframe measured moment-to-moment.
Learning Environments & Learner Engagement
The focus on learning environment as an element of learner engagement is of concern,
because while adult learners in the workplace are essentially the same as those of 30 years ago,
learning environments are not. The use of educational technology and new instructional techniques
has advanced to become a prevalent practice in education, industry, and government over the last
30 years. Networked technology is now used to deliver and assess across a wide spectrum of
intellectual domains ranging from technical literacies and declarative knowledge to task
performance in immersive simulations to licensure and professional credentialing. The adoption
of a specific technology implementation in instruction is largely driven by operational
requirements and measured effects of “differences.” Since early research in the mid-1970’s, most
commentators have suggested that instructional delivery courses delivered online produce at least
comparable learning outcomes relative to traditional classroom-based courses (Sitzmann et al.,
2006), based largely on comparisons of summative assessment outcomes in the two delivery
methodologies. Clark (1994) claims that instructional outcomes are environment and media
independent and asserted that learner preferences or biases produced variance in learner
performance rather than any limitation of a particular environment. These assertions are largely
restricted to the specific instructional environment(s) measured and dismiss the extensive
difference in learner experience and capacity to interact in the learning experience in different
learning environments.
Confounding the issue of comparative analysis of delivery methods with respect to the
learner and their respective level of engagement is the variance of instructional experience and
outcome in two different instructional environments – a well-designed virtual online instructional
23
program often employs very different methods, activities, and approaches to delivery from its
traditional classroom analog (Clark, 1994; Sautter, 2007). Fundamentally, the environments that
employ educational technology are different from those that do not - additional variance in
program delivery stems from student attitudes and perceptions of technology, which can vastly
influence success in an online delivery format (Clarke III, Emerson & MacKay, 2011; Glasnapp,
Poggio, Poggio, & Yang, 2005). Recent research has begun to contemplate the learner and the
factors affecting learner retention – what keeps a learner in an instructional program – but fail to
go beyond typical demographic or attitudinal measures (Park & Choi, 2009). Moreover, these
studies eschew any form of analysis that would relate terminal outcomes to factors affecting
participation while in the learning experience. The question of “equivalence” of delivery
methodology between a technology-enhanced online learning experience and that of a traditional
classroom misses a fundamental point - many of the most salient measures of effectiveness for the
classroom experience are highly subjective or not captured at all, and informed by the individual
learner’s set of goals and objectives within that environment (Brown, Collins, & Duguid, 1989).
To date, nearly all research relating to technology adoption and implementation within an
instructional implementation for adult learners has focused on summative assessment of learning
outcomes and persistence. Commentators often refer to these data collectively as indicia of
“learner engagement”, yet there is a pervasive lack of any hypothesis relating to the development
and consequences of engagement in the learning process. These studies have largely ignored the
personal subjectivities and the unique characteristics of learning environments relating to the
learning experience in favor of quantitative data relating to assessments of outcome (Manwaring
et al., 2017). The few exceptions noted in the literature relate to vocational training and anecdotal
perceptions of worth assigned by the learner (Peltier, Schibrowsky, & Drago, 2007). This
24
approach to research fails to measure the causal relationship between engagement and learning
outcome from the ecological and situated perspective. Despite compelling differences and benefits
to educational practice, little qualitative or quantitative investigation has been conducted with a
diverse learner audience to understand and measure learner’s attitudes, behaviors, perceptions, and
performance while learning.
Conclusion
The adult learner in the workplace today is beset on all sides – the skills he/she possesses
have “a decreasing half-life,” the training environments used to develop new skills are inauthentic,
the technologies used in delivery can be unreliable or unfamiliar, and implementations are often
undertaken without any consideration of the needs or intentionalities of the learner. It then comes
as no surprise that persistence in such training implementations is poor, absent some organizational
mandate to complete it. The construct of learner engagement for adults in the workforce is still
nascent – much of the research in learner engagement today is directed at primary and secondary
education and addressing the important issues there. However, drawing from extant research and
addressing its shortcomings allows for the development of a robust model that, if properly used to
guide implementation of training, will provide a roadmap for workforce development that is
effective and resource efficient. The first step in that process is to clearly articulate what learner
engagement is, including elements of cognitive, affective, and environmental factors, and
determine how to measure it.

25
Chapter 3
Methodology
Investigating the Construct of Learner Engagement
Through Sequential Mixed Methods
This chapter presents the method used for development of the learner engagement construct.
and subsequent scale development This research study was conducted in three stages, starting with
a qualitative, basic interpretive inquiry into learning experiences and the concept of learner
engagement, and will culminate in development of a quantitatively supported prescriptive model
of instructional treatment and delivery leveraging specific environments customized for particular
learning outcomes. This program of research is directed at first defining the learner engagement
construct, and subsequently developing an instrument and methodology to measure it. This
research was conducted in two phases:
1. Explore “learner engagement” through qualitative inquiry into the experience of
stakeholders; and
2. Develop an instrument and related methodology to measure the learner engagement
construct.
To further refine the focus of the study, the research was framed around four research
questions:
1. What are the perceived dimensions and characteristics of learner engagement? (RQ1)
2. What experiences and perceptions of the learner, and the interactions within the
environment, affect learner engagement? (RQ2)
3. What observable indicia exist of the learner-environment unit of analysis for the
engagement of a learner in a particular environment? (RQ3)
4. How can those experiences, perceptions, and interactions be used to develop a model
of learner engagement? (RQ4)
This chapter describes the methodology and procedures employed in developing a learner
engagement construct and then, developing and validating an instrument to assess this construct
model using a sample of learners from the population of adult learners who participate in periodic

26
vocational or professional development training. It outlines the research design, participant
characteristics, data collection procedures, data analyses procedures, and limitations of the
methods used in the present study.
Research Design – Phase I – Basic Interpretive Inquiry
The Phase I portion of this research employed a basic interpretive qualitative study to
investigate the perceptions of a variety of professional training stakeholders in typical vocational
training settings. A basic interpretive qualitative study (Merriam, 2002) was deemed
particularly appropriate, given the innovative application of a situated cognition framework in
this domain. Basic interpretive is a methodology of inquiry associated with a qualitative
research that seeks to create theoretical categories from collected data and then analyze
relationships between key categories (Charmaz, 2006). The main purpose of using a basic
interpretive approach is to develop a hypothesis through identification and classification of
concepts that are related by means of statements of relationships (Strauss & Corbin, 1998). For
this study, the experience of the research participants (i.e., how they construct and perceive
their learning environment as they learn), how they develop relationships between those
perceptions, their respective set of intentions while learning, and the evaluation of the learning
outcome outlined the basic structure and factors of the learner engagement construct.
Within this proposed study, the research considered the interactions and perceptions of
instructional program stakeholders (including learners, instructors, designers, and
sponsors/administrators), and aggregated these data into categories. A combination of structured
interviews, observational data from corresponding instructional deliveries, and artifact collection
from corresponding instructional deliveries were conducted to fully capture both individual and
group data in the learning environment (see Appendix A). As one characteristic of interest in the
27
learning environment is the dynamic between individuals within the learning environment, both
self-reported emic and etic observational data were collected as part of the interviews to assist in
the conduct of the basic interpretive study. Similarly, participants with diverse professional
contexts and differentiated learning environments were specifically chosen through purposeful
sampling to facilitate the emergence of persistent categories within the data (Merriam, 2002)
independent of a specific instructional subject area or learning environment.
During analysis of the data, a situated cognition framework (Brown et al., 1989) was used
to develop the central concept and related concepts of a qualitative study, wherein the effectiveness
of learning and pedagogical method are largely defined by both the assessed outcome and the
individual and his/her perception of the learning experience, rather than the environment or
outcome alone (Lave & Wenger, 1991). This framework was routinely referred to during analysis
to guide the basic interpretive inquiry into learner engagement. While several qualitative
methodologies could be applied to these research questions, basic interpretive methodology was
selected to allow the definition and factors affecting learner engagement to emerge from the data
collected, rather than initiating research into the experience of the learner with a variety of
predefined concepts against which to develop themes (Chamaz, 2006). This approach was adopted
to enhance transferability of the research to a variety of learning environments in subsequent
studies (Merriam, 2002).
Sampling – Phase I
Candidates for this stage of the research were identified through purposeful stratified
sampling of participants, instructors, and program administrator/sponsors in traditional and online
professional development programs in industry that provide different perspectives into the same
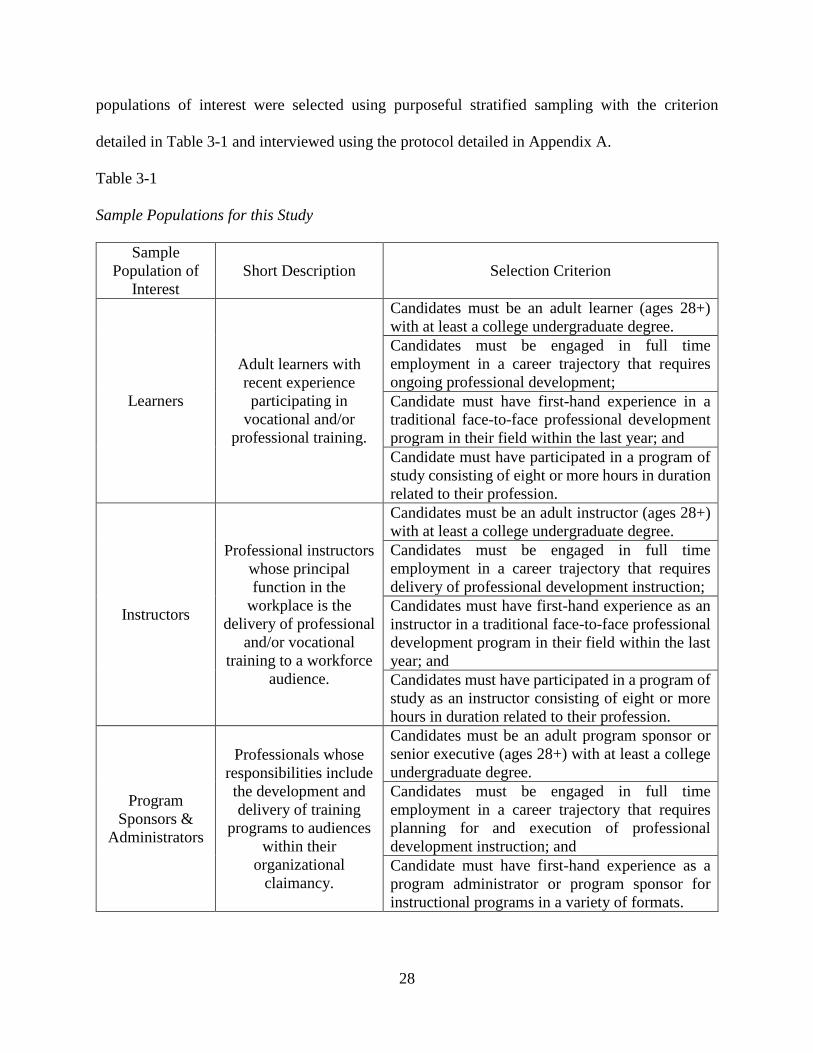
instructional domain (Creswell, 2000; Creswell & Creswell, 2016). Four subjects from each of the
28
populations of interest were selected using purposeful stratified sampling with the criterion
detailed in Table 3-1 and interviewed using the protocol detailed in Appendix A.
Table 3-1
Sample Populations for this Study
Sample
Population of
Interest
Short Description Selection Criterion
Learners
Adult learners with
recent experience
participating in
vocational and/or
professional training.
Candidates must be an adult learner (ages 28+)
with at least a college undergraduate degree.
Candidates must be engaged in full time
employment in a career trajectory that requires
ongoing professional development;
Candidate must have first-hand experience in a
traditional face-to-face professional development
program in their field within the last year; and
Candidate must have participated in a program of
study consisting of eight or more hours in duration
related to their profession.
Instructors
Professional instructors
whose principal
function in the
workplace is the
delivery of professional
and/or vocational
training to a workforce
audience.
Candidates must be an adult instructor (ages 28+)
with at least a college undergraduate degree.
Candidates must be engaged in full time
employment in a career trajectory that requires
delivery of professional development instruction;
Candidates must have first-hand experience as an
instructor in a traditional face-to-face professional
development program in their field within the last
year; and
Candidates must have participated in a program of
study as an instructor consisting of eight or more
hours in duration related to their profession.
Program
Sponsors &
Administrators
Professionals whose
responsibilities include
the development and
delivery of training
programs to audiences
within their
organizational
claimancy.
Candidates must be an adult program sponsor or
senior executive (ages 28+) with at least a college
undergraduate degree.
Candidates must be engaged in full time
employment in a career trajectory that requires
planning for and execution of professional
development instruction; and
Candidate must have first-hand experience as a
program administrator or program sponsor for
instructional programs in a variety of formats.
29
The sampling in each of these sample populations sought variance in relevant cultural
dimensions (e.g., gender, race/ethnicity, technical background, instructional domain) to achieve
data saturation in theme development. Following initial coding, axial coding of the interview
transcript was employed to identify the key categories used to develop a learner engagement
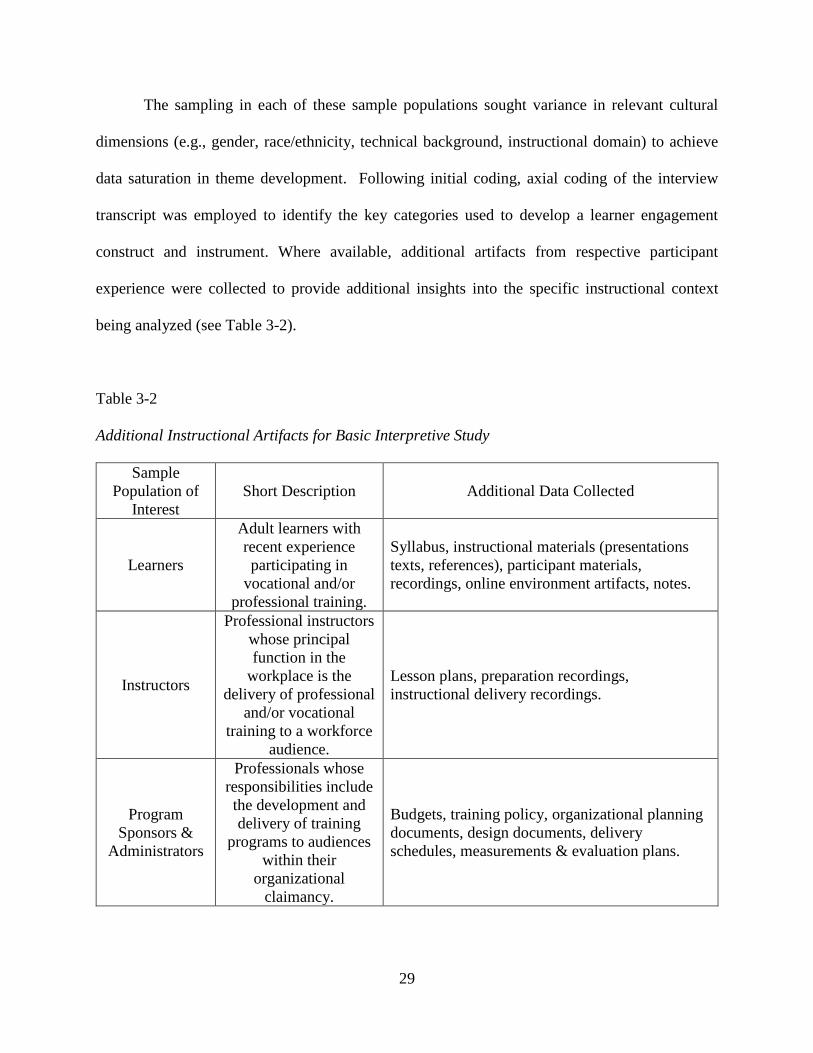
construct and instrument. Where available, additional artifacts from respective participant
experience were collected to provide additional insights into the specific instructional context
being analyzed (see Table 3-2).
Table 3-2
Additional Instructional Artifacts for Basic Interpretive Study
Sample
Population of
Interest
Short Description Additional Data Collected
Learners
Adult learners with
recent experience
participating in
vocational and/or
professional training.
Syllabus, instructional materials (presentations
texts, references), participant materials,
recordings, online environment artifacts, notes.
Instructors
Professional instructors
whose principal
function in the
workplace is the
delivery of professional
and/or vocational
training to a workforce
audience.
Lesson plans, preparation recordings,
instructional delivery recordings.
Program
Sponsors &
Administrators
Professionals whose
responsibilities include
the development and
delivery of training
programs to audiences
within their
organizational
claimancy.
Budgets, training policy, organizational planning
documents, design documents, delivery
schedules, measurements & evaluation plans.

30
The intent of this supplemental data collection effort is to collect relevant materials that are directly
related to the interview data collected to provide a more robust context for the instructional
delivery. This study employed routine engagement activities that include member checks and a
protocol for communication that ensured a complete and accurate measure of the stakeholders and
their experience (Shenton, 2004).
Analysis Method– Phase I
Observational, interview and artifact data were open coded to contextualize the data into
categories (Pidgeon, 1996). Axial coding was performed concurrently by the researcher and two
peer researchers to facilitate the identification and refinement of categories into concepts and
defining how these concepts are related (Ruona, 2005). Member checks (n=7) were conducted
with participants where supplemental data or clarification was desired and to ensure that the coding
adhered to the initial intent of the participant (Merriam & Grenier, 2019; Shenton, 2004). The
constant comparison method of analysis (Strauss & Corbin, 1990) was employed to identify the
central concepts by persistent review of all data from all sources to establish and refine the
relationship of the central concepts to other concepts that are identified. At every stage, the
researcher sought validation of qualitative data through triangulation method and reviews for
internal consistency within item responses (Shenton, 2004). The central concepts identified in this
analysis were used as factors in subsequent model definition and instrument development (Bulger,
Mayer, Almeroth, & Blau, 2008).
Research Design – Phase II – Construct/Factor Definition & Instrument Development
The second phase of this research was directed at the formal measurement of the construct
by construction of orthogonal factors, developing content validity evidence for the construct, and
operationalizing the construct in an affective instrument. The first step in developing evidence of
31
content validity consisted of two experts reviewing the conceptual definitions and the
correspondence between the conceptual and the operational definitions of the factors comprising
the construct of interest. These experts were prompted to provide qualitative feedback and
substantive recommendations that were incorporated into the construct factor definitions. The
experts held a Ph.D. (n = 3) and had expertise in cognition and instruction, as well as operational
experience in the adult/workplace learning industry or human resource development experience in
both practical and academic practices in relevant fields for at least 15 years. Drawing from an
extensive body of instruments relating to learner affective and cognitive measures, personal
experience working in the field, and the results from the qualitative study, items were developed
and reviewed for alignment along the three dimensions of interest. The initial candidate list was
generated through informal discussions with practitioners in the field as well as a literature review
of the current instruments relating to learner engagement for factors shared between those and the
construct under research. While many of these instruments individually suffer from limited
construct validity or applicability across multiple instruction contexts (Appleton et al, 2006), this
study conducted a broad survey of the body of instrumentation to elicit persistent themes and items
stems for further evaluation and development within this study. While the methodology followed
involved generating unique items, the factors and underlying themes of other instruments were
thought to provide some opportunity at a later date of developing criterion validity in follow-on
research. The learner engagement construct was operationalized by generating a candidate pool of
thirty items per factor (a total of ninety items). This candidate item list was then reviewed by the
panel of three experts that reviewed the construct in the field to identify which items were
redundant or confusing. As in the first review, the experts held a Ph.D. (n = 3) and had expertise
in cognition and instruction, as well as operational experience in the adult/workplace learning
32
industry or human resource development. All of them had experience in both practical and
academic practices in relevant fields for at least 15 years. Items identified as redundant or
confusing were either discarded or revised, with the intent of conducting a content validity analysis
of at least eighteen items per each of the three factors identified, with the intention of final selection
of six to eight questions per factor following item content validation (Grant & Davis, 1997).
For item validation, a panel of six content area experts were recruited to review the
instrument and candidate items in order to evaluate the relevance and dimensional alignment of
the items within the construct of interest (Gable & Wolf, 1993). The experts selected for reviewing
the draft instrument items included academic researchers in measurement/assessment, cognition,
and instruction, and adult education. In addition, four doctoral practitioners from government and
industry with current experience in the areas of adult professional development and training were
recruited from across the United States. Experts participating in the content validity review were
provided the background of the study, the construct of interest with detailed factor definition, a
copy of the draft instrument items, instructions, and a form soliciting feedback on relevance,
strength of association, and qualitative comments. The purpose and significance of the content
validation study was explained together with the potential uses of the instrument in the field (see
Appendix B – Content Validation Survey).
An item alignment rating scale was defined to allow experts to evaluate the dimensionality
of each item defined along the factor structure relating to the individual construct factors, as well
as an option for none of the factors. A classification rating was also solicited to allow the
researcher to self-evaluate the level of certainty with which items were classified. This index
allowed for redaction of draft items that failed to achieve a certainty rate of 0.80 for which factor
the item loads on (Gable & Wolf, 1993).
33
A relevance rating scale to the identified factor was solicited to allow experts to rate each
separate item by using the five-point Likert scale. This approach was used to quantitatively analyze
agreement for each item and the entire tool, as well as direct relevance of the items to its associated
factor. With the data collected, the researcher then conducted a content validity analysis to develop
a Content Validity Index (CVI) to establish proportion/percent agreement among the experts
(McCoach, Gable & Madura, 2013). The proportion of items receiving ratings of 4 and 5 (the
strongest alignment scores in the scale) constitute the actual CVI, and any items rated below a
normalized score of 0.75 were eliminated. Items were considered to have adequate content validity
if they achieved a relevance agreement of 0.875 or higher. Items with relevance scores ranging
from 0.75 to 0.875 agreement were further reviewed for adequacy using any qualitative data
collected on those items from the expert review and reworded/revised accordingly. Items were
discarded or revised if they were found to have unacceptable content validity with an agreement
of 0.75 or lower. A draft Learner Engagement Instrument (LEI) composed of all of the remaining
items was created from the candidate pool of items found to satisfy all the content validity criteria,
balancing the number of items per factor as much as possible (see Appendix C).
Sampling Method– Phase II
With a draft LEI developed, a sample of respondents for a pilot phase were drawn from a
population of working adults in the United States who had participated in an instructional program
related to professional development in the past twelve months. A research protocol was approved
by the University of Connecticut Institutional Review Board (IRB) that included measures for data
security, consent, and anonymization using online recruitment via Amazon Mechanical Turk.
Amazon Mechanical Turk is an online resource that provides a crowd-sourced distributed
sampling platform for data collection. A variety of screening and performance filters are available

34
to enhance the reliability of the data, including those detailed for this study drawing only from a
verified respondent sampling population. Amazon Mechanical Turk is appropriately deemed
convenience sampling (cite), but does provide some significant benefits to research, most notably
the speed and capacity to collect large and diverse data sets. Research in Amazon Turk and similar
platform demographics and data reliability are mixed, but do consistently find that samples are
more diverse than those from traditional methods in regard to socioeconomic status and are more
geographically distributed (Buhrmester, Kwang, & Gosling, 2011; but see (Ophir, Sisso, Asterhan,
Tikochinski, & Reichart, 2019). Moreover, empirical studies have shown that the data collected
from internet is as reliable as those collected in traditional methods, and in fact statistical power
can be enhanced from traditional convenience sampling methods through the use of filters in the
respondent population (Thomas & Clifford, 2017). The sample of adult learners (n=300) were
recruited from a population of adult workplace learners and stakeholders coupled with a
coordinated campaign of social media recruitment. All responses obtained through the blind online
platform were screened for employment status and residency as meeting the criteria for
participation. All rights of the subjects were protected such that no one person’s response could be
identified, either through survey code markings or any other method. A summary of the respondent
sample for the EFA detailing demographics and industry classification is provided in Appendix D.
Analysis Method – Phase II
The data from the pilot study was subjected to an EFA to “explore the dimensionality of
an instrument by finding the smallest number of interpretable factors needed to explain the
correlations among set of items” (McCoach, et al., 2013). The analysis consisted of:
1. Screening for missing or miscoded data
2. Evaluating the data for suitability of EFA
35
3. Factor extraction, rotation selection
4. Evaluation of item and sub-scale performance
5. Revision of the LEI (if indicated by the EFA)
6. Structural Validity/Subscale Analysis
7. Reliability & Descriptive Statistics Analysis
Data Screening: The data was screened for univariate outliers and list-wise missing data.
Of note, the instrument was implemented in such a way that missing or incomplete data precluded
successful completion by the participant and compensation. Preliminary analysis at this stage of
the analysis focused on determination of the appropriate number of factors for formal EFA.
Suitability for EFA: To evaluate the appropriateness of conducting EFA, some basic
statistical analyses were conducted, including Kaiser-Meyer-Olkin measure of sampling adequacy
and Bartlett’s test of sphericity. In addition, the analysis applied criteria from Lackey et al. (2003)
to assess Measures of Sampling Adequacy (MSAs) in the anti-image correlation matrix. Finally,
the communalities values for all items were evaluated for correlation of items with each other such
that EFA is appropriate (McCoach, et al., 2013).
Number of Factors to Extract: With suitability for EFA established, a preliminary factor
analysis was conducted on the data to determine the number of factors to extract from the data
(McCoach, et al., 2013). Analysis employed a “holistic” approach (McCoach, et al., 2013) that
considers several criteria, including Kaiser’s criterion (eigenvalue (λ) > 1.0), Scree Plot
Evaluation, Parallel Analysis (both Principal Component Analysis (PCA) and Principal Axis
Factoring (PAF)), and Minimum Average Partial Procedure (MAP) (McCoach, et al., 2013).
Lastly, composite scores were calculated for each of the factors, based on the mean of the items
which had their primary loadings on each factor. The skewness and kurtosis of these score data
36
were evaluated for normal distribution.
Revision of the LEI: Following the EFA, items within the LEI found to improperly load or
otherwise identified as poor indicators for sub-scale trait were either redacted from the model or
amended to address the deficiency. Similarly, items demonstrating strong negative partial
correlation were revised to ensure they remain aligned to their instrument while eliminating their
model-irrelevant correlation. Additional revision of items was performed to ensure a complete LEI
with all items loading on one of the three factors was prepared for reliability analysis and follow-
on CFA.
Subscales Analysis/Structural Validity: The EFA results were used to develop the final
subscales of the LEI. The subscales correspond the latent factors of the learner engagement
construct, and “reflect the judgmental categories from which the conceptual and operational
definitions of the affective characteristic were developed” (McCoach, et al., 2013). In evaluating
the results, analysis consisted of a thorough review of the aggregations of items suggested by the
EFA loadings (Fabrigar, Wegener, MacCallum, & Strahan, 1999), and factor definitions were
refined and further defined in the model (Fabrigar & Wegener, 2012).
Reliability & Descriptive Statistics Analysis: Reliability of the revised LEI subscales was
tested by conducting an Item Analysis and calculating Cronbach’s α and developing sum scores
and descriptive statistics pertaining to those scores. For examination of the distributions of each
item responses and the relations of each item with others and the entire survey, item analyses were
conducted, including item-total correlations for each item and Corrected Item-Total statistic
(revised correlation modelling the instrument/subscale with the item deleted). In the aggregate,
this information indicates the degree to which the items are related to each other, and to the
aggregate sub-scale. Then, items whose item-total correlations were below a cut-off criterion of

37
0.20 (Thompson, 2004) were examined for redaction from the instrument. Negative item
correlations (if any) were also analyzed, as these are indicia of poor correlation with the desired
sub-scale and/or need for reverse scoring or redaction.
Cronbach’s Alpha (α) coefficient was calculated for each of sub-scales, evaluating both the
value and the Confidence Interval to ensure adequate reliability under the constraint of tau-
equivalence of indicators, where the entire CI for Cronbach’s Alpha should be > 0.80 (Raykov,
2001). In addition, Cronbach’s Alpha was evaluated for instruments with each item within each
subscale removed to further assess model robustness by evaluating the removal of individual items
within subscales to evaluate the individual contribution of each item to modeling the total variance
observed within each subscale. Values and variance of Inter-Item Correlations were evaluated to
determine the level of redundancy between items and ensure that the variance/standard deviation
of these statistics is low (preferably σ < 0.1). In addition, mean scores and standard deviation of
the response data within each sub-scale were evaluated for normality and appropriate distribution
of response data (skew/kurtosis) to ensure the data represents the population response pattern and
was appropriate for analysis.
Confirmatory Factor Analysis (CFA): Following the EFA, items within the LEI found to
improperly load or otherwise identified as marginal indicators for sub-scale trait were amended to
better align with the subscales identified with the EFA. Items demonstrating strong negative
partial correlation were revised to ensure they remain aligned to their instrument while eliminating
their model-irrelevant correlation. Additional revision of items was performed to ensure a
complete LEI with all items loading on the construct of interest factors was prepared for reliability
analysis and follow-on CFA analysis on a new sample. A summary of the respondent sample for
the CFA detailing demographics and industry classification is provided in Appendix D.

38
Following collection of an independent second sample from the same population, CFA was
used to evaluate fit of the learner engagement model drawn from the EFA to alternative models.
The objective of CFA was to test how well the empirical data fits the hypothesized latent learner
engagement model. A variety of fit criteria evaluated model fit, including Kline’s (1998) criteria,
Comparative fit index (CFI), the root-mean-square error of approximation (RMSEA), and the
standardized root-mean-square residual (SRMR). Lastly, the underlying model and hypothesis
was reviewed based on the results of the CFA for subsequent research.
39
Chapter 4 – Results
Introduction
This research employed an exploratory sequential mixed methods design (Creswell,
2018) to answer the research questions because there are no instruments or structured
measurement methods based on a situated cognition theoretical framework that assesses
dimensions of learner engagement. Initially, qualitative data was obtained to design the learner
engagement instrument and subsequently the designed instrument was administered to two
representative samples to quantitatively validate its construct validity. This chapter presents
results of the study in three sections. The first section presents the results of the phase I
qualitative study and the phase II content validation and describe dimensions of the initial
instrumentation developed from the themes that emerged from qualitative data and expert’s
judgment. The second section presents the EFA results from the initial instrument
implementation in the population of interest, analysis of item performance, construct definition,
and decisions relating to individual item redaction/revision. The final section presents the
CFA results from the revised instrument implementation in the population of interest and final
reliability analysis of the construct and item performance. Lastly, instrument validity and
additional analyses that further examine the utility of the construct and instrument is provided.
Phase I – Qualitative Study
As a first step in researching the learner engagement construct, this study sought to elicit
insights in the perceptions of learning and development professionals working with the population
of interest. The research questions in the qualitative inquiry were necessarily limited in scope to
prevent confounding multiple factors and influences with those relating to over work and
professional attitudes, experience, etc. The goal of the qualitative inquiry was to more fully define

40
factors that could be explored applying qualitative measurement techniques to understand the
construct. Creswell and Plano-Clark (2018) characterize this type of mixed method research as
“exploratory sequential design” wherein the “qualitative method can help develop or inform the
second, qualitative method” (p. 84, citing Greene et al., 1989). This initial study examined
individual thoughts and experiences on several “sides” of the instructional experience – that of the
learner, the instructor, and the program sponsor or manager. The questions derived in the interview
protocol (see Appendix A) for this study were administered to both collect qualitative data relating
to three research questions of this study relating to learner engagement wherein some of the factors
associated with the construct of interest are not well defined in the current literature (Creswell,
2018):
1. What are the perceived dimensions and characteristics of learner engagement? (RQ1)
2. What experiences and perceptions of the learner, and the interactions within the
environment, affect learner engagement? (RQ2)
3. What observable indicia exist of the learner-environment unit of analysis for the
engagement of a learner in a particular environment? (RQ3)
In this fashion, the questions developed sought to balance open-ended inquiry against the
practicalities of asking questions that evoked meaningful responses that could be used to both
refine the question and develop themes relating to learner engagement in constructivist framework
(Patton, 2015).
The interview protocol was implemented to collect impressions, opinions, and perceptions
as they relate to the experience of a typical learner (Seidman, 2013), as well as relevant artifacts
(policy documents, syllabi, learner notes, etc.) related to the instructional experiences discussed.
Probes relating to the differences of any particular learning experience from the traditional
instructional environment were also utilized. The artifacts were employed in several interviews
to guide a discussion regarding the perceptions of the instructional experience from the perspective
of the learner, the instructor, and the program sponsor. Of note, the role of the artifacts varied

41
from group to group – learners used the artifacts (and in particular, presentations and syllabi) to
recount specific perceptions and experiences, instructors used their facilitation guides and notes to
describe their desired treatment and learner experience during delivery, and the program sponsors
used them as evidence of training conducted and outcomes achieved. The data collected provided
insight into the totality of experience in the learning environment while conforming to the general
precepts of a constructivist framework wherein the themes emerge from the data (Patton, 2015).
In addition, further analyses of these themes and the artifacts relating to individual instructional
experiences were conducted to determine whether relationships exist between learner-perceived
level of engagement in an instructional experience and subsequent outcome. The purpose of the
phase I study was to develop and define the general dimensions underlying learner engagement
applying a situated cognition framework. From the literature review, recent studies identify
general learner engagement constructs with an affective, a cognitive, and a behavioral aspect,
which collectively fail to address the underlying latent intentionality of the learner-environment
unit of analysis, instead choosing to substitute some form of frequency measure based on
observational data (Fredricks, Bloomfield & Paris, 2004).
I began the analysis with repeated readings of the transcripts and then proceeded to open
coding of the data (Patton, 2015). As noted by Patton, the repeated readings permit meanings and
patterns to emerge, and concurrently allow the researcher to gain “an understanding of the themes
and events covered in the text” (Thomas, 2006, p. 241) before committing to codes and a coding
schema. The initial set of readings was meant to provide context and meaning for the entire set
interviews across all interviewees. All the transcripts were read in this manner before any coding
of the transcripts was conducted (Thomas, 2006). Open coding of the transcripts was performed
that consisted of the researcher reading each response in its entirety, and then focusing on the
42
meaning of each phrase, identifying it as a code, and noting any particular context or meaning
(Patton, 2015) to seek solitary meaning within each phrase or line of discourse (Thomas, 2006).
In vivo codes were found to be very effective for developing an overall sense of the transcript, an
analytic approach recommended by Patton (2002) as providing the “cumulative core content of the
interviews” (p. 240). Shorthand summary terms for each selected code in the margin and basic
iconography were employed to identify repeated terms across interviews, particular emphasis, etc.
In several cases, the actual video recordings were used to evaluate the specific meaning of the
speaker – largely the use of body language and visuals to emphasize a particular point.
After open coding the data from each interview and reviewing relevant artifacts (where
collected), research memos were developed from the notes and related parentheticals. The process
included general impression of the interviewee, the spoken (and unspoken) meanings interpreted
from the data, as well as the loose open codes that appear to repeat across participants in an effort
to develop “a heightened sensitivity to the meanings contained therein” (Birks, Chapman, &
Francis, 2008, p. 69). The actual mechanics of developing the memos proved to be of significant
assistance in follow-on development of categories and themes – the repeated review of open codes
and collapsing of codes into others prompted further review of the data and subsequent analysis,
and the framework of the results thereby emerged (Birks, et al, 2008). After the open coding
process was complete, word processing software was used to compile all of the codes, phrases,
and in vivo comments from each interview to code comment tags, color code emerging categories,
and conduct spell checking/frequency count/word count to develop consistency across all
transcripts. The data were then reviewed in three iterations several days apart for occurrences of
categories within each interview transcript by both the researcher and a peer reviewer, with the
intent of returning to the data unbiased by recent analysis. In the content analysis, categories were

43
identified broadly to accommodate multiple codes and (mostly) preclude overlap. Synthesis of
categories was achieved by examining the relationship between categories and the underlying
codes – seeking no overlap of where a code “belongs” (Saldana, 2013). In addition, category
development was refined through the evaluation of the relationship of each category with the
others and the research questions.
As a next step, the categories were axially coded along relational lines to affirmatively link
categories to codes that define its meaning (Strauss & Corbin, 1990). An organizational taxonomy
proposed by Strauss and Corbin (1998) was applied wherein categories were further refined along
the phenomenon (in this case, the instructional experience), the context of the phenomenon, the
implementation of the phenomenon, and the consequences of the actions/interactions related to the
phenomenon. Of note, the operationalization of most corporate training contexts was found to
align well with this taxonomy, and category aggregation assisted in evaluating the relevance of
each category to the research questions. Within each category, sub-topics were identified,
including “contradictory points of view and new insights” (Thomas, 2006, p. 242). Finally, core
themes were composed for the categories that “convey the core theme or essence of a category”
(Thomas, 2006). This step in the analysis, above all others, facilitated the organization of the data
into meaningful responses to the research questions and allowed development of emerging themes
that summarized the key concepts of the high-level categories.
Learner Engagement Construct. Eleven themes emerged from twelve sets of qualitative
data and reflected essential aspects of two of the factors identified by previous research (Affective
and Cognitive), while providing extensive insight into a third, situated factor, characterizing the
dynamic relationship of the learner and the learning environment. Three dimensions of learner
engagement were thus derived from the qualitative study and they are: Affective Learner
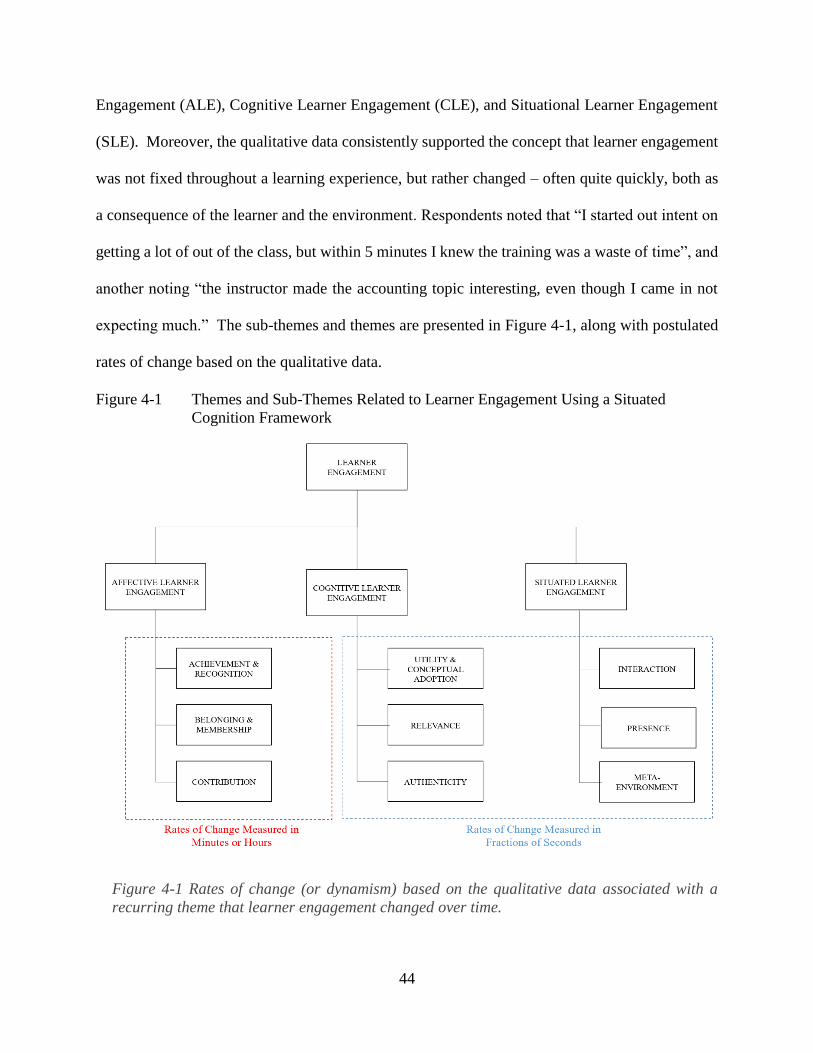
44
Engagement (ALE), Cognitive Learner Engagement (CLE), and Situational Learner Engagement
(SLE). Moreover, the qualitative data consistently supported the concept that learner engagement
was not fixed throughout a learning experience, but rather changed – often quite quickly, both as
a consequence of the learner and the environment. Respondents noted that “I started out intent on
getting a lot of out of the class, but within 5 minutes I knew the training was a waste of time”, and
another noting “the instructor made the accounting topic interesting, even though I came in not
expecting much.” The sub-themes and themes are presented in Figure 4-1, along with postulated
rates of change based on the qualitative data.
Figure 4-1 Themes and Sub-Themes Related to Learner Engagement Using a Situated
Cognition Framework
Figure 4-1 Rates of change (or dynamism) based on the qualitative data associated with a
recurring theme that learner engagement changed over time.
45
Affective Learner Engagement (ALE). Affective learner engagement is the emotional
response experienced by the learner while participating in the instructional session. This theme
was expected to emerge, as most recent research has identified an emotional aspect to the
engagement construct. As noted by Trowler (2010), “engagement is more than involvement or
participation – it requires feelings and sense-making as well as activity. Acting without feeling
engaged is just involvement or even compliance; feeling engaged without acting is dissociation”
(p. 5). Three themes emerged from the qualitative data relating to affective response: belonging
and membership, achievement & recognition, and contribution.
Belonging & Membership. Many of responses collected during the qualitative interviews,
particularly from the learners, had to do with the relationship that they formed (or did not form)
with their peers and instructor. All three populations interviewed noted the value of including
people of diverse technical background or experience in a particular learning program; this laid
the groundwork for program sponsors to design programs targeting a population while enhancing
cross-departmental expertise. Facilitators found that developing a relationship with the learners
and fostering a relationship between the learners produced a better outcome and improved their
sense of the quality of the delivery. The primary phrases or key elements of this sub theme was
the use of the first-person plural (“we”) in describing the interactions in instructional experience
and the overall sense that learners felt in contributing opinion or experiences within the
instructional session. This sense of shared experience in learning commonly extended beyond the
learning experience, with learners and instructors both noting lasting professional relationships
that formed initially during an instructional experience.
Achievement & Recognition. The sense of actually accomplishing something within the
instructional experience was of primary importance, particularly to the learners. Every participant
46
in an instructional experience interviewed highlighted the importance of having done something
valuable to them and how it made them feel. Learners felt that an instructional experience was of
value if they felt they had accomplished something important to them (and to a lesser extent, their
organization). In many cases, this theme emerged in the negative alternative, wherein learners
neither recognized the rationale nor the importance of the learning experience. This particular
negative example was noted by all three populations interviewed for the qualitative study, with
common phrases including “waste of time” or “training for the sake of training”, with particular
vitriol reserved for enterprise-wide compulsory training for compliance (e.g. workplace
environment, fiduciary responsibility, or interpersonal interactions). Achievement as interpreted by
instructors, learners, and program sponsors often took the form of some kind of formative feedback
or some measure of adoption by the learner population within the instructional experience.
Contribution. Instructors and learners frequently noted the importance of contribution and
informed response by others (instructor or peer learners) to their sense of satisfaction with the
learning experience. This thematic element is very closely related to recognition but is more
principally directed to a sense that the learner had actually advanced the experience of the entire
class, whether it was recognized or not. In reviewing artifacts for an instructional experience, this
was often reflected by one individual building on a concept introduced by another, with many
acknowledgments and supporting phrases like “yes, exactly” or “in addition, I would add” within
the classroom dialogue. The important thing for the learner was the sense that they had contributed
something meaningful or that they had gotten something very meaningful from one of their peers
or the instructor. Representative phrases from learners included “I valued the interaction with other
practitioners – it made my work better” and “I felt we advanced our understanding together”, and
in the negative case identified others that “were along for the ride” or “didn’t do their part of the

47
(assigned) project”. Of note, other elements of the learning environment could also quash this
sense of contribution – another participant (a learning and development consultant in an MBA
program) noted “in one of my classes, the professor shuts down discussion as soon as it starts and
delivers the content. We’re not encouraged to ask relevant questions, and the entire learning
experience is uncomfortable. The class is entirely filled with people disinclined to contribute at all
and it makes actually learning this material and how to apply it very difficult.” For their part,
program sponsors and instructors noted the value of learners that actively contribute in
instructional programs, highlighting a sense of accountability for learners. One program sponsor
went so far as to say, “I can build the best training in the world, but if the learners aren’t ready to
take some responsibility for their own development, the program will fail”.
Cognitive Learner Engagement (CLE). Several studies have identified the role of the
cognition, interest, and participation in the engagement of learners (Coates, 2007). As
distinguished from exclusively learner-centric observable studies (see Fredericks et al., 2004;
Jimerson et al., 2003), this study found that a cognition-based theme of both the learner and the
environment better represented the qualitative data. The characteristics of cognition that emerge
from this study involve interest and relevance and utility of the learning for the learner in the
environment. These themes most closely reflect characteristics of learning related to adult
learners (Knowles, 1973; Merriam, 2001). Perhaps most importantly however, cognition
moderates both the affective and the environmental response of the learner within the learning
experience. It would appear that without a cognitive latent factor, engagement is unlikely to
occur. Participants in the qualitative study noted, “the training program was useful for my job”
and “I started the PMP program because I needed the certification for work, but I found the
material very relevant to a variety of challenges in both my personal and professional life.” From
48
the data collected in this study, cognitive learner engagement is an amalgam of interest, value,
and utility related to the concepts and practices being presented in a learning experience viewed
through the lens of a particular learner’s experience and intent. Three principal themes that
characterized CLE emerged from the data.
Utility/Conceptual Adoption. The utility/conceptual adoption theme refers to the perceived
usefulness of the materials being presented in an instructional experience. Separate and distinct
from a learner’s affective reaction within the learning experience (how they feel about it), this theme
relates to the cognitive response while in the learning experience to how the learner perceives the
utility of information presented, both within the instructional experience and afterwards.
Participants in the qualitative study noted a broad and diverse experience with professional
instruction, and it was both the strongly positive and strongly negative perceptions of the utility of
the material that stood out for them. If a learning experience led to deeper understanding of complex
concepts related to their professional practice (even if beyond the ordinary boundary of his/her
expertise), participants would be more likely to say they were engaged. The PMP participant noted,
“I use elements of risk management and project planning everywhere – the concepts have really
changed my perspective when I approach any new project, and I now understand many of the
processes in place in other parts of the procurement and accounting department.” In contrast, when
the instructional experience offers nothing new of utility to the learner, they are likely to disengage.
One participant (a learning and development professional pursuing an MBA) saw little utility “in
an organizational behavior class focusing on basics that I’ve been working with for 15 years”
because of the lack of new information to contribute to her professional practice, but noted “several
of the students saw the stuff for the first time and they were amazed.”
Relevance: Content Alignment with Intentionality. This theme most frequently emerged
49
when the question of whether training was mandated or voluntary/self-selected by the learner arose.
Rather than facial perception of relevance (Knowles, 1973), this theme can best be characterized
as an alignment of intent between that of the instructional program design (as promulgated by the
program sponsor) and that of the learner (Biggs, 1996). Participants interviewed in this study noted
much higher dissatisfaction with mandatory training not directly useful or applicable to them as
learners in their role, with one participant noting “most mandatory company-wide training is a
waste of time”. The concepts underlying this theme are not simple affective responses to poorly
designed training – rather, this theme derives from an alignment between the instructional program
and the learner’s intended trajectory. If a learner intends to learn something, develop a new skill,
etc. the key question under this theme is whether the instructional program provides the means to
fulfill that intent. The perceived lack of relevance or utility is really a lack of alignment between
what the organization and the learner want to accomplish in the training.
Authenticity: Content Alignment with Experience. Similar to the perception of relevance,
learners’ perception of authenticity in an instructional experience is also a consequence of an
alignment. For learning to be perceived as authentic, an individual learner’s experience in the
domain needs to align with the concepts and practices presented. Of note, an exact alignment is not
necessary, but rather the information and task-interaction in the instructional delivery must at least
complement the learner’s experience and interactions in the same domain. Not surprisingly, in
situations where learners are working in an entirely new domain with no past experience or
“informational expectation”, this theme is not apparent. Notably, it was extremely negative
reactions that were very prevalent amongst participants (learners, instructors, and program
sponsors) – the most damning example recalled by one participant (an HR professional) that found
new-hire mandated training related to workplace environment “a complete waste of my time. I’ve
50
authored books on this material, and perhaps what made it most galling is that they got it wrong.
Rather than correct it – it was too big a class – I just read news on my tablet and checked off the
box.”
Situated Learner Engagement (SLE). Situated learning theories suggest a person’s
perception of and interaction with a learning environment are promising elements to explain a
dimensionality of their level of learner engagement. The process of learning results in observable
indicia driven by the extrinsic (and observable) factors of the tasks performed and the
relationships formed between the learner and the environment in the learning environment
(Brown et al., 1989). Lave and Wenger (1991) note, “learning involves the whole person; it
implies not only a relation to specific activities…it implies becoming a full participant, a
member…able to be involved in new activities, to perform new tasks and functions, to master
new understandings” (p. 53). Subsequent independent research by Lave (1991) and Wenger
(1998) into communities of practice and more recent research into workplace learning suggest
that how an individual leverages experience in interaction with a peer community of learners
leads to a meaningful learning activity (Gray, 2004). In this study, participants reported that the
learning environment and the dynamic interactive experiences with their peers both in structured
and unstructured learning environments as a major influence on their level of engagement. Three
themes emerged in this dimension: interaction, presence, and meta-environment.
Interaction. The foremost theme within situated learning engagement characterizes the
perception-reaction dynamic between the learner and the learning environment. This theme is
distinguished from simple observable behaviors such as a frequency count proxy for engagement
(Jimerson et al., 2003), instead assessing the changes in both the learner and the environment to
evaluate the level of engagement present. Participants recalled experiences provided extensive
51
positive and negative data relating to the presence or absence of engagement in a particular
instructional context that stemmed from their ability to interact with each other and the materials.
This issue is reminiscent of enabling learner agency as an important element in social-
constructivist learning environments (Dwight & Garrison, 2003; Woo & Reeves, 2007; Alt, 2015)
or the focus on interaction events in behaviorist learning environments (Trowler, 2010), but is
notably different because the unit of analysis is substantively different – it is the interaction of the
learner and the environment (Young et al, 1997). One participant (a manager completing a PMP
certificate program) reported, “The learning environment was not great – the instructor acted as a
gatekeeper between us (the learners) in the moderated forum and directed each of how and with
whom we should interact on a weekly basis. I shut down and did the bare minimum to get by.” In
contrast, another participant (Director of Customer Training) noted, “what I really like about
different learning environments is that learners have the kind of anonymity they want or not
depending on what they want to accomplish with their interaction, so they feel more free to ask
questions and volunteer opinion. They have the courage to ask a question or participate in a way
that maybe they wouldn’t otherwise.” Participants also noted that the design of the interaction was
critical, as one participant (a university distance education director) noted, “without means to
interact with the materials, you end up with a poor learning experience notwithstanding having the
best instructor in the world. Learners follow their perception of whether they’ll have the opportunity
and do what they need to do with each other and the instructor to achieve their goals in the class.”
Lastly, learner perceptions of the environment itself (whether technology, other learners, an
instructor, content, etc.) were often cited as directly related to learner engagement. One participant
(an experienced instructor in blended learning delivery) noted, “learners will often follow the lead
of someone else in the environment and there’s nothing you can do to save a dead class.” In
52
contrast, the same factor can contribute positively to individual learner engagement, as a
participant (the MBA student) noted “The other participants are my best resource (in an
instructional session). They look at things from different perspectives that often provide me the
best insight into how I understand the content.”
Presence. Participants frequently reported the need for learners to be “present in the
moment” or “mindful” during an instructional experience for them to be considered engaged.
Follow up questioning was used to explore those terms meant in the context of learning and
cognition. Several participants noted that “being present” in an instructional experience was
distinct from simple reaction to the learning experience. Instead, the degree to which someone
perceived a change in the learning environment and then reacted to it reflected a great deal more
complexity than previous studies using a “did-or-did-not” binary analysis (Trowler, 2010). The
sharing of knowledge and experience by whatever means available in a learning environment was
similarly a consistent component in this aspect of engagement, as one participant (an experienced
instructor) noted “I think there’s a couple levels of being present in a learning experience. Initially
it is basics – Are you listening? Are you involved in the conversation? […] Then there’s a deeper
level where the questions are more important - Are you adding to the conversation? Are you
making connections to other experiences (both yours and other learners’)? Is the conversation
evolving? Are you changing, and how?”
“Meta-Environment.” Separate from the actual learning environment, the meta-
environment is the organizational and physical context of the training delivery that can vastly affect
the learners’ instructional experience. For the learners and instructors in the study, the broad
diversity of learning environments and delivery methods implicates that where they participate in
a learning environment impacts their ability to engage and organizational context often informs

53
why they participate in the instructional program at all. One participant noted that the learning
management system accessed from home impacted the instructional environment in live
instruction, noting “it’s essentially an online portal where you get to submit your homework, to
take quizzes, post on discussion boards etc. But neither our grades nor our interactions are properly
recorded, so it becomes more stressful to attempt to understand the experience while live in class.
Rather than focusing on the learning of the content of the skills I am supposed to have, we find
ourselves attempting to outsmart the system to get to where we have to complete the course”. For
program sponsors, the meta-environment was often characterized by where the training mandate
originated and ultimately who was responsible to satisfy it. From this perspective, learner
engagement often depended on the organizational context of the learning experience as perceived
by the learner. An exemplar of this theme was a statement by one participant who noted, “we have
a lot of people who get sent the stuff they don’t actually even know what they’re being sent to
for…they may be told its compliance training, it’s safety training, or some kind of mandatory
thing…but they may not even know what they’re there for, and this may not get resolved before
completing the program.” Another participant (chief learning officer for a Fortune 100 company)
noted, “(participants feel) if the outcome really isn’t going to be their individual responsibility, why
should they care?”
Item Development. Themes were categorized based on characterizing the underlying
mechanisms and observable phenomena in regard to learner engagement, instead of the specific
contexts or anecdotes provided in the data in order to increase generalizability of the themes (Yin,
2015). Within the situated cognition theoretical framework, the themes were found to converge
meaningfully to represent each of the corresponding three dimensions of the learner engagement
construct (ALE, CLE, and SLE). Instrument development began with the development of items
54
related to the principle themes identified that, respectively, reflected the potential variables within
the construct of learner engagement. A total of 87 items relating to the theorized learner
engagement model were developed as candidates related to those factors identified in the
qualitative study through both independent development and a review of existing instrumentation
and informal discussions with practitioners in the field. As noted in the review of literature, while
many of these instruments individually suffer from limited construct validity or applicability
across multiple instruction contexts (Appleton et al, 2006), the author elected to conduct a broad
survey of the body of instrumentation to elicit persistent themes and items stems for further
evaluation and development within this study. After the generation of initial candidate items,
two subject matter experts in workplace learning and adult education were engaged to discuss the
overall conceptualization of the constructs as well as the content of the individual items. Each of
the subject matter experts possessed an advanced degree in cognitive psychology and over 20
years of experience in workforce development and research. Their review recommended
omission of 17 candidate items as repetitive and 18 additional candidate items for using
terminology not generally in use by the professional learning and development community, as
well as some revision of the construct factor descriptions. In total, 52 items were developed for
the three factors of learner engagement (Grant & David, 1997; Rubio, Berg-Weger, Tebb, Lee,
& Rauch, 2003) for the initial content validity analysis.
Content Validity. The first step in the content validation analysis sought to obtain
qualitative feedback on content adequacy and model definition through an independent review of
the construct and proposed factor structure by two experts in cognition and instruction (McKenzie
et al., 1999). Both experts are practicing researchers with advanced degrees in cognition (one M.
Ed. and one Ph.D.) and possess extensive background in adult instructional practice in industry.

55
The construct of interest (Learner Engagement) and its three factors (ALE, CLE, and SLE) were
defined and provided to these experts for correspondence between the conceptual and the
operational definitions of the construct (McKenzie et al., 1999). These experts provided
qualitative feedback and substantive recommendations that were then incorporated into the
construct definitions.
The second step consisted of item generation reflecting the domain of content and the
purpose for the instrument (McKenzie et al., 1999). A draft instrument was constructed from all
of the candidate items, a scale adopted for use, instructions to subjects was created, and items
reviewed to ensure consistency in wording and format. A panel of six content experts was
recruited to review the instrument in order to evaluate the relevance and dimensional alignment of
the candidate items within the construct of interest (Gable & Wolf, 1993) and provide additional
qualitative feedback on the construct definitions. The experts selected for reviewing the draft
instrument included academic researchers in measurement/assessment, cognition, and instruction,
and adult education. Experts participated in the content validity review through electronic forms
that included background of the study, the construct of interest, a copy of the draft instrument
items, instructions, and a form soliciting feedback on relevance, strength of association, and
qualitative comments. The purpose and significance of the content validation study were
explained together with the potential uses of the instrument in the field.
Two scaled responses were solicited for each item from each expert (Clark & Watson,
1995). The alignment rating scale allowed experts to evaluate the dimensionality of each item
defined along three dimensions (or “factors”) relating to the affective response to learner
experience, cognitive response to learner experience, situated learning experience, or none of the
factors. Items with less than 5 of 6 experts’ agreement were eliminated (Gable & Wolf, 1993).
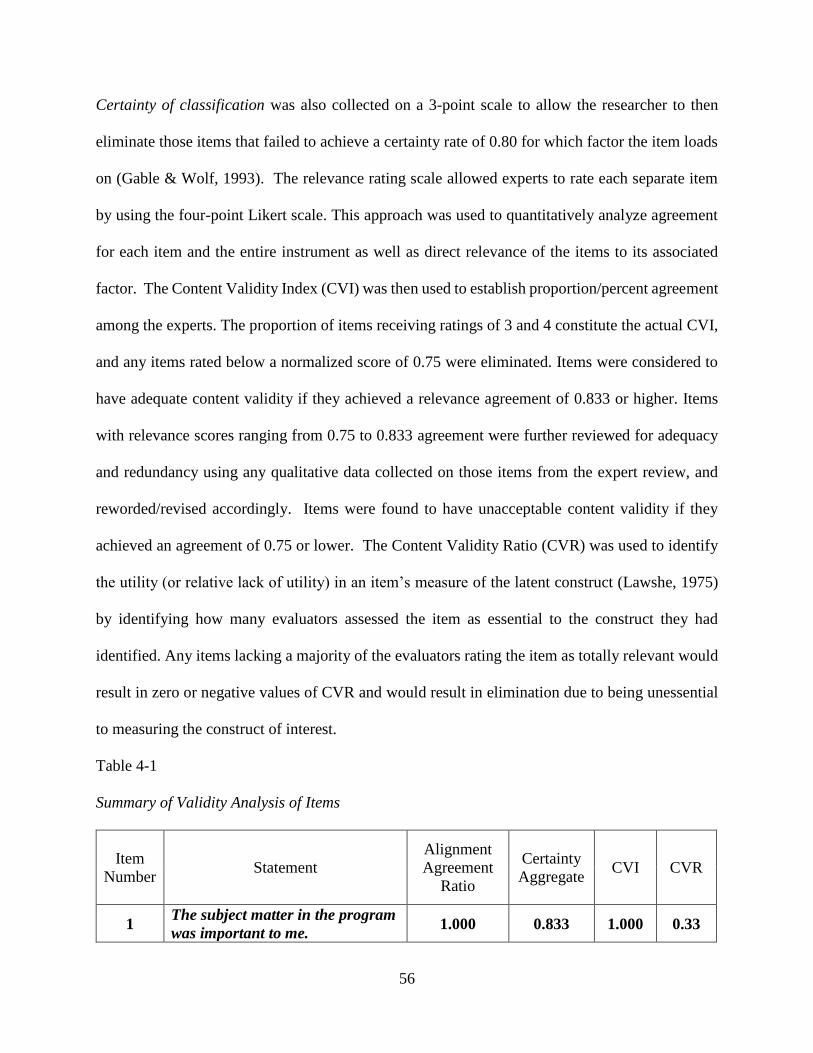
56
Certainty of classification was also collected on a 3-point scale to allow the researcher to then
eliminate those items that failed to achieve a certainty rate of 0.80 for which factor the item loads
on (Gable & Wolf, 1993). The relevance rating scale allowed experts to rate each separate item
by using the four-point Likert scale. This approach was used to quantitatively analyze agreement
for each item and the entire instrument as well as direct relevance of the items to its associated
factor. The Content Validity Index (CVI) was then used to establish proportion/percent agreement
among the experts. The proportion of items receiving ratings of 3 and 4 constitute the actual CVI,
and any items rated below a normalized score of 0.75 were eliminated. Items were considered to
have adequate content validity if they achieved a relevance agreement of 0.833 or higher. Items
with relevance scores ranging from 0.75 to 0.833 agreement were further reviewed for adequacy
and redundancy using any qualitative data collected on those items from the expert review, and
reworded/revised accordingly. Items were found to have unacceptable content validity if they
achieved an agreement of 0.75 or lower. The Content Validity Ratio (CVR) was used to identify
the utility (or relative lack of utility) in an item’s measure of the latent construct (Lawshe, 1975)
by identifying how many evaluators assessed the item as essential to the construct they had
identified. Any items lacking a majority of the evaluators rating the item as totally relevant would
result in zero or negative values of CVR and would result in elimination due to being unessential
to measuring the construct of interest.
Table 4-1
Summary of Validity Analysis of Items
Item
Number Statement
Alignment
Agreement
Ratio
Certainty
Aggregate CVI CVR
1 The subject matter in the program
was important to me. 1.000 0.833 1.000 0.33
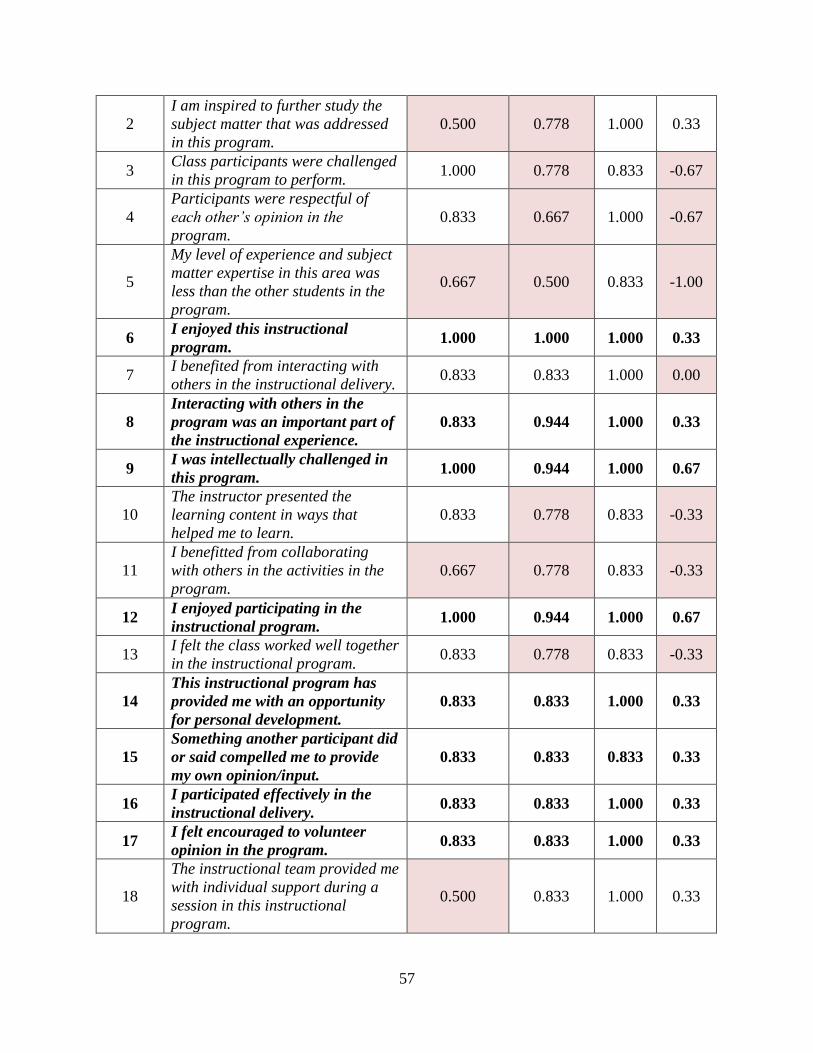
57
2
I am inspired to further study the
subject matter that was addressed
in this program.
0.500 0.778 1.000 0.33
3 Class participants were challenged
in this program to perform. 1.000 0.778 0.833 -0.67
4
Participants were respectful of
each other’s opinion in the
program.
0.833 0.667 1.000 -0.67
5
My level of experience and subject
matter expertise in this area was
less than the other students in the
program.
0.667 0.500 0.833 -1.00
6 I enjoyed this instructional
program. 1.000 1.000 1.000 0.33
7 I benefited from interacting with
others in the instructional delivery. 0.833 0.833 1.000 0.00
8
Interacting with others in the
program was an important part of
the instructional experience.
0.833 0.944 1.000 0.33
9 I was intellectually challenged in
this program. 1.000 0.944 1.000 0.67
10
The instructor presented the
learning content in ways that
helped me to learn.
0.833 0.778 0.833 -0.33
11
I benefitted from collaborating
with others in the activities in the
program.
0.667 0.778 0.833 -0.33
12 I enjoyed participating in the
instructional program. 1.000 0.944 1.000 0.67
13 I felt the class worked well together
in the instructional program. 0.833 0.778 0.833 -0.33
14
This instructional program has
provided me with an opportunity
for personal development.
0.833 0.833 1.000 0.33
15
Something another participant did
or said compelled me to provide
my own opinion/input.
0.833 0.833 0.833 0.33
16 I participated effectively in the
instructional delivery. 0.833 0.833 1.000 0.33
17 I felt encouraged to volunteer
opinion in the program. 0.833 0.833 1.000 0.33
18
The instructional team provided me
with individual support during a
session in this instructional
program.
0.500 0.833 1.000 0.33
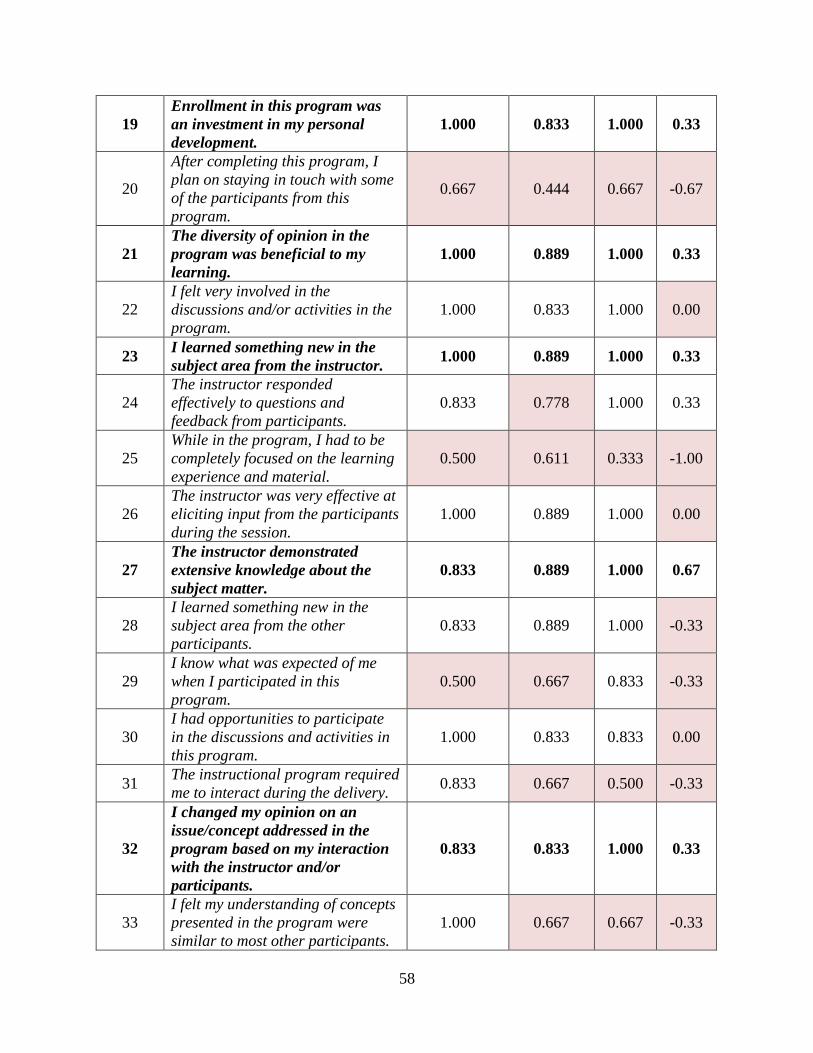
58
19
Enrollment in this program was
an investment in my personal
development.
1.000 0.833 1.000 0.33
20
After completing this program, I
plan on staying in touch with some
of the participants from this
program.
0.667 0.444 0.667 -0.67
21
The diversity of opinion in the
program was beneficial to my
learning.
1.000 0.889 1.000 0.33
22
I felt very involved in the
discussions and/or activities in the
program.
1.000 0.833 1.000 0.00
23 I learned something new in the
subject area from the instructor. 1.000 0.889 1.000 0.33
24
The instructor responded
effectively to questions and
feedback from participants.
0.833 0.778 1.000 0.33
25
While in the program, I had to be
completely focused on the learning
experience and material.
0.500 0.611 0.333 -1.00
26
The instructor was very effective at
eliciting input from the participants
during the session.
1.000 0.889 1.000 0.00
27
The instructor demonstrated
extensive knowledge about the
subject matter.
0.833 0.889 1.000 0.67
28
I learned something new in the
subject area from the other
participants.
0.833 0.889 1.000 -0.33
29
I know what was expected of me
when I participated in this
program.
0.500 0.667 0.833 -0.33
30
I had opportunities to participate
in the discussions and activities in
this program.
1.000 0.833 0.833 0.00
31 The instructional program required
me to interact during the delivery. 0.833 0.667 0.500 -0.33
32
I changed my opinion on an
issue/concept addressed in the
program based on my interaction
with the instructor and/or
participants.
0.833 0.833 1.000 0.33
33
I felt my understanding of concepts
presented in the program were
similar to most other participants.
1.000 0.667 0.667 -0.33
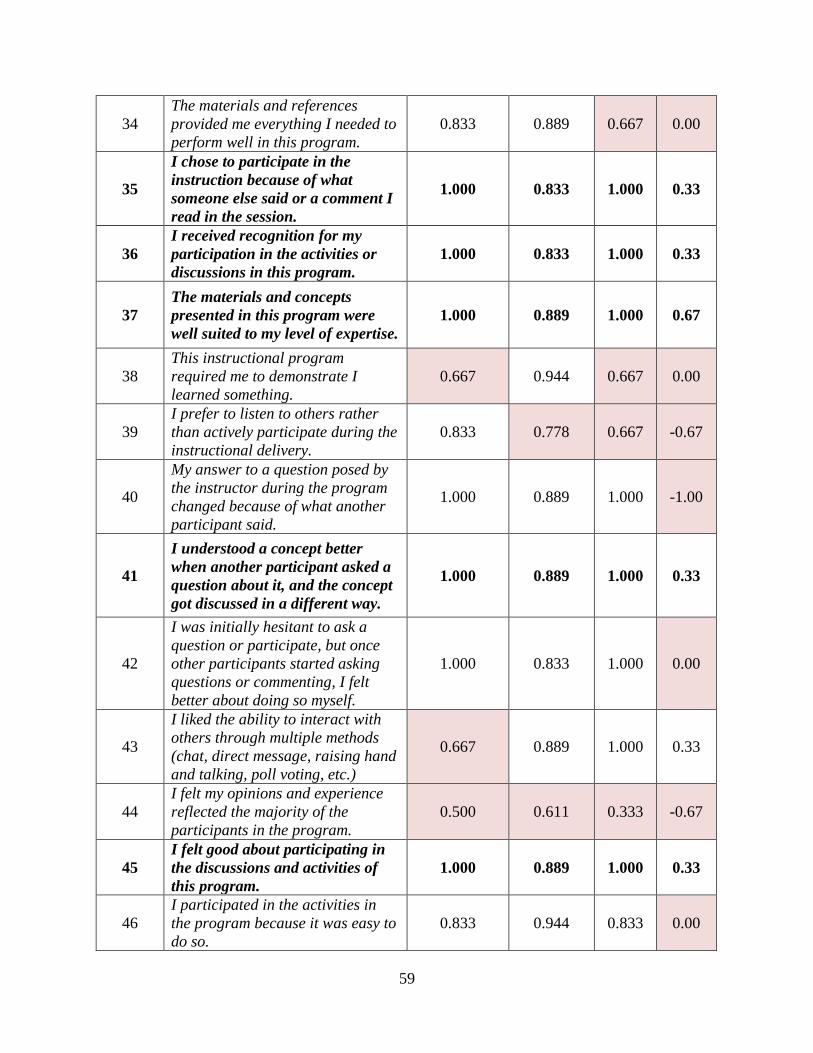
59
34
The materials and references
provided me everything I needed to
perform well in this program.
0.833 0.889 0.667 0.00
35
I chose to participate in the
instruction because of what
someone else said or a comment I
read in the session.
1.000 0.833 1.000 0.33
36
I received recognition for my
participation in the activities or
discussions in this program.
1.000 0.833 1.000 0.33
37
The materials and concepts
presented in this program were
well suited to my level of expertise.
1.000 0.889 1.000 0.67
38
This instructional program
required me to demonstrate I
learned something.
0.667 0.944 0.667 0.00
39
I prefer to listen to others rather
than actively participate during the
instructional delivery.
0.833 0.778 0.667 -0.67
40
My answer to a question posed by
the instructor during the program
changed because of what another
participant said.
1.000 0.889 1.000 -1.00
41
I understood a concept better
when another participant asked a
question about it, and the concept
got discussed in a different way.
1.000 0.889 1.000 0.33
42
I was initially hesitant to ask a
question or participate, but once
other participants started asking
questions or commenting, I felt
better about doing so myself.
1.000 0.833 1.000 0.00
43
I liked the ability to interact with
others through multiple methods
(chat, direct message, raising hand
and talking, poll voting, etc.)
0.667 0.889 1.000 0.33
44
I felt my opinions and experience
reflected the majority of the
participants in the program.
0.500 0.611 0.333 -0.67
45
I felt good about participating in
the discussions and activities of
this program.
1.000 0.889 1.000 0.33
46
I participated in the activities in
the program because it was easy to
do so.
0.833 0.944 0.833 0.00
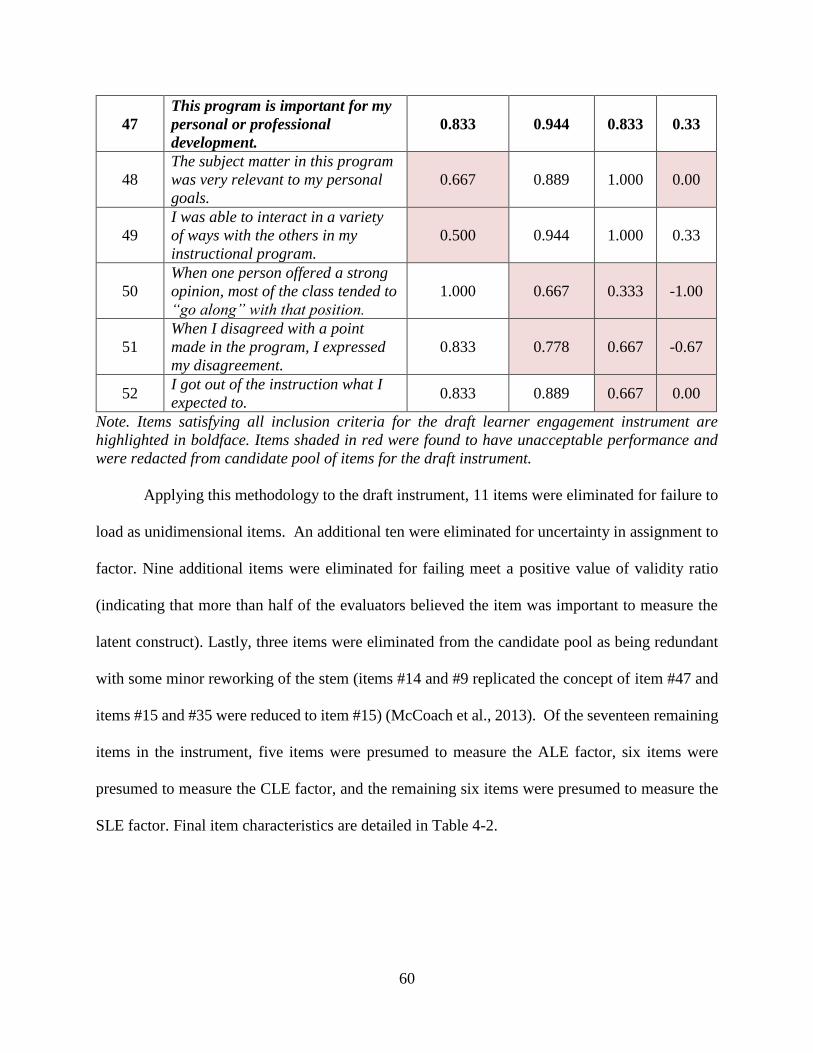
60
47
This program is important for my
personal or professional
development.
0.833 0.944 0.833 0.33
48
The subject matter in this program
was very relevant to my personal
goals.
0.667 0.889 1.000 0.00
49
I was able to interact in a variety
of ways with the others in my
instructional program.
0.500 0.944 1.000 0.33
50
When one person offered a strong
opinion, most of the class tended to
“go along” with that position.
1.000 0.667 0.333 -1.00
51
When I disagreed with a point
made in the program, I expressed
my disagreement.
0.833 0.778 0.667 -0.67
52 I got out of the instruction what I
expected to. 0.833 0.889 0.667 0.00
Note. Items satisfying all inclusion criteria for the draft learner engagement instrument are
highlighted in boldface. Items shaded in red were found to have unacceptable performance and
were redacted from candidate pool of items for the draft instrument.
Applying this methodology to the draft instrument, 11 items were eliminated for failure to
load as unidimensional items. An additional ten were eliminated for uncertainty in assignment to
factor. Nine additional items were eliminated for failing meet a positive value of validity ratio
(indicating that more than half of the evaluators believed the item was important to measure the
latent construct). Lastly, three items were eliminated from the candidate pool as being redundant
with some minor reworking of the stem (items #14 and #9 replicated the concept of item #47 and
items #15 and #35 were reduced to item #15) (McCoach et al., 2013). Of the seventeen remaining
items in the instrument, five items were presumed to measure the ALE factor, six items were
presumed to measure the CLE factor, and the remaining six items were presumed to measure the
SLE factor. Final item characteristics are detailed in Table 4-2.

61
Table 4-2
Items Characteristics in Learner Engagement Instrument
Latent Factor Number
of Items
Mean
Alignment
Agreement
Mean Certainty
Aggregate
Score
Mean CVI Mean CVR
Affective Learner
Engagement 5 0.97 0.90 1.000 0.40
Cognitive Learner
Engagement 6 0.97 0.90 0.97 0.50
Situated Learner
Engagement 6 0.90 0.87 0.97 0.33
Lastly, detailed qualitative comments from the experts led to revisions in items, especially with an
emphasis on the wording of affective terminology and tense of the statements for consistency.
Phase II – Pilot Instrumentation
Purpose. The instrumentation developed in Phase I of the study was implemented to
address the final research question (RQ4) directed at the development of a measure of a latent
construct of learner engagement for the population of interest. The Phase II portion of the study
consisted of operationalizing the instrument for the population of interest to permit an EFA of the
resulting data.
Sample. The sample of respondents for the phase II study was drawn from a population of
working adults (n=300) who had participated in an instructional program related to professional
development in the past twelve months. Respondents were screened against several criteria (Table
4-3) to collect response data only from the population of interest, and several demographic and
organization items were included before response data was collected to develop a complete picture
of the respondent population and instructional context that formed the basis of the response data
collected. A summary of the composition and demographics for the sample used in the EFA are

62
provided in Appendix D.
Table 4-3
Respondent Demographic Screening Criteria
Criterion Acceptable Range How Verified
Age 25-65
1. Sampling Profile on Survey Platform
(Amazon Mechanical Turk)
2. Demographic Item in Instrument
Education Post-Secondary Sampling Profile on Survey Platform
(Amazon Mechanical Turk)
Employment Status Full-Time
(> 32 hours/week)
Sampling Profile on Survey Platform
(Amazon Mechanical Turk)
Participant in
Professional Training
Program
Yes
1. Sampling Profile on Survey Platform
(Amazon Mechanical Turk)
2. Demographic Item in Instrument
Region North America Sampling Profile on Survey Platform
(Amazon Mechanical Turk)
The survey for the Phase II EFA study consisted of the 17 Likert-scale items relating to
learner engagement, two demographic questions, two questions regarding self-reported
organizational questions to provide an operational context for the learner intent upon entering the
instructional program providing the basis for the response data. Convenience sampling was
employed through an online data platform (Amazon Turk) to qualify respondents in alignment
with the population of interest and desired screening criteria. Small financial incentives1 were
offered to the respondents in return for the completion of a survey. All responses were obtained
anonymously, and IRB-mandated consent obtained through the format of the instrument for online
participation which required consent before participation. All rights of the subjects were protected
such that no one person’s response could be identified, either through survey code markings or
any other method.
1 The author paid for the company service at the rate of $1 U.S. dollars per participant, plus costs for the online
platform. The company, not the author, compensated participants who completed the survey, according to the
company’s internal policy.
63
Measurement Methodology. The web-based instrument included the 17 items developed
and satisfying initial validity analysis. Additional demographic information was collected to
provide the opportunity for follow-on analysis, refinement of the instrument, and additional
research in the subject area. The measurement methodology for all respondents used a five-element
Likert scale of agreement to positively worded statement. All items are positively worded to elicit
a degree of agreement or disagreement across the ‘‘expected degree of variation’’ on the construct
(Crocker & Algina, 1986; Kimberlin & Winterstein, 2008). The instrument was administered over
a period of eight days and resulted in a total of 300 responses.
Exploratory Factor Analysis
The data from the pilot study were subjected to an EFA to “explore the dimensionality of
an instrument by finding the smallest number of interpretable factors needed to explain the
correlations among set of items” (McCoach, et al., 2013, p.111). Most generally, EFA is an analytic
approach used to evaluate the existence of a “smaller set of k latent factors to represent the larger
set of j variables” (Henson & Roberts, 2006, p. 395) while retaining the fidelity of the original
data. The analysis approach in this study consisted of screening for missing or miscoded data,
evaluating the data for EFA, and conduct of a two-stage process for factor identification and further
analysis.
Data Screening: The data were screened for univariate outliers and list-wise missing data.
Due to the data collection platform used, participants were unable to provide incomplete responses
or out-of-range responses (the system would prompt until the instrument was completed
successfully and completely), providing a ratio of 17.6 cases per variable. Initially, the
factorability of the seventeen items was examined. Preliminary analysis focused on determination
of the appropriate number of factors for formal EFA.
64
Suitability for EFA: To evaluate the appropriateness of conducting EFA, some basic
statistical analyses were conducted. The Kaiser-Meyer-Olkin (KMO) measure of sampling adequacy
was 0.934 - “marvelous”, and above the commonly recommended value of 0.6 (McCoach et al.,
2013). This test evaluates the partial correlations between items after controlling for all other items
on the off-diagonal partial correlations in an anti-image correlation matrix. As McCoach et al. (2013
succinctly notes, “if the sum of the partial correlations is large relative to the sum of the correlations,
KMO is small and EFA may be inappropriate) (p.133). Bartlett’s test of sphericity was significant
(2 (300) = 5395.850, p < .05). Bartlett’s Test of Sphericity compares the observed item correlation
matrix to the identity matrix. The null hypothesis of this test is that the item data is orthogonal (thus
uncorrelated). In rejecting the null hypothesis, the analysis is that they item data are correlated
enough to where the correlation matrix diverges significantly from the identity matrix. Applying
criteria from Lackey et al. (2003), Measures of Sampling Adequacy (MSAs) were evaluated in the
anti-image correlation matrix. The diagonals of the anti-image correlation matrix ranged from 0.908
to 0.959, indicating excellent pattern coefficients on one or more factors, and off-axis partial
correlations absolute values averaged 0.061. Finally, the communalities for all items ranged in value
from 0.698 to 0.887, with a mean of 0.825, indicating good correlation of items with each other such
that EFA is appropriate (McCoach et al., 2013). Given these results, factor analysis was deemed to
be appropriate with all seventeen items.
Number of Factors to Extract: With suitability for EFA established, a preliminary
analysis was conducted on the data to determine the number of factors to extract from the data
(McCoach, et al., 2013). Factor extraction analysis considered several criteria, including Kaiser’s
criterion (eigenvalue (λ) > 1.0), Scree Plot Evaluation, Parallel Analysis (both Principal
Component Analysis (PCA) and Principal Axis Factoring (PAF)), and Minimum Average Partial

65
Procedure (MAP) (McCoach, et al., 2013). With multiple methods of factor extraction,
commentators often identify one method over another stressing characteristics ranging from using
statistical modeling accuracy to data fidelity to operational simplicity as favoring one method over
another (van Assen, 2017). This study chose to apply a “holistic” approach recommended by
McCoach et al. (2013) to assess the variability in the factors identified by the various approaches.
Kaiser’s criterion (Kaiser, 1960) suggests extracting all factors with eigenvalue above or
at 1.0. Operationally, this rule implies that a factor is retained if it explains more variance than
could be explained by randomly constructed factors under the null hypothesis that no true
underlying factor exists ( so the data is accurately represented by an identity n x n matrix with 1’s
along its principal diagonal and 0’s everywhere else. As noted by van Assen (2017), “The
“eigenvalues greater than one” rule, often attributed to Kaiser (1960), is implicitly linked to this
null model and states that the number of factors to retain should correspond to the number of
eigenvalues greater than one (i.e., deviating from the null expectation). Intuitively, one can
motivate this rule by stating that an eigenvalue that represents a “true structural dimension” should
at least explain more variance than contained in a single variable.” In the present research data,
Kaiser’s criterion suggested three factors to retain (Table 4-4).
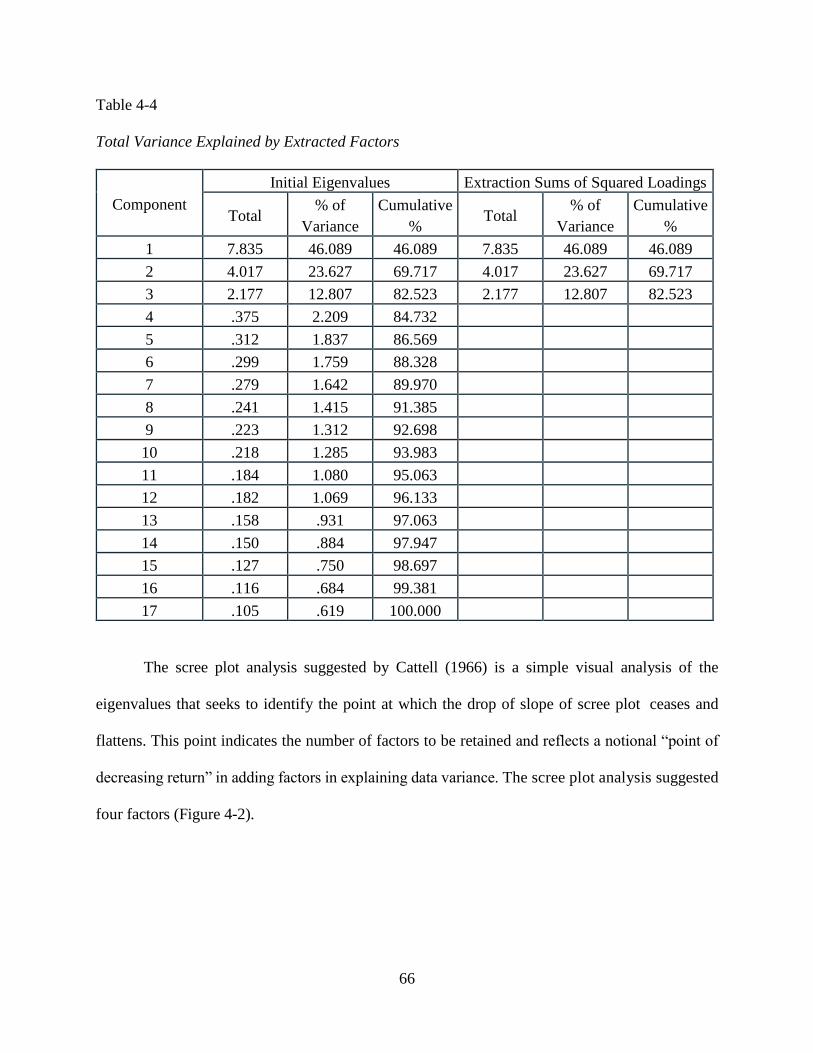
66
Table 4-4
Total Variance Explained by Extracted Factors
Component
Initial Eigenvalues Extraction Sums of Squared Loadings
Total % of
Variance
Cumulative
% Total
% of
Variance
Cumulative
%
1 7.835 46.089 46.089 7.835 46.089 46.089
2 4.017 23.627 69.717 4.017 23.627 69.717
3 2.177 12.807 82.523 2.177 12.807 82.523
4 .375 2.209 84.732
5 .312 1.837 86.569
6 .299 1.759 88.328
7 .279 1.642 89.970
8 .241 1.415 91.385
9 .223 1.312 92.698
10 .218 1.285 93.983
11 .184 1.080 95.063
12 .182 1.069 96.133
13 .158 .931 97.063
14 .150 .884 97.947
15 .127 .750 98.697
16 .116 .684 99.381
17 .105 .619 100.000
The scree plot analysis suggested by Cattell (1966) is a simple visual analysis of the
eigenvalues that seeks to identify the point at which the drop of slope of scree plot ceases and
flattens. This point indicates the number of factors to be retained and reflects a notional “point of
decreasing return” in adding factors in explaining data variance. The scree plot analysis suggested
four factors (Figure 4-2).
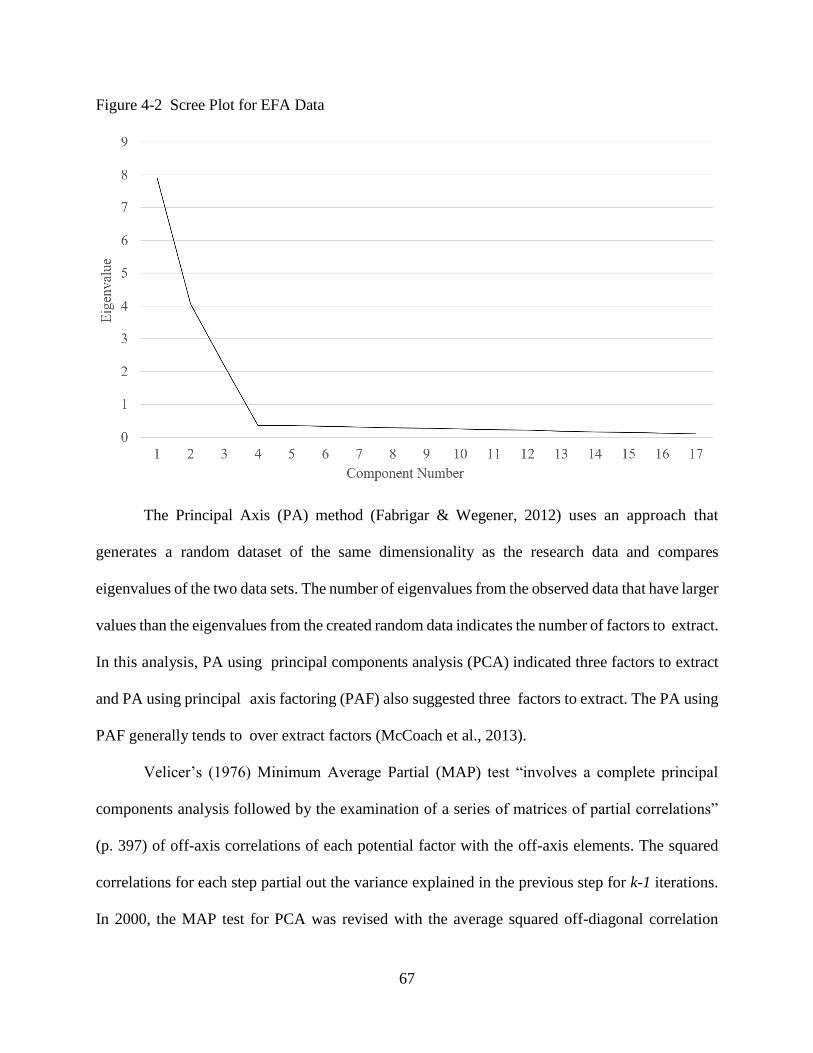
67
Figure 4-2 Scree Plot for EFA Data
The Principal Axis (PA) method (Fabrigar & Wegener, 2012) uses an approach that
generates a random dataset of the same dimensionality as the research data and compares
eigenvalues of the two data sets. The number of eigenvalues from the observed data that have larger
values than the eigenvalues from the created random data indicates the number of factors to extract.
In this analysis, PA using principal components analysis (PCA) indicated three factors to extract
and PA using principal axis factoring (PAF) also suggested three factors to extract. The PA using
PAF generally tends to over extract factors (McCoach et al., 2013).
Velicer’s (1976) Minimum Average Partial (MAP) test “involves a complete principal
components analysis followed by the examination of a series of matrices of partial correlations”
(p. 397) of off-axis correlations of each potential factor with the off-axis elements. The squared
correlations for each step partial out the variance explained in the previous step for k-1 iterations.
In 2000, the MAP test for PCA was revised with the average squared off-diagonal correlation
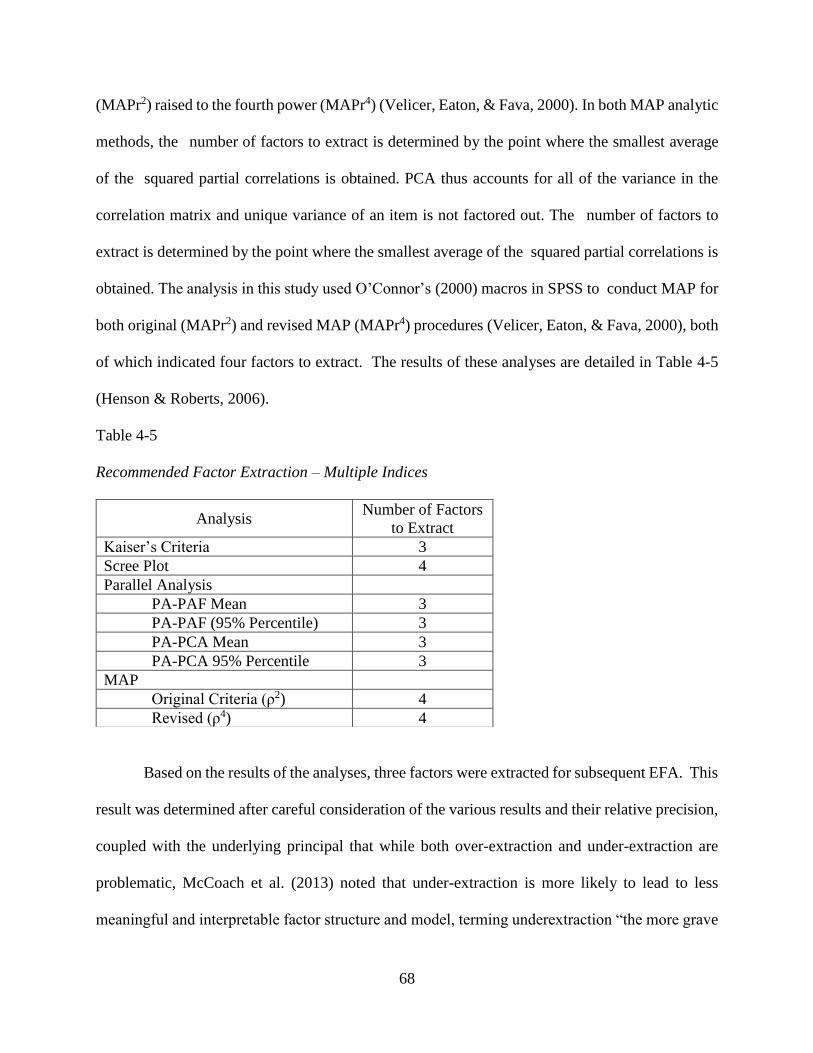
68
(MAPr2) raised to the fourth power (MAPr4) (Velicer, Eaton, & Fava, 2000). In both MAP analytic
methods, the number of factors to extract is determined by the point where the smallest average
of the squared partial correlations is obtained. PCA thus accounts for all of the variance in the
correlation matrix and unique variance of an item is not factored out. The number of factors to
extract is determined by the point where the smallest average of the squared partial correlations is
obtained. The analysis in this study used O’Connor’s (2000) macros in SPSS to conduct MAP for
both original (MAPr2) and revised MAP (MAPr4) procedures (Velicer, Eaton, & Fava, 2000), both
of which indicated four factors to extract. The results of these analyses are detailed in Table 4-5
(Henson & Roberts, 2006).
Table 4-5
Recommended Factor Extraction – Multiple Indices
Based on the results of the analyses, three factors were extracted for subsequent EFA. This
result was determined after careful consideration of the various results and their relative precision,
coupled with the underlying principal that while both over-extraction and under-extraction are
problematic, McCoach et al. (2013) noted that under-extraction is more likely to lead to less
meaningful and interpretable factor structure and model, terming underextraction “the more grave
Analysis Number of Factors
to Extract
Kaiser’s Criteria 3
Scree Plot 4
Parallel Analysis
PA-PAF Mean 3
PA-PAF (95% Percentile) 3
PA-PCA Mean 3
PA-PCA 95% Percentile 3
MAP
Original Criteria (ρ2) 4
Revised (ρ4) 4
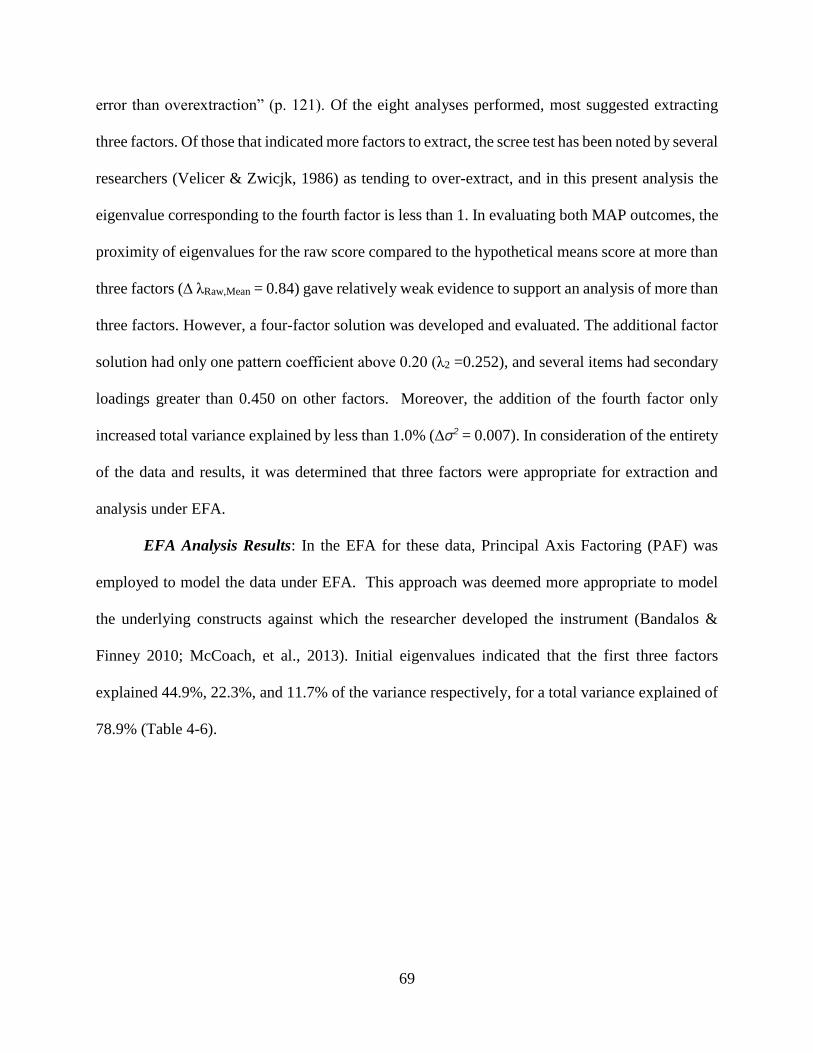
69
error than overextraction” (p. 121). Of the eight analyses performed, most suggested extracting
three factors. Of those that indicated more factors to extract, the scree test has been noted by several
researchers (Velicer & Zwicjk, 1986) as tending to over-extract, and in this present analysis the
eigenvalue corresponding to the fourth factor is less than 1. In evaluating both MAP outcomes, the
proximity of eigenvalues for the raw score compared to the hypothetical means score at more than
three factors (∆ λRaw,Mean = 0.84) gave relatively weak evidence to support an analysis of more than
three factors. However, a four-factor solution was developed and evaluated. The additional factor
solution had only one pattern coefficient above 0.20 (λ2 =0.252), and several items had secondary
loadings greater than 0.450 on other factors. Moreover, the addition of the fourth factor only
increased total variance explained by less than 1.0% (∆σ2 = 0.007). In consideration of the entirety
of the data and results, it was determined that three factors were appropriate for extraction and
analysis under EFA.
EFA Analysis Results: In the EFA for these data, Principal Axis Factoring (PAF) was
employed to model the data under EFA. This approach was deemed more appropriate to model
the underlying constructs against which the researcher developed the instrument (Bandalos &
Finney 2010; McCoach, et al., 2013). Initial eigenvalues indicated that the first three factors
explained 44.9%, 22.3%, and 11.7% of the variance respectively, for a total variance explained of
78.9% (Table 4-6).
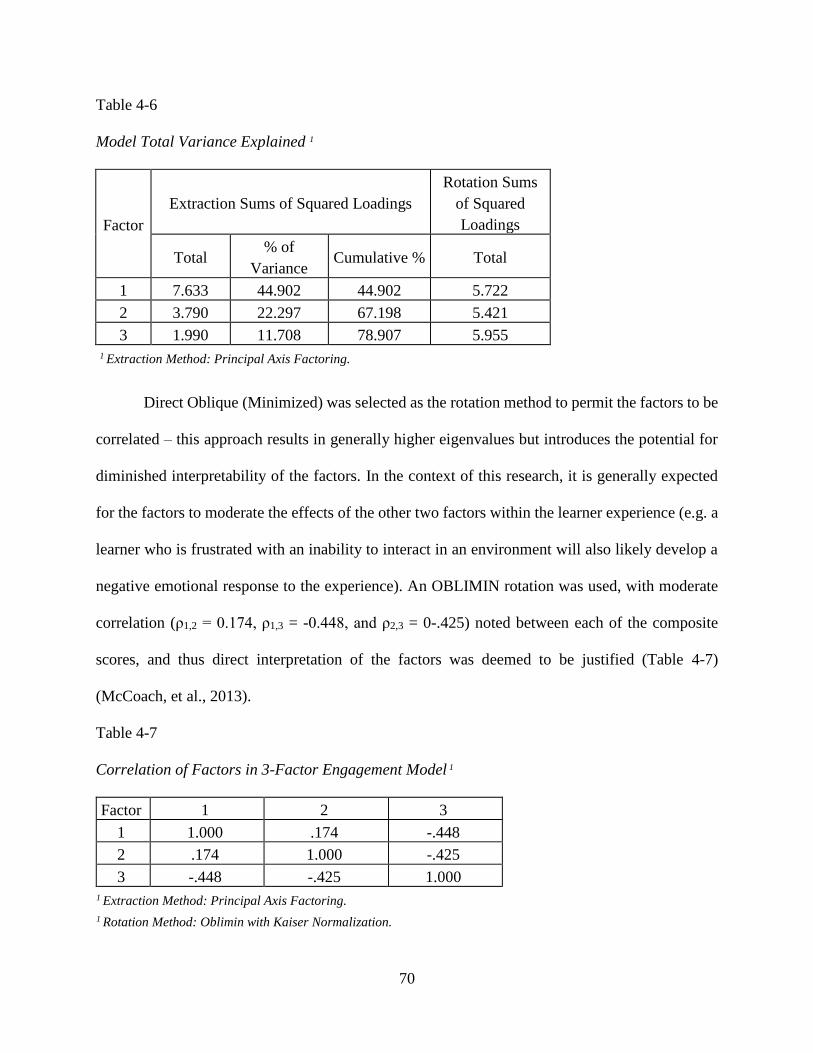
70
Table 4-6
Model Total Variance Explained 1
Factor
Extraction Sums of Squared Loadings
Rotation Sums
of Squared
Loadings
Total % of
Variance Cumulative % Total
1 7.633 44.902 44.902 5.722
2 3.790 22.297 67.198 5.421
3 1.990 11.708 78.907 5.955
1 Extraction Method: Principal Axis Factoring.
Direct Oblique (Minimized) was selected as the rotation method to permit the factors to be
correlated – this approach results in generally higher eigenvalues but introduces the potential for
diminished interpretability of the factors. In the context of this research, it is generally expected
for the factors to moderate the effects of the other two factors within the learner experience (e.g. a
learner who is frustrated with an inability to interact in an environment will also likely develop a
negative emotional response to the experience). An OBLIMIN rotation was used, with moderate
correlation (ρ1,2 = 0.174, ρ1,3 = -0.448, and ρ2,3 = 0-.425) noted between each of the composite
scores, and thus direct interpretation of the factors was deemed to be justified (Table 4-7)
(McCoach, et al., 2013).
Table 4-7
Correlation of Factors in 3-Factor Engagement Model 1
Factor 1 2 3
1 1.000 .174 -.448
2 .174 1.000 -.425
3 -.448 -.425 1.000
1 Extraction Method: Principal Axis Factoring.
1 Rotation Method: Oblimin with Kaiser Normalization.

71
The communalities for all items in the rotated solution ranged in value from 0.624 to 0.869, with
a mean of 0.789, indicating acceptable change in R2 from each item with all extracted factors
(Table 4-8).
Table 4-8
Communalities of 3-Factor Engagement Model 1
Item Initial Extraction
1 .824 .860
2 .745 .752
3 .846 .869
4 .838 .859
5 .802 .830
6 .815 .867
7 .614 .624
8 .702 .731
9 .754 .787
10 .738 .758
11 .718 .739
12 .769 .793
13 .691 .707
14 .773 .790
15 .802 .824
16 .782 .795
17 .799 .831 1 Extraction Method: Principal Axis Factoring.
Lastly, composite scores were created for each of the factors, based on the mean of the items which
had their primary loadings on each factor. In reviewing the results, items had primary pattern
coefficients ranging from 0.784 to 0.950. The three-factor model solution exhibits high
unidimensional pattern coefficients and possesses simple structure (McCoach, et al., 2013). The
factor pattern matrix for the solution is presented in Table 4-9.
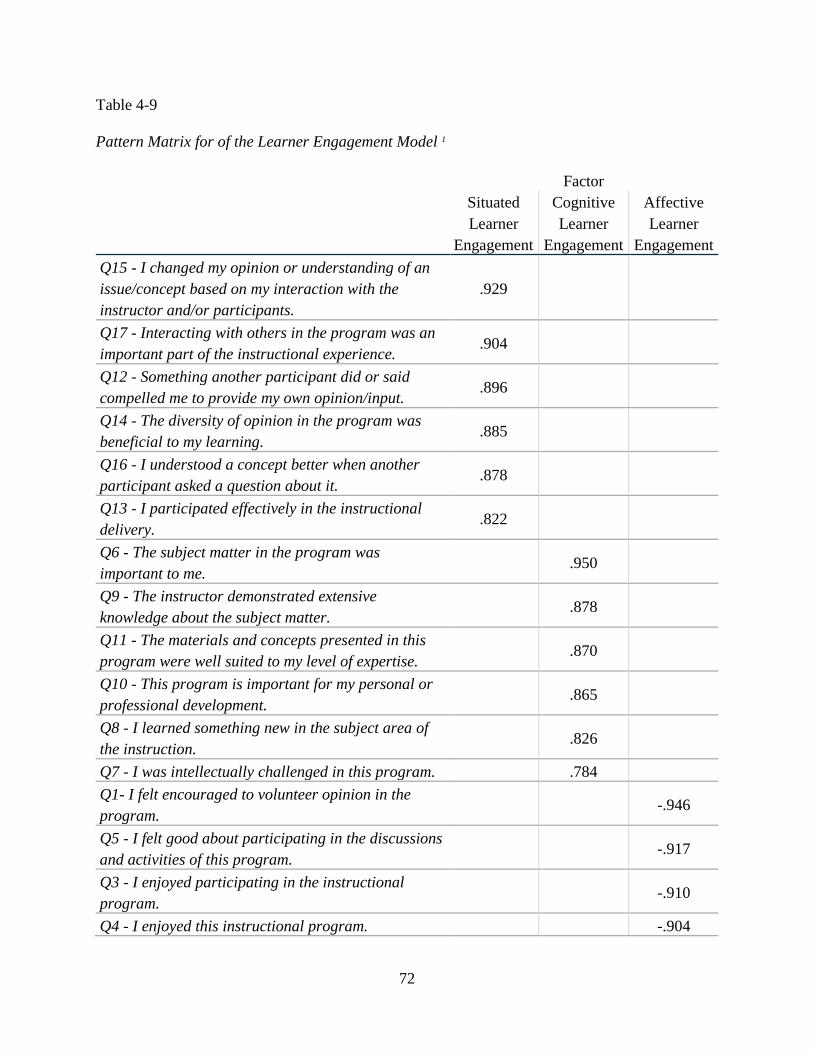
72
Table 4-9
Pattern Matrix for of the Learner Engagement Model 1
Factor
Situated
Learner
Engagement
Cognitive
Learner
Engagement
Affective
Learner
Engagement
Q15 - I changed my opinion or understanding of an
issue/concept based on my interaction with the
instructor and/or participants.
.929
Q17 - Interacting with others in the program was an
important part of the instructional experience. .904
Q12 - Something another participant did or said
compelled me to provide my own opinion/input. .896
Q14 - The diversity of opinion in the program was
beneficial to my learning. .885
Q16 - I understood a concept better when another
participant asked a question about it. .878
Q13 - I participated effectively in the instructional
delivery. .822
Q6 - The subject matter in the program was
important to me. .950
Q9 - The instructor demonstrated extensive
knowledge about the subject matter. .878
Q11 - The materials and concepts presented in this
program were well suited to my level of expertise. .870
Q10 - This program is important for my personal or
professional development. .865
Q8 - I learned something new in the subject area of
the instruction. .826
Q7 - I was intellectually challenged in this program. .784
Q1- I felt encouraged to volunteer opinion in the
program. -.946
Q5 - I felt good about participating in the discussions
and activities of this program. -.917
Q3 - I enjoyed participating in the instructional
program. -.910
Q4 - I enjoyed this instructional program. -.904
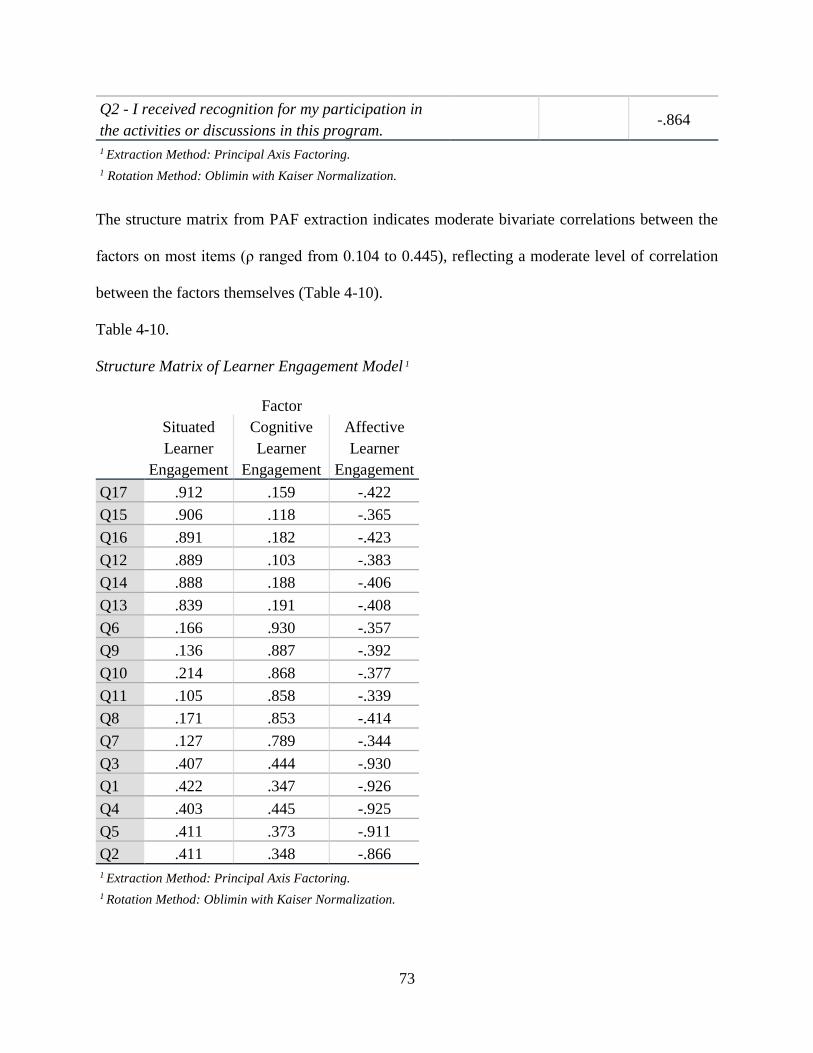
73
Q2 - I received recognition for my participation in
the activities or discussions in this program. -.864
1 Extraction Method: Principal Axis Factoring.
1 Rotation Method: Oblimin with Kaiser Normalization.
The structure matrix from PAF extraction indicates moderate bivariate correlations between the
factors on most items (ρ ranged from 0.104 to 0.445), reflecting a moderate level of correlation
between the factors themselves (Table 4-10).
Table 4-10.
Structure Matrix of Learner Engagement Model 1
Factor
Situated
Learner
Engagement
Cognitive
Learner
Engagement
Affective
Learner
Engagement
Q17 .912 .159 -.422
Q15 .906 .118 -.365
Q16 .891 .182 -.423
Q12 .889 .103 -.383
Q14 .888 .188 -.406
Q13 .839 .191 -.408
Q6 .166 .930 -.357
Q9 .136 .887 -.392
Q10 .214 .868 -.377
Q11 .105 .858 -.339
Q8 .171 .853 -.414
Q7 .127 .789 -.344
Q3 .407 .444 -.930
Q1 .422 .347 -.926
Q4 .403 .445 -.925
Q5 .411 .373 -.911
Q2 .411 .348 -.866
1 Extraction Method: Principal Axis Factoring.
1 Rotation Method: Oblimin with Kaiser Normalization.

74
Item/Instrument Revision
In order to determine which items to retain or revise from the EFA results, McCoach et al.’s
(2013) guidance was applied - well designed and functioning items “have high pattern coefficients
on one primary factor and near zero pattern coefficients on all other factors” (p.143). To judge
whether an item contributes to the interpretation and description of a latent factor, McCoach et al.
(2013) suggests a pattern coefficient of an item should ideally be equal to or greater than .50. To
assess item multidimensionality (i.e. when an item provides unique information on more than one
latent factor), McCoach et al. (2013) suggests eliminating any item with a second pattern
coefficient of greater than 0.30. Applying these criteria to our pattern matrix coefficients, all 17
items were retained from the EFA instrument. Among them, three items were reworded (items
#9, item #10, and item #11) to standardize the terminology (“instructional program” substituted for
“program”) and 3 items (item #2, item #7, and item #14) were paraphrased for clearer
representation of the key concept. This revision was undertaken with an expectation to avoid the
potential of multidimensionality caused by inconsistency of terminology when the instrument is
administered to a broader population.
Subscales Analysis/Internal Reliability & Structural Validity. The EFA produced three
factors which closely corresponded with the design of the items and initial validity analysis. While
initial scale development reflects conceptual and operational definitions of the latent construct
based on a review of literature and grounding in a theoretical framework (McCoach, et al., 2013)
reliability analysis seeks to evaluate how the items “hang together” within the context of the
response data collected. In evaluating the results, analysis began with a thorough review of the
aggregations of items suggested by the EFA loadings (Fabrigar, Wegener, MacCallum, & Strahan,
1999). The first factor corresponds to the interaction between the learner and the environment
75
during the instructional experience, in particular as they relate to the in situ and post-instructional
utility and sense of functional/effective participation derived during the instructional experience.
The second factor relates to the perceived value or importance of the subject matter of the
instructional experience to the learner’s intentional trajectory and his/her interaction with it. In the
original design, all of the items loading on this factor were designed to load on the factor originally
titled “Cognitive Learner Engagement” (CLE). The third factor that emerged from the EFA
corresponds with the affective response of the individual and attitude towards the instructional
experience. This factor retains the original title “Affective Learner Engagement” (ALE) from the
initial design. As initially designed, this factor is titled “Situated Learner Engagement.” In
evaluating the results, analysis consisted of a thorough review of the aggregations of items
suggested by the EFA loadings (Fabrigar, Wegener, MacCallum, & Strahan, 1999), and factor
definitions were refined and further defined in the model (Fabrigar & Wegener, 2012).
Reliability & Descriptive Statistics Analysis: Reliability of the subscales was tested by
conducting an Item Analysis and calculating Cronbach’s α and developing sum scores and
descriptive statistics around those scores. Cronbach’s Alpha (α) coefficients was calculated for
each of sub-scales, evaluating both the value and the Confidence Interval to ensure adequate
reliability, applying McCoach et al. (2013) guidance that the entire CI for Cronbach’s Alpha
should be > 0.80. In addition, Cronbach’s Alpha was evaluated for instruments with each item
within each subscale removed to further assess proper item performance and correlation within
each subscale. The subscales all demonstrate acceptable levels of reliability as all lower limits of
the CI of Cronbach’s Alpha (α) below the minimally acceptable 0.80 (Cortina, 1993).
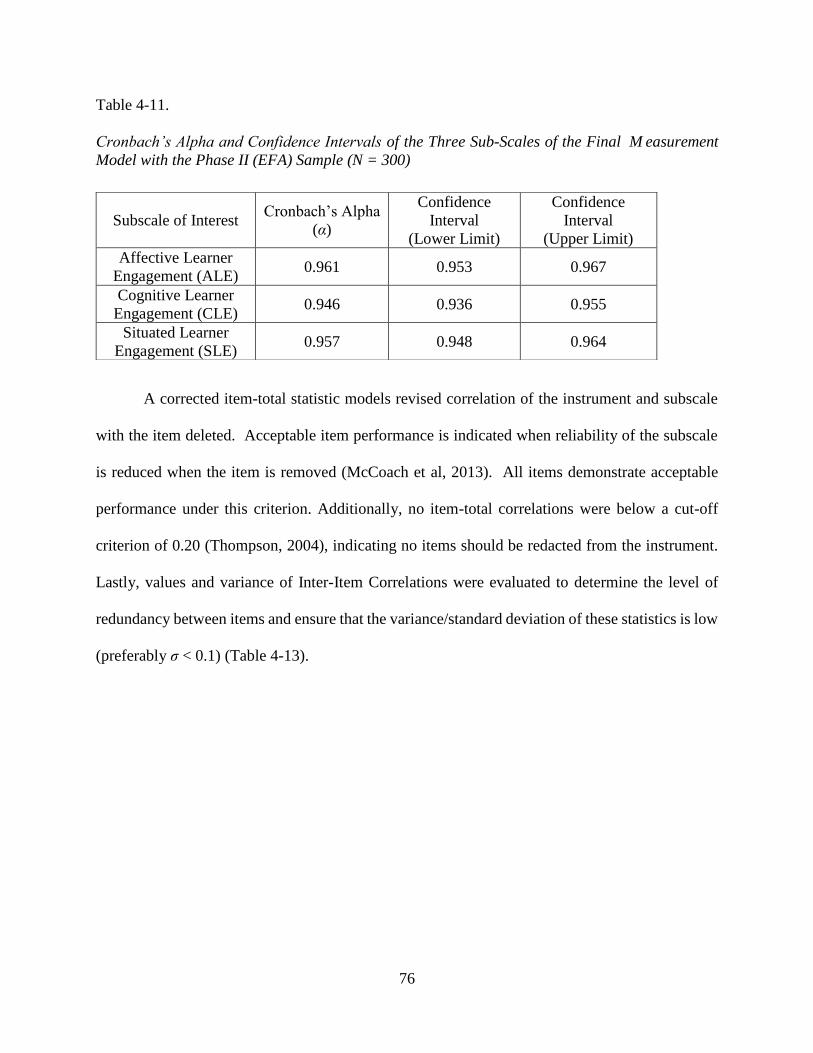
76
Table 4-11.
Cronbach’s Alpha and Confidence Intervals of the Three Sub-Scales of the Final M easurement
Model with the Phase II (EFA) Sample (N = 300)
A corrected item-total statistic models revised correlation of the instrument and subscale
with the item deleted. Acceptable item performance is indicated when reliability of the subscale
is reduced when the item is removed (McCoach et al, 2013). All items demonstrate acceptable
performance under this criterion. Additionally, no item-total correlations were below a cut-off
criterion of 0.20 (Thompson, 2004), indicating no items should be redacted from the instrument.
Lastly, values and variance of Inter-Item Correlations were evaluated to determine the level of
redundancy between items and ensure that the variance/standard deviation of these statistics is low
(preferably σ < 0.1) (Table 4-13).
Subscale of Interest Cronbach’s Alpha
(α)
Confidence
Interval
(Lower Limit)
Confidence
Interval
(Upper Limit)
Affective Learner
Engagement (ALE) 0.961 0.953 0.967
Cognitive Learner
Engagement (CLE) 0.946 0.936 0.955
Situated Learner
Engagement (SLE) 0.957 0.948 0.964
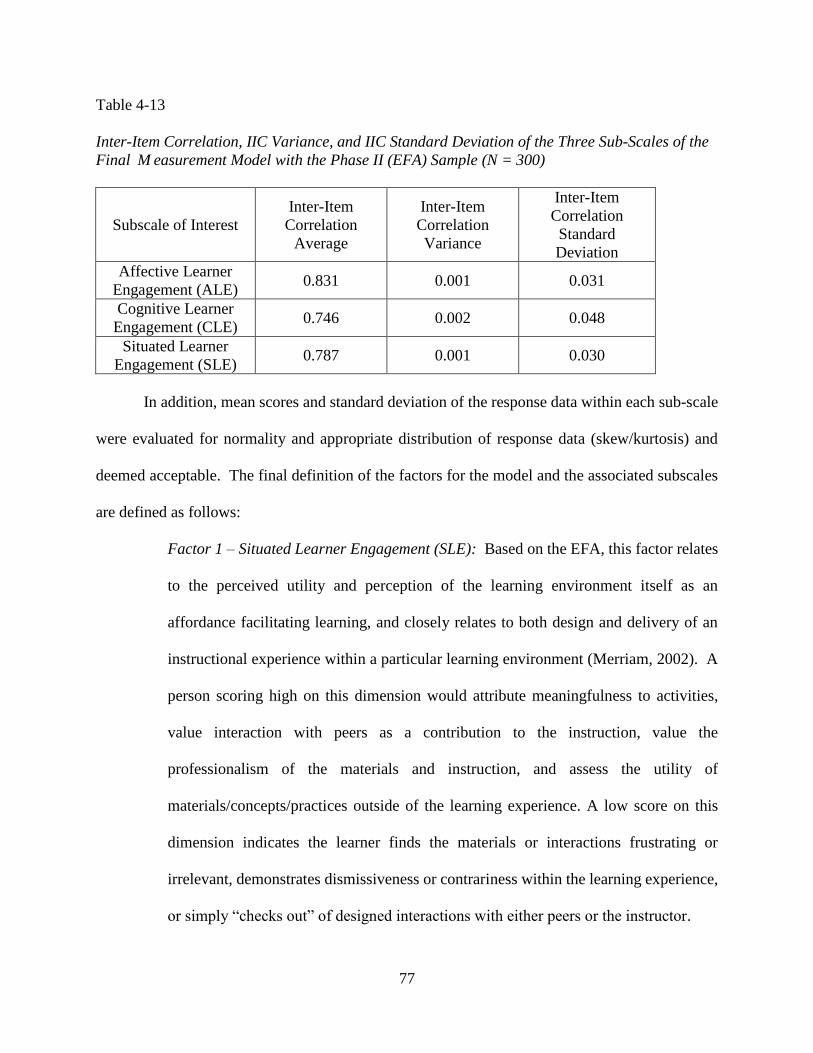
77
Table 4-13
Inter-Item Correlation, IIC Variance, and IIC Standard Deviation of the Three Sub-Scales of the
Final M easurement Model with the Phase II (EFA) Sample (N = 300)
Subscale of Interest
Inter-Item
Correlation
Average
Inter-Item
Correlation
Variance
Inter-Item
Correlation
Standard
Deviation
Affective Learner
Engagement (ALE) 0.831 0.001 0.031
Cognitive Learner
Engagement (CLE) 0.746 0.002 0.048
Situated Learner
Engagement (SLE) 0.787 0.001 0.030
In addition, mean scores and standard deviation of the response data within each sub-scale
were evaluated for normality and appropriate distribution of response data (skew/kurtosis) and
deemed acceptable. The final definition of the factors for the model and the associated subscales
are defined as follows:
Factor 1 – Situated Learner Engagement (SLE): Based on the EFA, this factor relates
to the perceived utility and perception of the learning environment itself as an
affordance facilitating learning, and closely relates to both design and delivery of an
instructional experience within a particular learning environment (Merriam, 2002). A
person scoring high on this dimension would attribute meaningfulness to activities,
value interaction with peers as a contribution to the instruction, value the
professionalism of the materials and instruction, and assess the utility of
materials/concepts/practices outside of the learning experience. A low score on this
dimension indicates the learner finds the materials or interactions frustrating or
irrelevant, demonstrates dismissiveness or contrariness within the learning experience,
or simply “checks out” of designed interactions with either peers or the instructor.
78
Factor 2 – Cognitive Learner Engagement (CLE): This dimension of the construct of
learner engagement relates to the perceived degree of alignment between the learner’s
intent and the design and delivery of the instructional experience. This factor measures
the degree to which the learner intends to advance mastery, learn from others (including
both peers in the classroom and the instructor), and sense of accomplishment stemming
from achievement both within the learning experience, and/or anticipated esteem for
enhanced expertise. Such accomplishment often contributes to a sense of relevance
and applicability of the subject matter to the more universal inset of intentions of the
learner (Young, 2004). Activities that might exemplify this aspect of learner
engagement would include asking sophisticated questions (“follow-on” questions that
build on a point made earlier in the same discussion), sense of self-worth that comes
from achievement, and sense of alignment of subject matter with task and performance
(Cooper, 2010) – they may make frequent comparisons to practices “in the field”, and
questions from such a person would be directed at question of real-world
implementations of theoretical or activity-based concepts presented in the learning
experience. A person scoring high on this dimension would demonstrate
inquisitiveness, curiosity, and engage in supplemental investigation into the subject
area during or after the instructional experience. A low score on this dimension
indicates the learner finds the material (including the opinions and information
indicates the learner finds the material (including the opinions and information from
others) to be irrelevant, boring, or unimportant.
Factor 3 – Affective Learner Engagement (ALE): This dimension reflects a direct
emotional (or visceral) reaction to the learning experience, membership in the
79
community of learning, and sense of safety and willingness to participate in the context
of learning. ALE facilitates emotional involvement of the learner in the learning
experience (Parimalam & Mahadevan, 2012). Activities that might exemplify this
aspect of learner engagement would include positive collaboration with peers (Calvani,
et al., 2010; McDonald & MacKay, 1998), articulation of shared experience and social
modeling (Bandura, 1986), scaffolded development/demonstration of skill/expertise
with an instructor (Vygotsky, 1986), and the sense of self-worth that comes from
participation in a learning experience (Cooper, 2010). A person scoring high on this
dimension would demonstrate frequent discussions with others, active contribution and
integration of discussion with others, and establishment of relationships with others
within the environment during or after the instructional experience – they would appear
gregarious and respectful within the learning environment. A low score on this
dimension indicates the learner finds the opinions of others distracting, finds
collaborative exercise loathsome (because it requires interaction with others, not
because the task is unimportant), and participates/contributes only when mandated by
the expert/instructor.
Confirmatory Factor Analysis
In the second part of phase II of the study, CFA was conducted to further evaluate the
performance of the Learner Engagement Instrument in the population of interest using an
independent sample. A summary of the composition and demographics for the sample used in
the CFA are provided in Appendix D In contrast to EFA, CFA requires definition of the latent
model a priori to assess model fit to a new sample drawn from the same population. The initial
model of the CFA consisted of 17 items selected from EFA, revised as noted to use consistent

80
terminology and provide additional clarity to respondents (Figure 4-3).
Figure 4-3 Final Learner Engagement Construct Model specified a priori in phase II CFA study 1
1 Item numbers are those used in the revised instrument used for CFA. Items were randomized in
instrument delivery.
Each item was aligned as an indicator of only one factor. Items #1, #2, #3, #4, and #5 were
specified as indicators of Affective Learner Engagement (ALE). Items #6, #7, #8, #9, #10, and
#11 were specified as indicators of Cognitive Learner Engagement (CLE). Lastly, items #12,
#13, #14, #15, #16, and #17 were specified as indicators of Situated Learner Engagement (SLE).
Analysis of model fit included both a review of several fit indices as well as an evaluation of path
coefficients for determining the strength of relationship between an item and its associated latent
factor (McCoach et al., 2013).
Fit Indices - Measures of model fit (such as Chi-Square) evaluates the degree to which the
Model-Implied Variance/Covariance matrix matches the population Variance/Covariance matrix
81
estimated by the data. In this case, the goal of CFA is a departure from the typical null-hypothesis
approach – the research instead seeks a Chi-square that provides insufficient data to reject the null
hypothesis – that is, that the Model-Implied covariance matrix from the Model detailed in Figure
4-1 is statistically indistinct from that estimated by the response data. In this case, to evaluate the
goodness of fit of the model to the data, a variety of fit indices were evaluated, including Chi-
Square, CMIN, Standardized Root Mean Square-Residual (SRMR), Root Mean Square Error of
Approximation (RMSEA), Tucker-Lewis Index (TLI), and Normed/Comparative Fit Index
(NFI/CFI), which can be further categorized as “absolute fit indices” or “incremental fit indices”.
Absolute fit indices “evaluate how well an a priori model reproduces the sample data”
(Beauducel & Wittmann, 2005) with the underlying presumption that a model that perfectly
reproduces the data observed would have a fit of zero (absolute fit). Thus, deviation from zero
reflect the “degree of badness” of fit for the model (Kenny, 2015). Incremental fit indices, in
contrast, use zero as the worst-fit standard (called the independence model), and measure
improvement in fit when the specified model is compared to the independence model (Hu &
Bentler, 1998). In the present study, the Chi-Square/CMIN unsurprisingly indicated the specified
Learner Engagement Model is not a good fit for the data (χ2 = 276.602, df = 117, Sig. = 0.000,
CMIN/DF = 2.364). However, χ2 is sensitive to sample size and the number of degrees of freedom
in the model, and many commentators note that with large sample sizes will yield a statistically
significant χ2 even in the presence of a trivial amount of data misfit and thus provides little
meaningful insight into model fit (McCoach, et al., 2013; Kenny, 2015). As such, additional
absolute indices of fit (RMSEA and SRMR) were evaluated to provide a more accurate assessment
of fit. RMSEA is a ratio of the Chi-Square adjusted for the degrees of freedom and for the
proscribed model (RMSEA = 0.068) is within the generally prescribed limit of .08. Standardized
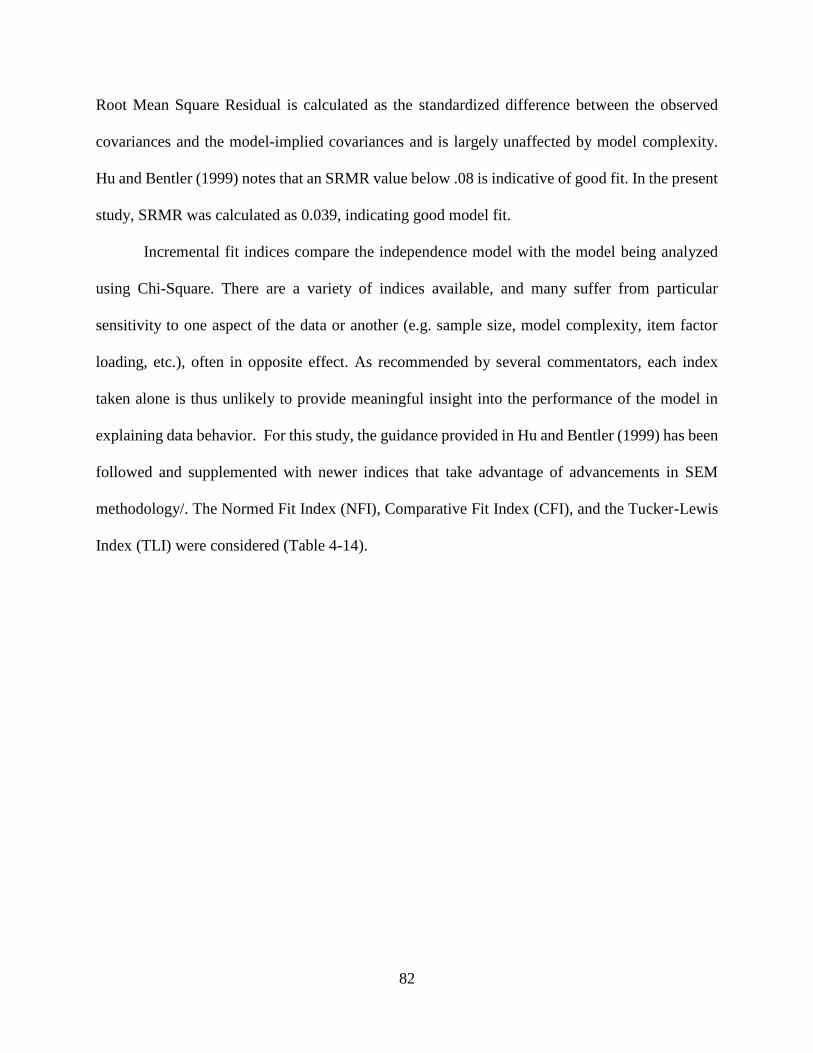
82
Root Mean Square Residual is calculated as the standardized difference between the observed
covariances and the model-implied covariances and is largely unaffected by model complexity.
Hu and Bentler (1999) notes that an SRMR value below .08 is indicative of good fit. In the present
study, SRMR was calculated as 0.039, indicating good model fit.
Incremental fit indices compare the independence model with the model being analyzed
using Chi-Square. There are a variety of indices available, and many suffer from particular
sensitivity to one aspect of the data or another (e.g. sample size, model complexity, item factor
loading, etc.), often in opposite effect. As recommended by several commentators, each index
taken alone is thus unlikely to provide meaningful insight into the performance of the model in
explaining data behavior. For this study, the guidance provided in Hu and Bentler (1999) has been
followed and supplemented with newer indices that take advantage of advancements in SEM
methodology/. The Normed Fit Index (NFI), Comparative Fit Index (CFI), and the Tucker-Lewis
Index (TLI) were considered (Table 4-14).
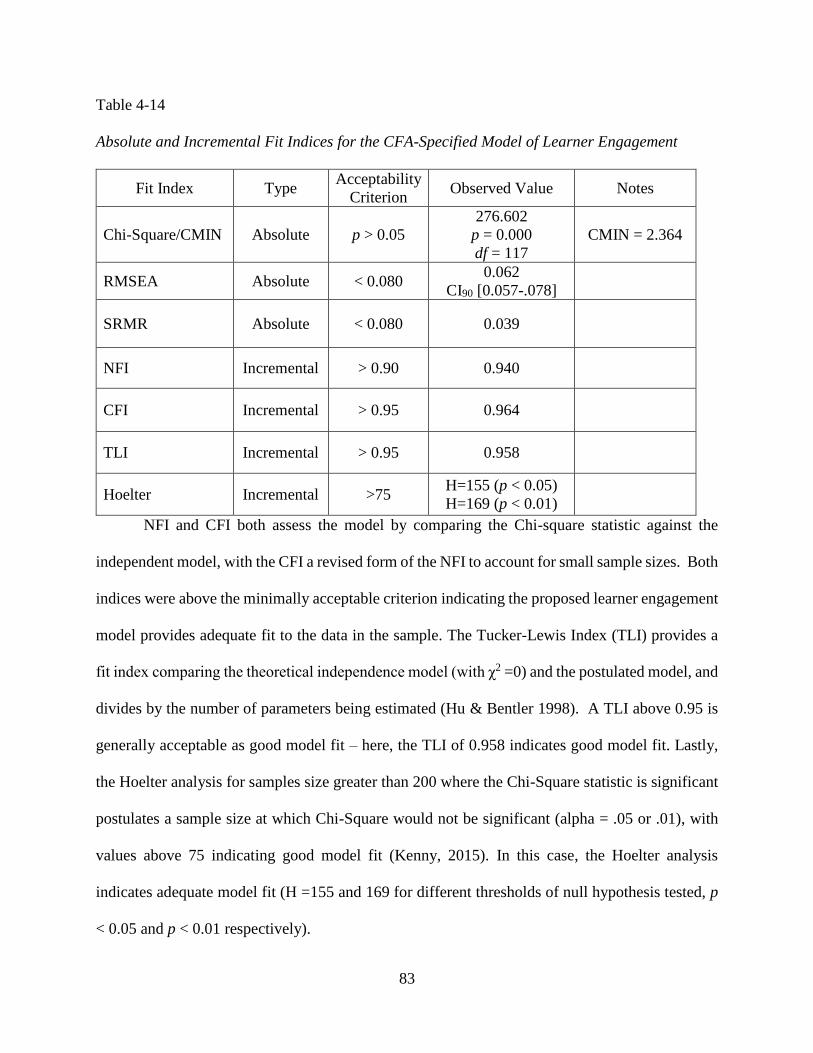
83
Table 4-14
Absolute and Incremental Fit Indices for the CFA-Specified Model of Learner Engagement
Fit Index Type Acceptability
Criterion Observed Value Notes
Chi-Square/CMIN Absolute p > 0.05
276.602
p = 0.000
df = 117
CMIN = 2.364
RMSEA Absolute < 0.080 0.062
CI90 [0.057-.078]
SRMR Absolute < 0.080 0.039
NFI Incremental > 0.90 0.940
CFI Incremental > 0.95 0.964
TLI Incremental > 0.95 0.958
Hoelter Incremental >75 H=155 (p < 0.05)
H=169 (p < 0.01)
NFI and CFI both assess the model by comparing the Chi-square statistic against the
independent model, with the CFI a revised form of the NFI to account for small sample sizes. Both
indices were above the minimally acceptable criterion indicating the proposed learner engagement
model provides adequate fit to the data in the sample. The Tucker-Lewis Index (TLI) provides a
fit index comparing the theoretical independence model (with χ2 =0) and the postulated model, and
divides by the number of parameters being estimated (Hu & Bentler 1998). A TLI above 0.95 is
generally acceptable as good model fit – here, the TLI of 0.958 indicates good model fit. Lastly,
the Hoelter analysis for samples size greater than 200 where the Chi-Square statistic is significant
postulates a sample size at which Chi-Square would not be significant (alpha = .05 or .01), with
values above 75 indicating good model fit (Kenny, 2015). In this case, the Hoelter analysis
indicates adequate model fit (H =155 and 169 for different thresholds of null hypothesis tested, p
< 0.05 and p < 0.01 respectively).
84
Factor Loadings: The next step in evaluation of the model is to evaluate the path
coefficients for the specified model. The path coefficients represent the strength of the relationship
between the observed (exogenous) variables and the latent factors (endogenous variables
comprising the learner engagement construct. In evaluating path coefficients, analysis begins with
statistical significance. McCoach et al. (2013) note that is rare for an item to have a non-
statistically significant path from its hypothesized factor, but if an item is unrelated to its factor, it
should be redacted from the instrument or the model re-specified to align the item with another
factor. In this analysis, we divide each unstandardized path coefficient by its standard error to
compute a critical ratio (CR) (McCoach, et al., 2013). If this ratio is greater than or equal to |1:96|
the path is considered statistically significant. If the ratio of the unstandardized path coefficient to
its standard error is less than |1.96| the path is considered non-statistically significant (McCoach,
2003). Table 4-15 presents the CR for each of the items, indicating all path coefficients are
statistically significant.

85
Table 4-15
Regression Weights for the CFA-Specified Model of Learner Engagement
Item Factor Loading Estimate S.E. C.R.
Q1 Affective_Learner_Engagement 1.000
Q2 Affective_Learner_Engagement .987 .052 18.973
Q3 Affective_Learner_Engagement 1.033 .047 22.153
Q8 Cognitive_Learner_Engagement .979 .047 20.961
Q9 Cognitive_Learner_Engagement .835 .043 19.463
Q11 Cognitive_Learner_Engagement .887 .048 18.664
Q7 Cognitive_Learner_Engagement .960 .047 20.228
Q10 Cognitive_Learner_Engagement .944 .047 20.110
Q6 Cognitive_Learner_Engagement 1.000
Q5 Affective_Learner_Engagement 1.056 .048 22.103
Q4 Affective_Learner_Engagement .985 .048 20.556
Q12 Situated_Learner_Engagement 1.000
Q14 Situated_Learner_Engagement 1.033 .053 19.652
Q16 Situated_Learner_Engagement .975 .053 18.465
Q13 Situated_Learner_Engagement .960 .054 17.776
Q15 Situated_Learner_Engagement .875 .054 16.191
Q17 Situated_Learner_Engagement 1.046 .073 14.248
Table 4-16 presents factor loading estimates using standardized regression weights for all
seventeen items indicate good to excellent relationships on one of the three factors, with primary
factor loadings ranging from 0.712 to 0.907, with no multi-dimensional items.

86
Table 4-16
Standardized Regression Weights/Factor Loadings for the CFA-Specified Model of Learner
Engagement
Item Factor Loading Estimate
Q1 Affective_Learner_Engagement .861
Q2 Affective_Learner_Engagement .837
Q3 Affective_Learner_Engagement .908
Q8 Cognitive_Learner_Engagement .853
Q9 Cognitive_Learner_Engagement .823
Q11 Cognitive_Learner_Engagement .805
Q7 Cognitive_Learner_Engagement .839
Q10 Cognitive_Learner_Engagement .836
Q6 Cognitive_Learner_Engagement .897
Q5 Affective_Learner_Engagement .907
Q4 Affective_Learner_Engagement .874
Q12 Situated_Learner_Engagement .851
Q14 Situated_Learner_Engagement .876
Q16 Situated_Learner_Engagement .845
Q13 Situated_Learner_Engagement .825
Q15 Situated_Learner_Engagement .778
Q17 Situated_Learner_Engagement .712
The error residual (represented in the model as the residuals for each exogenous variable
in the model) is also of interest, as it represents the unique variance in each item coupled with
measurement error for each item. As McCoach et al. (2013) note, this analysis at first blush does
appear counterintuitive as we seek to reduce measurement error in the pursuit of reliability and
accuracy. However, this analysis seeks to address whether “at least some unique variance in each
item that is not explained by the factor. Otherwise, the item and the factor are completely
redundant, because the lack of error variance suggests that the factor completely explains the item
variance” (McCoach, et al., 2013, p. 152). Shown in Table 4-17, it was observed that all error
variances are statistically significant, with C.R. values ranging from 4.251 to 8.315. No Heywood
cases (negative error variances) were noted, whose presence would indicate a structural solution
error in the model (also called an inadmissible solution, McCoach et al., 2013, p.229) that would
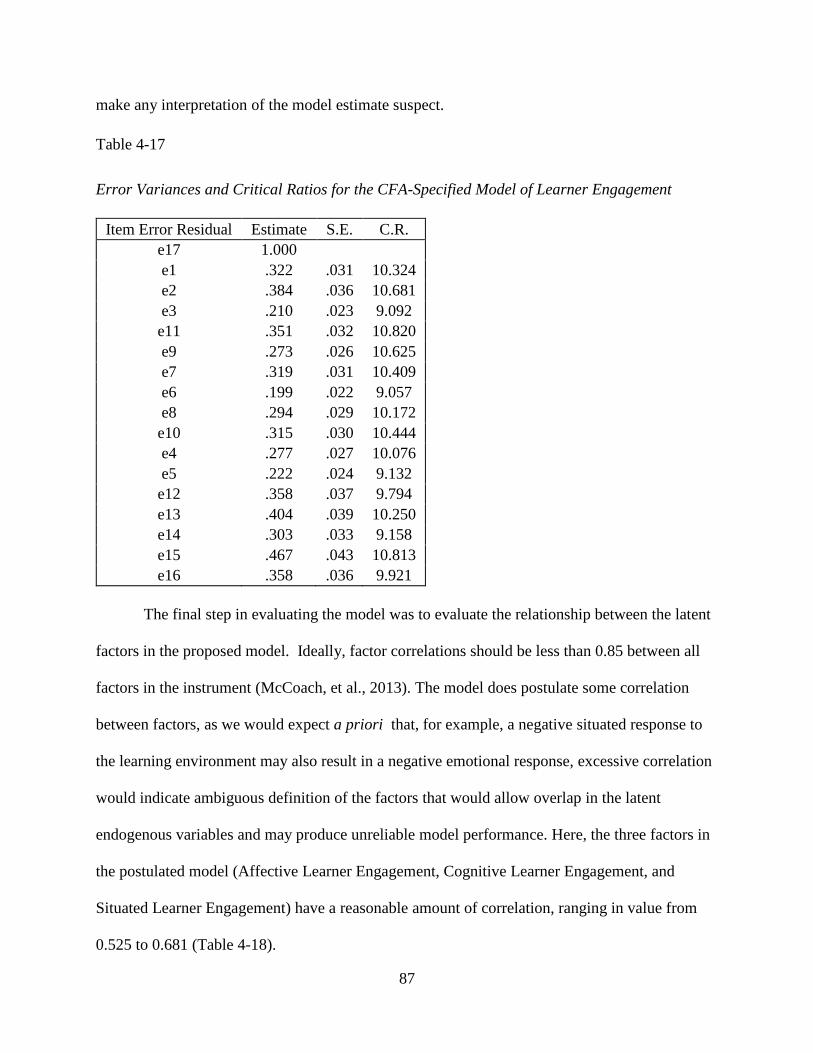
87
make any interpretation of the model estimate suspect.
Table 4-17
Error Variances and Critical Ratios for the CFA-Specified Model of Learner Engagement
Item Error Residual Estimate S.E. C.R.
e17 1.000
e1 .322 .031 10.324
e2 .384 .036 10.681
e3 .210 .023 9.092
e11 .351 .032 10.820
e9 .273 .026 10.625
e7 .319 .031 10.409
e6 .199 .022 9.057
e8 .294 .029 10.172
e10 .315 .030 10.444
e4 .277 .027 10.076
e5 .222 .024 9.132
e12 .358 .037 9.794
e13 .404 .039 10.250
e14 .303 .033 9.158
e15 .467 .043 10.813
e16 .358 .036 9.921
The final step in evaluating the model was to evaluate the relationship between the latent
factors in the proposed model. Ideally, factor correlations should be less than 0.85 between all
factors in the instrument (McCoach, et al., 2013). The model does postulate some correlation
between factors, as we would expect a priori that, for example, a negative situated response to
the learning environment may also result in a negative emotional response, excessive correlation
would indicate ambiguous definition of the factors that would allow overlap in the latent
endogenous variables and may produce unreliable model performance. Here, the three factors in
the postulated model (Affective Learner Engagement, Cognitive Learner Engagement, and
Situated Learner Engagement) have a reasonable amount of correlation, ranging in value from
0.525 to 0.681 (Table 4-18).
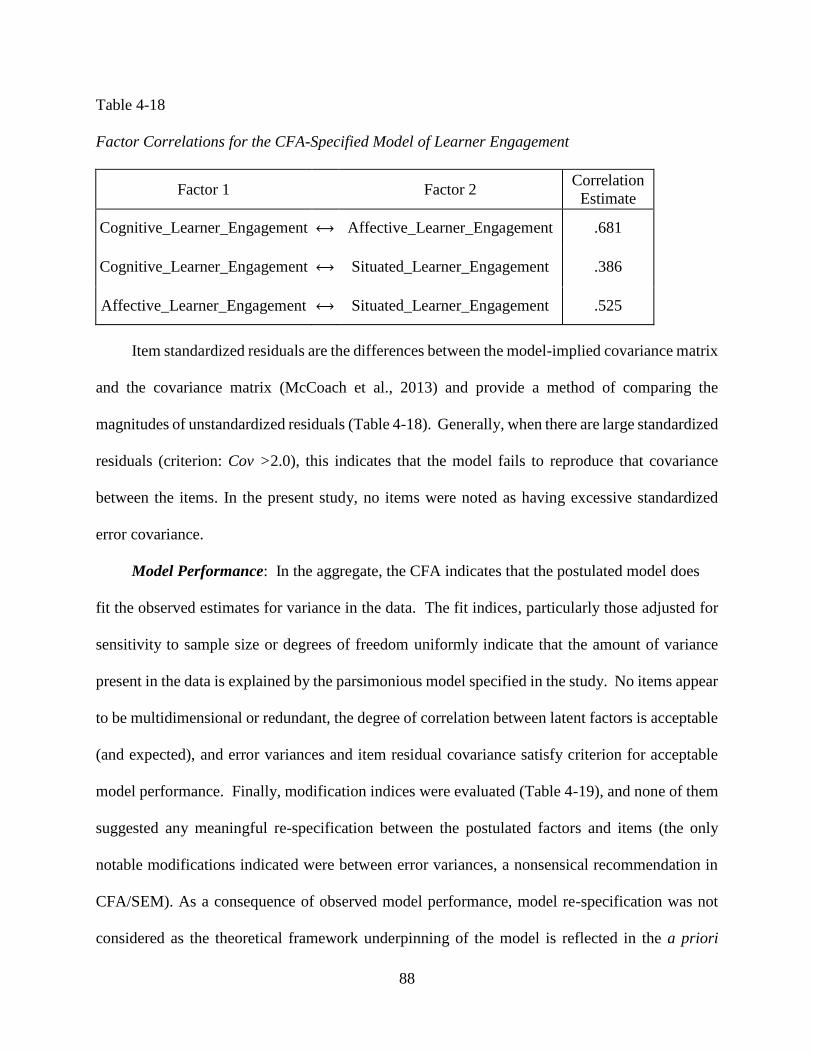
88
Table 4-18
Factor Correlations for the CFA-Specified Model of Learner Engagement
Factor 1 Factor 2 Correlation
Estimate
Cognitive_Learner_Engagement ⟷ Affective_Learner_Engagement .681
Cognitive_Learner_Engagement ⟷ Situated_Learner_Engagement .386
Affective_Learner_Engagement ⟷ Situated_Learner_Engagement .525
Item standardized residuals are the differences between the model-implied covariance matrix
and the covariance matrix (McCoach et al., 2013) and provide a method of comparing the
magnitudes of unstandardized residuals (Table 4-18). Generally, when there are large standardized
residuals (criterion: Cov >2.0), this indicates that the model fails to reproduce that covariance
between the items. In the present study, no items were noted as having excessive standardized
error covariance.
Model Performance: In the aggregate, the CFA indicates that the postulated model does
fit the observed estimates for variance in the data. The fit indices, particularly those adjusted for
sensitivity to sample size or degrees of freedom uniformly indicate that the amount of variance
present in the data is explained by the parsimonious model specified in the study. No items appear
to be multidimensional or redundant, the degree of correlation between latent factors is acceptable
(and expected), and error variances and item residual covariance satisfy criterion for acceptable
model performance. Finally, modification indices were evaluated (Table 4-19), and none of them
suggested any meaningful re-specification between the postulated factors and items (the only
notable modifications indicated were between error variances, a nonsensical recommendation in
CFA/SEM). As a consequence of observed model performance, model re-specification was not
considered as the theoretical framework underpinning of the model is reflected in the a priori

89
model, the model is parsimonious, and model performance was acceptable.
Table 4-19
Modification Indices for the CFA-Specified Model of Learner Engagement
Residual Factor M.I. Par Change
e15 <--> Affective_Learner_Engagement 2.782 -.049
e14 ⟷ Affective_Learner_Engagement 2.046 .037
e12 ⟷ e17 8.166 .112
e5 ⟷ e13 5.286 .049
e5 ⟷ e12 2.806 -.034
e6 ⟷ e13 6.412 .052
e6 ⟷ e14 5.469 -.043
e6 ⟷ e12 3.810 -.038
e6 ⟷ e10 2.261 -.026
e7 ⟷ e13 5.368 -.056
e7 ⟷ e14 12.225 .077
e9 ⟷ e10 2.737 -.032
e9 ⟷ e7 3.134 .034
e9 ⟷ e11 3.111 .035
e8 ⟷ Situated_Learner_Engagement 2.099 -.043
e8 ⟷ Affective_Learner_Engagement 2.549 .038
e8 ⟷ e14 7.862 -.060
e8 ⟷ e6 4.542 .036
e8 ⟷ e7 3.001 -.035
e8 ⟷ e11 5.727 -.051
e3 ⟷ Cognitive_Learner_Engagement 2.402 .033
e3 ⟷ e5 14.663 .060
e3 ⟷ e4 4.050 -.034
e3 ⟷ e9 3.608 -.032
e2 ⟷ e15 2.974 -.048
e2 ⟷ e14 4.064 .048
e2 ⟷ e5 7.856 -.056
e2 ⟷ e4 3.255 .039
e2 ⟷ e3 4.361 -.041
e1 ⟷ Cognitive_Learner_Engagement 2.822 -.043
e1 ⟷ e15 3.340 -.047
e1 ⟷ e12 2.467 .037
e1 ⟷ e5 3.620 -.035
e1 ⟷ e7 3.282 -.039

90
Residual Factor M.I. Par Change
e1 ⟷ e9 5.764 .047
e1 ⟷ e2 16.107 .093
Reliability Analysis
With the factor structure fully defined, reliability analysis of the items was conducted to
evaluate the internal consistency and performance of the items within the instrument (McCoach et
al, 2013). Several procedures were conducted in order to determine reliability and validity of
Learner Engagement Instrument and related subscales. The data from the Phase II CFA was used
for the reliability analysis. Data were screened for out-of-range or data entry error against the raw
data and the number of cases evaluated for suitability of analysis. An item analysis was then
conducted to examine the relevance of each item within the entire survey, using an Inter-Item
Correlation to evaluate how the items “hang together” (McCoach et al, 2013). Next, Cronbach’s
Alpha (α) coefficients were calculated for the entire survey as well as for each of the sub-scales.
Finally, mean scores and descriptive statistics relating to the distribution of the response data were
evaluated for efficacy and coverage within each subscale. SPSS 25.0 was used for the analyses.
Item Analysis – For examination of the distributions of each item responses and the relations
of each item with others and the entire survey, item analyses were conducted. In this context, the
item-total correlations for each item were examined along with the Corrected Item-Total statistic
(revised correlation modelling the instrument/subscale with the item deleted). In the aggregate,
this information indicates the degree to which the items are related to each other, and to the
aggregate sub-scale (McCoach et al., 2013). Then, the items whose item-total correlations were
below a cut-off criterion of 0.20 (Thompson, 2004) were examined for modification in the Learner
Engagement Instrument. Negative item correlations were also analyzed, as these are indicia of
poor correlation with the desired sub-scale and/or need for reverse scoring or redaction.
91
Cronbach’s Alpha – Cronbach’s Alpha (α) coefficients were calculated for the entire
survey as well as for each of sub-scales, evaluating both the value and the Confidence Interval to
ensure adequate reliability (generally the entire CI for Cronbach’s Alpha should be > 0.80). In
addition, Cronbach’s Alpha were evaluated for instruments with each item within each subscale
removed to further assess proper item performance and correlation within each subscale. Raykov
(1997) notes that this analysis may result in improper estimates of internal consistency when non-
tau equivalent factors are modeled. In this analysis, Cronbach’s alpha is deemed to be acceptable
as an uncorrected estimate of internal consistency as the co-generic items along the three subscales
resulted in very similar pattern coefficients (as noted in the CFA analysis, Table 4-11) with little
inter-item correlation (McCoach et al, 2013), and item unidimensionality was established in both
the EFA and CFA (one of the critical underlying assumptions of the validity of this analysis).
Cronbach’s alpha and 95% confidence interval for the three sub-scales of the Learner Engagement
Model are detailed in Table 4-19. Generally, the subscales all demonstrate acceptable levels of
reliability as all lower limits of the CI of Cronbach’s Alpha (α) are below the minimally acceptable
0.80 (Cortina, 1993).

92
Table 4-20
Cronbach’s Alpha and Confidence Intervals of the Three Sub-Scales of the Final Measurement
Model with the Phase II (CFA) Sample (N = 300)
Descriptive Statistics – Values and variance of inter-item correlations were evaluated to
determine the level of redundancy between items and ensure that the variance/standard deviation
of these statistics is low (preferably σ < 0.1). In addition, mean scores and standard deviation of
the response data within each sub-scale was evaluated for normality (i.e. excess skew and/or
kurtosis) to ensure it represents the population response pattern and is appropriate for analysis
(Table 4-21). As no missed responses were recorded, no decisions regarding missing data
replacement were necessary. Kurtosis was evaluated as acceptable for analysis, albeit slightly less
than desired.
Subscale of Interest Cronbach’s Alpha
(α)
Confidence
Interval
(Lower Limit)
Confidence
Interval
(Upper Limit)
Affective Learner
Engagement (ALE) 0.944 0.933 0.953
Cognitive Learner
Engagement (CLE) 0.936 0.924 0.946
Situated Learner
Engagement (SLE) 0.935 0.923 0.946
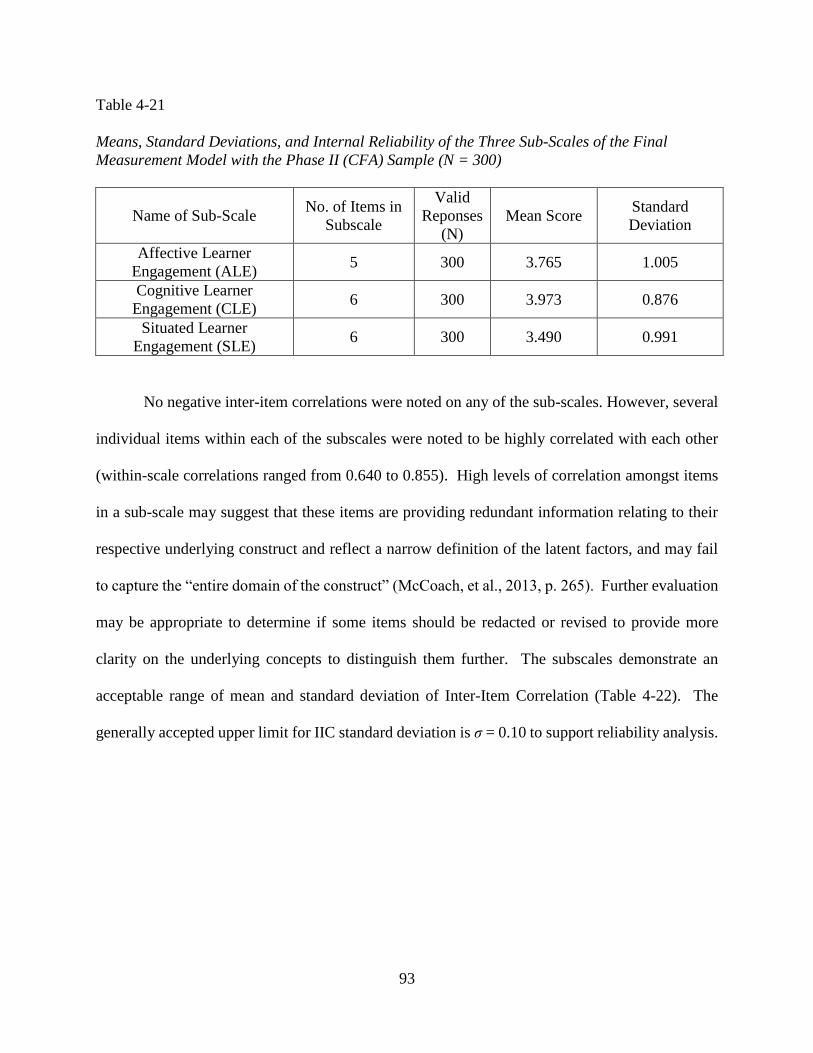
93
Table 4-21
Means, Standard Deviations, and Internal Reliability of the Three Sub-Scales of the Final
Measurement Model with the Phase II (CFA) Sample (N = 300)
Name of Sub-Scale No. of Items in
Subscale
Valid
Reponses
(N)
Mean Score Standard
Deviation
Affective Learner
Engagement (ALE) 5 300 3.765 1.005
Cognitive Learner
Engagement (CLE) 6 300 3.973 0.876
Situated Learner
Engagement (SLE) 6 300 3.490 0.991
No negative inter-item correlations were noted on any of the sub-scales. However, several
individual items within each of the subscales were noted to be highly correlated with each other
(within-scale correlations ranged from 0.640 to 0.855). High levels of correlation amongst items
in a sub-scale may suggest that these items are providing redundant information relating to their
respective underlying construct and reflect a narrow definition of the latent factors, and may fail
to capture the “entire domain of the construct” (McCoach, et al., 2013, p. 265). Further evaluation
may be appropriate to determine if some items should be redacted or revised to provide more
clarity on the underlying concepts to distinguish them further. The subscales demonstrate an
acceptable range of mean and standard deviation of Inter-Item Correlation (Table 4-22). The
generally accepted upper limit for IIC standard deviation is σ = 0.10 to support reliability analysis.

94
Table 4-22
Inter-Item Correlation, IIC Variance, and IIC Standard Deviation of the Three Sub-Scales of the
Final Measurement Model with the Phase II (CFA) Sample (N = 300)
Subscale of Interest
Inter-Item
Correlation
Average
Inter-Item
Correlation
Variance
Inter-Item
Correlation
Standard
Deviation
Affective Learner
Engagement (ALE) 0.772 0.001 0.033
Cognitive Learner
Engagement (CLE) 0.709 0.001 0.036
Situated Learner
Engagement (SLE) 0.705 0.002 0.038
Lastly, correlation among the subscale scores are shown in Table 4-23, and indicate
moderate correlation amongst the scores, as expected based on the theoretical framework upon
which the instrumentation was developed, predicted by the model, and confirmed by CFA
analysis.
Table 4-23
Subscale Score Correlations of the Three Sub-Scales of the Final Measurement Model with the
Phase II (CFA) Sample (N = 300)
Name of Sub-Scale Affective Learner
Engagement (ALE)
Cognitive Learner
Engagement (CLE)
Situated Learner
Engagement (SLE)
Affective Learner
Engagement (ALE) 1.000 0.636 0.492
Cognitive Learner
Engagement (CLE) 0.636 1.000 0.360
Situated Learner
Engagement (SLE) 0.492 0.360 1.000
Summary
The four research questions addressed in this chapter were:
1. What are the perceived dimensions and characteristics of learner engagement? (RQ1)
2. What experiences and perceptions of the learner, and the interactions within the
environment, affect learner engagement? (RQ2)
95
3. How can those experiences, perceptions, and interactions be used to develop a model of
learner engagement? (RQ3)
4. What observable indicia exist of the learner-environment unit of analysis for the
engagement of a learner in a particular environment? (RQ4)
Regarding these questions, qualitative data analysis and content validation suggested three general
dimensions of learner engagement: Affective Learner Engagement, Cognitive Learner
Engagement, and Situated Learner Engagement with associated behaviors or material indicia
drawn from interviews with stakeholders in the instructional services industry. An instrument was
developed and operationalized with a representative sample from the population of interest. Based
on the EFA results, 17 items were retained in the instrument aligned to a construct with three latent
factors. Basic reliability analysis indicated that each of three subscale items demonstrated
satisfactory internal consistency and reliability. A second set of data was collected based on a
slightly modified version of the instrument to evaluate model suggested by the EFA and the
qualitative study. The final measurement instrument included the revised 17 items that
demonstrated unidimensionality and effective loading on one of the three factors. The CFA results
exhibited an acceptable level of model fit to the data collected. Results from the EFA, CFA, and
reliability analyses confirmed that the three dimensions of the learner engagement model were
statistically valid and robust. These findings indicated that the three dimensions of the learner
engagement model can be meaningfully and practically measured to provide some indicia of the
latent construct within the learning experience across various learning environments and
instructional subject areas for the population of interest. The final version of the learner
engagement instrument is presented in Appendix E.
96
Chapter 5 - Model & Theory
Introduction
This study considered the construct of learner engagement and applied a mixed method
approach to develop a model based on affective instrumentation. The study sought to address four
questions:
What are the perceived dimensions and characteristics of learner engagement? (RQ1)
What experiences and perceptions of the learner, and the interactions within the
environment, affect learner engagement? (RQ2)
What observable indicia exist of the learner-environment unit of analysis for engagement
of a learner in a particular environment? (RQ3)
How can those experiences, perceptions, and interactions be used to develop a model of
learner engagement? (RQ4)
To date, research into the learner engagement construct had adopted either an Information
Processing model (Reitman, 1965) focusing solely on within-the-learner constructs (Appleton et
al., 2006) or a formulaic behaviorist model that leveraged earlier within-the-learner constructs
coupled with observable indicia (Trowler, 2010). In contrast, this study adopted a situated
cognition framework in light of the rapidly evolving nature of learning environments and the
postulated and observed effects of these environments on learning and resulting learner
trajectories. The unit of analysis is different than previous studies – rather than focusing solely on
the learner, this study approached the construct as a dynamic inter-relationship of the learner and
a particular learning environment, and extended the work of Trowler (2010) in identifying not just
observable indicia, but seeking to identify the latent construct of interaction between a learner and
the specific learning environmental affordances within a specific instructional experience. This
approach was adopted largely to address the fairly significant shortcomings of even the most
advanced behavioral models – namely, that different learning environments produce
97
fundamentally different learner experiences and opportunities to learn and must therefore produce
differentiated outcomes.
To address the first three research questions, this study undertook a basic interpretive
qualitative inquiry into the construct with representative samples from different stakeholder groups
drawn from the population of U.S. working adults who periodically complete some form of
professional or vocational training. A basic interpretive study was employed to avoid some bias
stemming from the researcher’s personal experience in the field and provide insights that otherwise
might be missed as part of learner engagement model definition. Following the definition of a
more clearly defined latent model structure, the fourth research question was addressed with a
quantitative study that developed and operationalized the construct in an affective instrument. The
instrument was developed and implemented, with two samples from the population of interest and
subjected to validity analysis, reliability analysis, EFA (n=300) and a CFA (n=300). The
remainder of this chapter is structured in four parts:
1. A summary and implications of the three-factor model for learner engagement as
developed in the basic interpretive inquiry and refined in the quantitative study;
2. A discussion of the validity evidence for the learner engagement instrument;
3. A discussion of the limitations of the study;
4. A discussion of recommendations for further research.
Summary and Implications of the Learner Engagement Model
The present study advances the understanding of learner engagement as a formal construct
by adopting a situated cognition theoretical framework. The latent factors hypothesized and
developed through qualitative inquiry were, in turn, empirically validated through sampling of the
population of interest. In contrast to earlier efforts, the framework as developed in this study is
sensitive to the dynamic nature of learning within different learning environments and is a
foundational step in developing a methodology to provide the optimal learner trajectory based on

98
instructional need and learning environment. With respect to the first research question, the study
hypothesized a three-factor latent construct for learner engagement based on an affective, a
cognitive, and a situated dynamic interaction between the learner and the learning environment.
The basic interpretive inquiry into the construct through interviews and a review of instructional
artifacts from a variety of professional development contexts and stakeholders provided several
common themes from which the factors were further refined. The situated learner response, in
particular, changed its definition extensively as a consequence of the qualitative inquiry – the
interaction of learner with the environment extended far beyond the scope of that considered by
previous research or this study as it was proposed. Situated learner engagement includes not just
the learning environment immediately evident during delivery but includes all of the remaining
operational context of the training both for the learner and the organization. The qualitative inquiry
also provided extensive data detailing key characteristics of the current state of professional
training in the United States.
The present study developed the learner engagement construct based on a comprehensive
cognitive framework, qualitative inquiry, and applied extensive psychometric procedures for
instrument development. The learner engagement model that emerged from this study has two key
implications. First, that the moderation of effect implicated by the partial correlations of the three
latent factors suggests that any one factor of learner engagement is insufficient in and of itself to
result in an engaged learner. This characteristic of the latent construct is of profound importance
for both instructional design and delivery in the context of professional training of adults. With the
advent of a myriad of new learning environments in instructional treatments and techniques, the
requirement to place a learner in an effective and supportive learning environment and deliver
relevant and authentic instructional content is critical to engaging the learner. While this may seem
99
self-evident, discussions with the programmatic stakeholders during the basic interpretive inquiry
indicated that those considerations were secondary or ignored in the fielding of an instructional
program for organizational development.
The second implication of this model is that the perception of the learner of both the
training program and the alignment of intent between the learner in the instructional program being
delivered is critical to learner engagement. This characteristic of the model is what distinguishes
learner engagement from motivation or intellectual interest, because it is dynamic within the
learning experience. The alignment of instructional intent (stemming from, inter alia, an
organizational need or objective) with that of the learner is the responsibility of both the designer
and the instructional delivery, and no stakeholder or instructor interviewed expressed any
experience in explicitly attempting to do so during an instructional delivery. This practice is borne
out by research noting the modern trend of shifting responsibility for learning and professional
development from the organization to the individual (Kamoche at al., 2011; Pang et al., 2009). In
such cases, learners in the professional development are expected to align themselves with the
perceived intent of the instructional program with little or no guidance, resulting in some likelihood
that some learners will get it wrong and consequently not engage with the program.
The learner engagement model has profound implications in the design and delivery of
professional development training in the U.S. workforce. As noted in the introduction to the study,
the resources expended in industry and workforce professional development are both extensive
and, in many cases, wasted. Attrition in organizationally mandated instructional programs can be
as high as 80%, a statistic borne out by the qualitative inquiry of the study. By focusing on the
complicated and dynamic in situ processes of learning based on a mixed-method approach, a
methodologically sound construct of learner engagement was developed (Creswell, 2012).

100
Coupled with learner analytics collected during delivery, the construct and related instrumentation
can provide a more complete picture of the mechanism and dynamics of learner engagement, and
ultimately provide expansive capabilities in assessing and remediating a disengaged learner before
attrition.
Validity Evidence for the Learner Engagement Instrument
Developing validity evidence for an instrument is a Sisyphean task – population
demographics change, learning is affected by profound new technological advances and
instructional methodologies, and thus an instrument must continually be subjected to validity
review against new data, theoretical review, and sampling to develop additional validity evidence.
As noted by McCoach et al. (2013), validity is never completely established for an instrument, but
rather “an ongoing process of accumulating various sources of evidence” in support of instrument
data interpretation (McCoach et al., 2013, p. 91). In this study, extant research coupled with a
situated cognition theoretical framework suggested a three-factor latent construct for learner
engagement and a different unit of analysis (learner-environment interaction) in developing
instrumentation (Young et al., 1997). The literature review provided directly related studies to
learner engagement construct (albeit with different theoretical frameworks) and provided excellent
references to related fields of inquiry that informed the development of the factor definitions (Clark
& Watson, 1995).
With respect to the qualitative inquiry, the data that provided the basis of the factor
structure of the construct followed a protocol to enhance the trustworthiness and credibility of the
data (Shenton, 2004), analogous to reliability and internal validity in quantitative studies and
sought to ensure that the findings were congruent with reality (Merriam, 2008). Transferability
was optimized to the extent possible by purposeful sampling of different stakeholder populations

101
to produce maximum variation in the qualitative sample and elicit different perspectives to achieve
theme saturation (Merriam, 2009). Once collected, the data were collected and analyzed in a multi-
step axial coding approach to develop categories and then themes that formed the basis of the
factor definitions in the quantitative study and triangulated where possible. The findings were then
member-checked to confirm interpretations and both positive and negative cases were
investigated. Finally, axial coding was also conducted by a peer researcher with extensive
experience in the industry and held an advanced degree in a related field, and the results integrated
into the overall coding taxonomy. With themes developed, conceptual and operational factor
definitions were reviewed by two researchers with expertise in cognition and instruction whose
formative feedback was used to refine the definitions (McKenzie et al., 1999). Items were
developed to fully explore potentially relevant criteria related to each of the factors in the construct
of interest (Clark & Watson, 1995), drawing both from the quantitative data and informed by the
literature review where scales of a factor were similar to the construct investigated in this study.
In the quantitative portion of the study, construct validity was central (Moss, 1992).
Construct validity refers to “the validity of inference about the higher constructs that represent
sampling particulars” (Shadish, Cook, & Campbell, 2002, p. 38). To establish construct validity
evidence, candidate items were subjected to screening for redundancy, wording, and clarity, before
being evaluated for content validity by a panel of six instructional and cognition experts (Lawshe,
1975; McKenzie et al., 1999). For items meeting acceptable criteria, a draft instrument was
developed to measure the latent construct to assess if an adequate level of content validity was
demonstrated for the three dimensions of the construct – ALE, CLE, and SLE. The EFA results
confirmed a three-factor structure explaining nearly 80% of variance in the sample and
demonstrating acceptable item reliability before advancing to CFA, which demonstrated
102
acceptable model fit and requiring no model respecification. Lastly, the three factors demonstrated
excellent unidimensional behavior and strong pattern coefficient loading. In both the EFA and
CFA samples, mild correlations between the three dimensions of the three factors were observed
indicating acceptable discriminant validity of the latent construct.
Limitations of the Study
The most notable limitation to this study is the nature of instrumentation as a summative
measure and its ability to effectively measure the dynamic learner engagement construct as
defined. Learner engagement is best described as resulting from the interaction of a particular
learner within a particular learning environment – it changes over time within that learning
experience. Instrumentation such as the affective instrument developed in this study are
implemented post-delivery and are summative in nature and require the learner to provide insights
based on recall. As such, this instrument provides no insight into the moment-to-moment changes
of the construct during the learning experience. Saunders and Gero (2004) and Rømer (2002) and
related research indicate that the rate of dynamism is high, with individual factors within the
construct changing multiple times per second as learner perception focuses on different elements
within the learning environment. The instrument, instead, is a first step to addressing the actual
measurement of learner engagement in situ by establishing scales for the construct and detailing
some observable criteria that can be investigated more thoroughly for real-time measurement
through learner analytics and more advanced analysis methods. Notwithstanding its limitations,
the instrument is a foundational step in developing a measurement protocol of engagement within
learning environments, as both the relevant observable criteria and structurally valid subscales
were developed as part of the instrument development process.
103
A second limitation of the study is the population of interest used for data collection.
Starting with the qualitative inquiry and through the operationalization of the instrument, the
population of interest in this study is fairly limited in comparison to the potential applicability of
the construct to other instructional domains (K-12, Post-Secondary, etc.). Moreover, items were
generated from a qualitative study based on a limited number of participants and literature review,
and generalizability can reasonably be questioned (Creswell, 2012). This study, however, sought
only to address the construct of learner engagement in adults for three reasons:
1. The problem statement of this research was directed at the resource and operational
inefficiencies currently extant in professional training (e.g. Kaufmann, 2015);
2. Adults learning in a professional development context have similar intentional
trajectories with respect to construct-irrelevant factors, and so error can be assumed as
normally distributed (making EFA and CFA analysis more valid) (McCoach et al.,
2013); and
3. Professional development instructional treatments in industry and government expose
far larger populations to more diverse learning environments and instructional
treatments than those in primary or secondary education (see, e.g., Hurato et al., 1999,
in contrast to Boud et al., 2000; Assoc. for Talent Development, 2018). This diversity
of learner experience will permit subsequent research on the relationship between
different learning environments, content, and levels of engagement.
While the present study has no applicability to different populations of learners, aside from the
one in the study, application of the same methodology will permit similar investigations into other
instructional contexts and populations.

104
This study is the first of its kind to employ a situated cognition theoretical framework to
investigate the construct of interest. Situated cognition is foundationally different from an
information processing or behavioral theoretical framework that formed the basis for previous
research on measuring learner engagement. As a consequence, this research has the potential to
provide adaptive measures based on the particular affordances and perceptions of the learner
within any given experience. Situated cognition, however, will require extensive adaptation by
practitioners in the field to evaluate operational or conceptual definitions of the resulting construct.
The experts solicited for conducting item validity and review of the operational and conceptual
factor definition were carefully selected based on their expertise in both situated cognition theory
and instrument development process. There may therefore be limitations in the qualitative study
in terms of credibility, consistency, and transferability (Merriam, 2009). To maximize credibility
of qualitative data, qualitative data was axially coded, member checked, and compared with the
results from an independent researcher coding the same data (Golafshani, 2003).
Notwithstanding the processes applied in the development of the learner engagement
instrument and the subsequent item and subscale performance observed, the construct validity
evidence supporting use of the instrument is limited (McCoach et al., 2013; Moss, 1992). Construct
validity conceptually is about whether an instrument actually represents what it claims to
represent. In this study, construct validity was established based on a validation analysis conducted
by a panel of experts in both academia and in the industry. The validity for internal structure of
the learner engagement construct was statistically established through EFA and CFA across two
independent online convenience samples (each n=300). For its part, online convenience sampling
itself has been the subject of some research to identify any sampling biases and adverse respondent
behaviors with mixed results (e.g. Hamby & Taylor, 2016), further limiting generalizability and

105
validity. As noted earlier, the evidence on the use of these sampling methods is mixed, but
generally the threat of data validity through satisficing and similar sources of data inaccuracy have
been found to be no worse than traditional methods (Hamby & Taylor, 2016).
In addition, although both samples provided sufficient power to resolve a solution and
assess model fit, many of the items within the three subscales demonstrated moderate to high
correlation that may reflect under representation of the entirety of each of the factors. The
characterization of the factors under the theoretical construct of interest is limited to the structure
of this study, and both the naming and the precise latent traits being measured is still very much a
subject for further research. Due to this limitation, the results of this study (e.g., the instrument)
should be generalized with caution to other learner populations or situations beyond those
conditions covered by this study. Finally, it will be necessary in subsequent research to develop
additional validity evidence to support that the proposed factors actually measure the dimensions
of interest by analyzing the relationship of respondent data to relevant external variables such as
observable criteria and other related constructs and measures (McCoach et al., 2013; Moss, 1992;
Raykov & Marcoulides, 2011). Notwithstanding these limitations to construct and criterion
validity, the learner engagement construct and potential for integration with learner analytics
necessary to develop that validity evidence provides clear next steps for this line of research.
Recommendations for Future Research
The results from this study and a review of its extant limitations direct future study to
address three important issues:
1. A more expansive qualitative inquiry to develop a Grounded Theory of learner
engagement for diverse populations of learners;
106
2. Development of additional items and versions of the learner engagement instrument
for diverse populations of learners from that Grounded Theory; and
3. A quantitative inquiry into the effects of engagement on learner trajectory/learning
outcomes; and
4. A quantitative inquiry to explore functional relationships and statistical relationships
between learner engagement and other variables impacting learning outcomes.
Grounded Theory Qualitative Study: For subsequent full-scale study, a qualitative inquiry
to develop a Grounded Theory of Learner Engagement is a promising approach to develop
additional methodology in measurement of the learner engagement construct. Data from such a
study will ultimately contemplate experiences from additional online program administrators,
instructors, and participants, seeking variance in relevant cultural dimensions (e.g., gender,
race/ethnicity, technical background, motive for participation in online learning). This study will
therefore seek a robust qualitative data set to include observational, interview, focus group, and
artifact data that will be open coded to contextualize the data into categories that will subsequently
permit development of concepts (Charmaz, 2006). Axial coding and some supplemental
theoretical sampling for data (where required) will be performed to facilitate the identification and
refinement of categories into concepts and defining how these concepts are related. The constant
comparison method of analysis (Strauss & Corbin, 1998) will be employed to identify the central
concept by persistent review of all data from all sources to establish and refine the relationship of
the central concept to other concepts that are identified. Concepts will then be integrated through
memoing and sorting using a taxonomy-based approach, from which the theory will emerge. At
every stage, qualitative data will be validated through triangulation method, reviews for internal
consistency within item responses, member checks, and inter-rater approaches for observational
107
data (Shenton, 2004). The overall goal of the analytic method is to develop a robust, complete
Grounded Theory of learner engagement in different learning environments, and concurrently
develop more comprehensive categorical data on other indicia correlated with learner engagement
for capture by automated learner analytics within a learning environment.
As a methodology, Grounded Theory is particularly appropriate when viewed against the
situated cognition theoretical framework of the research – the theory emerges from, and is
validated against, the data, rather than “forcing the data into preconceived categories” (Charmaz,
2006). Situational cognition theory similarly relies on individual perception and development of
realities within a particular environment (Brown et al., 1989; Charmaz, 2006). A full-scale study
would include a combination of facilitated focus groups, individual researcher participation in
online courses, interviews, and artifact collection as data collection methods to fully capture both
individual and group data in a variety of learning environments. As one characteristic of interest
in the learning environment is the dynamic between individuals, both emic and etic observational
data would assist in the development of the Grounded Theory. Similarly, diversity of participants
and contexts will facilitate the emergence of persistent categories within the data (Merriam, 2002).
A Grounded Theory develop is highly likely to be transferrable to other contexts, and by design
would satisfy Glaser and Strauss (1967) quality criteria of fitness, understanding, generality, and
control.
Fully Develop the Learner Engagement Subscales: With a more robust Grounded Theory
of learner engagement, additional items and versions of the learner engagement instrument will be
developed and operationalized to identify more generalized subscales applicable to different
learner populations. As noted earlier, the learner engagement construct is the key to future
research, as the subscales within that model will allow quantitative studies into causal relationships

108
between environment, content area, instructional treatment, and learner outcome. To more fully
develop the construct, the learner engagement instrument developed in this study will be revised
to provide more complete representation of all aspects of the fully defined learner engagement
construct and variety of possible learning environments (online live, online self-paced, live
classroom-seminar, live classroom–lecture, simulation, VR/AR, etc.) through purposeful
sampling. With more varied instructional environments controlled in an experiment, item
performance can be more fully explored, including higher order factor analysis (McCoach et al.,
2013) and CFA-based item performance analysis (Raykov & Marcoulides, 2011).
Catalog Observable Criteria: As part of the qualitative study, artifacts from a variety of
instructional experiences were reviewed as part of the directed interview process, both to aid in
advancing the interpretive inquiry and theme development and to develop a taxonomy of criteria
and observable indicia that correlate to factors within the learner engagement construct. Fredericks
et al. (2004) provided one of initial efforts along these lines framed in a behavioral context, and
as noted earlier, this line of research has continued using analytics derived from learning systems
to assess learner engagement using behavioral measures as part of its calculus, albeit within only
one specialized learning environment and instructional treatment (Kahn, et al, 2017; Manwaring,
et al, 2017). The key distinction from earlier research is that in the framework suggested by this
study, meaningful data collection needs to look beyond the simple “did-or-did-not” behavioral
approach in favor of one looking at a more sophisticated assessment of change. Certainly,
observable indicia of the learner remain important, but it is more important to assess the
contextualized changes and why they occurred based on the learner-environment interaction in
order to determine the engagement of a learner (Rømer, 2002). To that end, refined measures of
data collection should be implemented to more robustly measure learner engagement, to include

109
neurological measures of learner, eyesight tracking, response latency, dialogic analysis of
conversations, and advanced learner analytics for attention tracking via whatever environmental
affordances are present. Correlation of this data with the evolving learning environment during the
experience will provide more expansive insight into how dynamic learner engagement is and how
it might be managed during instructional delivery.
Affects and Effects: In reviewing research related to learner engagement, it is almost
universally true that the researchers in those studies assume that learner engagement results in
enhanced learner outcomes. In some cases, such an assumption, viewed contextually, is
tautologically valid because the limited definition of engagement adopted in the study (e.g.
engagement is measured by reduction in attrition, Angelino, Williams, & Natvig, 2007). In other
research the study methodology was too summative in nature to examine the effects of learner
engagement on outcomes in a meaningful time domain (e.g. GPA outcomes against self-reported
“levels of engagement”, Carini, Kuh, & Klein, 2006). There are two profound and critical issues
to this assumption that must be investigated by research derived from this study:
1. There is no established causal relationship between environment, content domain,
instructional treatment method, and learner outcome (What affects learner
engagement?); and
2. There is no established causal relationship between learner engagement and learner
outcome (What are the effects of learner engagement?).
With a stable and internally consistent instrument with more robust subscales coupled with
extensive data on what related observable data and learner analytics to collect, research will focus
on repeatability of instrument data and leveraging the instrument in a collection of studies to
evaluate the causal relationships between learning environment, content domain, instructional

110
treatment method and learner engagement. These series of studies will vary one aspect of the
learning experience and focus on the dynamics of individual learner engagement with the
particularized learning environment, content domain, and treatment and to determine to what
extent engagement affects individual and aggregate cohort performance. The factors identified in
the basic interpretive qualitative inquiry will be measured throughout the learning experience and
used to model learner performance as a function of engagement within the learning environment.
In a systematic way, the causal relationships between learning environment, content domain,
treatment methodology, and the changes in learner engagement can be investigated to evaluate
effects on different learner populations.
The second, and perhaps most important line of quantitative inquiry, is the effect of learner
engagement on learner outcome/trajectory. With controls in place relating to the learning
environment, content domain, and treatment methodology, this study will seek to measure learner
engagement through an instructional experience and assess the effects of variance in learner
engagement on outcome (Shadish, Cook, & Campbell, 2002). This line of research is fraught with
some potential ethical issues and must be approached once the effects of varied engagement can
be anticipated with appropriate remediation capabilities in place. Once the effects of learner
engagement are well understood, the construct can be used predictively to develop an expansive
instructional framework that seeks to optimize instructional outcomes based on the anticipated
effects learner engagement. The potential impact a meaningfully measurable learner engagement
protocol cannot be understated in the context of learning and development – optimized
instructional treatments and tailored individualized learning would foster a workforce learning-
centric culture that would save industry billions of dollars, anaconda worker productivity, and

111
provide a means for advancement currently denied to those who have found professional training
wanting.
From a validity perspective, this line of research seeks to address a long–standing
shortcoming of most previous research that had limited applicability beyond the experiment to
other populations of interest, learning environment, or instructional treatment methods (really a
threat to the external validity of those studies as a consequence of setting); one specific measurable
effect in one domain using one technology has produced little in the way of a model of broader
effects imposed by the adoption of different technologies all at once, tailored for optimal
performance at the enabling-objective level. Certainly, there exists an opportunity for a meta-
analysis of such studies (Hedges & Vevea, 1998; Raudenbush, Hedges, & Cooper, 1994) but there
is a potential of confounding the construct – combining too many variables, as well as introducing
construct-irrelevant variance based on the changeability of each specific study methodology
requiring a random effect modeling approach with difficult to interpret results. This research
approach, however, will allow a greater degree of generalizability to other populations. In
addition, some chance of selection bias may be present (Cheung, Burns, Sinclair, & Sliter, 2017),
but given the large multisite nature of running several studies against multiple instructional
settings, this is not a viable threat but may, as a result, raise an external validity threat (e.g. attrition
in one study may be precluded based on operational context of a particular learning experience,
whereas in another it is not).
In this postulated line of research, outcomes would be measured quantitatively by utilizing
highly reliable standardized tests or rubrics with large control groups referenced against the same
population of interest. In the interests of completeness, the observed reliability of every instrument
will be assessed, reviewed against historical measures, and reported as part of the analysis. To
112
remove any external validity threat stemming from treatment variation, a large enough sample of
classes would be chosen to accommodate such variance – in fact, it is expected that each treatment
instance will have extensive variance in learner experiences across the variables of interest that
can be accommodated by a MANOVA analysis. Little in the way of participant expectancy could
be asserted in this design, as much of the measurement is transparent or reasonably expected in
any instructional experience in the study by a typical learner. The potential threats to statistical
conclusion validity are principally heterogeneity of participants and extraneous variance in the
experimental setting, which can be addressed by conducting the experiments across different
populations and learning environments.
Conclusion
This sequential mixed-method study focused on the development and operationalization
of a learner engagement construct (Creswell, 2012). This approach was adopted on the guidance
of Creswell and Plano-Clark (2018) who noted that a sequential exploratory design is most
appropriate “when the need for a second, quantitative phase emerges based on what is learned
from the first, qualitative phase” (p.89) and is “best suited for exploring a phenomenon” (p.84).
Based on the rapid expansion in learning environment diversity within the instructional domain
for professional development, a situated cognition theoretical framework was adopted to address
the fundamental differences in learner experience resulting from the profound differences in
externalities, affordances, and interactions in such environments. Purposeful sampling was used
to elicit qualitative data from three principal sub-populations related to the professional training
domain to develop data saturation and permit theme development using an open-inquiry format
interview protocol.
Analysis of the qualitative data permitted the development of candidate
113
subscales/construct factor conceptual and operational definitions that, in turn, were used to
develop items for a draft affective instrument directed at post-delivery measurement of learner
engagement. Both the construct and items were reviewed in succession by a panel of experts in
cognition and instruction, resulting in refinement of both the definitions and revision or
redaction of items from the instrument. The resulting draft instrument was operationalized
against a sample (n = 300) to collect response data to permit an EFA. Following both the EFA
and reliability analysis, items were revised, and the instrument was operationalized against a
second sample (n = 300) to permit a CFA. Model fit and item performance were found to be
acceptable, but additional research was deemed appropriate to ensure the construct is properly
represented by the subscale developed.
114
References
Alt, D. (2015). Assessing the contribution of a constructivist learning environment to academic
self-efficacy in higher education. Learning Environments Research, 18(1), 47-67.
Anderson, J. R., Reder, L. M., & Simon, H. A. (1996). Situated learning and education.
Educational researcher, 25(4), 5-11.
Arkorful, V., & Abaidoo, N. (2015). The role of e-learning, advantages and disadvantages of its
adoption in higher education. International Journal of Instructional Technology and
Distance Learning, 12(1), 29-42.
Angelino, L. M., Williams, F. K., & Natvig, D. (2007). Strategies to engage online students and
reduce attrition rates. Journal of Educators Online, 4(2), n2.
Appleton, J. J., Christenson, S. L., Kim, D., & Reschly, A. L. (2006). Measuring cognitive and
psychological engagement: Validation of the student engagement instrument. Journal of
School Psychology, 44(5), 427-445.
Arbaugh, J. B. (2000). Virtual classroom characteristics and student satisfaction with internet-
based MBA courses. Journal of Management Education, 24(1), 32-54.
Association for Talent Development. (2018). State of the industry report. Retrieved from
Retrieved from https://www.td.org/research-reports/2018-state-of-the-industry.
Beal, C., Qu L., & Lee H. (2006). Classifying learner engagement through integration of
multiple data sources. Proceedings of the National Conference on Artificial Intelligence.
AAAI Press, 151–156.
Beauducel, A., & Wittmann, W. W. (2005). Simulation study on fit indexes in CFA based on
data with slightly distorted simple structure. Structural Equation Modeling, 12(1), 41-75.
Betts, J. E., Appleton, J. J., Reschly, A. L., Christenson, S. L., & Huebner, E. S. (2010). A study
of the factorial invariance of the Student Engagement Instrument (SEI): Results from
middle and high school students. School Psychology Quarterly, 25(2), 84.
Birks, M., Chapman, Y., & Francis, K. (2008). Memoing in qualitative research: Probing data
and processes. Journal of Research in Nursing, 13(1), 68-75.
Breslin, G., Hodges, N. J., & Williams, M. A. (2009). Effect of information load and time on
observational learning. Research quarterly for exercise and sport, 80(3), 480-490.
Bronfenbrenner, U. (1994). Ecological models of human development. Readings on The
Development of Children, 2(1), 37-43.
Brown, J. S., Collins, A., & Duguid, P. (1989). Situated cognition and the culture of

115
learning. Educational Researcher, 18(1), 32-42.
Buerck, J. P., Malmstrom, T., & Peppers, E. (2003). Learning environments and learning styles:
Non-traditional student enrollment and success in an Internet-based versus a lecture-based
computer science course. Learning Environments Research, 6(2), 137-155.
Buhrmester, M., Kwang, T. & Gosling, S. (2011). Amazon’s mechanical turk: A new source of
inexpensive, yet high-quality, data? Perspectives on Psychological Science 6(1), 3–5.
Carini, R. M., Kuh, G. D., & Klein, S. P. (2006). Student engagement and student learning:
Testing the linkages. Research in Higher Education, 47(1), 1-32.
Carnevale, A. P., Strohl, J., & Gulish, A. (2015). College is just the beginning. Center on
Education and the Workforce McCourt School of Public Policy.
Charmaz, K. (2006). Constructing grounded theory: A practical guide through qualitative
analysis. Thousand Oaks, CA: Sage Publications.
Charmaz, K. (2014). Constructing grounded theory (2nd ed.). Thousand Oaks, CA: Sage
Publications.
Cheung, J. H., Burns, D. K., Sinclair, R. R., & Sliter, M. (2017). Amazon Mechanical Turk in
organizational psychology: An evaluation and practical recommendations. Journal of
Business and Psychology, 32(4), 347-361.
Ciborra, C. (2004). Encountering information systems as a phenomenon. In C. Avergou, C.
Ciborra, & F. Land (Eds.), The Social Study of Information and Communication
Technology: Innovation, Actors, and Contexts pp 17-37. New York, NY: Oxford
University Press.
Clarke III, I., Flaherty, T. B., & Mottner, S. (2001). Student perceptions of educational
technology tools. Journal of Marketing Education, 23(3), 169-177.
Clark, L. A. & Watson, D. (1995). Constructing validity: Basic issues in objective scale
development. Psychological Assessment, 7, 309-319.
Clark, R.E. (1983). Reconsidering research on learning from media. Review of Educational
Research, 53(4), 445-459.
Clark, R.E. (1994). Reconsidering research on learning from media. Educational Technology
Research & Development, 42(2), 21-29.
Clouse, S. F., & Evans, G. E. (2003). Graduate business students’ performance with synchronous
and asynchronous interaction e‐learning methods. Decision Sciences Journal of Innovative
Education, 1(2), 181-202.

116
Creswell, J. W., & Miller, D. L. (2000). Determining validity in qualitative inquiry. Theory into
Practice, 39(3), 124-130.
Creswell, J. W. (2018). Research design: Qualitative, quantitative, and mixed methods
approaches (5th ed.). Thousand Oaks, CA: Sage Publications.
Creswell, J.W., & Plano Clark, V. L. (2017). Designing and conducting mixed methods research
(3rd ed.) Thousand Oaks: Sage Publications.
Crocker, L., & Algina, J. (1986). Introduction to classical and modern test theory. Orlando, FL:
Holt, Rinehart and Winston.
Daley, B. J., & Cervero, R. M. (2016). Learning as the basis for continuing professional
education. New Directions for Adult and Continuing Education, 2016(151), 19-29.
Dobbs, R. R., Waid, C. A., & del Carmen, A. (2009). Students' perceptions of online courses:
The effect of online course experience. Quarterly Review of Distance Education, 10(1), 9.
Dwight, J., & Garrison, J. (2003). A manifesto for instructional technology: Hyperpedagogy.
Teachers College Record, 105(5), 699-728.
Ericsson, K. A. (2006). The influence of experience and deliberate practice on the development
of superior expert performance. The Cambridge handbook of expertise and expert
performance, 38, 685-705.
Fabrigar, L. R., Wegener, D. T., MacCallum, R. C., & Strahan, E. J. (1999). Evaluating the use
of exploratory factor analysis in psychological research. Psychological Methods, 4(3), 272.
Fabrigar, L. R., & Wegener, D. T. (2012). Understanding statistics: Exploratory factor
analysis. New York, NY: Oxford University.
Finn, J. D. (1989). Withdrawing from school. Review of Educational Research, 59(2), 117-142.
Fredricks, J.A., Blumenfeld, P.C. & Paris, A.H. (2004) School engagement: potential of the
concept, state of the evidence. Review of Educational Research. 74 (1), 59–109.
Gable, R.K., & Wolf, M.B. (1993). Instrument development in the affective domain: Measuring
attitudes and values in corporate and school settings (2nd ed.). Boston, MA: Kluwer
Academic Publishers.
Gagne, R. M., Wager, W. W., Golas, K. C., Keller, J. M., & Russell, J. D. (2005). Principles of
instructional design. Performance Improvement, 44(2), 44-46.
Gibson, J. J. (1986). Information pickup theory. Boston: Mifflin.
Glaser, B. and Strauss, A. (1967). The Discovery of Grounded Theory. Chicago: Aldine.
117
Golafshani, N. (2003). Understanding reliability and validity in qualitative research. The
Qualitative Report, 8(4), 597-606.
Grant, J. S., & Davis, L. L. (1997). Selection and use of content experts for instrument
development. Research in Nursing & Health, 20(3), 269-274.
Grenier, R. S. (2009). The role of learning in the development of expertise in museum
docents. Adult Education Quarterly, 59(2), 142-157.
Guba, E. G., & Lincoln, Y. S. (1989). Fourth generation evaluation. Thousand Oaks, CA: Sage
Publications.
Halverson, L. R., & Graham, C. R. (2019). Learner Engagement in Blended Learning
Environments: A Conceptual Framework. Online Learning, 23(2), 145-178.
Hedges, L. V., & Olkin, I. (2014). Statistical methods for meta-analysis. New York, NY:
Academic Press.
Hedges, L. V., & Vevea, J. L. (1998). Fixed-and random-effects models in meta-analysis.
Psychological Methods, 3(4), 486.
Henson, R. K., & Roberts, J. K. (2006). Use of exploratory factor analysis in published research:
Common errors and some comment on improved practice. Educational and Psychological
measurement, 66(3), 393-416.
Herling, R. W., & Provo, J. (2000). Knowledge, competence, and expertise in
organizations. Advances in Developing Human Resources, 2(1), 1-7.
Hodges, B. (2009). Ecological pragmatics: Values, dialogical arrays, complexity, and caring.
Pragmatics & Cognition, 17(3), 628-652.
Hu, L. T., & Bentler, P. M. (1998). Fit indices in covariance structure modeling: Sensitivity to
underparameterized model misspecification. Psychological Methods, 3(4), 424.
Jimerson, S. R., Campos, E., & Greif, J. L. (2003). Toward an understanding of definitions and
measures of school engagement and related terms. The California School
Psychologist, 8(1), 7-27.
Jonassen, D. H., & Rohrer-Murphy, L. (1999). Activity theory as a framework for designing
constructivist learning environments. Educational technology research and
development, 47(1), 61-79.
Kahn, P., Everington, L., Kelm, K., Reid, I., & Watkins, F. (2017). Understanding student
engagement in online learning environments: The role of reflexivity. Educational
Technology Research and Development, 65(1), 203-218.
118
Kauffman, H. (2015). A review of predictive factors of student success in and satisfaction with
online learning. Research in Learning Technology, 23.
Kimberlin, C. L., & Winterstein, A. G. (2008). Validity and reliability of measurement
instruments used in research. American Journal of Health-System Pharmacy, 65(23), 2276-
2284.
Kenny, D. A. (November, 2015). Measuring model fit retrieved from
http://davidakenny.net/cm/fit.htm
Knowles, M. (1973). The adult learner: A neglected species. Houston, TX: Gulf Publishing
Company.
Knowles, M. (1984). Andragogy in action. San Francisco: Jossey-Bass.
Kuchinke, K. P. (1997). Employee expertises the status of the theory and the literature.
Performance Improvement Quarterly, 10(4), 72-86.
Lamborn, S., Newmann, F., & Wehlage, G. (1992). The significance and sources of student
engagement. In F. Newman (Ed.), Student Engagement and achievement in American
secondary schools (pp. 11-39). New York, NY: Teachers College Press.
Lave, J. (1991). Situating learning in communities of practice. In L. B. Resnick, J. M. Levine, &
S. D. Teasley (Eds.), Perspectives on socially shared cognition (pp. 63–82). Washington
DC: American Psychological Association.
Lave, J., & Wenger, E. (1991). Situated learning: Legitimate peripheral participation. London:
Cambridge University Press.
Lawshe, C. H. (1975). A quantitative approach to content validity. Personnel Psychology, 28(4),
563-575.
Manwaring, K. C., Larsen, R., Graham, C. R., Henrie, C. R., & Halverson, L. R. (2017).
Investigating student engagement in blended learning settings using experience sampling
and structural equation modeling. The Internet and Higher Education, 35, 21-33.
Marks, H. M. (2000). Student engagement in instructional activity: Patterns in the elementary,
middle, and high school years. American Educational Research Journal, 37(1), 153-184.
Martin, F., Parker, M. A., & Deale, D. F. (2012). Examining interactivity in synchronous virtual
classrooms. The International Review of Research in Open and Distributed Learning,
3(3), 228-261.
Mayer, R. E. (2014). Incorporating motivation into multimedia learning. Learning and
Instruction, 29, 171-173.
119
McCoach, D. B., Gable, R. K., & Madura, J. P. (2013). Instrument development in the affective
domain. New York, NY: Springer.
McIver, D., Fitzsimmons, S., & Flanagan, D. (2016). Instructional design as knowledge
management: A knowledge-in-practice approach to choosing instructional
methods. Journal of Management Education, 40(1), 47-75.
Merriam, S. B. (2002). Qualitative research in practice: Examples for discussion and analysis.
San Francisco, CA: Jossey-Bass.
Merriam, S. B., Caffarella, R. S., & Baumgartner, L. M. (2006). Learning in adulthood: A
comprehensive guide. John Wiley & Sons.
Merriam, S. B., & Grenier, R. S. (Eds.). (2019). Qualitative research in practice: Examples for
discussion and analysis. San Francisco, CA: Jossey-Bass.
McKenzie, J. F., Wood, M. L., Kotecki, J. E., Clark, J. K., & Brey, R. A. (1999). Establishing
content validity: Using qualitative and quantitative steps. American Journal of Health
Behavior, 23, 311-318.
Mills, J., Bonner, A., & Francis, K. (2006). The development of constructivist grounded
theory. International Journal of Qualitative Methods, 5(1), 25-35.
Miller, S. E., Leinhardt, G., & Zigmond, N. (1987, April). Experimental features of secondary
schooling for high risk LD students, Part I: Academic integration. In annual conference of
the American Educational Research Association, Washington, DC.
Mirriahi, N., Alonzo, D., & Fox, B. (2015). A blended learning framework for curriculum design
and professional development. Research in Learning Technology, 23.
Moody, J. (2004). Distance education: why are the attrition rates so high? The Quarterly Review
of Distance Education, 5(3), 205-210.
Moss, P. A. (1992). Shifting conceptions of validity in educational measurement: Implications
for performance assessment. Review of Educational Research, 62(3), 229-258.c
Norman, G. R. (1999). The adult learner: a mythical species. Academic Medicine.
Ophir, Y., Sisso, I., Asterhan, C. S., Tikochinski, R., & Reichart, R. (2019). The Turker Blues:
Hidden factors behind increased depression rates among Amazon’s Mechanical Turkers.
Clinical Psychological Science. doi: 10.1177/2167702619865973
Park, J. H., & Choi, H. J. (2009). Factors influencing adult learners' decision to drop out or
persist in online learning. Journal of Educational Technology & Society, 12(4), 207-217.
120
Patton, M. Q. (2015). Qualitative research and evaluation methods (4th ed.). Thousand Oaks,
CA: Sage Publications.
Peltier, J. W., Schibrowsky, J. A., & Drago, W. (2007). The interdependence of the factors
influencing the perceived quality of the online learning experience: A causal model.
Journal of Marketing Education, 29(2), 140-153.
Piaget, J. (1964). Part I: Cognitive development in children: Piaget development and learning.
Journal of Research in Science Teaching, 2(3), 176-186.
Poggio, J., Glasnapp, D. R., Yang, X., & Poggio, A. J. (2005). A comparative evaluation of score
results from computerized and paper & pencil mathematics testing in a large-scale state
assessment program. Journal of Technology, Learning, and Assessment, 3(6).
Rana, S., Ardichvili, A., & Polesello, D. (2016). Promoting self-directed learning in a learning
organization: tools and practices. European Journal of Training and Development, 40(7),
470-489.
Raudenbush, S. W., Cooper, H., & Hedges, L. V. (1994). The handbook of research
synthesis. New York, NY: Russell Sage Foundation.
Raykov, T. (2001). Estimation of congeneric scale reliability using covariance structure analysis
with nonlinear constraints. British Journal of Mathematical and Statistical Psychology,
54(2), 315-323.
Raykov, T., & Marcoulides, G. A. (2011). Introduction to psychometric theory. New York: Tylor
and Francis Group.
Reitman, W. R. (1965). Cognition and thought: an information processing approach. New York:
Wiley and Sons.
Rømer, T. A. (2002). Situated learning and assessment. Assessment & Evaluation in Higher
Education, 27(3), 233-241.
Rubio, D. M., Berg-Weger, M., Tebb, S. S., Lee, E. S., & Rauch, S. (2003). Objectifying
content validity: Conducting a content validity study in social work research. Social Work
Research, 27, 94-104.
Ruona, W. E. (2005). Analyzing qualitative data. In R. Swanson & E. Holton III (Eds.),
Research in Organizations: Foundations and Methods of Inquiry, (pp. 223-263). Oakland,
CA: Berrett-Koehler Publishers.
Raykov, T., & Marcoulides, G. A. (2011). Introduction to psychometric theory. Routledge:
London.
Saldaña, J. (2015). The coding manual for qualitative researchers. Thousand Oaks, CA: Sage
121
Publications.
Sautter, P. (2007). Designing discussion activities to achieve desired learning outcomes: Choices
using mode of delivery and structure. Journal of Marketing Education, 29(2), 122-131.
Seidman, I. (2013). Interviewing as qualitative research: A guide researchers in education and
the social sciences (4th ed.). New York, NY: Teachers College Press.
Shadish, W. R., Cook, T. D., & Campbell, D. T. (2002). Experimental and quasi-experimental
designs for generalized causal inference. New York, NY: Houghton, Mifflin and
Company.
Shenton, A. K. (2004). Strategies for ensuring trustworthiness in qualitative research
projects. Education for Information, 22(2), 63-75.
Sitzmann, T., Kraiger, K., Stewart, D., & Wisher, R. (2006). The comparative effectiveness of
web‐based and classroom instruction: A meta‐analysis. Personnel psychology, 59(3), 623-
664.
Strauss, A., & Corbin, J. (1990). Basics of qualitative research. Thousand Oaks, CA: Sage
Publications.
Strauss, A.L. & Corbin, J.M. (1998). Basics of Qualitative Research: Techniques and
Procedures for Developing Grounded Theory (2nd ed.). Thousand Oaks, CA: Sage.
Thomas, D. R. (2006). A general inductive approach for analyzing qualitative evaluation
data. American Journal of Evaluation, 27(2), 237-246.
Trowler, V. (2010). Student engagement literature review. The Higher Education
Academy, 11(1), 1-15.
Vygotsky, L. S. (1962). Thought and language. Cambridge, MA: MIT Press.
Wang, M. T., & Eccles, J. S. (2013). School context, achievement motivation, and academic
engagement: A longitudinal study of school engagement using a multidimensional
perspective. Learning and Instruction, 28, 12-23.
Wenger, E. (1998). Communities of practice: Learning as a social system. Systems Thinker, 9(5),
2-3.
Wolff, M., Wagner, M. J., Poznanski, S., Schiller, J., & Santen, S. (2015). Not another boring
lecture: Engaging learners with active learning techniques. The Journal of Emergency
Medicine, 48(1), 85-93.
Woo, Y., & Reeves, T. C. (2007). Meaningful interaction in web-based learning: A social
constructivist interpretation. The Internet and Higher Education, 10(1), 15-25.
122
Yap, K. B., Wong, D., Wong, J., & Turner, B. (2011). The Influence of Classroom Environment
and Approaches to Learning in Achieving Outcomes in Marketing Education. In Australia
New Zealand Marketing Academy Conference: Marketing in the Age of Consumerism:
Jekyll or Hyde? (p. 8). Edith Cowan University.
Yoo, S. J., & Huang, W. D. (2013). Engaging online adult learners in higher education:
Motivational factors impacted by gender, age, and prior experiences. The Journal of
Continuing Higher Education, 61(3), 151-164.
Young, M. F. (2004). An ecological psychology of instructional design: Learning and thinking
by perceiving-acting systems. In D. H. Jonassen (Ed.), Handbook of research for
educational communications and technology (169–177). Mahwah, NJ: Erlbaum.
Young, M. F., Kulikowich, J. M., & Barab, S. A. (1997). The unit of analysis for situated
assessment. Instructional Science, 25(2), 133-150.
123
Appendix A
Interview Protocol
Principal Investigator: Dr. Scott Brown
Student Researcher: Charles Dye
Study Title: Qualitative & Quantitative Inquiry into Learner Engagement
Sponsor: University of Connecticut, Neag School of Education
Introduction
You are invited to participate in a research study to participate in an interview regarding the learner
experience and engagement. I am a graduate student at the University of Connecticut, and am
conducting this interview as part of my doctoral research. I am interested in finding out your
opinions and experience in corporate training and development, and in particular your take on
learner engagement – what is it, and why it matters to you and your organization.
Why is this study being done?
The purpose of this research study is to explore the concept of learner engagement in learning
environments in modern professional/occupational training programs. The Government, industry,
and academia spend billions of dollars annually attempting to enhance learning through the use of
different instructional approaches. This research seeks to better understand the effect of these
approaches on the learner’s experience, performance, and achievement.
Sponsor: University of Connecticut, Neag School of Education
Date : ___________________________
Time: ___________________________
Location: ___________________________
Interviewer: Charles S. Dye
Interviewee: ___________________________
Release form signed? YES/NO (Circle One)
Notes to interviewee:
1. Thank you for your participation.
2. The purpose of this interview is to begin a research study on the effects of educational
technology on learner experience – we will begin with the investigation of “learner
engagement” – a term often used in the field, but poorly (if ever) defined.
3. Based on the professional background and experience of the interviewee, his/her input will
be invaluable to this research and in helping grow the community of practice in post-

124
secondary professional development and the implementation of educational technology as
a tool for instruction and learner support.
4. The confidentiality of responses is guaranteed.
5. The approximate length of interview will be 30 minutes, and consist of six (6) primary
questions.
Introduction (May vary from Script, key points above): I’d like to open this interview by thanking
you for taking the time to participate in this study on the effects of educational technology on adult
learner experience. You were selected for the study based on your extensive experience and
professional reputation in the field.
As a first step, we need to address some research protocol - please review the Confidentiality Form
and let me know if you have any questions.
To assist me in the analysis of our interview and its results. May I record our interview using this
device (iPad loaded with SoftNote™ software)? (Check One)
Yes
No
Research Question(s)
1. What is learner engagement?
2. What experiences and perceptions of the learner affect learner engagement?
3. How can those experiences and perceptions be used to develop a model of learner
engagement?
4. What observable indicia exist for engagement of a learner in a particular environment?
Purpose of Research:
The purpose of this interview is to record your thoughts, impressions, and experience as it
relates to the implementation of distance education generally, and the uses educational
technology and their individual/collective effects on learner experience. We then turn to
the effects of that learner experience on “learner engagement”, and the effects of
engagement on successful instructional outcomes. The learner audience we will be
focusing on is adult learners – that is, those learners ages 25 and up, in the U.S., pursuing
post-secondary professional training or other form of education.
Interview Questions:
1. What environmental elements define a learner “experience” in an online learning
environment?
Possible Probes (Check if Used/Planned for Use – Note Time):
Are educational technology elements in some fashion “different” from traditional
element in the decision to include them?
Why is environment important to the outcome of the program?
2. What learner perceptions define a learner “experience” in a learning environment?
Possible Probes (Check if Used/Planned for Use – Note Time):

125
What do you think are prevalent perceptions relating to this instructional program?
What trends have you observed in corporate training/talent development relating to
learner perceptions and participation?
3. How would you define “Learner Engagement”?
Possible Probes (Check if Used/Planned for Use – Note Time):
How is motivation different than “engagement”?
What types of skills are required to be successful in this instructional program?
How is self-efficacy or confidence different than “engagement”?
What other factors do you think influence “engagement”?
What is the relevance of engagement in distance education?
4. Turning to your personal experience in distance education as a participant, what elements
of the instructional program were notable?
Possible Probes (Check if Used/Planned for Use – Note Time):
Why were these factors notable?
How has your experience changed your practice in participation (learner) or
delivery (instructor, administrator) of programs?
5. To what extent do particular elements in an instructional delivery affect “learner
engagement”?
Possible Probes (Check if Used/Planned for Use – Note Time):
Why are these elements notable?
How has your experience changed your practice in participation (learner) or
delivery (instructor, administrator) of programs?
How important is the inclusion of these elements in the success (or failure) of a
instructional program?
Why are these elements not always included in instructional programs?
CLOSE
I’d like to thank you for the time and opportunity to discuss learners and engagement in distance
education. My next steps will include transcription of our discussion here today, and I’ll provide
you a copy of the transcript for you to review/comment/discuss with me no later than November
10th.
In the meantime, as I transcribe our discussion, if I have any questions, would it be acceptable for
me to contact you for clarification? (Check One)
Yes
No
How would you like me to contact you? (Check All that Apply):
Phone Call
Visit/Face-to-Face
126
Appendix B
Content Validation Survey
Principal Investigator: Dr. Scott Brown
Student Researcher: Charles Dye
Study Title: Qualitative & Quantitative Inquiry into Learner Engagement
Sponsor: University of Connecticut, Neag School of Education
Introduction
You are invited to participate in research relating the learner experience and engagement. I am a
graduate student at the University of Connecticut and am developing an affective instrument as
part of my doctoral research. As part of the validity analysis in the development of this instrument,
I am requesting your qualitative review of the attached instrument items as part of the development
and validation process. Attached to this page are draft instrument items meant to measure adult
learner engagement – a construct that relates to adults’ reactions to the process of learning within
the learning environment (classroom, online environment, virtual instruction, ER/VR, etc.).
Research Purpose
This program of research is directed at a situated cognition construct of the individual within the
learning environment and the dynamics of individual learner engagement throughout the learning
experience. This research will be conducted in several stages:
1. Develop a construct of learner engagement as it relates to enhanced outcome in
instructional programs that employ educational technology;
2. Develop an affective instrument to develop a measure learner engagement (self-declared
from the learner);
3. Develop a set of observable learner data and environmental changes associated with self-
declared level of learner engagement from the instrument; and
4. Conduct a quantitative study of the relationship between learner engagement and learning
outcome.
The purpose of this line of research seeks to determine the relationship between learner
engagement and improved learner outcomes in instructional programs – a tacit assumption in
current research and trade journals. It is the position of this research that given the wide variety of
learning environments available today that that leverage educational technology and a variety of
affordances for the learner, this explicit assumption cannot be presumed. This theoretical
framework examines the situated experience of the learner and its impact on the ultimate success
of the learner in achieving the particularized outcomes desired by that learner and the organization
127
through alignment of intentional trajectory.
Theoretical Framework
Gibson (1969) details a theory of situated cognition particularly apropos to this study. For
situated cognitivists, the task of learning is the confluence of a set of personal motives with a
particular environment that provides affordances to which the learner attunes his/her perception.
Action and response to stimuli in the learning process is based on those invariances of the
environment that invite action (Gibson, 1969). Each individual’s experience is thus unique to their
perceptions and the affordances within a particular learning environment that are both present and
perceived in a constructivist context (Mills, Bonner, & Francis (2008) – previous studies eschew
the perception and motivation of the individual learner in favor of merely cataloging environment
factors and measuring outcomes at a superficial level (Hodges, 2009).
Situated cognition as a theory of learning has potential in understanding the process of
becoming engaged as a learner in a particular learning environment to achieve a particular learning
outcome, Central to a situated cognitivist model is that the interaction between action and
environment in the learning process is real time and ongoing – in the context of this study, the
teacher takes action, prospectively perceives the effect of action on the environment and learners
within the timeline of goals/objectives in that moment, the subsequent environmental response,
and takes subsequent action. A central tenet of this theoretical framework thus focuses on the
interaction perception, action, and environment that forms and dissolves minute by minute while
in the learning process. “A perceiving/acting agent is coupled with a developing/adapting
environment and what matters is how the two interact" (Young, Kulikowich, and Barab, 1997) - a
participant in a particular learning environment, by definition, adapts perception and interaction
based on the environmental affordances and outcomes in question. As this process continues, the
educator refines his/her perception to the environment, the instructional practice enhanced,
learners interact, and the learning environment is changed. “The environmental consequences of
actions produce new experiences that can draw the attention of the perceiver to new affordances
of the environment” (Young, 2003, p. 172).
This study is also heavily influenced by a constructivist lens – each participant in the learning
environment (educator, learner, and administrator) constructs a different sense of the efficacy and
consequences of adoption of pedagogical technique or technology in the classroom. These
experiences and constructs are highly dynamic within the experience of the participants, and
adoption of a constructivist lens in this context will allow the “claims, concerns, and issues of
stakeholders serve as organizational foci (Guba & Lincoln, 1989, p. 50). These organizational foci
will, in turn, be used for follow-on studies and additional purposed sampling to fully refine the
theory (Charmaz, 2000, p. 524) in evaluating the learning environment and defining “new”
pedagogies and technologies as elements of the learning environment. Situational Cognition and
Constructivist theory relies on individual perception and development of realities within a

128
particular environment (Brown, Collins, and Duguid, 1989; Charmaz, 2006).
Construct of Interest
I. Factor Conceptual Definition
Construct of Interest – This instrument is developed to identify characteristics of:
The emotional response of the learner to the instructional experience;
The intellectual response of the learner to the instructional content; and
The interaction of the learner with the environment and the resulting changes
in the environment.
These factors are defined as follows:
Factor 1 – Emotional Response: This dimension is a direct emotional (or visceral)
reaction to the learning experience, membership in the learning experience, and sense
of safety and willingness to participate in the context of learning (Appleton, 2006).
Affective reactions that might exemplify this aspect of learner engagement would
include a sense belonging-ness within the learning environment and other participants,
positive sense towards other learners and/or any instructor, collaboration, shared
experience, skill development and the sense of self-worth that comes from being more
skilled (and worthy as a member of a community), and/or participation in a learning
community.
Factor 2 – Intellectual Response: The second dimension of the proposed construct of
learner engagement is the degree of intellectual challenge perceived and accepted by
the learner in the learning experience. Intellectual engagement involves the learner in
the subject matter (Parimalam & Mahadevan, 2012). This factor seeks to measure the
degree to which the learner is challenged to advance mastery, learn from others
(including both peers in the classroom and the instructor), and sense of accomplishment
stemming from academic achievement. Such accomplishment often contributes to a
sense of relevance and applicability of the subject matter to the goals of the learner
[CITE]. Activities that might reflect this aspect of learner engagement would include
asking sophisticated questions, sense of self-worth that comes from achievement, and
sense of alignment of subject matter with task and performance (Cooper, 2010).
Factor 3 – Environmental Interaction/Response: The third dimension of the construct
of interest is the degree to which the learner perceives the environment, its effect on
them as learners, and how the environment changes during the instructional
experience. While current commentators have most recently adopted a behaviorist
approach to measuring interaction, this factor is directed beyond simply measures
observable data to measuring the changes in the environment when something changes
e.g. one participant makes a controversial opinion, resulting in a heated debate. It is the
evolution of the debate from simple back-and-forth to debate that is being measured
here, not the simple expression of an opinion. Environmental engagement involves the
129
learner in the change of the environment as it happens and seeks to measure the changes
perceived by the learner as they occur. Such changes and the participation of the learner
in them often contributes to a sense of contribution and belongingness (Trowler, 2010).
Activities that might reflect this aspect of learner engagement would include all
observable activities of the learner, as well as the evolving sophistication of the
discussion, dialogic response analysis in discussions, participating in polls, asking
questions, sense of how the participant is being represented/advocated in the
environment, and sense of alignment with the instructional outcome.
Directions
The statements/items contained in Addendum to this data sheet are being considered for inclusion
in the final version of a Learner Engagement Survey. This instrument will ultimately be used as
part of a body of research directed at determining and measuring differential learner outcomes as
they relate to the learning environments and the use of particular instructional
treatments/techniques. Please assist me in reviewing the content of these statements by providing
two ratings for each statement. The specific tasks to perform this review are as follows:
1. Task 1 – Review the construct of interest. In this case, the construct is “learner engagement”,
and is being defined along three dimensions (or “factors”) relating to emotional response to
learner experience, intellectual response to learner experience, and environmental response
relating to the interaction/change of environment and learner during the instructional
experience.
2. Task 2 – Which factor? Review each statement in the instrument and evaluate it (based on
your interpretation) as to whether the statement relates to one or more (or none) of the factors.
3. Task 3 – How certain are you? Evaluate the certainty you have in classifying this statement as
relating to the factor you selected.
4. Task 4 – Is this statement relevant? Evaluate the statement for its relevance and importance to
the factor you selected within the construct.
5. Task 5 – Any else? Please provide any comments you wish to make relating to a particular
statement in the space provided next to each statement.
6. Task 6 – A few qualitative questions. Please answer the questions at the end of this survey
that relate to your impression of the overall quality and function of the instrument as provided.
All comments are welcomed - your opinion is being sought because of your expertise in the field.
A variety of domains inform the construct of learner engagement, and this is one of many steps in
developing an effective measure of engagement effect within the learning experience.

130
ADDENDUM – ITEM REVIEW
Draft Instrument - A five-element Likert scale of agreement will be used in this instrument. All items are positively worded to elicit a
degree of agreement or disagreement. Additional items will be included to preclude some variance resulting from respondent
inattentiveness and satisficing (Thomas & Clifford, 2017; Buhrmester, Talaifar,& Gosling, 2018) – convenience sampling employing a
crowd-based platform will be used to collect respondent data.
Statements Factor (Select One)
Certainty:
How sure are you that this
statement measures the chosen
factor?
1 – Not Very Sure
2 – Strongly
3 – Absolutely
Relevancy:
How relevant is this statement to
measuring the factor you have
selected?
1 – Irrelevant
2 – Not Very Relevant
3 – Somewhat Relevant
4 – Totally Relevant
Comments
The subject matter in the
program was important to me.
☐ I - Emotional Response
☐ II – Intellectual Response
☐ III – Environmental Response
☐ Neither
☐ 1 ☐ 2 ☐ 3 ☐1 ☐ 2 ☐ 3 ☐ 4
I am inspired to further study
the subject matter that was
addressed in this program.
☐ I - Emotional Response
☐ II – Intellectual Response
☐ III – Environmental Response
☐ Neither
☐ 1 ☐ 2 ☐ 3 ☐1 ☐ 2 ☐ 3 ☐ 4
Class participants were
challenged in this program to
perform.
☐ I - Emotional Response
☐ II – Intellectual Response
☐ III – Environmental Response
☐ Neither
☐ 1 ☐ 2 ☐ 3 ☐1 ☐ 2 ☐ 3 ☐ 4

131
Participants were respectful of
each other’s opinion in the
program.
☐ I - Emotional Response
☐ II – Intellectual Response
☐ III – Environmental Response
☐ Neither
☐ 1 ☐ 2 ☐ 3 ☐1 ☐ 2 ☐ 3 ☐ 4
My level of experience and
subject matter expertise in this
area was less than the other
students in the program.
☐ I - Emotional Response
☐ II – Intellectual Response
☐ III – Environmental Response
☐ Neither
☐ 1 ☐ 2 ☐ 3 ☐1 ☐ 2 ☐ 3 ☐ 4
I enjoyed this instructional
program.
☐ I - Emotional Response
☐ II – Intellectual Response
☐ III – Environmental Response
☐ Neither
☐ 1 ☐ 2 ☐ 3 ☐1 ☐ 2 ☐ 3 ☐ 4
I benefited from interacting
with others in the instructional
delivery.
☐ I - Emotional Response
☐ II – Intellectual Response
☐ III – Environmental Response
☐ Neither
☐ 1 ☐ 2 ☐ 3 ☐1 ☐ 2 ☐ 3 ☐ 4
Interacting with others in the
program was an important part
of the instructional experience.
☐ I - Emotional Response
☐ II – Intellectual Response
☐ III – Environmental Response
☐ Neither
☐ 1 ☐ 2 ☐ 3 ☐1 ☐ 2 ☐ 3 ☐ 4

132
I was intellectually challenged
in this program.
☐ I - Emotional Response
☐ II – Intellectual Response
☐ III – Environmental Response
☐ Neither
☐ 1 ☐ 2 ☐ 3 ☐1 ☐ 2 ☐ 3 ☐ 4
The instructor presented the
learning content in ways that
helped me to learn.
☐ I - Emotional Response
☐ II – Intellectual Response
☐ III – Environmental Response
☐ Neither
☐ 1 ☐ 2 ☐ 3 ☐1 ☐ 2 ☐ 3 ☐ 4
I enjoyed collaborating with
others in the activities in the
program.
☐ I - Emotional Response
☐ II – Intellectual Response
☐ III – Environmental Response
☐ Neither
☐ 1 ☐ 2 ☐ 3 ☐1 ☐ 2 ☐ 3 ☐ 4
I was excited to participate in
this program.
☐ I - Emotional Response
☐ II – Intellectual Response
☐ III – Environmental Response
☐ Neither
☐ 1 ☐ 2 ☐ 3 ☐1 ☐ 2 ☐ 3 ☐ 4
I felt the class worked well
together in the instructional
program.
☐ I - Emotional Response
☐ II – Intellectual Response
☐ III – Environmental Response
☐ Neither
☐ 1 ☐ 2 ☐ 3 ☐1 ☐ 2 ☐ 3 ☐ 4
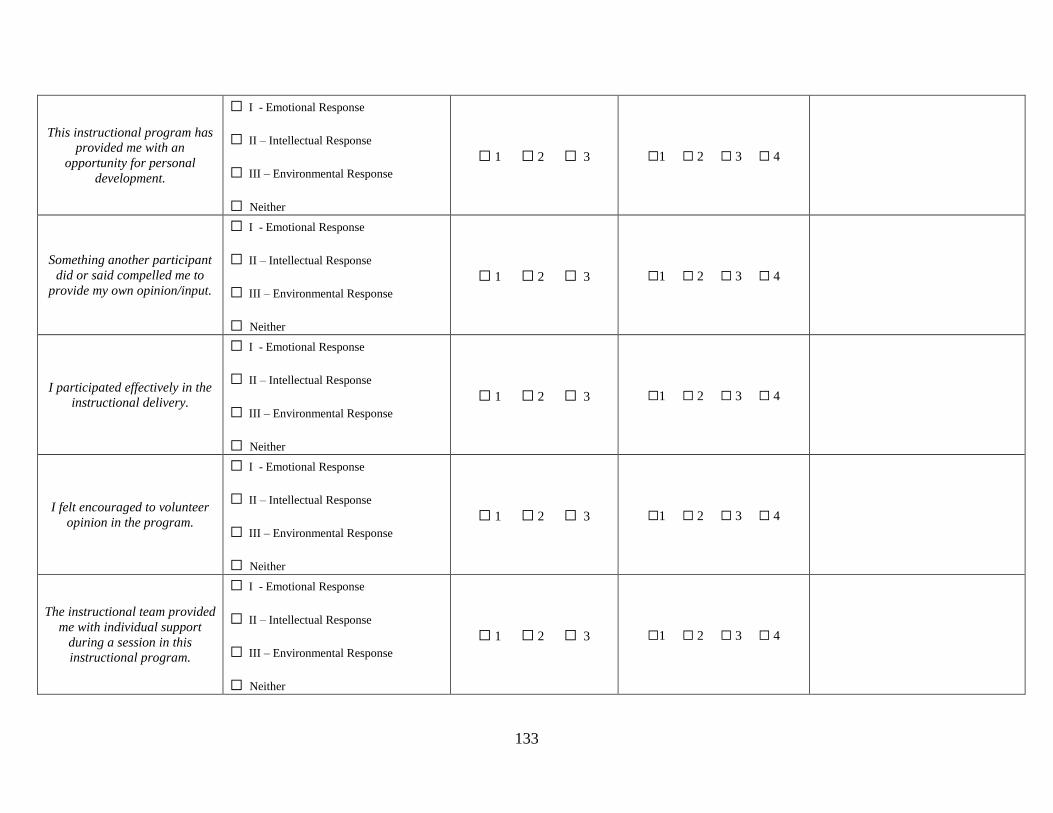
133
This instructional program has
provided me with an
opportunity for personal
development.
☐ I - Emotional Response
☐ II – Intellectual Response
☐ III – Environmental Response
☐ Neither
☐ 1 ☐ 2 ☐ 3 ☐1 ☐ 2 ☐ 3 ☐ 4
Something another participant
did or said compelled me to
provide my own opinion/input.
☐ I - Emotional Response
☐ II – Intellectual Response
☐ III – Environmental Response
☐ Neither
☐ 1 ☐ 2 ☐ 3 ☐1 ☐ 2 ☐ 3 ☐ 4
I participated effectively in the
instructional delivery.
☐ I - Emotional Response
☐ II – Intellectual Response
☐ III – Environmental Response
☐ Neither
☐ 1 ☐ 2 ☐ 3 ☐1 ☐ 2 ☐ 3 ☐ 4
I felt encouraged to volunteer
opinion in the program.
☐ I - Emotional Response
☐ II – Intellectual Response
☐ III – Environmental Response
☐ Neither
☐ 1 ☐ 2 ☐ 3 ☐1 ☐ 2 ☐ 3 ☐ 4
The instructional team provided
me with individual support
during a session in this
instructional program.
☐ I - Emotional Response
☐ II – Intellectual Response
☐ III – Environmental Response
☐ Neither
☐ 1 ☐ 2 ☐ 3 ☐1 ☐ 2 ☐ 3 ☐ 4
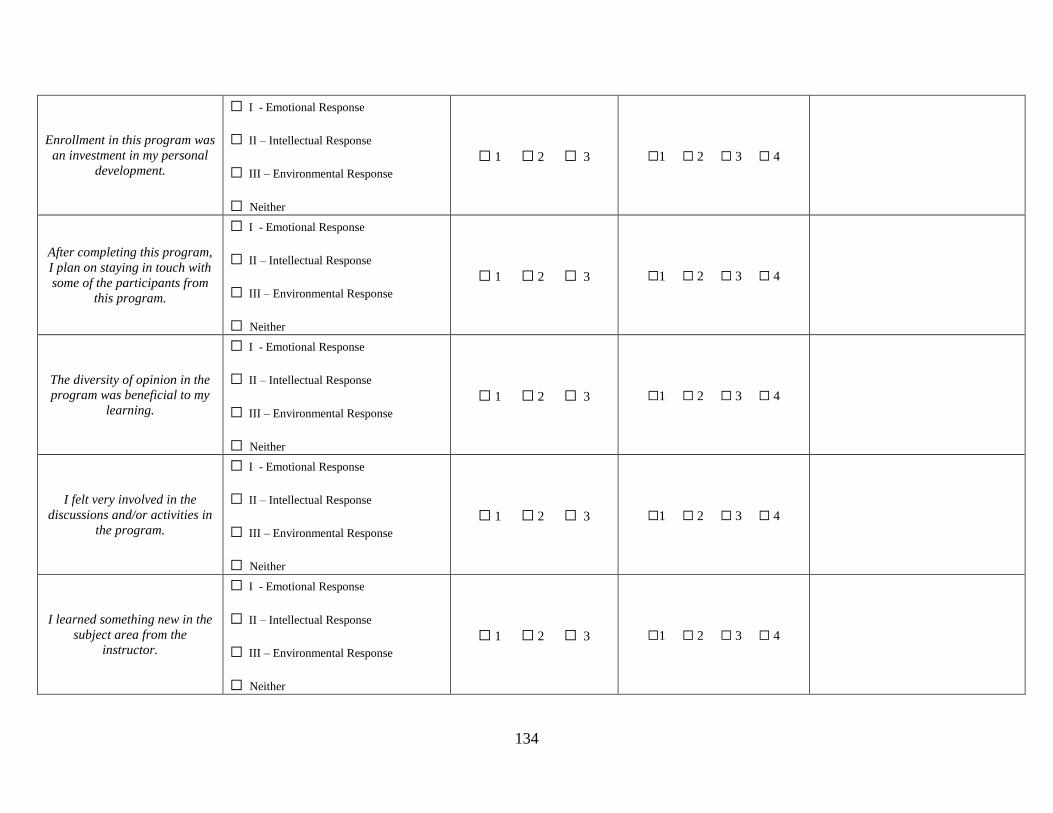
134
Enrollment in this program was
an investment in my personal
development.
☐ I - Emotional Response
☐ II – Intellectual Response
☐ III – Environmental Response
☐ Neither
☐ 1 ☐ 2 ☐ 3 ☐1 ☐ 2 ☐ 3 ☐ 4
After completing this program,
I plan on staying in touch with
some of the participants from
this program.
☐ I - Emotional Response
☐ II – Intellectual Response
☐ III – Environmental Response
☐ Neither
☐ 1 ☐ 2 ☐ 3 ☐1 ☐ 2 ☐ 3 ☐ 4
The diversity of opinion in the
program was beneficial to my
learning.
☐ I - Emotional Response
☐ II – Intellectual Response
☐ III – Environmental Response
☐ Neither
☐ 1 ☐ 2 ☐ 3 ☐1 ☐ 2 ☐ 3 ☐ 4
I felt very involved in the
discussions and/or activities in
the program.
☐ I - Emotional Response
☐ II – Intellectual Response
☐ III – Environmental Response
☐ Neither
☐ 1 ☐ 2 ☐ 3 ☐1 ☐ 2 ☐ 3 ☐ 4
I learned something new in the
subject area from the
instructor.
☐ I - Emotional Response
☐ II – Intellectual Response
☐ III – Environmental Response
☐ Neither
☐ 1 ☐ 2 ☐ 3 ☐1 ☐ 2 ☐ 3 ☐ 4
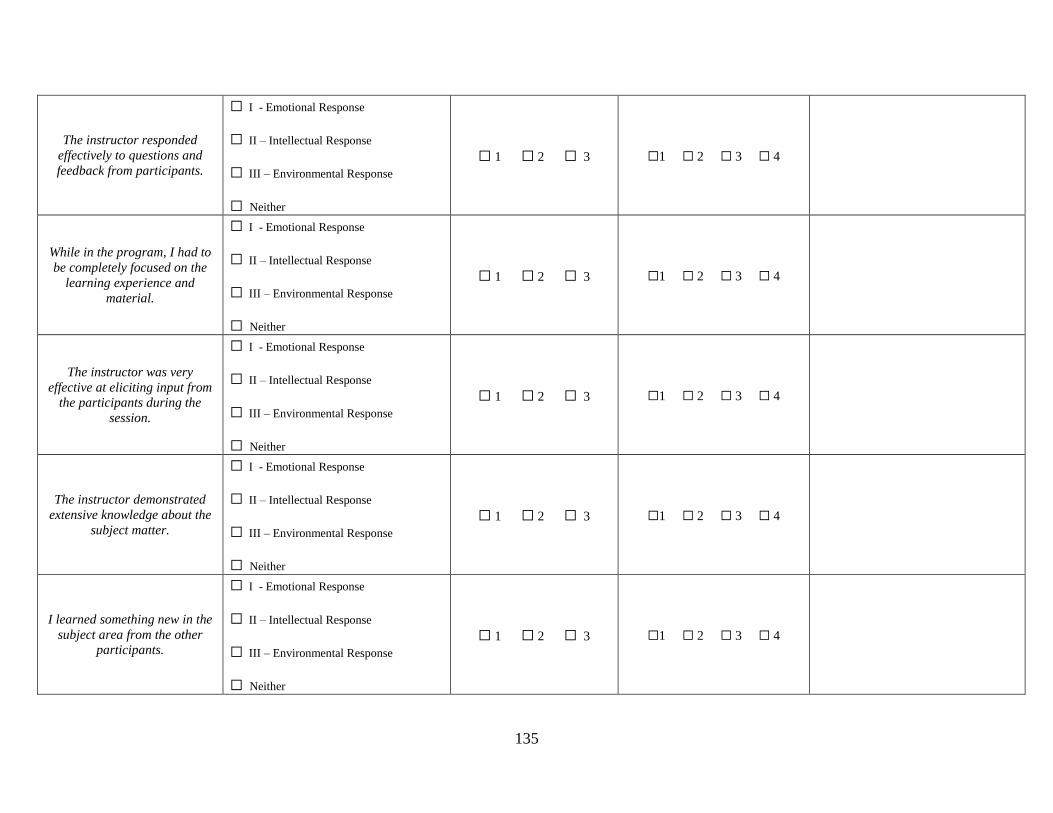
135
The instructor responded
effectively to questions and
feedback from participants.
☐ I - Emotional Response
☐ II – Intellectual Response
☐ III – Environmental Response
☐ Neither
☐ 1 ☐ 2 ☐ 3 ☐1 ☐ 2 ☐ 3 ☐ 4
While in the program, I had to
be completely focused on the
learning experience and
material.
☐ I - Emotional Response
☐ II – Intellectual Response
☐ III – Environmental Response
☐ Neither
☐ 1 ☐ 2 ☐ 3 ☐1 ☐ 2 ☐ 3 ☐ 4
The instructor was very
effective at eliciting input from
the participants during the
session.
☐ I - Emotional Response
☐ II – Intellectual Response
☐ III – Environmental Response
☐ Neither
☐ 1 ☐ 2 ☐ 3 ☐1 ☐ 2 ☐ 3 ☐ 4
The instructor demonstrated
extensive knowledge about the
subject matter.
☐ I - Emotional Response
☐ II – Intellectual Response
☐ III – Environmental Response
☐ Neither
☐ 1 ☐ 2 ☐ 3 ☐1 ☐ 2 ☐ 3 ☐ 4
I learned something new in the
subject area from the other
participants.
☐ I - Emotional Response
☐ II – Intellectual Response
☐ III – Environmental Response
☐ Neither
☐ 1 ☐ 2 ☐ 3 ☐1 ☐ 2 ☐ 3 ☐ 4
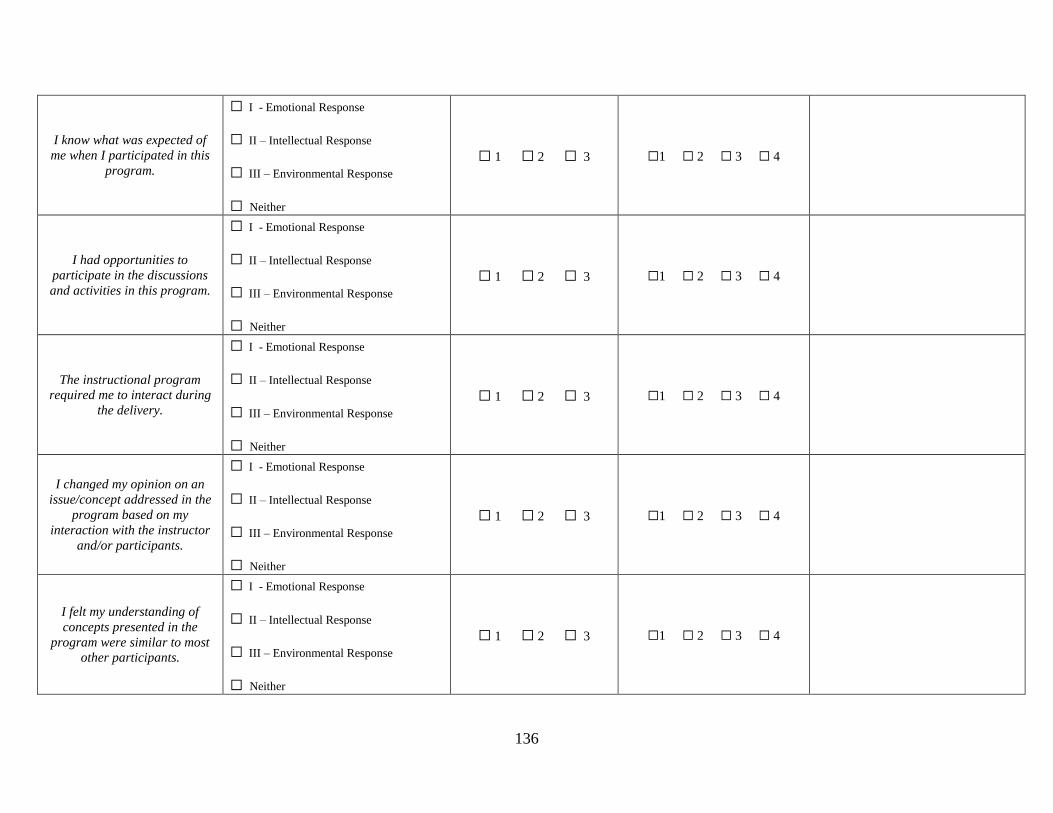
136
I know what was expected of
me when I participated in this
program.
☐ I - Emotional Response
☐ II – Intellectual Response
☐ III – Environmental Response
☐ Neither
☐ 1 ☐ 2 ☐ 3 ☐1 ☐ 2 ☐ 3 ☐ 4
I had opportunities to
participate in the discussions
and activities in this program.
☐ I - Emotional Response
☐ II – Intellectual Response
☐ III – Environmental Response
☐ Neither
☐ 1 ☐ 2 ☐ 3 ☐1 ☐ 2 ☐ 3 ☐ 4
The instructional program
required me to interact during
the delivery.
☐ I - Emotional Response
☐ II – Intellectual Response
☐ III – Environmental Response
☐ Neither
☐ 1 ☐ 2 ☐ 3 ☐1 ☐ 2 ☐ 3 ☐ 4
I changed my opinion on an
issue/concept addressed in the
program based on my
interaction with the instructor
and/or participants.
☐ I - Emotional Response
☐ II – Intellectual Response
☐ III – Environmental Response
☐ Neither
☐ 1 ☐ 2 ☐ 3 ☐1 ☐ 2 ☐ 3 ☐ 4
I felt my understanding of
concepts presented in the
program were similar to most
other participants.
☐ I - Emotional Response
☐ II – Intellectual Response
☐ III – Environmental Response
☐ Neither
☐ 1 ☐ 2 ☐ 3 ☐1 ☐ 2 ☐ 3 ☐ 4
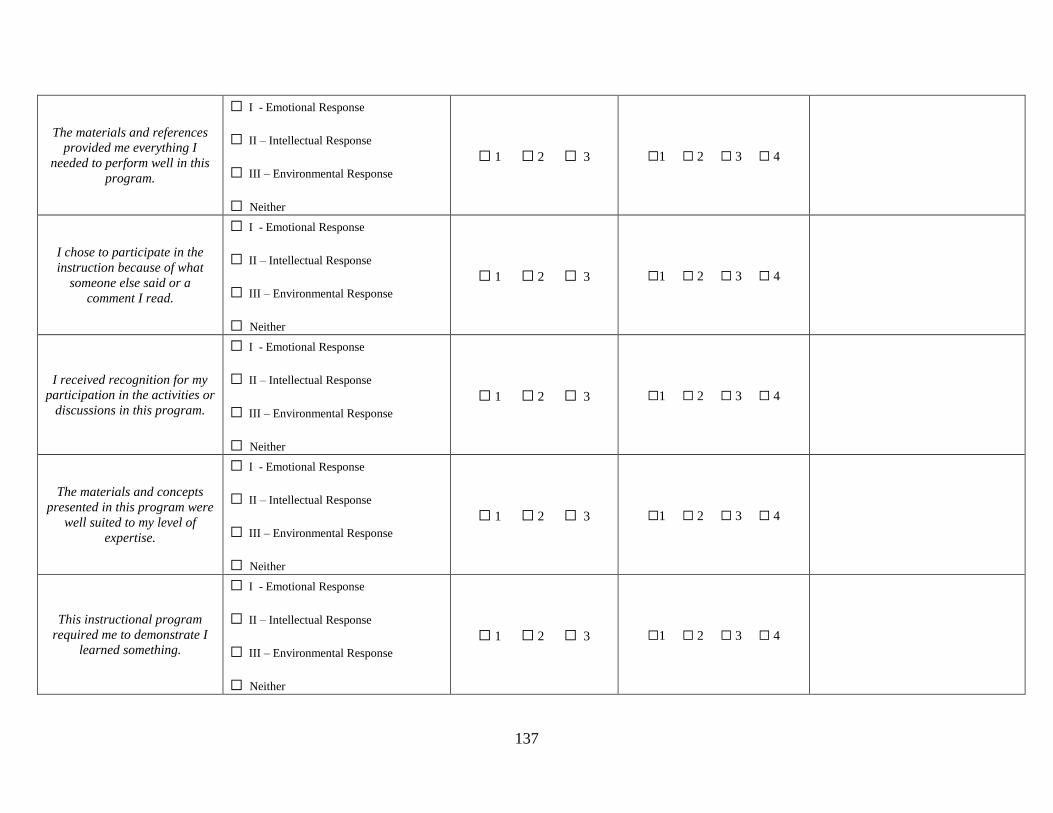
137
The materials and references
provided me everything I
needed to perform well in this
program.
☐ I - Emotional Response
☐ II – Intellectual Response
☐ III – Environmental Response
☐ Neither
☐ 1 ☐ 2 ☐ 3 ☐1 ☐ 2 ☐ 3 ☐ 4
I chose to participate in the
instruction because of what
someone else said or a
comment I read.
☐ I - Emotional Response
☐ II – Intellectual Response
☐ III – Environmental Response
☐ Neither
☐ 1 ☐ 2 ☐ 3 ☐1 ☐ 2 ☐ 3 ☐ 4
I received recognition for my
participation in the activities or
discussions in this program.
☐ I - Emotional Response
☐ II – Intellectual Response
☐ III – Environmental Response
☐ Neither
☐ 1 ☐ 2 ☐ 3 ☐1 ☐ 2 ☐ 3 ☐ 4
The materials and concepts
presented in this program were
well suited to my level of
expertise.
☐ I - Emotional Response
☐ II – Intellectual Response
☐ III – Environmental Response
☐ Neither
☐ 1 ☐ 2 ☐ 3 ☐1 ☐ 2 ☐ 3 ☐ 4
This instructional program
required me to demonstrate I
learned something.
☐ I - Emotional Response
☐ II – Intellectual Response
☐ III – Environmental Response
☐ Neither
☐ 1 ☐ 2 ☐ 3 ☐1 ☐ 2 ☐ 3 ☐ 4

138
I prefer to listen to others
rather than actively participate
during the instructional deliver.
☐ I - Emotional Response
☐ II – Intellectual Response
☐ III – Environmental Response
☐ Neither
☐ 1 ☐ 2 ☐ 3 ☐1 ☐ 2 ☐ 3 ☐ 4
My answer to a question posed
by the instructor during the
program changed because of
what another participant said.
☐ I - Emotional Response
☐ II – Intellectual Response
☐ III – Environmental Response
☐ Neither
☐ 1 ☐ 2 ☐ 3 ☐1 ☐ 2 ☐ 3 ☐ 4
I understood a concept better
when another participant asked
a questions about it, and the
concept got discussed in a
different way.
☐ I - Emotional Response
☐ II – Intellectual Response
☐ III – Environmental Response
☐ Neither
☐ 1 ☐ 2 ☐ 3 ☐1 ☐ 2 ☐ 3 ☐ 4
I was initially hesitant to ask a
question or participate, but
once other participants started
asking questions or
commenting, I felt better about
doing so myself.
☐ I - Emotional Response
☐ II – Intellectual Response
☐ III – Environmental Response
☐ Neither
☐ 1 ☐ 2 ☐ 3 ☐1 ☐ 2 ☐ 3 ☐ 4
I liked the ability to interact
with others through multiple
methods (chat, direct message,
raising hand and talking, poll
voting, etc.)
☐ I - Emotional Response
☐ II – Intellectual Response
☐ III – Environmental Response
☐ Neither
☐ 1 ☐ 2 ☐ 3 ☐1 ☐ 2 ☐ 3 ☐ 4
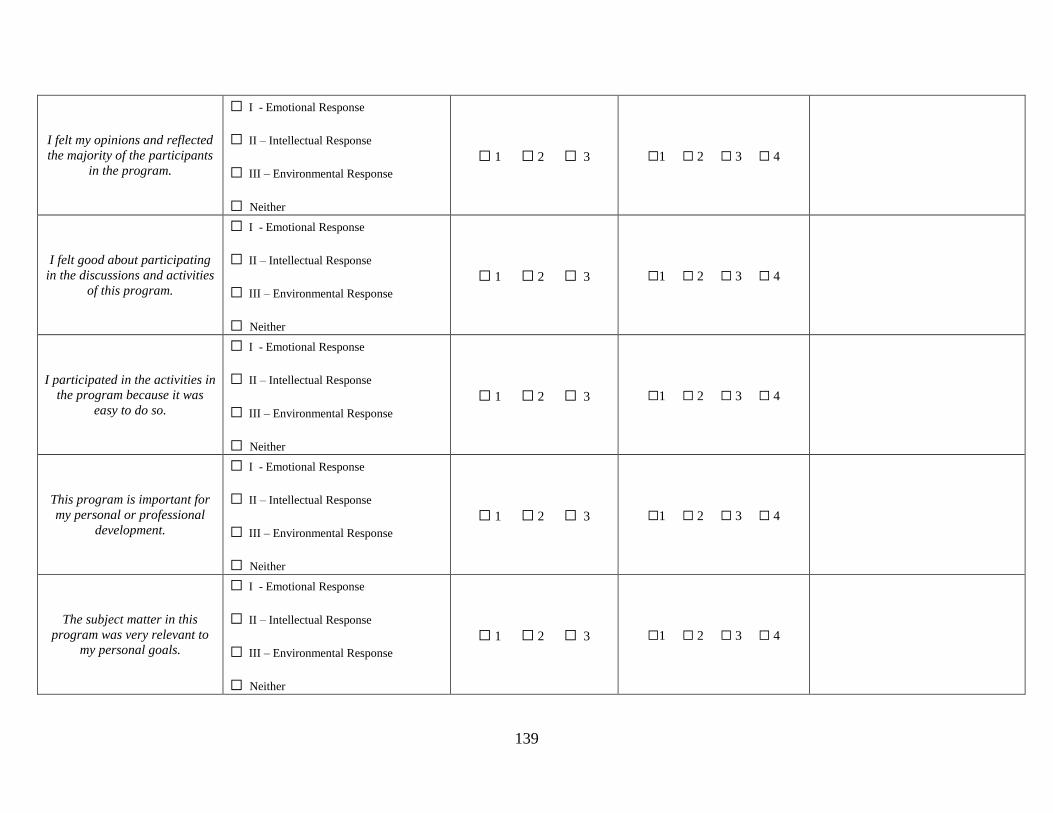
139
I felt my opinions and reflected
the majority of the participants
in the program.
☐ I - Emotional Response
☐ II – Intellectual Response
☐ III – Environmental Response
☐ Neither
☐ 1 ☐ 2 ☐ 3 ☐1 ☐ 2 ☐ 3 ☐ 4
I felt good about participating
in the discussions and activities
of this program.
☐ I - Emotional Response
☐ II – Intellectual Response
☐ III – Environmental Response
☐ Neither
☐ 1 ☐ 2 ☐ 3 ☐1 ☐ 2 ☐ 3 ☐ 4
I participated in the activities in
the program because it was
easy to do so.
☐ I - Emotional Response
☐ II – Intellectual Response
☐ III – Environmental Response
☐ Neither
☐ 1 ☐ 2 ☐ 3 ☐1 ☐ 2 ☐ 3 ☐ 4
This program is important for
my personal or professional
development.
☐ I - Emotional Response
☐ II – Intellectual Response
☐ III – Environmental Response
☐ Neither
☐ 1 ☐ 2 ☐ 3 ☐1 ☐ 2 ☐ 3 ☐ 4
The subject matter in this
program was very relevant to
my personal goals.
☐ I - Emotional Response
☐ II – Intellectual Response
☐ III – Environmental Response
☐ Neither
☐ 1 ☐ 2 ☐ 3 ☐1 ☐ 2 ☐ 3 ☐ 4

140
I liked being able to interact in
a variety of ways with the
others in my instructional
program.
☐ I - Emotional Response
☐ II – Intellectual Response
☐ III – Environmental Response
☐ Neither
☐ 1 ☐ 2 ☐ 3 ☐1 ☐ 2 ☐ 3 ☐ 4
When one person offered a
strong opinion, most of the
class tended to “go along” with
that position.
☐ I - Emotional Response
☐ II – Intellectual Response
☐ III – Environmental Response
☐ Neither
☐ 1 ☐ 2 ☐ 3 ☐1 ☐ 2 ☐ 3 ☐ 4
When I disagreed with appoint
made in the program, I
expressed my disagreement.
☐ I - Emotional Response
☐ II – Intellectual Response
☐ III – Environmental Response
☐ Neither
☐ 1 ☐ 2 ☐ 3 ☐1 ☐ 2 ☐ 3 ☐ 4

141
Final questions:
1. Do you believe this instrument is complete? Why or why not?
142
2. Do you believe this survey (which will be comprised of some of these items) is easy to answer? Why or why not?

143
Appendix C
Learner Engagement Instrument for EFA
Principal Investigator: Dr. Scott Brown
Student Researcher: Charles Dye
Study Title: Qualitative & Quantitative Inquiry into Learner Engagement
Sponsor: University of Connecticut, Neag School of Education
Note: This instrument version is for review purposes only, survey will be administered online,
with item order randomized.
What is your age (round to the nearest year)?
In what industry classification most closely describes where you currently work?
Manufacturing
Pharmaceutical
Finance
Energy
Technical
Education
Medical
Government
Other
How frequently do you attend some form of professional development or training related to your
job?
Multiple time a week
Weekly
Monthly
Annually
Less frequently than annually
To complete the rest of this survey, please think about a recent instructional experience you had
relating to professional development or certifications for your employment that included other
participants (e.g. NOT one-on-one coaching, mentoring, or individualized development).
What type of instructional treatment/experience are you referring to for this survey?

144
Live In-Person Delivery/Traditional Classroom (<50 participants)
Large Scale Conference/Presentation/MOOC (> 50 participants)
Live Online (via Web Conference or Virtual Classroom (e.g. WebEx, Zoom, Skype,
etc.))
Self-Paced/Directed (either online, computer-based, correspondence, or other
method)
Blended Program (a combination of some or all of the above)
Other: _________________________
Approximately how long was the instructional experience that you are referring to in this survey
(in hours)?
Please rate how strongly you agree or disagree with each of the following statements by placing
a check mark in the appropriate box.
1. I felt encouraged to volunteer opinion in the program.
Strongly agree
Somewhat agree
Neither agree nor disagree
Somewhat disagree
Strongly disagree
2. I received recognition for my participation in the activities or discussions in this program.
Strongly agree
Somewhat agree
Neither agree nor disagree
Somewhat disagree
Strongly disagree
3. I enjoyed participating in the instructional program.
Strongly agree
Somewhat agree
Neither agree nor disagree
Somewhat disagree
Strongly disagree
4. I enjoyed this instructional program.
Strongly agree
Somewhat agree
Neither agree nor disagree
Somewhat disagree
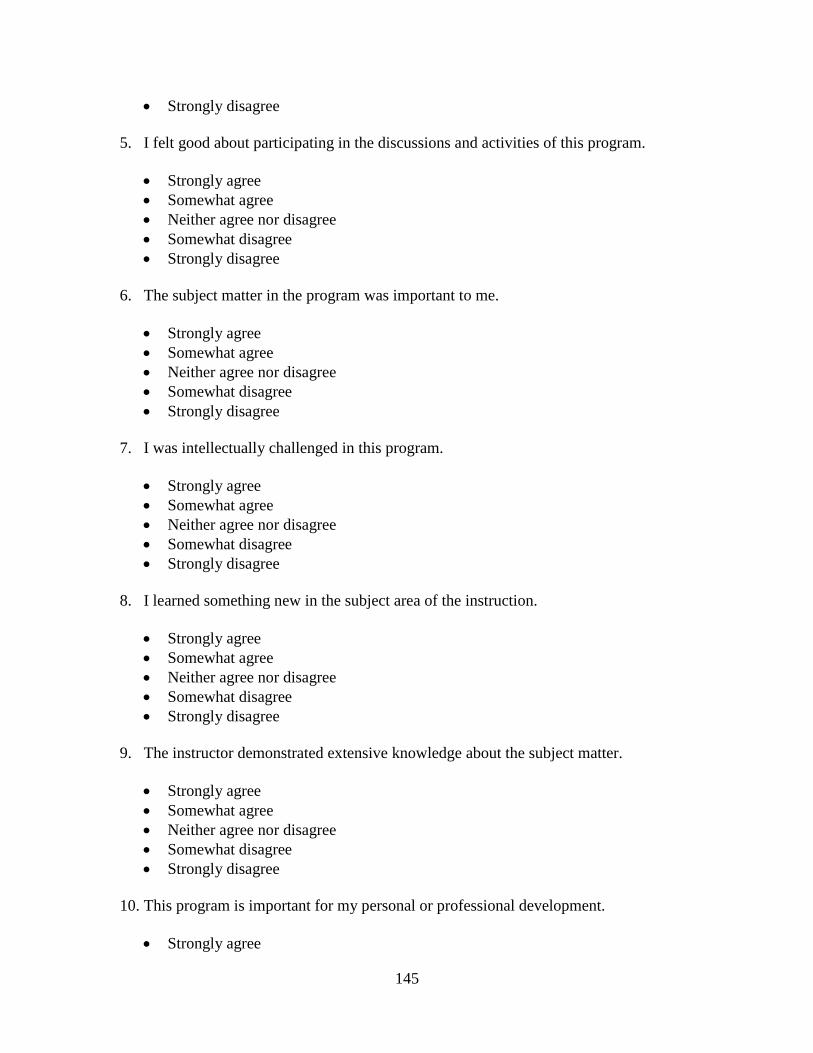
145
Strongly disagree
5. I felt good about participating in the discussions and activities of this program.
Strongly agree
Somewhat agree
Neither agree nor disagree
Somewhat disagree
Strongly disagree
6. The subject matter in the program was important to me.
Strongly agree
Somewhat agree
Neither agree nor disagree
Somewhat disagree
Strongly disagree
7. I was intellectually challenged in this program.
Strongly agree
Somewhat agree
Neither agree nor disagree
Somewhat disagree
Strongly disagree
8. I learned something new in the subject area of the instruction.
Strongly agree
Somewhat agree
Neither agree nor disagree
Somewhat disagree
Strongly disagree
9. The instructor demonstrated extensive knowledge about the subject matter.
Strongly agree
Somewhat agree
Neither agree nor disagree
Somewhat disagree
Strongly disagree
10. This program is important for my personal or professional development.
Strongly agree
146
Somewhat agree
Neither agree nor disagree
Somewhat disagree
Strongly disagree
11. The materials and concepts presented in this program were well suited to my level of
expertise.
Strongly agree
Somewhat agree
Neither agree nor disagree
Somewhat disagree
Strongly disagree
12. Something another participant did or said compelled me to provide my own
opinion/input.
Strongly agree
Somewhat agree
Neither agree nor disagree
Somewhat disagree
Strongly disagree
13. I participated effectively in the instructional delivery.
Strongly agree
Somewhat agree
Neither agree nor disagree
Somewhat disagree
Strongly disagree
14. The diversity of opinion in the program was beneficial to my learning.
Strongly agree
Somewhat agree
Neither agree nor disagree
Somewhat disagree
Strongly disagree
15. I changed my opinion or understanding of an issue/concept based on my interaction with
the instructor and/or participants.
Strongly agree
Somewhat agree
Neither agree nor disagree

147
Somewhat disagree
Strongly disagree
16. I understood a concept better when another participant asked a question about it.
Strongly agree
Somewhat agree
Neither agree nor disagree
Somewhat disagree
Strongly disagree
17. Interacting with others in the program was an important part of the instructional
experience.
Strongly agree
Somewhat agree
Neither agree nor disagree
Somewhat disagree
Strongly disagree

148
Appendix D
EFA and CFA Sample Composition & Demographics
EFA Sample Descriptive Statistics and Industry Classifications
The sample collected for the EFA analysis was conducted through Amazon Mechanical
Turk. The sample of adult learners (n=300) were recruited from a population of adult workplace
learners and stakeholders coupled with a coordinated campaign of social media recruitment. All
responses obtained through the blind online platform were screened for employment status and
residency as meeting the criteria for participation.
Age – Respondent age descriptive statistics align with that of the general U.S. workforce.
Median response age for the sample (43) closely corresponded to the U.S. median work workforce
(42.7), supporting the assertion from Hamby & Taylor (2016) that the convenience sampling
approach provides a sufficiently diverse data sample with respect to measured demographics. The
age distribution demonstrated modest skew towards a younger population youth versus the U.S.
workforce (see Figure D-1 and Figure D-2).
Figure D-1 Respondent Age Distribution

149
Figure D-2 U.S. Workforce Age Distribution1
Instructional Treatment – Respondents in the EFA sample indicated a wide variety of
instructional formats that informed their response to the EFA instrument (see Table D-1), and
reflected industry trends noted in the 2018 AST State of the Training Industry Report (ATD,
2019) that traditional classroom had been supplanted by a variety of methods for instructional
delivery.
Table D-1
Instructional Format for Respondents in the EFA Sample
Type of Training Attended Frequency
Percent of Total
Responses
Traditional Classroom 9 3.0
Large Audience Presentation 112 37.3
Live Online 38 12.7
Self-Paced
(Online or Correspondence) 44 14.7
Blended 65 21.7
Other 32 10.7
Total 300 100.0
1 U.S. workforce data in thousands. U.S. data retrieved from Bureau of Labor Statistics.
(2017). Employed persons by detailed industry and age [Time series]. Generated December
13, 2019.
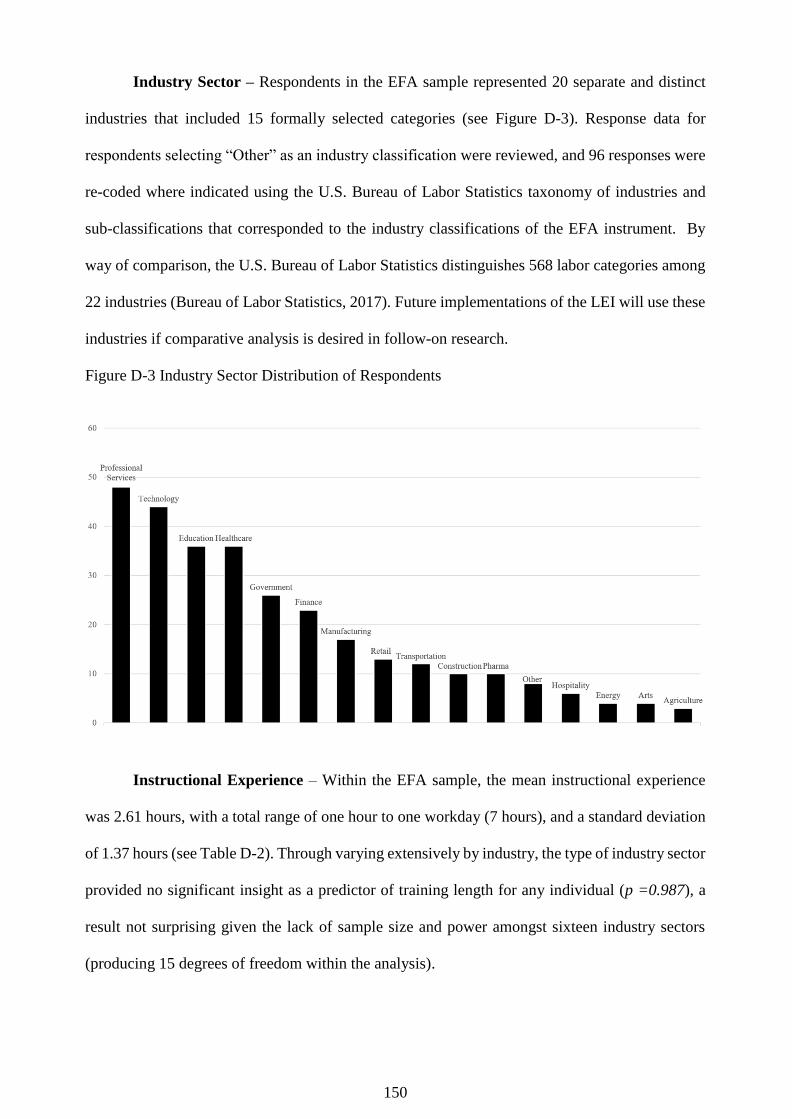
150
Industry Sector – Respondents in the EFA sample represented 20 separate and distinct
industries that included 15 formally selected categories (see Figure D-3). Response data for
respondents selecting “Other” as an industry classification were reviewed, and 96 responses were
re-coded where indicated using the U.S. Bureau of Labor Statistics taxonomy of industries and
sub-classifications that corresponded to the industry classifications of the EFA instrument. By
way of comparison, the U.S. Bureau of Labor Statistics distinguishes 568 labor categories among
22 industries (Bureau of Labor Statistics, 2017). Future implementations of the LEI will use these
industries if comparative analysis is desired in follow-on research.
Figure D-3 Industry Sector Distribution of Respondents
Instructional Experience – Within the EFA sample, the mean instructional experience
was 2.61 hours, with a total range of one hour to one workday (7 hours), and a standard deviation
of 1.37 hours (see Table D-2). Through varying extensively by industry, the type of industry sector
provided no significant insight as a predictor of training length for any individual (p =0.987), a
result not surprising given the lack of sample size and power amongst sixteen industry sectors
(producing 15 degrees of freedom within the analysis).
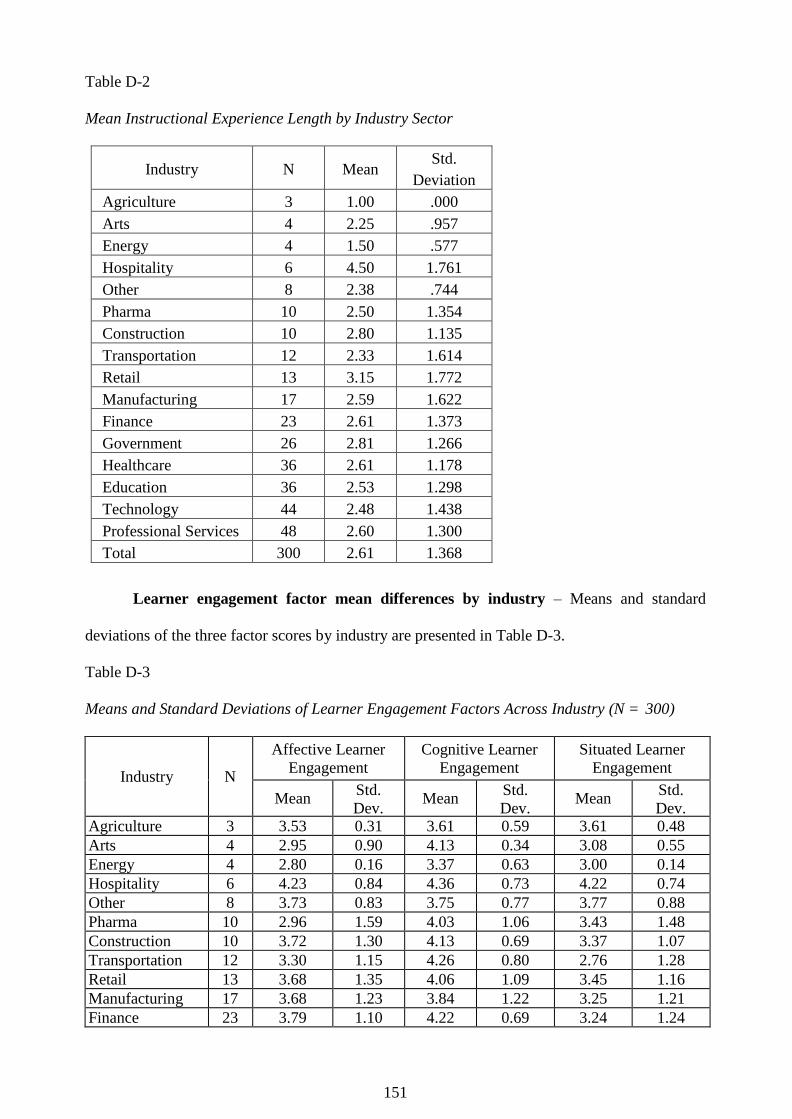
151
Table D-2
Mean Instructional Experience Length by Industry Sector
Industry N Mean Std.
Deviation
Agriculture 3 1.00 .000
Arts 4 2.25 .957
Energy 4 1.50 .577
Hospitality 6 4.50 1.761
Other 8 2.38 .744
Pharma 10 2.50 1.354
Construction 10 2.80 1.135
Transportation 12 2.33 1.614
Retail 13 3.15 1.772
Manufacturing 17 2.59 1.622
Finance 23 2.61 1.373
Government 26 2.81 1.266
Healthcare 36 2.61 1.178
Education 36 2.53 1.298
Technology 44 2.48 1.438
Professional Services 48 2.60 1.300
Total 300 2.61 1.368
Learner engagement factor mean differences by industry – Means and standard
deviations of the three factor scores by industry are presented in Table D-3.
Table D-3
Means and Standard Deviations of Learner Engagement Factors Across Industry (N = 300)
Industry N
Affective Learner
Engagement
Cognitive Learner
Engagement
Situated Learner
Engagement
Mean Std.
Dev. Mean
Std.
Dev. Mean
Std.
Dev. Agriculture 3 3.53 0.31 3.61 0.59 3.61 0.48
Arts 4 2.95 0.90 4.13 0.34 3.08 0.55
Energy 4 2.80 0.16 3.37 0.63 3.00 0.14
Hospitality 6 4.23 0.84 4.36 0.73 4.22 0.74
Other 8 3.73 0.83 3.75 0.77 3.77 0.88
Pharma 10 2.96 1.59 4.03 1.06 3.43 1.48
Construction 10 3.72 1.30 4.13 0.69 3.37 1.07
Transportation 12 3.30 1.15 4.26 0.80 2.76 1.28
Retail 13 3.68 1.35 4.06 1.09 3.45 1.16
Manufacturing 17 3.68 1.23 3.84 1.22 3.25 1.21
Finance 23 3.79 1.10 4.22 0.69 3.24 1.24
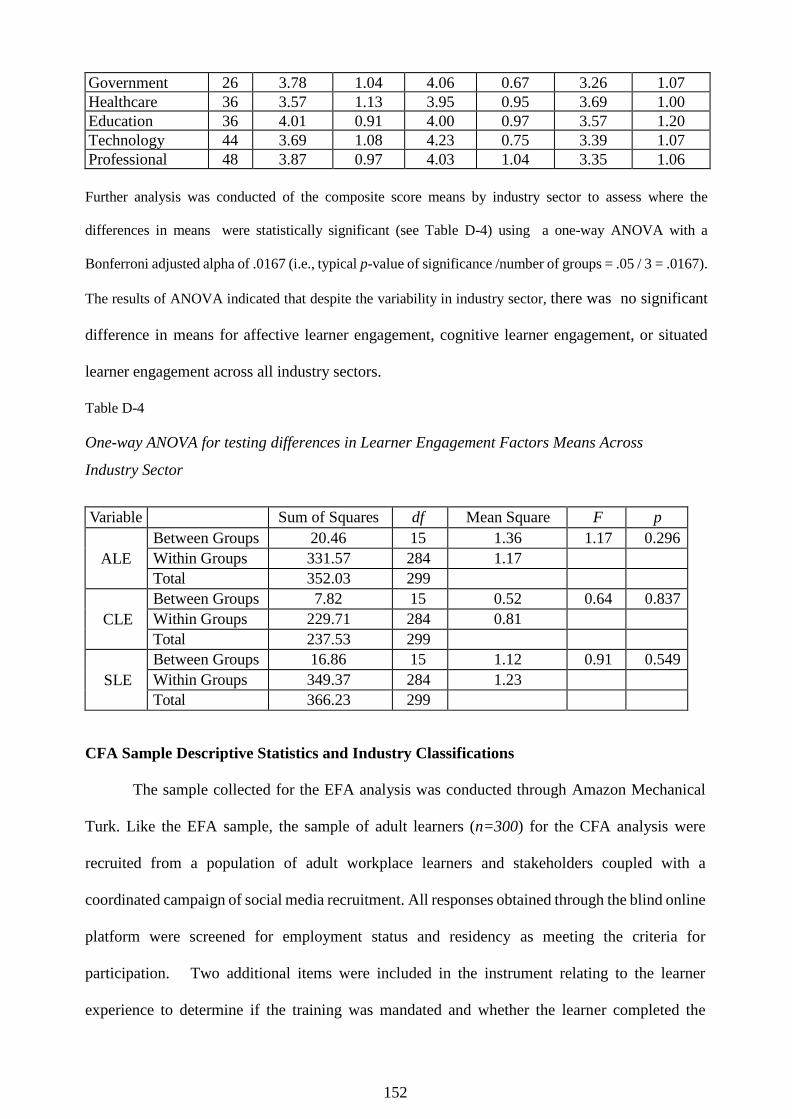
152
Government 26 3.78 1.04 4.06 0.67 3.26 1.07
Healthcare 36 3.57 1.13 3.95 0.95 3.69 1.00
Education 36 4.01 0.91 4.00 0.97 3.57 1.20
Technology 44 3.69 1.08 4.23 0.75 3.39 1.07
Professional
Services
48 3.87 0.97 4.03 1.04 3.35 1.06
Further analysis was conducted of the composite score means by industry sector to assess where the
differences in means were statistically significant (see Table D-4) using a one-way ANOVA with a
Bonferroni adjusted alpha of .0167 (i.e., typical p-value of significance /number of groups = .05 / 3 = .0167).
The results of ANOVA indicated that despite the variability in industry sector, there was no significant
difference in means for affective learner engagement, cognitive learner engagement, or situated
learner engagement across all industry sectors.
Table D-4
One-way ANOVA for testing differences in Learner Engagement Factors Means Across
Industry Sector
Variable Sum of Squares df Mean Square F p
ALE
Between Groups 20.46 15 1.36 1.17 0.296
Within Groups 331.57 284 1.17
Total 352.03 299
CLE
Between Groups 7.82 15 0.52 0.64 0.837
Within Groups 229.71 284 0.81
Total 237.53 299
SLE
Between Groups 16.86 15 1.12 0.91 0.549
Within Groups 349.37 284 1.23
Total 366.23 299
CFA Sample Descriptive Statistics and Industry Classifications
The sample collected for the EFA analysis was conducted through Amazon Mechanical
Turk. Like the EFA sample, the sample of adult learners (n=300) for the CFA analysis were
recruited from a population of adult workplace learners and stakeholders coupled with a
coordinated campaign of social media recruitment. All responses obtained through the blind online
platform were screened for employment status and residency as meeting the criteria for
participation. Two additional items were included in the instrument relating to the learner
experience to determine if the training was mandated and whether the learner completed the

153
instruction.
Age – Respondent age distribution in the CFA sample aligns with that of the general U.S.
workforce. Median response age for the sample (40) closely corresponded to the U.S. median
work workforce (42.7), supporting the assertion from Hamby & Taylor (2016) that the
convenience sampling approach provides a sufficiently diverse data sample with respect to
measured demographics. The age distribution demonstrated modest skew towards a younger
population youth versus the U.S. workforce (see Figure D-3).
Figure D-4 Respondent Age Distribution
Instructional Treatment – As in the EFA sample, respondents in the CFA sample
indicated a wide variety of instructional formats that informed their response to the instrument
(see Table D-5), and reflected industry trends noted in the 2018 AST State of the Training Industry
Report (ATD, 2019) that traditional classroom had been supplanted by a variety of methods for
instructional delivery.
Table D-5
Instructional Format for Respondents in the CFA Sample
Type of Training Attended Frequency
Percent of Total
Responses
Traditional Classroom 8 2.7
Large Audience Presentation 103 34.3
Live Online 51 17.0

154
Self-Paced
(Online or Correspondence) 49 16.3
Blended 59 19.7
Other 30 10.0
Total 300 100.0
Industry Sector – Respondents in the EFA sample represented 24 separate and distinct industries
that included 15 formally selected categories (see Figure D-5). Response data for respondents
selecting “Other” as an industry classification were reviewed, and 74 responses were re-coded
where indicated using the U.S. Bureau of Labor Statistics taxonomy of industries and sub-
classifications that corresponded to the industry classifications of the CFA instrument.
Figure D-5 Industry Sector Distribution of Respondents

155
Instructional Experience – Within the CFA sample, the mean instructional experience
was 2.44 hours, with a total range of one hour to one workday (7 hours), and a standard deviation
of 1.37 hours (see Table D-6). Through varying extensively by industry, the type of industry sector
provided no significant insight as a predictor of training length for any individual (p =0.487), a
result not surprising given the lack of sample size and power amongst sixteen industry sectors
(producing 15 degrees of freedom within the analysis).
Table D-6
Mean Instructional Experience Length by Industry Sector
Industry N Mean Std.
Deviation
Agriculture 1 2 -
Arts 5 1.8 1.10
Energy 33 2.61 1.44
Hospitality 3 2.33 0.58
Other 15 2.13 0.74
Pharma 39 2.62 1.74
Construction 6 1.5 0.55
Transportation 20 2.55 1.00
Retail 10 2.50 1.18
Manufacturing 19 2.21 1.23
Finance 36 2.83 1.48
Government 19 2.74 1.15
Healthcare 27 2.48 1.60
Education 22 2.27 1.08
Technology 25 1.84 1.07
Professional Services 20 2.50 1.762
Total 300 2.44 1.371

156
Learner engagement factor mean differences by industry – Means and standard
deviations of the three factor scores by industry are presented in Table D-7.
Table D-7
Means and Standard Deviations of Learner Engagement Factors Across Industry (N = 300)
Industry N
Affective Learner
Engagement
Cognitive Learner
Engagement
Situated Learner
Engagement
Mean Std.
Dev. Mean
Std.
Dev. Mean
Std.
Dev. Agriculture 1 2 - 3.83 - 3 -
Arts 5 3.44 0.67 3.97 0.64 3.27 0.19
Energy 33 3.63 1.14 4.04 0.87 3.57 1.05
Hospitality 3 3.60 0.40 3.78 0.25 3.39 0.35
Other 15 3.72 1.11 4.09 0.75 3.67 1.05
Pharma 39 3.69 1.18 3.99 0.98 3.69 1.06
Construction 6 4.03 0.41 4.22 0.51 3.39 0.89
Transportation 20 3.70 1.13 4.13 1.07 3.03 1.16
Retail 10 4.12 0.69 3.93 0.72 3.47 0.77
Manufacturing 19 3.96 0.72 3.96 0.62 3.40 0.69
Finance 36 3.63 1.12 3.95 1.01 3.33 1.06
Government 19 4.13 0.76 4.18 0.48 3.78 0.98
Healthcare 27 3.87 0.97 3.98 0.89 3.69 1.05
Education 22 3.80 0.92 3.95 0.77 3.36 1.07
Technology 25 3.61 1.04 3.59 1.02 3.40 0.86
Professional
Services
20 3.70 1.12 4.13 1.07 3.02 1.16
Further analysis was conducted of the composite score means by industry sector to assess where the
differences in means were statistically significant (see Table D-8) using a one-way ANOVA with a
Bonferroni adjusted alpha of .0167 (i.e., typical p-value of significance /number of groups = .05 / 3 = .0167).
The results of ANOVA indicated that despite the variability in industry sector, there was no significant
difference in means for affective learner engagement, cognitive learner engagement, or situated
learner engagement across all industry sectors.

157
Table D-8
One-way ANOVA for testing differences in Learner Engagement Factors Means Across
Industry Sector
Variable Sum of Squares df Mean Square F p
ALE
Between Groups 11.16 15 0.74 0.73 0.757
Within Groups 290.75 284 1.02
Total 301.91 299
CLE
Between Groups 5.87 15 0.39 0.49 0.941
Within Groups 223.69 284 0.79
Total 229.56 299
SLE
Between Groups 11.57 15 0.77 0.78 0.703
Within Groups 281.91 284 0.99
Total 293.48 299
Lastly, with the addition of two additional items on the CFA instrument, additional ANOVA
analysis was done to evaluate whether the mandatory nature of the instructional program was
predictive of the engagement of the learner under the theoretical model, a point made frequently
during the qualitative inquiry. Mandatory training was found to be a significant predictor of
engagement under the theoretical model of the study (see Table D-9).
Table D-9
Mandatory Attendance as a Predictor of Learner Engagement under the Theoretical Model
Variable Sum of Squares df Mean Square F p
ALE
Between Groups 21.68 1 21.68 23.05 <.001
Within Groups 280.23 298 0.94
Total 301.91 299
CLE
Between Groups 10.73 1 10.73 14.61 <.001
Within Groups 218.84 298 0.73
Total 229.57 299
SLE
Between Groups 3.76 1 3.76 3.87 0.05
Within Groups 289.71 298 0.97
Total 293.47 299
158
Appendix E
Learner Engagement Instrument for CFA
Principal Investigator: Dr. Scott Brown
Student Researcher: Charles Dye
Study Title: Qualitative & Quantitative Inquiry into Learner Engagement
Sponsor: University of Connecticut, Neag School of Education
Note: This instrument version is for review purposes only, survey will be administered online,
with item order randomized.
What is your age (round to the nearest year)?
In what industry classification most closely describes where you currently work?
Manufacturing
Pharmaceutical
Finance
Energy
Technical
Education
Medical
Government
Other
How frequently do you attend some form of professional development or training related to your
job?
Multiple time a week
Weekly
Monthly
Annually
Less frequently than annually
To complete the rest of this survey, please think about a recent instructional experience you had
relating to professional development or certifications for your employment that included other
participants (e.g. NOT one-on-one coaching, mentoring, or individualized development).
What type of instructional treatment/experience are you referring to for this survey?
Live In-Person Delivery/Traditional Classroom (<50 participants)
Large Scale Conference/Presentation/MOOC (> 50 participants)

159
Live Online (via Web Conference or Virtual Classroom (e.g. WebEx, Zoom, Skype,
etc.))
Self-Paced/Directed (either online, computer-based, correspondence, or other
method) with some form of Interaction with other Participants (Chat, Message Board,
etc.)
Blended Program (a combination of some or all of the above)
Other: _________________________
Approximately how long was the instructional experience that you are referring to in this survey
(in hours)?
Did you choose to attend this training, or was it mandated to you to attend?
Chose to attend
Training was mandated
Did you complete the training?
Yes
No
Please rate how strongly you agree or disagree with each of the following statements by placing
a check mark in the appropriate box.
1. I felt encouraged to volunteer opinion in the program.
Strongly agree
Somewhat agree
Neither agree nor disagree
Somewhat disagree
Strongly disagree
2. I received good feedback on my participation in the activities or discussions in this
instructional program.
Strongly agree
Somewhat agree
Neither agree nor disagree
Somewhat disagree
Strongly disagree
3. I enjoyed participating in the instructional program.
Strongly agree
Somewhat agree
Neither agree nor disagree
Somewhat disagree

160
Strongly disagree
4. I enjoyed this instructional program.
Strongly agree
Somewhat agree
Neither agree nor disagree
Somewhat disagree
Strongly disagree
5. I felt good about participating in the discussions and activities of this program.
Strongly agree
Somewhat agree
Neither agree nor disagree
Somewhat disagree
Strongly disagree
6. The subject matter in the instructional program was important to me.
Strongly agree
Somewhat agree
Neither agree nor disagree
Somewhat disagree
Strongly disagree
7. I was intellectually interested in the subject matter presented in the instructional program.
Strongly agree
Somewhat agree
Neither agree nor disagree
Somewhat disagree
Strongly disagree
8. I learned something new in the subject area of the instructional program.
Strongly agree
Somewhat agree
Neither agree nor disagree
Somewhat disagree
Strongly disagree

161
9. The instructor/instructional software provided extensive accurate and meaningful
information about the subject matter.
Strongly agree
Somewhat agree
Neither agree nor disagree
Somewhat disagree
Strongly disagree
10. This instructional program is important for my personal or professional development.
Strongly agree
Somewhat agree
Neither agree nor disagree
Somewhat disagree
Strongly disagree
11. The materials and concepts presented in the instructional program were well suited to my
level of expertise.
Strongly agree
Somewhat agree
Neither agree nor disagree
Somewhat disagree
Strongly disagree
12. Something another participant did or said compelled me to provide my own opinion/input
during instructional delivery.
Strongly agree
Somewhat agree
Neither agree nor disagree
Somewhat disagree
Strongly disagree
13. I participated effectively in the instructional delivery.
Strongly agree
Somewhat agree
Neither agree nor disagree
Somewhat disagree
Strongly disagree

162
14. The diversity of opinion evident during instructional delivery was beneficial to my
learning.
Strongly agree
Somewhat agree
Neither agree nor disagree
Somewhat disagree
Strongly disagree
15. I changed my opinion or understanding of an issue/concept based on my interaction with
the instructor and/or participants during the instructional program.
Strongly agree
Somewhat agree
Neither agree nor disagree
Somewhat disagree
Strongly disagree
16. I understood a concept better when another participant asked a question about it.
Strongly agree
Somewhat agree
Neither agree nor disagree
Somewhat disagree
Strongly disagree
17. Interacting with others in the instructional program was an important part of the
experience.
Strongly agree
Somewhat agree
Neither agree nor disagree
Somewhat disagree
Strongly disagree