Embed Size (px)
Citation preview
Department of Mechanics and Maritime Sciences CHALMERS UNIVERSITY OF TECHNOLOGY Gothenburg, Sweden 2019
A Proton Exchange Membrane & Solid Oxide Fuel Cell comparison Possible fuel cells and fuel costs Bachelor thesis in Marine engineering
Kristofer Sjölin
Emil Holmgren

BACHELOR THESIS 2019:38
A Proton Exchange Membrane & Solid Oxide Fuel Cell comparison Possible fuel cells and fuel costs
Bachelor thesis in Mechanics and Maritime Sciences
KRISTOFER SJÖLIN
EMIL HOLMGREN
Department of Mechanics and Maritime Sciences
CHALMERS UNIVERSITY OF TECHNOLOGY
Gothenburg, Sweden 2019
IV
A Proton Exchange Membrane & Solid Oxide Fuel Cell comparison
Possible fuel cells and fuel costs
© Kristofer Sjölin 2019
© Emil Holmgren 2019
Bachelor Thesis 2019:38
Department of Mechanics and Maritime Sciences
Chalmers University of Technology
SE-412 96 Gothenburg
Sweden
Telephone: + 46 (0)31-772 1000
Printing /Department of Mechanics and Maritime Sciences
Gothenburg, Sweden 2019
I
Abstract
With increasing pollution to air from the shipping industry and future stricter regulation
concerning marine fuels, new ways are required to power ships. Fuel cells could be a solution
to decrease emissions that ships contribute with. They have higher efficiency and can be run on
cleaner fuels. In this study, two fuel cell techniques are compared: PEMFC (proton exchange
membrane fuel cell) and SOFC (solid oxide fuel cell). The technical performance and cost of
the fuel cells were assessed based on a literature review combined with data from consultations
with industry representatives. Within the field there is plenty of literature, articles and reports.
Fuel cost calculations are also included in the study where present and possible future fuels are
included. In the study one can see that both PEMFC and SOFC have higher efficiency than
combustion engines. If hydrogen is used as fuel the only emission is water. Both techniques
have comparable electrical efficiency. PEMFC is compact and handles generally load variations
better. SOFC is not as compact and works at higher temperatures than PEMFC. The SOFC can
be combined with a gas turbine increasing its efficiency. If waste heat recovery is used its
efficiency is further increased. PEMFC has a lower capex compared to SOFC but SOFC can
utilize natural gas which is cheaper than hydrogen. PEMFC has the highest power to volume
ratio, however it runs on hydrogen which has low volumetric density compared to tradition
marine fuels. With this, new challenges will arise at same time as fuel cells will offer a
sustainable choice.
Keywords
hydrogen, fuel cell, PEM, PEMFC, SOFC, LNG, shipping, fuel cell fuel cost
II
Sammanfattning
Med ökande utsläpp till luft från sjöfarten och framtida strängare regelverk gällande
fartygsbränslen, krävs nya sätt att driva fartyg. Bränsleceller skulle kunna vara en lösning för
att minska utsläpp som fartyg bidrar med. De har högre verkningsgrad och kan drivas med
renare bränslen. I denna studie jämförs två bränslecellstekniker PEMFC (proton exchange
membrane fuel cell) och SOFC (solid oxide fuel cell). Studien är framförallt en litteraturöversikt
kombinerad med konsultationer med representanter från branschen. Inom ämnet finns gott om
litteratur, artiklar och rapporter. Bränslekostnadsberäkningar ingår även i studien för befintliga
och potentiella bränslen inom sjöfarten. I studien kan man se att både PEMFC och SOFC har
högre verkningsgrad gentemot dagens förbränningsmotorer. Om vätgas används är det enda
utsläppet vatten. Båda teknikerna har snarlik elektrisk verkningsgrad. PEMFC är kompakt och
hanterar generellt lastförändingar bättre. SOFC arbetar vid högre temperaturer än PEMFC.
SOFC kan kombineras med gasturbin för att ytterliggare öka sin verkningsgrad. Använder man
värmåtervinning kan verkningsgraden förbättras ytterligare. PEMFC har ett lägre inköpspris
jämfört med SOFC, dock kan SOFC drivas med naturgas vilket är billigare än vätgas. PEMFC
har högst energidensitet sett till storlek, dock drivs den av vätgas som har låg volumetrisk
densitet gentemot traditionella sjöfartsbränslen. Med detta kommer nya utmaningar samtidigt
som bränsleceller kommer att erbjuda ett hållbart allternativ.
Nyckelord
vätgas, bränsleceller, PEM, PEMFC, SOFC, LNG, sjöfart, bränslecellsbränsle kostnad

III
Foreword
The authors want to thank their families for their endurance and support. We would also like to
thank Selma Brynolf who has been our mentor throughout the process. A special thanks is also
given to Jan Froitzheim at Chalmers and Johan Burgren at Powercell for taking time to answer
our questions.
IV
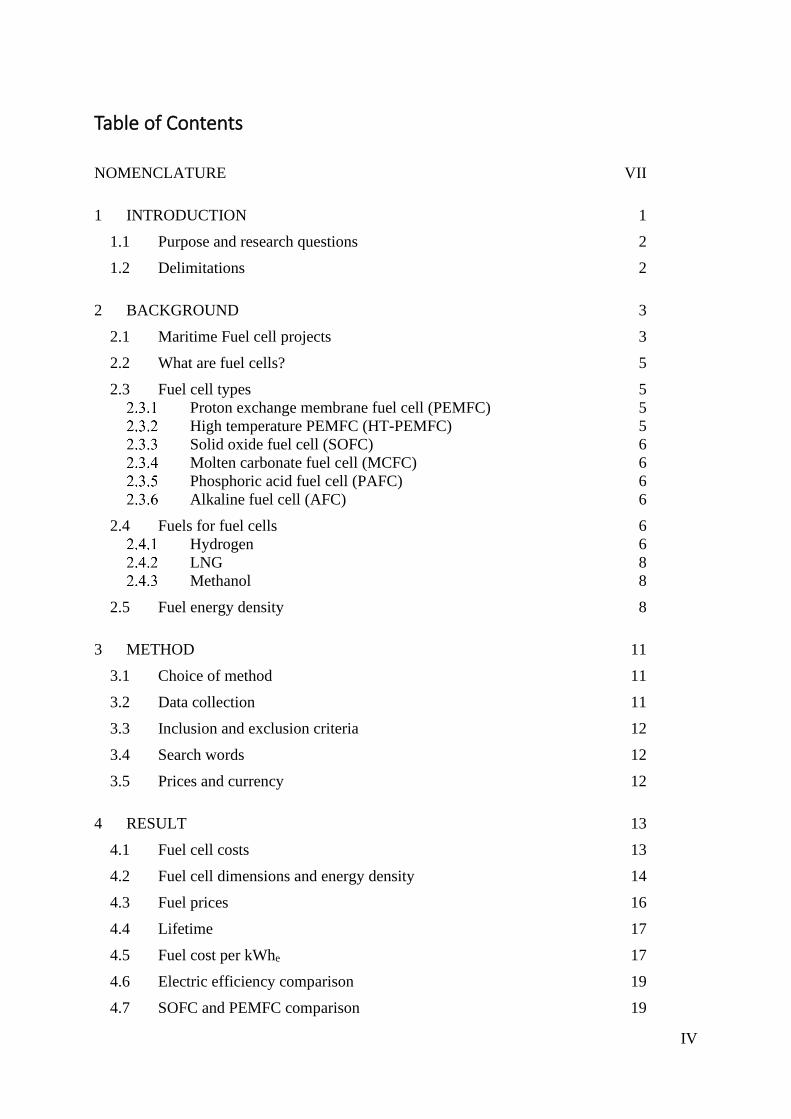
Table of Contents
NOMENCLATURE VII
1 INTRODUCTION 1
1.1 Purpose and research questions 2
1.2 Delimitations 2
2 BACKGROUND 3
2.1 Maritime Fuel cell projects 3
2.2 What are fuel cells? 5
2.3 Fuel cell types 5 Proton exchange membrane fuel cell (PEMFC) 5 High temperature PEMFC (HT-PEMFC) 5
Solid oxide fuel cell (SOFC) 6 Molten carbonate fuel cell (MCFC) 6
Phosphoric acid fuel cell (PAFC) 6
Alkaline fuel cell (AFC) 6
2.4 Fuels for fuel cells 6 Hydrogen 6
LNG 8 Methanol 8
2.5 Fuel energy density 8
3 METHOD 11
3.1 Choice of method 11
3.2 Data collection 11
3.3 Inclusion and exclusion criteria 12
3.4 Search words 12
3.5 Prices and currency 12
4 RESULT 13
4.1 Fuel cell costs 13
4.2 Fuel cell dimensions and energy density 14
4.3 Fuel prices 16
4.4 Lifetime 17
4.5 Fuel cost per kWhe 17
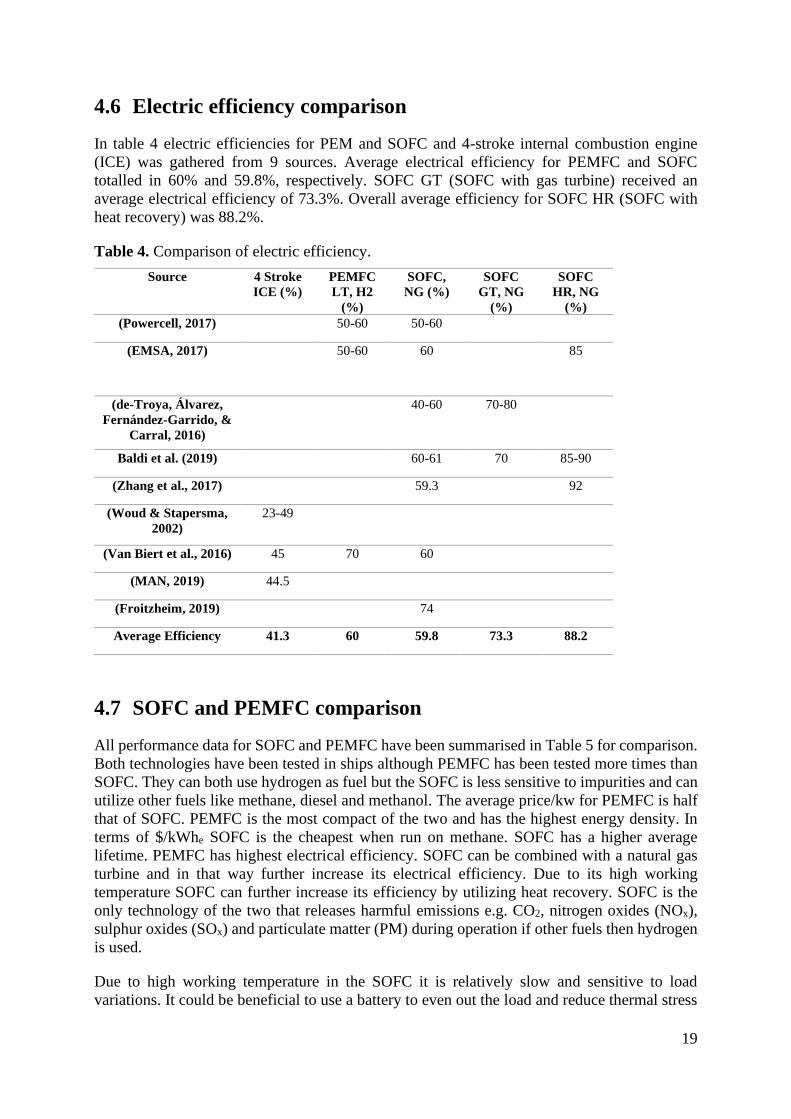
4.6 Electric efficiency comparison 19
4.7 SOFC and PEMFC comparison 19
V
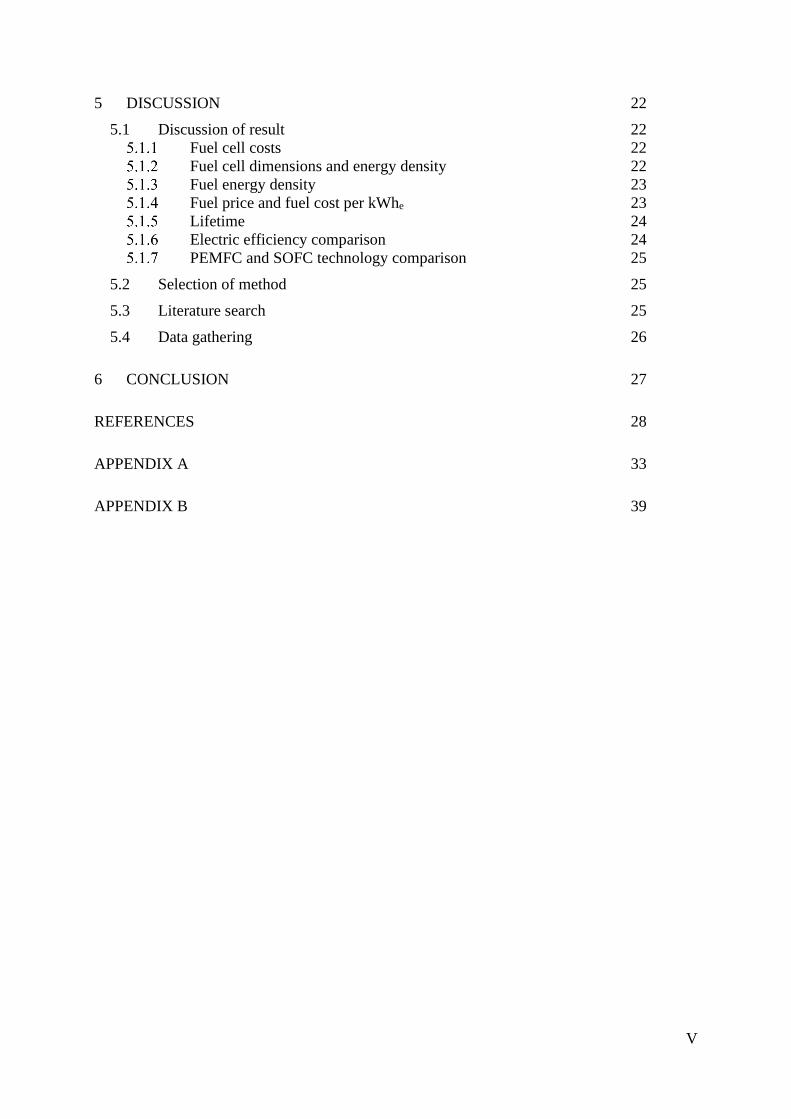
5 DISCUSSION 22
5.1 Discussion of result 22 Fuel cell costs 22
Fuel cell dimensions and energy density 22 Fuel energy density 23 Fuel price and fuel cost per kWhe 23 Lifetime 24 Electric efficiency comparison 24
PEMFC and SOFC technology comparison 25
5.2 Selection of method 25
5.3 Literature search 25
5.4 Data gathering 26
6 CONCLUSION 27
REFERENCES 28
APPENDIX A 33
APPENDIX B 39
VI
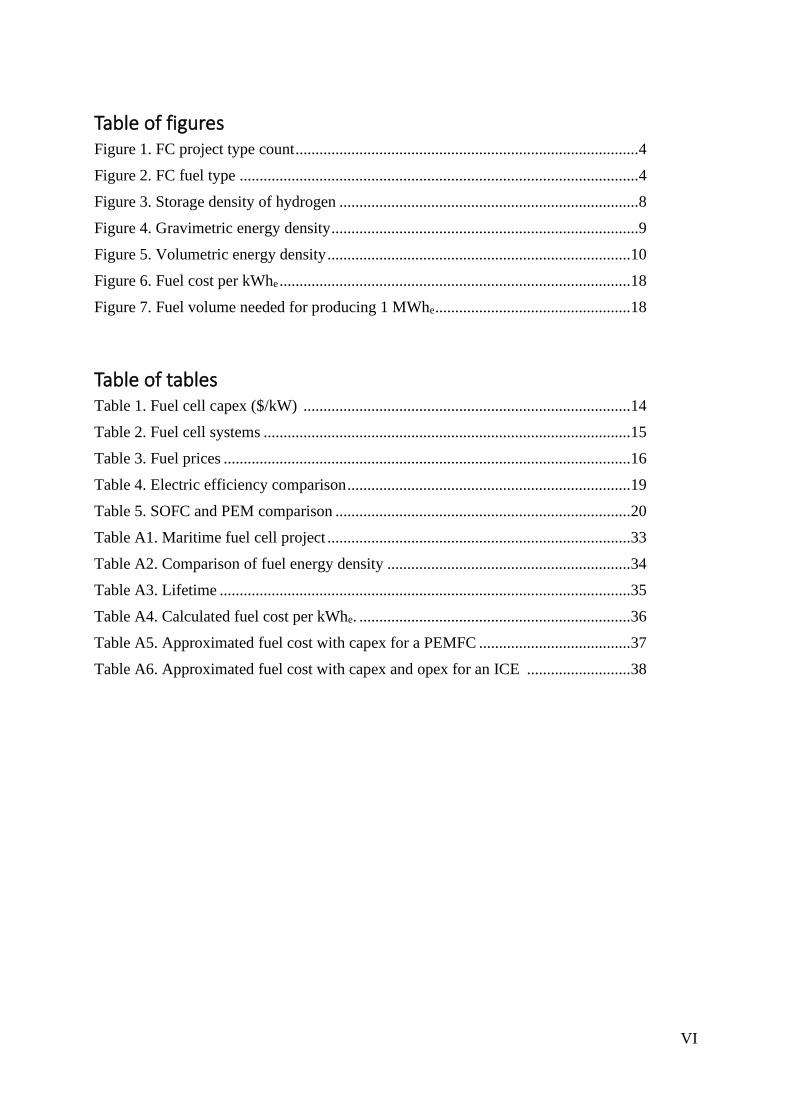
Table of figures Figure 1. FC project type count ...................................................................................... 4
Figure 2. FC fuel type .................................................................................................... 4
Figure 3. Storage density of hydrogen ........................................................................... 8
Figure 4. Gravimetric energy density ............................................................................. 9
Figure 5. Volumetric energy density ............................................................................ 10
Figure 6. Fuel cost per kWhe ........................................................................................ 18
Figure 7. Fuel volume needed for producing 1 MWhe ................................................. 18
Table of tables Table 1. Fuel cell capex ($/kW) .................................................................................. 14
Table 2. Fuel cell systems ............................................................................................ 15
Table 3. Fuel prices ...................................................................................................... 16
Table 4. Electric efficiency comparison ....................................................................... 19
Table 5. SOFC and PEM comparison .......................................................................... 20
Table A1. Maritime fuel cell project ............................................................................ 33
Table A2. Comparison of fuel energy density ............................................................. 34
Table A3. Lifetime ....................................................................................................... 35
Table A4. Calculated fuel cost per kWhe. .................................................................... 36
Table A5. Approximated fuel cost with capex for a PEMFC ...................................... 37
Table A6. Approximated fuel cost with capex and opex for an ICE .......................... 38
VII
Nomenclature
$/kW Price in dollars per kW of the system
AFC Alkaline Fuel Cell
APU Auxiliary Power Unit
CGH2 Compressed Hydrogen Gas
CH3OH Methanol
CO Carbon monoxide
CO2 Carbon dioxide
DMFC Direct Methanol Fuel Cell
DNV-GL Det Norske Veritas and Germanischer Lloyd
DOE US Department Of Energy
FC Fuel Cell
GHG Greenhouse Gases
H2 Hydrogen
HFO Heavy Fuel Oil
HT- PEMFC High Temperature Proton Membrane Exchange Fuel Cell
ICE Internal Combustion Engine
IEA International Energy Agency
IGF-Code International Code of safety for gas fuelled ships
IMO International Maritime Organization
kWh Kilo watt hour
kWhe Electric kilo watt hour
LH2 Liquid hydrogen (-253OC)
LNG Liquified Natural Gas
LOHC Liquid Organic Hydrogen Carrier
LT-PEMFC Low Temperature Proton Membrane Exchange Fuel Cell
MCFC Molten carbonate fuel cell
MEPC Marine Environment Protection Committee
MFO Marine Fuel Oil
MGO Marine gas oil
MOU Memorandum of Understanding
mt Metric tonne
NECA Nitrogen Emission Control Areas
NG Natural Gas
VIII
NOx Nitrogen Oxides
ODS Ozone depleting substances
O2 Oxygen
PAFC Phosphoric acid fuel cell
PEMFC Proton Exchange Membrane Fuel cell
PM Particulate matter
SECA Sulphur Emission Control Areas
SOFC Solid Oxide Fuel Cell
SOFC GT Solid Oxide Fuel Cell with Gas Turbine
SOFC HR Solid Oxide Fuel Cell with heat recovery
SOx Sulphur Oxides
VOC Volatile organic compounds
1
1 Introduction
During the past decades air pollution has been a widely discussed subject, not at least in the
shipping industry. As stricter air emission regulation comes into force the demand for cleaner
fuels will increase. This puts shipowners and operators in a position where they need to start
considering the use of abatement technologies or other fuels than those of today. Fuel cells is a
technology that can provide an efficient and clean energy conversion compared to traditional
marine engines.
In 2012 the shipping industry contributed with about 3% of global carbon dioxide (CO2)
emissions (Andersson, Brynolf, Lindgren, & Wilewska-Bien, 2016). According to IMO
(International Maritime organization), CO2 emissions are expected to increase between 50-
250% by 2050 depending on how the world market develops (IMO, 2014). On the 13th of April
2018 during the 72nd Marine Environment Protection Committee (MEPC 72) it was decided
that greenhouse gases (GHG) must be decreased by at least 50% by 2050 compared to 2008
(IMO, 2019).
Out of a historical perspective one can say that interest in fuel cells is increasing. In the maritime
sector during the 80 and 90’s, fuel cells powered only a handful smaller submarines and naval
vessels (Barbir, 2005) (Van Biert, Godjevac, Visser, & Aravind, 2016). This has come to
change where testing of fuel cells onboard ship has been on the increase during the past 20
years (EMSA, 2017). In the search of more sustainable shipping new developments can for
example be seen in the Swedish maritime sector. By 2020 at least 13 new buildings are expected
to be able to utilize liquified natural gas as fuel (Energigas, 2019). Between Helsingborg and
Helsingör battery propelled ferries already provide fossil free transportation (Forsea, 2019). In
2019 the Norwegian parliament adopted a resolution that will make the Norwegian world
heritage fjords emission free by 2026 (Sjofartsdirektoratet, 2019). Furthermore, several cruise
ship operators have acknowledged their interest in fuel cell technology (Langfeldt, 2018). In
2018 the electronic maker ABB and Ballard Power Systems announced that they are
collaborating in the development of the next generation of fuel cells to be used onboard a ship.
The fuel cell system onboard will have the capacity of 3MW (Margaronis, 2018). These are
only a few examples of present and future developments in the shipping industry.
In the latest report from European Maritime Safety Agency on fuel cell technology in the
shipping industry, it can be seen that the shipping industry has been evaluating alternatives to
today’s burning of fossil fuels (EMSA, 2017). Fuel cells have on several occasions been tested
during the past 20 years in the maritime sector and could provide the shipping industry with an
alternative means of power production. They are efficient in their energy conversion and quiet.
If pure hydrogen is used as fuel the only emission would be water.
2
1.1 Purpose and research questions
This report aims to review Proton Exchange Membrane Fuel Cell (PEMFC) and Solid Oxide
Fuel Cell (SOFC) technology and evaluate their maritime feasibility.
The following research questions are asked:
• What is the difference in power density, system size, lifetime, efficiency and capex for
PEMFC and SOFC in marine applications?
• What types of fuels can be used and what are their difference in cost?
1.2 Delimitations
The study will be limited to two fuel cell technologies that could be used in shipping, proton
exchange membrane fuel cells and solid oxide fuel cells. Both technologies have been tested in
the maritime environment.
Although regulatory requirements are an important aspect of the subject, they will not be
handled in this thesis.
3
2 Background
The first fuel cell was invented in 1839 by William Groove. Further developments of fuel cells
were not made until 1939. By the end of the 1950s a 6 kW fuel cell had been developed. Fuel
cells didn’t find any practical use until the U.S Space Program. The first fuel cell that was used
was of the type PEMFC, this was used throughout the Gemini space program (Barbir, 2005).
During the Apollo program an Alkaline fuel cell (AFC) of 1.5 kW was used, it provided space
shuttles with electricity and drinking water (Fuel Cell Today, 2019). Between the 60’s and 90’s
fuel cells had been successfully used in U.S space program. In 1989 a fuel cell powered
submarine was demonstrated by the company Perry Energy Systems. In 1993 many new fuel
cell powered vehicles were developed. Ballard power systems developed a fuel cell power bus.
The company Energy Partners developed the first fuel cell powered passenger car (Barbir,
2005). During the 2000’s fuel cells have been used in buses in both Europe, China and Australia.
In 2007 fuel cells began to be available on the commercial market as auxiliary power units
(APU) both in civilian and military application. The types seen in these applications were
mainly PEMFC and DMFC (direct methanol fuel cell). In 2009 PEMFC started to become more
readily available on the Japanese market for residential use (Fuel Cell Today, 2019). In 2018 it
was announced that the installation of Daesan Green Energy Fuel cell powerplant has
commenced, a hydrogen fuelled fuel cell power plant of 50MW (Bulletin, 2018). The power
plant is aimed to be finished in 2020. A summary of fuel cell projects in the shipping industry
can be read in chapter 2.1.
2.1 Maritime Fuel cell projects
In the past 20 years there has been an increase in the number of maritime fuel cell projects.
Between the year 2000 and until early 2017 there were 27 studies of fuel cells onboard ships
(EMSA, 2017). Among these projects various fuel cell types have been studied and some of the
projects are still ongoing. The projects range from 12 kW to 2.5 MW and incorporate MCFC
(molten carbonate fuel cell), SOFC, PEMFC, HT-PEM (high temperature PEM) (EMSA,
2017). Another project called Maranda started in late 2017 which is evaluating PEMFC, with a
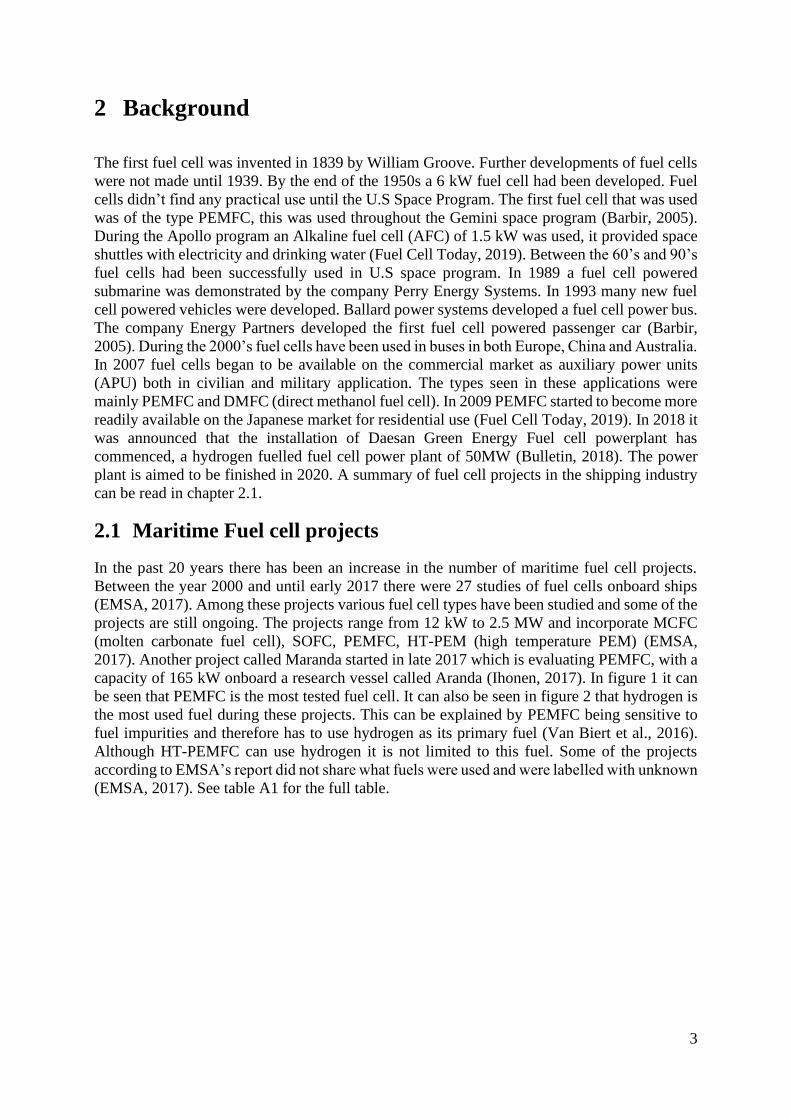
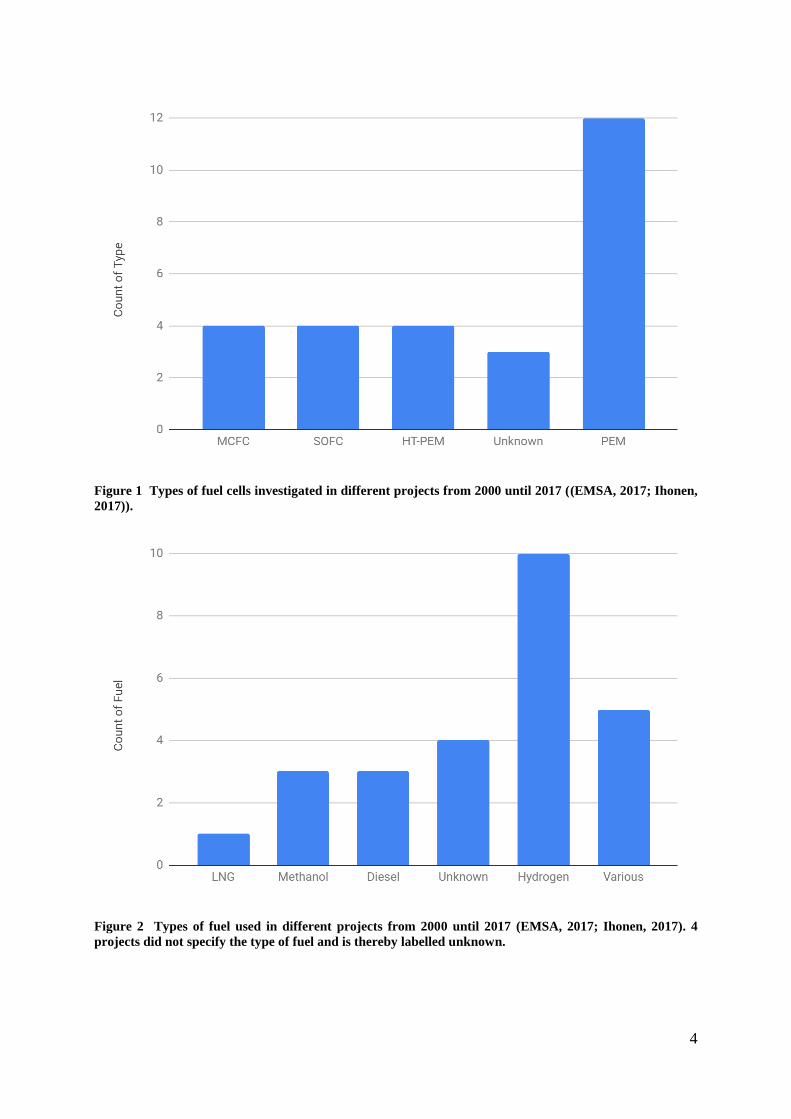
capacity of 165 kW onboard a research vessel called Aranda (Ihonen, 2017). In figure 1 it can
be seen that PEMFC is the most tested fuel cell. It can also be seen in figure 2 that hydrogen is
the most used fuel during these projects. This can be explained by PEMFC being sensitive to
fuel impurities and therefore has to use hydrogen as its primary fuel (Van Biert et al., 2016).
Although HT-PEMFC can use hydrogen it is not limited to this fuel. Some of the projects
according to EMSA’s report did not share what fuels were used and were labelled with unknown
(EMSA, 2017). See table A1 for the full table.
4
Figure 1 Types of fuel cells investigated in different projects from 2000 until 2017 ((EMSA, 2017; Ihonen,
2017)).
Figure 2 Types of fuel used in different projects from 2000 until 2017 (EMSA, 2017; Ihonen, 2017). 4
projects did not specify the type of fuel and is thereby labelled unknown.
5
2.2 What are fuel cells?
Fuel cells convert chemical energy in a fuel directly to direct current electricity (Barbir, 2005).
Fuel Cells in general are composed of three parts: An anode, a cathode and an electrolyte
(Kreuer, 2013). The Anode and the cathode are physically separated by a membrane. The anode
and cathode are electrically connected. Depending on the type of the fuel cell the chemical
reaction happens differently.
In PEMFC hydrogen is used as fuel. When hydrogen enters the fuel cell, hydrogen ions travel
through the membrane and react with oxygen on the cathode side. SOFC are different in this
aspect. Here the oxygen ions pass the membrane and reacts with the fuel on the anode side
(EMSA, 2017). Comparing this to a traditional combustion engine, a combustion engine
involves several more steps before the energy converted can be used. The traditional way to
produce electricity onboard is by the use of an auxiliary engine or genset, were a diesel engine
drives a generator. In this way the energy is converted 3 times. From chemical energy to heat,
heat to mechanical, mechanical energy to electricity. Whereas in a fuel cell, the energy
conversion is only one step, from chemical energy directly to electric energy (Barbir, 2005).
2.3 Fuel cell types
There are many types of fuel cells. In this report PEMFC and SOFC have a central part. AFC,
PAFC (phosphoric acid fuel cell) and MCFC are mentioned for the understanding of the result
and the history of fuel cells.
Proton exchange membrane fuel cell (PEMFC)
PEMFC can also be called Low Temperature Proton Exchange Membrane (LT-PEMFC).
Throughout this thesis PEMFC is used as LT-PEMFC. The PEMFC has a high power to
weight/volume ratio compared to other fuel cell types. The PEMFC uses pure hydrogen as fuel
and it is sensitive to impurities like carbon monoxide (EMSA, 2017). If a reformer is used the
PEMFC can use other fuels such as methanol, methane (Powercell, 2017). Start-up times are
considered as fast and the electrochemical process produces low amounts of heat compared to
SOFC, MCFC. The material used as a catalyst in the PEMFC is mainly platinum which is a
quite rare and an expensive metal. As an electrolyte it uses a humid polymer membrane that
allows protons to move through the membrane. PEMFC operates at temperatures between 50-
100°C and the efficiency is between 50-60% (EMSA, 2017). PEMFC has its highest efficiency
at lower loads which peaks at around 30% load (Burgren, 2019). When load is increased
efficiency drops.
High temperature PEMFC (HT-PEMFC)
HT-PEMFC differs from the PEMFC mainly from the operating temperature. HT-PEMFC
operates at 200°C and this is possible due to the electrolyte not being water based, instead the
electrolyte is a mineral based acid. HT-PEMFC is considered to be slightly less sensitive against
impurities in the fuel compared to the PEMFC. Another trait of the HT-PEMFC is that it can
use several other fuels including hydrogen. The others are LNG, Diesel and Methanol. The
efficiency of both PEM and HT-PEMFC is similar but due to the higher operating temperature
of HT-PEMFC there is a greater potential of utilizing excess heat. By utilizing excess heat, a
higher total efficiency of the system can be reached (EMSA, 2017).
6
Solid oxide fuel cell (SOFC)
The solid oxide fuel cell has an electrical efficiency of 60% and operates at a temperature of
between 500-1000°C. If the SOFC system is equipped with waste heat recovery the overall
efficiency can be increased to 85% (EMSA, 2017). Equipping the SOFC system with a gas
turbine could increase the electrical efficiency up to 70% (J Markowski, 2019). SOFC can use
several different fuels as it is not sensitive to impurities. It can use hydrogen, methane, methanol
and diesel as fuel. A drawback of SOFC is long start up times (US Department of Energy,
2019). The electrolyte is composed of a solid ceramic material. It is not uncommon that yttrium
stabilized zirconia is used (EMSA, 2017). The solid oxide fuel cell has longer expected lifetime
than the PEM fuel cell.
Molten carbonate fuel cell (MCFC)
The working temperature of this fuel cell is between 600 and 700°C. The efficiency is about
50% but with heat recovery up to 85%. It can utilize many different fuels, such as hydrogen,
methane, diesel and methanol. The electrolyte is a molten carbonate salt. A distinguishable
difference to other fuel cells is that it needs both CO2 and Oxygen (O2) on the cathode side
(EMSA, 2017). In comparison to other fuel cell types the most common element on the cathode
side is O2.
Phosphoric acid fuel cell (PAFC)
Phosphoric acid fuel cells use acid as electrolyte. They have an efficiency of 40% and if heat
recovery is utilized overall efficiency can be increased. It has a high operating temperature,
about 200°C, and can use different fuels such as methane or methanol (EMSA, 2017).
According to EMSA, it is a well-tested fuel cell (EMSA, 2017). (Vogler & Sattler, 2016) states
that it “is the most mature fuel cell technology”.
Alkaline fuel cell (AFC)
It uses pure oxygen and hydrogen as fuel. It is sensitive to impurities on both the anode and the
cathode side. The most common electrolyte is potassium hydroxide solution. The efficiency is
around 50-60% (EMSA, 2017).
2.4 Fuels for fuel cells
In this chapter, fuels will be described that are important for fuel cells. The different fuels that
are used in the calculations can be found in table A2 and A4, figure 6 and figure 7.
Hydrogen
Hydrogen can be stored as a pressurized gas or liquid. Other possible ways of storing hydrogen
is chemically and physically. This means that hydrogen is stored with other materials. These
materials are known as: Liquid Organic Hydrogen Carrier (LOHC) (Schneider, 2015), metal
hydrides, glass microspheres, chemical hydrides and cryo absorbers (Barbir, 2005). Hydrogen
is highly flammable and will ignite between 4-75 vol% of hydrogen in air (Deniz & Zincir,
2016).
7
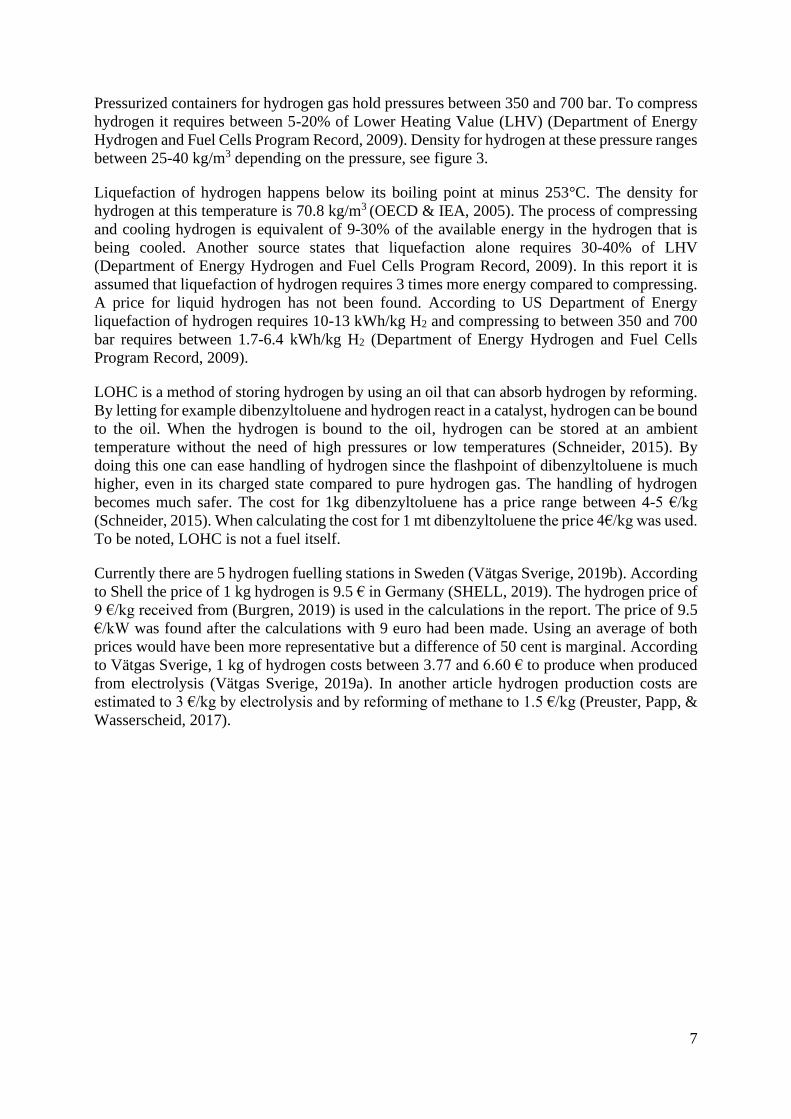
Pressurized containers for hydrogen gas hold pressures between 350 and 700 bar. To compress
hydrogen it requires between 5-20% of Lower Heating Value (LHV) (Department of Energy
Hydrogen and Fuel Cells Program Record, 2009). Density for hydrogen at these pressure ranges
between 25-40 kg/m3 depending on the pressure, see figure 3.
Liquefaction of hydrogen happens below its boiling point at minus 253°C. The density for
hydrogen at this temperature is 70.8 kg/m3 (OECD & IEA, 2005). The process of compressing
and cooling hydrogen is equivalent of 9-30% of the available energy in the hydrogen that is
being cooled. Another source states that liquefaction alone requires 30-40% of LHV
(Department of Energy Hydrogen and Fuel Cells Program Record, 2009). In this report it is
assumed that liquefaction of hydrogen requires 3 times more energy compared to compressing.
A price for liquid hydrogen has not been found. According to US Department of Energy
liquefaction of hydrogen requires 10-13 kWh/kg H2 and compressing to between 350 and 700
bar requires between 1.7-6.4 kWh/kg H2 (Department of Energy Hydrogen and Fuel Cells
Program Record, 2009).
LOHC is a method of storing hydrogen by using an oil that can absorb hydrogen by reforming.
By letting for example dibenzyltoluene and hydrogen react in a catalyst, hydrogen can be bound
to the oil. When the hydrogen is bound to the oil, hydrogen can be stored at an ambient
temperature without the need of high pressures or low temperatures (Schneider, 2015). By
doing this one can ease handling of hydrogen since the flashpoint of dibenzyltoluene is much
higher, even in its charged state compared to pure hydrogen gas. The handling of hydrogen
becomes much safer. The cost for 1kg dibenzyltoluene has a price range between 4-5 €/kg
(Schneider, 2015). When calculating the cost for 1 mt dibenzyltoluene the price 4€/kg was used.
To be noted, LOHC is not a fuel itself.
Currently there are 5 hydrogen fuelling stations in Sweden (Vätgas Sverige, 2019b). According
to Shell the price of 1 kg hydrogen is 9.5 € in Germany (SHELL, 2019). The hydrogen price of
9 €/kg received from (Burgren, 2019) is used in the calculations in the report. The price of 9.5
€/kW was found after the calculations with 9 euro had been made. Using an average of both
prices would have been more representative but a difference of 50 cent is marginal. According
to Vätgas Sverige, 1 kg of hydrogen costs between 3.77 and 6.60 € to produce when produced
from electrolysis (Vätgas Sverige, 2019a). In another article hydrogen production costs are
estimated to 3 €/kg by electrolysis and by reforming of methane to 1.5 €/kg (Preuster, Papp, &
Wasserscheid, 2017).
8
Figure 3 Storage density of hydrogen under certain pressure and temperature conditions (ILK Dresden,
2015). CC BY-SA 4.0
LNG
Liquid natural gas is stored cold at -162°C at its atmospheric boiling point. Typical tank
construction materials are nickel alloyed steels, stainless steels or aluminium. Cryogenic tanks
require insulation to reduce boil-off. This is important in order to protect both the tank and the
structure surrounding it. Typical insulation materials onboard gas carriers are: Balsa Wood,
Mineral Wool, Perlite, Polystyrene and Polyurethane (White, 2000). Natural gas consists of
about 90% methane (Nationalencyklopedin, 2019). The chemical formula for methane is CH4
(Svein Erik Pedersen, 2015).
The price for LNG on 15.02.2018 was 6.55 $/mmBtu (DNVGL, 2019).
Methanol
Methanol is an alcohol and a low flashpoint fuel. These require advanced system concerning
ventilation, alarms and fire protection (EMSA, 2017). The Chemical formula is CH3OH.
Methanol boils at 64.6°C and has a density 793 kg/m3 at 20°C (Svein Erik Pedersen, 2015).
The price for methanol is ~400 $/mt (Methanex, 2019).
2.5 Fuel energy density
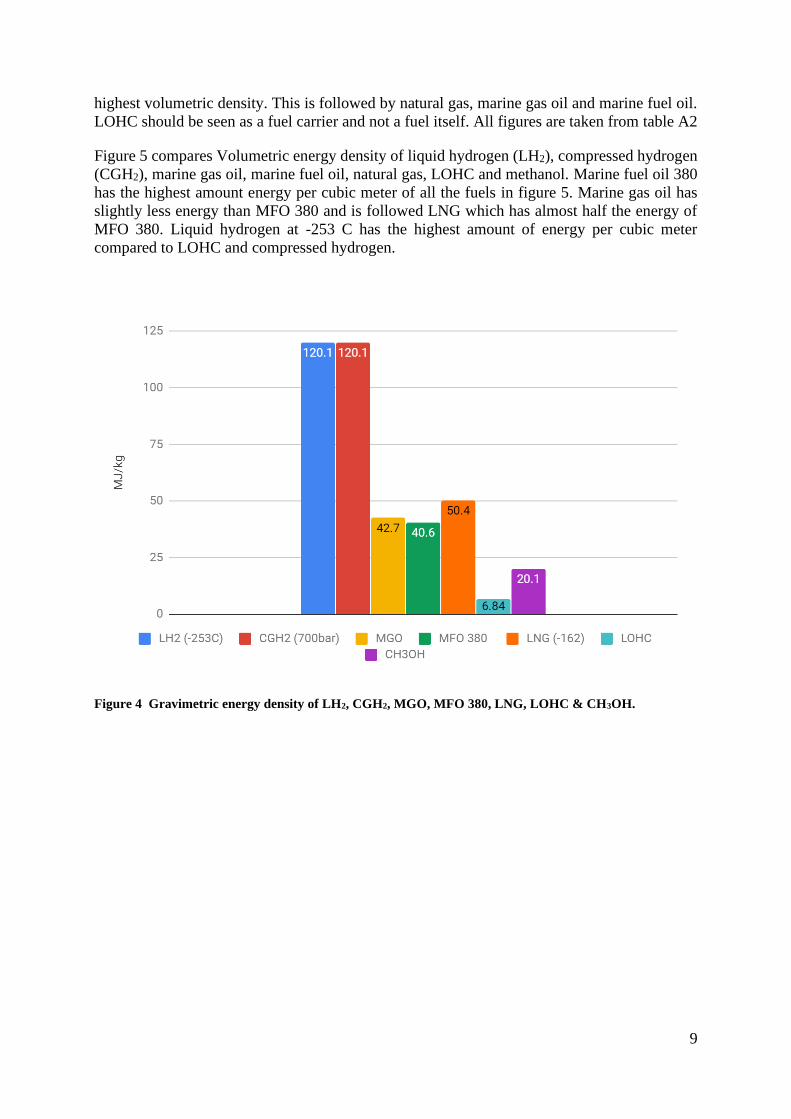
Figure 4 shows gravimetric density of hydrogen, marine fuel oil, marine gas oil, natural gas, a
liquid organic hydrogen carrier and methanol. Of all the fuels in figure 4 hydrogen has the
9
highest volumetric density. This is followed by natural gas, marine gas oil and marine fuel oil.
LOHC should be seen as a fuel carrier and not a fuel itself. All figures are taken from table A2
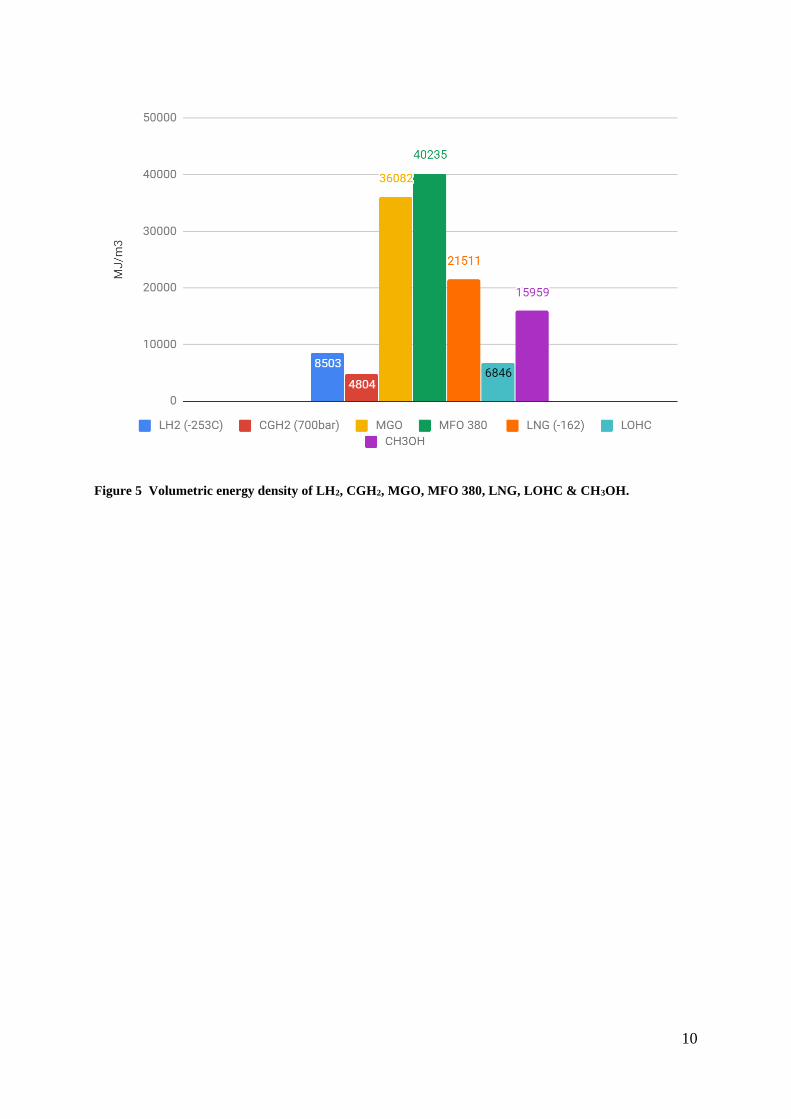
Figure 5 compares Volumetric energy density of liquid hydrogen (LH2), compressed hydrogen
(CGH2), marine gas oil, marine fuel oil, natural gas, LOHC and methanol. Marine fuel oil 380
has the highest amount energy per cubic meter of all the fuels in figure 5. Marine gas oil has
slightly less energy than MFO 380 and is followed LNG which has almost half the energy of
MFO 380. Liquid hydrogen at -253 C has the highest amount of energy per cubic meter
compared to LOHC and compressed hydrogen.
Figure 4 Gravimetric energy density of LH2, CGH2, MGO, MFO 380, LNG, LOHC & CH3OH.
10
Figure 5 Volumetric energy density of LH2, CGH2, MGO, MFO 380, LNG, LOHC & CH3OH.
11
3 Method
3.1 Choice of method
To assess and compare PEMFC and SOFC for marine applications we conducted a literature
review which was complemented with interviews from industry representatives. From the
literature review we identified the following important performance areas: cost, dimensions,
energy density, lifetime, fuels that can be used, efficiency load variations and emissions. Mixing
methods seemed to be the most viable approach for this study. Both proton exchange membrane
and solid oxide fuel cells are still quite young technologies.
This thesis is divided into two parts, a literature review and a calculation. The literature review
comprises of several parts: fuel cell cost; fuel cell dimensions; fuel prices; lifetime; electric
efficiency. Some data included in the literature review origins from two consultations that were
made during the study. The calculations use data from the literature review.
The purpose of a literature review is to give an overview of the current knowledge within a
subject. This is done through systematic and objective review of current research within a field.
Gathering of literature is done through specific methods and search words. The findings are
then presented in an overview and a subjective conclusion is drawn from the data gathered
(Denscombe, 2016).
In order to gather information and to build a better understanding for the subject we consulted
two representatives working with fuel cells. A set of questions were prepared for both
consultations and field notes were taken during the meetings. The first representative was Jan
Froitzheim, Associate Professor in Chemistry and Chemical Engineering, Environmental
Inorganic Chemistry, at Chalmers. The second representative was Johan Burgren, Business
Manager at Powercell, a Gothenburg based fuel cell company. Information gathered during
these consultations are personal communication.
3.2 Data collection
Data was gathered both through scientific articles, published reports and manufacturer’s data
sheets. Scientific articles included in the review were acquired through Chalmers library search
function. Manufacturer’s data sheets were acquired through the manufacturer’s website where
they were openly available. Performance data on the Nuvera fuel cell was found through a news
article. Reports were gathered through the web while scientific articles were found using
databases. The databases used were the following: Science direct, Complementary Index, Gale
Academic OneFile, Chalmers Library Catalogue, Chalmers Library E-book Collection,
Scopus®, Science Citation Index, Directory of Open Access Journals & Academic Search
Index.
Some data was also gathered through consulting a fuel cell company and an Associate Professor
in Chemistry and Chemical Engineering, Environmental Inorganic Chemistry, at Chalmers. In
the literature review fuel cell costs, dimensions, energy density, lifetime, efficiency are
compared for proton exchange membrane and solid oxide fuel cells. Furthermore, produced
kilowatt hours electric is calculated for fuel cells and combustion engines using performance
data from the literature review.
12
The consultations were made through two meetings in total. Both meetings were prepared with
similar generic questions about fuel cells. Some questions had to be adapted depending on the
technology as they work differently. During the consultations both researchers were present.
One was made in person and the second was a telephone conference. Answers to the questions
were directly written down by the person holding the secretary role.
3.3 Inclusion and exclusion criteria
The criteria for scientific articles or reports was that they should not be older than 10 years.
They had to at least handle the topic Proton exchange membrane or Solid oxide fuel cell.
Selecting data sheets for the dimension and energy density comparison was initially done by
using fuel cells in the similar power range of a 100 kW. The selection was also limited to proton
exchange membrane and solid oxide fuel cells. This was later changed to include both
phosphoric acid and molten carbonate fuel cells. The power range was also increased.
3.4 Search words
English was the primary language during the searches while Swedish was used less frequently
for searches. These are the search words that were used throughout the information gathering:
shipping, marine, fuel cell, SOFC, solid oxide fuel cell, proton exchange membrane, LOHC,
PEMFC, storage, hydrogen, liquid, liquefaction, compressed, methanol, HFO, MGO, PAFC,
AFC, efficiency, density, cost, capex, Nasa, Apollo, Ballard, Powercell, Nedstack, Toshiba,
Doosan, Sure Source, Fuel Cell Bulletin, Hyrex, Nuvera, Symbio, Bloom Energy, Swiss
hydrogen, Fuel Cell Energy, Daesan, shipping and fuel cells.
3.5 Prices and currency
Fuel costs per produced kilowatt hour electric was also calculated but is not included in the
literature review as method. Although it should be noted that produced kilowatt hours electric
was calculated using efficiency data gathered for this report and up to date fuel prices.
If a price was gathered in euro and converted into US dollars, the conversion rate used was
1:1.116.
For cost comparisons an electricity price of 0.64 SEK/kWh, equal to 0.067 $/kWh between July
and December 2018 was used in the calculations (Centralbyrån, 2019). Prices for MGO (Marine
gas oil) and MFO 380 (Marine fuel oil), retrieved in April, of 740.15 $/mt and 491.97 $/mt
were used to compare the traditional combustion engine with the FC technology (Bunker Index,
2019).
13
4 Result
Different characteristics of PEMFC and SOFC affect their potential for use onboard ships. The
most important aspects will be described in this chapter. Fuel Cells sensitivity to load variations,
the cost of the fuel cells, the size of fuel cells, fuel price, lifetime, fuel cost per kWhe, electric
efficiency and a comparison of both technologies.
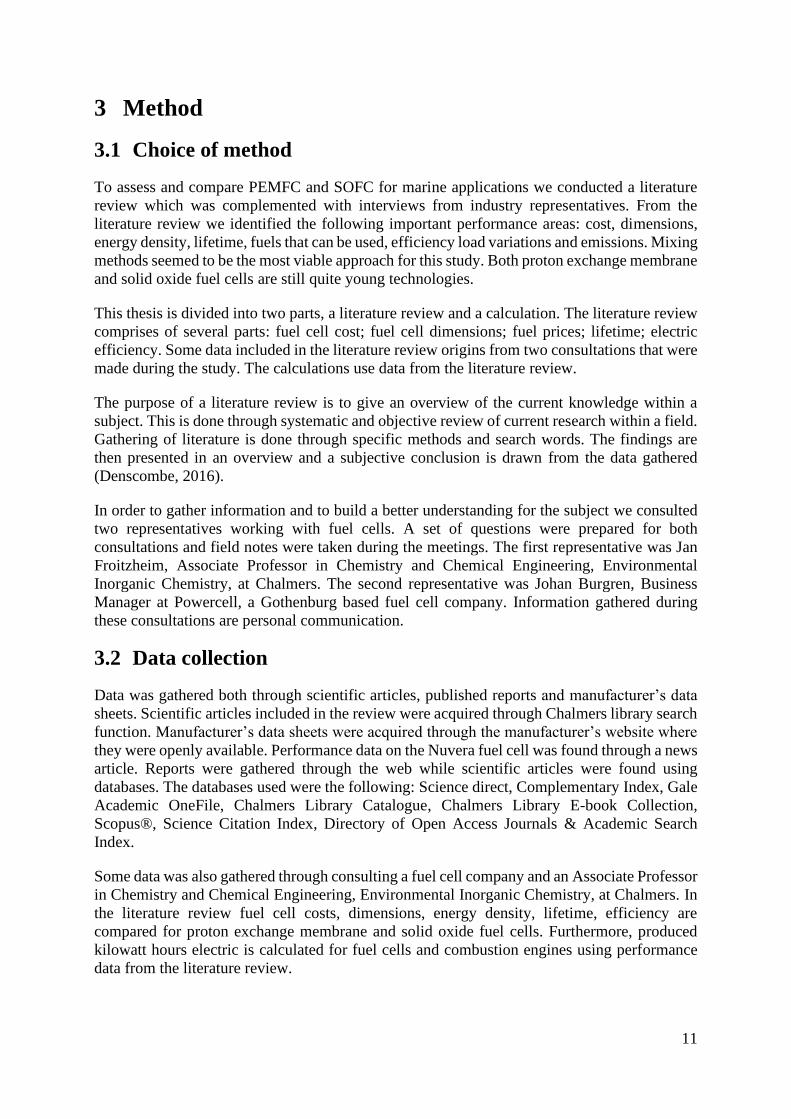
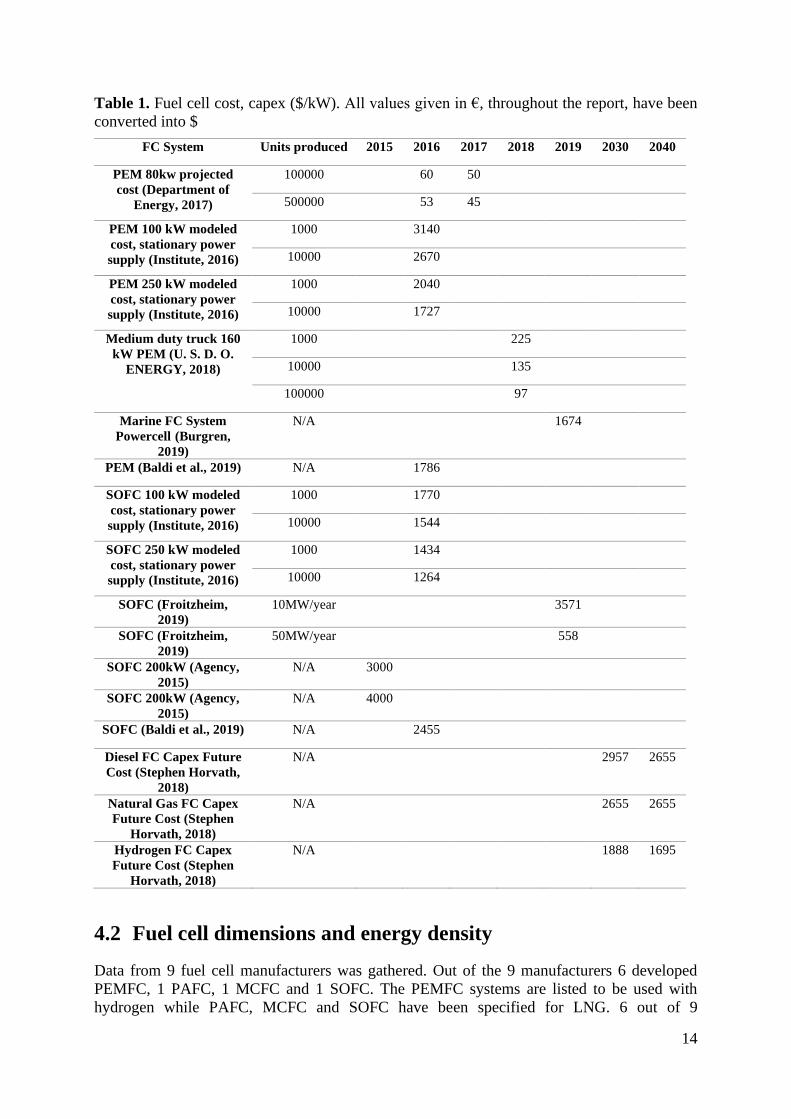
4.1 Fuel cell costs
Fuel cell cost prices are shown as $/kW in table 1. Prices shown are divided into amount of fuel
cells that are needed to be produced in order to reach that price. Where N/A is shown, price
could not be associated with future, present or past production numbers. The average capex
according to table 1, does not take any consideration of the number of produced units. Even if
there seems to be a correlation between production volumes and capex.
In 2017 the US Department of Energy released a report of projected costs for a 80 kW
PEMFC system for the automotive industry. Expected cost for 2017 depended on the amount
of fuel cells produced and ranged between 50 and 45 $/kW. When looking at Battelle’s report
of costs we see that the modelled cost for a 100 kW stationary PEM is between 2670 and
3140 $/kW for 1000-10000 units produced. For a 250 kW PEM stationary power supply the
cost decreased and landed on between 1727 and 2040 $/kW. SOFC modelled to cost range
between 1544 and 1770 $/kW. Looking at larger units of 250kW SOFC the price is reduced
to between 1264 and 1434 $/kW. In a more recent report from U.S Department of Energy
concerning PEM fuel cells in trucks cost projections range between 96.8 and 225 $/kW
depending on how many units that will be produced (US Department of Energy, 2018).
Through personal communication with the fuel cell company Powercell we received the
price information of a complete PEMFC could have a cost of 1500 €/kW or 1674 $/kW for
maritime application (Burgren, 2019). It was explained that 2/3 of the system cost was for
the fuel cell itself. Jan Froitzheim stated during our inquiry about SOFC that today’s capex
for SOFC is 3571 $/kW at 10MW of units shipped per year. If production volumes for SOFC
increased to 50 MW shipped yearly capex can come down to 558 $/kW (Froitzheim, 2019).
With capex as low as 558 $/kW for a fuel cell (FC) it is not far away from an internal
combustion engine (ICE) at 700 $/kW (Brynolf, 2014). When looking at future cost between
the years 2030 and 2040, maritime FC capex can range between 1695 and 2957.4 $/kW
(Stephen Horvath, 2018). Here capex depends on the type of fuel cell and fuel used but
doesn’t take production volumes into consideration. When looking at another report (Baldi,
Wang, Pérez-Fortes, & Maréchal, 2019) it can be seen that PEMFC projections for 2016
were at 1785 $/kW. The same article stated that SOFC for the same year would cost 2455.2
$/kW.
14
Table 1. Fuel cell cost, capex ($/kW). All values given in €, throughout the report, have been
converted into $
FC System Units produced 2015 2016 2017 2018 2019 2030 2040
PEM 80kw projected
cost (Department of
Energy, 2017)
100000 60 50
500000
53 45
PEM 100 kW modeled
cost, stationary power
supply (Institute, 2016)
1000 3140
10000
2670
PEM 250 kW modeled
cost, stationary power
supply (Institute, 2016)
1000 2040
10000
1727
Medium duty truck 160
kW PEM (U. S. D. O.
ENERGY, 2018)
1000 225
10000
135
100000
97
Marine FC System
Powercell (Burgren,
2019)
N/A
1674
PEM (Baldi et al., 2019) N/A
1786
SOFC 100 kW modeled
cost, stationary power
supply (Institute, 2016)
1000 1770
10000
1544
SOFC 250 kW modeled
cost, stationary power
supply (Institute, 2016)
1000 1434
10000
1264
SOFC (Froitzheim,
2019)
10MW/year 3571
SOFC (Froitzheim,
2019)
50MW/year 558
SOFC 200kW (Agency,
2015)
N/A 3000
SOFC 200kW (Agency,
2015)
N/A 4000
SOFC (Baldi et al., 2019) N/A
2455
Diesel FC Capex Future
Cost (Stephen Horvath,
2018)
N/A 2957 2655
Natural Gas FC Capex
Future Cost (Stephen
Horvath, 2018)
N/A
2655 2655
Hydrogen FC Capex
Future Cost (Stephen
Horvath, 2018)
N/A 1888 1695
4.2 Fuel cell dimensions and energy density
Data from 9 fuel cell manufacturers was gathered. Out of the 9 manufacturers 6 developed
PEMFC, 1 PAFC, 1 MCFC and 1 SOFC. The PEMFC systems are listed to be used with
hydrogen while PAFC, MCFC and SOFC have been specified for LNG. 6 out of 9
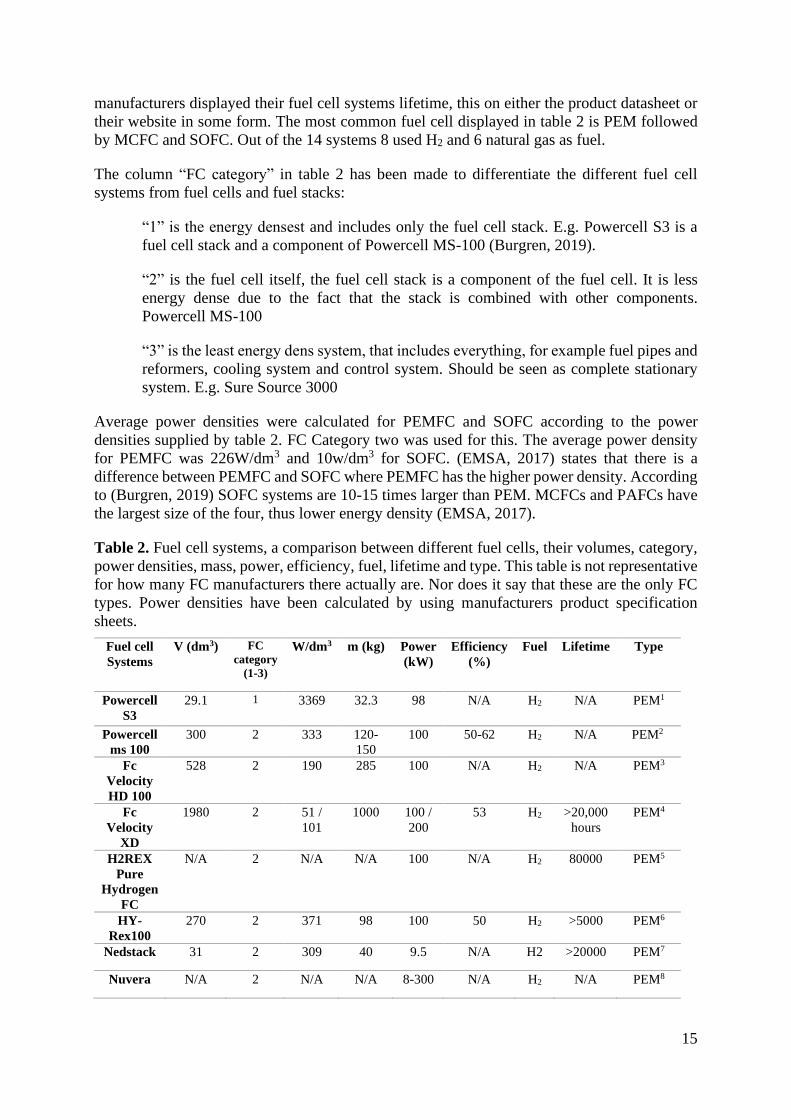
15
manufacturers displayed their fuel cell systems lifetime, this on either the product datasheet or
their website in some form. The most common fuel cell displayed in table 2 is PEM followed
by MCFC and SOFC. Out of the 14 systems 8 used H2 and 6 natural gas as fuel.
The column “FC category” in table 2 has been made to differentiate the different fuel cell
systems from fuel cells and fuel stacks:
“1” is the energy densest and includes only the fuel cell stack. E.g. Powercell S3 is a
fuel cell stack and a component of Powercell MS-100 (Burgren, 2019).
“2” is the fuel cell itself, the fuel cell stack is a component of the fuel cell. It is less
energy dense due to the fact that the stack is combined with other components.
Powercell MS-100
“3” is the least energy dens system, that includes everything, for example fuel pipes and
reformers, cooling system and control system. Should be seen as complete stationary
system. E.g. Sure Source 3000
Average power densities were calculated for PEMFC and SOFC according to the power
densities supplied by table 2. FC Category two was used for this. The average power density
for PEMFC was 226W/dm3 and 10w/dm3 for SOFC. (EMSA, 2017) states that there is a
difference between PEMFC and SOFC where PEMFC has the higher power density. According
to (Burgren, 2019) SOFC systems are 10-15 times larger than PEM. MCFCs and PAFCs have
the largest size of the four, thus lower energy density (EMSA, 2017).
Table 2. Fuel cell systems, a comparison between different fuel cells, their volumes, category,
power densities, mass, power, efficiency, fuel, lifetime and type. This table is not representative
for how many FC manufacturers there actually are. Nor does it say that these are the only FC
types. Power densities have been calculated by using manufacturers product specification
sheets.
Fuel cell
Systems
V (dm3) FC
category
(1-3)
W/dm3 m (kg) Power
(kW)
Efficiency
(%)
Fuel Lifetime Type
Powercell
S3
29.1 1 3369 32.3 98 N/A H2 N/A PEM1
Powercell
ms 100
300 2 333 120-
150
100 50-62 H2 N/A PEM2
Fc
Velocity
HD 100
528 2 190 285 100 N/A H2 N/A PEM3
Fc
Velocity
XD
1980 2 51 /
101
1000 100 /
200
53 H2 >20,000
hours
PEM4
H2REX
Pure
Hydrogen
FC
N/A 2 N/A N/A 100 N/A H2 80000 PEM5
HY-
Rex100
270 2 371 98 100 50 H2 >5000 PEM6
Nedstack 31 2 309 40 9.5 N/A H2 >20000 PEM7
Nuvera N/A 2 N/A N/A 8-300 N/A H2 N/A PEM8
16
Symbio,
H2Motiv
XL
32-128 1 2500 N/A 80 -
320
N/A H2 N/A PEM9
ES5-
YA8AAN
29962 2 10 15800 300 53-65 NG N/A SOFC10
ES5-
FABAAN
23412 2 9 12600 200 53-65 NG N/A SOFC11
ES5-
EA2AAN
23412 2 11 13600 250 53-65 NG N/A SOFC12
Sure
source
4000
N/A 3 N/A N/A 3700 60 NG N/A MCFC13
Sure
source
3000
2217111 3 1.3 159211 2800 47 ±2% NG N/A MCFC14
PureCell
Model
400
67043 3 7 28663 440 45 NG 85848 PAFC15
1: (Powercell, 2018) 2: (Powercell, 2019) 3: (Ballard, 2019) 4: (Systems) 5: (Toshiba, 2019) 6: (Swiss Hydrogen,
2017) 7: (Nedstack, 2014) 8: (Renewableenergy Focus, 2013) 9: (Symbio, 2019) 10: (Energy, 2019c) 11:
(Energy, 2019b) 12: (Energy, 2019a) 13: (Fuelcellenergy, 2019b) 14: (Fuelcellenergy, 2019a) 15: (Doosan,
2018)
4.3 Fuel prices
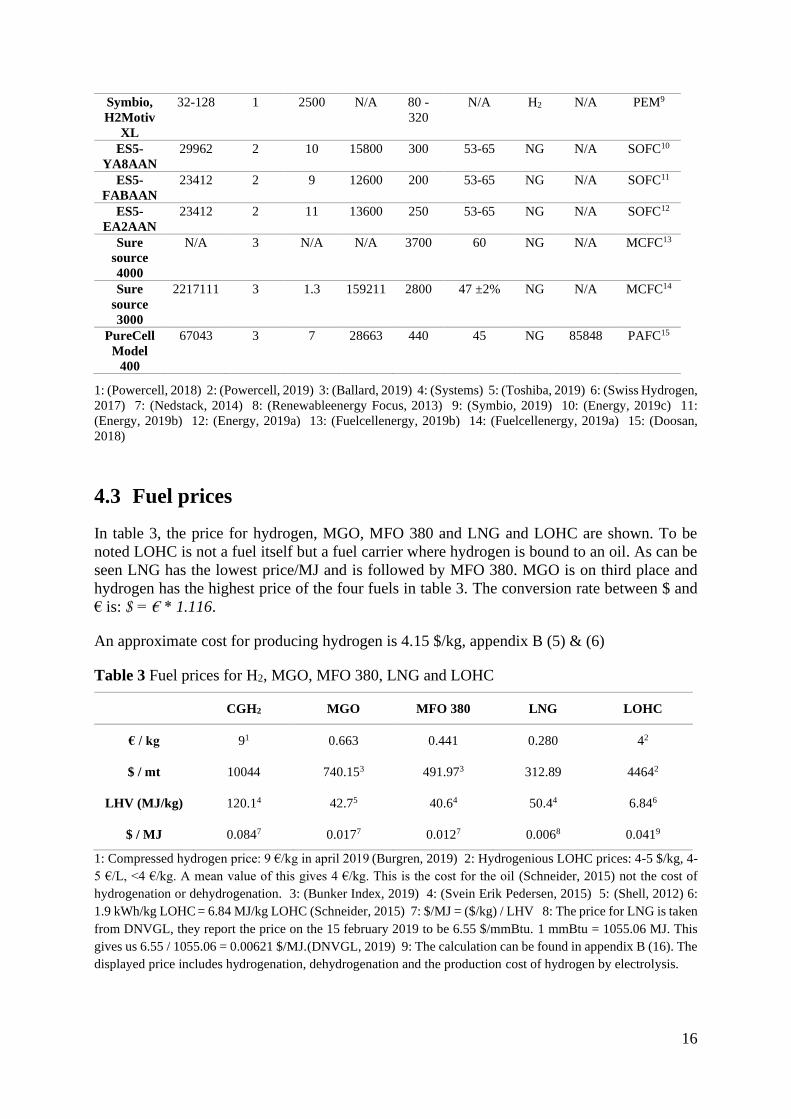
In table 3, the price for hydrogen, MGO, MFO 380 and LNG and LOHC are shown. To be
noted LOHC is not a fuel itself but a fuel carrier where hydrogen is bound to an oil. As can be
seen LNG has the lowest price/MJ and is followed by MFO 380. MGO is on third place and
hydrogen has the highest price of the four fuels in table 3. The conversion rate between $ and
€ is: $ = € * 1.116.
An approximate cost for producing hydrogen is 4.15 $/kg, appendix B (5) & (6)
Table 3 Fuel prices for H2, MGO, MFO 380, LNG and LOHC
CGH2 MGO MFO 380 LNG LOHC
€ / kg 91 0.663 0.441 0.280 42
$ / mt 10044 740.153 491.973 312.89 44642
LHV (MJ/kg) 120.14 42.75 40.64 50.44 6.846
$ / MJ 0.0847 0.0177 0.0127 0.0068 0.0419
1: Compressed hydrogen price: 9 €/kg in april 2019 (Burgren, 2019) 2: Hydrogenious LOHC prices: 4-5 $/kg, 4-
5 €/L, <4 €/kg. A mean value of this gives 4 €/kg. This is the cost for the oil (Schneider, 2015) not the cost of
hydrogenation or dehydrogenation. 3: (Bunker Index, 2019) 4: (Svein Erik Pedersen, 2015) 5: (Shell, 2012) 6:
1.9 kWh/kg LOHC = 6.84 MJ/kg LOHC (Schneider, 2015) 7: $/MJ = ($/kg) / LHV 8: The price for LNG is taken
from DNVGL, they report the price on the 15 february 2019 to be 6.55 $/mmBtu. 1 mmBtu = 1055.06 MJ. This
gives us 6.55 / 1055.06 = 0.00621 $/MJ.(DNVGL, 2019) 9: The calculation can be found in appendix B (16). The
displayed price includes hydrogenation, dehydrogenation and the production cost of hydrogen by electrolysis.
17
4.4 Lifetime
Expected lifetime for PEMFC and SOFC is shown in table A3 gathered from different sources.
Average lifetime for both types has been calculated at the bottom row of the table. PEMFC
lifetime ranges from 5000 to 35000 hours. SOFC lifetime ranges between 30000-90000 hours.
Expected lifetime of fuel cells can vary depending on its application. In the article “A review
of PEM fuel cell durability” fuel cells for the automotive industry have a lifetime expectancy
of 5000 hours (Wu et al., 2008). A similar lifetime expectancy is found in a company
presentation (Powercell, 2017). PEMFC for buses in comparison to cars have a higher lifetime
expectancy reaching 20000 hours (Wu et al., 2008) and stationary have an expectancy of 40000
hours. The lower lifetime expectancy for cars can be explained by cars being subjected to more
frequent load variations which makes the lifetime shorter. According to (Burgren, 2019)
lifetime of a fuel cell will increase if it is run on a constant load. Starting up and shutting down
the system also decreases lifetime of a fuel cell (Wu et al., 2008). In comparison to SOFC,
PEMFC can handle these load variations better, as SOFC is very sensitive to these. It is also
recommended to combine FC systems with batteries to deal with load cycling (EMSA, 2017).
The average lifetime for PEMFC and SOFC according to table A3 is 21000 and 56000 hours,
respectively.
4.5 Fuel cost per kWhe
Fuel prices per kWhe for 7 different energy conversion systems were calculated and is showed
in each column of table A4. The LOHC price displayed is only based on dehydrogenation,
hydrogenation and the hydrogen production cost. To be noted, the life cycle cost is not included
in this price comparison.
As seen in figure 6, SOFC running on natural gas has lowest price per kWhe followed by a 4-
stroke genset on MGO. PEMFC running on compressed hydrogen has by far the highest price
per produced kWhe.
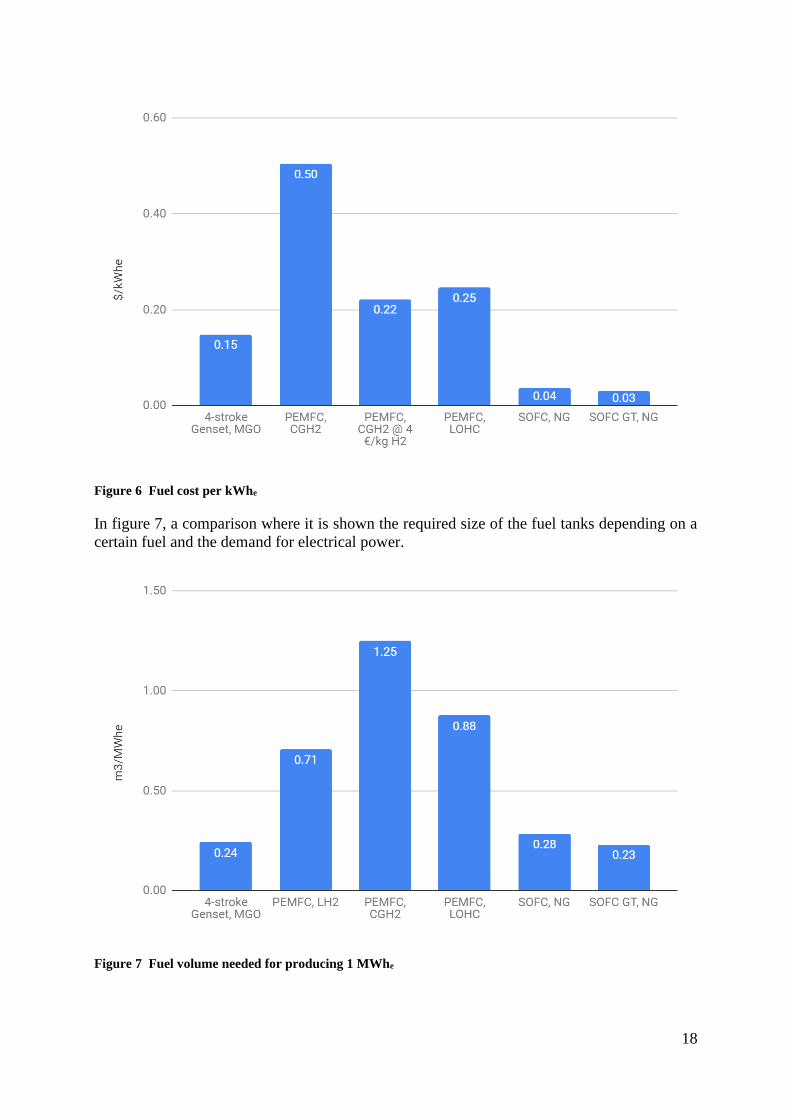
18
Figure 6 Fuel cost per kWhe
In figure 7, a comparison where it is shown the required size of the fuel tanks depending on a
certain fuel and the demand for electrical power.
Figure 7 Fuel volume needed for producing 1 MWhe
19
4.6 Electric efficiency comparison
In table 4 electric efficiencies for PEM and SOFC and 4-stroke internal combustion engine
(ICE) was gathered from 9 sources. Average electrical efficiency for PEMFC and SOFC
totalled in 60% and 59.8%, respectively. SOFC GT (SOFC with gas turbine) received an
average electrical efficiency of 73.3%. Overall average efficiency for SOFC HR (SOFC with
heat recovery) was 88.2%.
Table 4. Comparison of electric efficiency.
Source 4 Stroke
ICE (%)
PEMFC
LT, H2
(%)
SOFC,
NG (%)
SOFC
GT, NG
(%)
SOFC
HR, NG
(%)
(Powercell, 2017) 50-60 50-60
(EMSA, 2017) 50-60 60 85
(de-Troya, Álvarez,
Fernández-Garrido, &
Carral, 2016)
40-60 70-80
Baldi et al. (2019) 60-61 70 85-90
(Zhang et al., 2017) 59.3 92
(Woud & Stapersma,
2002)
23-49
(Van Biert et al., 2016) 45 70 60
(MAN, 2019) 44.5
(Froitzheim, 2019) 74
Average Efficiency 41.3 60 59.8 73.3 88.2
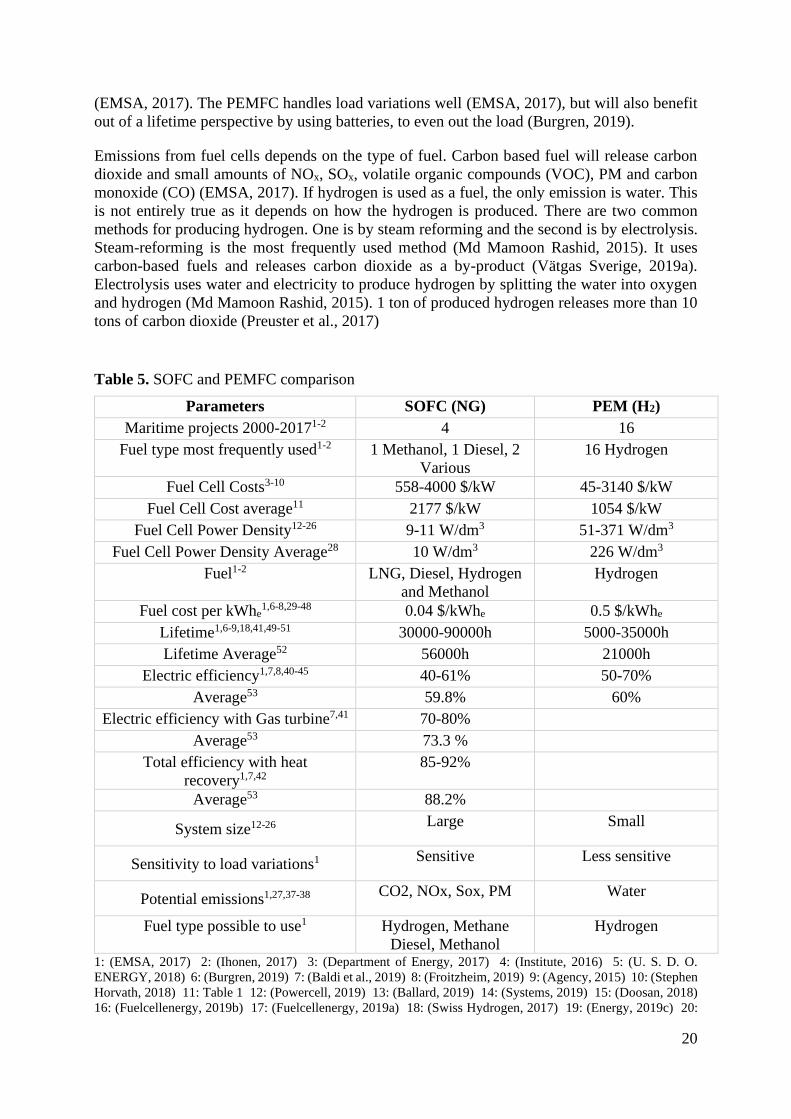
4.7 SOFC and PEMFC comparison
All performance data for SOFC and PEMFC have been summarised in Table 5 for comparison.
Both technologies have been tested in ships although PEMFC has been tested more times than
SOFC. They can both use hydrogen as fuel but the SOFC is less sensitive to impurities and can
utilize other fuels like methane, diesel and methanol. The average price/kw for PEMFC is half
that of SOFC. PEMFC is the most compact of the two and has the highest energy density. In
terms of $/kWhe SOFC is the cheapest when run on methane. SOFC has a higher average
lifetime. PEMFC has highest electrical efficiency. SOFC can be combined with a natural gas
turbine and in that way further increase its electrical efficiency. Due to its high working
temperature SOFC can further increase its efficiency by utilizing heat recovery. SOFC is the
only technology of the two that releases harmful emissions e.g. CO2, nitrogen oxides (NOx),
sulphur oxides (SOx) and particulate matter (PM) during operation if other fuels then hydrogen
is used.
Due to high working temperature in the SOFC it is relatively slow and sensitive to load
variations. It could be beneficial to use a battery to even out the load and reduce thermal stress
20
(EMSA, 2017). The PEMFC handles load variations well (EMSA, 2017), but will also benefit
out of a lifetime perspective by using batteries, to even out the load (Burgren, 2019).
Emissions from fuel cells depends on the type of fuel. Carbon based fuel will release carbon
dioxide and small amounts of NOx, SOx, volatile organic compounds (VOC), PM and carbon
monoxide (CO) (EMSA, 2017). If hydrogen is used as a fuel, the only emission is water. This
is not entirely true as it depends on how the hydrogen is produced. There are two common
methods for producing hydrogen. One is by steam reforming and the second is by electrolysis.
Steam-reforming is the most frequently used method (Md Mamoon Rashid, 2015). It uses
carbon-based fuels and releases carbon dioxide as a by-product (Vätgas Sverige, 2019a).
Electrolysis uses water and electricity to produce hydrogen by splitting the water into oxygen
and hydrogen (Md Mamoon Rashid, 2015). 1 ton of produced hydrogen releases more than 10
tons of carbon dioxide (Preuster et al., 2017)
Table 5. SOFC and PEMFC comparison
Parameters SOFC (NG) PEM (H2)
Maritime projects 2000-20171-2 4 16
Fuel type most frequently used1-2 1 Methanol, 1 Diesel, 2
Various
16 Hydrogen
Fuel Cell Costs3-10 558-4000 $/kW 45-3140 $/kW
Fuel Cell Cost average11 2177 $/kW 1054 $/kW
Fuel Cell Power Density12-26 9-11 W/dm3 51-371 W/dm3
Fuel Cell Power Density Average28 10 W/dm3 226 W/dm3
Fuel1-2 LNG, Diesel, Hydrogen
and Methanol
Hydrogen
Fuel cost per kWhe1,6-8,29-48 0.04 $/kWhe 0.5 $/kWhe
Lifetime1,6-9,18,41,49-51 30000-90000h 5000-35000h
Lifetime Average52 56000h 21000h
Electric efficiency1,7,8,40-45 40-61% 50-70%
Average53 59.8% 60%
Electric efficiency with Gas turbine7,41 70-80%
Average53 73.3 %
Total efficiency with heat
recovery1,7,42
85-92%
Average53 88.2%
System size12-26 Large Small
Sensitivity to load variations1 Sensitive Less sensitive
Potential emissions1,27,37-38 CO2, NOx, Sox, PM Water
Fuel type possible to use1 Hydrogen, Methane
Diesel, Methanol
Hydrogen
1: (EMSA, 2017) 2: (Ihonen, 2017) 3: (Department of Energy, 2017) 4: (Institute, 2016) 5: (U. S. D. O.
ENERGY, 2018) 6: (Burgren, 2019) 7: (Baldi et al., 2019) 8: (Froitzheim, 2019) 9: (Agency, 2015) 10: (Stephen
Horvath, 2018) 11: Table 1 12: (Powercell, 2019) 13: (Ballard, 2019) 14: (Systems, 2019) 15: (Doosan, 2018)
16: (Fuelcellenergy, 2019b) 17: (Fuelcellenergy, 2019a) 18: (Swiss Hydrogen, 2017) 19: (Energy, 2019c) 20:

21
(Energy, 2019b) 21: (Energy, 2019a) 22: (Toshiba, 2019) 23: (Nedstack, 2014) 24: (Renewableenergy Focus,
2013) 25: (Symbio, 2019) 26: (Powercell, 2018) 27: (Alfredsson & Swenson, 2017) 28: Table 2 29: (Vogler &
Sattler, 2016) 30: (Burgren, 2019) 31: (Bunker Index, 2019) 32: (DNVGL, 2019) 33: (Schneider, 2015) 34:
(Svein Erik Pedersen, 2015) 35: (Shell, 2012) 36: (Department of Energy Hydrogen and Fuel Cells Program
Record, 2009) 37: (Preuster et al., 2017) 38: (Vätgas Sverige, 2019a) 39: (Centralbyrån, 2019) 40: (Powercell,
2017) 41: (de-Troya, Álvarez, Fernández-Garrido, & Carral, 2016) 42: (Zhang et al., 2017) 43: (Woud &
Stapersma, 2002) 44: (Van Biert et al., 2016) 45: (MAN, 2019) 46: (ST1, 2014) 47: (Association, 2011) 48:
(Chalmers Department for Mecanics and Maritime Sciencies, 2019) 49: (Nedstack, 2017) 50: (Systems, 2019)
51: (Ballard Power Systems, 2019) 52: Table A3 53: Table 4 54: Table 3
22
5 Discussion
There is an abundance of literature and articles on the subject. Throughout the study we found
several PEMFC manufacturers but only one SOFC manufacturer. The reason for this could be
PEMFC being a more mature technology than SOFC. Although few SOFC manufacturers were
found, useful data was acquired through reports and scientific articles. In hindsight it would be
preferable to include more SOFC manufacturers to increase the reliability of the comparison.
5.1 Discussion of result
The literature review shows that there is an interest in fuel cells in the shipping industry. Not
only PEM and SOFC are being tested, but also MCFC (EMSA, 2017). Although it was chosen
to focus the study on PEM and SOFC technology, we can also see that MCFC as a fuel cell
technology is feasible for maritime use. Naohiro Saito concluded in his report on fuel cells, that
PEM, SO and MCFC are the most feasible to use out of an economic point view (Saito, 2018).
Fuel cell costs
There is a large variation in the costs reported for SOFC and PEMFC in the literature as shown
in table 1.
Fuel cell costs in table 1 should not be taken out of context. The average capex according to
table 1, does not take any consideration to the number of produced units. Both capex for
PEMFC and SOFC are cost predictions from the past and estimated costs in future. Capex
ranges between 45-4000 $/kw not considering the fuel cell type or the production volumes.
Prices between 45-60 $/kW should be seen from a more mature market standpoint. To achieve
the prices 45-60$ production volumes of 100000-500000 units must be achieved. The fuel cells
in this price range are also aimed for the automotive industry which doesn’t make it an entirely
fair comparison. According to the organisation Fuel Cells and Hydrogen Joint Undertaking
market realizations in “a business as usual scenario” could happen between 2025-2045, with a
less conservative view this could be seen in between 2025-2035 (FCH, 2019).
Looking at FC capex for the shipping industry, it can be seen from table 1, that cost predictions
for stationary application is not too far apart compared to the automotive industry. Even if
stationary and maritime FC predictions are quite high for now compared to internal combustion
engines (Brynolf, 2014). It is not unlikely that synergy effects will be seen from the automotive
industry when production volumes increase. Another factor that should be considered when
analysing capex predictions is that at least in some cases a mark-up of the price is used. In
Battelle’s report it could be seen that capex was 1.5 times higher from the original calculated
cost (Institute, 2016).
If production volumes increase significantly cost reduction could be seen for both technologies.
Compared to maritime ICE both SOFC and PEM still have a higher initial capex (Stephen
Horvath, 2018).
Fuel cell dimensions and energy density
As seen in table 2 there is a difference in size between SOFC and PEMFC in power density.
PEMFC has a greater power density than SOFC. PEMFC are in general regarded as more
energy dense compared to SOFC. (Vogler & Sattler, 2016) states that most FC systems of today
23
that are in the range of 150 kW and larger are significantly less energy dense than PEMFC. This
is also confirmed by EMSA’s maritime study on fuel cells (EMSA, 2017). It should be noted
that it would be preferable to include more SOFC systems, in order to increase the validity of
the comparison.
During data gathering it was noted that fuel cells were marketed in different ways. In some
cases, the fuel cell stack itself was marketed especially for the automotive industry where high-
power density is demanded. When looking at stationary systems the whole system size was
usually included.
Fuel energy density
Although fuel energy density of a fuel was not included in the research question it is an essential
part of the study as it explains some of the challenges with fuels concerning fuel cells onboard
ships.
Hydrogen has the highest energy density per kg compared to MGO, MFO 380, LNG and
Methanol. Its volumetric energy density on the other hand shows that hydrogen in its liquid
form assumes 4.7 times more volume than MFO 380 (Vogler & Sattler, 2016). Liquid natural
gas requires twice the space of MGO at -162°C. This factor impairs the operational range of
ships as they will need much larger bunker tanks for the same amount of energy. LOHC will
need even more space compared to liquid hydrogen but has the advantage of being stored at an
ambient room temperature. Hydrogen in its compressed form has lower energy density than
LOHC and suffers from impracticalities from its pressure tanks. LOHC would seem to be a
more convenient option compared to liquid hydrogen concerning handling and safety as it does
not burn easily. Boil off from liquid hydrogen has not been investigated in this report but should
be considered in future reports.
Fuel price and fuel cost per kWhe
When calculating the price of hydrogen per kilo gram an assumption was made of 8766 MWh
of energy usage yearly. The price of electricity during July to Dec 2018 was 0.67 $/kWh
(Centralbyrån, 2019). 1 kg of hydrogen requires 50 kWh to produce (Vätgas Sverige, 2019a).
Multiplying these results in a hydrogen production price of 3.33 $/kg. When adding the
investment and operating cost to the production price of hydrogen will have an estimated cost
of 6.66 $/kg (Vätgas Sverige, 2019a). When comparing fuel cost per kWhe for hydrogen with
natural gas and traditional marine fuels, hydrogen has the highest price of them all. If the
hydrogen price decreases our result would change significantly. When looking at historical
prices of the other fuels there does not seem to be any large enough change in price to affect
our result.
Even if two values for the hydrogen cost was found, it was decided to use 9 €/kg H2 throughout
this thesis.
In figure 6 fuel cost per kWhe can be seen. In the calculation, capex is not included in the final
price per kWhe.
From a shipowner’s perspective it could be interesting to have capex included. If capex is added
to the calculation over a time period, a difference can be seen of 4-10% on cost per kWhe. For
example, assuming a lifetime of 50000 hours and a constant price of 9 €/kg H2 the total price
per kWhe just increases from 0.50 to 0.52 $ or at a lifetime of 21000 hours the increase is 0.05
24
$/kWhe equal to 10% of the total cost, table A5. If the same comparison is made with a
traditional diesel genset, the fuel cost versus total cost, the increase is ~5% at 50000 hours and
~11% at 21000 hours, table A6. Even if fuel cells are considered at higher price per kW
compared to the ICE, the largest cost will not be the capex but the fuel.
The reason for why capex was not added from the beginning is that capex for fuel cells varies
at the moment as they have not been fully commercialized. It would be reasonable to think that
shipowners would be reluctant to switch technologies if price is not competitive against current
powerplant systems. Depending on the segment of shipping, capex will play an important role
(Vogler & Sattler, 2016). At the same time fuel cost is as important because it governs the
operational costs (Vogler & Sattler, 2016).
The numbers 17 kWhe/kg H2 (Burgren, 2019) together with the price of hydrogen, 9 €/kg H2
results in 0.53 €/kWhe or 0.59 $/kWhe.
The calculated result 0.50 $/kWhe for a PEMFC running on CGH2 seems reasonable compared
with the approximated cost of 0.59 $/kWhe received from (Burgren, 2019).
Operational fuel cost as seen in figure 6 and table A4 gives the SOFC a lower cost compared to
PEMFC when running on LNG.
Lifetime
In order to receive a general overview of PEM and SOFC lifetime, an average was calculated.
PEMFC lifetime can vary between 5000-35000 hours and is categorized depending on the
application. According to (Wu et al., 2008) PEMFC for stationary application has the longest
lifetime followed by busses and then cars. This distinction is not made in the comparison of
table A3 but is worth noting (Wu et al., 2008).
According to Johan Burgren at Powercell, to utilize the maximum lifetime of a PEM fuel cell
it should run at constant medium load. EMSA states in their report “Study on the use of fuel
cells in shipping” that SOFC has a low tolerance for cycling compared to PEMFC (EMSA,
2017).
What can be said about FC lifetime is that it has a strong correlation to load variation. The less
load variation in a fuel cell the longer lifetime it can achieve (Alfredsson & Swenson, 2017)
(Burgren, 2019). Also, the SOFC lifetime is dependent on its application. It is even more
sensitive for load variations than the PEMFC (EMSA, 2017). At the same time, lifetime of
PEMFC can be increased significantly if one were to use it in applications with less load cycling
(Wu et al., 2008).
Electric efficiency comparison
Table 4 shows average efficiency for both PEM and SOFC. Efficiency values for PEM and
SOFC were gathered from several sources. From the result it can be seen that both technologies
have similar average efficiency. PEM efficiency varies depending on its load condition and can
decrease with as much as 10% (Powercell, 2017). According to (Burgren, 2019) PEMFC has
its highest efficiency at ~30% load. The efficiency of a fuel cell is higher than the internal
combustion engine. The reason for this is that FC do not have to follow the Carnot-efficiency
curve compared to ICE, as seen in the background (Barbir, 2005).
25
In chapter 4.5 and 4.6 combustion engines are compared with fuel cells. Although our research
question does not support combustion engines, this comparison could give a wider perspective
on how they perform against fuel cells. The columns with ICE in table 4 are not presented in
table 5 since it is not a fuel cell.
PEMFC and SOFC technology comparison
SOFC has an average lifetime of 56000 hours based on table 5. SOFC is not yet a fully
developed technology although one manufacturer was found. As for PEMFC average lifetime
is shorter than SOFC. This could depend on that PEMFC are primarily used in more load driven
applications, i.e. cars and buses but have also been seen in stationary applications.
As for emissions the SOFC system is the least environmentally friendly of the two as it can
emit CO2, NOX, SOX, VOC and CO. This of course depends on the fuel used, if hydrogen is
used in the SOFC it would mean that it would be on par with PEMFC out of an environmental
perspective, where water is the only emission. This does not take into consideration from what
the hydrogen is initially produced from. Hydrogen can be produced with both renewables and
fossil fuels, as described in chapter 2.4.1 and 4.7.
Both SOFC and PEMFC have high electrical efficiencies over todays combustion engines.
5.2 Selection of method
The study combines both a literature review approach and consultations with representatives
from the industry. Several other methods were considered. Interview and case study were also
possible method candidates.
Interview as a method was considered early on but was discarded because it had possible
disadvantages for the study, as finding subjects to interview could be difficult within the given
timeframe. A case study was also considered for the comparison of SO and PEM fuel cells. One
disadvantage with case studies is that it could be difficult to get access to the environment where
the study is intended to take place (Denscombe, 2016). E.g. we could have asked permission to
study PEM fuel cells in Gothenburg. This would require the permission from the specified
company which we did not have. During the study there were no SOFC companies known to
us in Sweden. Therefore, it was decided that a literature review approach had a higher likeliness
to succeed than the other methods mentioned above.
It could be discussed if interview as a method would have produced a different result. E.g.
interviews according to Denscombe (2016) are suitable for producing detailed data and could
give the researcher valuable insight due to the subjects vast experience in his or her field. In
hindsight the study would not have been based on the same amount of data which is also
reflected by the fact that we were only able to find two representatives from the industry to
consult during the study.
5.3 Literature search
Literature searches were not limited to databases found in Chalmers library’s search engine. By
not limiting the scope of the literature searches a broad range of data was acquired. This would
not have been possible if searches had been limited e.g. to a specific database or type of article.
In order to produce reliable results an age limit of ten years was set for the articles and reports
26
reviewed. An exception to this rule was made in one case. During the comparison of fuel cell
efficiency in table 4, performance data for combustion engines from 2002 was used. It was not
considered that combustion engine data would affect the validity of the result as it is not likely
that combustion engine efficiency has changed very much the last twenty years.
Data for chapter 4.2 was made by gathering data sheets from manufacturer’s websites. In one
case an exception was made concerning Nuvera fuel cells where data was gathered through a
news article. This could affect reliability for that specific entry but will most likely not affect
the end result if the entry would have been ignored.
The criteria given in the method states that articles must handle the topic PEMFC or SOFC. An
exception to this was made during the compilation of data for chapter 4.2. Although it was not
originally intended to include MCFC and PAFC in the comparison as it is not supported by
research question, it was added by the fact that it exemplifies land-based fuel cell systems.
These fuel cell systems require more volume in general and they provide a distinction between
the different types of fuel cells.
During the data gathering of fuel cell systems, more SOFC could have been included in the
comparison in order to increase the validity of the result. We believe that the main reason why
so few SOFC entries were included in the study, is that PEM fuel cells are more common on
the market.
5.4 Data gathering
It should be noted that the Liquid Organic Hydrogen Carrier oil cost, energy content, in table 3
derives from a company presentation. The maker Hydrogenious is a for profit organization.
(Schneider, 2015). The cost for hydrogenation, dehydrogenation and hydrogen production is an
approximation (Preuster et al., 2017) & (Schneider, 2015) not directly from the manufacturer,
see appendix B.
One should have in mind that both persons consulted represent their own unique field within
fuel cells. Johan Burgren at Powercell works for a profit company which main purpose is to
promote and sell PEM fuel cells. Jan Froiztheim does research within the field of SO fuel cells.
Maritime fuel cell projects were reviewed through two sources. The bulk of maritime fuel cell
data was found in EMSA’s study on “maritime use of fuel cells in shipping”. One project was
found in (Ihonen, 2017) which was later confirmed by (Powercell, 2017). Several other articles
and presentations, (Van Biert et al., 2016), (Markowski & Pielecha, 2019), (Langfeldt, 2018),
(Klebanoff, Pratt, & LaFleur, 2017), (Barbir, 2005) describe the projects mentioned in EMSA’s
study in some way. Therefore, it was decided to use EMSA’s study for the projects primarily.
27
6 Conclusion
By studying maritime FC projects, it can be seen that PEMFC is the most widely tested
technology followed by SOFC and MCFC. The reason to why PEMFC is mostly is used could
be because of the availability of the technology, more flexible performance characteristics and
price.
Both PEM and SO fuel cell types have similar average electrical efficiency. When looking at
the SOFC it can be noted that its average electrical efficiency is slightly lower. Although the
PEMFC is favored by its slightly higher electrical efficiency the SOFC can be configured in
such a way that it can further increase its efficiency. Combined with a gas turbine it can further
increase its electrical efficiency. Due its high work temperature it can also utilize waste heat
recovery and furthermore increase its efficiency. The overall efficiency of the SOFC can be
increased up to 88% if heat recovery is utilized. This could make it a more interesting choice
over the PEMFC, but it does not take into account the lower energy density of the SOFC system.
The SOFC has 10-22 times the volume of PEMFC which makes it a large system. From a
lifetime perspective SOFC has highest average lifetime compared to PEMFC. Load cycling
decreases the lifetime of both types but SOFC is more sensitive to load cycling than PEMFC.
Both PEMFC and SOFC can utilize hydrogen as fuel. PEMFC demands high purity of hydrogen
while SOFC is less sensitive and can utilize other fuels like methane, methanol and diesel
without using a reformer. If hydrogen is chosen as a fuel it will be the most sustainable as the
only emission is water. The average calculated price for a PEM fuel cell is 1054 $/kW and the
SO fuel cell has about the double of that, 2177 $/kW. As a comparison to this, a traditional
diesel genset has a capex of 700 $/kW. The most expensive way the produce an electric kWh
is by the use of a PEMFC running on hydrogen and most cost efficient is to run a SOFC on
natural gas.
For future research it could be interesting to study how a complete fuel cell system could
replace a traditional fossil fuelled one onboard ships. We know that hydrogen requires about
4.8 times the volume in its liquid form compared heavy fuel oil. Could some of the extra
volume required for fuel be compensated when systems associated with heavy fuel oil
operation are removed.
.
28
References
Alfredsson, H., & Swenson, C. (2017). Bränslecell jämfört med dieselgenerator. En
fallstudie; ersättning av dieselgenerator på ett fartyg. CHALMERS TEKNISKA
HÖGSKOLA. Retrieved from
http://publications.lib.chalmers.se/records/fulltext/250182/250182.pdf
Andersson, K., Brynolf, S., Lindgren, J. F., & Wilewska-Bien, M. (2016). Shipping
and the Environment: Springer, Berlin, Heidelberg.
Association, D. M. (2011). Bio-Methanol.
Baldi, F., Wang, L., Pérez-Fortes, M., & Maréchal, F. (2019). A Cogeneration System
Based on Solid Oxide and Proton Exchange Membrane Fuel Cells With Hybrid
Storage for Off-Grid. Frontiers in Energy Research. doi:10.3389/fenrg.2018.00139
Ballard. (2019). Fuel Cell Power Module for Heavy Duty Motive Applications.
Ballard Power Systems. (2019). Heavy duty models. Retrieved from
http://ballard.com/fuel-cell-solutions/fuel-cell-power-products/motive-modules
Barbir, F. (2005). Pem Fuel Cells: Elsevier Academic Press.
Brynolf, S. (2014). Environmental Assessment of Present and Future marine Fuels.
Bulletin, F. C. (2018). Doosan starts installation of hydrogen-fueled 50 MW fuel cell
power plant in South Korea. Volume 2018(Issue 8), 1.
Bunker Index. (2019). Bunker index,. Retrieved from https://www.bunkerindex.com/
Burgren, J. (2019, 17 april 2019). [Personal Communcation].
Centralbyrån, S. (2019, 4 maj 2019). Priser på el för industrikunder 2007–. Retrieved
from https://www.scb.se/hitta-statistik/statistik-efter-amne/energi/prisutvecklingen-
inom-energiomradet/energipriser-pa-naturgas-och-el/pong/tabell-och-
diagram/genomsnittspriser-per-halvar-2007/priser-pa-el-for-industrikunder-2007/
Chalmers Department for Mecanics and Maritime Sciencies. (2019). Tanker Safety
Liquified Gases (T. O. Neptune Ed. Vol. 2).
de-Troya, J. J., Álvarez, C., Fernández-Garrido, C., & Carral, L. (2016). Analysing the
possibilities of using fuel cells in ships. International Journal of Hydrogen Energy,
41(4), 2853-2866. doi:10.1016/j.ijhydene.2015.11.145
Deniz, C., & Zincir, B. (2016). Environmental and economical assessment of
alternative marine fuels. Journal of Cleaner Production, 113, 438-449.
doi:10.1016/j.jclepro.2015.11.089
Denscombe, M. (2016). Forskningshandboken (P. Larson, Trans.).
Department of Energy Hydrogen and Fuel Cells Program Record. (2009). Energy
requirements for hydrogen gas compression and liquefaction as related to vehicle
storage needs. Retrieved from
https://www.hydrogen.energy.gov/pdfs/9013_energy_requirements_for_hydrogen_gas
_compression.pdf?fbclid=IwAR0PMWYPYO0BbHyZUr9MmsLkze8BqSOOfFSvW
Ypy-506cUh6ae-BdINou6s
DNVGL. (2019). Current price development oil and gas. Retrieved from
https://www.dnvgl.com/maritime/lng/current-price-development-oil-and-gas.html

29
Doosan. (2018, 04-30-2019). Pure Cell Modell 400. Retrieved from
http://www.doosanfuelcell.com/download/pdf/catalog/pafc-400kw_us_en.pdf
EMSA. (2017). MARITIME STUDY ON THE USE OF FUEL CELLS IN SHIPPING.
Retrieved from http://www.emsa.europa.eu/news-a-press-centre/external-
news/download/4545/2921/23.html
Energigas, S. (2019, 26 september 2017). Svenska rederier surfar på gasvågen.
Retrieved from https://www.energigas.se/publikationer/tidningen-energigas/svenska-
rederier-surfar-paa-gasvaagen/
Energy, B. (2019a, 04-30-2019). ES5-EA2AAN. Retrieved from
https://www.bloomenergy.com/sites/default/files/es5-250kw-datasheet-2019.pdf
Energy, B. (2019b). ES5-FABAAN. Retrieved from
https://www.bloomenergy.com/sites/default/files/es5-200kw-datasheet-2019.pdf
Energy, B. (2019c, 04-30-2019). ES5-YA8AAN. Retrieved from
https://www.bloomenergy.com/sites/default/files/es5-300kw-datasheet-2019.pdf
FCH. (2019). Hydrogen Roadmap Europe A sustainable pathway for the European
energy transition, . Retrieved from
https://fch.europa.eu/sites/default/files/20190206_Hydrogen%20Roadmap%20Europe
_Keynote_Final.pdf
Forsea. (2019). Hållbarhet. Retrieved from https://www.forsea.se/om-
forsea/hallbarhet/
Froitzheim, J. (2019, 5 february). [Personal Communication].
Fuel Cell Today. (2019). History. Retrieved from
http://www.fuelcelltoday.com/history
Fuelcellenergy. (2019a). SureSource 3000
2.8 MEGAWATTS. Retrieved from https://www.fuelcellenergy.com/wp-
content/uploads/2017/02/Product-Spec-SureSource-3000.pdf
Fuelcellenergy. (2019b, 04-30-2019). SureSource 4000. Retrieved from
https://www.fuelcellenergy.com/wp-content/uploads/2013/11/Product-Spec-
SureSource-4000.pdf
Ihonen, J. (2017). MARANDA project to develop fuel cell system for Arctic ship.
Fuel Cells Bulletin, 2017(2), 3-4. doi:10.1016/s1464-2859(17)30072-x
ILK Dresden, M. K. (2015). Storage density of Hydrogen under certain pressure and
temperature conditions. Retrieved from
https://en.wikipedia.org/wiki/Hydrogen_storage#/media/File:Storage_Density_of_Hyd
rogen.jpg
IMO. (2014). Third IMO Greenhouse Gas Study 2014. Retrieved from
http://www.imo.org/en/OurWork/Environment/PollutionPrevention/AirPollution/Docu
ments/Third%20Greenhouse%20Gas%20Study/GHG3%20Executive%20Summary%
20and%20Report.pdf?fbclid=IwAR2VoUCnjD_VfmMWI4AjcDRnYM0tZo4KGfbKj
U5GONKY_WwRmc77GF5IiEw
IMO. (2019, 9-13 April 2018). Marine Environment Protection Committee (MEPC),
72nd session. Retrieved from
30
http://www.imo.org/en/MediaCentre/MeetingSummaries/MEPC/Pages/MEPC-72nd-
session.aspx
Institute, g. M. (2016). Manufacturing Cost Analysis of 100 and 250 kW Fuel Cell
Systems for Primary Power and Combined Heat and Power Applications. Retrieved
from
https://www.energy.gov/sites/prod/files/2016/07/f33/fcto_battelle_mfg_cost_analysis_
pp_chp_fc_systems.pdf.
J Markowski, I. P. (2019). The potential of fuel cells as a drive source of maritime
transport. Paper presented at the 2nd International Conference on the Sustainable
Energy and Environmental Development.
Kreuer, K.-D. (2013). Fuel Cells Selected Entries from the Encyclopedia of
Sustainability Science and Technology.
Langfeldt, L. (2018, 21 February). Maritime Fuel Cell Applications Technologies and
ongoing developments. Retrieved from
http://www.jterc.or.jp/koku/koku_semina/pdf/180221_presentation-01.pdf
Margaronis, S. (2018). ABB collaboration with Ballard advances fuel cell ships
Retrieved from https://www.ajot.com/blogs/full/ai-abb-collaboration-with-ballard-
advances-fuel-cell-ships?fbclid=IwAR3ALzLS8Jc05bcA37hXmYPLvfvR6x-
G5ua5NPFWAijbEzK41K-xnH04igI
Md Mamoon Rashid, M. K. A. M., Hamid Naseem, Mohd Danish. (2015). Hydrogen
Production by Water Electrolysis: A Review of Alkaline Water Electrolysis, PEM
Water Electrolysis and High Temperature Water Electrolysis. International Journal of
Engineering and Advanced Technology (IJEAT) ISSN: 2249 – 8958, Volume-4 Issue-
3, February 2015.
Methanex. (2019). Methanex Methanol Price Sheet. Retrieved from
https://www.methanex.com/our-
business/pricing?fbclid=IwAR3BDzovuaqbiLnc5X_K1FYfJOXulHmVZlusBF5chqix
VBjEqKdfAWF0RGE
Nationalencyklopedin. (2019). naturgas. Retrieved from
http://www.ne.se/uppslagsverk/encyklopedi/lång/naturgas
Nedstack. (2014, 04-30-2018). PRODUCT SPECIFICATIONS OF XXL STACKS.
Retrieved from http://www.nedstack.com/wp-
content/uploads/2017/05/nedstack_product-specifications-of-xxl-stacks.pdf
OECD, & IEA. (2005). PROSPECTS FOR HYDROGEN AND FUEL CELLS.
Retrieved from
Powercell. (2017). Fuel Cells-PowerCell.
Powercell. (2018). S3-Produktblad.
Powercell. (2019, 04-30-2019). PowerCell MS 100 50-100kw Pem Fuel cell system
Prototype. Retrieved from https://www.powercell.se/wordpress/wp-
content/uploads/2018/12/powercell-ms100-datasheet-pdf.pdf
Preuster, P., Papp, C., & Wasserscheid, P. (2017). Liquid Organic Hydrogen Carriers
(LOHCs): Toward a Hydrogen-free Hydrogen Economy. Accounts of Chemical
Research, 50(1), 74-85. doi:10.1021/acs.accounts.6b00474

31
Renewableenergy Focus. (2013, 07 November 2013). Nuvera Fuel Cells to provide
Fincantieri with fuel cell technology for marine vessels. Retrieved from
http://www.renewableenergyfocus.com/view/35513/nuvera-fuel-cells-to-provide-
fincantieri-with-fuel-cell-technology-for-marine-vessels/
Saito, N. (2018). The economic analysis of commercial ships with hydrogen fuel cell
through case studies. Retrieved from
https://commons.wmu.se/cgi/viewcontent.cgi?article=1617&context=all_dissertations
Schneider, D. M. J. (2015). Hydrogen storage and distribution via liquid organic
carriers.
Shell. (2012). Shell marine gasoil,. Retrieved from
https://prodepc.blob.core.windows.net/epcblobstorage/GPCDOC_X_cbe_26724_key_
140007515295_201302281447.pdf
SHELL. (2019). WASSERSTOFF. Retrieved from https://www.shell.de/energie-
und-innovation/mobilitaet/wasserstoff.html
Sjofartsdirektoratet. (2019). Amendments to the Regulations on environmental safety
for ships and mobile offshore units. Retrieved from
https://www.sdir.no/en/shipping/legislation/directives/amendments-to-the-regulations-
on-environmental-safety-for-ships-and-mobile-offshore-units/
ST1. (2014). Marine fuel oil MFO 380.
Stephen Horvath, M. F., Christian Breyer. (2018). Techno-economic analysis of a
decarbonized shipping sector: Technology suggestions for a fleet in 2030 and 2040.
Svein Erik Pedersen, J. G., Svein Kaasa, Oddmund Olsen. (2015). Teknisk
formelsamling med tabeller (7 ed.). Oslo: Gyldendal undervisning.
Swiss Hydrogen. (2017). HY-REX100 RANGE EXTENDER FOR HEAVY DUTY
VEHICLES.
Symbio. (2019). H2Motiv XL. Retrieved from https://www.symbio.one/en/modules-2/
Systems, B. P. (2019, 04-30-2019). Fuel cells for rail applications. Retrieved from
https://hydrail.appstate.edu/sites/hydrail.appstate.edu/files/11_laperche-riteau.pdf
Toshiba. (2019). An environmentally-friendly and highly efficient power generator
with no CO2 emissions. Retrieved from https://www.toshiba-
energy.com/en/hydrogen/product/fuel-cell.htm
US Department of Energy. (2018). 2018 Cost Projections of PEM Fuel Cell Systems
for Automobiles and Medium-Duty Vehicles.
US Department of Energy. (2019). Types of fuel cells. Retrieved from
https://www.energy.gov/eere/fuelcells/types-fuel-cells
Van Biert, L., Godjevac, M., Visser, K., & Aravind, P. V. (2016). A review of fuel cell
systems for maritime applications. Journal of Power Sources, 327(September), 345-
364. doi:10.1016/j.jpowsour.2016.07.007
Vätgas Sverige. (2019a). FAQ. Retrieved from http://www.vatgas.se/faktabank/faq/
Vätgas Sverige. (2019b). Tankstationer. Retrieved from http://www.vatgas.se/tanka/
Vogler, F., & Sattler, G. (2016). Hydrogen-fueled marine transportation. Compendium
of Hydrogen Energy, 4, 35-65. doi:10.1016/b978-1-78242-364-5.00003-8

32
White, M. a. (2000). Liquified Gas Handling Priciniples on Ships and in Terminals (T.
O. Neptune Ed. 3 ed. Vol. 1). London.
Woud, K., & Stapersma, D. (2002). Design of propulsion and electric power
generation systems. London: nstitute of Marine Engineers.
Wu, J., Yuan, X. Z., Martin, J. J., Wang, H., Zhang, J., Shen, J., . . . Merida, W.
(2008). A review of PEM fuel cell durability: Degradation mechanisms and mitigation
strategies. Journal of Power Sources, 184(1), 104-119.
doi:10.1016/j.jpowsour.2008.06.006
Zhang, L., Xing, Y., Xu, H., Wang, H., Zhong, J., & Xuan, J. (2017). Comparative
study of solid oxide fuel cell combined heat and power system with Multi-Stage
Exhaust Chemical Energy Recycling: Modeling, experiment and optimization. Energy
Conversion and Management, 139, 79-88.
doi:https://doi.org/10.1016/j.enconman.2017.02.045
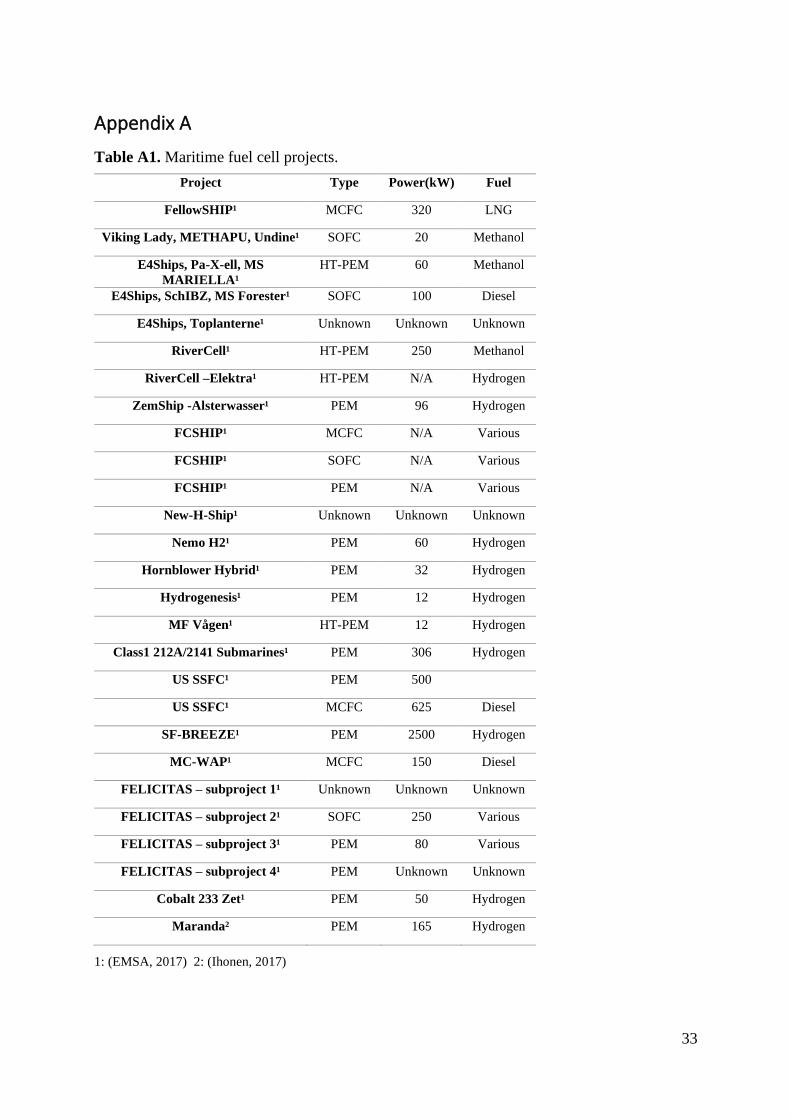
33
Appendix A
Table A1. Maritime fuel cell projects.
Project Type Power(kW) Fuel
FellowSHIP¹ MCFC 320 LNG
Viking Lady, METHAPU, Undine¹ SOFC 20 Methanol
E4Ships, Pa-X-ell, MS
MARIELLA¹
HT-PEM 60 Methanol
E4Ships, SchIBZ, MS Forester¹ SOFC 100 Diesel
E4Ships, Toplanterne¹ Unknown Unknown Unknown
RiverCell¹ HT-PEM 250 Methanol
RiverCell –Elektra¹ HT-PEM N/A Hydrogen
ZemShip -Alsterwasser¹ PEM 96 Hydrogen
FCSHIP¹ MCFC N/A Various
FCSHIP¹ SOFC N/A Various
FCSHIP¹ PEM N/A Various
New-H-Ship¹ Unknown Unknown Unknown
Nemo H2¹ PEM 60 Hydrogen
Hornblower Hybrid¹ PEM 32 Hydrogen
Hydrogenesis¹ PEM 12 Hydrogen
MF Vågen¹ HT-PEM 12 Hydrogen
Class1 212A/2141 Submarines¹ PEM 306 Hydrogen
US SSFC¹ PEM 500
US SSFC¹ MCFC 625 Diesel
SF-BREEZE¹ PEM 2500 Hydrogen
MC-WAP¹ MCFC 150 Diesel
FELICITAS – subproject 1¹ Unknown Unknown Unknown
FELICITAS – subproject 2¹ SOFC 250 Various
FELICITAS – subproject 3¹ PEM 80 Various
FELICITAS – subproject 4¹ PEM Unknown Unknown
Cobalt 233 Zet¹ PEM 50 Hydrogen
Maranda² PEM 165 Hydrogen
1: (EMSA, 2017) 2: (Ihonen, 2017)
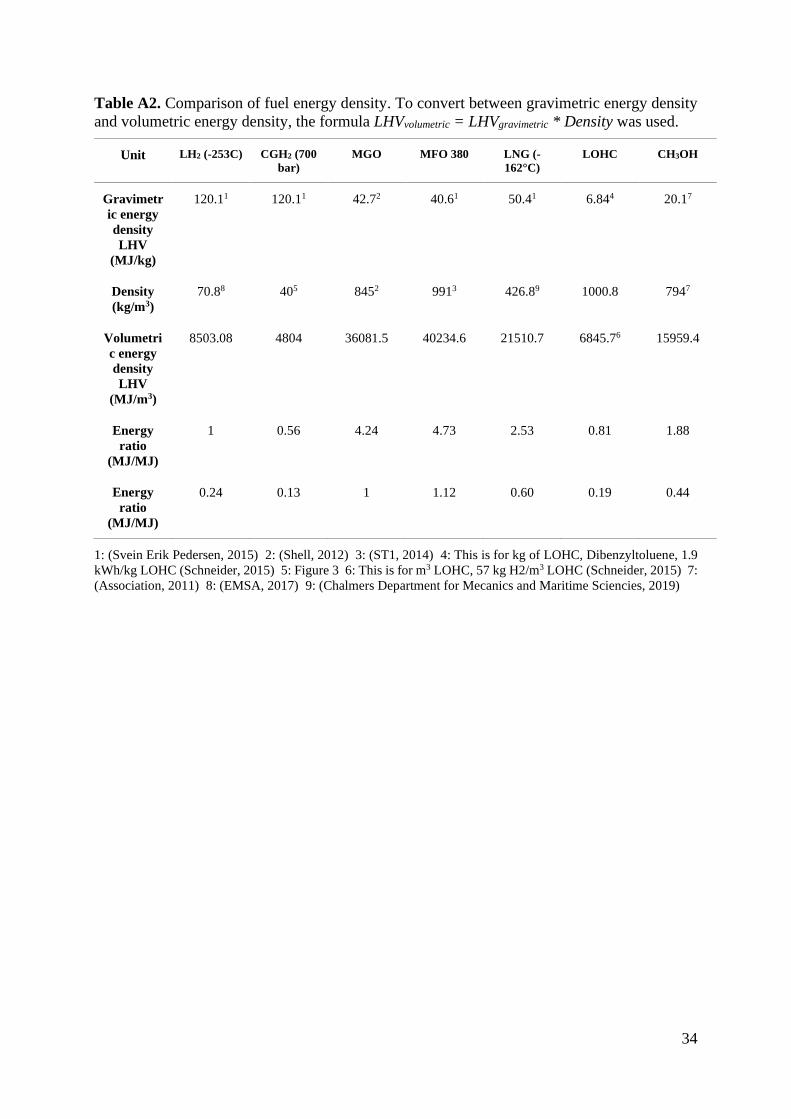
34
Table A2. Comparison of fuel energy density. To convert between gravimetric energy density
and volumetric energy density, the formula LHVvolumetric = LHVgravimetric * Density was used.
Unit LH2 (-253C) CGH2 (700
bar) MGO MFO 380 LNG (-
162°C) LOHC CH3OH
Gravimetr
ic energy
density
LHV
(MJ/kg)
120.11 120.11 42.72 40.61 50.41 6.844 20.17
Density
(kg/m3)
70.88 405 8452 9913 426.89 1000.8 7947
Volumetri
c energy
density
LHV
(MJ/m3)
8503.08 4804 36081.5 40234.6 21510.7 6845.76 15959.4
Energy
ratio
(MJ/MJ)
1 0.56 4.24 4.73 2.53 0.81 1.88
Energy
ratio
(MJ/MJ)
0.24 0.13 1 1.12 0.60 0.19 0.44
1: (Svein Erik Pedersen, 2015) 2: (Shell, 2012) 3: (ST1, 2014) 4: This is for kg of LOHC, Dibenzyltoluene, 1.9
kWh/kg LOHC (Schneider, 2015) 5: Figure 3 6: This is for m3 LOHC, 57 kg H2/m3 LOHC (Schneider, 2015) 7:
(Association, 2011) 8: (EMSA, 2017) 9: (Chalmers Department for Mecanics and Maritime Sciencies, 2019)
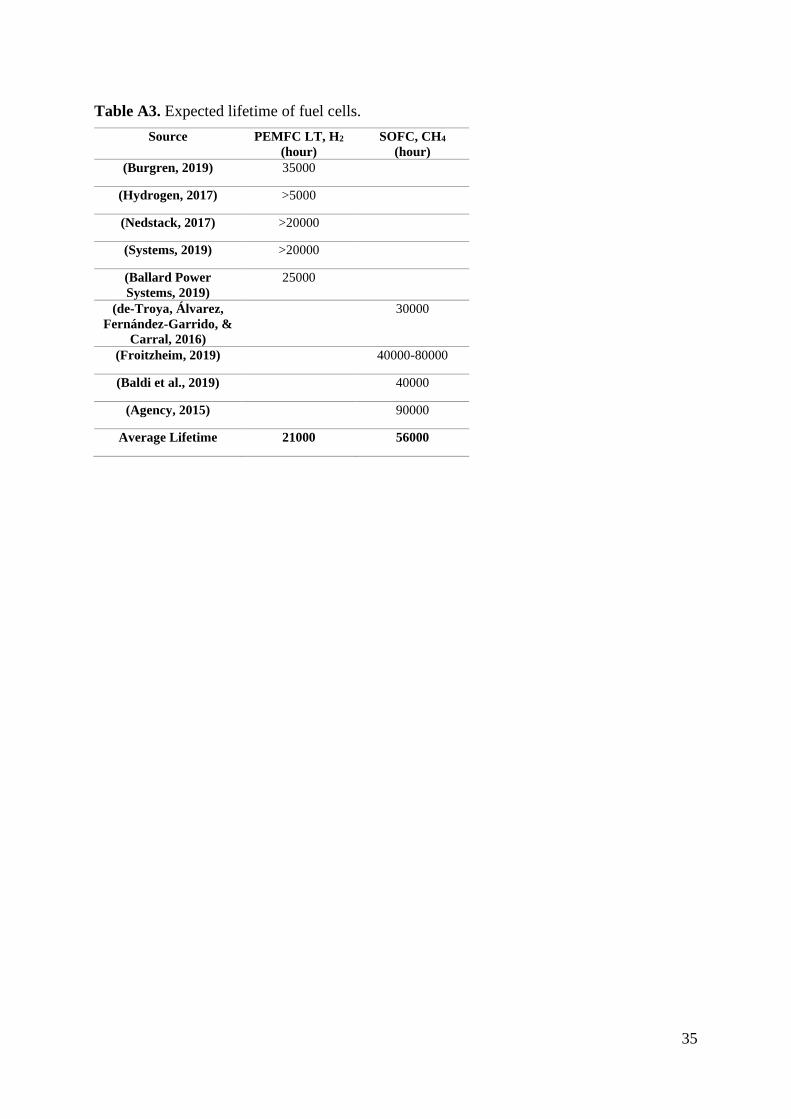
35
Table A3. Expected lifetime of fuel cells.
Source PEMFC LT, H2
(hour)
SOFC, CH4
(hour)
(Burgren, 2019) 35000
(Hydrogen, 2017) >5000
(Nedstack, 2017) >20000
(Systems, 2019) >20000
(Ballard Power
Systems, 2019)
25000
(de-Troya, Álvarez,
Fernández-Garrido, &
Carral, 2016)
30000
(Froitzheim, 2019)
40000-80000
(Baldi et al., 2019)
40000
(Agency, 2015)
90000
Average Lifetime 21000 56000
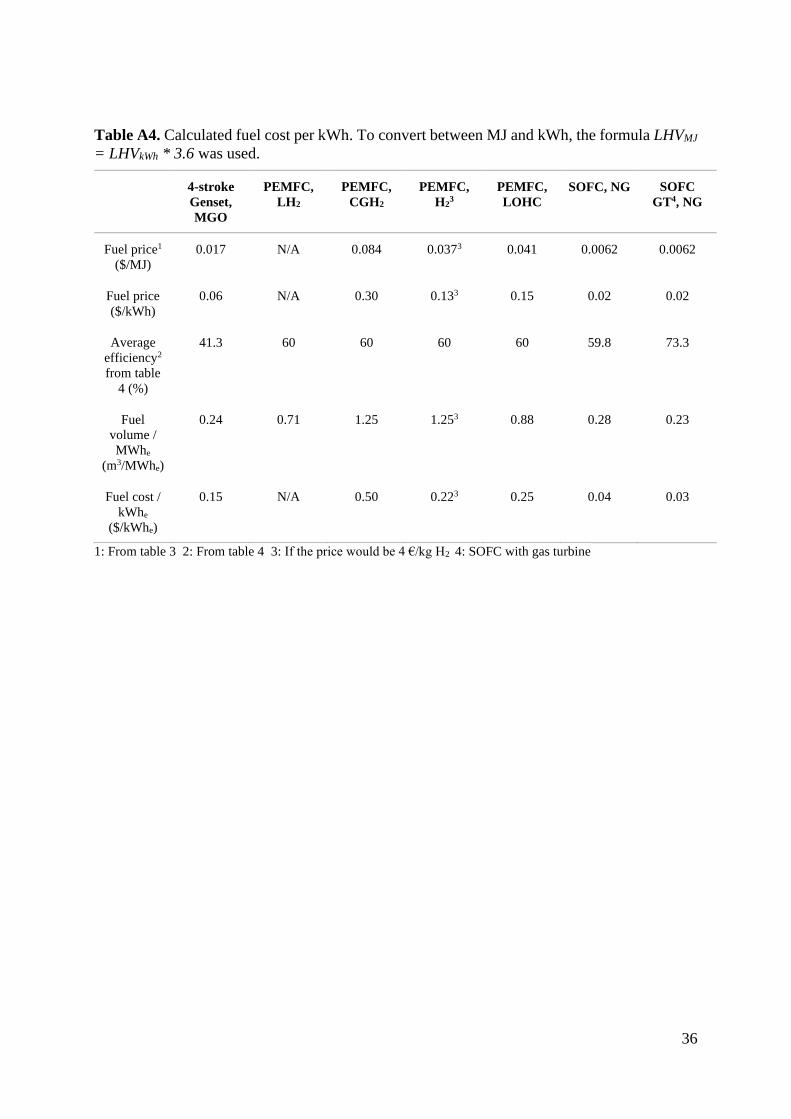
36
Table A4. Calculated fuel cost per kWh. To convert between MJ and kWh, the formula LHVMJ
= LHVkWh * 3.6 was used.
4-stroke
Genset,
MGO
PEMFC,
LH2
PEMFC,
CGH2
PEMFC,
H23
PEMFC,
LOHC
SOFC, NG SOFC
GT4, NG
Fuel price1
($/MJ)
0.017 N/A 0.084 0.0373 0.041 0.0062 0.0062
Fuel price
($/kWh)
0.06 N/A 0.30 0.133 0.15 0.02 0.02
Average
efficiency2
from table
4 (%)
41.3 60 60 60 60 59.8 73.3
Fuel
volume /
MWhe
(m3/MWhe)
0.24 0.71 1.25 1.253 0.88 0.28 0.23
Fuel cost /
kWhe
($/kWhe)
0.15 N/A 0.50 0.223 0.25 0.04 0.03
1: From table 3 2: From table 4 3: If the price would be 4 €/kg H2 4: SOFC with gas turbine
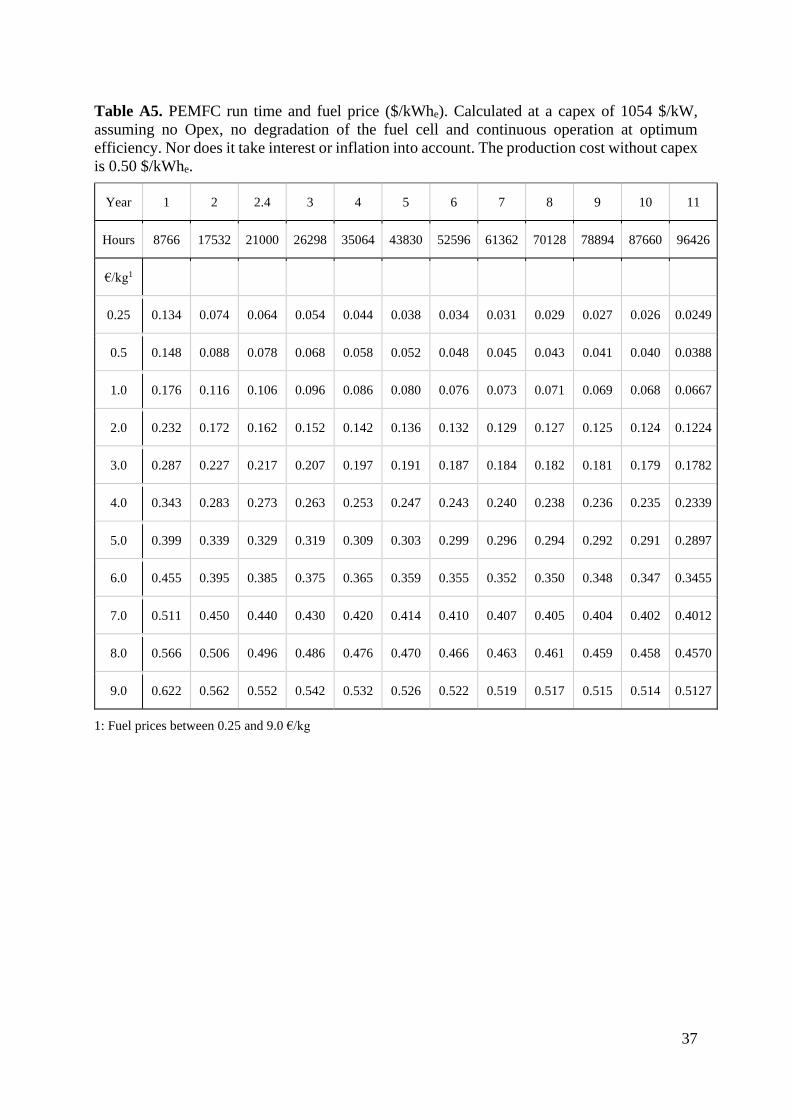
37
Table A5. PEMFC run time and fuel price ($/kWhe). Calculated at a capex of 1054 $/kW,
assuming no Opex, no degradation of the fuel cell and continuous operation at optimum
efficiency. Nor does it take interest or inflation into account. The production cost without capex
is 0.50 $/kWhe.
Year 1 2 2.4 3 4 5 6 7 8 9 10 11
Hours 8766 17532 21000 26298 35064 43830 52596 61362 70128 78894 87660 96426
€/kg1
0.25 0.134 0.074 0.064 0.054 0.044 0.038 0.034 0.031 0.029 0.027 0.026 0.0249
0.5 0.148 0.088 0.078 0.068 0.058 0.052 0.048 0.045 0.043 0.041 0.040 0.0388
1.0 0.176 0.116 0.106 0.096 0.086 0.080 0.076 0.073 0.071 0.069 0.068 0.0667
2.0 0.232 0.172 0.162 0.152 0.142 0.136 0.132 0.129 0.127 0.125 0.124 0.1224
3.0 0.287 0.227 0.217 0.207 0.197 0.191 0.187 0.184 0.182 0.181 0.179 0.1782
4.0 0.343 0.283 0.273 0.263 0.253 0.247 0.243 0.240 0.238 0.236 0.235 0.2339
5.0 0.399 0.339 0.329 0.319 0.309 0.303 0.299 0.296 0.294 0.292 0.291 0.2897
6.0 0.455 0.395 0.385 0.375 0.365 0.359 0.355 0.352 0.350 0.348 0.347 0.3455
7.0 0.511 0.450 0.440 0.430 0.420 0.414 0.410 0.407 0.405 0.404 0.402 0.4012
8.0 0.566 0.506 0.496 0.486 0.476 0.470 0.466 0.463 0.461 0.459 0.458 0.4570
9.0 0.622 0.562 0.552 0.542 0.532 0.526 0.522 0.519 0.517 0.515 0.514 0.5127
1: Fuel prices between 0.25 and 9.0 €/kg
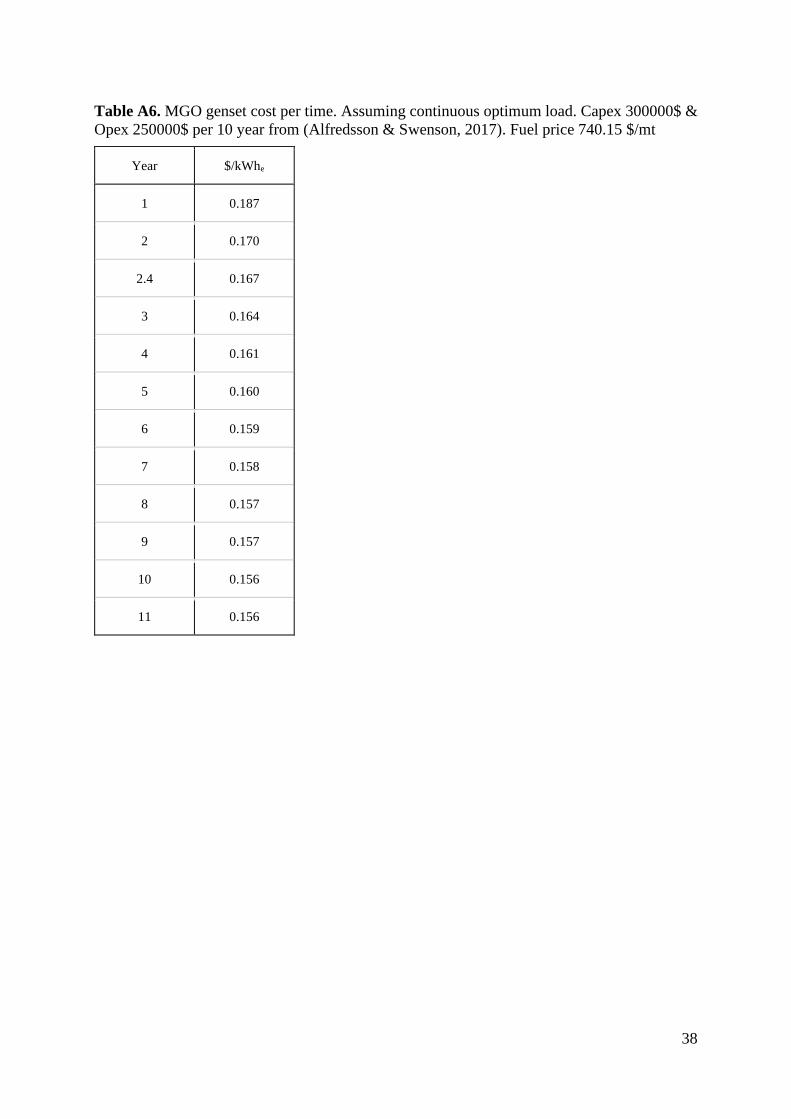
38
Table A6. MGO genset cost per time. Assuming continuous optimum load. Capex 300000$ &
Opex 250000$ per 10 year from (Alfredsson & Swenson, 2017). Fuel price 740.15 $/mt
Year $/kWhe
1 0.187
2 0.170
2.4 0.167
3 0.164
4 0.161
5 0.160
6 0.159
7 0.158
8 0.157
9 0.157
10 0.156
11 0.156
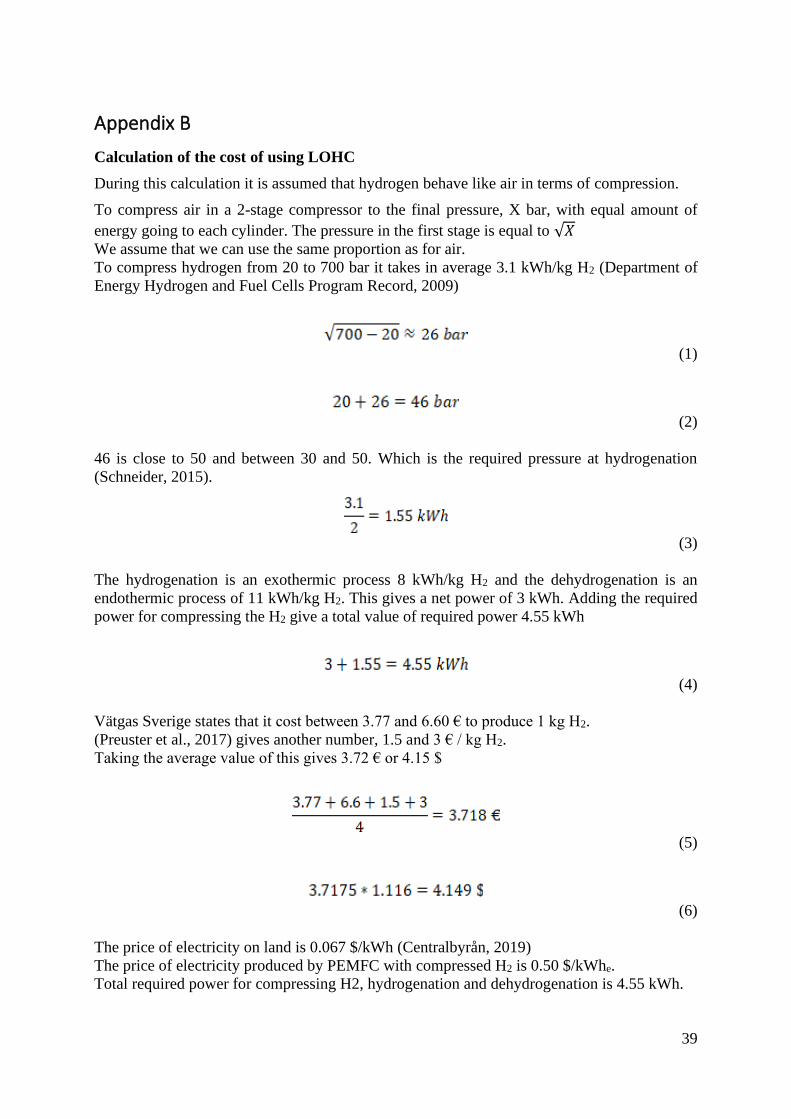
39
Appendix B
Calculation of the cost of using LOHC
During this calculation it is assumed that hydrogen behave like air in terms of compression.
To compress air in a 2-stage compressor to the final pressure, X bar, with equal amount of
energy going to each cylinder. The pressure in the first stage is equal to √𝑋
We assume that we can use the same proportion as for air.
To compress hydrogen from 20 to 700 bar it takes in average 3.1 kWh/kg H2 (Department of
Energy Hydrogen and Fuel Cells Program Record, 2009)
(1)
(2)
46 is close to 50 and between 30 and 50. Which is the required pressure at hydrogenation
(Schneider, 2015).
(3)
The hydrogenation is an exothermic process 8 kWh/kg H2 and the dehydrogenation is an
endothermic process of 11 kWh/kg H2. This gives a net power of 3 kWh. Adding the required
power for compressing the H2 give a total value of required power 4.55 kWh
(4)
Vätgas Sverige states that it cost between 3.77 and 6.60 € to produce 1 kg H2.
(Preuster et al., 2017) gives another number, 1.5 and 3 € / kg H2.
Taking the average value of this gives 3.72 € or 4.15 $
(5)
(6)
The price of electricity on land is 0.067 $/kWh (Centralbyrån, 2019)
The price of electricity produced by PEMFC with compressed H2 is 0.50 $/kWhe.
Total required power for compressing H2, hydrogenation and dehydrogenation is 4.55 kWh.
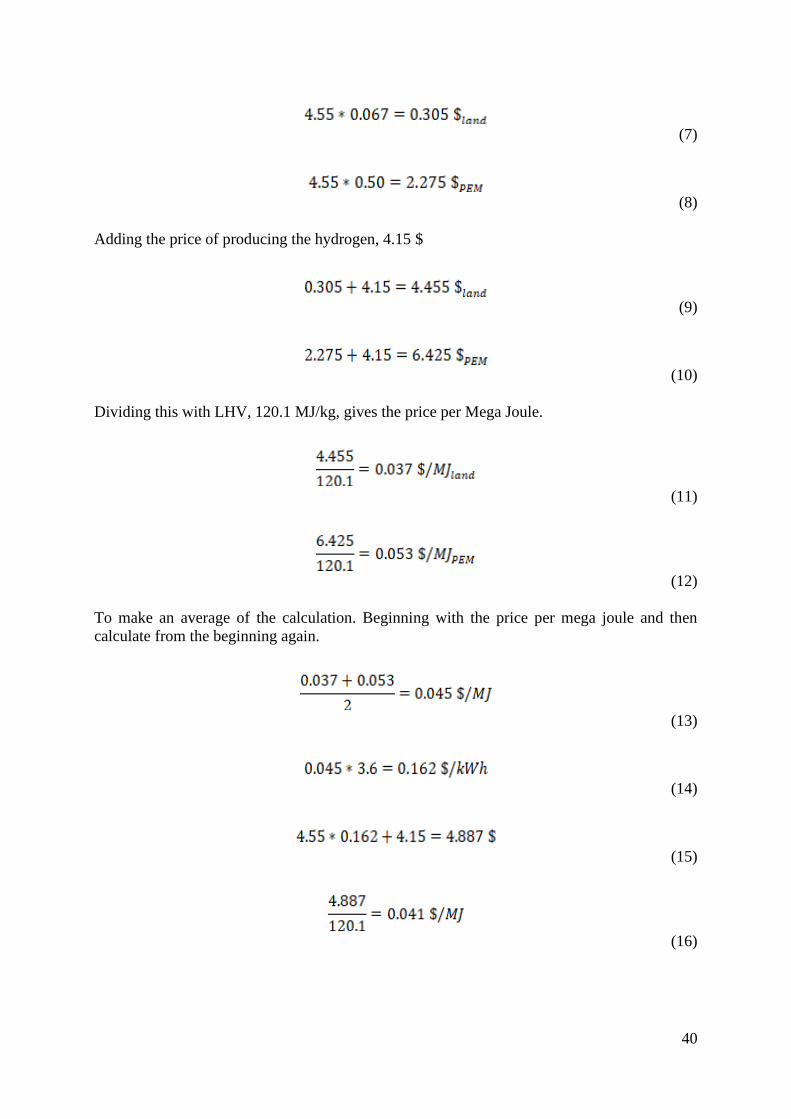
40
(7)
(8)
Adding the price of producing the hydrogen, 4.15 $
(9)
(10)
Dividing this with LHV, 120.1 MJ/kg, gives the price per Mega Joule.
(11)
(12)
To make an average of the calculation. Beginning with the price per mega joule and then
calculate from the beginning again.
(13)
(14)
(15)
(16)