Embed Size (px)
Citation preview
Jack Brouwer, Ph.D.Director
March 20, 2019
In-Rack Direct DC Powering of Servers with Solid Oxide and Proton
Exchange Membrane Fuel Cells
US DOE H2@Scale Data Center WorkshopSeattle, WA
© Advanced Power and Energy Program 2019 2/28
Fuel Cell Systems for Data Centers
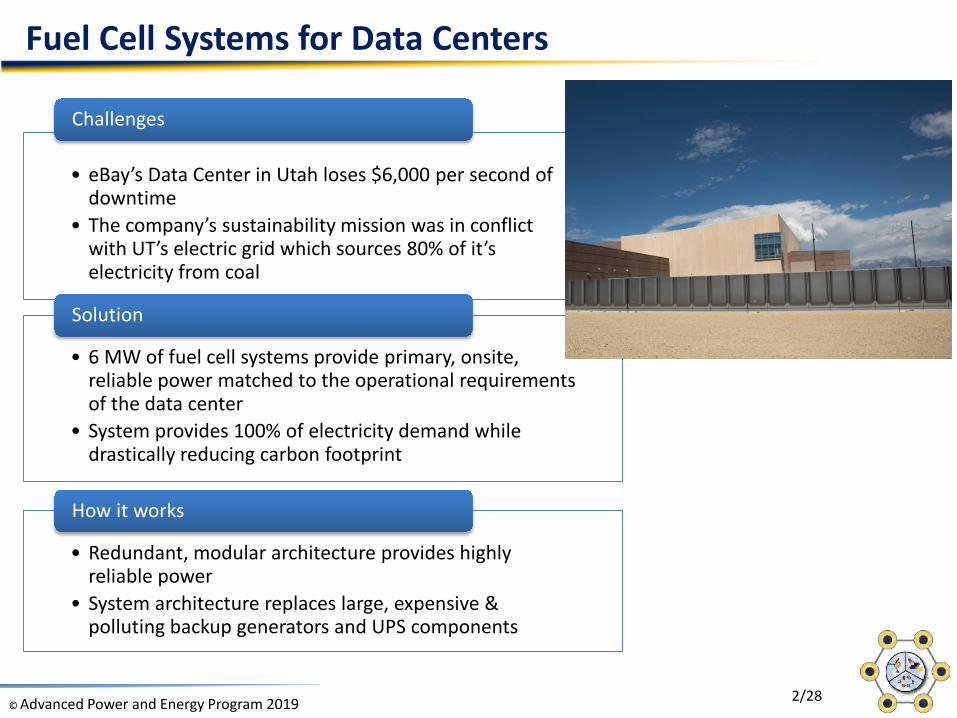
• eBay’s Data Center in Utah loses $6,000 per second of downtime
• The company’s sustainability mission was in conflict with UT’s electric grid which sources 80% of it’s electricity from coal
Challenges
• 6 MW of fuel cell systems provide primary, onsite, reliable power matched to the operational requirements of the data center
• System provides 100% of electricity demand while drastically reducing carbon footprint
Solution
• Redundant, modular architecture provides highly reliable power
• System architecture replaces large, expensive & polluting backup generators and UPS components
How it works
© Advanced Power and Energy Program 2019 3/28
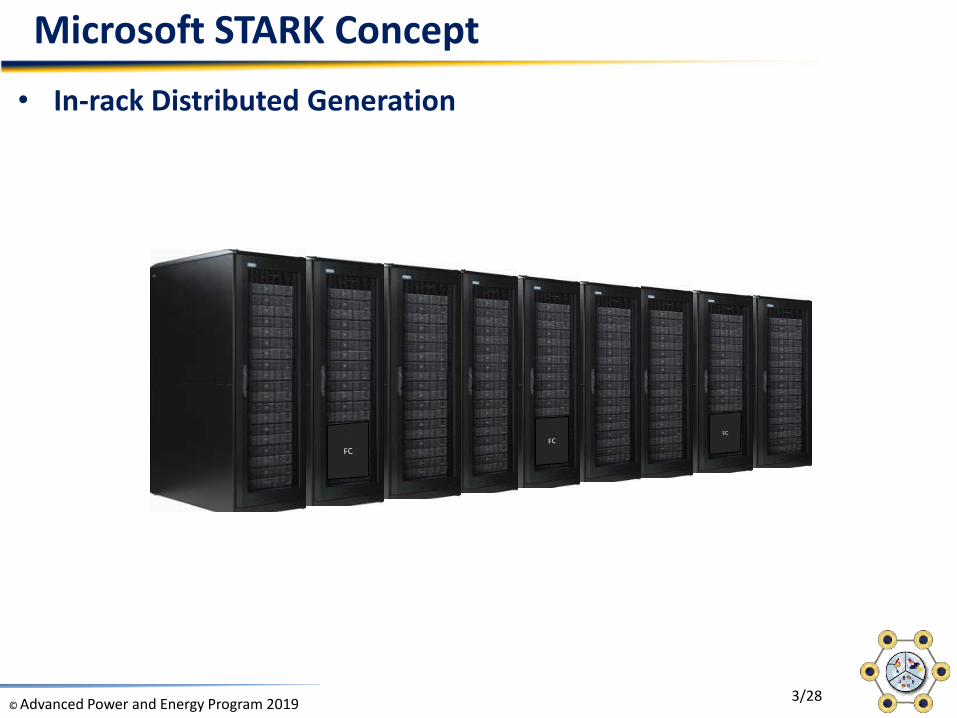
Microsoft STARK Concept• In-rack Distributed Generation
© Advanced Power and Energy Program 2019 4/28
Microsoft STARK ConceptIn-Rack Distributed Generation• A direct generation method that places fuel cells at the rack level
inches from servers– limits the failure domain to a few dozen servers– Low voltage DC direct connection enabled– Equipment such as power distribution units, high voltage transformers,
expensive switchgear, and AC-DC power supplies in servers could be eliminated
• Hybrid fuel cell systems designed, installed and tested – Use of a 10kW PEMFC stack and system as the distributed power source to
power a server rack – Use of a 2.5 kW SOFC stack and system as the distributed DC power source
to power a server rack
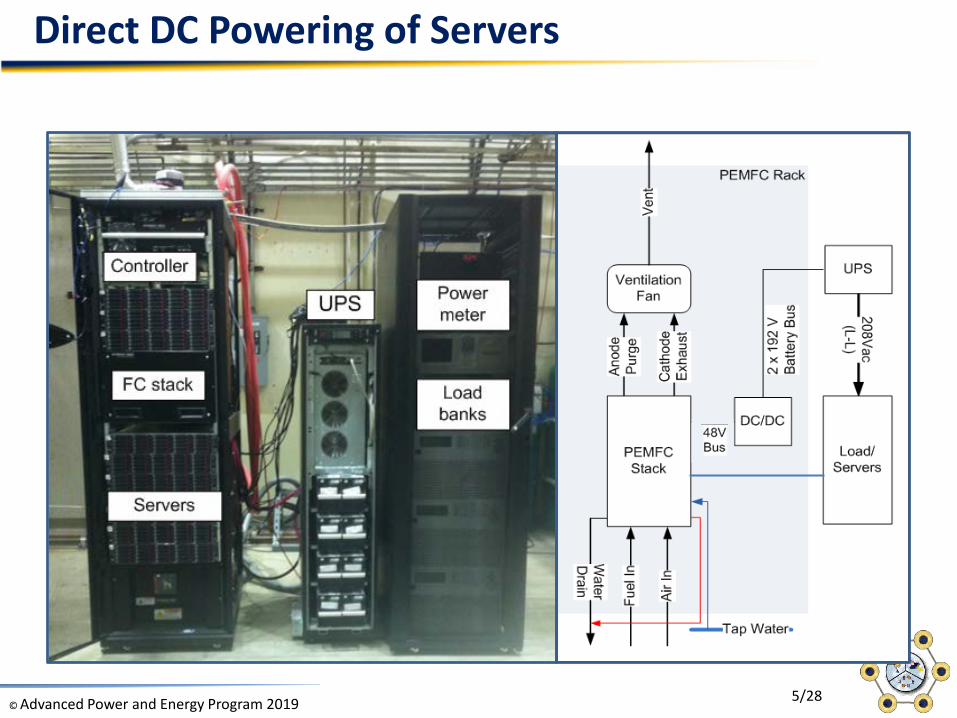
© Advanced Power and Energy Program 2019 5/28
Direct DC Powering of Servers
© Advanced Power and Energy Program 2019 6/28
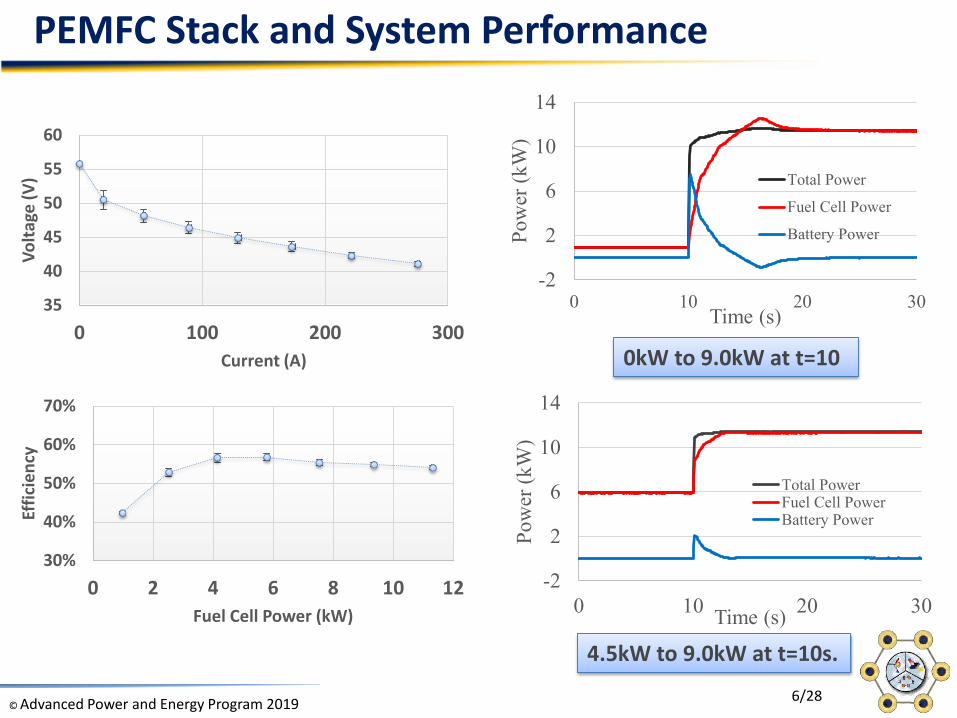
PEMFC Stack and System Performance
30%
40%
50%
60%
70%
0 2 4 6 8 10 12
Effic
ienc
y
Fuel Cell Power (kW)
35
40
45
50
55
60
0 100 200 300
Volta
ge (V
)
Current (A)
-2
2
6
10
14
0 10 20 30
Pow
er (k
W)
Time (s)
Total Power
Fuel Cell Power
Battery Power
0kW to 9.0kW at t=10
-2
2
6
10
14
0 10 20 30
Pow
er (k
W)
Time (s)
Total PowerFuel Cell PowerBattery Power
4.5kW to 9.0kW at t=10s.
© Advanced Power and Energy Program 2019 7/28
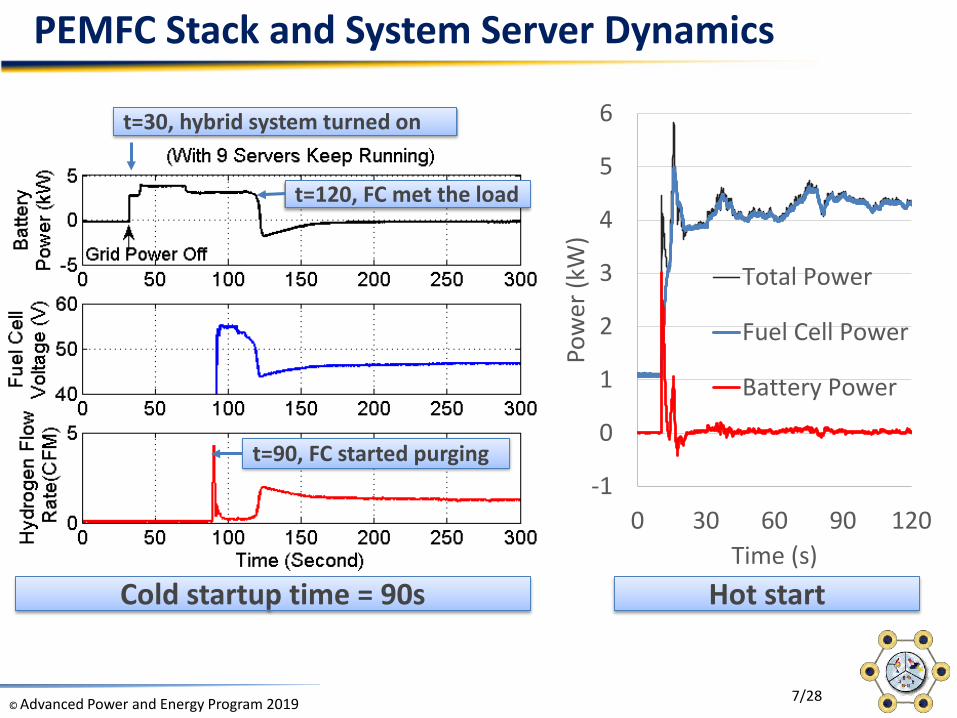
PEMFC Stack and System Server Dynamics
Cold startup time = 90s
t=30, hybrid system turned on
t=90, FC started purging
t=120, FC met the load
-1
0
1
2
3
4
5
6
0 30 60 90 120
Pow
er (k
W)
Time (s)
Total Power
Fuel Cell Power
Battery Power
Hot start
© Advanced Power and Energy Program 2019 8/28
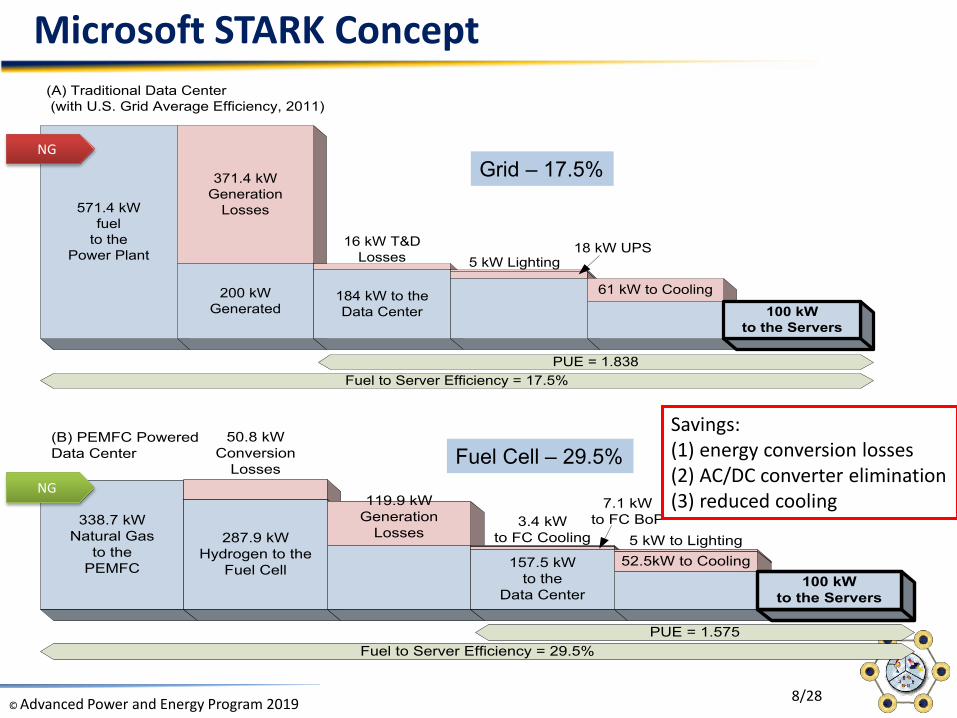
571.4 kWfuel
to the Power Plant
371.4 kWGeneration
Losses
(A) Traditional Data Center (with U.S. Grid Average Efficiency, 2011)
200 kWGenerated
16 kW T&D Losses
184 kW to the Data Center
18 kW UPS
PUE = 1.838Fuel to Server Efficiency = 17.5%
50.8 kW
(B) PEMFC Powered
61 kW to Cooling
5 kW Lighting
100 kW to the Servers
Microsoft STARK Concept
U 838ue to Se e c e cy 5%
338.7 kWNatural Gas
to the PEMFC
50.8 kWConversion
Losses
(B) PEMFC Powered Data Center
287.9 kWHydrogen to the
Fuel Cell
119.9 kW Generation
Losses
7.1 kW to FC BoP
PUE = 1.575Fuel to Server Efficiency = 29.5%
3.4 kW to FC Cooling
157.5 kWto the
Data Center
52.5kW to Cooling100 kW
to the Servers
5 kW to Lighting
NG
NG
Fuel Cell – 29.5%
Grid – 17.5%
Savings: (1) energy conversion losses(2) AC/DC converter elimination(3) reduced cooling
© Advanced Power and Energy Program 2019 9/28
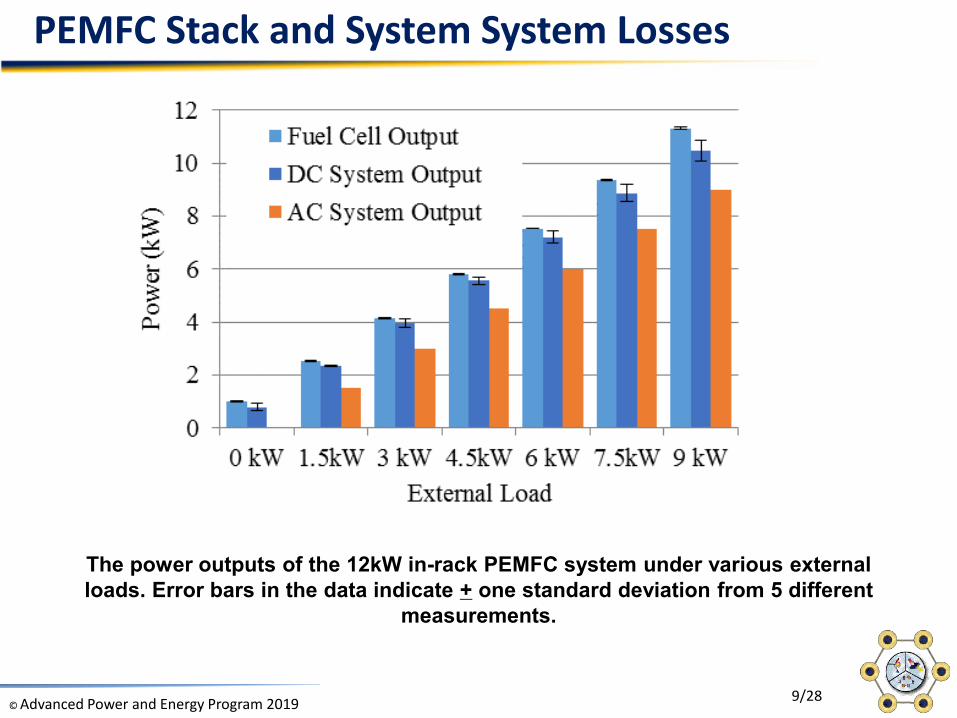
PEMFC Stack and System System Losses
The power outputs of the 12kW in-rack PEMFC system under various external loads. Error bars in the data indicate + one standard deviation from 5 different
measurements.
© Advanced Power and Energy Program 2019 10/28
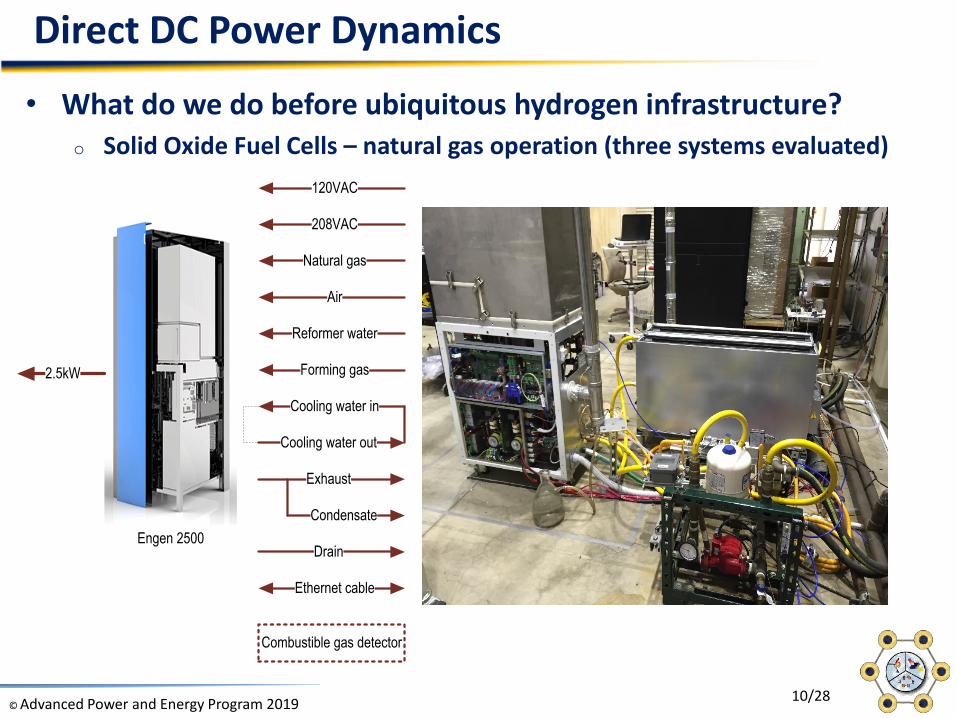
Direct DC Power Dynamics
• What do we do before ubiquitous hydrogen infrastructure?o Solid Oxide Fuel Cells – natural gas operation (three systems evaluated)
Engen 2500
Natural gas
208VAC
120VAC
Cooling water out
Cooling water in
Reformer water
Exhaust
Forming gas
Condensate
2.5kW
Combustible gas detector
Ethernet cable
Drain
Air
© Advanced Power and Energy Program 2019 11/28
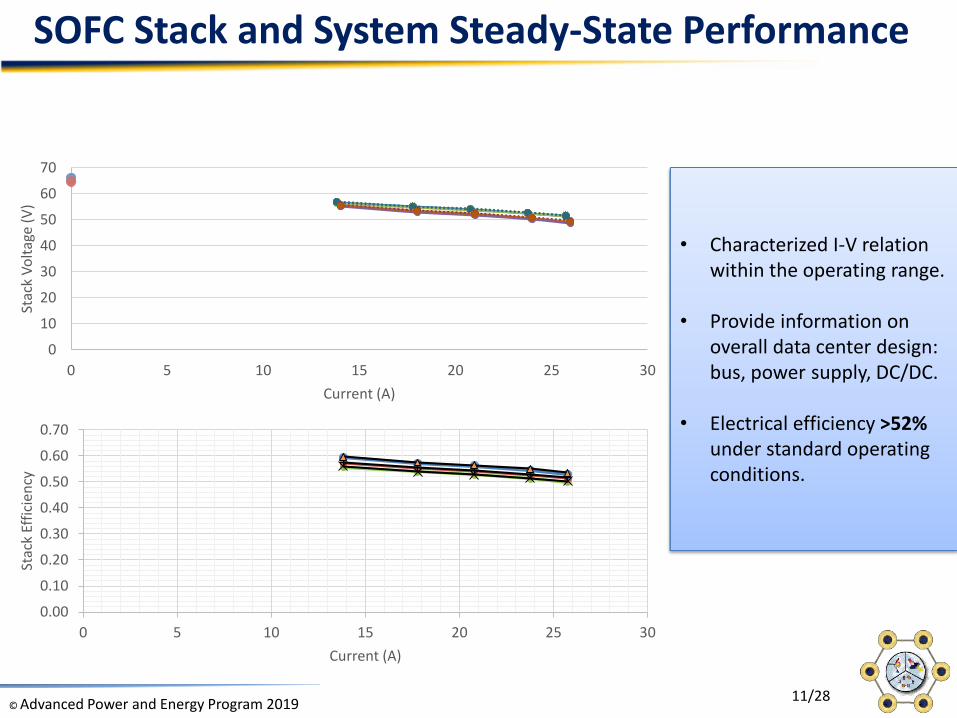
SOFC Stack and System Steady-State Performance
• Characterized I-V relation within the operating range.
• Provide information on overall data center design: bus, power supply, DC/DC.
• Electrical efficiency >52% under standard operating conditions.
0
10
20
30
40
50
60
70
0 5 10 15 20 25 30
Stac
k Vo
ltage
(V)
Current (A)
0.00
0.10
0.20
0.30
0.40
0.50
0.60
0.70
0 5 10 15 20 25 30
Stac
k Ef
ficie
ncy
Current (A)
© Advanced Power and Energy Program 2019 12/28
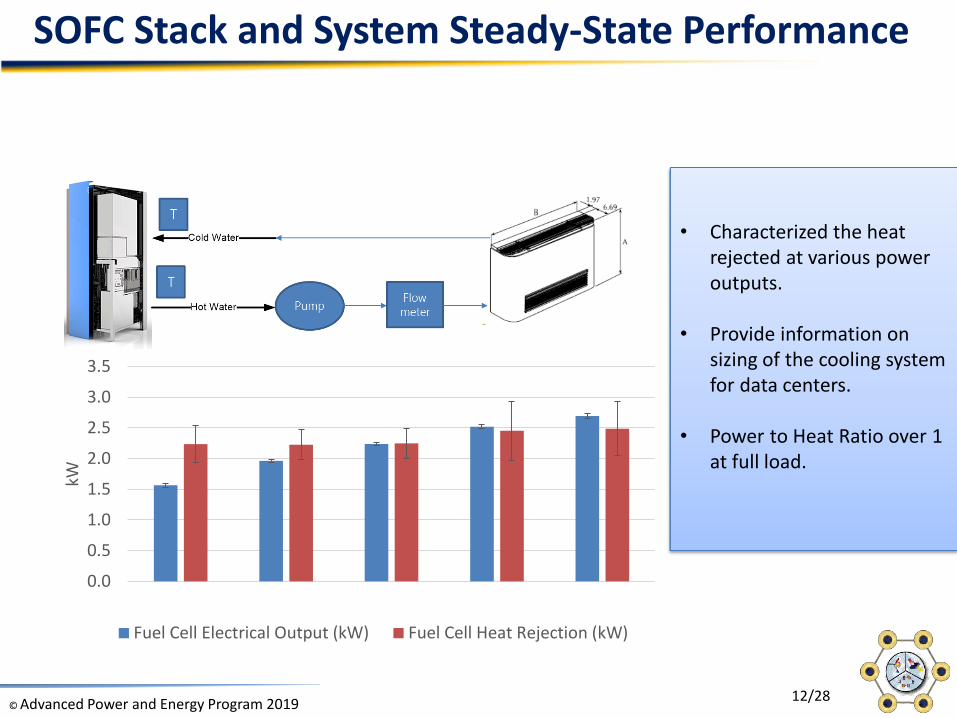
SOFC Stack and System Steady-State Performance
• Characterized the heat rejected at various power outputs.
• Provide information on sizing of the cooling system for data centers.
• Power to Heat Ratio over 1 at full load.
0.0
0.5
1.0
1.5
2.0
2.5
3.0
3.5
kW
Fuel Cell Electrical Output (kW) Fuel Cell Heat Rejection (kW)
© Advanced Power and Energy Program 2019 13/28
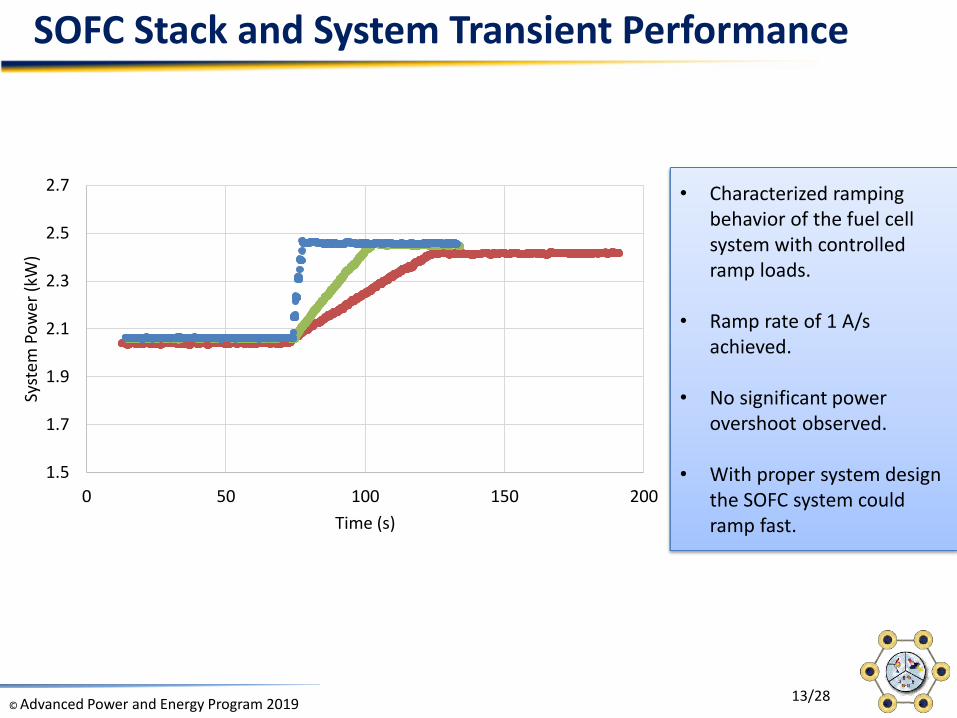
SOFC Stack and System Transient Performance
• Characterized ramping behavior of the fuel cell system with controlled ramp loads.
• Ramp rate of 1 A/s achieved.
• No significant power overshoot observed.
• With proper system design the SOFC system could ramp fast.
1.5
1.7
1.9
2.1
2.3
2.5
2.7
0 50 100 150 200
Syst
em P
ower
(kW
)
Time (s)
© Advanced Power and Energy Program 2019 14/28
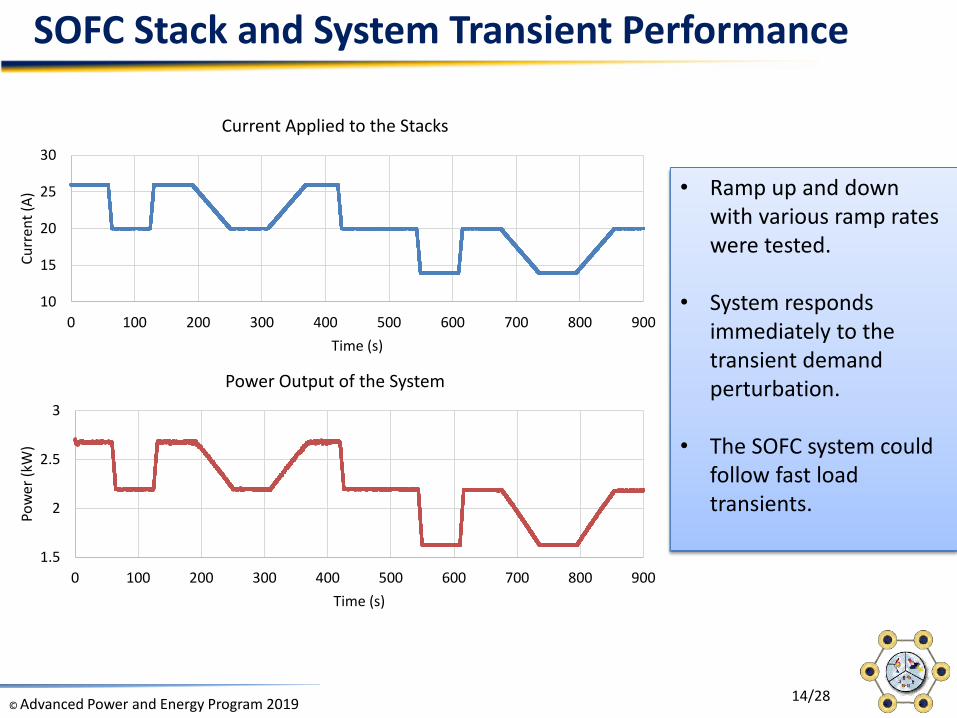
SOFC Stack and System Transient Performance
• Ramp up and down with various ramp rates were tested.
• System responds immediately to the transient demand perturbation.
• The SOFC system could follow fast load transients.
10
15
20
25
30
0 100 200 300 400 500 600 700 800 900
Curr
ent (
A)
Time (s)
Current Applied to the Stacks
1.5
2
2.5
3
0 100 200 300 400 500 600 700 800 900
Pow
er (k
W)
Time (s)
Power Output of the System
© Advanced Power and Energy Program 2019 15/28
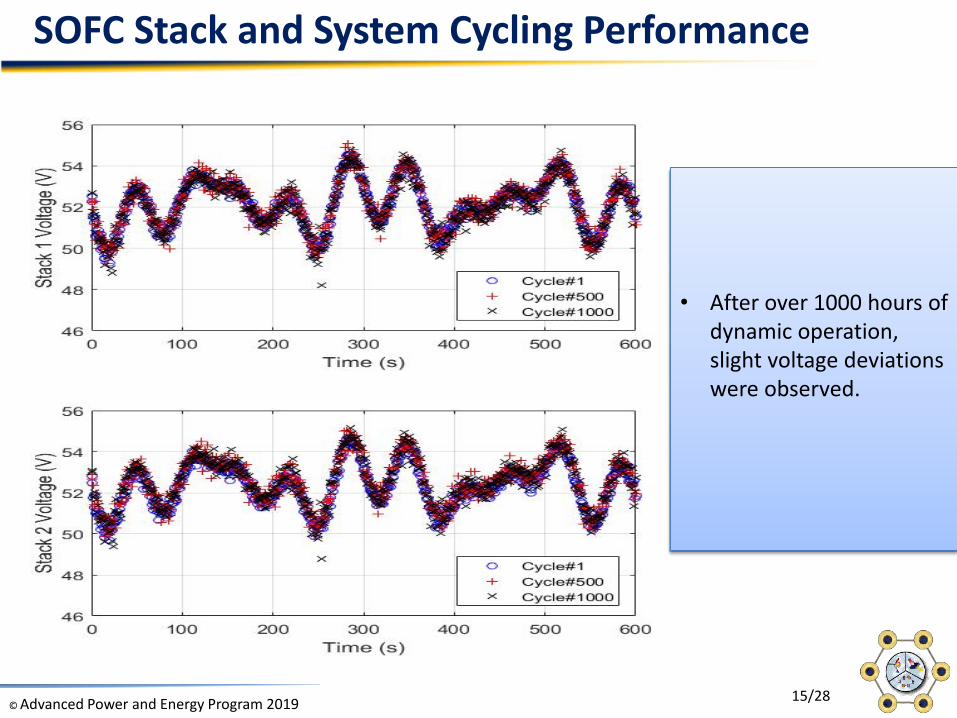
SOFC Stack and System Cycling Performance
• After over 1000 hours of dynamic operation, slight voltage deviations were observed.
© Advanced Power and Energy Program 2019 16/28
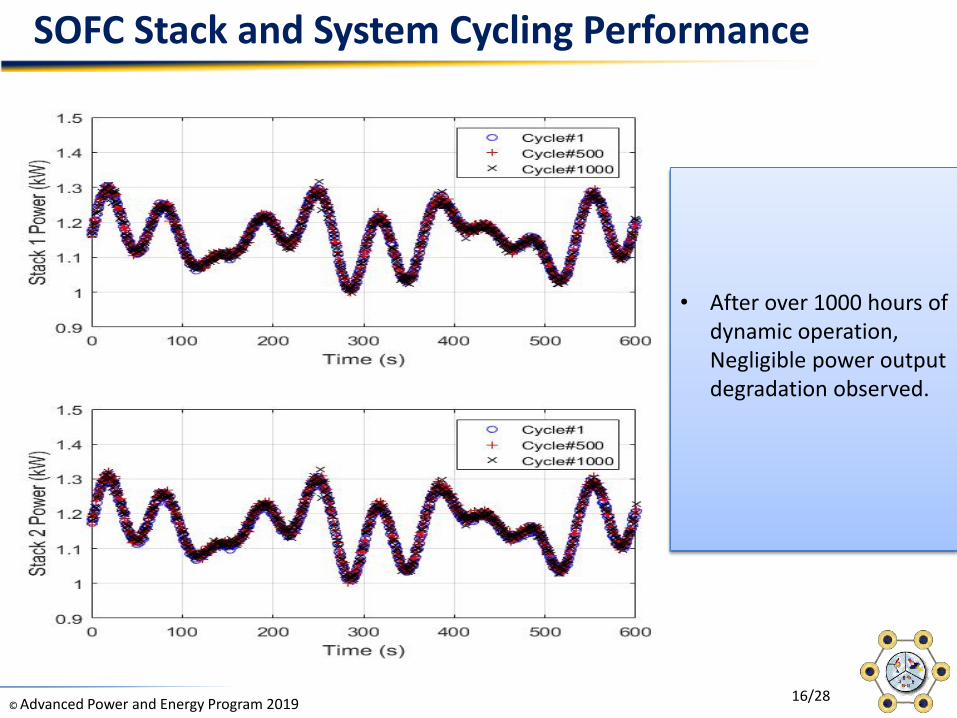
SOFC Stack and System Cycling Performance
• After over 1000 hours of dynamic operation, Negligible power output degradation observed.
© Advanced Power and Energy Program 2019 17/28
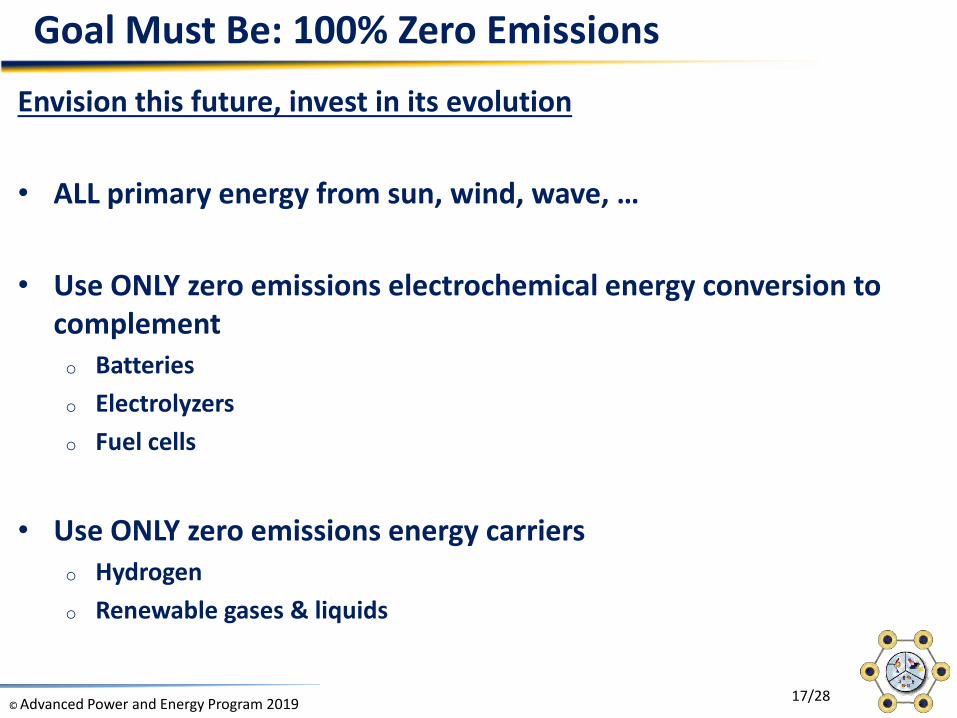
Goal Must Be: 100% Zero Emissions
Envision this future, invest in its evolution
• ALL primary energy from sun, wind, wave, …
• Use ONLY zero emissions electrochemical energy conversion to complemento Batterieso Electrolyzerso Fuel cells
• Use ONLY zero emissions energy carrierso Hydrogeno Renewable gases & liquids
© Advanced Power and Energy Program 2019 18/28
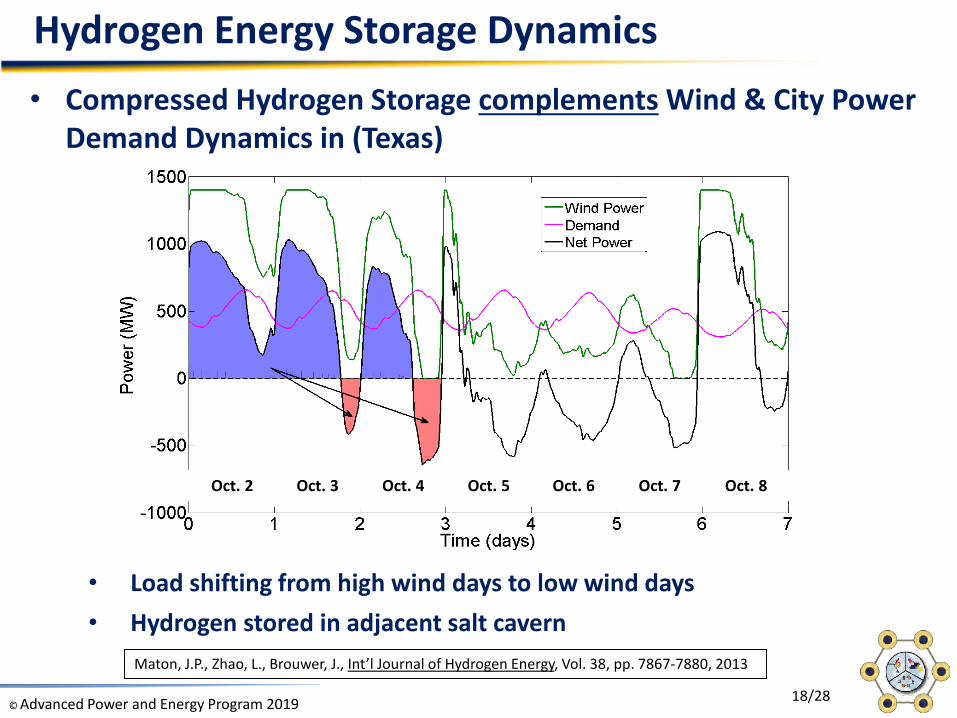
Hydrogen Energy Storage Dynamics
Oct. 2 Oct. 3 Oct. 4 Oct. 5 Oct. 6 Oct. 7 Oct. 8
• Load shifting from high wind days to low wind days• Hydrogen stored in adjacent salt cavern
Maton, J.P., Zhao, L., Brouwer, J., Int’l Journal of Hydrogen Energy, Vol. 38, pp. 7867-7880, 2013
• Compressed Hydrogen Storage complements Wind & City Power Demand Dynamics in (Texas)
© Advanced Power and Energy Program 2019 19/28
Jan Feb Mar Apr May Jun Jul Aug Sep Oct Nov Dec30
45
60
75
90
105
120
135
150
165
Pre
ssure
(B
ar)
Maximum Pressure
Minimum Pressure
280
290
300
310
320
330
340
350
360
370
Tem
pera
ture
(K
)
PressureTemperature
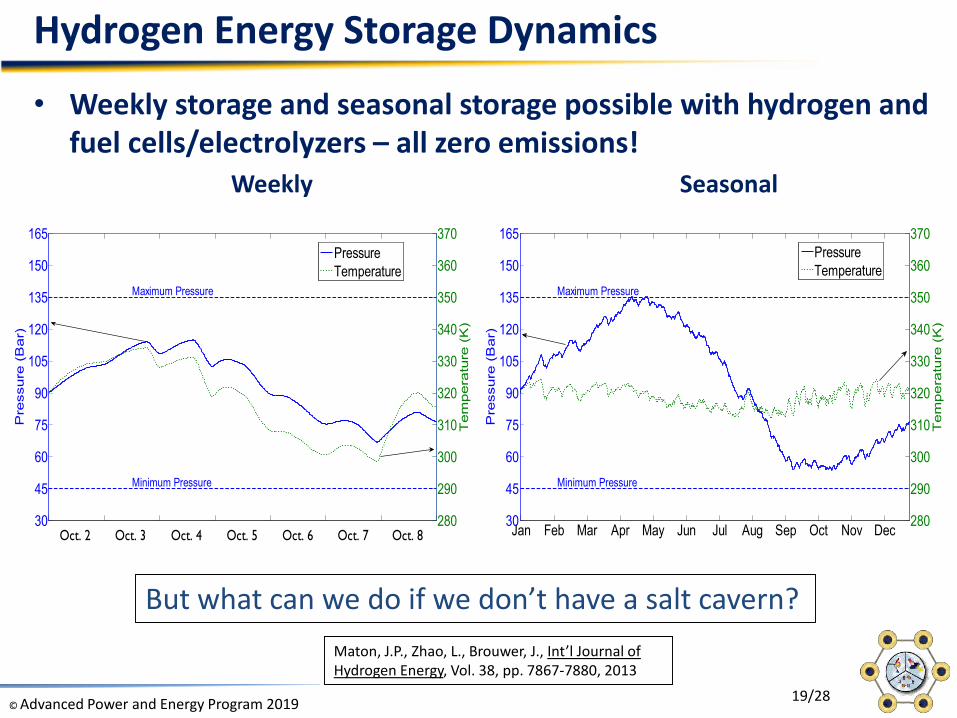
Hydrogen Energy Storage Dynamics
• Weekly storage and seasonal storage possible with hydrogen and fuel cells/electrolyzers – all zero emissions!
Weekly Seasonal
30
45
60
75
90
105
120
135
150
165
Pre
ssure
(B
ar)
Maximum Pressure
Minimum Pressure
280
290
300
310
320
330
340
350
360
370
Tem
pera
ture
(K
)
PressureTemperature
Oct. 2 Oct. 3 Oct. 4 Oct. 5 Oct. 6 Oct. 7 Oct. 8
Maton, J.P., Zhao, L., Brouwer, J., Int’l Journal of Hydrogen Energy, Vol. 38, pp. 7867-7880, 2013
But what can we do if we don’t have a salt cavern?
© Advanced Power and Energy Program 2019 20/28
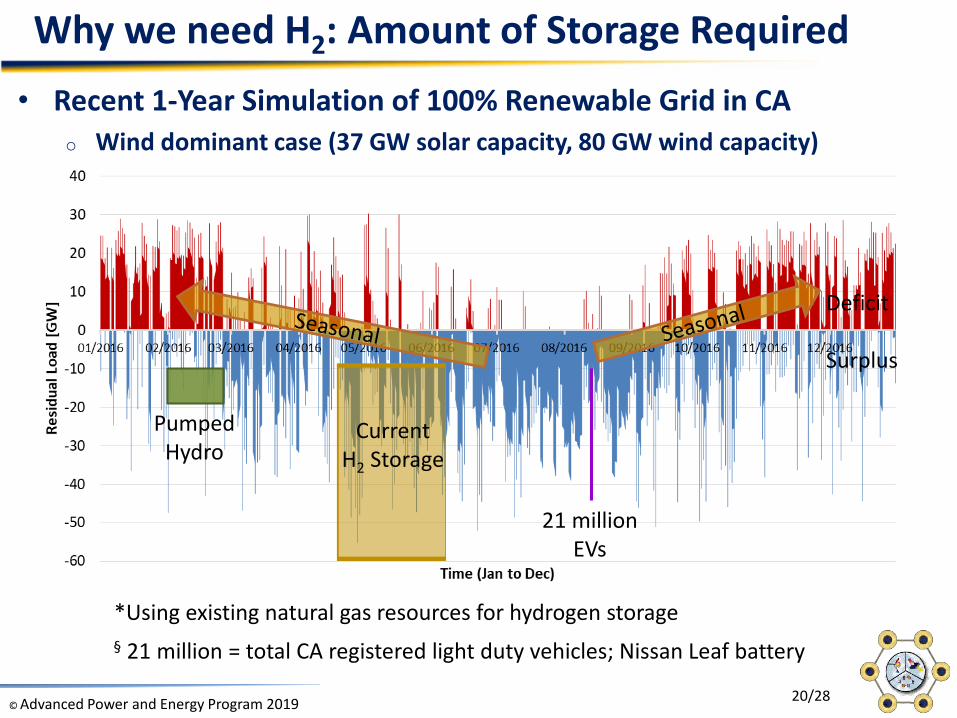
• Recent 1-Year Simulation of 100% Renewable Grid in CAo Wind dominant case (37 GW solar capacity, 80 GW wind capacity)
Why we need H2: Amount of Storage Required
Deficit
Surplus
21 millionEVs
CurrentH2 Storage
PumpedHydro
§ 21 million = total CA registered light duty vehicles; Nissan Leaf battery
*Using existing natural gas resources for hydrogen storage
© Advanced Power and Energy Program 2019 21/28
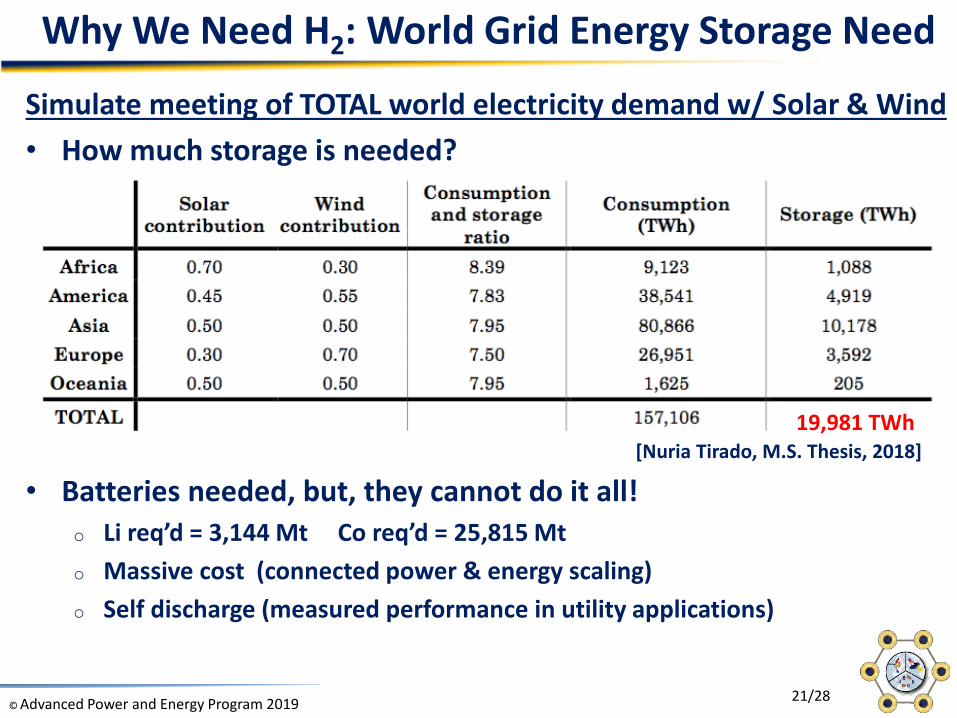
Why We Need H2: World Grid Energy Storage Need
Simulate meeting of TOTAL world electricity demand w/ Solar & Wind• How much storage is needed?
[Nuria Tirado, M.S. Thesis, 2018]
• Batteries needed, but, they cannot do it all!o Li req’d = 3,144 Mt Co req’d = 25,815 Mto Massive cost (connected power & energy scaling)o Self discharge (measured performance in utility applications)
19,981 TWh
© Advanced Power and Energy Program 2019 22/28
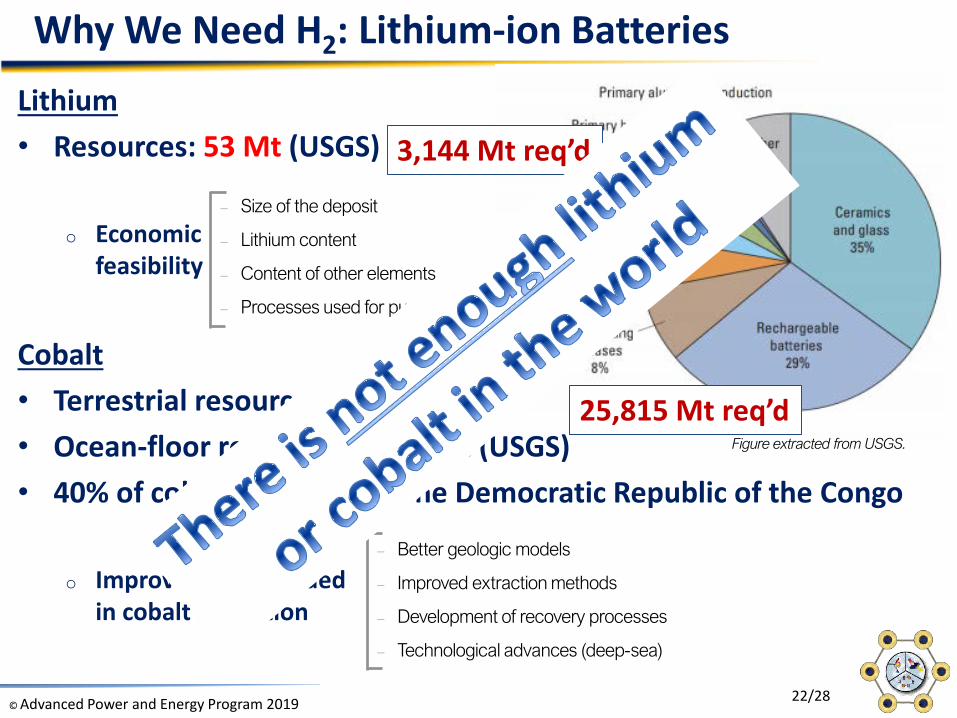
Lithium• Resources: 53 Mt (USGS)
o Economic feasibility
Cobalt• Terrestrial resources: 25 Mt (USGS)• Ocean-floor resources: >120 Mt (USGS)• 40% of cobalt comes from the Democratic Republic of the Congo
o Improvements needed in cobalt extraction
Why We Need H2: Lithium-ion Batteries
– Size of the deposit
– Lithium content
– Content of other elements
– Processes used for purification
– Better geologic models
– Improved extraction methods
– Development of recovery processes
– Technological advances (deep-sea)
Figure extracted from USGS.
3,144 Mt req’d
25,815 Mt req’d
© Advanced Power and Energy Program 2019 23/28
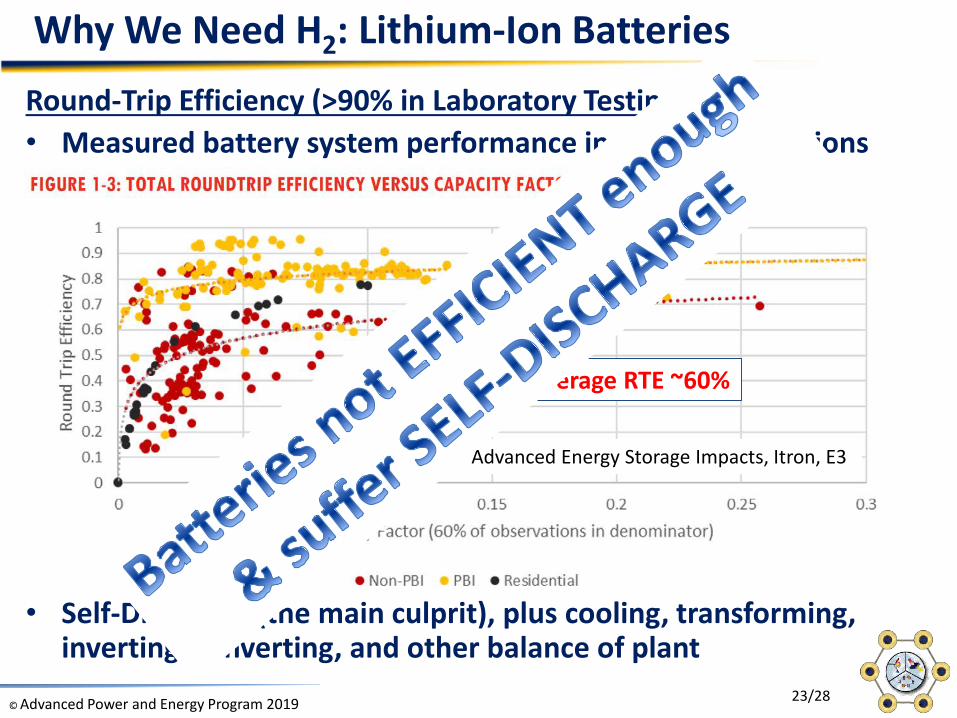
Why We Need H2: Lithium-Ion BatteriesRound-Trip Efficiency (>90% in Laboratory Testing)• Measured battery system performance in Utility Applications
• Self-Discharge (the main culprit), plus cooling, transforming, inverting/converting, and other balance of plant
From: 2017 SGIP Advanced Energy Storage Impacts, Itron, E3
Average RTE ~60%
© Advanced Power and Energy Program 2019 24/28
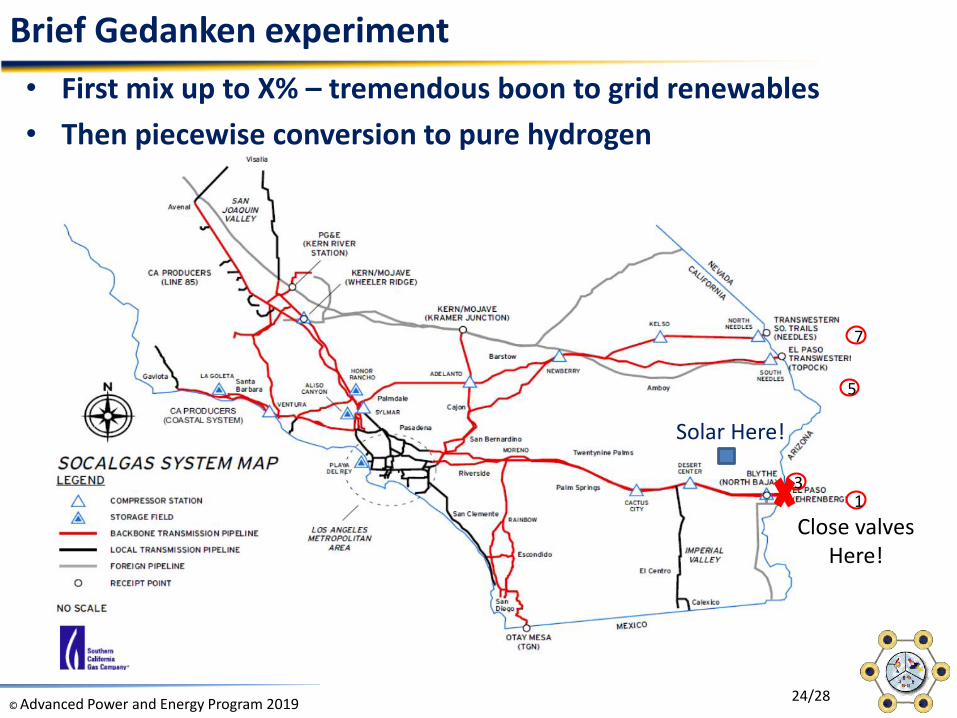
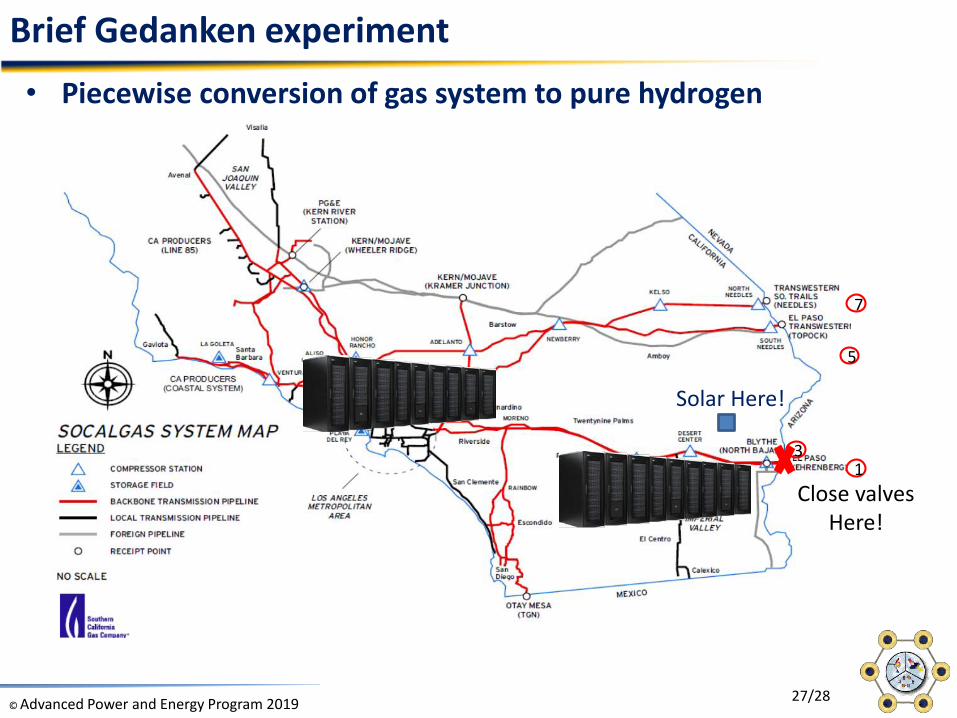
Brief Gedanken experiment• First mix up to X% – tremendous boon to grid renewables• Then piecewise conversion to pure hydrogen
13
7
5
Solar Here!
Close valvesHere!
© Advanced Power and Energy Program 2019 25/28
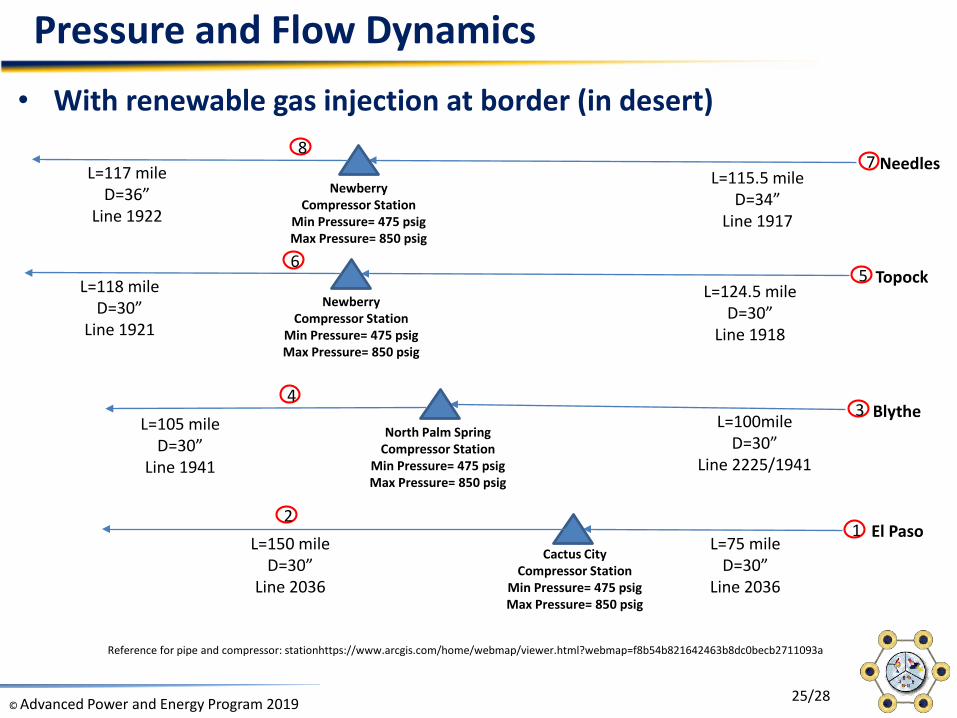
1L=75 mile
D=30”Line 2036
Cactus City Compressor Station
Min Pressure= 475 psigMax Pressure= 850 psig
L=150 mileD=30”
Line 2036
2
3L=100mile
D=30”Line 2225/1941
North Palm SpringCompressor Station
Min Pressure= 475 psigMax Pressure= 850 psig
L=105 mileD=30”
Line 1941
4
5L=124.5 mile
D=30”Line 1918
NewberryCompressor Station
Min Pressure= 475 psigMax Pressure= 850 psig
L=118 mileD=30”
Line 1921
6
7L=115.5 mile
D=34”Line 1917
NewberryCompressor Station
Min Pressure= 475 psigMax Pressure= 850 psig
L=117 mileD=36”
Line 1922
8
El Paso
Needles
Topock
Blythe
Reference for pipe and compressor: stationhttps://www.arcgis.com/home/webmap/viewer.html?webmap=f8b54b821642463b8dc0becb2711093a
Pressure and Flow Dynamics• With renewable gas injection at border (in desert)
© Advanced Power and Energy Program 2019 26/28
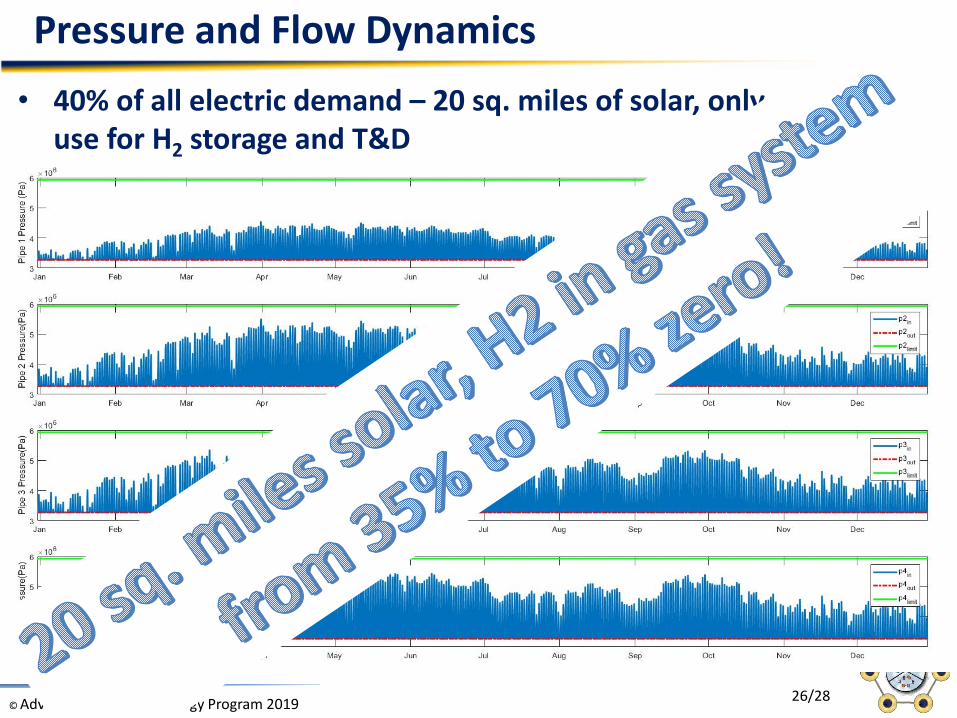
Pressure and Flow Dynamics• 40% of all electric demand – 20 sq. miles of solar, only gas system
use for H2 storage and T&D
© Advanced Power and Energy Program 2019 27/28
Brief Gedanken experiment• Piecewise conversion of gas system to pure hydrogen
13
7
5
Solar Here!
Close valvesHere!
© Advanced Power and Energy Program 2019 28/28
Thank You!