Embed Size (px)
Citation preview
This chapter describes a technique based on meta-analysis for analyzing data from multisite studies.
NEW DIRECTIONS FOR EVALUATION, no. 94, Summer 2002 © Wiley Periodicals, Inc. 45
4
This research is a product of the collaborative effort of the Analysis and TaxonomySubcommittees of the Collaborative Program to Prevent Homelessness. We gratefullyacknowledge the contributions of the investigators: Sara Asmussen, John Brekke, ColleenClark, Kendon Conrad, Kathleen Coughey, Patricia Hanrahan, Charles Reichardt,Alexander Rich, Joann Sacks, Stanley Sacks, Sam Tsemberis, Gregory Teague, and JohnYagelka, as well as Lawrence Rickards, James Herrell, and Cheryl Gallagher of theSubstance Abuse and Mental Health Services Administration (SAMHSA). Thanks alsogo to Pamela Robbins, Roumen Vesselinov, and William Shadish for their comments onan earlier version of this chapter.
This research was supported by grant no. 280–94–0008 from the Center forSubstance Abuse Treatment and the Center for Mental Health Services, SAMHSA, U.S.Department of Health and Human Services. The views presented here are the authors’and do not necessarily represent the official policy or position of SAMHSA.
A Prospective Meta-Analytic Approachin a Multisite Study of HomelessnessPrevention
Steven Banks, Gregory J. McHugo, Valerie Williams,Robert E. Drake, Marybeth Shinn
In the past decade, there has been a proliferation of federally funded multi-site studies. Kraemer (2000) described different types of multisite studies,which range from studies with a single intervention, research protocol, andsubject population to studies that use a common data-gathering protocolbut differ in intervention composition and subject population. She calledthese “multiple collaborating single-site randomized clinical trials” (p. 533).Such was the situation facing our project, and thus, we implemented an ana-lytic method that was appropriate for this type of multisite study.
46 CONDUCTING MULTIPLE SITE EVALUATIONS IN REAL-WORLD SETTINGS
Our approach can be described as a prospective meta-analysis becauseit employs meta-analytic methods that are usually used to summarize pub-lished research in conjunction with the hypothetico-deductive approach toanalyzing clinical trials. These techniques offer a wide range of accessibil-ity to audiences and an ease of testing various alternative hypotheses, mak-ing them potentially applicable to a variety of multisite evaluations. In thischapter, we provide the scientific rationale for the analytic strategy, the sta-tistical formulas to perform the analysis, and an example from a multisitestudy evaluating the effectiveness of various treatment interventions to pre-vent homelessness.
When a meta-analysis of published results is performed, the review’spurpose and research questions are developed. Published results are thenselected by applying specified procedures for locating studies that meetexplicit criteria for inclusion in the analysis. Data are collected from stud-ies by coding study features according to the objectives of the review and aschecks on threats to validity, as well as by transforming study outcomes intoa common metric so they can be combined and compared. The typical met-ric is the effect size, defined as the standardized difference in outcomebetween the average study participant who received a treatment and theaverage participant who did not (or who received a different level of treat-ment). Finally, statistical procedures are used to investigate relationshipsamong study characteristics and findings. When a meta-analytic approachis used to analyze data from a multisite study, many of the central featuresof traditional meta-analysis, such as computation of a study-specific effectsize and exploration of relationships among study characteristics and find-ings, remain integral.
Study Description
In 1996, the Center for Mental Health Services (CMHS) and the Center forSubstance Abuse Treatment (CSAT) of the Substance Abuse and MentalHealth Services Administration (SAMHSA) launched a three-year coopera-tive agreement, the Collaborative Program to Prevent Homelessness(CPPH), to evaluate the effectiveness of various interventions in eight sitesacross the United States (Rickards and others, 1999). This study targetedpersons with psychiatric and substance use disorders who were formerlyhomeless or at risk of homelessness and who were engaged with the men-tal health or substance abuse treatment systems. Eight sites (Chicago,Denver, Los Angeles, Tampa/St. Petersburg, New York City, Philadelphia[two sites], and Washington, D.C.) were selected because they representedcombinations of mental health and substance abuse services with fourstrategies for homelessness prevention: supported housing, residential treat-ment, family support and respite, and representative payee and money man-agement. Across the sites, the population considered to be at risk varied inthe extent and severity of current and lifetime homelessness, mental illness,
PROSPECTIVE META-ANALYTIC APPROACH IN A MULTISITE STUDY 47
and substance abuse. Six sites were mental health programs, and two wereprimarily substance abuse treatment programs. (For a detailed descriptionof the participating sites and CPPH, see Rickards and others, 1999.)
Challenges and Resolutions to the CPPH Cross-SiteAnalysis
Although the CPPH sites were diverse in their settings and approaches, theyhad common components: (1) a connection to, or provision of, a range ofaffordable, safe housing options, (2) flexible case management services ofvarying intensity, (3) linkages to mental health or substance abuse treat-ment, (4) money management, and (5) a range of community support ser-vices. Differences among the interventions centered on the quantity ofservices provided within the five key components and the range of outreachand enrollment procedures.
The settings in which outreach and recruitment were conducted, aswell as the enrollment procedures used, covered various points of entry intothe service system, from street outreach to community mental health agen-cies. There are two important implications of these differences. First, par-ticipants recruited into the intervention settings were at different pointsalong the homeless continuum, and these points of entry mirrored risk fac-tors that have been identified as pathways to homelessness. Some partici-pants were homeless at the time of recruitment, whereas others may havebeen actively engaged in the treatment system but lacking the appropriatesupports needed to maintain housing. Second, participants represented dif-ferent populations (for example, mothers with children in therapeutic com-munities, users of detoxification facilities, people living on the streets) thatdid not simply reflect differences in stage of homelessness.
Additional site differences posed challenges for the development of across-site analytic framework. First, sites used different methods for assign-ing participants to treatment (that is, intervention programs) and compar-ison groups. Some sites used random assignment, and others used aquasi-experimental design with naturally formed groups. Second, differ-ences in intervention and comparison programs exist across sites; that is,the comparison group at one site may have been similar to the interventiongroup at another site. To address this difference in study groups across sites,we developed and used a set of program-level contrasts to classify the sites.
Program-level data were collected on the intervention components ateach site in the domains of housing, case management, and other servicesand treatment foci. This information was obtained with the ProgramCharacteristics Measure (PCM) (Teague and others, 2000; Policy ResearchAssociates, 2001), which was completed for each of the study groups at allsites, allowing comparisons to be made between intervention and compar-ison group scores on items in the three overarching domains. Each PCMitem was rated on a scale from 1 to 5. A rating of 1 indicated that the component
48 CONDUCTING MULTIPLE SITE EVALUATIONS IN REAL-WORLD SETTINGS
was not characteristic of the program, whereas a 5 meant that the compo-nent was very characteristic of the program. For example, the first item inthe housing domain, “control of housing stock,” was defined as “the agencycontrols access to housing so that it can guarantee availability to study par-ticipants.” A score of 1 on this item indicated that the agency had no con-trol over housing stock, and a score of 5 meant that an agency couldguarantee access to respondents (that is, the agency owned all buildings inwhich housing was located or had vouchers for all housing units offered toparticipants). Teague and others (2000) describe the development and useof PCM in the CPPH cross-site analysis.
Contrast scores on each PCM item were calculated by subtracting thescore for each site’s comparison group from the score for that site’s inter-vention group. Principal investigators agreed that a contrast score of 2 ormore (absolute value) represented the cutoff for determining whether therewas a meaningful difference between the two study groups at each site.Thus, a site would be considered to have no contrast on a PCM item if bothintervention and comparison groups scored high on the item or if both groupsscored low; that is, a contrast is a function not of the experimental treat-ment but of the difference between the experimental and comparison con-ditions at a particular site.
The Prospective Meta-Analytic Method
The prospective meta-analytic approach employed five sequential steps, allbased on the calculation of site-level effect sizes. First, we examined the over-all difference between the intervention and comparison groups across sites,using a meta-analytic approach to summarize and weight data from each ofthe sites. Second, we examined whether there was significant heterogeneityof effect sizes across sites. Third, given heterogeneity, we attempted to modelit using a priori contrasts on the specific components of interventions at thedifferent sites. Fourth, given a contrast accounting for significant variance,we examined the sensitivity of the test to the inclusion of particular sites.Confidence increases if the results are not dependent on the inclusion of par-ticular sites in the overall analysis. Finally, we tested moderators to deter-mine whether conclusions held across demographic groups and groups thatdiffered on baseline characteristics relevant to the interventions. This laststep did not depend on the previous ones; for example, moderating effectscan be tested whether an overall effect is found or is homogeneous.
The prospective component of this analytic strategy borrows heavilyfrom randomized clinical trial literature. The first prospective decision wasto analyze the data in an intent-to-treat model; that is, an individual initiallyin the intervention group (whether randomized or self-selected) is consid-ered in this group regardless of whether he or she makes use of the inter-vention services. This preserves the design features of a randomized study.A second decision was to identify a small set of primary outcome measures
PROSPECTIVE META-ANALYTIC APPROACH IN A MULTISITE STUDY 49
for analysis of the intervention effect. If there is a significant overall inter-vention effect or significant intervention effect heterogeneity, additionalanalyses can be performed without controlling for the multiplicity of sta-tistical tests (Snedecor and Cochran, 1980). If significant differences existamong the effects across the sites, then these differences need to be mod-eled with program-level factors. Furthermore, the sensitivity of the resultsshould be examined to see if particular sites dominate the conclusions(Greenhouse and Iyengar, 1994). Third, these program-level factors needto be identified in advance of examining the outcomes. Fourth, potentialparticipant-level moderator variables should be identified before the analy-ses of the outcomes. The a priori nature of the decisions increases the sta-tistical interpretability of the resulting p values. All of these a priori stepswere taken in the multisite analysis outlined here and justify describing themeta-analysis as prospective.
Computing Site-Specific Effect Sizes
The computation of an effect size for each project is an essential componentof a prospective meta-analytic approach. In our study, the choice of a mea-sure of effect size for each outcome variable at each study site depended onwhether there were significant differences between intervention and com-parison groups at baseline. When significant differences did not exist, analy-sis of covariance (ANCOVA) was used to generate the information forcomputing the effect size (see formula 1 in the chapter technical appendix).Groups were presumed to come from the same population, and the intro-duction of the covariate simply increased the precision of the estimate.
When a site’s study groups were not equivalent on the outcome mea-sure of interest at baseline, a standardized mean difference was used tocompute an effect size (see formula 2 in the technical appendix). In this situa-tion, ANCOVA can introduce bias, and regression of each group to itsrespective population mean can be mistakenly interpreted as an effect oftreatment—the so-called Lord’s Paradox (Lord, 1967).
Where samples are small, measures of effect size are upwardly biasedand can be corrected with a simple formula (see formula 3 in the technicalappendix). This adjustment reduces the effect size for studies with seventy-eight or more subjects by less than 1 percent.
Computing a Mean Effect Size
Once an effect size is calculated for each project, an estimate of the averageeffect across all sites is computed. Because sites have different numbers ofsubjects, we computed a weighted mean effect size (see formula 4 in thetechnical appendix).
Having computed the mean effect size and its variability, we can testthe hypothesis that the mean effect size equals zero. This test is the first of
50 CONDUCTING MULTIPLE SITE EVALUATIONS IN REAL-WORLD SETTINGS
several that form the logical hierarchy in the prospective meta-analysis. Forthis hypothesis to be tested, the 95 percent confidence interval is formedaround the mean effect size (see formula 5 in the technical appendix). If theconfidence interval includes zero, we cannot demonstrate any overall effectof the interventions across all sites. If the confidence interval does notinclude zero, the mean effect size is considered to be different from zero.Two questions then arise. First, how big is the effect? Cohen (1977) andLipsey (1990) have provided rules for labeling effect sizes as small, medium,and large. The second question concerning the variability among the siteeffect sizes is discussed in the next section.
For clarity, effect sizes can be converted back into the scale of the out-come variable. In CPPH, the primary outcome variables were measures oftime in various residential settings, so effect sizes were converted back intodays. Days were calculated by multiplying the mean effect size by themedian standard deviation across the sites to yield the difference in the pro-portion of days. We then multiplied this quantity by 180, the approximatenumber of days in a six-month period.
Assessing Heterogeneity of Effect Sizes Among the Sites
Assessing the variability of effect sizes is of substantial scientific interest. Tothe extent that there is significant heterogeneity among the effect sizes, thevariability will be modeled with the program-level variables. In contrast, ifthe effect sizes appear homogeneous, the analysis may proceed to the exam-ination of moderator variables. To assess the degree of heterogeneity amonga group of effect sizes, we used a technique described by Hedges and Olkin(1985). This technique is similar to the analysis of variance and produces achi-square statistic with the number of degrees of freedom equal to one lessthan the number of sites being analyzed (see formula 6 in the technicalappendix). A significant chi-square statistic indicates that significant het-erogeneity exists among the effect sizes, and interest turns to understand-ing the reason.
Modeling the Heterogeneity of Effect Sizes
The Hedges and Olkin (1985) method of examining heterogeneity can alsobe used to test factors associated with the heterogeneity. The approach par-titions the total heterogeneity into components explained by a contrast vari-able and a pooled residual within-groups component. With the CPPHexample, the test of total heterogeneity among the eight sites’ effect sizesproduced a chi-square with seven degrees of freedom. If significant varia-tion is observed, the sites can be disaggregated into two clusters, based ona program-level factor: those with a contrast and those with no contrast.This procedure is repeated first using only sites with a contrast and againusing sites with no contrast. For example, if there are five sites with a contrast
PROSPECTIVE META-ANALYTIC APPROACH IN A MULTISITE STUDY 51
and three with no contrast, the chi-square statistic for sites with a contrastwill have four degrees of freedom, whereas the chi-square for sites with nocontrast will have two degrees of freedom. The theory associated with par-titioning of chi-square statistics indicates that
Total heterogeneity = Heterogeneity within no-contrast group + het-erogeneity within high-contrast group + difference between high- andno-contrast groups
In this formula, the last term is also a chi-square statistic with onedegree of freedom. If this term is significant, the effect of the interventiondiffers significantly between the contrast and no-contrast sites. The othertwo chi-square statistics can be tested separately or pooled to test whethersignificant heterogeneity remains after controlling for this single program-level factor.
Where a significant effect size was observed for a cluster of sites andthe heterogeneity within that cluster was significant, sensitivity analyseswere conducted to determine whether the effect was the consequence of asingle project (Greenhouse and Iyengar, 1994). There are a number of waysto accomplish this test of sensitivity. One is to remove each site’s effect size,one at a time, from the analysis and to repeat the computations. With thisapproach, the power of the multisite analysis is reduced, as computationsare now on seven sites, with fewer cases. A second method is to replace theeffect size for the site with the largest impact with the next largest effect sizeobserved. This serves to pull the largest effect size toward the mean of theother sites in its cluster. If reanalysis indicates that the significant effect ismaintained, confidence in its robustness increases.
The extent to which respondent characteristics moderated site-leveleffects can also be examined with the partitioning of a chi-square approach.For CPPH, we used a set of participant-level covariates (gender, for exam-ple) as a method to reduce further the heterogeneity of effects observed anddetermine whether programs were differentially successful for individualswith particular characteristics. For example, the effect of gender, contrast,and a gender-by-contrast interaction could all be estimated with the parti-tioned chi-squares.
The sensitivity, or robustness, of these analyses is also of interest. Aweaker test of robustness was employed by removing individual sites anddetermining whether there was a change in the direction of the interaction,computed as the difference score between the two covariate groups (malesversus females, for example) across the two clusters.
Results Using a Single Outcome Variable
In this section, we use one of the primary outcome measures, stable hous-ing, to illustrate the prospective meta-analytic method. Stable housing wascomputed from the Residential Follow-Back Calendar data as described in
52 CONDUCTING MULTIPLE SITE EVALUATIONS IN REAL-WORLD SETTINGS
more detail elsewhere (Policy Research Associates, 2001). Days in stablehousing is the sum of the days spent during the interview period in therespondent’s own single room occupancy (SRO) unit, apartment or house,a supportive SRO, long-term transitional housing program or group home,or the apartment or house (long term) of the respondent’s parent orguardian or someone else. Because interview periods varied in duration, wecalculated the proportion of days in these settings in the interview period.
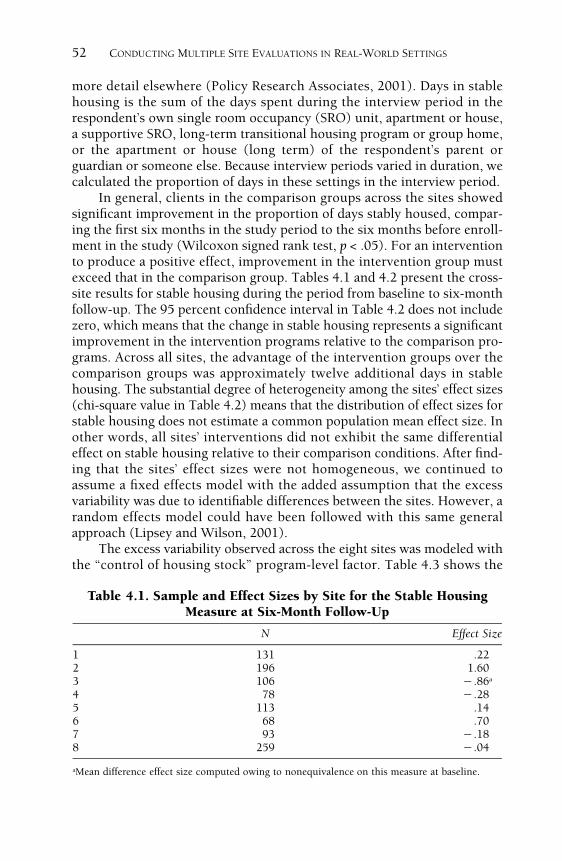
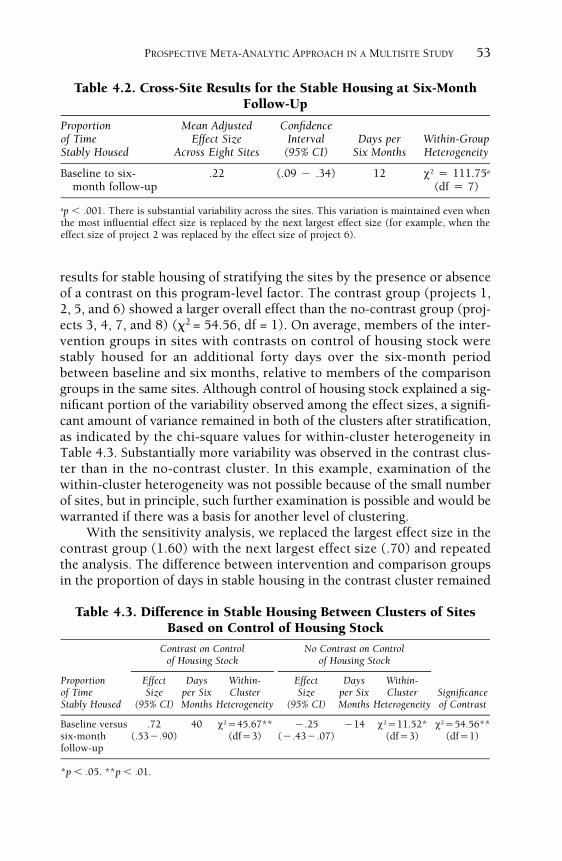
In general, clients in the comparison groups across the sites showedsignificant improvement in the proportion of days stably housed, compar-ing the first six months in the study period to the six months before enroll-ment in the study (Wilcoxon signed rank test, p < .05). For an interventionto produce a positive effect, improvement in the intervention group mustexceed that in the comparison group. Tables 4.1 and 4.2 present the cross-site results for stable housing during the period from baseline to six-monthfollow-up. The 95 percent confidence interval in Table 4.2 does not includezero, which means that the change in stable housing represents a significantimprovement in the intervention programs relative to the comparison pro-grams. Across all sites, the advantage of the intervention groups over thecomparison groups was approximately twelve additional days in stablehousing. The substantial degree of heterogeneity among the sites’ effect sizes(chi-square value in Table 4.2) means that the distribution of effect sizes forstable housing does not estimate a common population mean effect size. Inother words, all sites’ interventions did not exhibit the same differentialeffect on stable housing relative to their comparison conditions. After find-ing that the sites’ effect sizes were not homogeneous, we continued toassume a fixed effects model with the added assumption that the excessvariability was due to identifiable differences between the sites. However, arandom effects model could have been followed with this same generalapproach (Lipsey and Wilson, 2001).
The excess variability observed across the eight sites was modeled withthe “control of housing stock” program-level factor. Table 4.3 shows the
Table 4.1. Sample and Effect Sizes by Site for the Stable HousingMeasure at Six-Month Follow-Up
N Effect Size
1 131 .222 196 1.603 106 �.86a
4 78 �.285 113 .146 68 .707 93 �.188 259 �.04
aMean difference effect size computed owing to nonequivalence on this measure at baseline.
PROSPECTIVE META-ANALYTIC APPROACH IN A MULTISITE STUDY 53
results for stable housing of stratifying the sites by the presence or absenceof a contrast on this program-level factor. The contrast group (projects 1,2, 5, and 6) showed a larger overall effect than the no-contrast group (proj-ects 3, 4, 7, and 8) (�2 = 54.56, df = 1). On average, members of the inter-vention groups in sites with contrasts on control of housing stock werestably housed for an additional forty days over the six-month periodbetween baseline and six months, relative to members of the comparisongroups in the same sites. Although control of housing stock explained a sig-nificant portion of the variability observed among the effect sizes, a signifi-cant amount of variance remained in both of the clusters after stratification,as indicated by the chi-square values for within-cluster heterogeneity inTable 4.3. Substantially more variability was observed in the contrast clus-ter than in the no-contrast cluster. In this example, examination of thewithin-cluster heterogeneity was not possible because of the small numberof sites, but in principle, such further examination is possible and would bewarranted if there was a basis for another level of clustering.
With the sensitivity analysis, we replaced the largest effect size in thecontrast group (1.60) with the next largest effect size (.70) and repeatedthe analysis. The difference between intervention and comparison groupsin the proportion of days in stable housing in the contrast cluster remained
Table 4.2. Cross-Site Results for the Stable Housing at Six-MonthFollow-Up
Proportionof TimeStably Housed
Mean AdjustedEffect Size
Across Eight Sites
ConfidenceInterval
(95% CI)Days per
Six MonthsWithin-GroupHeterogeneity
Baseline to six-month follow-up
.22 (.09 � .34) 12 v2 � 111.75a
(df � 7)
ap � .001. There is substantial variability across the sites. This variation is maintained even whenthe most influential effect size is replaced by the next largest effect size (for example, when theeffect size of project 2 was replaced by the effect size of project 6).
Table 4.3. Difference in Stable Housing Between Clusters of SitesBased on Control of Housing Stock
Contrast on Controlof Housing Stock
No Contrast on Controlof Housing Stock
Proportionof TimeStably Housed
EffectSize
(95% CI)
Daysper SixMonths
Within-Cluster
Heterogeneity
EffectSize
(95% CI)
Daysper SixMonths
Within-Cluster
HeterogeneitySignificanceof Contrast
Baseline versussix-monthfollow-up
.72(.53�.90)
40 v2�45.67**(df�3)
�.25(�.43�.07)
�14 v2�11.52*(df�3)
v2�54.56**(df�1)
*p � .05. **p � .01.
54 CONDUCTING MULTIPLE SITE EVALUATIONS IN REAL-WORLD SETTINGS
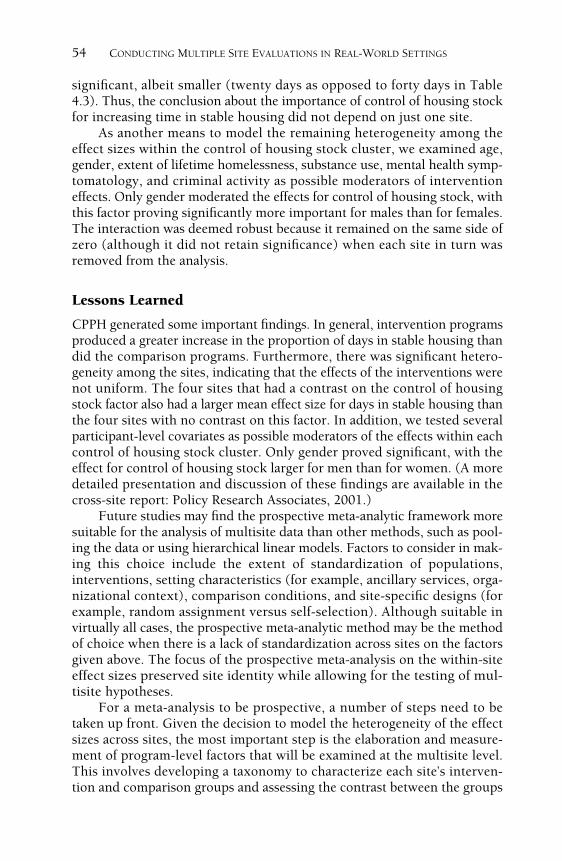
significant, albeit smaller (twenty days as opposed to forty days in Table4.3). Thus, the conclusion about the importance of control of housing stockfor increasing time in stable housing did not depend on just one site.
As another means to model the remaining heterogeneity among theeffect sizes within the control of housing stock cluster, we examined age,gender, extent of lifetime homelessness, substance use, mental health symp-tomatology, and criminal activity as possible moderators of interventioneffects. Only gender moderated the effects for control of housing stock, withthis factor proving significantly more important for males than for females.The interaction was deemed robust because it remained on the same side ofzero (although it did not retain significance) when each site in turn wasremoved from the analysis.
Lessons Learned
CPPH generated some important findings. In general, intervention programsproduced a greater increase in the proportion of days in stable housing thandid the comparison programs. Furthermore, there was significant hetero-geneity among the sites, indicating that the effects of the interventions werenot uniform. The four sites that had a contrast on the control of housingstock factor also had a larger mean effect size for days in stable housing thanthe four sites with no contrast on this factor. In addition, we tested severalparticipant-level covariates as possible moderators of the effects within eachcontrol of housing stock cluster. Only gender proved significant, with theeffect for control of housing stock larger for men than for women. (A moredetailed presentation and discussion of these findings are available in thecross-site report: Policy Research Associates, 2001.)
Future studies may find the prospective meta-analytic framework moresuitable for the analysis of multisite data than other methods, such as pool-ing the data or using hierarchical linear models. Factors to consider in mak-ing this choice include the extent of standardization of populations,interventions, setting characteristics (for example, ancillary services, orga-nizational context), comparison conditions, and site-specific designs (forexample, random assignment versus self-selection). Although suitable invirtually all cases, the prospective meta-analytic method may be the methodof choice when there is a lack of standardization across sites on the factorsgiven above. The focus of the prospective meta-analysis on the within-siteeffect sizes preserved site identity while allowing for the testing of mul-tisite hypotheses.
For a meta-analysis to be prospective, a number of steps need to betaken up front. Given the decision to model the heterogeneity of the effectsizes across sites, the most important step is the elaboration and measure-ment of program-level factors that will be examined at the multisite level.This involves developing a taxonomy to characterize each site’s interven-tion and comparison groups and assessing the contrast between the groups
PROSPECTIVE META-ANALYTIC APPROACH IN A MULTISITE STUDY 55
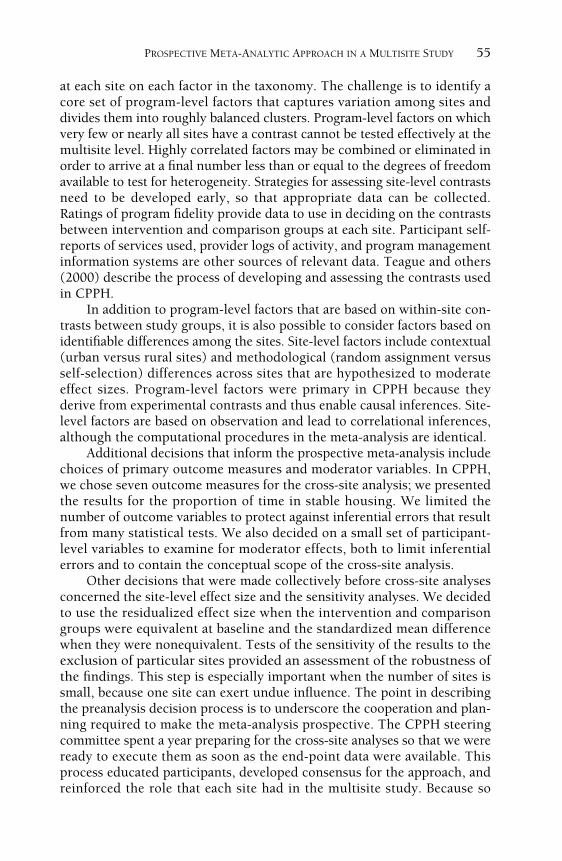
at each site on each factor in the taxonomy. The challenge is to identify acore set of program-level factors that captures variation among sites anddivides them into roughly balanced clusters. Program-level factors on whichvery few or nearly all sites have a contrast cannot be tested effectively at themultisite level. Highly correlated factors may be combined or eliminated inorder to arrive at a final number less than or equal to the degrees of freedomavailable to test for heterogeneity. Strategies for assessing site-level contrastsneed to be developed early, so that appropriate data can be collected.Ratings of program fidelity provide data to use in deciding on the contrastsbetween intervention and comparison groups at each site. Participant self-reports of services used, provider logs of activity, and program managementinformation systems are other sources of relevant data. Teague and others(2000) describe the process of developing and assessing the contrasts usedin CPPH.
In addition to program-level factors that are based on within-site con-trasts between study groups, it is also possible to consider factors based onidentifiable differences among the sites. Site-level factors include contextual(urban versus rural sites) and methodological (random assignment versusself-selection) differences across sites that are hypothesized to moderateeffect sizes. Program-level factors were primary in CPPH because theyderive from experimental contrasts and thus enable causal inferences. Site-level factors are based on observation and lead to correlational inferences,although the computational procedures in the meta-analysis are identical.
Additional decisions that inform the prospective meta-analysis includechoices of primary outcome measures and moderator variables. In CPPH,we chose seven outcome measures for the cross-site analysis; we presentedthe results for the proportion of time in stable housing. We limited thenumber of outcome variables to protect against inferential errors that resultfrom many statistical tests. We also decided on a small set of participant-level variables to examine for moderator effects, both to limit inferentialerrors and to contain the conceptual scope of the cross-site analysis.
Other decisions that were made collectively before cross-site analysesconcerned the site-level effect size and the sensitivity analyses. We decidedto use the residualized effect size when the intervention and comparisongroups were equivalent at baseline and the standardized mean differencewhen they were nonequivalent. Tests of the sensitivity of the results to theexclusion of particular sites provided an assessment of the robustness ofthe findings. This step is especially important when the number of sites issmall, because one site can exert undue influence. The point in describingthe preanalysis decision process is to underscore the cooperation and plan-ning required to make the meta-analysis prospective. The CPPH steeringcommittee spent a year preparing for the cross-site analyses so that we wereready to execute them as soon as the end-point data were available. Thisprocess educated participants, developed consensus for the approach, andreinforced the role that each site had in the multisite study. Because so
56 CONDUCTING MULTIPLE SITE EVALUATIONS IN REAL-WORLD SETTINGS
much was decided beforehand, the analyses went very quickly, few deci-sions had to be made by the analysts, and the findings were communicatedeasily to investigators.
What are the advantages and disadvantages of the prospective meta-analytic approach over contemporary methods like hierarchical linear mod-els (or other mixed-effects regression approaches) and structural equationmodels for the analysis of multisite data? Given the relative infancy of thesemethods, this question is difficult to answer until direct comparisonsbetween them are made. In the case of CPPH, the answer is as much practi-cal as it is technical. The prospective meta-analytic approach fit more closelywith the mental models that participants had of the multisite study. Site iden-tity was important, and the analysis had to preserve it in a transparent way.By basing the analysis on the site-level effect sizes, we focused on the site-by-treatment interaction, that is, on the differences among treatment effectsacross the eight sites. Differences among the sites at baseline or due to timealone were deemed secondary and were not part of the analysis plan.
The prospective meta-analytic method also enabled us to compute dif-ferent forms of the effect size across the sites and to conduct appropriate sen-sitivity analyses. These steps would be more complicated and opaque withother statistical techniques. These other techniques (Haddock, Rindskopf,and Shadish, 1998) may produce more accurate estimates of variances,because of their use of the raw data and sophisticated computational algo-rithms, but the extent and importance of this advantage are not known.
One clear limitation of most multisite studies is the lack of statisticalpower to test hypotheses at the multisite level. With only eight sites inCPPH, the power to test program-level factors was minimal, as it would bewith any other statistical approach. This lack of power may underidentifyimportant program-level factors, but those found are likely to be robust. InCPPH, the control of housing stock explained variation in the effect sizesfor residential outcomes across the sites, but other program-level factors didnot. This effect withstood sensitivity tests, and it was further elaborated onby the interaction with gender. These significant effects emerged despite thelack of statistical power. One unanswered question concerns the credibilityof findings that arise from multisite studies that employ a meta-analyticapproach. How will scientists and policymakers view the key findings fromCPPH? Do findings from a coordinated multisite study with a prospectivemeta-analysis deserve more consideration than findings from single-sitestudies and retrospective meta-analyses? The proliferation of multisite stud-ies, especially into realms where conventional levels of standardization arenot possible, will force examination of these questions in the coming years.
Conclusion
Making key analytic decisions prospectively and using an accessibleapproach can make the analysis of multisite data a more collaborative andproductive process. The prospective meta-analytic approach is based on
PROSPECTIVE META-ANALYTIC APPROACH IN A MULTISITE STUDY 57
sound statistical methods and a clear conceptual framework. In multisitestudies where there are specific features of design, measurement, or imple-mentation that result in nonignorable differences among the sites, theprospective meta-analytic approach offers advantages over other approaches.The involvement of all CPPH investigators in decisions concerning theanalysis and the simplicity and focus of the meta-analysis itself were impor-tant advantages of the approach and enhanced the overall quality of themultisite study.
Technical Appendix
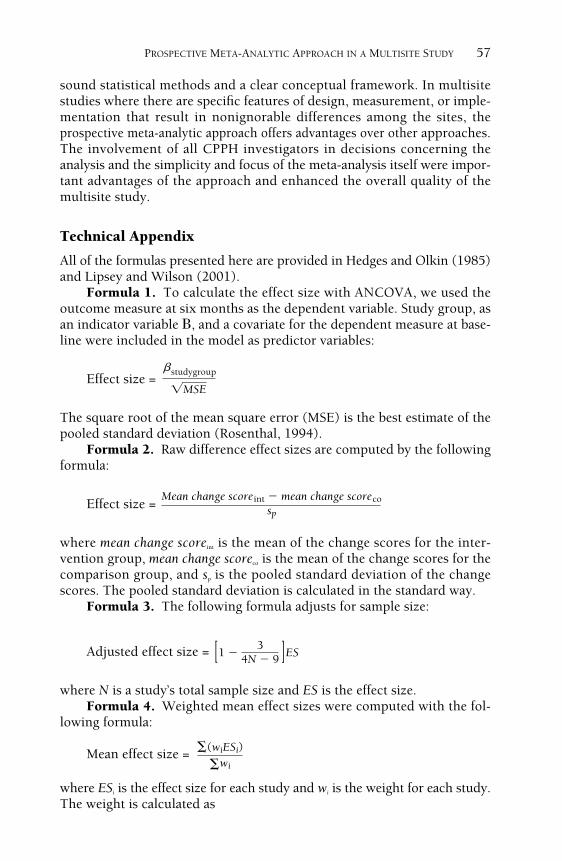
All of the formulas presented here are provided in Hedges and Olkin (1985)and Lipsey and Wilson (2001).
Formula 1. To calculate the effect size with ANCOVA, we used theoutcome measure at six months as the dependent variable. Study group, asan indicator variable �, and a covariate for the dependent measure at base-line were included in the model as predictor variables:
Effect size =
The square root of the mean square error (MSE) is the best estimate of thepooled standard deviation (Rosenthal, 1994).
Formula 2. Raw difference effect sizes are computed by the followingformula:
Effect size =
where mean change scoreint is the mean of the change scores for the inter-vention group, mean change scoreco is the mean of the change scores for thecomparison group, and sp is the pooled standard deviation of the changescores. The pooled standard deviation is calculated in the standard way.
Formula 3. The following formula adjusts for sample size:
Adjusted effect size =
where N is a study’s total sample size and ES is the effect size.Formula 4. Weighted mean effect sizes were computed with the fol-
lowing formula:
Mean effect size =
where ESi is the effect size for each study and wi is the weight for each study.The weight is calculated as
�studygroup
�MSE
Mean change scoreint � mean change scorecosp
[1 � ]ES4N � 9
3
�wi
�(wiESi)
58 CONDUCTING MULTIPLE SITE EVALUATIONS IN REAL-WORLD SETTINGS
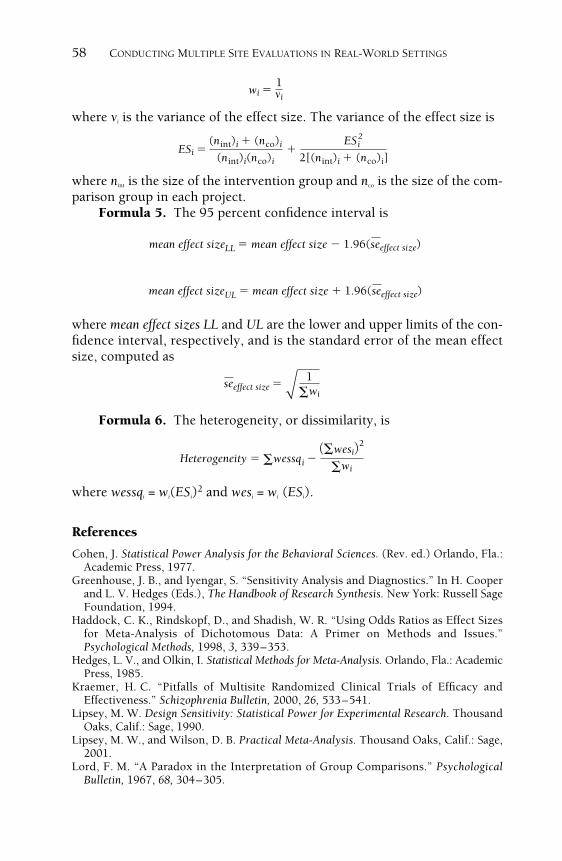
where vi is the variance of the effect size. The variance of the effect size is
where nint is the size of the intervention group and nco is the size of the com-parison group in each project.
Formula 5. The 95 percent confidence interval is
where mean effect sizes LL and UL are the lower and upper limits of the con-fidence interval, respectively, and is the standard error of the mean effectsize, computed as
Formula 6. The heterogeneity, or dissimilarity, is
where wessqi = wi(ESi)2 and wesi = wi (ESi).
References
Cohen, J. Statistical Power Analysis for the Behavioral Sciences. (Rev. ed.) Orlando, Fla.:Academic Press, 1977.
Greenhouse, J. B., and Iyengar, S. “Sensitivity Analysis and Diagnostics.” In H. Cooperand L. V. Hedges (Eds.), The Handbook of Research Synthesis. New York: Russell SageFoundation, 1994.
Haddock, C. K., Rindskopf, D., and Shadish, W. R. “Using Odds Ratios as Effect Sizesfor Meta-Analysis of Dichotomous Data: A Primer on Methods and Issues.”Psychological Methods, 1998, 3, 339–353.
Hedges, L. V., and Olkin, I. Statistical Methods for Meta-Analysis. Orlando, Fla.: AcademicPress, 1985.
Kraemer, H. C. “Pitfalls of Multisite Randomized Clinical Trials of Efficacy andEffectiveness.” Schizophrenia Bulletin, 2000, 26, 533–541.
Lipsey, M. W. Design Sensitivity: Statistical Power for Experimental Research. ThousandOaks, Calif.: Sage, 1990.
Lipsey, M. W., and Wilson, D. B. Practical Meta-Analysis. Thousand Oaks, Calif.: Sage,2001.
Lord, F. M. “A Paradox in the Interpretation of Group Comparisons.” PsychologicalBulletin, 1967, 68, 304–305.
�wi
(�wesi)2
Heterogeneity � �wessqi �
seeffect size � �wi
1
vi
1wi �
(nint)i � (nco)i
(nint)i(nco)i
ESi2
2[(nint)i � (nco)i]ESi � �
mean effect sizeLL � mean effect size � 1.96(seeffect size)
mean effect sizeUL � mean effect size � 1.96(seeffect size)
Policy Research Associates. Final Report: Cross-Site Evaluation of the CollaborativeProgram to Prevent Homelessness. Delmar, N.Y.: Policy Research Associates, 2001.
Rickards, L. D., and others. “Cooperative Agreements for CMHS/CSAT CollaborativeProgram to Prevent Homelessness: An Overview.” Alcoholism Treatment Quarterly,1999, 17, 1–15.
Rosenthal, R. “Parametric Measures of Effect Size.” In H. Cooper and L. V. Hedges(Eds.), The Handbook of Research Synthesis. New York: Russell Sage Foundation, 1994.
Snedecor, G. W., and Cochran, W. G. Statistical Methods. (7th ed.) Ames: Iowa StateUniversity Press, 1980.
Teague, G., and others. “Measurement of Interventions in a Multi-Site Study ofHomelessness Prevention.” Paper presented at the annual meeting of the AmericanPublic Health Association, Boston, Nov. 2000.
STEVEN BANKS is research associate professor of psychiatry at the University ofMassachusetts Medical School, Worcester.
GREGORY J. MCHUGO is research associate professor of psychiatry at DartmouthCollege, Hanover, New Hampshire.
VALERIE WILLIAMS is a research associate with Policy Research Associates,Delmar, New York.
ROBERT E. DRAKE is professor of psychiatry at Dartmouth College, Hanover,New Hampshire.
MARYBETH SHINN is professor of psychology at New York University.
PROSPECTIVE META-ANALYTIC APPROACH IN A MULTISITE STUDY 59