Embed Size (px)
Citation preview

A Prospective Comparison of Two Commercially Available
Hospital Admission Risk Scores
Dale Eric Green, MD MHA FCCP: Chief Medical Information Officer,
Cornerstone Health Care
AMGA April, 2014

Disclosure
I am employed by Cornerstone Health Care, P.A., High Point, NC.
I have no conflicting financial interest in any product or enterprise related to this presentation.

Learning Objectives
• Improve understanding of the science of predictive modeling
• Differentiate predictive models as claims based, clinically based, or combination risk models
• Summarize common commercially available predictive risk model products
• Gain understanding of “real world” application of predictive risk models

Cornerstone Health Care
1995 2014
42 physicians > 250
2 APPs 111 APPs
8 specialties 36 specialties
221 employees > 1800 employees
19 locations 115 locations
1 hospital (High Point) 15 hospitals
29 PCP PCMH level 3

NC County Coverage Map

Value Proposition
Cornerstone Health Care is transforming care delivery in part by stratifying service intensity based upon the needs of the patient. Prospectively identifying patients with the highest resource needs allows earlier intervention and potentially mitigates the risk of the cost and risk of hospitalization.

Risk
*Risk = F(Loss, Probability)
*Healthcare Risk Adjustment and Predictive Modeling, 2011

Commonly Used Risk Scoring Methodologies
• Charlson Comorbidity Score
• CMS – Hierarchical Category Conditions (HCC)
• Optum Symmetry Groups
• Humedica clinical risk scoring
• Many others…

Risk Scoring


OptumTM Impact Pro®
Risk Score
• Uses a member’s clinical episodes of care, prior use of health care services, prescription drugs, and lab results as markers of their future health risk
• Creates markers of risk that can be both predictive and provide clinical insights into why a patient is high risk
• Predicts both future expenditures and calculates the probability of one or more hospitalizations

Symmetry Episode Treatment Groups®


Optum Score Interpretation
• “Future Risk Inpatient” scores range from 0.23 to as high as 31.4 in the study population
• Optum tool also generates and “Inpatient Probability Score” which is approximately 3.13 x Future Risk Inpatient

Humedica® Risk Score
• Different models for DM, CHF, and COPD
• Stepwise logistic regression models developed using demographics and various clinical parameters
• IDN and non-IDN models (prior hospitalizations used as predictive variable in IDN but not non-IDN)

Humedica Score Interpretation
• Scores presented in 2 ways
• Categorized (<80%, >80%,>90%, >95%, >98%)
• Percentile ranked i.e. 0%- 100%
• Optum’s “Inpatient Probability Score” and Humedica’s percentile ranking methodology are very different
• “Likelihood of Disease-related Hospitalization within 6 months”

Risk Score Comparisons
• Likelihood of DM-related Hospitalization within 6 months Categorized [End of Time Period] is defined as the percentile rank indicating the likelihood that the patient will require a hospitalization for diabetes in the 6 months following the specified time period.
• Optum scores are reported as probability of hospital admission in 1 year e.g. there is a 95% probability of hospitalization in 12 months

Humedica Risk Cohorts
• COPD
• CHF
• Adult DM
• Pediatric asthma

Humedica Risk Score Distribution (DM)

Humedica Score Distributions

Optum iPro Score Distribution

Optum iPro Percentile Distribution

Observational Study Design
• Prospectively collected risk scores (June 2014)
• Optum iPro scores, Humedica scores, paid claims for all patients
• Claims data June 1 – Nov 1 analyzed for hospitalizations and ED visits
• Final population – 7901

Optum Results

Humedica COPD Results
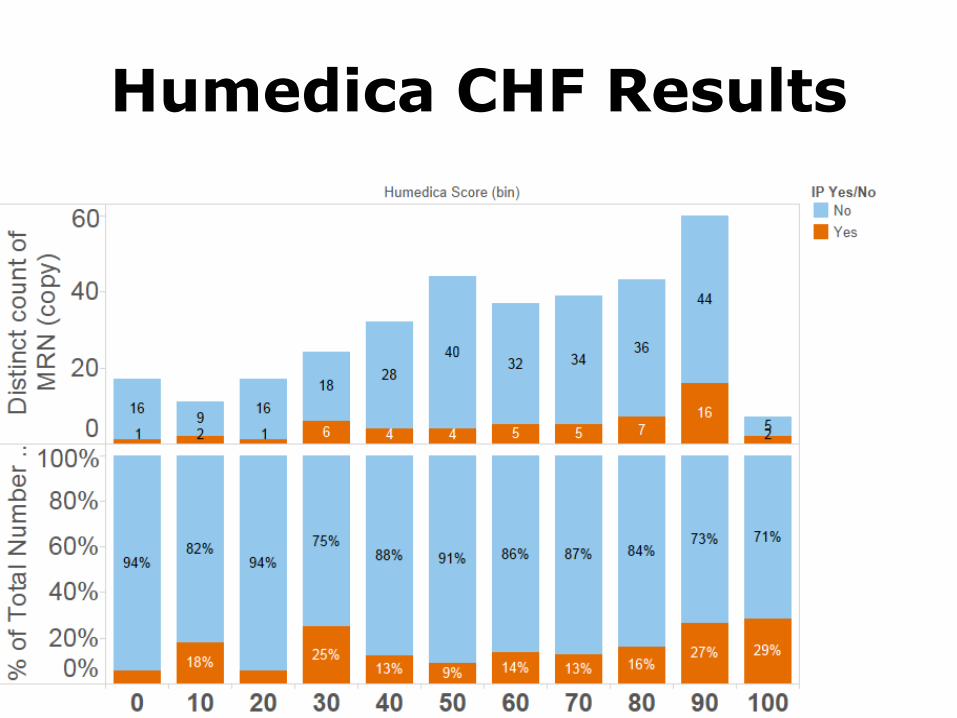
Humedica CHF Results

Humedica DM Results

Humedica Composite Results

Humedica Composite vs Optum
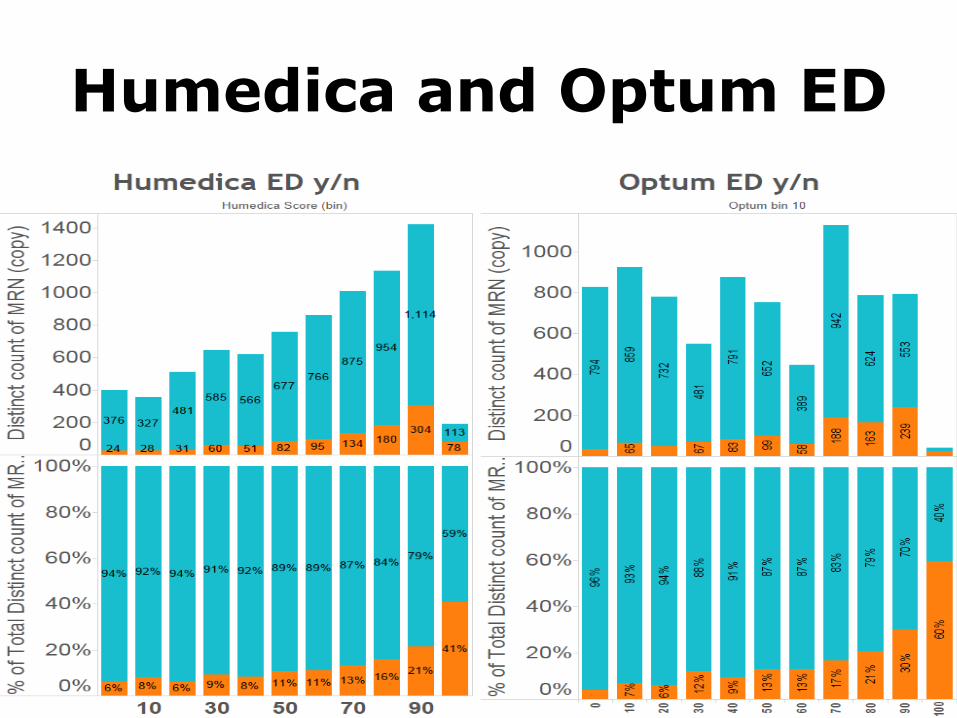
Humedica and Optum ED

Humedica ED + IP

Optum Hospitalization Probability Score

Summary of Findings
• Both scoring systems work but slight edge to Optum
• Scores appear to be equally useful in predicting ED visits

Methodological Limitations
• 6 month observational timeframe
• Claims run out -> incomplete data for 6 months observational period
• Ordinal score comparison between Optum and Humedica and among Humedica disease cohorts is NOT strictly apples to apples
• Population has selection bias. Both groups have increased pre-existing probabilities of higher utilization

Establishing Cut Points
• Balance of true positives, false negatives, false positives, intervention effectiveness, intervention expense, and intervention alternatives
• Receiver Operating Characteristic (ROC) curves and Area Under the Curve (AUC) analysis is one tool in common use
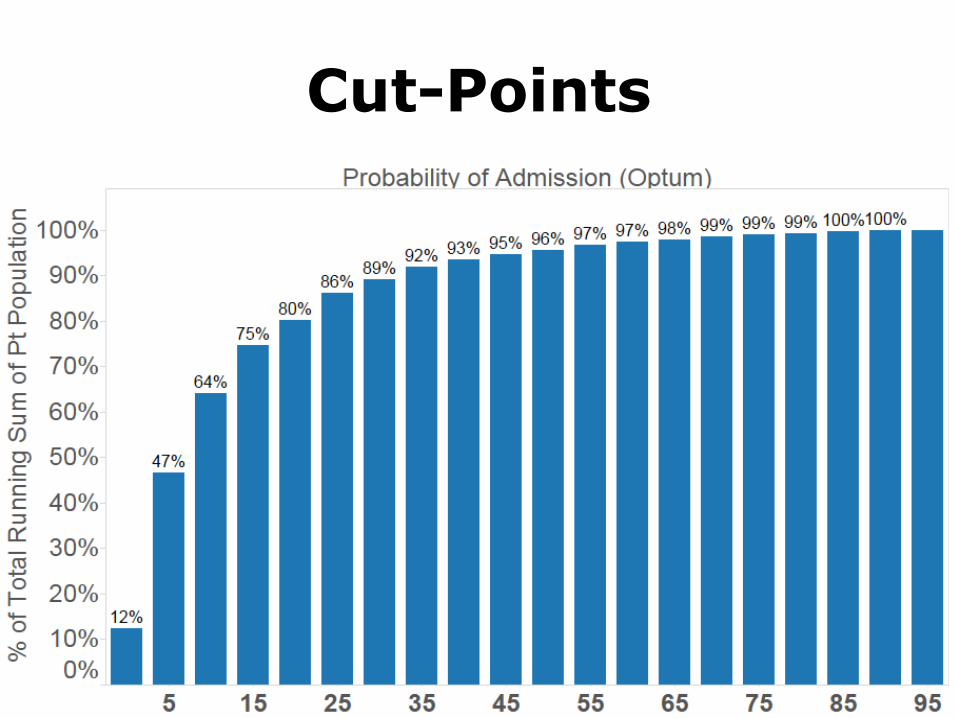
Cut-Points

Program Application at Cornerstone Health Care
• Congestive Heart Failure management clinic
• Poly-chronic clinics
• Patient navigation
• Practice based “encounter specialists”