Embed Size (px)
Citation preview
Glasgow Theses Service http://theses.gla.ac.uk/
n
Leishman, Andrew (2015) The comparison of commercially available coconut water, sports drink and plain water on rehydration and potential benefit for endurance based performance. MSc(R) thesis. http://theses.gla.ac.uk/6596/ Copyright and moral rights for this thesis are retained by the author A copy can be downloaded for personal non-commercial research or study, without prior permission or charge This thesis cannot be reproduced or quoted extensively from without first obtaining permission in writing from the Author The content must not be changed in any way or sold commercially in any format or medium without the formal permission of the Author When referring to this work, full bibliographic details including the author, title, awarding institution and date of the thesis must be given
The comparison of commercially available coconut
water, sports drink and plain water on rehydration
and potential benefit for endurance based
performance.
Written project report, submitted in fulfillment of the requirements for
the Postgraduate degree of Master of Science by Research in
Physiology & Sport Science.
School of Life Science
College of Medical, Veterinary and Life Science
University of Glasgow
Name: Andrew Leishman BSc (Hons) Date: August 2015
0701022
Signed:
2
Contents
Page
Acknowledgements……………………………………………………….... 3
Abstract…………………………………………………………………….. 4
List of Figures……………………………………………………………… 6
List of Tables………………………………………………………………. 9
List of Abbreviations………………………………………………………. 10
Introduction………………………………………………………………… 11
Literature Review…………………………………………………………...16
Methods……………………………………………………………………. 31
Results ……………………………………………………………………... 36
Discussion………………………………………………………………….. 65
Conclusion…………………………………………………………………. 75
References………………………………………………………………….. 76
Appendices………………………………………………………………… 81
3
Acknowledgements
This project was funded by Freedom Brands Ltd, a Glasgow based company who
market and sell the product Go Coco coconut water.
I would also like to thank Nairn Scobie and Lynsey Johnston for their time and
technical assistance throughout this project.
4
Abstract
Dehydration, the loss of bodily water, results in reduced exercise performance. If
athletes become dehydrated, rehydration is essential. Sports drinks are designed
to provide fuel for the exercising athlete, and also to help with rehydration. A
new alternative to commercial sports drinks is coconut water, which naturally
contains electrolytes like potassium, magnesium, calcium and sodium, and natural
sugars like glucose and fructose.
Our aim was to investigate whether coconut water could be used as a more
effective rehydration beverage compared to a sports drink and plain water while
using a 150% fluid replacement strategy. As a secondary aspect to the study we
investigated whether there were any differences in rehydration capacity for
individuals with differing aerobic fitness.
With institutional ethics approval, 16 subjects (22.9 3.2 years; height 1.81
0.06 m; body mass 75.8 10.2 kg; 2OV max 3.98 0.68 l·min-1
) gave written,
informed consent and performed a familiarisation and 3 experimental trials.
Subjects exercised on a cycle ergometer (65% of peak work rate) in an
environmental chamber (temperature 36.7 0.9ºC, relative humidity 91.9
21.2%) until 2-3% body mass was lost. For 2 hours post-exercise, subjects
rehydrated to the equivalent of 150% of body mass lost using coconut water, a
sports drink or plain water, administered in a randomised, double-blind crossover
manner. In these 2 hours, subject’s nude body mass, urine osmolality and blood
glucose were monitored every 30 minutes. Subjects also completed a
questionnaire at each 30 minute interval during rehydration.
No significant differences were seen between the fluids with regards to body mass
regained during the rehydration phase, percentage rehydration or rehydration
index. Significance was found in measurements of urine osmolality between
coconut water and water at the end of the rehydration phase (P < 0.05), but not
between coconut water and the sports drink. With blood glucose, there was a
significantly different profile across time between water and the other two fluids.
5
Although the fitter individuals were found to be able to upregulate sweat rates
compared to the less fit subjects, there was no difference found in the rehydration
capacity of individuals with differing aerobic fitness levels. Interestingly, the fitter
subjects reported feeling more sick throughout the rehydration phase while
rehydrating with a sports drink compared to the less fit individuals, this was not
seen when subjects rehydrated with coconut water.
No significant difference was found between coconut water and the sports drink
for blood glucose response throughout the rehydration phase. Further research
should therefore aim to investigate the potential use of coconut water during
exercise to improve endurance performance.
There is no significant difference between Go Coco coconut water and a
commercially available sports drink when comparing their ability to rehydrate
following dehydrating exercise and that fitter individuals rated feeling more sick
while consuming a sports drink compared to coconut water, it is recommended
that the naturally occurring coconut water would make an ideal alternative to the
manufactured sports drink.
6
List of Figures
Figure Number Page
1: Average body mass of subjects throughout each trial expressed as a percentage
of their initial body mass……………………………………………………38
2: Average body mass of subjects throughout each trial and split into group 1 (<
50 ml·kg-1
·min-1
) and group 2 (> 50 ml·kg-1
·min-1
), expressed as a percentage of
their initial body mass………………………………………………………39
3: Percentage rehydration at the end of the rehydration phase……………. 40
4: Percentage rehydration at the end of the rehydration phase, with subjects split
dependant on aerobic fitness………………………………………………..41
5: Rehydration index of each fluid………………………………………… 42
6: Rehydration index of each fluid, showing subjects split dependant on aerobic
fitness………………………………………………………………………..43
7: Urine osmolality measured at each time point throughout the experimental
trials…………………………………………………………………………44
8: Urine osmolality measured at each time point throughout the experimental trials
with subjects split dependant on aerobic fitness……………………………46
9: Blood glucose measured at each time point throughout the experimental
trials....................................................................................................……... 47
10: Blood glucose measured at each time point throughout the experimental trials,
showing subjects grouped dependant on fitness levels……………………..48
11: Feelings of thirst that the subjects expressed at each time point throughout the
trials………………………………………………….................................. 49
7
Figure Number Page
12: Feelings of thirst that the subjects expressed at each time point throughout the
trials, with subjects divided into groups dependant on aerobic fitness
levels………………………………………………………………………...50
13: Feelings of hunger that the subjects expressed at each time point throughout
the trials…………………………………………………………………….. 51
14: Feelings of hunger that the subjects expressed at each time point throughout
the trials, with subjects divided into groups dependant on aerobic fitness
levels………………………………………………………………………...52
15: Feelings of tiredness that the subjects expressed at each time point throughout
the trials…………………………………………………………………….. 53
16: Feelings of tiredness that the subjects expressed at each time point throughout
the trials, with subjects divided into groups dependant on aerobic fitness
levels………………………………………………………………………...54
17: How dry the subjects thought their mouths felt at each time point throughout
the trials…………………………………………………………………….. 55
18: How dry the subjects thought their mouths felt at each time point throughout
the trials, with subjects divided into groups dependant on aerobic fitness
levels………………………………………………………………………...56
19: How subjects felt the taste in their mouths was at each time point throughout
the trials…………………………………………………………………….. 57
20: How subjects felt the taste in their mouths was at each time point throughout
the trials, with subjects divided into groups dependant on aerobic fitness
levels……………………………………………………………………...…59
8
Figure Number Page
21: How bloated the subjects felt at each time point throughout the trials
……………………………………………………………………... 60
22: How bloated the subjects felt at each time point throughout the trials, with
subjects divided into groups dependant on aerobic fitness levels………….61
23: How sick the subjects felt at each time point throughout the trials……. 62
24: How sick the subjects felt at each time point throughout the trials, with
subjects divided into groups dependant on aerobic fitness levels………….64
9
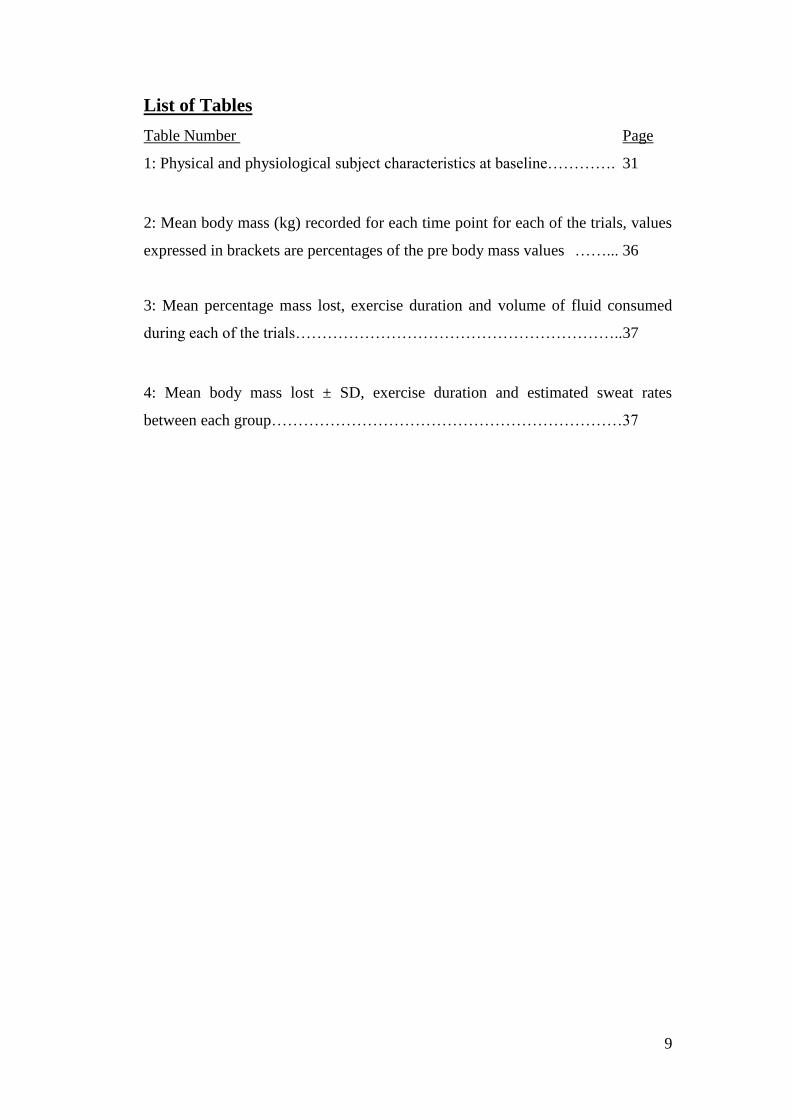
List of Tables
Table Number Page
1: Physical and physiological subject characteristics at baseline…………. 31
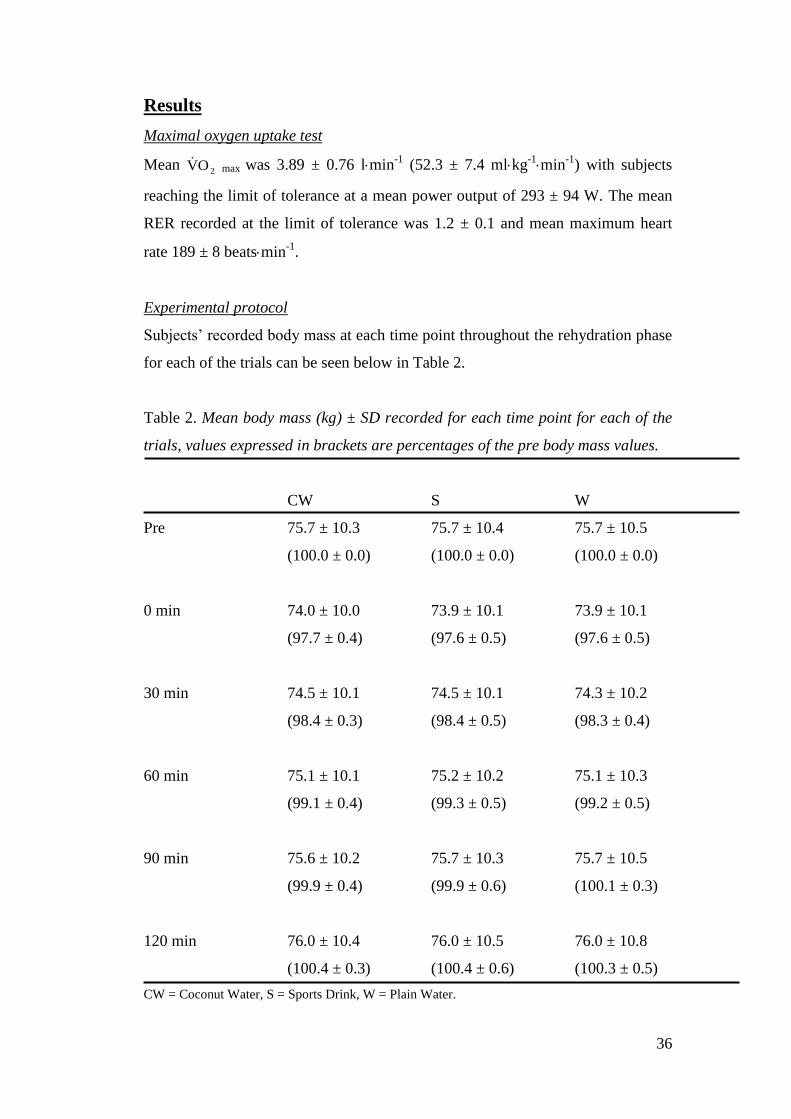
2: Mean body mass (kg) recorded for each time point for each of the trials, values
expressed in brackets are percentages of the pre body mass values ……... 36
3: Mean percentage mass lost, exercise duration and volume of fluid consumed
during each of the trials……………………………………………………..37
4: Mean body mass lost ± SD, exercise duration and estimated sweat rates
between each group…………………………………………………………37
10
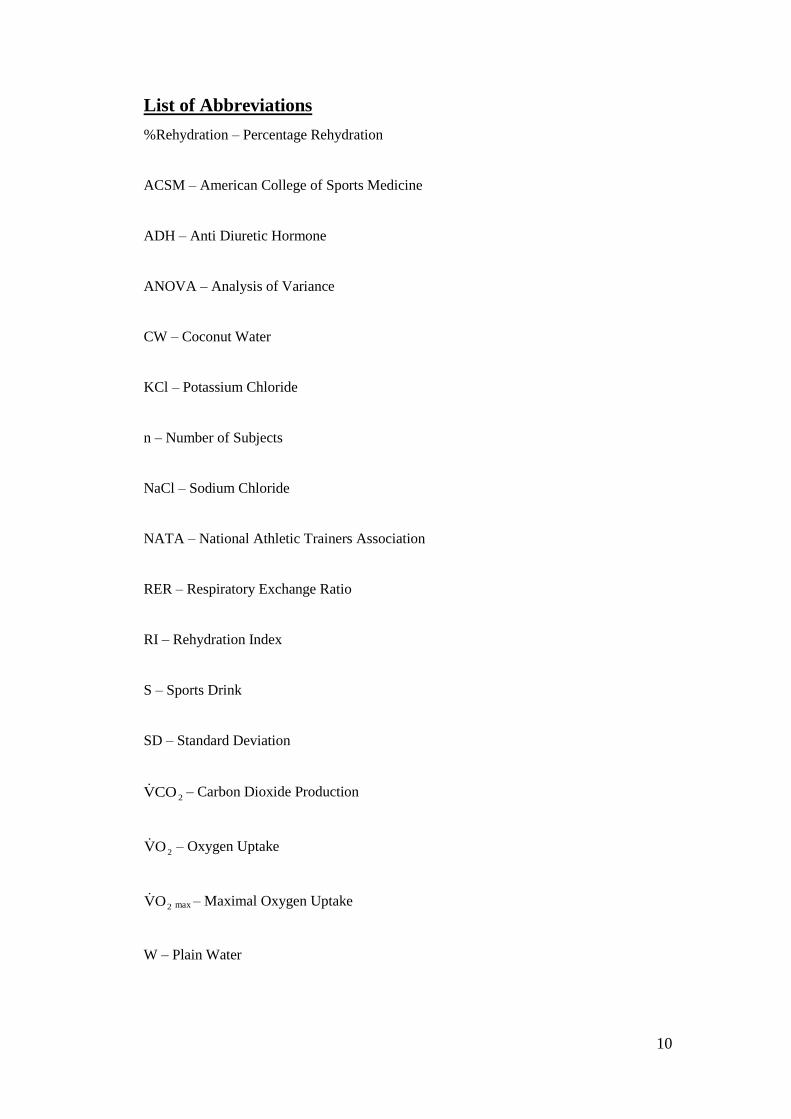
List of Abbreviations
%Rehydration – Percentage Rehydration
ACSM – American College of Sports Medicine
ADH – Anti Diuretic Hormone
ANOVA – Analysis of Variance
CW – Coconut Water
KCl – Potassium Chloride
n – Number of Subjects
NaCl – Sodium Chloride
NATA – National Athletic Trainers Association
RER – Respiratory Exchange Ratio
RI – Rehydration Index
S – Sports Drink
SD – Standard Deviation
2COV – Carbon Dioxide Production
2OV – Oxygen Uptake
2OV max – Maximal Oxygen Uptake
W – Plain Water
11
Introduction
During exercise the requirement for fluid replacement has been a topic of much
debate over the years. Opinions have differed and recommendations have often
moved along a continuum from not drinking at all during exercise to drinking as
much as is tolerable (Noakes, 2007). This is not a subject to be taken lightly as
hydration can have detrimental effects on the health and performance of athletes.
As little as a 2% loss in body mass during exercise can cause thermal stress,
impaired cognitive function, impaired cardiovascular function and accelerated
fatigue (Armstrong et al, 1985), all of which would impact on an athlete’s health.
Maughan and Leiper (1995) found that a loss of body mass, in excess of 2.5% can
decrease the ability to exercise by as much as 15%, therefore severely inhibiting
performance. Dehydration is more commonly seen amongst athletes, however at
the other end of the scale, overdrinking can lead to more dangerous problems. The
condition exercise-associated hyponatraemia can occur where there is a large
decrease in the concentration of sodium within the plasma, it is too dilute, this
creates an osmotic gradient and forces water into surrounding cells causing the
cells to swell, disrupting cell functions and in extreme cases endanger life (Martini
and Nath, 2009).
We have known for some time that dehydration, the loss of bodily water, results in
a decrement in exercise performance. Sweat rates differ between individuals,
which during exercise can be greater than 1 litre per hour (Costill et al, 1976), if
this fluid loss is not replaced dehydration ensues. While exercising in warm
climates, the need for the body to produce sweat is increased in order to maintain
thermoregulation. If the body gets into a state of hyperthermia, exercise tolerance
depreciates (Nielsen et al 1993). Furthermore, with increasing aerobic capacity the
metabolic heat produced during exercise is also increased. Ichinose-Kuwahara et
al (2010) found that fitter individuals (maximal aerobic capacity ≥ 55 ml.kg-1
.min-
1) had larger sweat rates when compared to less fit individuals (≤ 45 ml.kg
-1.min
-
1). This transpires that professional athletes, who generate larger power outputs
while they compete compared to recreational athletes, have increased heat
production that requires greater sweat rates for cooling. This poses the question:
can athletes upregulate their rehydration capacity?
12
Heavy sweating during exercise decreases the volume of extracellular fluid,
temporarily increasing the sodium concentration. This is sensed by osmoreceptors
that stimulate the release of anti-diuretic hormone (ADH), reducing water loss
from the kidneys and stimulating a feeling of thirst. If plain water is then
consumed, water receptors in the pharynx, as well as a decrease in the sodium
concentration of extracellular fluid, suppress the release of ADH (Maughan, 1999
& Nose et al, 1988a). This drives water losses from the kidneys and reduces
feelings of thirst (Gonzalez-Alonzo et al, 1992), extracellular fluid volume cannot
be suitably restored with plain water.
As a result of dehydration and the reduction of extracellular fluid volume, there is
a reduction in blood volume, which will play a key role in exercise capacity being
diminished. The working muscles will continue to demand a high supply of blood
flow in order to receive sufficient oxygen to fuel the exercise. However, the body
also has a demand to increase blood flow to the skin to enable the body to
dissipate some of its heat (Maughan, 1999), there must be a compromise.
It is therefore recommended that for endurance exercise, that lasts longer than 1
hour that carbohydrates and electrolytes should be added to the fluid.
Commercially available sports drinks are advertised as the best fluid to consume,
as they contain the electrolytes lost through sweating but also contain
carbohydrates used to fuel exercise. Research has proven that such drinks can
prevent dehydration and rehydrate better than water alone. Maughan and Leiper
(1995) found that including sodium in a fluid for rehydration was more beneficial
than when sodium was not present in the fluid. Further research in this field has
suggested that also adding potassium to a rehydration solution has greater benefits
than sodium alone (Nadel et al, 1990).
If suitable hydration strategies are followed during exercise then the body’s fluid
balance can be maintained. However, when this is not the case a rehydration
strategy is essential. Rehydration, by definition, is the process of restoring lost
water within the body. This process of returning the body’s fluid balance
following a period of dehydration is driven by regulatory responses to retain water
13
and sodium within the kidney as well as behavioural changes to increase thirst.
The choice of drink that is consumed for rehydration is often chosen
independently due to personal preference, however at the moment this industry is
dominated by manufactured drinks. There are now many different brands of sports
drinks available on the market, all attracting worldwide consumption and due to
the association of these products with their sporting heroes, children are being
attracted to them, especially amongst young males. These drinks contain many
additives including sweeteners, colourings and preservatives.
In a review by Beltrami et al (2008) the authors suggest that large drink brands are
even beginning to influence fluid intake recommendations. Companies such as
PepsiCo, who manufacture the popular sports drink ‘Gatorade’, supply funding to
both the National Athletic Trainers Association (NATA) and the American
College of Sports Medicine (ACSM). New peer reviewed scientific research in the
field of hydration and rehydration may take months to be accepted and become
available to those who need it most, athletes and practitioners within elite sport.
However, the sports drink industry can produce new advertising campaigns and
claims overnight that need no form of scientific proof in order to be published.
These claims are within the public eye and could cause misguidedness among the
general public.
In 1996 the ACSM published a Position Stand (Convertino et al, 1996) regarding
exercise and fluid replacement. Their guidelines stated a generic recommendation
for all, to match fluid replacement with the body mass lost during their activity.
They have since updated their recommendations. In 2007 they published new
guidelines (Sawka et al, 2007) that suggested more emphasis on individual
hydration strategies, as well as increasing the volume of fluid replacement post-
exercise to 1.5 litres of fluid for every kilogram of body mass lost during exercise.
An exciting new product, beginning to grow in worldwide popularity, which has
the potential to provide benefits to sporting performance, is coconut water.
Coconut water is the liquid found inside young, unripe, green coconuts. It
naturally contains electrolytes such as potassium, magnesium, calcium and
phosphorus, which is similar to the man-made sports drinks that also contain
14
preservatives and artificial colours. A serving of coconut water contains a high
concentration of potassium as well as other various nutrients, vitamins, amino
acids, antioxidants, enzymes and minerals (Yong et al, 2009).
One of the benefits associated with coconut water that could be of greatest interest
for the general public is its potential to reduce cholesterol levels as well as lower
blood pressure. Research surrounding these effects is limited, therefore further
studies would have to be completed before we have more confidence in these
claims. However, research by Bhagya et al (2010) found that 3 weeks of feeding
rats with coconut water resulted in the rats having significantly lower blood
pressure and also reduced total cholesterol, triglycerides and free fatty acids.
Manna et al (2014) reported that coconut water has large antioxidant properties
that can help protect the body against various cancers.
Aragon-Vargas et al (2000) investigated what effect coconut water has on
rehydration. Their study involved 3 trials, water, coconut water or a sports drink
as means of rehydration. On average body mass was significantly lower at the end
of the rehydration phase following the water trial compared to both coconut water
and sports drink (P < 0.05). They concluded that the inability to return the body to
euhydration within a warm, humid climate, was due to increased sweat output
during the recovery period, in spite of ingestion of fluid equivalent to 125% of the
original body mass lost during exercise. Their results showed that water was less
effective at regaining bodily fluid compared to coconut water and a sports drink.
A recurring theme within previous research using coconut water is that studies
appear underpowered, using very small subject numbers, therefore failing to find
any real changes in variables. There is also a lack of research that use the current
ACSM guidelines for fluid replacement, replacing 150% of the fluid lost during
exercise instead using strategies that fall below these current recommendations.
The aim of this study is to investigate the effect of commercially available
coconut water, sports drink and plain water on rehydration using a 150%
rehydration strategy. We hypothesise that coconut water will be as effective as a
sports drink and would therefore be a more natural alternative rehydration aid.
15
Secondary, we aim to investigate whether differences in aerobic capacity can have
significant effect on rehydration capacity.
16
Literature Review
Rehydration
The earliest study investigating the process of rehydration following exercise
eliciting dehydration was carried out in the early 1970’s. Costill and Sparks
(1973) investigated ‘Rapid fluid replacement following thermal dehydration’. 8
male subjects were dehydrated and then monitored during a rehydration phase on
3 separate occasions, which were randomised. The 3 different trials involved
rehydrating with demineralised water, a glucose-electrolyte solution or no fluid at
all. The subjects were dehydrated by sitting inactive in a heated environment
(temperature 70oC, relative humidity 9-12%), they were frequently weighed until
a loss of 4% of their original body mass had been reached. After the body mass
reductions were met, subjects sat in a cooler environment (23oC) in order to cool
down for 30 minutes. At this point subjects began to rehydrate with a volume
equivalent to 7.7% of the body mass that had been lost during dehydration. This
was repeated at 15 minute intervals for 3 hours until 13 boluses had been
consumed and 100% of the body mass lost had been replaced. Before dehydration
and at time 0, 30, 90 and 240 minutes of rehydration venous blood samples were
taken so that blood, plasma and red cell volumes could be calculated.
Haematocrit, haemoglobin, plasma protein and electrolyte as well as plasma
osmolality were also assessed.
They found that following dehydration, plasma volume had decreased by 12%
which was unable to be restored by the end of the 4 hour rehydration period in all
trials. They concluded that this rapid fluid replacement was ineffective at restoring
plasma volume and plasma osmolality.
Subjects could not tolerate the hot temperatures for long periods of time, generally
found to be between 15-30 minutes. This meant that the subjects had to be placed
in the heated environment intermittently for a duration between 2 and 4.5 hours
until they could reach the 4% body mass reduction required in this study. This is a
long time to ask of subjects to repeatedly enter this environment, considering a
rehydration period was still to follow afterwards which lasted 3 hours. The authors
suggest that rapid fluid replacement is ineffective at restoring the blood to
17
euhydration, however their protocol for rehydration lasted 3 hours, which in actual
practice, may be the difference between going into an event in euhydration or still
dehydrated from a previous effort. It may be more likely that rehydrating with
only 100% of the body mass lost during dehydration is ineffective at restoring
plasma volume and plasma osmolality.
This was later followed up by a group led by Nose. They conducted two studies
both published in 1988. The first of their studies was entitled ‘Role of osmolality
and plasma volume during rehydration in humans’. 6 subjects were used in this
investigation in order to determine what effect that rehydrating with different
sodium concentrations had on the restoration of the body’s fluid compartments.
Subjects exercised in a heated environment (36oC, 30% relative humidity) at 40%
2OV max until a 2-3% reduction in body mass was achieved. Subjects were then
rested for 1 hour in cooler conditions before rehydration began. In the next 3
hours subjects were rehydrated using tap water, ad libitum, along with capsules
containing either a placebo (more water) or sodium chloride (0.45g). Body mass,
urine volume and blood samples were taken throughout.
During the rehydration period subjects were seen to restore the water lost due to
dehydration by 68% and 82% for placebo and sodium chloride trials respectively.
This was a significant difference between the trials (P < 0.05). Urine production
was greater during the placebo trial compared to the sodium chloride trial, again
this was significant (P < 0.05). Plasma volume was restored to 174% of pre-
exercise values following the sodium chloride trial compared to only 78%
following the placebo trial. This gave us the early evidence that addition of
sodium to a rehydration beverage is beneficial for restoration and retention of
body water.
Nose et al’s second piece of work published in 1988 was titled ‘Shift in body fluid
compartments after dehydration in humans’. The methodology was the same as
their first study. They measured plasma volume, plasma osmolality, and plasma
electrolyte content (sodium, potassium and chloride). Sweat and urine volumes
were also investigated before and after dehydration. They were able to estimate
18
the change in the extracellular fluid space from the chloride distribution. Change
in the intracellular fluid space could be calculated by subtracting the change in the
extracellular fluid from the change in body mass following dehydration. The
authors were able to conclude that the movement of fluid out of the intercellular
space attenuated the decrease in the extracellular fluid.
Published in 1986 Nielsen et al investigated changes in fluid balance during
exercise and rehydration with different glucose-electrolyte drinks. They used 6
male subjects, and tested 4 different drinks for their ability to rehydrate and what
effect this had on performance following dehydration. The control drink consisted
of 139mmol/l glucose & 43mmol/l sodium chloride (NaCl), the next drink was the
same but with 51mmol/l potassium chloride (KCl) added, the third drink was also
same as the control but with 85mmol/l NaCl extra added to make total NaCl in
this beverage 128mmol/l and the last drink was a commercially available sports
drink. Drinks were disguised with a lemon flavour to match the sports drink.
Drinks were administered in a double blind random order.
Subjects were told to drink 1 litre of water or milk the night before each trial to
ensure euhydration. On arrival to the lab subjects voided their bladder then rested
in supine position while a venous catheter was inserted for blood sampling. After
30 minutes rest a biopsy was taken from the vastus lateralis muscle and first blood
sample taken. Subjects then performed a work capacity test, which involved
cycling at 50% 2OV max for 6 minutes, work rate was then increased to 105%
2OV
max and subjects continued until exhaustion. Work done in this period was
calculated from number of pedal revs and load. Before dehydrating exercise began
body mass was taken. The dehydrating exercise was completed on a cycle
ergometer for 2 hours in 30oC heat at 50%
2OV max. A second blood sample was
taken during the last minute of exercise with the next muscle biopsy being taken
immediately after exercise, when possible a urine sample was also collected.
Subjects then lay on a bed for a 2 hour period of rehydration. The next blood
sample was taken 30 minutes after second sample and before fluid replacement
began. Each subject drank 300ml of fluid every 15 minutes until 9 drinks were
finished (total 2700ml). More blood was taken at 10, 30, 40, 60, 90 and 135
19
minutes after fluid intake had started. Urine was collected, if possible, every hour.
A third muscle biopsy was taken along with the last blood sample at 135 minutes.
The same work capacity test was then repeated.
On average subjects in this study lost 3.1% of their pre-exercise body mass.
Plasma volume in the dehydrated state was seen to have decreased by ~16% due
to exercise in the heat. In the 30 minute rest interval before drinking began plasma
volume had already started to return towards pre-exercise values. Within 30-45
minutes of the rehydration phase plasma volume had been restored while
consuming the control drink, the added NaCl drink and the sports drink. It took
until 90 minutes for the plasma volume to be restored during the added KCl trial.
At the end of 2 hour rehydration, plasma volume was greater than pre-exercise
values for all 4 trials. Results of the work capacity test showed that the work that
could be completed post rehydration was significantly less (~22%) than the work
done before dehydration, with no significant difference seen between each of the
fluids. The muscle biopsies found that there was a reduction in muscle glycogen
stores after rehydration compared to before dehydration and could account for the
reduction in work capacity. Nielsen et al concluded that the drinks may differ in
time taken to pass from the stomach into the gut, where intestinal absorption takes
place. They also stated that drinks that are rich in sodium favour the filling of the
extracellular water compartment, while drinks high in potassium, as well as sports
drinks, favour filling of the intracellular water compartment.
This was the first study to compare beverages rich in sodium and potassium. This
is of importance due to the high potassium content within coconut water. They
found that the potassium rich beverage and the sports drink both favour the filling
of the intercellular space, which may be of benefit for the working muscles during
exercise. However they did not find similar results between these two beverages
in their ability to restore plasma volume. It took double the time for the potassium
drink to restore plasma volume compared to the sports drink.
In 1992 Lambert et al investigated the effect of adding carbonation to beverages
used for rehydration. Their study used 8 healthy men and involved 4 separate
trials. In the evening prior to each trial, subjects were told to ingest 500ml water to
20
ensure euhydration. When the subjects arrived at the lab they emptied their
bladder and had their body mass measured. Before exercise began subjects were
seated for 15 minutes before collection of a venous blood sample. Subjects then
exercised at 50% 2OV max on a cycle ergometer in an environmental heat chamber
(40oC and 40% relative humidity) aiming to reduce body mass by 4%. At time
points 60, 90 and 105 minutes into exercise subjects were allowed to have a 5
minute recovery period in normal room temperature conditions to dry off and be
reweighed. Subjects continued to exercise until desired mass was lost.
Immediately after exercise was completed subjects were seated for 15 minutes
before a venous blood sample was retaken, this was also repeated at 30, 90, 150
and 240 minutes of rehydration. Subjects were rehydrated with one of the
following beverages, administered in a random order, for a 3 hour period. Drink 1
was a carbonated 10% glucose-fructose drink, the second was a carbonated non-
carbohydrate containing drink, number 3 was a non-carbonated 10% glucose-
fructose drink, and finally drink 4 was non-carbonated as well as non-
carbohydrate. The beverages were split into 13 separate feedings, given at 15
minutes intervals, each equating to 7.7% of the body mass lost following
dehydration (total 100% body mass replacement). At the end of the rehydration
period subjects urinated and were reweighed.
On average subjects reduced body mass by 4.12%, in a time of 128 minutes.
Rehydration was evaluated by changes in body mass, plasma volume and plasma
protein concentration. Changes in these variables were similar at each time point
throughout the rehydration period, however euhydration was not reached by the
end of rehydration for each drink. Negative fluid balance at the end of the
rehydration period was believed to be due to continued sweating, urine output and
water lost through respiration. Quantity of urine produced during rehydration was
not different between trials. Plasma glucose was elevated during trials for the
carbohydrate containing drinks as expected. Ratings of gastrointestinal distress
were also similar for all drinks at each time point. This data suggests that
carbonated drinks are as effective as non-carbonated drinks in fluid replacement
and recovery from dehydration, and would suggest that there is no difference in
the rate of gastric emptying. The authors also concluded that rehydration was seen
21
to be no different when the 10% carbohydrate drink was consumed compared to
the non-carbohydrate drink. No difference between the non-carbohydrate drink
and the drink high in carbohydrate shows there is no disadvantage for fluid
replacement by consuming fluid high in carbohydrate. This therefore suggests
high carbohydrate being present in the rehydration fluid may be advantageous for
athletes who must compete or train within hours or days of dehydrating
performance, as muscle glycogen resynthesis is reported to be 3 times faster when
carbohydrate is present in fluid consumed immediately after exercise.
As this study was conducted while research in this area was still fairly new, they
only rehydrated subjects with a volume equivalent to 100% of the body mass they
had lost during dehydration. They found that subjects were still in negative fluid
balance by the end of the rehydration period, suggesting that extra fluid needs to
be consumed to overcome the loss of water from urine, sweat and respiration.
Also published in 1992 was a study by Gonzalez-Alonzo et al, titled ‘Rehydration
after exercise with common beverages and water’. This study assessed 10 subjects
during a 2 hour rehydration period following exercise-induced dehydration. They
were rehydrated with a caffeinated diet cola, a 6% carbohydrate-electrolyte or
plain water. Measurements of whole body rehydration, gastric emptying and blood
volume restoration were monitored. Subjects exercised at 60-80% 2OV max in a
heated environment (32 oC, 40% relative humidity) until approximately 2.5% of
their body mass was lost. Following exercise, the subjects returned to a cooler
environment and received beverages equal in volume to the fluid they had lost.
Fluids were consumed in two portions at 0 and 45 minutes of the 2 hour
rehydration period. At the end of the rehydration period, they found there to be no
fluid remaining within the stomach after all trials. However, the subjects still
remained slightly hypohydrated after the rehydration period for all trials, this was
believed to be due to water lost as a result of urine formation, respiration, sweat
and metabolism. The authors created a formula used as an index of percentage
rehydration, where percentage rehydration = (total body mass lost following
dehydration - (initial body mass – final body mass) / fluid intake in kg) x 100
22
They found the diet cola to produce a significantly lower percentage rehydration
value (54%) compared to water and the carbohydrate-electrolyte drink which gave
values of 64% and 69%, respectively (P < 0.05). Percent rehydration has been
used as a very useful indicator to measure effectiveness of a particular rehydration
drink, however due to the variations in level of dehydration, volume ingested,
duration of rehydration period and composition it is difficult to make meaningful
comparisons between different protocols.
Coconut Water for Rehydration
Aragon-Vargas et al (2000) investigated what effect coconut water has on
rehydration. Their study involved 19 heat acclimated young males who were
members of the athletics school in Costa Rica. Their protocol consisted of 3 trials,
involving either water, coconut water or a sports drink as means of rehydration,
with each drink administered in a random order. Diet was monitored 48 hours
before each trial using questionnaires and subjects followed specific instructions
regarding fluid and sodium intake in the 24 hours prior to the trial. Body mass was
measured and urine collected before the exercise began. Subjects exercised for
several 20 minute bouts outdoors, with body mass measurement being taken until
2% of original body mass was lost. This was then followed by a period of
recovery before subjects consumed one of the drinks, in a single dose with volume
equal to 125% of body mass lost. Urine and body mass were measured throughout
the 3 hour recovery period. Exercise and recovery were both completed within the
same environmental conditions of 26.5oC.
Body mass was used as a measure of fluid balance throughout the experiment.
Subjects typically lost 2.3% of their original body mass following exercise. On
average body mass was significantly lower at the end of the rehydration phase
following the water trial compared to both coconut water and sports drink (P <
0.05). No significant difference was seen in urine output between all trials during
the 3 hour rehydration period. They concluded that the inability to return the body
to euhydration within a warm, humid climate, was due to increased sweat output
during the recovery period, in spite of ingestion of fluid equivalent to 125% of the
original body mass lost during exercise. The extent of hypohydration at the end of
the recovery period was similar to that seen after subjects had been dehydrated
23
following exercise. Their results showed that water was less effective at regaining
bodily fluid compared to coconut water and a sports drink. However, this
difference was only able to be detected by differences in final body mass of the
subjects, as the urine production was not significantly different between trials.
This study was unique as they used subjects that were already acclimatised to the
heat, as they were natives of Costa Rica. Previous studies had all used subjects
that were being put into an unfamiliar environmental chamber in order to elicit
dehydration. However, their protocol was completed outdoors meaning they were
unable to completely standardise conditions as you would be able to within a
laboratory. Earlier studies had only rehydrated with fluid equal to 100% of the
body mass lost during dehydration, this study used 125% fluid replacement and
still found subjects were in negative fluid balance by the end of the rehydration
phase.
More recently, Saat et al (2002) published research investigating ‘Rehydration
after exercise with fresh young coconut water, carbohydrate-electrolyte beverage
and plain water’. 8 healthy males were used within this study, subjects attended
the lab 2-3 hours after a standardised breakfast and drinking ~500 ml water to
ensure normal hydration. Subjects were exercised in a hot environment (31.1oC,
51.4% relative humidity) at 60% 2OV max for 90 minutes until 2.5 - 3.0% of their
original body mass had been lost. Subjects then had to follow a 2 hour rehydration
period, sitting in a thermoneutral environment, while drinking either coconut
water, a carbohydrate-electrolyte beverage or plain water. The volume of fluid
consumed equated to 120% of the body mass lost due to dehydration. This was
split into 3 separate feedings and drank at set points 0, 30 and 60 minutes within
the rehydration phase. Blood samples were taken to measure haematocrit, serum
osmolality and serum electrolyte (sodium, potassium and chloride) content. Urine
output was collected and analysed for urine osmolality, as well as urine electrolyte
content. In addition nude body mass was also recorded. Net fluid balance was
calculated, based on body mass loss, volume of fluid ingested and urinary volume
produced, as suggested by Maughan et al, 1994. The authors also used the
percentage rehydration equation from Gonzalez-Alonso (1992). The final
24
parameter used for estimation of the extent of rehydration was the rehydration
index. Mitchell et al (1994) were responsible for this measurement which gives an
indication of how much of the fluid ingested was responsible for the restoration of
body mass. Rehydration Index = (total volume of fluid administered (ml) / total
body mass gain during rehydration (g) / % rehydration / 100), a value of 1 is
believed to be optimal, anything greater indicates a less effective use of the
ingested fluid.
Subjects lost on average 2.78% body mass during dehydration, and were
rehydrated with an average of 1875ml of fluid. They found that at the end of the
rehydration period that all beverages left subjects hypohydrated. There was no
significant difference seen in the percentage rehydration, however it was seen to
be highest following the carbohydrate-electrolyte trial (80%). They also found no
significant difference in the rehydration index across all trials either. No
significant difference was seen in blood volume and urine volume produced at any
time points for all trials. Plain water produced significantly lower urine osmolality
compared to coconut water and the carbohydrate-electrolyte drink at 90 and 120
minutes into the rehydration period. As previously mentioned, net fluid balance
was negative at end of rehydration and was similar between all 3 trials. Serum
osmolality was found to be significantly higher immediately at the end of exercise
compared to pre-exercise for all trials, as expected due to dehydration. Serum
osmolality was seen to return to, or even be less than, pre-exercise values by end
of rehydration period in all trials. During rehydration the carbohydrate-electrolyte
drink produced significantly higher blood glucose values compared to plain water
at all of the time points. The blood glucose during the carbohydrate-electrolyte
trial was also significantly higher than the coconut water at 30 and 60 minutes into
rehydration. Coconut water produced significantly higher blood glucose values
than water at 30, 60 and 90 minutes into rehydration but not at the final time point
of 120 minutes.
They concluded that rehydrating with plain water diluted the blood as serum
osmolality was lower at the end of the rehydration period than pre-exercise values
at the beginning of the trial. Plain water also produced lower urine osmolality
which suggested that there was increased fluid clearance by the kidneys leading to
25
additional urine production. Importantly they suggested that results from other
studies which may use an ad libitum rehydration strategy should be interpreted
with caution when comparing to studies that use a forced fluid consumption
strategy. They state that this is because different amounts of fluids are ingested
and that subjects do not voluntarily drink a volume equal to or more than their
fluid losses.
This study was able to state that coconut water could be used for whole body
rehydration following exercise induced dehydration. The authors suggested that
further investigation would be to add sodium to coconut water to make it
equivalent to the values seen within common sports drinks.
In 2007, Ismail et al completed an investigation into what effect adding additional
sodium to coconut water had on its ability to rehydrate. The study was entitled
‘Rehydration with sodium-enriched coconut water after exercise-induced
dehydration’. 10 healthy males volunteered for the study. There were 4 separate
trials involved in the study. The beverages used during rehydration were coconut
water, coconut water with added sodium, a sports drink and plain water. Diet and
physical activity were recorded in the 48 hour period before the first trial and was
then replicated prior to the rest of the trials. Before each trial, subjects arrived at
the lab at 7am for a standardised breakfast and 500ml of water. 1 hour later
subjects emptied their bladder and had nude body mass measured. A venous
catheter was inserted for blood sampling (haematocrit, haemoglobin & glucose).
At 9am (2 hours after breakfast) subjects started to exercise on a treadmill at 65%
2OV max for 90 minutes in a heat chamber (32oC, relative humidity 70%) with the
aim of dehydrating the body by 3% of its original mass. After completing the
exercise a blood sample was taken, and subjects given 10 minutes to cool down in
a thermo-neutral room (23oC, 60% relative humidity). Once the subjects were
completely dried of sweat, nude body mass was re-measured. 30 minutes after
exercise had finished another blood sample was taken, as well as urine collection
and nude body mass. It was after this that the subjects were given their first drink
which was equivalent to 50% of body mass they had lost during exercise, this was
the start of a 2 hour rehydration period. 30 minutes into the rehydration period the
26
second drink was given to subjects, this time the volume was only equivalent to
40% of the body mass lost. The final drink, equating to 30% body mass lost, was
given at 60 minutes into the rehydration phase. Blood and urine were collected
every 30 minutes during rehydration. At the end of the 2 hour rehydration period,
urine was collected before final nude body mass was measured. A questionnaire
was also completed during the rehydration phase.
Subjects lost on average 3.08% of their original body mass as a result of exercise
in a heated environment. Fluid volumes used to rehydrate the subjects averaged
2200ml. Subjects were seen to be still slightly dehydrated at the end of the
rehydration phase. Percentage rehydration was found to be higher for all drinks
compared to water. Rehydration index was also used and produced values of 2.5,
1.8, 2.0 and 1.75 for water, sports drink, coconut water and sodium enriched
coconut water respectively. Plasma volume at end of rehydration had returned to
pre-values for all drinks except water. Urine production was lower during the
trials where subjects rehydrated with the sports drink and both coconut waters
compared to water. Urine osmolality after dehydration was similar in all trials.
After the 2 hour rehydration, urine osmolality following consumption of water
was significantly lower (P < 0.05) than when the sports drink or coconut waters
were used. Net fluid balance at end of the rehydration period was not significantly
different between trials but was negative for all. Serum osmolality was
significantly higher at end of the exercise period (P < 0.01) for all trials, and had
returned to euhydration levels by end of rehydration period. However, serum
osmolality while rehydrating with water was significantly lower compared to all
other drinks (P < 0.05) at 90 and 120 minutes into the rehydration period. Blood
glucose was the same for all trials before and after exercise. During the
rehydration period, the sports drink trial and both coconut water trials were seen to
produce higher values of blood glucose compared to the water trial. The
questionnaire results found that feeling of thirst was not significantly different
between trials. Subjects also reported that both coconut waters and the sports
drink were much sweeter than water, but no significant difference was seen
between each of them. Subject’s feeling of nausea was similar for all trials,
however at 30 and 60 minutes into the rehydration period significantly lower
scores were reported during the sodium enriched coconut water trial compared to
27
all others. Feeling of fullness was also significantly less during the sodium
enriched coconut water trial at 30 and 60 minutes. Sensation of stomach upset was
seen to be generally lower while rehydrating with both coconut waters compared
to the sports drink and water, this was only seen to be significant at 30, 60 and 90
minutes into the rehydration period.
Ismail et al began to conclude by saying that their data suggests that, firstly,
sodium enriched coconut water is as effective as the sports drink for fluid
replacement and recovery following dehydration. Secondly, rehydration was
similar when coconut water and sports drink solutions were ingested. Previous
studies have shown percentage rehydration can be between 50-80% following a
rehydration phase of 2-3 hours, using many different rehydration strategies. The
percentage rehydrations seen in this study of 68 and 69% for sports drink and
sodium enriched coconut water were similar to other studies (Gonzalez-Alonso
1992 and Singh 2002). Other studies may give the rehydration fluid in one large
volume to drink, in this study drinks spaced out every 30 minutes. This was
planned to match possible rates of ingestion which might be used in actual
practice in order to avoid extreme stomach fullness. Maughan and Leiper (1995),
Maughan (1994) and Kovacs (2002) followed rehydration for 5-6 hours which
obviously provides a much more complete picture of the effect that a fluid
consumed has on kidney function, however, sometimes this might not be feasible
to follow. Maughan (1997) has shown that to optimise rehydration you must drink
a volume greater than the total body mass that was lost during exercise and that
the drink should contain electrolytes in order to prevent urine production. Even
when large volumes of fluid are consumed they appear to not adequately rehydrate
if sodium levels are low (Shirreffs 1996). Rehydration Index ranges 1.80 - 2.60
have been reported with sodium levels of 20 mmol/l typical of most sports drinks.
The sports drink used in this study had a rehydration index of 1.80 which also falls
within this range. However, the rehydration index seen following rehydration with
sodium enriched coconut water was 1.75 which is better than that reported in
studies using sports drinks, which may be due to the increased potassium content
of the coconut water. They also state that rehydrating with 120% of body mass
lost may not be a sufficient volume in order to restore fluid loss as all trials were
still seen to be in negative fluid balance by the end of the rehydration period.
28
In the study by Saat et al (2002) they found that percent rehydration was higher
with a sports drink compared to coconut water perhaps due to lower sodium
content in coconut water. Ismail et al added sodium to coconut water in this study
and saw similar results in percent rehydration and rehydration index when
compared to a sports drink, coconut water alone and plain water. Major target
during rehydration is to maintain plasma volume so that circulation and sweating
can continue optimally (Leiper and Maughan 1986). Previous studies suggest high
potassium content of drinks, as seen in coconut water, may delay recovery of
plasma volume due to increased intracellular fluid restoration instead of
extracellular. However, no difference was seen in this study between coconut
water and sports drink.
Coconut Water for Performance
Most of the studies that use coconut water focus on its ability to rehydrate
following dehydration. The first study that looked at a performance aspect to
coconut water ingestion was not completed until very recently, by Kalman et al
(2012).
Their study used 12 subjects, who underwent 4 different trials. When they arrived
at the lab they were given a standardised breakfast as well as 470ml water. 1 hour
later, they began exercising to elicit dehydration, in a heated environment (36oC,
relative humidity 48%). Exercise involved two 30 minute bouts of
walking/jogging on a treadmill separated with a 10 minute recovery period.
Subjects lost between 2-3% of their initial body mass by following this exercise
protocol. Subjects returned to a thermoneutral environment for a 3 hour
rehydration period, before completing an exercise performance test.
Measurements of body mass, plasma osmolality, urine specific gravity and
subjective questionnaire scores were taken throughout the rehydration period.
Subjects were assigned a different beverage during the 4 different trials
administered in a randomised order. Drinks investigated were bottled water,
commercially available coconut water, coconut water from concentrate and a
carbohydrate-electrolyte drink. Subjects were rehydrated by volumes equivalent to
125% of the body mass lost during dehydration, which they were given in a single
bolus and allowed 60 minutes to finish. After the rehydration phase, subjects
29
completed a performance test which involved running on a treadmill at 4.2
miles/hour with gradient being increased from 0% in 2.5% increments every 3
minutes until volitional exhaustion, total exercise time was recorded. Subjects lost
on average 1.7kg (~2% of original body mass) following dehydration. There were
no significant differences seen in the measurements taken throughout rehydration
between any of the trials. It was concluded that coconut water, from natural or
concentrate sources, is as effective for rehydration as water and a carbohydrate-
electrolyte drink.
The main focus of this study was on performance, and it was found that there was
no significant difference in the performance test results of total exercise time
between each condition. Although this study looked at a performance aspect to
coconut water consumption, it was only following a rehydration phase, meaning
previous dehydration had taken place. The use of the incremental protocol for the
performance test to assess the effectiveness of the rehydration beverage is strange.
An incremental test designed to elicit exhaustion may lead to subjects ceasing
exercise due to localised muscular fatigue, which may be more a test of subjects’
ability to clear metabolic by-products or how they tolerate the accumulation of
these by-products when production exceeds clearance. We still don’t know to date
if coconut water can be used as a natural replacement, for sports drinks, for an
athlete during endurance sport. To investigate this, a study using coconut water to
fuel time trial performance would need to be conducted, where subjects are told to
cover a set distance or complete a set amount of work as quickly as possible.
A new piece of research by Laitano et al (2014) is the latest study to investigate
the effect coconut water may have on exercise performance. 8 subjects were used
during this study, with 3 different beverages being tested. The beverages used
were plain water, an orange flavoured drink and coconut water, which were
administered in a randomised order. The difference in this study compared to all
others before was that they were testing the effect of drinking coconut before
performing exercise and whether it was beneficial for exercise capacity. An hour
before beginning the exercise test subjects began to drink one of the selected
beverages, volume equalling 10 ml/kg. Drinks were divided into 7 equal boluses
and given to subjects every 10 minutes during the hour. The exercise test began 20
30
minutes after the last bolus was consumed and was performed in a heated
environment (34oC, 55% relative humidity). The test involved cycling at 60% of
maximum power output, with a steady cadence and continued until subjects were
unable to keep cadence above 60 rev·min-1
.
The authors found a reduced urine volume was produced during the coconut water
trial compared to water and flavoured drink (P < 0.05). Sweat rates and fluid
balance were similar throughout the exercise test between all trials. Interestingly,
they found that exercise capacity was increased following previous consumption
of coconut water compared to the other drinks (P < 0.05). This shows early
indication that coconut water may be beneficial for endurance performance,
however this study did not compare coconut water’s effect with a sports drink.
Also exercise performance test was a maximal test with no consumption of fluid
during the trial. Investigation is required comparing the consumption of coconut
water and a sports drink during longer endurance exercise on markers of
performance.
In summary, the use of coconut water as a rehydration beverage is still a fairly
new concept. Many of the studies that use coconut water use small subject
numbers therefore it is hard to gain much confidence from these results. These
studies also use a variety of different rehydration strategies and it is still unknown
which method is optimal.
31
Methods
Subjects
For homogeneity 16 males volunteered to take part in this project, all of whom
were healthy and recreationally active. Subject characteristics can be seen below
in Table 1. Subjects were provided with information sheets (see Appendix 1)
outlining the required commitments of their involvement, before written informed
consent was obtained (Appendix 2), prior to the subjects beginning the study. A
subject health questionnaire was also completed and any subjects that evidenced a
history of disease, illness, injury or family history of sudden death were excluded.
All protocols and procedures used in the study were approved by the School of
Life Sciences Ethical Review Committee for non-clinical Research, University of
Glasgow.
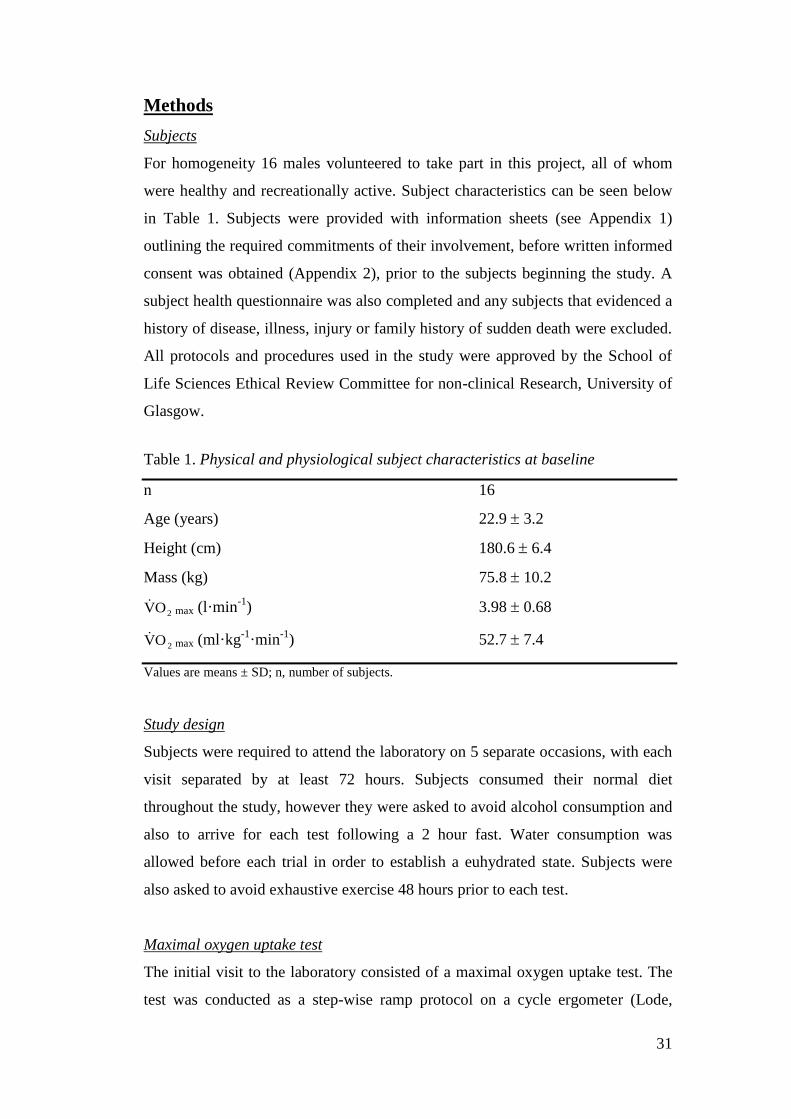
Table 1. Physical and physiological subject characteristics at baseline
n 16
Age (years) 22.9 3.2
Height (cm) 180.6 6.4
Mass (kg) 75.8 10.2
2OV max (l·min-1
) 3.98 0.68
2OV max (ml·kg-1
·min-1
) 52.7 7.4
Values are means ± SD; n, number of subjects.
Study design
Subjects were required to attend the laboratory on 5 separate occasions, with each
visit separated by at least 72 hours. Subjects consumed their normal diet
throughout the study, however they were asked to avoid alcohol consumption and
also to arrive for each test following a 2 hour fast. Water consumption was
allowed before each trial in order to establish a euhydrated state. Subjects were
also asked to avoid exhaustive exercise 48 hours prior to each test.
Maximal oxygen uptake test
The initial visit to the laboratory consisted of a maximal oxygen uptake test. The
test was conducted as a step-wise ramp protocol on a cycle ergometer (Lode,
32
Groningen, Netherlands). Subjects performed a 10 minute warm-up before the test
began. Resistance on the bike was then increased by 25 watts per minute (W·min-
1) until voluntary exhaustion or the subject was no longer able to maintain a
cadence of greater than 50 rev·min-1
. At the end of the test subjects were required
to complete a cool down period allowing their heart rate to return to warm up
values.
Subjects were required to wear a headset (Hans Rudolph, Kansas, USA) for a
Two-Way Non-Rebreathing Valve mouthpiece (2700 series, Hans Rudolph,
Kansas, USA). A nose clip was also required to be worn during each test to
prevent any of the expired air being lost to the atmosphere. Therefore, subjects
breathed through the two-way valve connected to a piece of tubing, 1.5 m in
length and 5.0 cm in diameter, which allowed the expired air to be collected in a
Douglas bag.
Douglas bag collections allowed for expired gas concentrations to be attained by
analysis using a gas analyser (Servopro 4100 gas analyser, Servomex,
Crowborough, UK), leading to calculation of the gas exchange variables 2OV and
2COV . The gas analyser was calibrated using precision analysed gases that span
the range of inspired and expired gas concentrations. Concentrations were
checked both pre and post analysis to check the stability of the calibration. The
volume of gas collected in the Douglas bags was found by a volume analyser (Dry
gas meter, Harvard Apparatus, Edenbridge, UK).
Finally a Polar heart rate monitor (FT2, Polar Electro Oy, Kempele, Finland) was
also worn to allow reading of the subject’s heart rate to be observed throughout
the test.
Experimental protocol
The next 4 visits were part of the experimental trial. The trials involved subjects
being dehydrated by exercising within an environmental chamber heated to a
temperature of 36.7 0.9oC and 91.9 21.2% relative humidity, before being
rehydrated using various fluids.
33
Before each of the tests began, various baseline measurements were recorded.
These included subject’s height, nude body mass, urine osmolality and blood
glucose. Subjects were also required to complete a simple subjective feelings
questionnaire (Appendix 3), involving 7 questions all scored on a scale of 1 -10.
Blood samples were drawn using a lancet to make a small puncture in the skin of
the thumb by a suitably qualified individual. A sample was drawn into a capillary
tube, containing reactants used to prevent the blood from coagulating. The blood
was then mixed in the tube, allowing for the reaction to take place. This was
achieved by simply holding the tube between the thumb and fore finger and
spinning the tube moving the blood along the full length of the tube. This was
continued until the blood underwent a colour change from red to brown indicating
the reaction was complete. The blood was then ready to be analysed. This sample
was used to measure blood glucose (Analox GM7 analyser, London, UK). The
glucose analyser was calibrated before each test using a standard glucose solution
of known concentration 8.0 mM. A pipette was used to draw a 7 micro litre
sample of the glucose solution that was then expelled into the reaction chamber of
the glucose analyser, this was repeated until 2 consecutive samples gave a glucose
reading within 0.1 mM of each other, this was then accepted as an 8.0 mM
sample. Each blood sample was analysed using a 7 micro litre sample from the
capillary tube that was expelled into the reaction chamber of the glucose analyser.
Again, samples were analysed until 2 consecutive samples were within 0.1 mM of
each other. A 20 micro litre sample of the urine collected was used to assess urine
osmolality (Advanced Micro-Osmometer, Model 3300, Massachusetts, USA). The
osmometer initiated calibration by selecting the ‘calibration’ option from the
machine’s menu setting. A 20 micro litre sample was drawn of the first calibration
standard (50 mOsm) and placed in the sample cradle, the cradle was then pressed
down so that the sample entered the reaction chamber. This was repeated until the
machine prompted the use of the second calibration standard (850 mOsm). The
same process was followed for the 850 mOsm standard until the machine
displayed ‘calibration complete’. The calibration could then be checked by
following the same sampling protocol with a 290 mOsm reference solution.
34
When experiments like this are conducted in a heated environment, core
temperature of subjects has to be monitored throughout. If core temperature rose
to 39oC the subject was closely monitored, and if core temperature reached 40
oC
the test was stopped and the subject was allowed to cool down by exiting the heat
chamber and being placed in a cool room with a fan. To monitor core temperature
the subject was required to insert a rectal thermometer 10 cm beyond the anal
sphincter. Again, a Polar heart rate monitor (FT2, Polar Electro Oy, Kempele,
Finland) was worn to allow reading of heart rate to be observed throughout the
test.
Subjects then exercised on a cycle ergometer at 65% 2OV max (determined from the
maximal oxygen uptake test) for 60 minutes, in order to lose 2-3% of body mass
via sweat loss. Chamber temperature, subject core temperature and chamber
relative humidity were recorded at 5 minute intervals throughout the exercise
period. After 60 minutes of exercise within the chamber, subjects were removed
and asked to towel dry before body mass was re-measured. The test was ended if
the subject had been found to have decreased in nude body mass by between 2-
3%. However, the amount of sweat produced during exercise is variable between
individuals, therefore, some subjects were not able to lose between 2-3% nude
body mass within 60 minutes. These subjects had to return to the chamber and
continue exercising in intervals of 10 minutes (to a maximum of 90 minutes) until
sufficient body mass was lost. After each of the 10 minute periods of exercise the
subject was again removed from the chamber and asked to towel dry before nude
body mass was re-measured.
Once the subject had reached the target body mass, they were returned to the
laboratory. It was here that the subject’s urine osmolality, blood glucose and
subjective questionnaire scores were re-measured. In the 2 hour period following
exercise cessation subjects rehydrated to the equivalent of 150% of body mass
lost. The total volume required to be consumed was broken down into 3 equal
boluses, subjects were asked to consume each portion within 40 minutes of being
received. Throughout the 2 hour rehydration phase, subjects’ nude body mass,
35
urine osmolality, blood glucose and subjective feelings questionnaire scores were
monitored every 30 minutes and at the end of the 2 hours of rehydration.
The first test in this series was a familiarisation test and subjects were allowed to
consume their own beverage of choice and in an ad libitum manner. The
remaining 3 experimental tests involved subjects consuming either coconut water
(Go Coco), a commercially available sports drink or plain water, administered in a
randomised, double-blind crossover manner.
Statistical analysis
The (minimum) sample size of 36 was calculated to ensure that the width of the
resulting 95% confidence interval for the difference in population mean for the
same subject is at most 2%. Implicit in this calculation is the assumption of
population standard deviation (SD) of 3% in the distribution of differences
between treatments on the same subject. During analysis subjects were split into
two groups depending on their maximum oxygen capacity, group one had a
maximum oxygen capacity of < 50 ml·kg-1
·min-1
with group two > 50 ml·kg-
1·min
-1. Statistical analysis was performed using Minitab 17 (Minitab Ltd.,
Coventry, UK). Analyses of variance (ANOVAs) were used to assess any
differences in the results between trials. Significance was determined with a P
value < 0.05. Furthermore Cohen’s d calculations of effect sizes were also used to
determine potential differences between each beverage that had not been detected
from the ANOVAs due to the lower sample size used. When d is less than 0.2,
effect sizes are said to be trivial, between 0.2 – 0.4 effect size is small, between
0.4 – 0.8 are medium effect sizes and large effect sizes are d values greater than
0.8.
36
Results
Maximal oxygen uptake test
Mean 2OV max was 3.89 ± 0.76 lmin
-1 (52.3 ± 7.4 mlkg
-1min
-1) with subjects
reaching the limit of tolerance at a mean power output of 293 ± 94 W. The mean
RER recorded at the limit of tolerance was 1.2 ± 0.1 and mean maximum heart
rate 189 ± 8 beatsmin-1
.
Experimental protocol
Subjects’ recorded body mass at each time point throughout the rehydration phase
for each of the trials can be seen below in Table 2.
Table 2. Mean body mass (kg) ± SD recorded for each time point for each of the
trials, values expressed in brackets are percentages of the pre body mass values.
CW S W
Pre 75.7 ± 10.3 75.7 ± 10.4 75.7 ± 10.5
(100.0 ± 0.0) (100.0 ± 0.0) (100.0 ± 0.0)
0 min 74.0 ± 10.0 73.9 ± 10.1 73.9 ± 10.1
(97.7 ± 0.4) (97.6 ± 0.5) (97.6 ± 0.5)
30 min 74.5 ± 10.1 74.5 ± 10.1 74.3 ± 10.2
(98.4 ± 0.3) (98.4 ± 0.5) (98.3 ± 0.4)
60 min 75.1 ± 10.1 75.2 ± 10.2 75.1 ± 10.3
(99.1 ± 0.4) (99.3 ± 0.5) (99.2 ± 0.5)
90 min 75.6 ± 10.2 75.7 ± 10.3 75.7 ± 10.5
(99.9 ± 0.4) (99.9 ± 0.6) (100.1 ± 0.3)
120 min 76.0 ± 10.4 76.0 ± 10.5 76.0 ± 10.8
(100.4 ± 0.3) (100.4 ± 0.6) (100.3 ± 0.5)
CW = Coconut Water, S = Sports Drink, W = Plain Water.
37
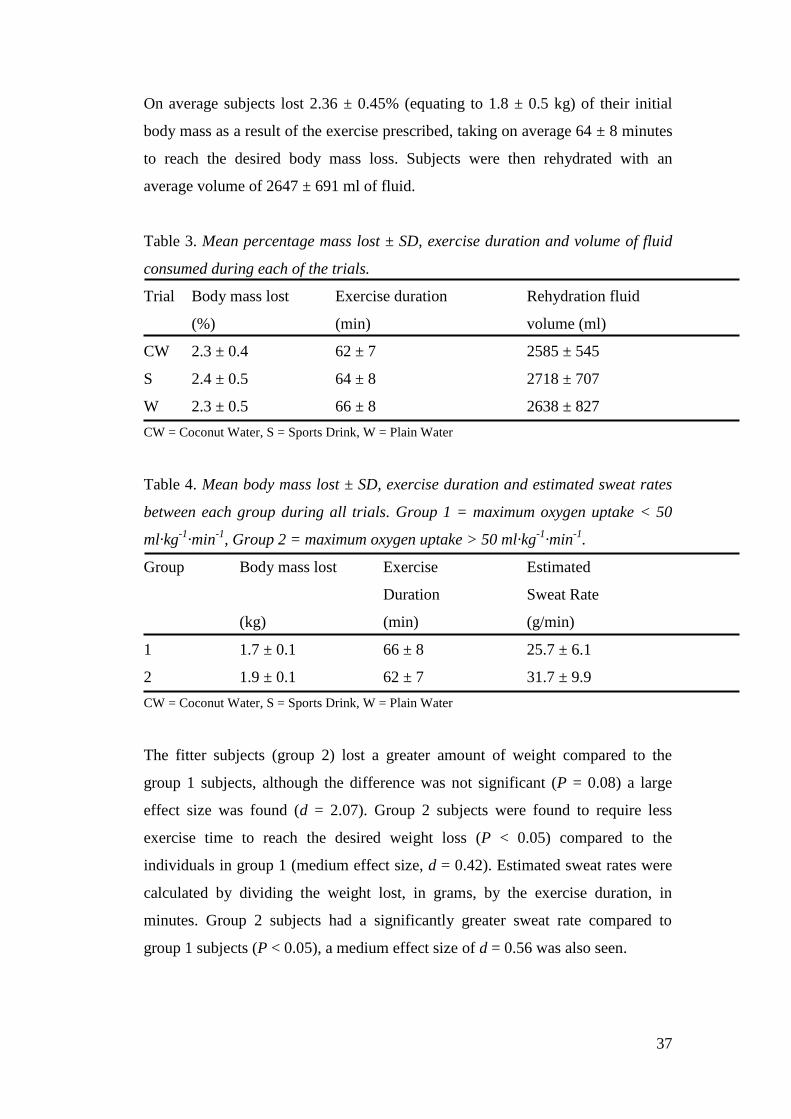
On average subjects lost 2.36 ± 0.45% (equating to 1.8 ± 0.5 kg) of their initial
body mass as a result of the exercise prescribed, taking on average 64 ± 8 minutes
to reach the desired body mass loss. Subjects were then rehydrated with an
average volume of 2647 ± 691 ml of fluid.
Table 3. Mean percentage mass lost ± SD, exercise duration and volume of fluid
consumed during each of the trials.
Trial Body mass lost Exercise duration Rehydration fluid
(%) (min) volume (ml)
CW 2.3 ± 0.4 62 ± 7 2585 ± 545
S 2.4 ± 0.5 64 ± 8 2718 ± 707
W 2.3 ± 0.5 66 ± 8 2638 ± 827
CW = Coconut Water, S = Sports Drink, W = Plain Water
Table 4. Mean body mass lost ± SD, exercise duration and estimated sweat rates
between each group during all trials. Group 1 = maximum oxygen uptake < 50
ml·kg-1
·min-1
, Group 2 = maximum oxygen uptake > 50 ml·kg-1
·min-1
.
Group Body mass lost Exercise Estimated
Duration Sweat Rate
(kg) (min) (g/min)
1 1.7 ± 0.1 66 ± 8 25.7 ± 6.1
2 1.9 ± 0.1 62 ± 7 31.7 ± 9.9
CW = Coconut Water, S = Sports Drink, W = Plain Water
The fitter subjects (group 2) lost a greater amount of weight compared to the
group 1 subjects, although the difference was not significant (P = 0.08) a large
effect size was found (d = 2.07). Group 2 subjects were found to require less
exercise time to reach the desired weight loss (P < 0.05) compared to the
individuals in group 1 (medium effect size, d = 0.42). Estimated sweat rates were
calculated by dividing the weight lost, in grams, by the exercise duration, in
minutes. Group 2 subjects had a significantly greater sweat rate compared to
group 1 subjects (P < 0.05), a medium effect size of d = 0.56 was also seen.
38
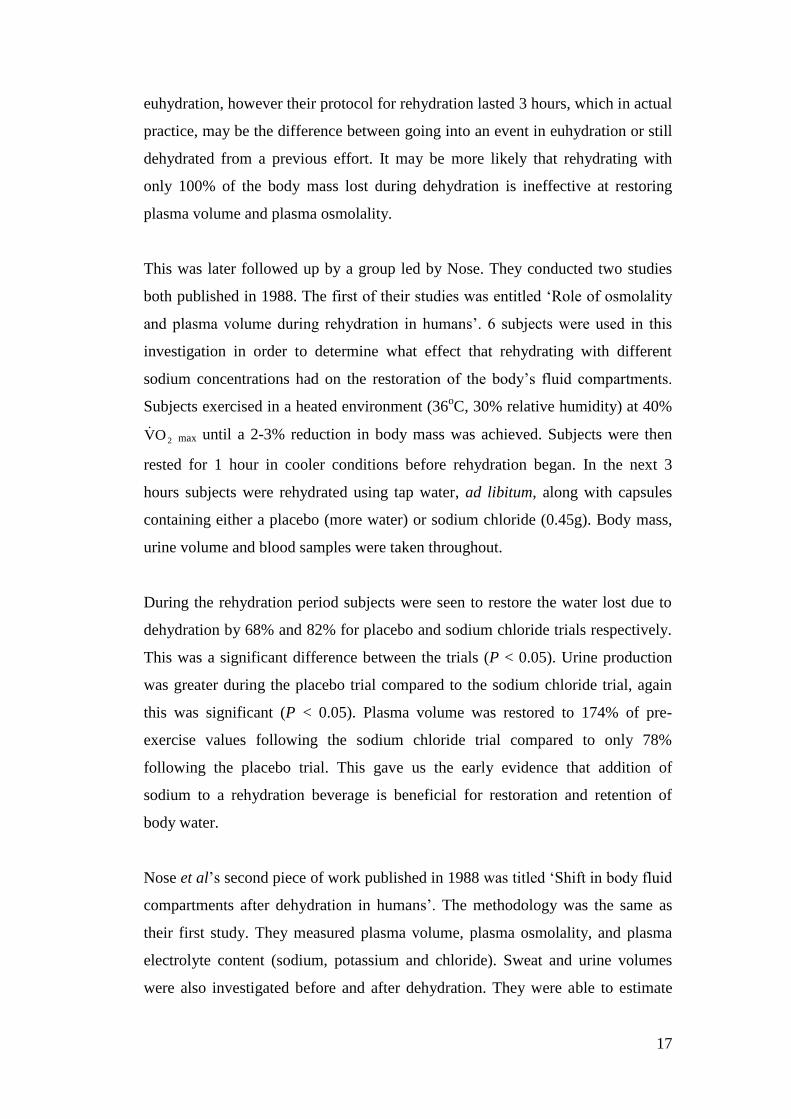
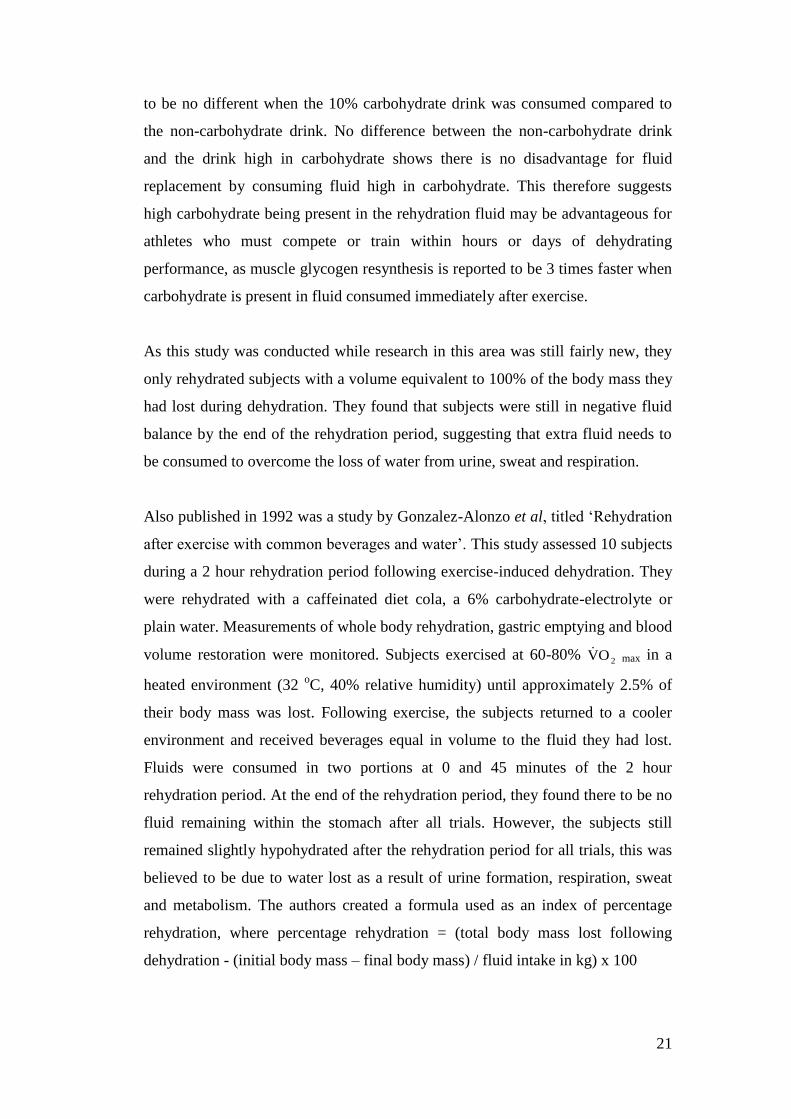
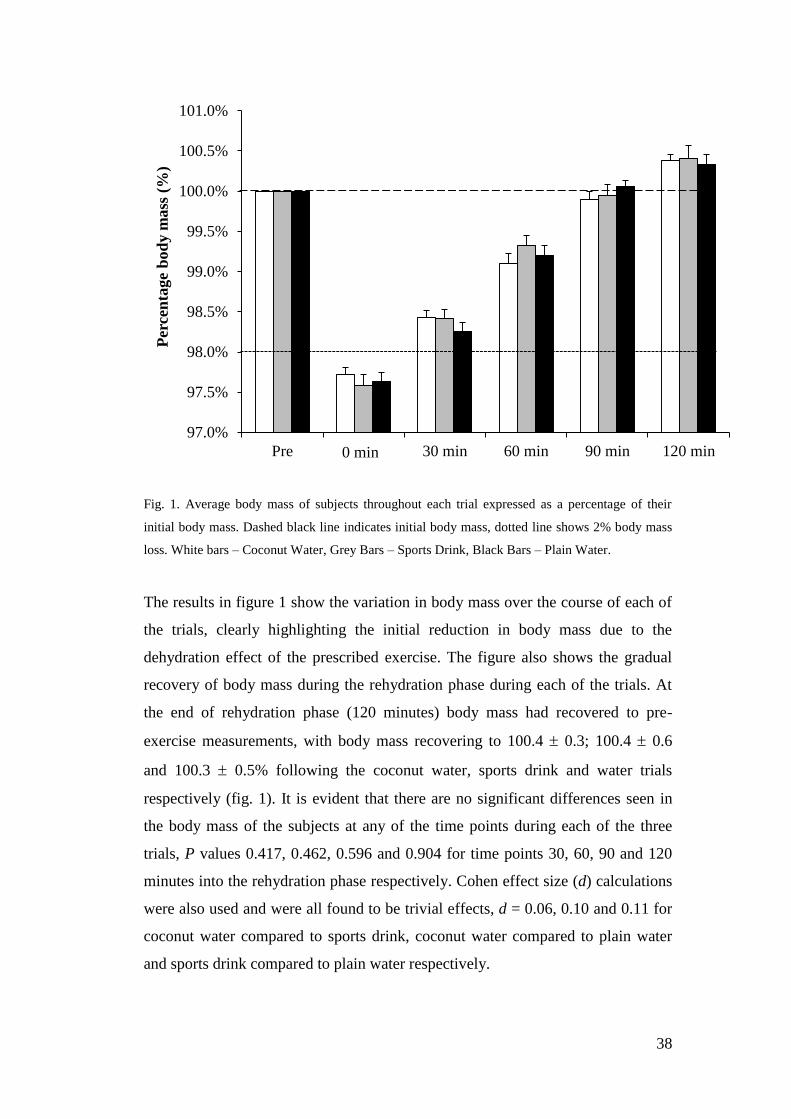
Fig. 1. Average body mass of subjects throughout each trial expressed as a percentage of their
initial body mass. Dashed black line indicates initial body mass, dotted line shows 2% body mass
loss. White bars – Coconut Water, Grey Bars – Sports Drink, Black Bars – Plain Water.
The results in figure 1 show the variation in body mass over the course of each of
the trials, clearly highlighting the initial reduction in body mass due to the
dehydration effect of the prescribed exercise. The figure also shows the gradual
recovery of body mass during the rehydration phase during each of the trials. At
the end of rehydration phase (120 minutes) body mass had recovered to pre-
exercise measurements, with body mass recovering to 100.4 0.3; 100.4 0.6
and 100.3 0.5% following the coconut water, sports drink and water trials
respectively (fig. 1). It is evident that there are no significant differences seen in
the body mass of the subjects at any of the time points during each of the three
trials, P values 0.417, 0.462, 0.596 and 0.904 for time points 30, 60, 90 and 120
minutes into the rehydration phase respectively. Cohen effect size (d) calculations
were also used and were all found to be trivial effects, d = 0.06, 0.10 and 0.11 for
coconut water compared to sports drink, coconut water compared to plain water
and sports drink compared to plain water respectively.
97.0%
97.5%
98.0%
98.5%
99.0%
99.5%
100.0%
100.5%
101.0%
Pre Post 30 min 60 min 90 min 120 min
Per
cen
tage
bod
y m
ass
(%
)
0 min
39
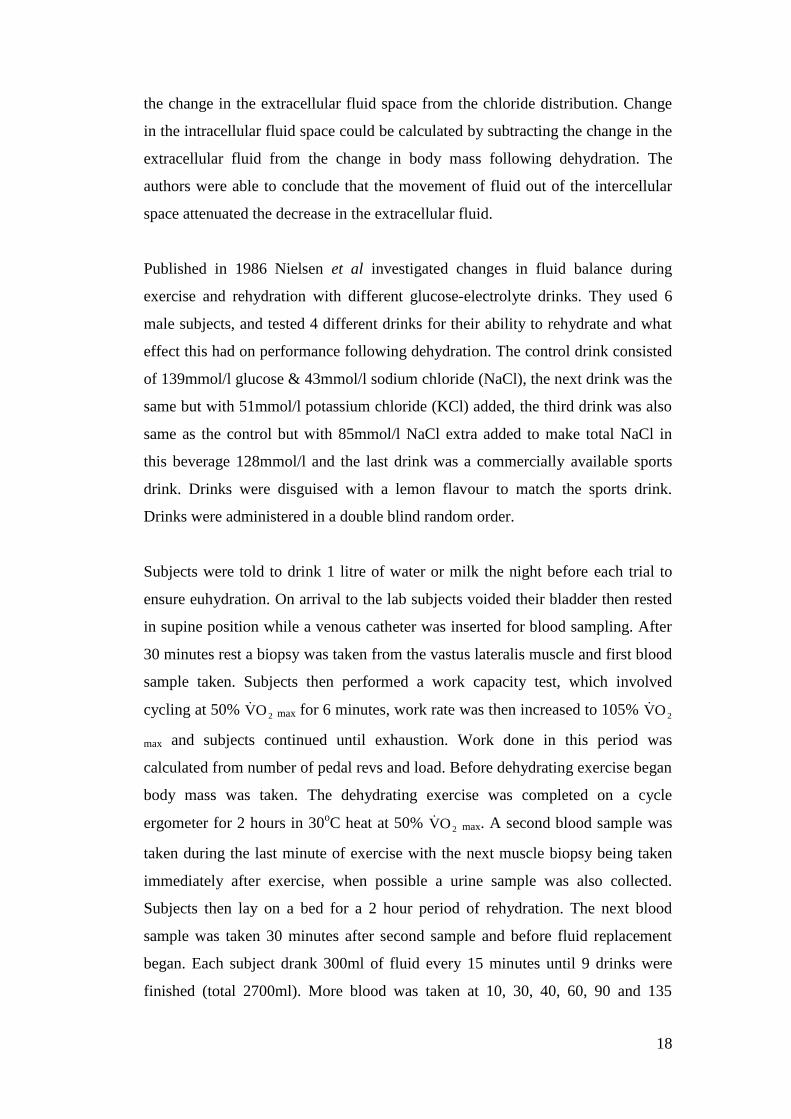
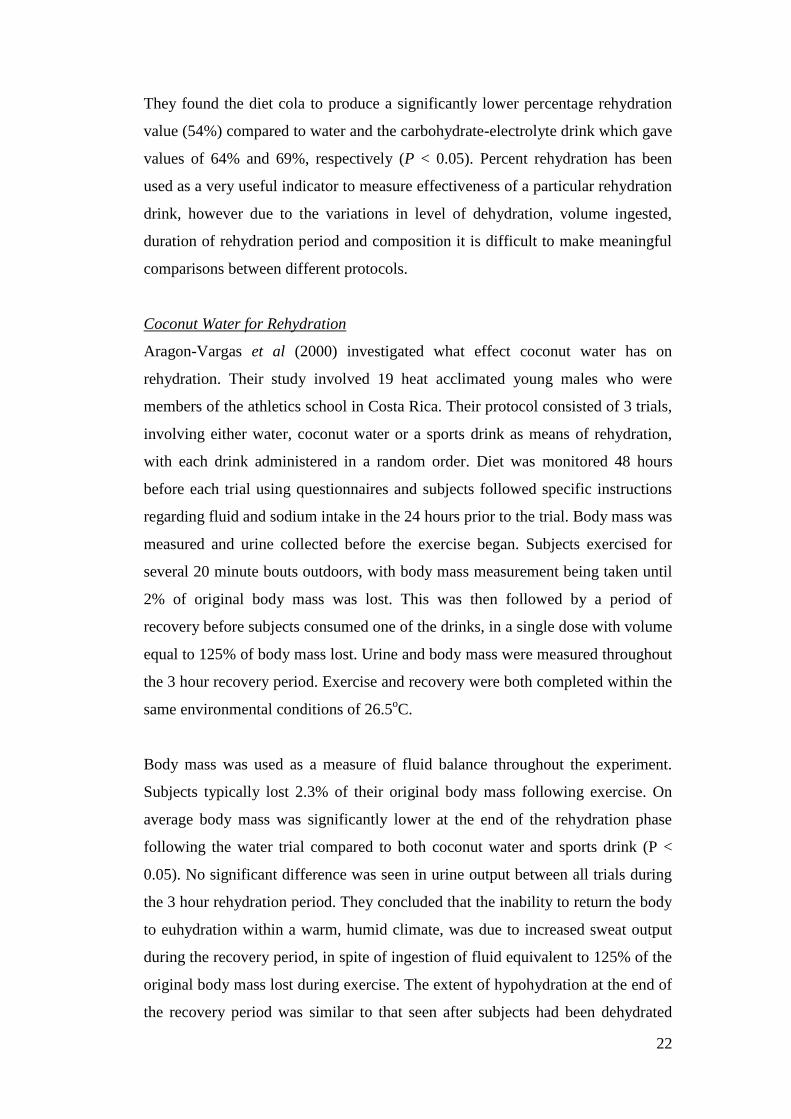
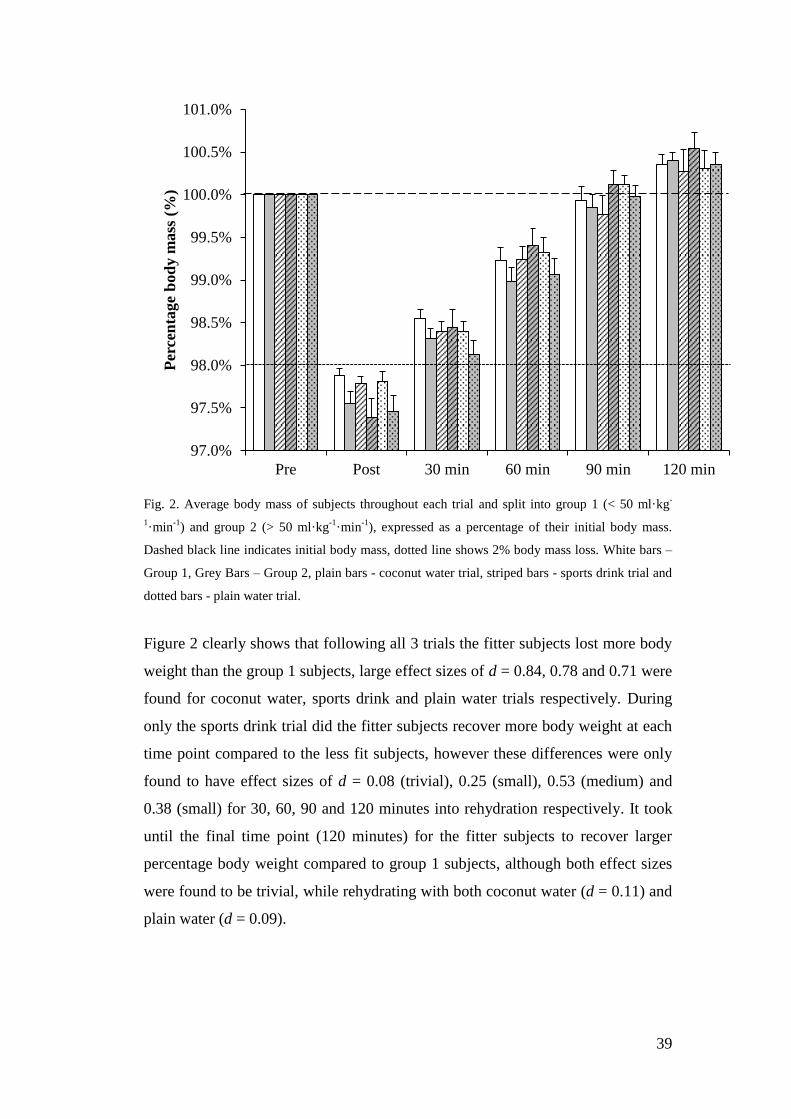
Fig. 2. Average body mass of subjects throughout each trial and split into group 1 (< 50 ml·kg-
1·min
-1) and group 2 (> 50 ml·kg
-1·min
-1), expressed as a percentage of their initial body mass.
Dashed black line indicates initial body mass, dotted line shows 2% body mass loss. White bars –
Group 1, Grey Bars – Group 2, plain bars - coconut water trial, striped bars - sports drink trial and
dotted bars - plain water trial.
Figure 2 clearly shows that following all 3 trials the fitter subjects lost more body
weight than the group 1 subjects, large effect sizes of d = 0.84, 0.78 and 0.71 were
found for coconut water, sports drink and plain water trials respectively. During
only the sports drink trial did the fitter subjects recover more body weight at each
time point compared to the less fit subjects, however these differences were only
found to have effect sizes of d = 0.08 (trivial), 0.25 (small), 0.53 (medium) and
0.38 (small) for 30, 60, 90 and 120 minutes into rehydration respectively. It took
until the final time point (120 minutes) for the fitter subjects to recover larger
percentage body weight compared to group 1 subjects, although both effect sizes
were found to be trivial, while rehydrating with both coconut water (d = 0.11) and
plain water (d = 0.09).
97.0%
97.5%
98.0%
98.5%
99.0%
99.5%
100.0%
100.5%
101.0%
Pre Post 30 min 60 min 90 min 120 min
Per
cen
tage
bod
y m
ass
(%
)
40
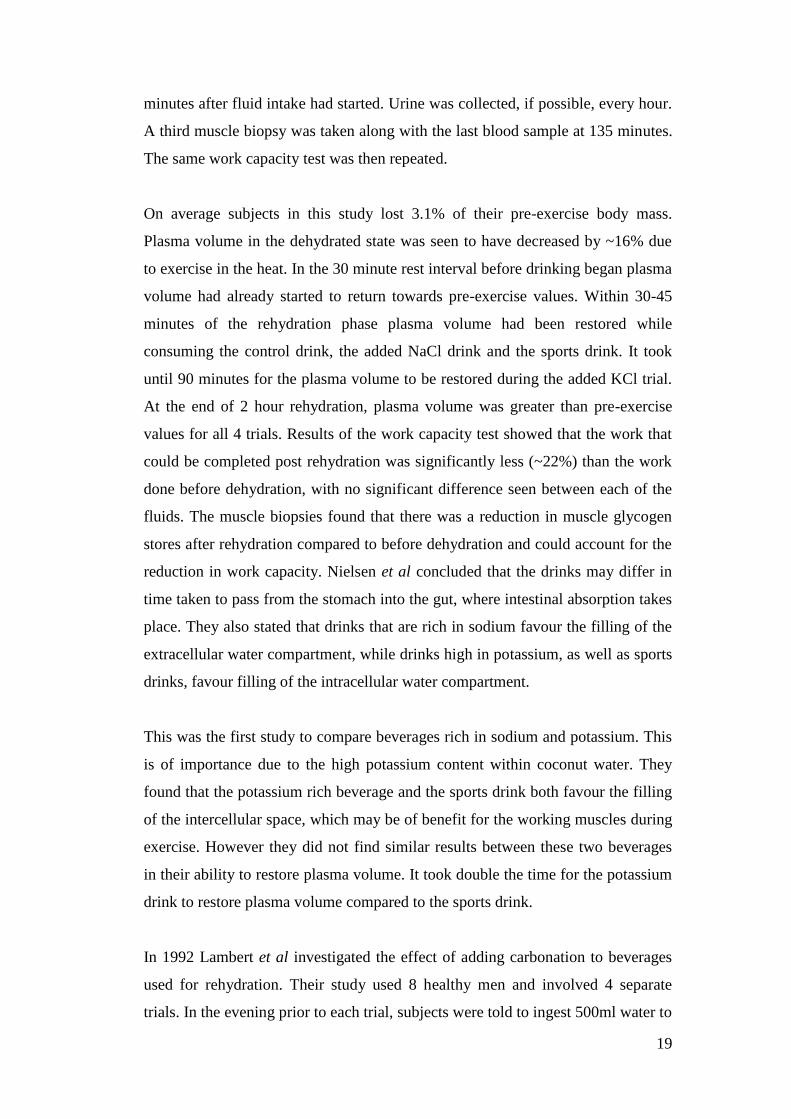
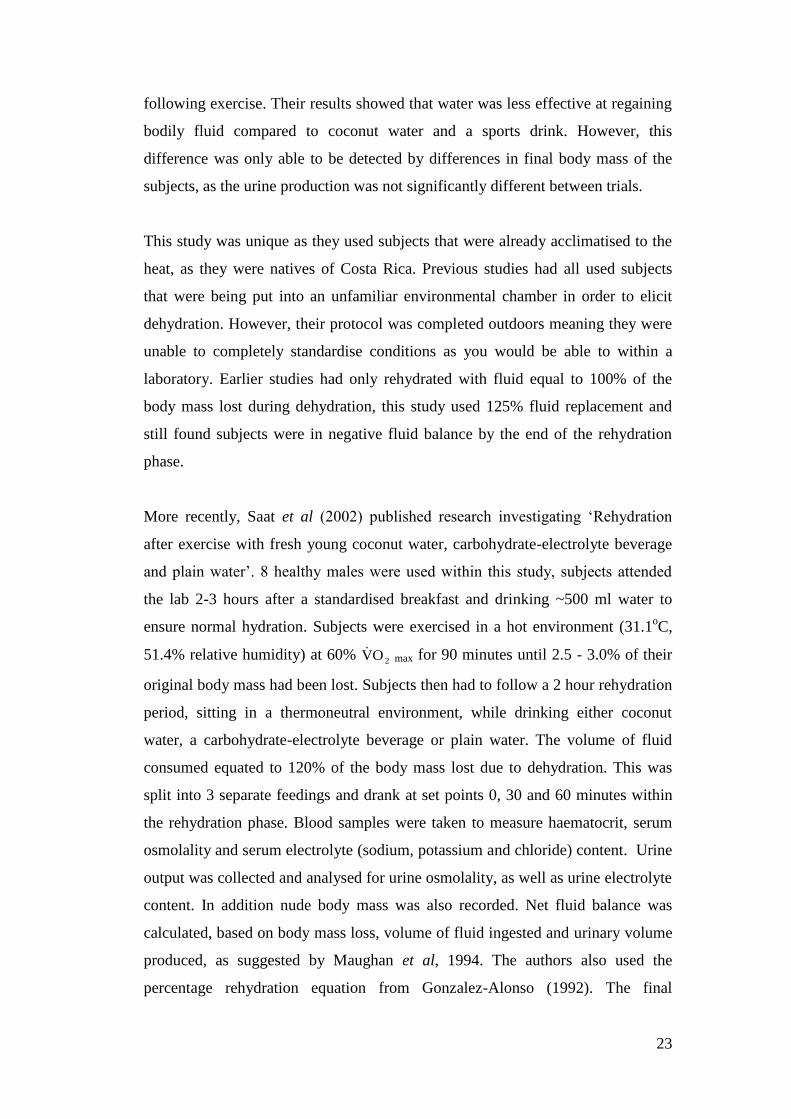
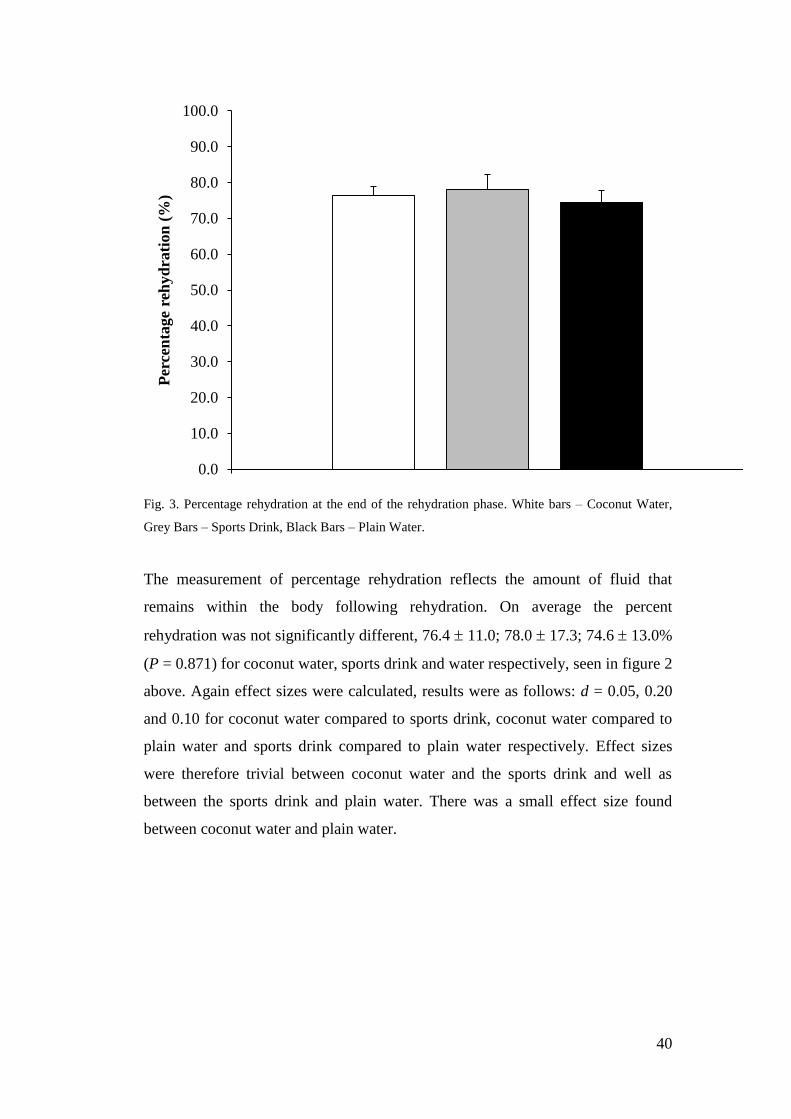
Fig. 3. Percentage rehydration at the end of the rehydration phase. White bars – Coconut Water,
Grey Bars – Sports Drink, Black Bars – Plain Water.
The measurement of percentage rehydration reflects the amount of fluid that
remains within the body following rehydration. On average the percent
rehydration was not significantly different, 76.4 11.0; 78.0 17.3; 74.6 13.0%
(P = 0.871) for coconut water, sports drink and water respectively, seen in figure 2
above. Again effect sizes were calculated, results were as follows: d = 0.05, 0.20
and 0.10 for coconut water compared to sports drink, coconut water compared to
plain water and sports drink compared to plain water respectively. Effect sizes
were therefore trivial between coconut water and the sports drink and well as
between the sports drink and plain water. There was a small effect size found
between coconut water and plain water.
0.0
10.0
20.0
30.0
40.0
50.0
60.0
70.0
80.0
90.0
100.0
Per
cen
tage
reh
yd
rati
on
(%
)
41
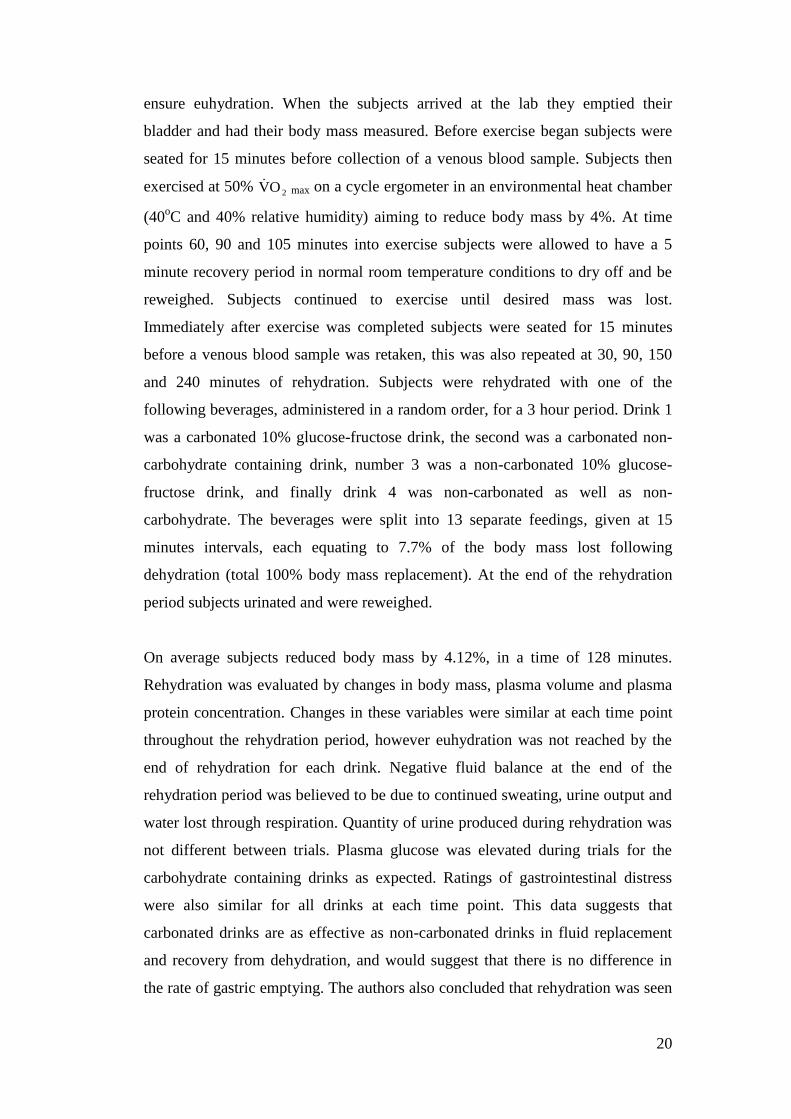
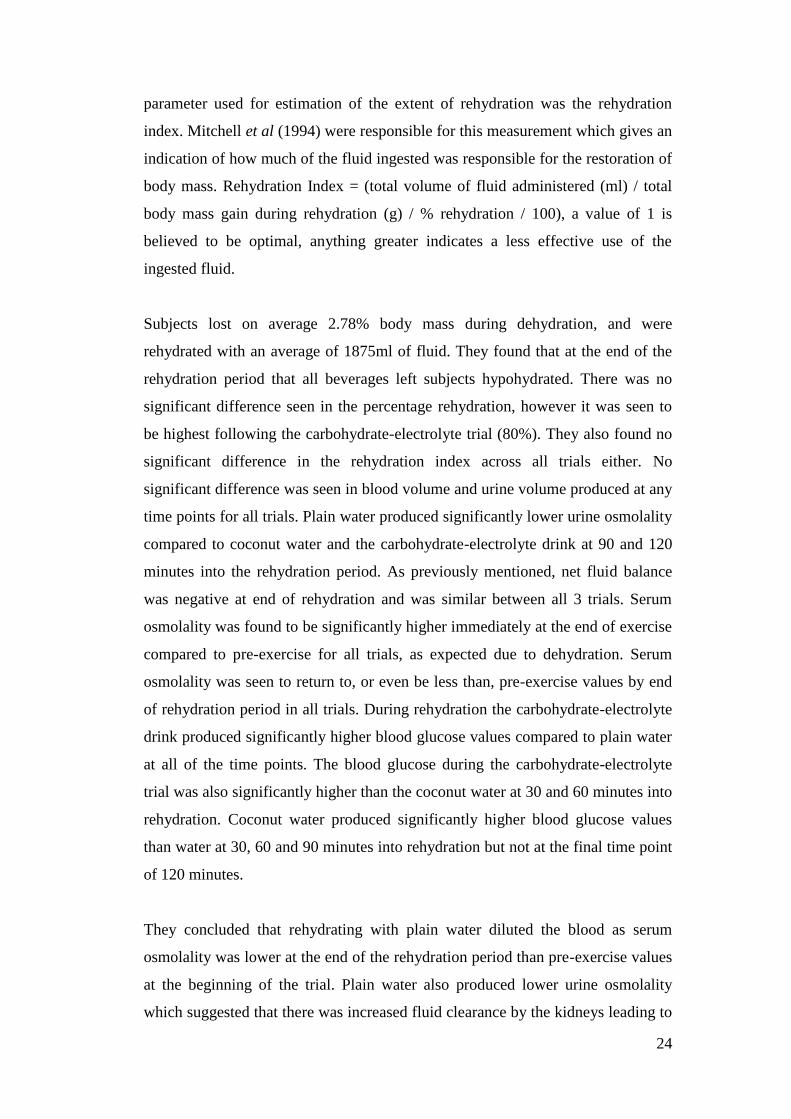
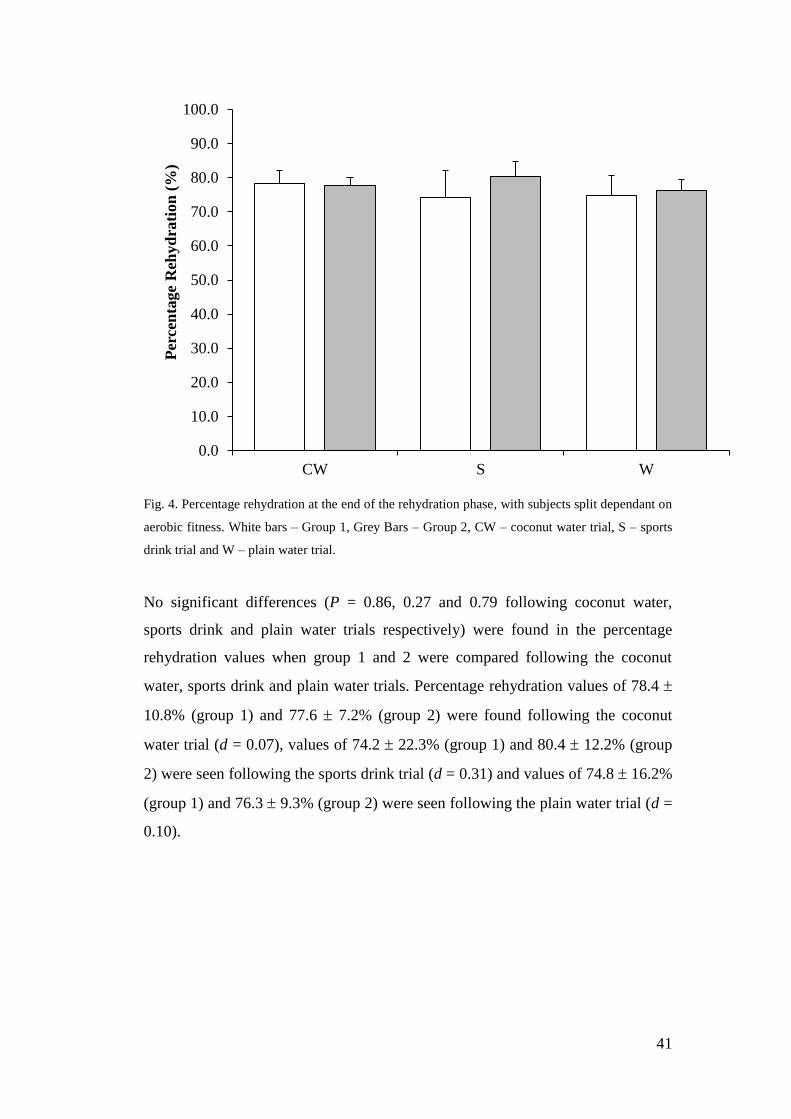
Fig. 4. Percentage rehydration at the end of the rehydration phase, with subjects split dependant on
aerobic fitness. White bars – Group 1, Grey Bars – Group 2, CW – coconut water trial, S – sports
drink trial and W – plain water trial.
No significant differences (P = 0.86, 0.27 and 0.79 following coconut water,
sports drink and plain water trials respectively) were found in the percentage
rehydration values when group 1 and 2 were compared following the coconut
water, sports drink and plain water trials. Percentage rehydration values of 78.4
10.8% (group 1) and 77.6 7.2% (group 2) were found following the coconut
water trial (d = 0.07), values of 74.2 22.3% (group 1) and 80.4 12.2% (group
2) were seen following the sports drink trial (d = 0.31) and values of 74.8 16.2%
(group 1) and 76.3 9.3% (group 2) were seen following the plain water trial (d =
0.10).
0.0
10.0
20.0
30.0
40.0
50.0
60.0
70.0
80.0
90.0
100.0
CW S W
Per
cen
tage
Reh
yd
rati
on
(%
)
42
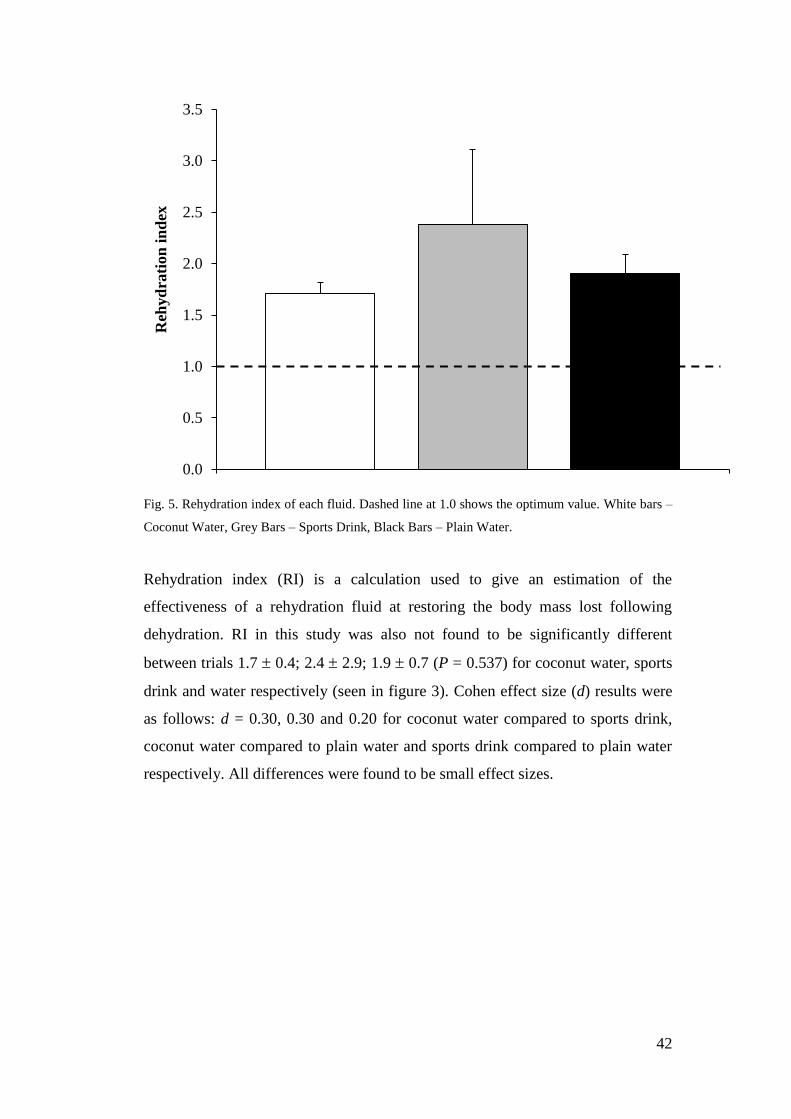
Fig. 5. Rehydration index of each fluid. Dashed line at 1.0 shows the optimum value. White bars –
Coconut Water, Grey Bars – Sports Drink, Black Bars – Plain Water.
Rehydration index (RI) is a calculation used to give an estimation of the
effectiveness of a rehydration fluid at restoring the body mass lost following
dehydration. RI in this study was also not found to be significantly different
between trials 1.7 0.4; 2.4 2.9; 1.9 0.7 (P = 0.537) for coconut water, sports
drink and water respectively (seen in figure 3). Cohen effect size (d) results were
as follows: d = 0.30, 0.30 and 0.20 for coconut water compared to sports drink,
coconut water compared to plain water and sports drink compared to plain water
respectively. All differences were found to be small effect sizes.
0.0
0.5
1.0
1.5
2.0
2.5
3.0
3.5
Reh
yd
rati
on
in
dex
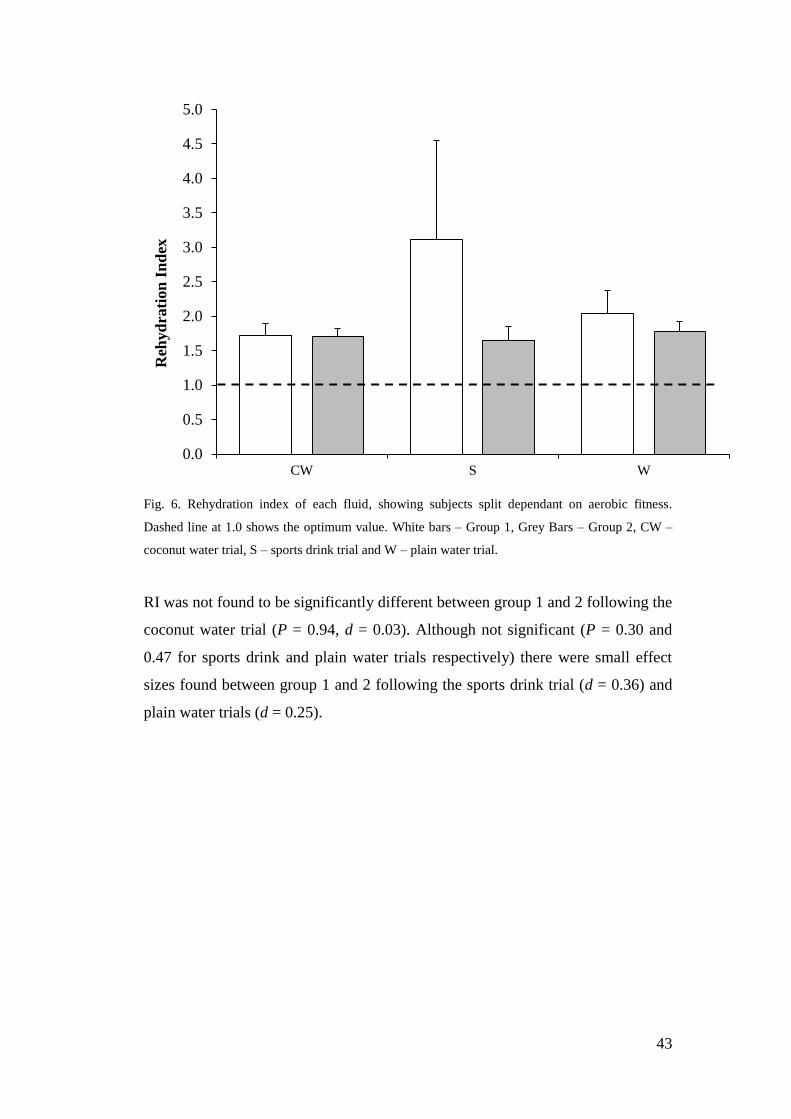
43
Fig. 6. Rehydration index of each fluid, showing subjects split dependant on aerobic fitness.
Dashed line at 1.0 shows the optimum value. White bars – Group 1, Grey Bars – Group 2, CW –
coconut water trial, S – sports drink trial and W – plain water trial.
RI was not found to be significantly different between group 1 and 2 following the
coconut water trial (P = 0.94, d = 0.03). Although not significant (P = 0.30 and
0.47 for sports drink and plain water trials respectively) there were small effect
sizes found between group 1 and 2 following the sports drink trial (d = 0.36) and
plain water trials (d = 0.25).
0.0
0.5
1.0
1.5
2.0
2.5
3.0
3.5
4.0
4.5
5.0
CW S W
Reh
yd
rati
on
In
dex
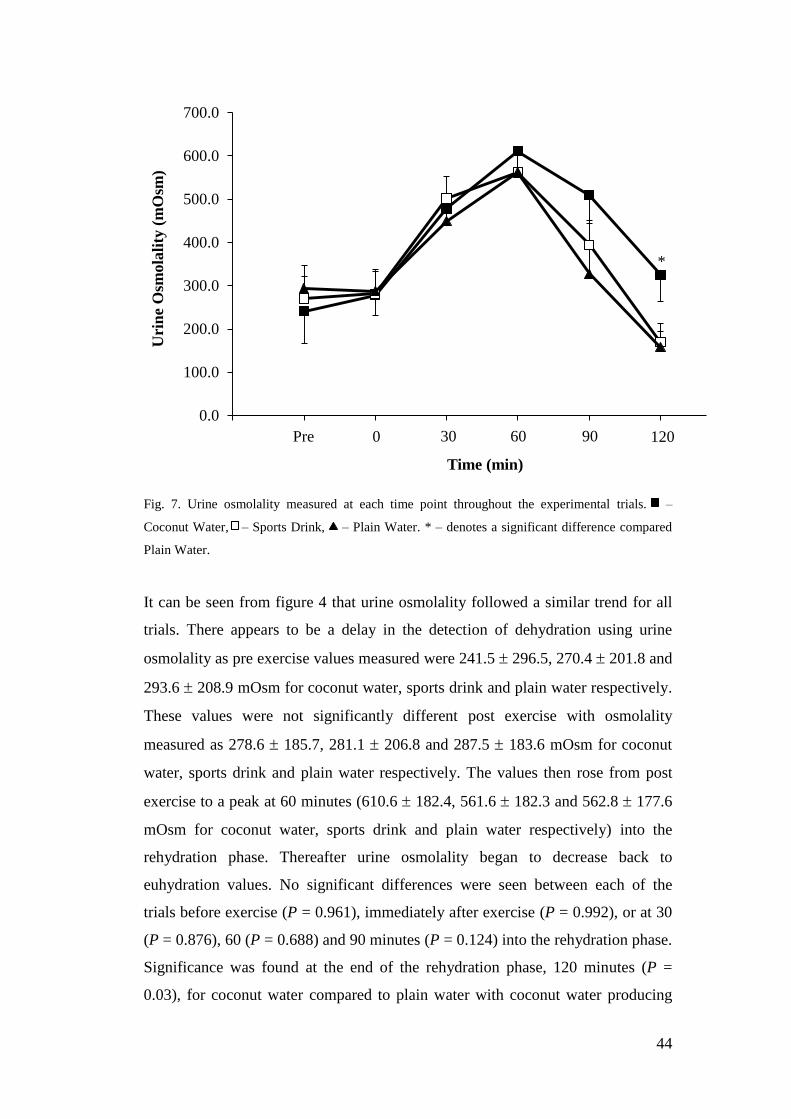
44
Fig. 7. Urine osmolality measured at each time point throughout the experimental trials. –
Coconut Water, – Sports Drink, – Plain Water. * – denotes a significant difference compared
Plain Water.
It can be seen from figure 4 that urine osmolality followed a similar trend for all
trials. There appears to be a delay in the detection of dehydration using urine
osmolality as pre exercise values measured were 241.5 296.5, 270.4 201.8 and
293.6 208.9 mOsm for coconut water, sports drink and plain water respectively.
These values were not significantly different post exercise with osmolality
measured as 278.6 185.7, 281.1 206.8 and 287.5 183.6 mOsm for coconut
water, sports drink and plain water respectively. The values then rose from post
exercise to a peak at 60 minutes (610.6 182.4, 561.6 182.3 and 562.8 177.6
mOsm for coconut water, sports drink and plain water respectively) into the
rehydration phase. Thereafter urine osmolality began to decrease back to
euhydration values. No significant differences were seen between each of the
trials before exercise (P = 0.961), immediately after exercise (P = 0.992), or at 30
(P = 0.876), 60 (P = 0.688) and 90 minutes (P = 0.124) into the rehydration phase.
Significance was found at the end of the rehydration phase, 120 minutes (P =
0.03), for coconut water compared to plain water with coconut water producing
0.0
100.0
200.0
300.0
400.0
500.0
600.0
700.0
0 1 2 3 4 5 6 7
Uri
ne
Osm
ola
lity
(m
Osm
)
Time (min)
Pre 0 30 60 90 120
*
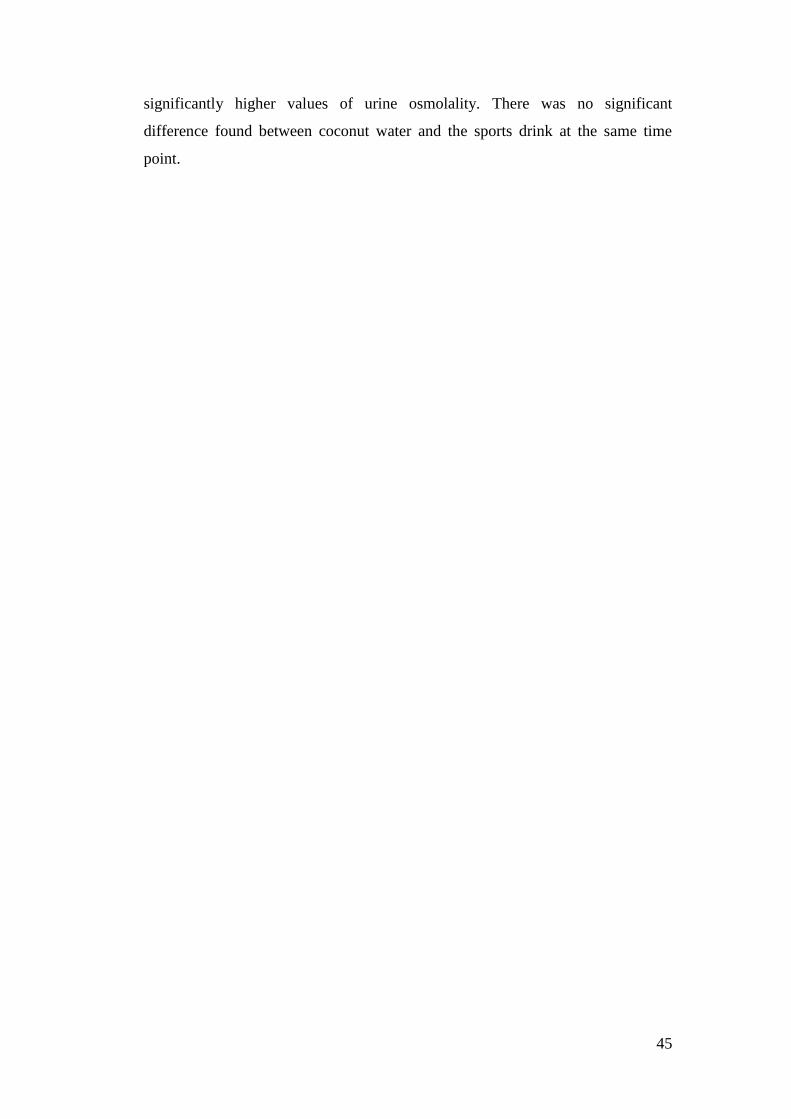
45
significantly higher values of urine osmolality. There was no significant
difference found between coconut water and the sports drink at the same time
point.
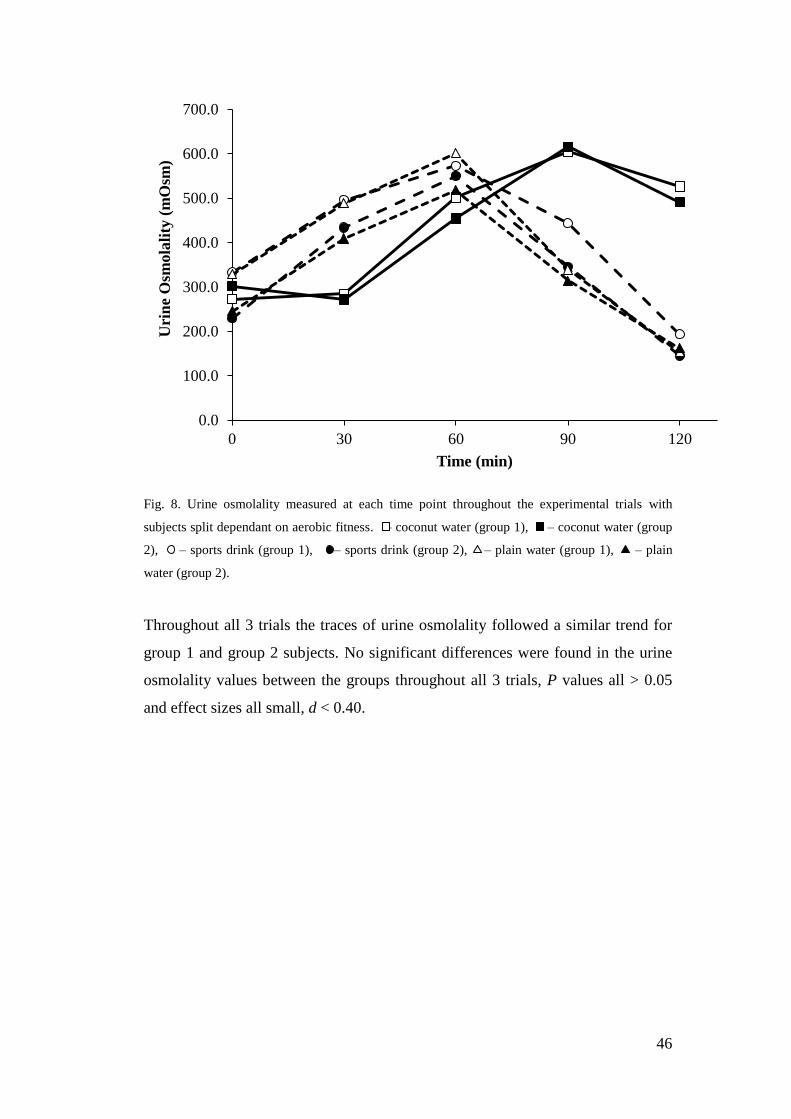
46
Fig. 8. Urine osmolality measured at each time point throughout the experimental trials with
subjects split dependant on aerobic fitness. – coconut water (group 1), – coconut water (group
2), – sports drink (group 1), – sports drink (group 2), – plain water (group 1), – plain
water (group 2).
Throughout all 3 trials the traces of urine osmolality followed a similar trend for
group 1 and group 2 subjects. No significant differences were found in the urine
osmolality values between the groups throughout all 3 trials, P values all > 0.05
and effect sizes all small, d < 0.40.
0.0
100.0
200.0
300.0
400.0
500.0
600.0
700.0
0 30 60 90 120
Uri
ne
Osm
ola
lity
(m
Osm
)
Time (min)
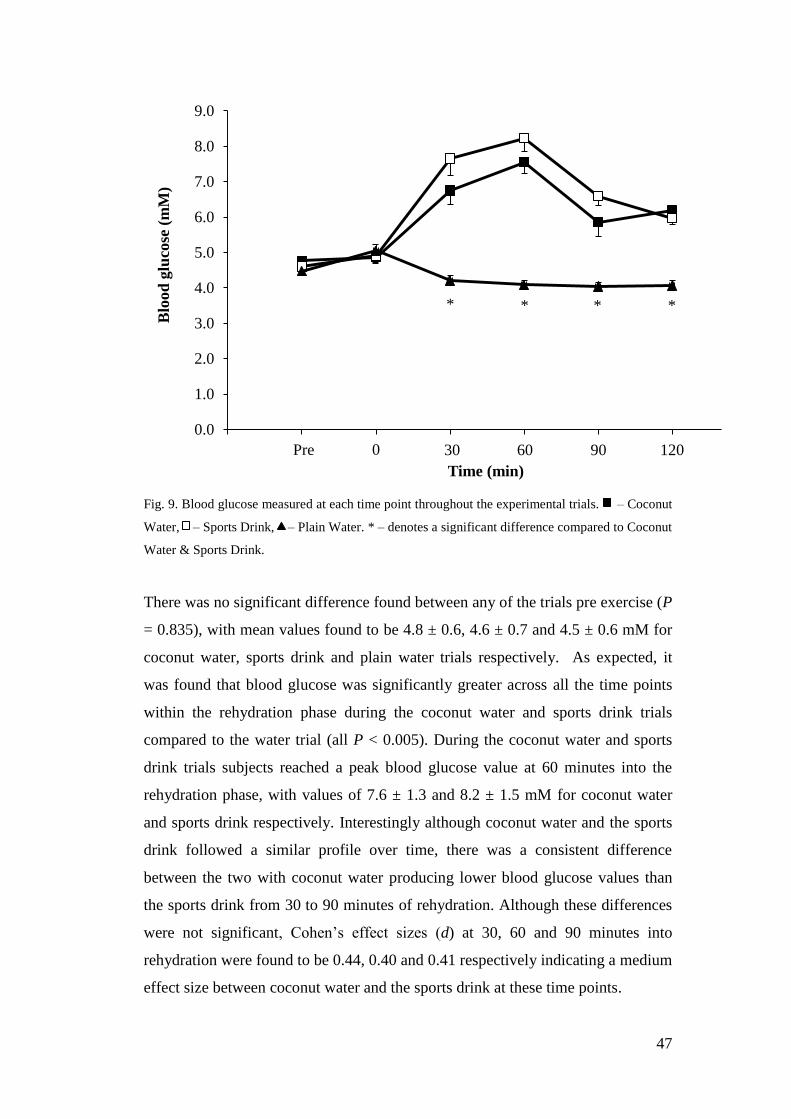
47
Fig. 9. Blood glucose measured at each time point throughout the experimental trials. – Coconut
Water, – Sports Drink, – Plain Water. * – denotes a significant difference compared to Coconut
Water & Sports Drink.
There was no significant difference found between any of the trials pre exercise (P
= 0.835), with mean values found to be 4.8 ± 0.6, 4.6 ± 0.7 and 4.5 ± 0.6 mM for
coconut water, sports drink and plain water trials respectively. As expected, it
was found that blood glucose was significantly greater across all the time points
within the rehydration phase during the coconut water and sports drink trials
compared to the water trial (all P < 0.005). During the coconut water and sports
drink trials subjects reached a peak blood glucose value at 60 minutes into the
rehydration phase, with values of 7.6 ± 1.3 and 8.2 ± 1.5 mM for coconut water
and sports drink respectively. Interestingly although coconut water and the sports
drink followed a similar profile over time, there was a consistent difference
between the two with coconut water producing lower blood glucose values than
the sports drink from 30 to 90 minutes of rehydration. Although these differences
were not significant, Cohen’s effect sizes (d) at 30, 60 and 90 minutes into
rehydration were found to be 0.44, 0.40 and 0.41 respectively indicating a medium
effect size between coconut water and the sports drink at these time points.
0.0
1.0
2.0
3.0
4.0
5.0
6.0
7.0
8.0
9.0
0 30 60 90 120 150 180
Blo
od
glu
cose
(m
M)
Time (min)
Pre 0 30 60 90 120
* * * *
48
Fig. 10. Blood glucose measured at each time point throughout the experimental trials, showing
subjects grouped dependant on fitness levels. – coconut water (group 1), – coconut water
(group 2), – sports drink (group 1), – sports drink (group 2), – plain water (group 1), –
plain water (group 2).
Again throughout all 3 trials the traces for group 1 and group 2 were found to
follow the same trend. No significant differences were found in blood glucose
values between group 1 and 2, P values all > 0.05 and effect sizes all small, d <
0.40.
0.0
1.0
2.0
3.0
4.0
5.0
6.0
7.0
8.0
9.0
10.0
0 30 60 90 120
Blo
od
Glu
cose
(m
mol·
l-1)
Time (min)
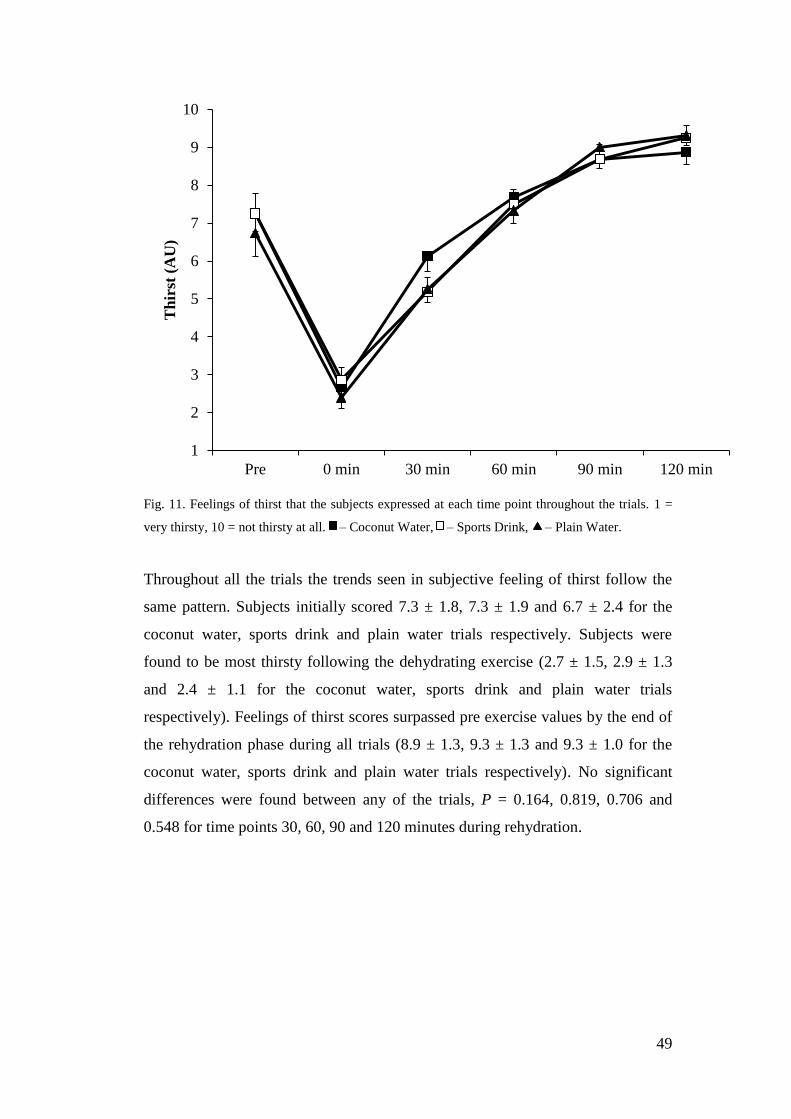
49
Fig. 11. Feelings of thirst that the subjects expressed at each time point throughout the trials. 1 =
very thirsty, 10 = not thirsty at all. – Coconut Water, – Sports Drink, – Plain Water.
Throughout all the trials the trends seen in subjective feeling of thirst follow the
same pattern. Subjects initially scored 7.3 ± 1.8, 7.3 ± 1.9 and 6.7 ± 2.4 for the
coconut water, sports drink and plain water trials respectively. Subjects were
found to be most thirsty following the dehydrating exercise (2.7 ± 1.5, 2.9 ± 1.3
and 2.4 ± 1.1 for the coconut water, sports drink and plain water trials
respectively). Feelings of thirst scores surpassed pre exercise values by the end of
the rehydration phase during all trials (8.9 ± 1.3, 9.3 ± 1.3 and 9.3 ± 1.0 for the
coconut water, sports drink and plain water trials respectively). No significant
differences were found between any of the trials, P = 0.164, 0.819, 0.706 and
0.548 for time points 30, 60, 90 and 120 minutes during rehydration.
1
2
3
4
5
6
7
8
9
10
Pre 0 min 30 min 60 min 90 min 120 min
Th
irst
(A
U)
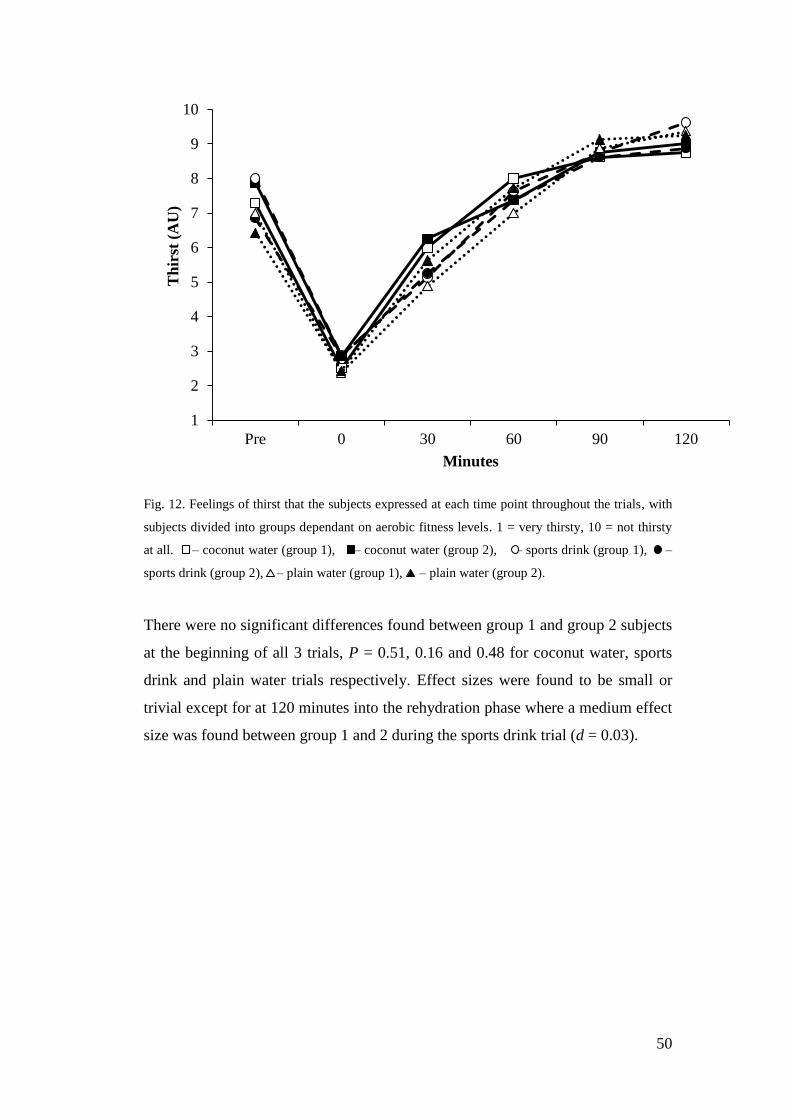
50
Fig. 12. Feelings of thirst that the subjects expressed at each time point throughout the trials, with
subjects divided into groups dependant on aerobic fitness levels. 1 = very thirsty, 10 = not thirsty
at all. – coconut water (group 1), – coconut water (group 2), – sports drink (group 1), –
sports drink (group 2), – plain water (group 1), – plain water (group 2).
There were no significant differences found between group 1 and group 2 subjects
at the beginning of all 3 trials, P = 0.51, 0.16 and 0.48 for coconut water, sports
drink and plain water trials respectively. Effect sizes were found to be small or
trivial except for at 120 minutes into the rehydration phase where a medium effect
size was found between group 1 and 2 during the sports drink trial (d = 0.03).
1
2
3
4
5
6
7
8
9
10
Pre 0 30 60 90 120
Th
irst
(A
U)
Minutes
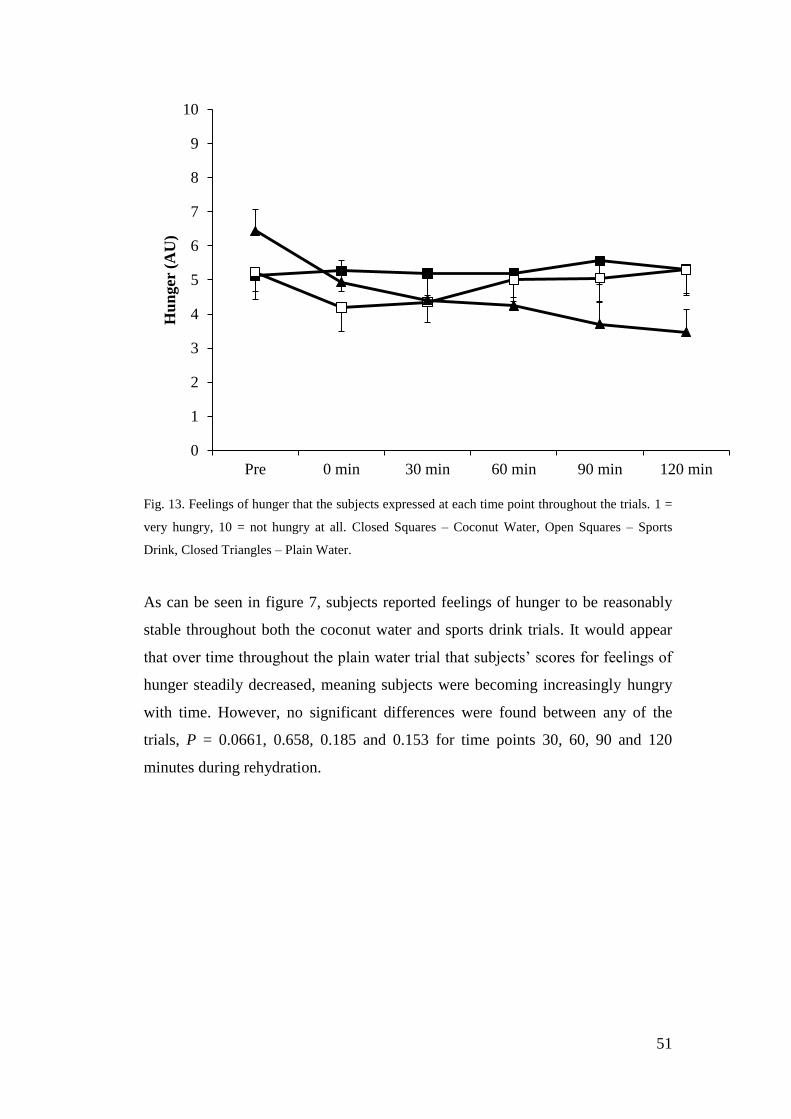
51
Fig. 13. Feelings of hunger that the subjects expressed at each time point throughout the trials. 1 =
very hungry, 10 = not hungry at all. Closed Squares – Coconut Water, Open Squares – Sports
Drink, Closed Triangles – Plain Water.
As can be seen in figure 7, subjects reported feelings of hunger to be reasonably
stable throughout both the coconut water and sports drink trials. It would appear
that over time throughout the plain water trial that subjects’ scores for feelings of
hunger steadily decreased, meaning subjects were becoming increasingly hungry
with time. However, no significant differences were found between any of the
trials, P = 0.0661, 0.658, 0.185 and 0.153 for time points 30, 60, 90 and 120
minutes during rehydration.
0
1
2
3
4
5
6
7
8
9
10
Pre 0 min 30 min 60 min 90 min 120 min
Hu
nger
(A
U)
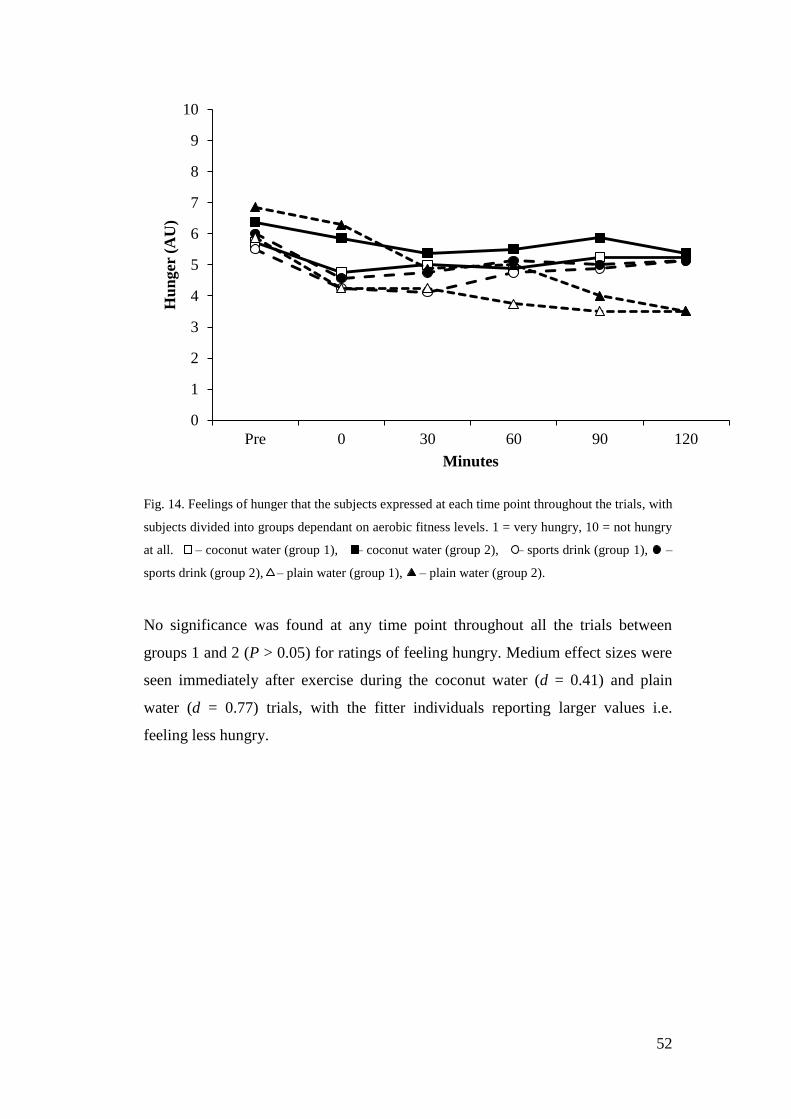
52
Fig. 14. Feelings of hunger that the subjects expressed at each time point throughout the trials, with
subjects divided into groups dependant on aerobic fitness levels. 1 = very hungry, 10 = not hungry
at all. – coconut water (group 1), – coconut water (group 2), – sports drink (group 1), –
sports drink (group 2), – plain water (group 1), – plain water (group 2).
No significance was found at any time point throughout all the trials between
groups 1 and 2 (P > 0.05) for ratings of feeling hungry. Medium effect sizes were
seen immediately after exercise during the coconut water (d = 0.41) and plain
water (d = 0.77) trials, with the fitter individuals reporting larger values i.e.
feeling less hungry.
0
1
2
3
4
5
6
7
8
9
10
Pre 0 30 60 90 120
Hu
nger
(A
U)
Minutes
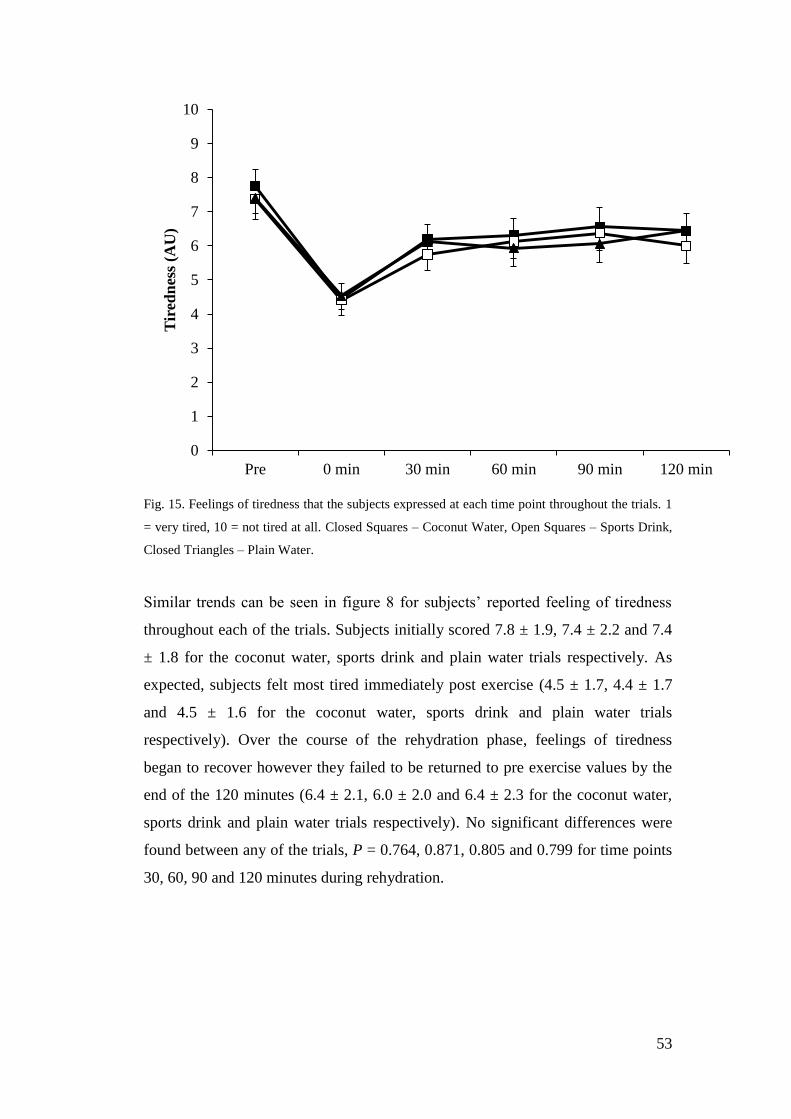
53
Fig. 15. Feelings of tiredness that the subjects expressed at each time point throughout the trials. 1
= very tired, 10 = not tired at all. Closed Squares – Coconut Water, Open Squares – Sports Drink,
Closed Triangles – Plain Water.
Similar trends can be seen in figure 8 for subjects’ reported feeling of tiredness
throughout each of the trials. Subjects initially scored 7.8 ± 1.9, 7.4 ± 2.2 and 7.4
± 1.8 for the coconut water, sports drink and plain water trials respectively. As
expected, subjects felt most tired immediately post exercise (4.5 ± 1.7, 4.4 ± 1.7
and 4.5 ± 1.6 for the coconut water, sports drink and plain water trials
respectively). Over the course of the rehydration phase, feelings of tiredness
began to recover however they failed to be returned to pre exercise values by the
end of the 120 minutes (6.4 ± 2.1, 6.0 ± 2.0 and 6.4 ± 2.3 for the coconut water,
sports drink and plain water trials respectively). No significant differences were
found between any of the trials, P = 0.764, 0.871, 0.805 and 0.799 for time points
30, 60, 90 and 120 minutes during rehydration.
0
1
2
3
4
5
6
7
8
9
10
Pre 0 min 30 min 60 min 90 min 120 min
Tir
edn
ess
(AU
)
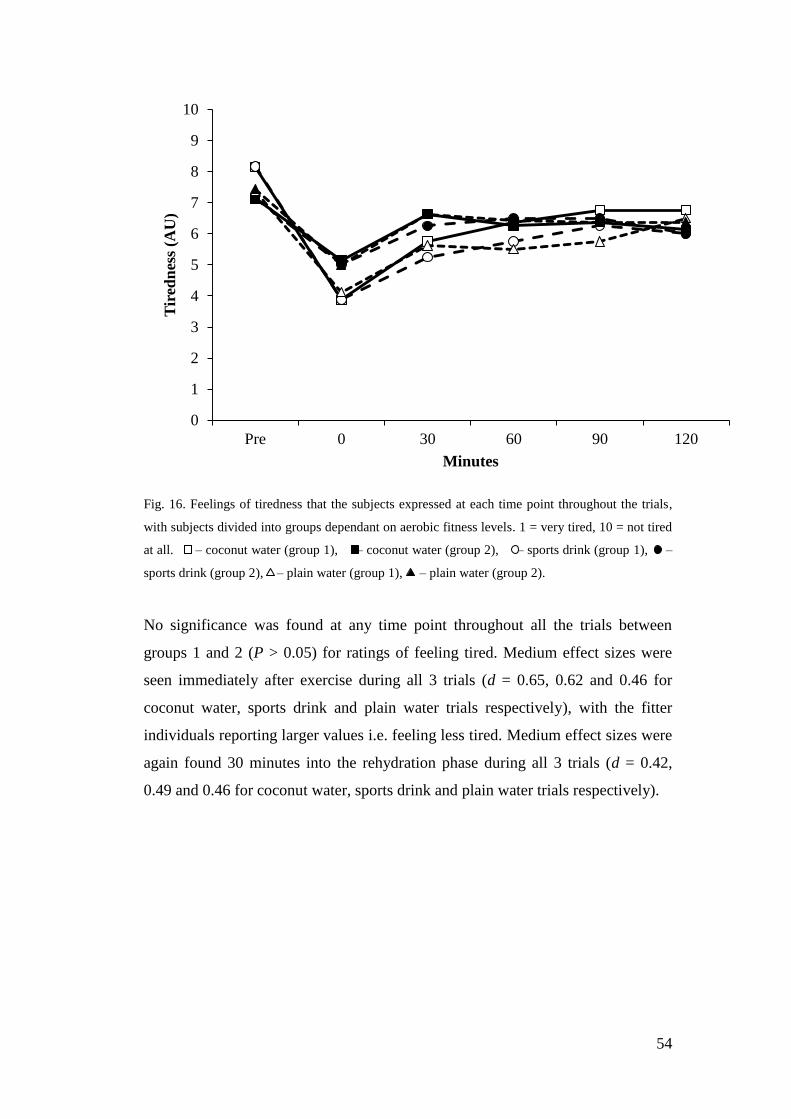
54
Fig. 16. Feelings of tiredness that the subjects expressed at each time point throughout the trials,
with subjects divided into groups dependant on aerobic fitness levels. 1 = very tired, 10 = not tired
at all. – coconut water (group 1), – coconut water (group 2), – sports drink (group 1), –
sports drink (group 2), – plain water (group 1), – plain water (group 2).
No significance was found at any time point throughout all the trials between
groups 1 and 2 (P > 0.05) for ratings of feeling tired. Medium effect sizes were
seen immediately after exercise during all 3 trials (d = 0.65, 0.62 and 0.46 for
coconut water, sports drink and plain water trials respectively), with the fitter
individuals reporting larger values i.e. feeling less tired. Medium effect sizes were
again found 30 minutes into the rehydration phase during all 3 trials (d = 0.42,
0.49 and 0.46 for coconut water, sports drink and plain water trials respectively).
0
1
2
3
4
5
6
7
8
9
10
Pre 0 30 60 90 120
Tir
edn
ess
(AU
)
Minutes
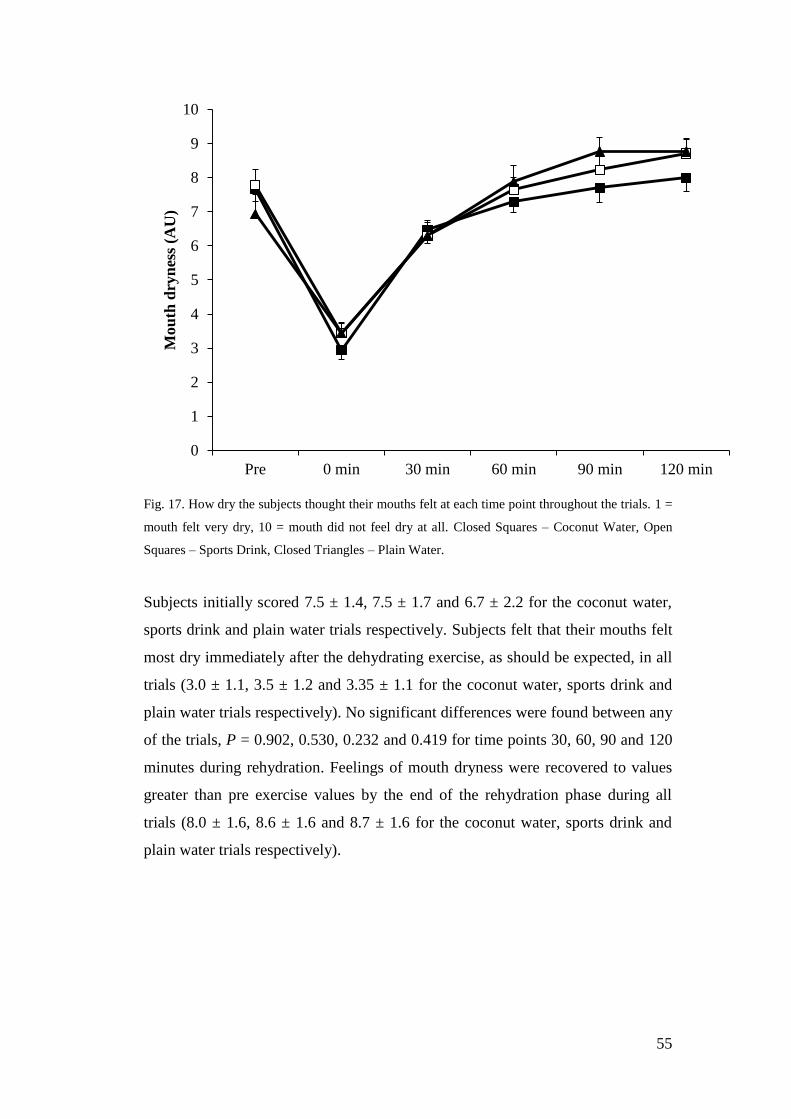
55
Fig. 17. How dry the subjects thought their mouths felt at each time point throughout the trials. 1 =
mouth felt very dry, 10 = mouth did not feel dry at all. Closed Squares – Coconut Water, Open
Squares – Sports Drink, Closed Triangles – Plain Water.
Subjects initially scored 7.5 ± 1.4, 7.5 ± 1.7 and 6.7 ± 2.2 for the coconut water,
sports drink and plain water trials respectively. Subjects felt that their mouths felt
most dry immediately after the dehydrating exercise, as should be expected, in all
trials (3.0 ± 1.1, 3.5 ± 1.2 and 3.35 ± 1.1 for the coconut water, sports drink and
plain water trials respectively). No significant differences were found between any
of the trials, P = 0.902, 0.530, 0.232 and 0.419 for time points 30, 60, 90 and 120
minutes during rehydration. Feelings of mouth dryness were recovered to values
greater than pre exercise values by the end of the rehydration phase during all
trials (8.0 ± 1.6, 8.6 ± 1.6 and 8.7 ± 1.6 for the coconut water, sports drink and
plain water trials respectively).
0
1
2
3
4
5
6
7
8
9
10
Pre 0 min 30 min 60 min 90 min 120 min
Mou
th d
ryn
ess
(AU
)
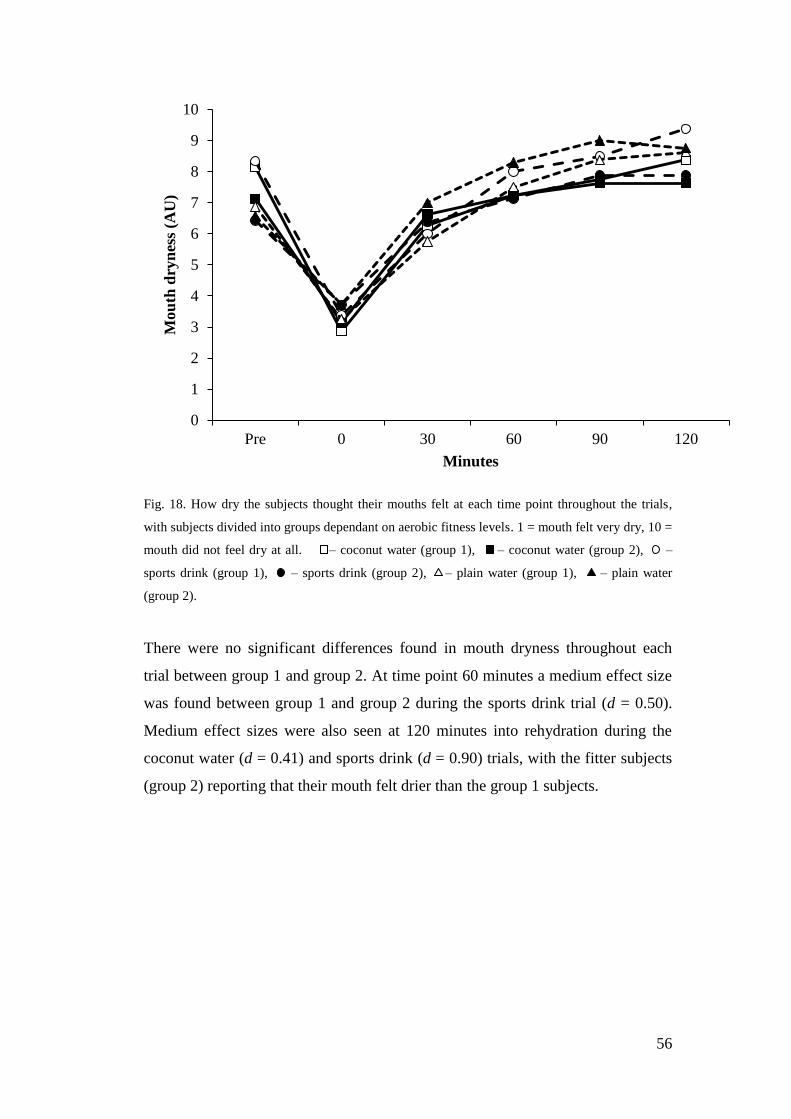
56
Fig. 18. How dry the subjects thought their mouths felt at each time point throughout the trials,
with subjects divided into groups dependant on aerobic fitness levels. 1 = mouth felt very dry, 10 =
mouth did not feel dry at all. – coconut water (group 1), – coconut water (group 2), –
sports drink (group 1), – sports drink (group 2), – plain water (group 1), – plain water
(group 2).
There were no significant differences found in mouth dryness throughout each
trial between group 1 and group 2. At time point 60 minutes a medium effect size
was found between group 1 and group 2 during the sports drink trial (d = 0.50).
Medium effect sizes were also seen at 120 minutes into rehydration during the
coconut water (d = 0.41) and sports drink (d = 0.90) trials, with the fitter subjects
(group 2) reporting that their mouth felt drier than the group 1 subjects.
0
1
2
3
4
5
6
7
8
9
10
Pre 0 30 60 90 120
Mou
th d
ryn
ess
(AU
)
Minutes
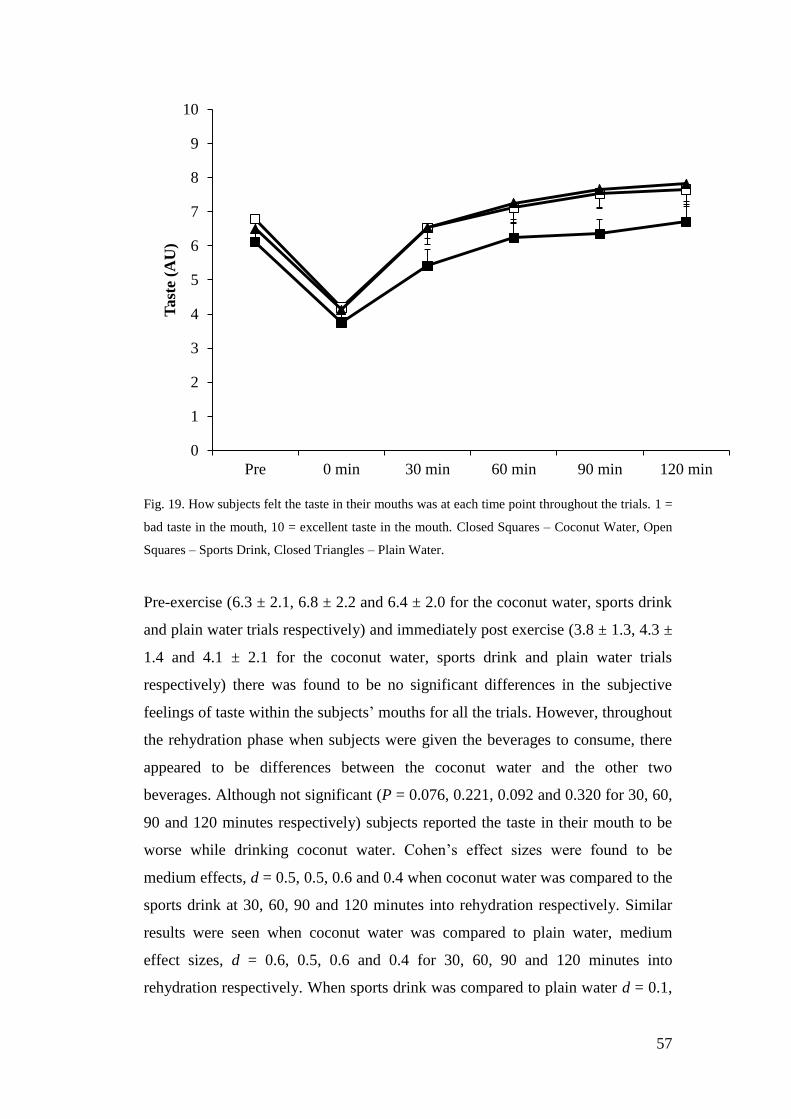
57
Fig. 19. How subjects felt the taste in their mouths was at each time point throughout the trials. 1 =
bad taste in the mouth, 10 = excellent taste in the mouth. Closed Squares – Coconut Water, Open
Squares – Sports Drink, Closed Triangles – Plain Water.
Pre-exercise (6.3 ± 2.1, 6.8 ± 2.2 and 6.4 ± 2.0 for the coconut water, sports drink
and plain water trials respectively) and immediately post exercise (3.8 ± 1.3, 4.3 ±
1.4 and 4.1 ± 2.1 for the coconut water, sports drink and plain water trials
respectively) there was found to be no significant differences in the subjective
feelings of taste within the subjects’ mouths for all the trials. However, throughout
the rehydration phase when subjects were given the beverages to consume, there
appeared to be differences between the coconut water and the other two
beverages. Although not significant (P = 0.076, 0.221, 0.092 and 0.320 for 30, 60,
90 and 120 minutes respectively) subjects reported the taste in their mouth to be
worse while drinking coconut water. Cohen’s effect sizes were found to be
medium effects, d = 0.5, 0.5, 0.6 and 0.4 when coconut water was compared to the
sports drink at 30, 60, 90 and 120 minutes into rehydration respectively. Similar
results were seen when coconut water was compared to plain water, medium
effect sizes, d = 0.6, 0.5, 0.6 and 0.4 for 30, 60, 90 and 120 minutes into
rehydration respectively. When sports drink was compared to plain water d = 0.1,
0
1
2
3
4
5
6
7
8
9
10
Pre 0 min 30 min 60 min 90 min 120 min
Tast
e (A
U)
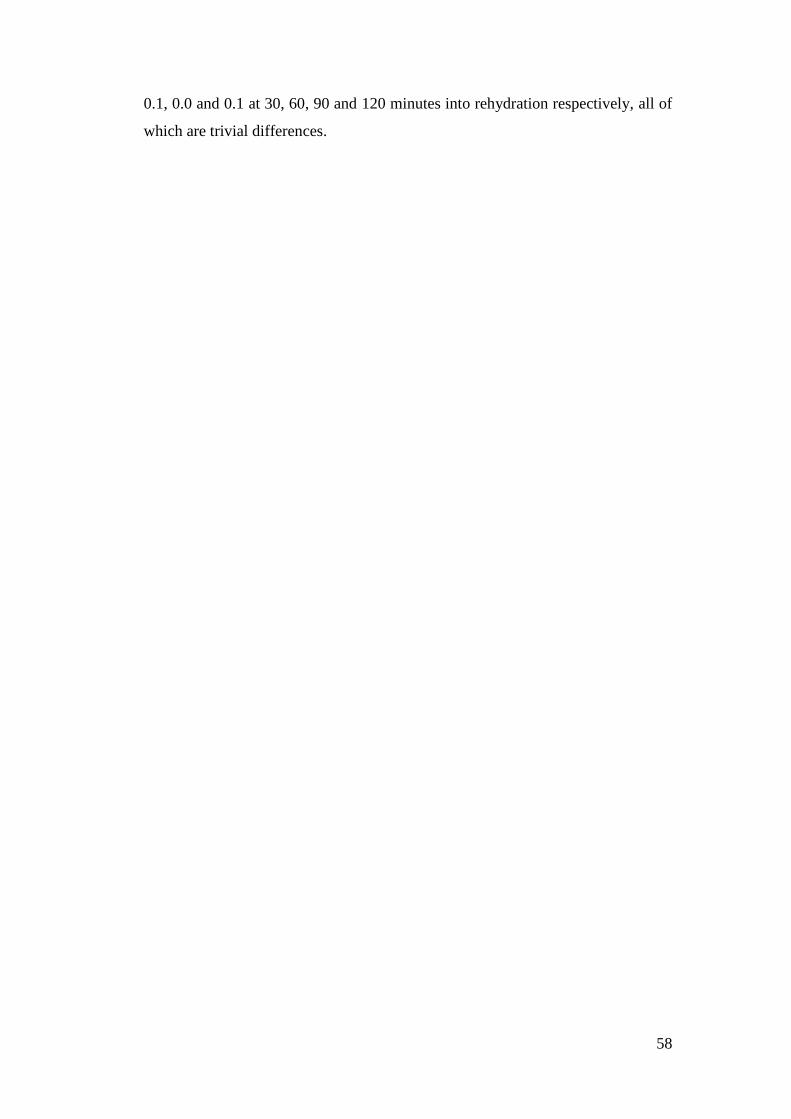
58
0.1, 0.0 and 0.1 at 30, 60, 90 and 120 minutes into rehydration respectively, all of
which are trivial differences.
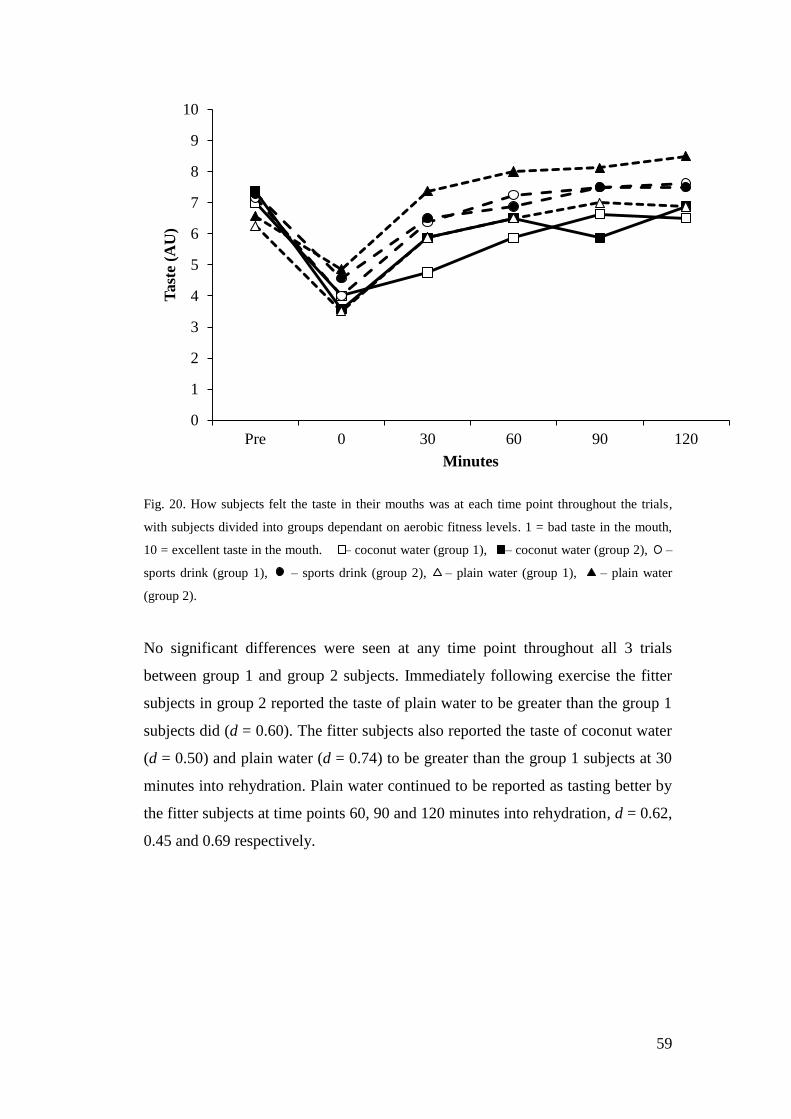
59
Fig. 20. How subjects felt the taste in their mouths was at each time point throughout the trials,
with subjects divided into groups dependant on aerobic fitness levels. 1 = bad taste in the mouth,
10 = excellent taste in the mouth. – coconut water (group 1), – coconut water (group 2), –
sports drink (group 1), – sports drink (group 2), – plain water (group 1), – plain water
(group 2).
No significant differences were seen at any time point throughout all 3 trials
between group 1 and group 2 subjects. Immediately following exercise the fitter
subjects in group 2 reported the taste of plain water to be greater than the group 1
subjects did (d = 0.60). The fitter subjects also reported the taste of coconut water
(d = 0.50) and plain water (d = 0.74) to be greater than the group 1 subjects at 30
minutes into rehydration. Plain water continued to be reported as tasting better by
the fitter subjects at time points 60, 90 and 120 minutes into rehydration, d = 0.62,
0.45 and 0.69 respectively.
0
1
2
3
4
5
6
7
8
9
10
Pre 0 30 60 90 120
Tast
e (A
U)
Minutes
60
Fig. 21. How bloated the subjects felt at each time point throughout the trials. 1 = very bloated, 10
= not bloated at all. Closed Squares – Coconut Water, Open Squares – Sports Drink, Closed
Triangles – Plain Water.
There were no significant differences found in the subjective feelings of
bloatedness throughout all the trials (P = 0.992, 0.790, 0.582 and 0.658 for 30, 60,
90 and 120 minutes respectively). The same trend was found throughout all trials
(can be seen in figure 11) that over the course of time bloatedness values
decreased from initial scores of 9.6 ± 0.7, 9.1 ± 1.7 and 9.4 ± 1.1 to 7.8 ± 2.3, 7.2
± 2.9 and 8.0 ± 2.6 at the end of the rehydration phase for the coconut water,
sports drink and plain water trials respectively, meaning subjects were becoming
increasingly bloated over time.
0
1
2
3
4
5
6
7
8
9
10
Pre 0 min 30 min 60 min 90 min 120 min
Blo
ate
dn
ess
(AU
)
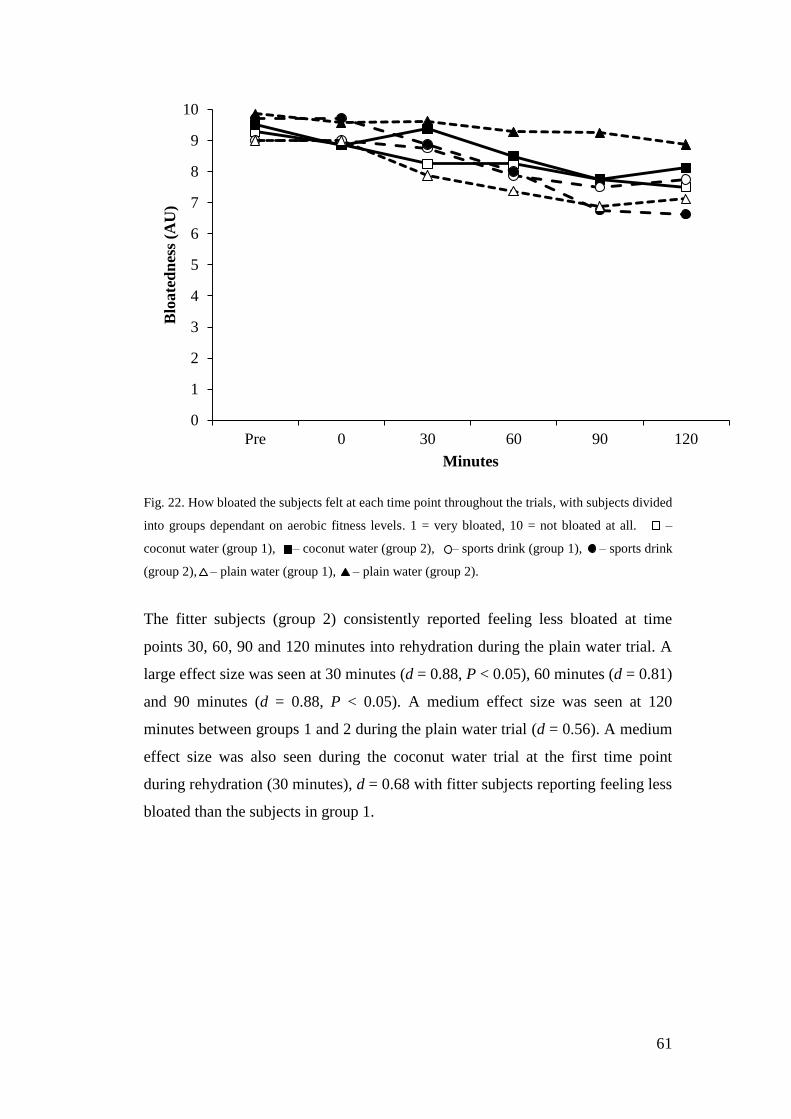
61
Fig. 22. How bloated the subjects felt at each time point throughout the trials, with subjects divided
into groups dependant on aerobic fitness levels. 1 = very bloated, 10 = not bloated at all. –
coconut water (group 1), – coconut water (group 2), – sports drink (group 1), – sports drink
(group 2), – plain water (group 1), – plain water (group 2).
The fitter subjects (group 2) consistently reported feeling less bloated at time
points 30, 60, 90 and 120 minutes into rehydration during the plain water trial. A
large effect size was seen at 30 minutes (d = 0.88, P < 0.05), 60 minutes (d = 0.81)
and 90 minutes (d = 0.88, P < 0.05). A medium effect size was seen at 120
minutes between groups 1 and 2 during the plain water trial (d = 0.56). A medium
effect size was also seen during the coconut water trial at the first time point
during rehydration (30 minutes), d = 0.68 with fitter subjects reporting feeling less
bloated than the subjects in group 1.
0
1
2
3
4
5
6
7
8
9
10
Pre 0 30 60 90 120
Blo
ate
dn
ess
(AU
)
Minutes
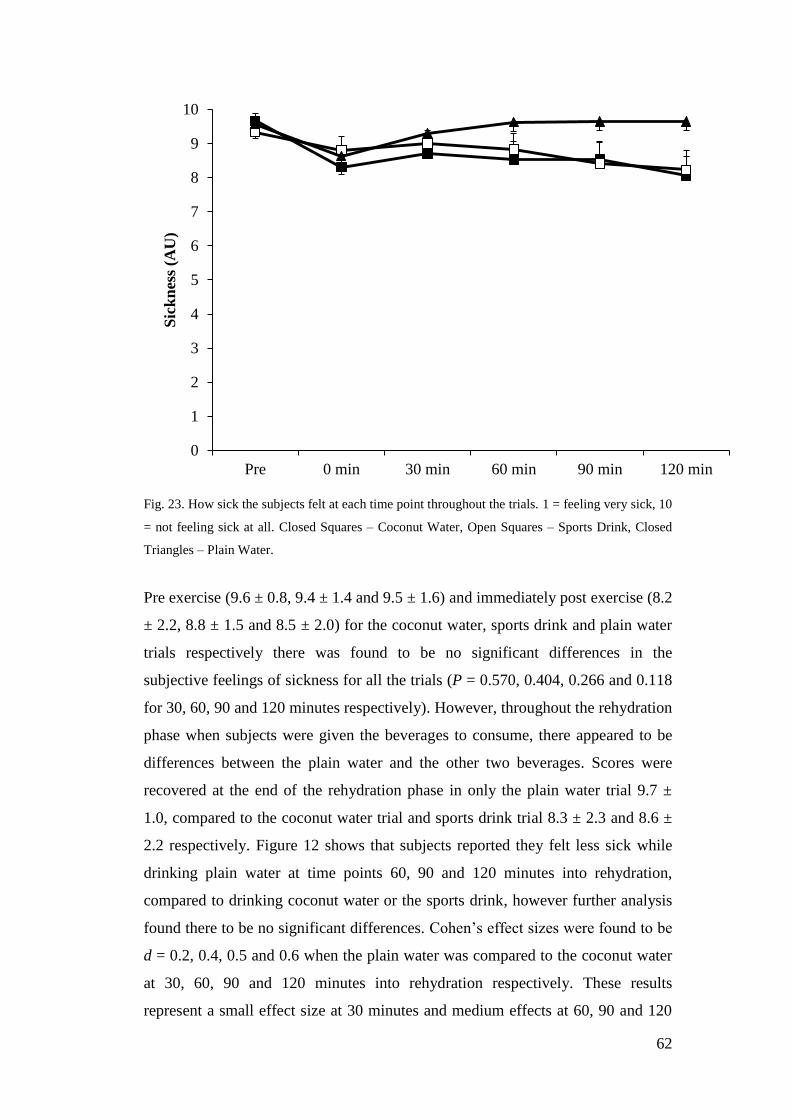
62
Fig. 23. How sick the subjects felt at each time point throughout the trials. 1 = feeling very sick, 10
= not feeling sick at all. Closed Squares – Coconut Water, Open Squares – Sports Drink, Closed
Triangles – Plain Water.
Pre exercise (9.6 ± 0.8, 9.4 ± 1.4 and 9.5 ± 1.6) and immediately post exercise (8.2
± 2.2, 8.8 ± 1.5 and 8.5 ± 2.0) for the coconut water, sports drink and plain water
trials respectively there was found to be no significant differences in the
subjective feelings of sickness for all the trials (P = 0.570, 0.404, 0.266 and 0.118
for 30, 60, 90 and 120 minutes respectively). However, throughout the rehydration
phase when subjects were given the beverages to consume, there appeared to be
differences between the plain water and the other two beverages. Scores were
recovered at the end of the rehydration phase in only the plain water trial 9.7 ±
1.0, compared to the coconut water trial and sports drink trial 8.3 ± 2.3 and 8.6 ±
2.2 respectively. Figure 12 shows that subjects reported they felt less sick while
drinking plain water at time points 60, 90 and 120 minutes into rehydration,
compared to drinking coconut water or the sports drink, however further analysis
found there to be no significant differences. Cohen’s effect sizes were found to be
d = 0.2, 0.4, 0.5 and 0.6 when the plain water was compared to the coconut water
at 30, 60, 90 and 120 minutes into rehydration respectively. These results
represent a small effect size at 30 minutes and medium effects at 60, 90 and 120
0
1
2
3
4
5
6
7
8
9
10
Pre 0 min 30 min 60 min 90 min 120 min
Sic
kn
ess
(AU
)
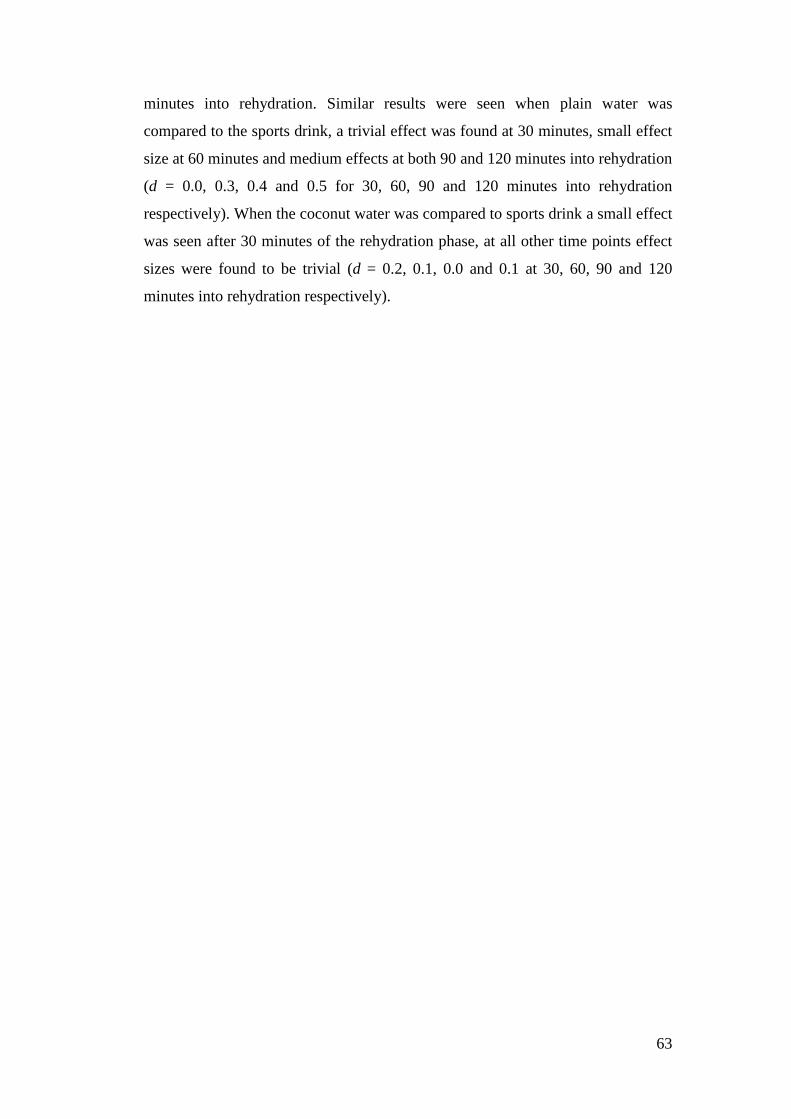
63
minutes into rehydration. Similar results were seen when plain water was
compared to the sports drink, a trivial effect was found at 30 minutes, small effect
size at 60 minutes and medium effects at both 90 and 120 minutes into rehydration
(d = 0.0, 0.3, 0.4 and 0.5 for 30, 60, 90 and 120 minutes into rehydration
respectively). When the coconut water was compared to sports drink a small effect
was seen after 30 minutes of the rehydration phase, at all other time points effect
sizes were found to be trivial (d = 0.2, 0.1, 0.0 and 0.1 at 30, 60, 90 and 120
minutes into rehydration respectively).
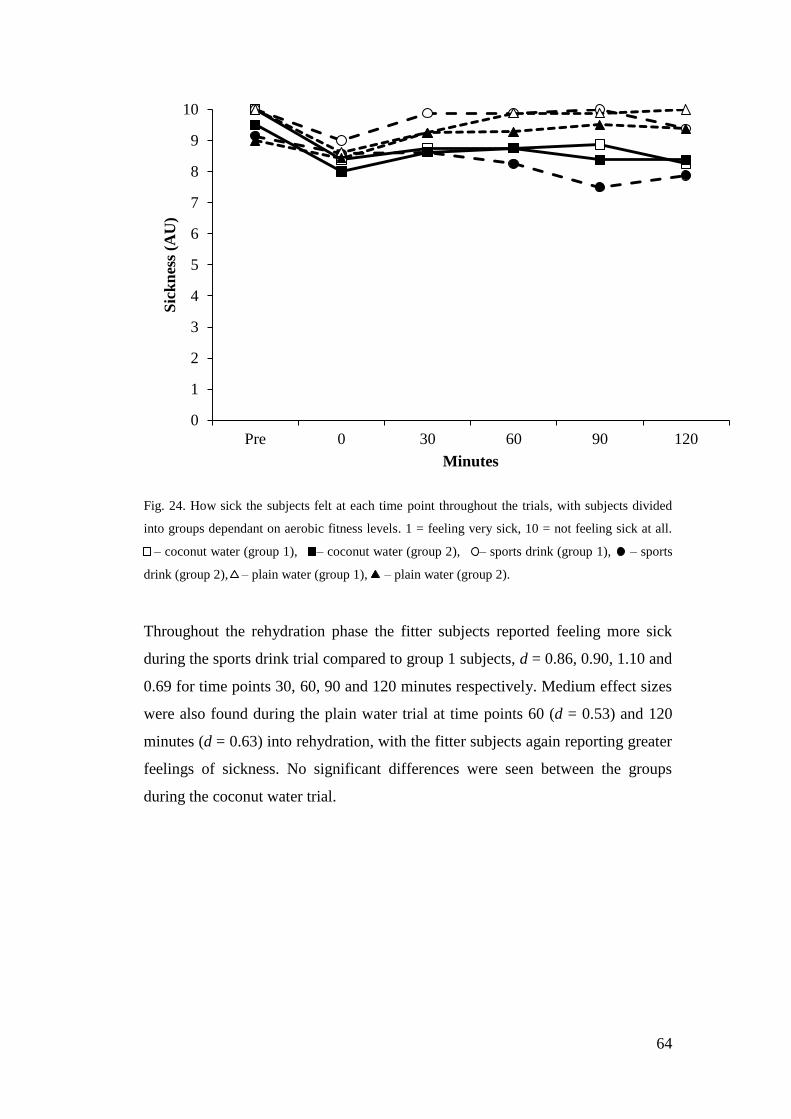
64
Fig. 24. How sick the subjects felt at each time point throughout the trials, with subjects divided
into groups dependant on aerobic fitness levels. 1 = feeling very sick, 10 = not feeling sick at all.
– – coconut water (group 1), – coconut water (group 2), – sports drink (group 1), – sports
drink (group 2), – plain water (group 1), – plain water (group 2).
Throughout the rehydration phase the fitter subjects reported feeling more sick
during the sports drink trial compared to group 1 subjects, d = 0.86, 0.90, 1.10 and
0.69 for time points 30, 60, 90 and 120 minutes respectively. Medium effect sizes
were also found during the plain water trial at time points 60 (d = 0.53) and 120
minutes (d = 0.63) into rehydration, with the fitter subjects again reporting greater
feelings of sickness. No significant differences were seen between the groups
during the coconut water trial.
0
1
2
3
4
5
6
7
8
9
10
Pre 0 30 60 90 120
Sic
kn
ess
(AU
)
Minutes
65
Discussion
As previously mentioned, dehydration by as little as a 2% body mass loss can
have a detrimental effect on exercise performance. Following the exercise
protocol subjects lost on average 2.36 ± 0.45% which indicates that the protocol
was successful in dehydrating the subjects by a suitable amount so that subsequent
rehydration was required.
After completion of the rehydration phase subjects were found to have restored
body mass to 100.4 0.3; 100.4 0.6 and 100.3 0.5% of their initial pre
exercise body mass, following the coconut water, sports drink and water trials
respectively. These results were in line with those found by Kalman et al (2012),
who reported subjects restoring body mass by on average 99.49, 99.49 and
99.49% following a rehydration phase using coconut water, sports drink and plain
water respectively.
Initially 36 subjects had been intended to be recruited based on the power
calculation. This proved to be unfeasible as the expectations on subjects to give up
their time was too much. The use of meta-analysis data was explored but was also
found to be not feasible as no access to raw data could be obtained. As the main
body of the research study was under powered it was decided that to add novelty
to the study that the 16 subjects obtained could be split to investigate potential
differences in rehydration capacity depending on aerobic fitness levels. Subjects
were split into two group dependant on their maximum oxygen uptake to allow
investigation of a fitness effect on rehydration. The criteria used to split the groups
(group 1 < 50 ml·kg-1
·min-1
, group 2 > 50 ml·kg-1
·min-1
) is lower than previous
studies, however this gave a perfect 50/50 split in the groups.
The fitter individuals in group 2 (31.7 9.9 g/min) were found to produce greater
estimated sweat rates compared to the individuals in group 1 (25.7 6.1 g/min).
This is what was expected to been seen and was similar to what has been reported
in previous studies (Ichinose-Kuwahara et al, 2010).
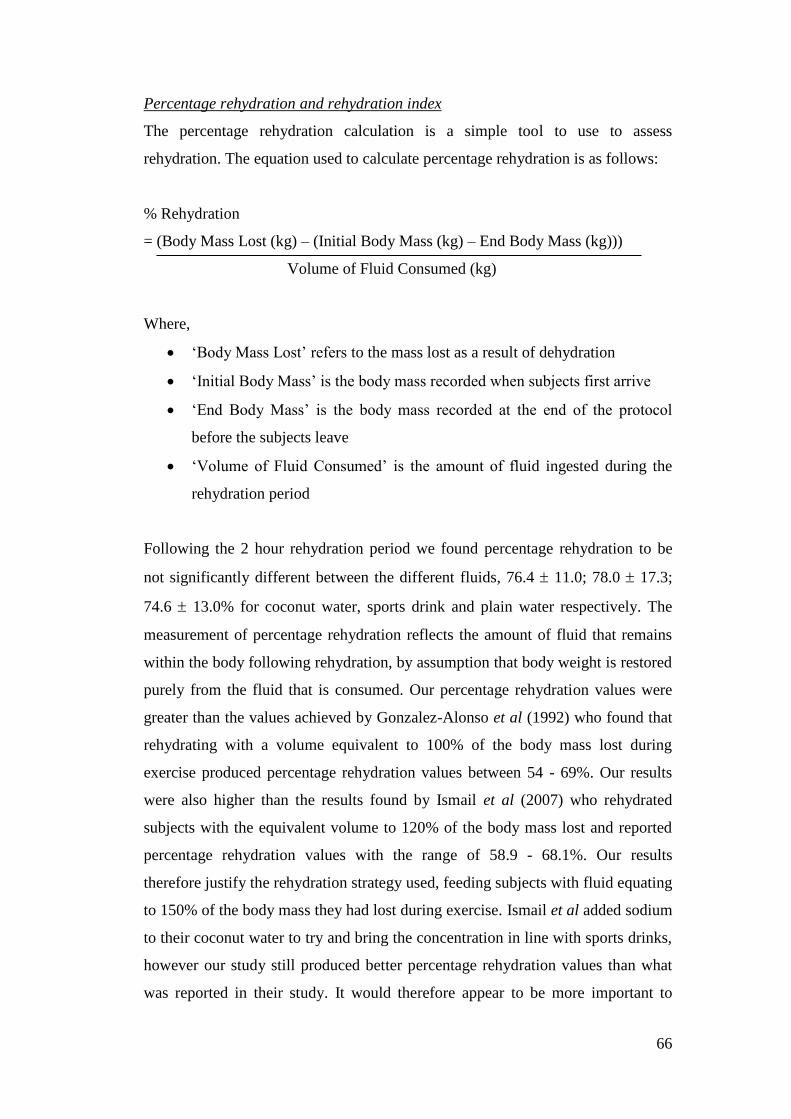
66
Percentage rehydration and rehydration index
The percentage rehydration calculation is a simple tool to use to assess
rehydration. The equation used to calculate percentage rehydration is as follows:
% Rehydration
= (Body Mass Lost (kg) – (Initial Body Mass (kg) – End Body Mass (kg)))
Volume of Fluid Consumed (kg)
Where,
‘Body Mass Lost’ refers to the mass lost as a result of dehydration
‘Initial Body Mass’ is the body mass recorded when subjects first arrive
‘End Body Mass’ is the body mass recorded at the end of the protocol
before the subjects leave
‘Volume of Fluid Consumed’ is the amount of fluid ingested during the
rehydration period
Following the 2 hour rehydration period we found percentage rehydration to be
not significantly different between the different fluids, 76.4 11.0; 78.0 17.3;
74.6 13.0% for coconut water, sports drink and plain water respectively. The
measurement of percentage rehydration reflects the amount of fluid that remains
within the body following rehydration, by assumption that body weight is restored
purely from the fluid that is consumed. Our percentage rehydration values were
greater than the values achieved by Gonzalez-Alonso et al (1992) who found that
rehydrating with a volume equivalent to 100% of the body mass lost during
exercise produced percentage rehydration values between 54 - 69%. Our results
were also higher than the results found by Ismail et al (2007) who rehydrated
subjects with the equivalent volume to 120% of the body mass lost and reported
percentage rehydration values with the range of 58.9 - 68.1%. Our results
therefore justify the rehydration strategy used, feeding subjects with fluid equating
to 150% of the body mass they had lost during exercise. Ismail et al added sodium
to their coconut water to try and bring the concentration in line with sports drinks,
however our study still produced better percentage rehydration values than what
was reported in their study. It would therefore appear to be more important to
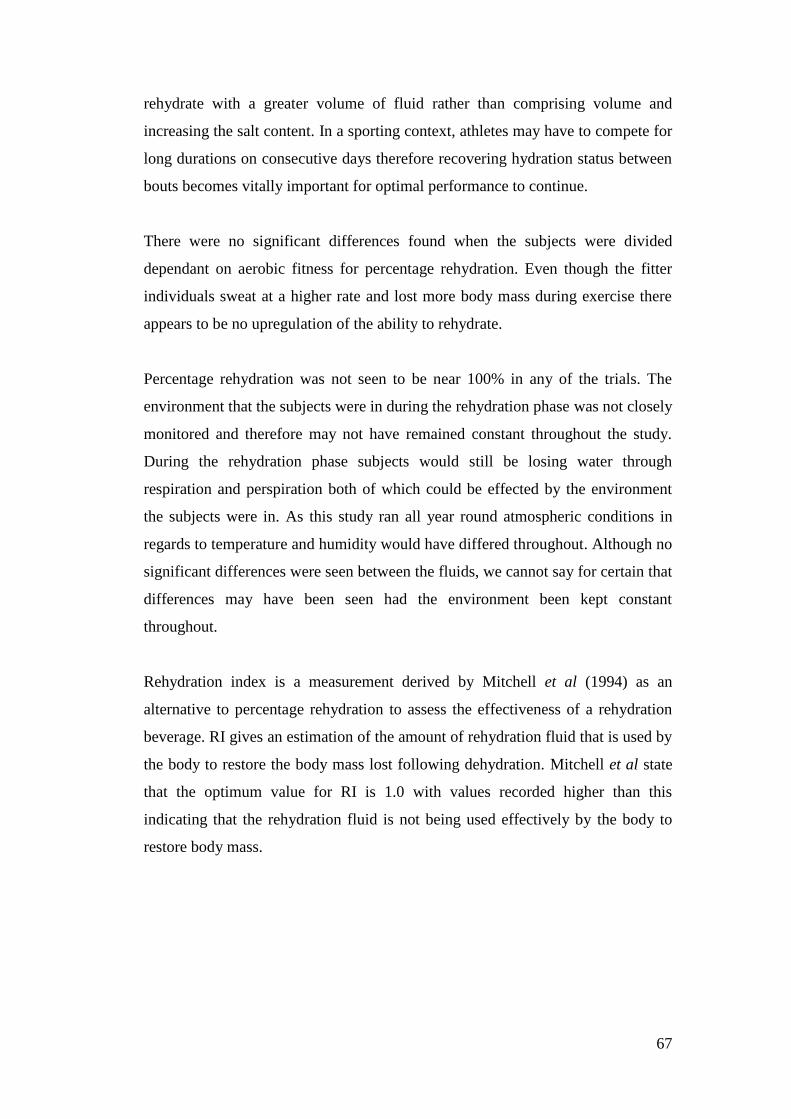
67
rehydrate with a greater volume of fluid rather than comprising volume and
increasing the salt content. In a sporting context, athletes may have to compete for
long durations on consecutive days therefore recovering hydration status between
bouts becomes vitally important for optimal performance to continue.
There were no significant differences found when the subjects were divided
dependant on aerobic fitness for percentage rehydration. Even though the fitter
individuals sweat at a higher rate and lost more body mass during exercise there
appears to be no upregulation of the ability to rehydrate.
Percentage rehydration was not seen to be near 100% in any of the trials. The
environment that the subjects were in during the rehydration phase was not closely
monitored and therefore may not have remained constant throughout the study.
During the rehydration phase subjects would still be losing water through
respiration and perspiration both of which could be effected by the environment
the subjects were in. As this study ran all year round atmospheric conditions in
regards to temperature and humidity would have differed throughout. Although no
significant differences were seen between the fluids, we cannot say for certain that
differences may have been seen had the environment been kept constant
throughout.
Rehydration index is a measurement derived by Mitchell et al (1994) as an
alternative to percentage rehydration to assess the effectiveness of a rehydration
beverage. RI gives an estimation of the amount of rehydration fluid that is used by
the body to restore the body mass lost following dehydration. Mitchell et al state
that the optimum value for RI is 1.0 with values recorded higher than this
indicating that the rehydration fluid is not being used effectively by the body to
restore body mass.
68
The following formula shows how RI is calculated:
RI = Volume of Fluid Consumed (ml)
Body Mass Regained (g)
% Rehydration
100
Where,
‘Volume of Fluid Consumed’ is the amount of fluid ingested during the
rehydration period
‘Body Mass Regained’ is the amount of body mass regained during a
rehydration period following dehydration
‘% Rehydration’ is percentage rehydration, calculated using the equation
previously mentioned
Rehydration Index ranges 1.80 - 2.60 have been reported with sodium levels of 20
mmol/l typical of most sports drinks (Ismail et al, 2007). Saat et al (2002) found
that percent rehydration was higher with a sports drink (80 ± 4%) compared to
coconut water (75 ± 5%) and water (73 ± 5%). In the same study Saat et al
reported RI values of 1.56, 1.36 and 1.71 for coconut water, sports drink and
water respectively. The lower value of percentage rehydration and larger RI
values were perhaps due to the lower sodium content of the coconut water. This
was then further investigated by Ismail et al (2007) who added sodium to coconut
water and saw similar results in percent rehydration and rehydration index when
compared to a sports drink. The sports drink used in Ismail’s study had a
rehydration index of 1.80 which falls within the range of typical RI values.
However, the rehydration index seen following rehydration with sodium enriched
coconut water was 1.75 which is better than that reported in studies using sports
drinks, which may be due to the increased potassium content of the coconut water.
The RI values obtained from our study were 1.7 0.4; 2.4 2.9; 1.9 0.7 for
coconut water, sports drink and water respectively. Again our results show Go
Coco coconut water rehydrated subjects better than Ismail et al managed even
69
when adding sodium to the coconut water. This further strengthens the suggestion
that increasing volume of fluid consumed during rehydration is more important
than altering the contents, as Go Coco coconut water has very low levels of
sodium (11.6 mmol/l) yet % rehydration and RI values were still found to be
better.
To maintain exercise capacity, blood flow to the muscles as well as to the skin
surface must be maintained. However, with dehydration comes a decrease in
exercise performance, which is believed to be due to the reduction in plasma
volume (Maughan, 1999). This reduction in plasma volume means that there must
be a comprise in blood flow to the working muscles or to the skin surface.
Therefore, the major target during exercise is to remain in a hydrated state
allowing plasma volume to be maintained, circulation and sweating can then
continue optimally (Leiper and Maughan, 1986). Previous studies suggest high
potassium content of drinks, as seen in coconut water, may delay recovery of
plasma volume due to increased intracellular fluid restoration instead of
extracellular.
Again, no significant differences were found between the subjects in group 1 and
group 2 for rehydration index. This measurement along with the percentage
rehydration values suggest that the fitter individuals show no upregulation of their
ability to rehydrate.
Urine osmolality
Urine osmolality was used as it is a relatively inexpensive and simple
measurement of hydration. Although we recognise that this may not be best
marker for hydration status within a research laboratory, it is a measurement that
is reflective of real life practice within elite sports, where cost and time may be
constrained. Urine samples were collected throughout the rehydration phase,
however once analysed for urine osmolality these samples were discarded.
Subjects were only given a small container to provide a sample and all other urine
produced at that time point was simply voided into the lavatory. To understand
fluid balance in more detail each urine sample should have been fully collected
70
within a larger container and total volume produced recorded as well as urine
osmolality at each time point.
We found that during the coconut water trial a significant difference was seen at
end of the rehydration phase, compared to the plain water trial. Coconut water
produced significantly higher values of urine osmolality. Nose et al (1988b)
suggested that when a large volume of fluid is consumed that contains low sodium
levels, that there is an acute hyponatremic response, plasma osmolality falls and
the body increases urine output.
Our results found that at the end of the plain water trial urine osmolality was very
low 158.1 ± 144.1, compared to the coconut water trial 325.4 ± 242.1, a
significant difference (P < 0.05). These results favour plain water as a more
suitable rehydration fluid. However, % rehydration and RI values, although not
significantly different, would favour coconut water as a more suitable fluid for
rehydration. These differences may be explained by the theory, suggested by Nose
et al, that as plain water (a hypotonic solution) is consumed in large volumes,
plasma osmolality will fall increasing urine production by the kidneys, the fluid
being consumed is passed right through. Coconut water may contain low levels of
sodium, but it contains large amounts of potassium. Therefore, as coconut water is
consumed in large volumes for rehydration the fluid can be retained within the
body more effectively. When our subjects were asked to produce a urine sample
during the coconut water trial, their bodies had retained the fluid they had
consumed, urine production was reduced as the body tried to rehydrate, urine
therefore required to be forced resulting in the sample being more concentrated.
During the plain water trial, the body increased production of urine and the fluid
consumed passed straight through, resulting in the subjects’ samples being
measured with low osmolality.
As previously seen with percentage rehydration and rehydration index, there were
no differences found between the fitter individuals compared to the less fit
individuals throughout all 3 trials.
71
Blood glucose
It has been long since known that many nutritional strategies have beneficial
effects for athletes during exercise (Coyle et al, 83 & 86). For endurance athletes
carbohydrate is the most important substrate as it is carbohydrates that will be
fuelling the body to complete the exercise. Carbohydrates are progressively
depleted during endurance exercise, to the point where fatigue sets in and work
rate can no longer be maintained. Therefore the most notable nutritional strategy
for endurance performance is carbohydrate ingestion during the exercise period.
However, when high glycaemic index fluids are consumed there is a rapid rise in
the circulating blood glucose, to combat this rise there is an accompanying rise in
circulating insulin. The circulating insulin is responsible for the clearance of
glucose from the blood, however in some individuals the decrease in blood
glucose can surpass resting levels (3.5 mM), making these individuals
hypoglycaemic (Martini and Nath, 2009). Hypoglycaemia is associated with
several symptoms including feelings of fatigue. Sapata et al (2006) found that
subjects fed with a high glycaemic meal prior to exercise had a higher heart rate
during the exercise trial compared to when they were fed with a low glycaemic
meal. The hypoglycaemic response following the high glycaemic meal demanded
the heart to work harder to sustain the same work load. Also in 2006, Stevenson et
al found that during exercise fat oxidation was lower when a prior high glycaemic
meal had been consumed compared to a low glycaemic meal. During endurance
sporting performance higher fat oxidation helps constraint the depletion of
glycogen stores, which will allow work rate to be sustained for longer, therefore
enhancing sporting performance.
We found medium effect sizes in blood glucose values between coconut water and
the sports drink at 30, 60 and 90 minutes (d = 0.44, 0.40 and 0.41 respectively)
into the rehydration phase. Coconut water was found to produce a lower blood
glucose response compared to the sports drink.
The Go Coco coconut water used in this study contains 4.4g per 100ml sugars of
which approximately 70% is glucose and the remaining 30% is made up of
fructose. The sports drink contained 3.6g per 100ml but was 100% glucose. A
study by Currell and Jeukendrup (2008) was the first to demonstrate beneficial
72
performance effects from consumption of a mixed carbohydrate beverage in the
ratio 2:1 of glucose to fructose. Their study involved 8 subjects over 3
experimental trials, using plain water, a glucose only beverage and a beverage
containing glucose and fructose (2:1 ratio) during exercise testing. Exercise
testing consisted of subjects cycling for a fixed 2 hour period while being fed the
experimental beverage in 15 minute intervals. At the end of the 2 hour period,
subjects immediately began a time trial to complete a set amount of work in the
quickest time possible. They were given the test beverage to consume during the
time trial, on completion of 25, 50 and 75% of the work set. The results found that
the glucose alone beverage improved performance (mean power output and time
to completion) by 10% compared to the water trial. However, the performance
improvement effects of the glucose:fructose beverage surpassed this by a further
8%. This improvement during the glucose:fructose trial is due to the increased rate
of absorption. Glucose can only be transported through a sodium dependant
glucose transporter called SGLT1 which can become saturated, slowing
absorption. Fructose, however, is transported through the GLUT5 transporter
which can work simultaneously with the SGLT1 transporter to increase absorption
(Martini and Nath, 2009).
In our study the sports drink used contained glucose alone. Therefore, due to the
properties contained within the Go Coco coconut water, it is being suggested that
coconut water could potentially be consumed during endurance sport, as an
alternative to man-made sports drinks. Coconut water naturally contains sugars
and electrolytes as well as having antioxidant properties as well. If athletes
switched to coconut water use then it would cut down the number of additives
consumed in the athlete’s diet. This may also, in turn, lead to children choosing a
more natural, healthier option to sports drinks.
During endurance exercise the use of carbohydrates is essential for performance.
Therefore, since we found no significant differences between coconut water and
the sports drink throughout the rehydration phase in blood glucose values (6.8 ±
1.6 vs. 7.7 ± 1.9, 7.6 ± 1.3 vs. 8.2 ± 1.5, 5.9 ± 1.6 vs. 6.6 ± 1.0, 6.2 ± 1.0 vs. 6.0 ±
0.7 mM, for coconut water vs. sports drink at each time point duration rehydration
30, 60, 90 and 120 minutes respectively). However, Cohen’s effect sizes were
73
found to be medium at 30, 60 and 90 minutes into rehydration. This coupled with
the glucose:fructose contents of the coconut water suggest that there is a potential
for the use of coconut water during endurance exercise to have a benefit to
performance.
Subjective questionnaire
Subjectively there was found to be no difference in the feeling of thirst between
any of the three beverages. Subjects therefore did not have a preference of
rehydration beverage based solely on its ability to quench their feelings of thirst.
However, further subjective questionnaire results show that significance was
almost reached with subjects rating the taste of the coconut water lower than the
sports drink and plain water, Cohen’s effect sizes found medium effects between
coconut water and both the sports drink and plain water. Coconut water was
obviously adequate enough to quench the subjects’ feelings of thirst when they
were in a dehydrated state but would appear not to be the selected drink of choice
based on the taste. This is also reflected in the feeling of sickness question where
subjects reported lower values meaning they felt more nauseous during the
coconut water trial compared to the water trial (medium effect sizes seen at 60, 90
and 120 minutes into rehydration). Some subjects struggled to consume the
required volume of coconut water. Coconut water companies have started
flavouring their drinks which may get round the taste issue for some subjects.
However one of the main attractions towards the use of coconut water is that it is
natural, adding flavourings would make the coconut water more man-made like
sports drinks that are already highly popular within the market.
The greatest difference detected between the subjects when they were split based
on aerobic fitness was in the subjective questionnaire measurement of sickness.
Consistently throughout the rehydration phase the fitter individuals reported
feeling more sick than the less fit subjects during the sports drink trial. There was
no significant difference found between the fitness group during the coconut water
trial at any of the time points. This is an interesting finding as elite level athletes
have to consume rehydration beverages frequently after hard training sessions or
competition, potentially in large volumes. The fitter subjects reported greater
feelings of sickness during the sports drink trial compared to the coconut water
74
trial which may indicate that for elite athletes it might feel easier on the stomach
to consume coconut water as a rehydration beverage compared to a sports drink.
There are still many unanswered questions with regards to the use of coconut
water as a rehydration beverage and its potential use as an ergogenic aid during
exercise performance. Future research in this field should aim to investigate the
mechanisms involved in the results seen in our study with upregulation of sweat
rates by fitter individuals but with no difference in rehydration capacity, is there a
ceiling effect? There also requires to be investigation into whether Go Coco
coconut water may be used by athletes exercising for long periods of time on a
regular basis during training and competition.
Limitations
Maughan and Leiper (1995), Maughan (1994) and Kovacs (2002) followed a
rehydration period for 5-6 hours which obviously provides a much more complete
overview of the effect that a fluid consumed has on kidney function and the
restoration of euhydration. We did not believe that this would be feasible to follow
and therefore tried to shorten the rehydration time. We found no significant
differences between any of the rehydration beverages at the end of the 2 hour
rehydration phase, however our rehydration strategy may have affected the final
measurements. Our protocol involved providing the subjects with fluid at regular
40 minute intervals during the rehydration phase. This was to avoid excessive
consumption which would not be reflective of rehydration strategies employed by
professional athletes. However, as the process of maintaining fluid balance via
osmotic movements within the kidneys is a slow process, we feel that a full
picture of the rehydration process was not seen within the 2 hour rehydration
period used in our protocol.
75
Conclusion
In light of our findings, primarily that there is no significant difference between
Go Coco coconut water and a commercially available sports drink when
comparing their ability to rehydrate following dehydrating exercise and that fitter
individuals rated feeling more sick while consuming a sports drink compared to
coconut water, it is recommended that the naturally occurring coconut water
would make an ideal alternative to the manufactured sports drink. These sports
drinks are used during sporting endurance performance, our early indications
suggest that Go Coco coconut water produces a similar blood glucose response to
the sports drink, as well as a mixture of glucose and fructose sugars, and could
therefore produce similar benefits to endurance performance. Future research
should aim to investigate whether Go Coco coconut water may be used by athletes
exercising for long periods of time on a regular basis during training and
competition.
76
References
Aragon-Vargas, L.F. and Madriz-Davila, K. (2000) Incomplete warm-climate,
post-exercise rehydration with water, coconut water or a sports drink. Medicine
and Science in Sports and Exercise 32(5): S238.
Armstrong, L.E., Costill, D.L. and Fink, W.J. (1985) Influence of diuretic induced
dehydration on competitive running performance. Medicine and Science in Sports
and Exercise 17(4): 456-461.
Beltrami, F.G., Hew-Butler, T. and Noakes, T.D. (2008) Drinking policies and
exercise-associated hyponatraemia: is anyone still promoting overdrinking? Br J
Sports Med 42: 796-
801.
Bhagya, D., Prema, L. and Rajamohan, T. (2010) Beneficial effects of tender
coconut water on blood pressure and lipid levels in experimental hypertension.
Journal of Cell and Tissue Research 10(1): 2139-2144.
Convertino, V.A., Armstrong, L.E., Coyle, E.F., Mack, G.W., Sawka, M.N.,
Senay, L.C. Jr. and Sherman, W.M. (1996) American college of sports medicine
position stand. Exercise and fluid replacement. Med Sci Sports Exerc 28(1): 1-7.
Costill, D.L. and Sparks, K.E. (1973) Rapid fluid replacement following thermal
dehydration. J Appl Physiol 34: 299-303.
Costill, D.L., Coté, R. and Fink, W. (1976) Muscle water and electrolytes
following varied levels of dehydration in man. Journal of Applied Physiology
40(1): 6-11.
Coyle, E.F., Coggan, A.R., Hemmert, M.K. and Ivy, J.L. (1986) Muscle glycogen
utilization during prolonged strenuous exercise when fed carbohydrate. Journal of
Applied Physiology 61(1): 165-172.
77
Coyle, E.F., Hagberg, J.M., Hurley, B.F., Martin, W.H., Ehsani, A.A. and
Holloszy, J.O (1983) Carbohydrate feeding during prolonged strenuous exercise
can delay fatigue. Journal of Applied Physiology 55(1): 230-235.
Currell, K. and Jeukendrup, A.E. (2008) Superior endurance performance with
ingestion of multiple transportable carbohydrates. Med Sci Sports Exerc 40(2):
275-281.
Gonzalez-Alonzo, J., Heaps, C.L. and Coyle, E.F. (1992) Rehydration after
exercise with common beverages and water. Int J Sports Med 13: 399-406.
Ichinose-Kuwahara T, Inoue Y, Iseki Y, Hara S, Ogura Y & Kondo N (2010). Sex
differences in the effects of physical training on sweat gland responses during a
graded exercise. Exp Physiol 95, 1026-1032.
Ismail, R., Singh, R. and Sirisinghe, R.G. (2007) Rehydration with sodium-
enriched coconut water after exercise-induced dehydration. Southeast Asian J
Trop Med Public Health 38(4): 769-785.
Kalman, D.S., Feldman, S., Krieger, D.R. and Bloomer, R.J. (2012) Comparison
of coconut water and an electrolyte sports drink on measures of hydration and
physical performance in exercise-trained men. Journal of the International Society
of Sports Nutrition 9(1): 1.
Kovacs, E.M., Schmahl, R.M., Senden, J.M. and Brouns, F. (2002) Effect of high
and low rates of fluid intake on post-exercise rehydration. International Journal of
Sport Nutrition and Exercise Metabolism 12: 14-23.
Laitano, O., Trangmar, S.J., Marins, D.M., Menezes, E.S. and da Silva Reis, G.
(2014) Improved exercise capacity in the heat followed by coconut water
consumption. Motriz Rio Claro 20(1): 107-111.
78
Lambert, C.P., Costill, D.L., McConell, G.K., Benedict, M.A., Lambert, G.P.,
Robergs, R.A. and Fink, W.J. (1992) Fluid replacement after dehydration:
influence of beverage carbonation
and carbohydrate content. Int J Sports Med 13: 285-292.
Leiper, J.B. and Maughan, R.J. (1986) Absorption of water and electrolytes from
hypotonic, isotonic and hypertonic solutions. J Physiol 373: 90-102.
Manna, K., Khan, A., Das, D.K., Kesh, S.B., Das, U., Ghosh, S., Dey, R.S., Saha,
K.D., Chakraborty, A., Chattopadhyay, S., Dey, S. and Chattopadhyay, D. (2014)
Protective effect of coconut water concentrate and its active component shikimic
acid against hydroperoxide mediated oxidative stress. Journal of
Ethnopharmacology In Press
Martini, F.H. and Nath, J.L. (2009) Fundamentals of Anatomy and Physiology. 8th
Ed. San Francisco: Pearson.
Maughan R.J. and Leiper, J.B. (1995) Sodium intake and post-exercise
rehydration in man. European Journal of Applied Physiology 71: 311-319.
Maughan, R.J. (1999) Nutritional ergogenic aids and exercise performance.
Nutrition Research Reviews 12: 255-280.
Maughan, R.J. and Shirreffs, S.M. (1997) Recovery from prolonged exercise:
restoration of water and electrolyte balance. Journal of Sports Sciences 15(3):
297-303.
Maughan, R.J., Owen, J.H., Shirreffs, S.M. and Leiper, J.B. (1994) Post-exercise
rehydration in man: effects of electrolyte addition to ingested fluids. European
Journal of Applied Physiology 69: 209-215.
Mitchell, J.B., Grandjean, P.W., Pizza, F.X., Starling, R.D. and Holtz, R.W.
(1994) The effect of volume ingested on rehydration and gastric emptying
following exercise induced dehydration. Med Sci Sports Exerc 26: 1135-1143.
79
Nadel, E.R., Mack, G.W. and Nose, H. (1990) Influence of fluid replacement
beverages on body fluid homeostasis during exercise and recovery. Fluid
Homeostasis During Exercise. Carmel, IN: Cooper Publishing: 181-198.
Nielsen, B., Sjogaard, G., Ugelvig, J., Knudsen, B. and Dohlmann, B. (1986)
Fluid balance in exercise dehydration and rehydration with different glucose-
electrolyte drinks. Eur J Appl Physiol 55: 318-323.
Nielsen B, Hales JRS, Strange S, Christensen NJ, Warberg J, Saltin B (1993)
Human circulatory and thermoregulatory adaptations with heat acclimation and
exercise in a hot, dry environment. J Physiol 460: 467-485.
Noakes, T.D. (2007) Drinking guidelines for exercise: what evidence is there that
athletes should drink "as much as tolerable", "to replace the weight lost during
exercise" or "ad libitum"? Journal of Sports Sciences 25(7): 781-796.
Nose, H., Mack, G.W., Shi, X.R. and Nadel, E.R. (1988a) Role of osmolality and
plasma volume during rehydration in humans. J Appl Physiol 65: 325-331.
Nose, H., Mack, G.W., Shi, X.R. and Nadel, E.R. (1988b) Shift in body fluid
compartments after dehydration in human. J Appl Physiol 65: 318-324.
Saat, M., Singh, R., Sirisinghe, R.G. and Nawawi, M. (2002) Rehydration after
exercise with fresh young coconut water, carbohydrate-electrolyte beverage and
plain water. Journal of Physiological Anthropology and Applied Human Science
21(2): 93-104.
Sapata, K.B., Fayh, A.P.T. and Oliveira, A.R. (2006) Effect of prior consumption
of carbohydrate on the glycaemia and performance. Rev Bras Med Esporte 12(4):
189 – 194.
Sawka, M.N., Burke, L.M., Eichner, E.R., Maughan, R.J., Montain, S.J. and
Stachenfeld, N.S. (2007) American college of sports medicine position stand.
Exercise and fluid replacement. Med Sci Sports Exerc 39: 377-390.
80
Shirreffs, S.M., Taylor, A.J., Leiper, J.B. and Maughan, R.J. (1996) Post-exercise
rehydration in man: effects of volume consumed and drink sodium content.
Medicine & Science in Sports & Exercise 28(10): 1260-1271.
Singh, R., Brouns, F. and Kovacs, E. (2002) The effect of rehydration on cycling
performance after exercise-induced dehydration. Southeast Asian J Trop Med
Public Health 33: 378-388.
Stevenson, E.J., Williams, C., Mash, L.E., Phillips, B. and Nute, M.L. (2006)
Influence of high-carbohydrate mixed meals with different glycemic indexes on
substrate utilization during subsequent exercise in women. Am J Clin Nutr 84:
354–360.
Yong, J.W.H., Ge, L., Ng, Y.F. and Tan, S.N. (2009) The chemical composition
and biological properties of coconut (cocos nucifera L.) water. Molecules 14:
5144-5164.
81
Appendices Appendix 1
Andrew Leishman & Nairn Scobie
University of Glasgow
Subject Information Sheet for a Research Project
Title of Research Project:
The Comparison of different Hydration Strategies on Rehydration.
The nature of sport in recent years has led to more research into methods to
legally enhance athletes’ performance. Different nutritional strategies are usually
the first to be experimented with for enhancing sporting performance. At the
moment the largest area of nutritional supplementation for endurance performance
is manufactured sports drinks. This study could open the prospect of using a
naturally produced drink as an alternative without comprising the advantageous
performance effects of commercially available sports drinks. You have been
invited to take part in a research study that will contribute to identifying if the
performance benefits of sports drinks can be matched or bettered by the use of
coconut water as an alternative.
This information sheet provides you with details of the research project. Please
read the information carefully, and ask a member of the research team if you have
any questions or need further explanation. If you would like to participate in this
research project, it is important that you fully understand what you are
volunteering for, and that you are satisfied with the information given to you,
before you sign the Informed Consent Form. The form is returned to the research
group, whereas you may keep this information sheet and a copy of the signed
Informed Consent Form.
What is the purpose of this research project?
These commercially available sports drinks are packed full of sugars and
additives. The publicity that sport in the UK is currently getting means that more
and more individuals are taking up sport or exercise. These sports drinks are
82
advertised as enhancing performance of the countries sports stars, and are
therefore consumed by the public on a mass scale. In most cases, the general
public that are exercising regularly only require to remain hydrated during their
exercise periods. If these sports drinks are consumed while not participating in
long duration sport then the excess sugar contained in the drinks can lead to an
increase in body fat.
Can this new more natural alternative, produce the same performance benefits?
This new beverage also contains electrolytes and minerals that help keep the body
hydrated. In this project we want to investigate whether this new strategy can be
used as an alternative to sports drinks for athletic endurance performance.
Why have you been chosen?
You have been selected as a potential participant in this study, because you are
male, aged 18-35 years and have a history of physical exercise that enables you to
participate in the research project by undertaking repeated exercise sessions.
However, inclusion criteria states that you do not smoke, are not on any
medication, and do not use drugs, either recreational or performance enhancing.
Further, if you have a history of heart or blood vessel disease, metabolic disorder,
high blood pressure, or any other related condition, you will not be allowed to
participate in this research project.
Do you have to participate?
It is entirely up to you to decide whether or not you want to participate in this
research project. If you do not wish to participate, you will not have to give any
reason for saying no. If you decide you wish to participate, you will have to sign
an Informed Consent Form and return it to the research group, before enrolment.
If you decide to participate, you are still free to withdraw from the research
project at any time without giving a reason.
What does participation involve?
You will be asked to visit the laboratory on 5 separate days. Each visit will last
approximately 3 hours. These visits will be separated by at least 7 days.
83
On your first visit, you will be introduced to the laboratory personnel and
familiarised with the equipment and protocols. You will be asked for your age,
height, weight, urine osmolality (which will require you to provide a urine sample
which will be analysed to check your hydration status) and bioelectrical
impedance will be measured. Bioelectrical impedance involves electrodes being
attached at your wrist and ankles and a small electrical current (which cannot be
felt) passing through your body. This gives a further measure of your hydration
status along with a measure of how much fat your body contains.
The first test involves a maximal oxygen uptake test, which will be carried out on
a cycle ergometer. You will be required to wear a heart rate monitor, mouthpiece
and nose clip during the test so that measures of heart rate, oxygen uptake and
ventilation can be recorded at each step. You will perform a 10 minute warm-up
before the test begins, from there the resistance on the bike increases by 15 watts
per minute (W·min-1
) until you can no longer continue or the revolutions per
minute drops below 50 (whichever occurs first).
This test will take about 10-20 minutes in total, depending on your fitness, but
only the last few minutes of the test are hard and exhaustive.
The final 4 visits to the lab will be completed in an environmental heat chamber
heated to a temperature of 30oC and 53% humidity. Before these tests get
underway, your height, weight, urine osmolality and bioelectrical impedance will
be taken. You will also be required to provide a blood sample (5-10ml) which will
be analyed for plasma volume which gives us a further marker of your hydration
status. You should let the researchers know if you have trouble with needles and
blood samples.
You will exercise on a cycle ergometer at 65% VO2max (determined from the
VO2max test you performed earlier) for 10 minute intervals (to a maximum of 90
minutes) in order to lose 3% of body weight via sweat loss. The amount of sweat
produced during exercise is variable between individuals therefore some subjects
will lose 3% body weight quicker than others. Therefore after each 10 minute
period of exercise you will be removed from the bike, dried and body weight will
84
be re-measured. The test will be ended if your body weight has decreased by 3%,
otherwise you will return to the bike to complete the next exercise interval.
Again these tests will involve a cool down period when the tests are completed,
with weight, urine osmolality and bioelectrical impedance being re-measured
upon completion. In the 2 hour period following exercise cessation you will
rehydrate to the equivalent of 120% of body weight lost. Throughout this 2 hour
rehydration phase, your weight, blood sample and bioimpedance will be
monitored every 30 minutes. At the end of the 2 hours, urine osmolality will be
measured. We will also collect all the urine you produce in this 2 hour period to
measure the total volume produced.
For experiments like this carried out in the heat, your body (core) temperature
must be monitored throughout. If core temperature rises above a pre-determined
level of 40ºC the test is stopped and you will be allowed to cool down. To
monitor core temperature you will be required to insert a rectal thermometer 10cm
beyond the anal sphincter.
Finally, we ask that you do not drink any alcohol 48 hours prior to each laboratory
visit. Also, you will be asked to eat a healthy, normal meal (breakfast or lunch)
approximately 3 hours before each laboratory visit, and not eat any chocolate or
sugar-rich food during those 3 hours between meals and laboratory visits. You
will also be required to refrain from drinking any liquid in this period.
What are the potential disadvantages of the research project for you?
Physical exercise has a negligible risk in healthy adults, although strenuous
exercise does carry a small risk of inducing heart attacks. The primary symptom
of a heart attack is chest pain. If you experience chest pain, you should stop
exercising immediately. Your heart rate will be monitored, and in the unlikely
event that you experience serious problems, approved emergency personnel are in
the laboratory at all times during the visits and approved emergency procedures
are in place.
85
At the end of the exercise tests you will feel tired and exhausted, your legs will
feel heavy, and you may be out of breath and light headed. This is common after
strenuous exercise and is harmless to you.
When blood samples are taken, you will feel an initial ‘prick’ from the needle
going in. Although slightly discomforting, this is a harmless procedure when
performed by experienced personnel.
There are no known side effects of this research project that will affect you.
What are the possible benefits of the research project for you?
The results of the exercise test will tell you how fit you are, and the research team
will explain what the results mean for you.
Also, numerous health benefits are associated with physical exercise, such as
improved fitness, less risk of disease, and increased well-being.
You will not be paid to participate in this research project.
Confidentiality
All information and results collected during this research project will be kept
strictly confidential.
What will happen to the results of the research project?
The results will be used by the students in their respective research project
dissertations (Master of Science). The results may also be published in one or
more scientific journals after the research project is completed. You will not be
identified in any publication.
Disclaimer - What if something goes wrong?
If you are harmed by taking part in this research project, there are no
compensation arrangements. If you are harmed due to someone's negligence, then
you may have grounds for a legal action but you may have to pay for it.
86
Further information
You may ask questions about the research project and your rights as a volunteer
now or at any time later. You may contact the research team while participating or
via the contact details shown below.
Nairn Scobie Andrew Leishman
E-mail: [email protected] E-mail:
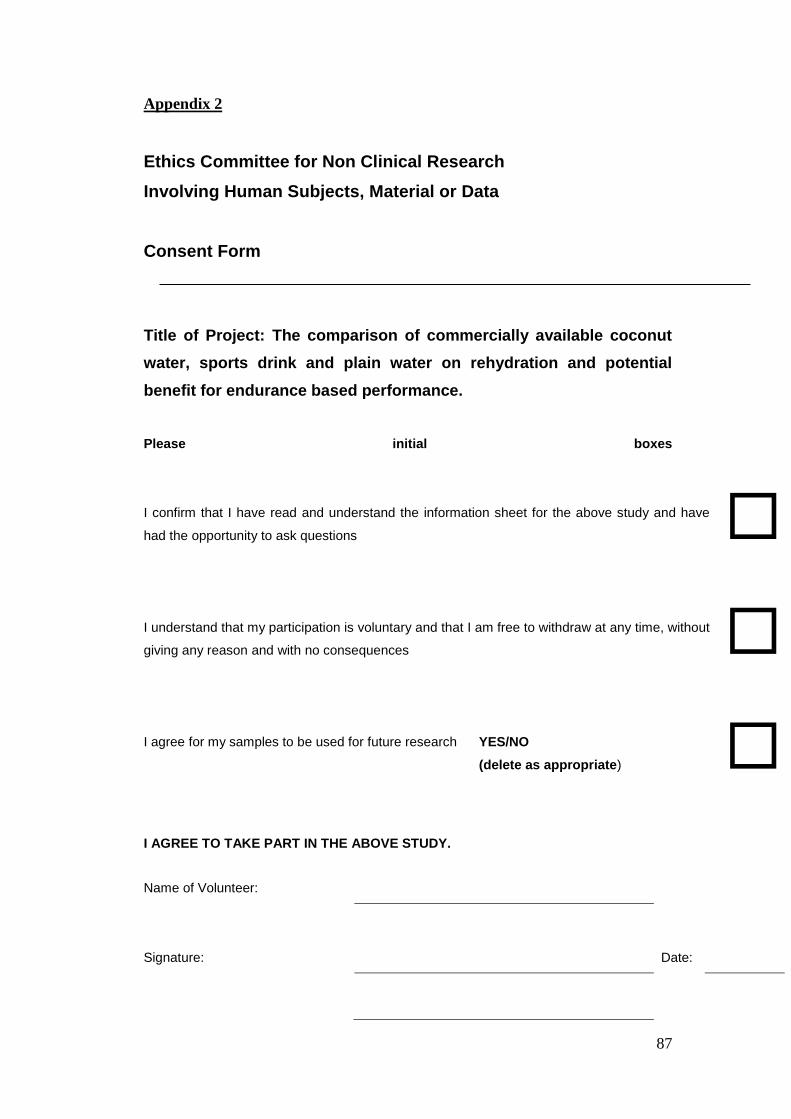
87
Appendix 2
Ethics Committee for Non Clinical Research
Involving Human Subjects, Material or Data
Consent Form
Title of Project: The comparison of commercially available coconut
water, sports drink and plain water on rehydration and potential
benefit for endurance based performance.
Please initial boxes
I confirm that I have read and understand the information sheet for the above study and have
had the opportunity to ask questions
I understand that my participation is voluntary and that I am free to withdraw at any time, without
giving any reason and with no consequences
I agree for my samples to be used for future research YES/NO
(delete as appropriate)
I AGREE TO TAKE PART IN THE ABOVE STUDY.
Name of Volunteer:
Signature: Date:
88
Name of person taking consent:
Signature: Date:
Name of Researcher:
Signature: Date:
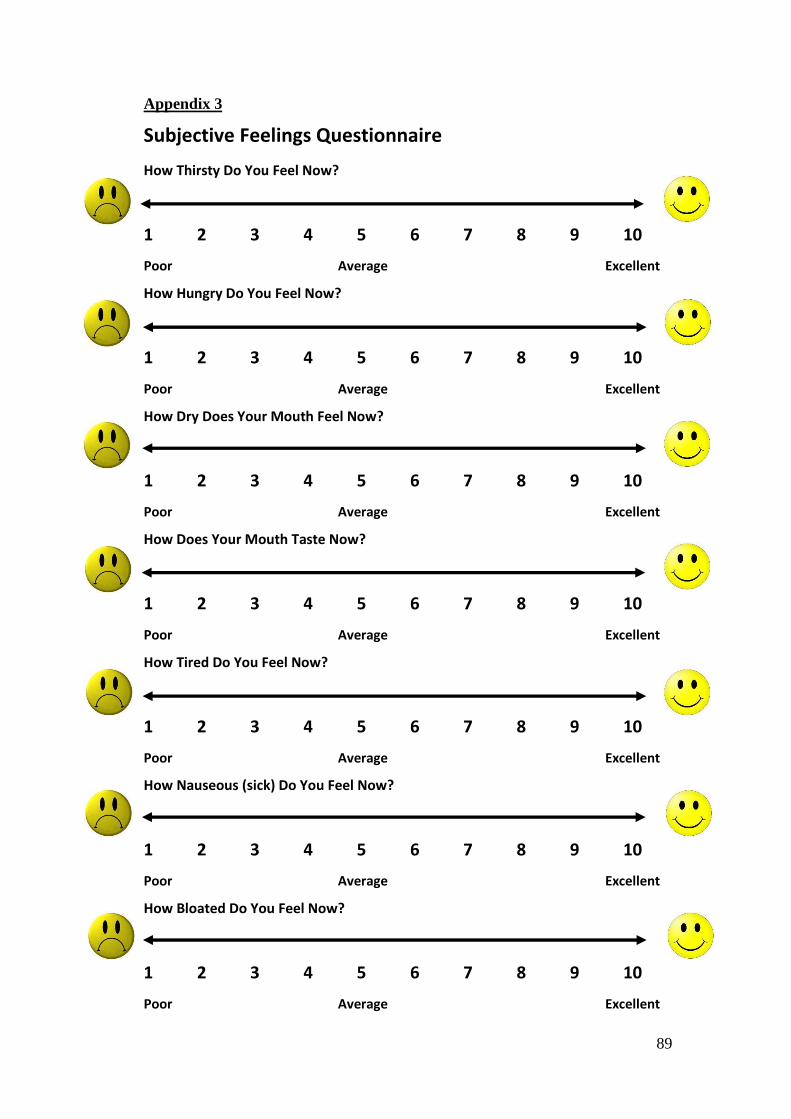
89
Appendix 3
Subjective Feelings Questionnaire How Thirsty Do You Feel Now?
1
2
3
4
5
6
7
8
9
10
Poor Average Excellent
How Hungry Do You Feel Now?
1
2
3
4
5
6
7
8
9
10
Poor Average Excellent
How Dry Does Your Mouth Feel Now?
1
2
3
4
5
6
7
8
9
10
Poor Average Excellent
How Does Your Mouth Taste Now?
1
2
3
4
5
6
7
8
9
10
Poor Average Excellent
How Tired Do You Feel Now?
1
2
3
4
5
6
7
8
9
10
Poor Average Excellent
How Nauseous (sick) Do You Feel Now?
1
2
3
4
5
6
7
8
9
10
Poor Average Excellent
How Bloated Do You Feel Now?
1
2
3
4
5
6
7
8
9
10
Poor Average Excellent

90