Embed Size (px)
Citation preview
Wireless Sensor Network, 2012, 4, 1-7 http://dx.doi.org/10.4236/wsn.2012.41001 Published Online January 2012 (http://www.SciRP.org/journal/wsn)
A Proposal of Sensor Data Collection System Using Mobile Relay Nodes*
Ryota Ayaki, Hideki Shimada, Kenya Sato Department of Information Systems Design, Doshisha University, Kyoto, Japan Email: [email protected], [email protected], [email protected]
Received October 16, 2011; revised November 23, 2011; accepted December 20, 2011
ABSTRACT
In recent years, as embedded devices become smaller, cheaper and more diverse, the demand for urban sensing systems that present valuable information to users is increasing. However, in achieving urban sensing systems, the communica-tion channel from the sensors to the data centers pose a problem, especially in respect to the cost of furnishing IP/mobile networks for each and every one of the sensor nodes. Many existing researches attempt to tackle this problem, but they generally limit either the types of sensors used or the distances among the sensors. In this paper, we propose a new sensor data collection system model in which mobile relay nodes transport the sensor data to the data center. We ran simulations under conditions imitating the real world to verify the practicality of the proposed system. This simula-tion uses data accumulated from traffic surveys to closely imitate pedestrians in the real world. We evaluated that the proposed system has sufficient ability to use in urban sensing systems that are not under the real-time constraint. Keywords: Wireless Sensor Networks; Data Aggregation; DTN; Mobile Networks
1. Background
In recent years, as sensors become smaller, cheaper and more diverse, a wide range of matter is becoming sub-ject to sensing. For instance, this includes natural phe-nomena such as earthquakes and weather, words said by people, train schedule delays, social phenomena such as sales and opening hours at shops, and man-made objects such as products and buildings. As more and more things become subject to sensing, more information such as what is happening where, who is doing what can be used in our everyday environments. Urban sensing systems that collect a variety of data using a multitude of sensors and provide them to users as beneficial information are gaining demand.
A variety of sensing models are proposed to achieve urban sensing systems. An example would be one using ad-hoc networks where sensor nodes attached to the en-vironment send their data wirelessly to other nodes with-out using a base station [1,2]. In this paper we will call this the “fixed-sensor” sensing model. Another example would be one where humans or robots equipped with sensors use store-and-forward networking to collect data as they roam around the environment [3,4]. In this paper we will call this the “roaming-sensor” sensing model.
There are many applications of urban sensing. In par-ticular, video monitoring systems for security surveillance
and elder-care have high demand [5,6]. These systems require that footage be collected from numerous cameras placed around the area. However, the fixed-sensor model, if it were to be employed in this system, requires other nodes to be present inside the wireless networking area at all times. The roaming-sensor model, on the other hand, is difficult to use in situations where sensors need to be fixed, and it also limits the types of sensors that can be used.
This paper proposes a new sensing model, the “mobile relay node” sensing model, where nodes that transmit data are physically detached from nodes that collect data. More specifically, relay nodes that roam around the area receive data from fixed sensors and transmit them to data centers. To discuss the practicality of this system, we ran simulations imitating the real world and evaluated the data collection ability.
2. Related Studies
2.1. Fixed-Sensor Sensing Model
Wireless sensor networks use wireless networking among sensor nodes to collect data from a number of distributed sensors. The most popular network model used is the ad-hoc network where nodes communicate directly with each other without routing through data centers. This is an effective way of building a low-cost network where infra- structure is not sufficient. However, because ad-hoc net- works use multi-hop communication, it requires that nodes
*This work was supported by JSPS Grant-in-Aid for Scientific Research KAKENHI (2100084).
Copyright © 2012 SciRes. WSN

R. AYAKI ET AL. 2
have other nodes present within their wireless areas at all times. For this reason, although ad-hoc networks are ef-fective in settings where sensors are placed in a limited area, they are unsuitable for settings where sensors are distributed over a wider area (such as in urban sensing).
One application of the wireless sensor network is the Field Server [7], an animal and plant growth monitoring system.
2.2. Roaming-Sensor Sensing
DTN (Delay/Disruption-Tolerant Network) [8] is a net- work architecture that achieves high-reliability data trans- mission in environments where disruptions, disconnections and major transmission delays occur frequently. DTNs use relay nodes that hold on to the data while moving around and transmit them when another node comes into its communicable area. This is called store-and-forward.
One application of the DTN is DakNet [9]. DakNet’s main components are the Internet access point, the mo-bile access point, and the kiosks. The Internet access point has access to the Internet. The mobile access point is the relay node, usually a motor vehicle that runs a cer-tain route periodically, such as a bus or motorcycle. The kiosks are end user terminals. DakNet allows the users to (indirectly) connect to the Internet through their kiosks. However, as we mentioned above, DakNet uses buses or motorcycles as relay nodes and they only go through a certain route, and is difficult to apply to urban sensing where the target area is relatively wide.
Human Probe [10] is a sensing model where humans equipped with wearable sensors roam around the target area (mainly urban districts). The persons carrying the sensors are to also carry a networking device so that they can transmit the data to data centers. However, because wearable sensors are limited by their weight, size and shape, many types of data are uncollectable.
Car Probe [11,12] uses cars as moving sensors. This system is categorized in ITS (Intelligent Transport Sys- tems), and there are various applications [13]. In Car Probe, sensor data is collected as the car runs, then cou- pled with GPS data and accumulated in the data center. Data in the data center can then be used to form informa- tion on traffic congestion, traffic accidents and weather, and these can in turn be provided to drivers. For example, windshield wiper operation data can provide rain infor- mation, and ABS operation data can provide information on frozen road surfaces. However, Car Probe is unsuitable for situations where sensors need to be in a fixed position.
3. Proposed System
3.1. Overview
In this paper, we propose a new sensor data collection model, the “mobile relay node” sensing model, where
nodes that transmit data are physically detached from nodes that collect data. More specifically, relay nodes that roam around the area receive data from fixed sensors and transmit them to data centers.
In contrast to fixed-sensor sensing, the mobile relay node model does not require that sensor nodes always have other nodes within their communicable area. In con- trast to roaming-sensor sensing, the mobile relay node model is not limited in its range area or usable sensor types.
3.2. Assumed Environment
The proposed system is composed of the sensor nodes, the mobile relay nodes, and the data center.
The sensor nodes are sensors eccentrically placed in the environment that collect data on natural or social phe-nomena or man-made objects. Some examples are lumi-nometers, thermometers and cameras. Sensor nodes in urban sensing systems need to be particularly large in number and, at the same time, inexpensive to produce and maintain. Therefore, we assume that they do not have the ability to connect to mobile wide-area data net-works. These sensor nodes use wireless PAN (Personal Area Networking) to communicate with the mobile relay nodes.
The mobile relay nodes are moving objects with no fixed routes. That is to say, the nodes do not have a cer-tain route that they must follow, and has no or few limi-tations on where they can go. Humans, animals or motor vehicles are suitable for these nodes. The mobile relay nodes are to have both wireless PAN and mobile wide- area data network connectivity. As they roam around the environment, the mobile relay nodes collect data from sensor nodes using wireless PAN and are responsible for relaying the data to the data center.
The data center is a base station or server connected to the Internet and is used to accumulate the data collected by sensor nodes. It is to have a database for storing the data and is to perform computations on the data and pos-sibly publish the resulting information.
3.3. Sensor Data Collection Model
Figure 1 shows the sensor data collection model. The curved lines indicate the routes that mobile relay nodes pass through. The dotted lines indicate data collection and transmission
The list below is the flow of operations. 1) The mobile relay nodes set their wireless PAN to
receiving mode. 2) The sensor nodes sense the environmental data and
store them in their queue buffer. 3) Once data is stocked in their buffers, the sensor nodes
use wireless PAN such as UWB (Ultra Wide Band), Zig-
Copyright © 2012 SciRes. WSN

R. AYAKI ET AL. 3
Bee, or Bluetooth to search a nearby mobile relay node. 4) When a mobile relay node comes in a sensor node’s
wireless PAN area and receives the search signal, it issues a connection permission and data transmission command.
5) The sensor node, upon receiving these signals, uses the wireless PAN to send the data stocked in its buffer to the mobile relay node.
6) The mobile relay node uses its wide-area data net-work connection to forward the data to the data center.
3.4. Assumed Applications
Because the proposed model uses sensor nodes and mo-bile relay nodes that are physically detached from each other, implementers can choose the best type of mobile relay node to use depending on the setting. For instance, in urban districts with many pedestrians, mobile phones can be used as mobile relay nodes. This setup would provide a large number of mobile relay nodes and would be able to collect a great amount of sensor data.
Although the mobile relay node model does not yield real-time performance, the flexible characteristic pointed out above allows a wide variety of applications. One ex-ample is a wide-range video surveillance system. Cur-rently, surveillance cameras are placed in crowded areas such as convenience stores and train stations. The cam-eras' primary purpose is security, and the number of cam-eras is not large. Also, the video data is generally only provided to the owners of the cameras and not published. On the other hand, a system that uses the proposed model allows a large number of video cameras to be placed throughout the city. The video data accumulated can pos-sibly be used to provide end-users with information on what is happening where, and who is doing what.
4. Simulated Environment
4.1. Overview
We have built a simulator in order to evaluate the pro-posed model’s ability to collect sensor data. Because sensor data generally lose value as time passes in urban sensing systems, we evaluate the model's ability to col-lect data based on latency, as in the elapsed time since sensing up to collection by the mobile relay node.
The simulated environment is based on the assumed application stated in Section 3.4. The sensor nodes are video cameras and the mobile relay nodes are handheld devices carried around by humans. The video data ac-quired by the video cameras are to be ultimately sent to the data center by the handheld devices.
4.2. Initial Data
In order to run the simulation, we needed a set of initial data regarding how the humans, or mobile relay nodes, move around.
The People Flow Project [14], conducted by The Cen-ter for Spatial Information Science at The University of Tokyo, provides “People Flow” data. This is a set of computed data collected from traffic surveys in metro-politan districts. The traffic surveys investigate many aspects of human traffic, including the types of people, their objectives, their origins and destinations, and the modes of transportation. The surveys target approxi-mately 2% of the total population.
Figure 2 shows a sample of the traffic survey data. The surveys handle “trips” as basic units of human flow: a trip starts when a person starts travelling from a certain origin and ends when she arrives at a certain destination. The figure shows three trips, one starting at home and ending at the office (the commute), another starting at the office and ending at the shop (the shopping), and a third starting at the office and ending at home (the return). Although the traffic surveys provide data on the modes of transportation and the starting and ending timestamps of the trips, the raw data does not contain location data (as in latitude and longitude). The People Flow Project is helpful here as it performs computations on the original survey data to infer location data on the humans, and the resulting data is available through its Web API.
In our simulation, we used this Web API to extract pedestrian data and used it as initial data for pedestrian routes.
4.3. Building the Simulator
We have built a simulator using Java. As mentioned in Section 4.2, routing of the mobile relay nodes are based on pedestrian trip data extracted from People Flow data. The trip data are acquired from a sample number ap-proximating to 2% of the total population. Although nearly 50 times this number is assumed to be present in the actual environment, we have not altered the number of pedestrians because it is difficult to accurately infer their routes. This means that in the simulation, the 2% of the population who participated in the traffic survey carry handheld devices that act as mobile relay nodes.
DB
MR Mobile Relay node
CE CEnter
SN Sensor Node
SN
MR
Mobile network IP network
UWB, ZigBee Bluetooth
B1
BufferB4
B3
B2
B1
B5
MR
MR
MR MRSN
SN
SN
SN
SN
SN
SN
SN
SN
SN
SN
CE
Figure 1. Model of sensor data acquisition.
Copyright © 2012 SciRes. WSN

R. AYAKI ET AL. 4
Home
Departed 8:00
Arrived 20:30 On foot
Train
Station Station
Commute Shopping
Trip 1 Trip 2
Shop
Arrived 18:30
Departed 19:30
Office
Arrived 9:00
Departed 18:00Bus
Bus stop Bus stop
Return
Trip 3
Train
Station Station
On foot
On foot
On foot
On foot
On foot
Figure 2. A sample of the traffic survey data.
5. Evaluation and Discussions
5.1. Picking Out the Initial Data
The list below is the flow of operations. Requirement 1) Transit infrastructure such as roads
and railroads are sufficient. Requirement 2) The area is stably crowded. Requirement 3) A portion of the area is off-limits to
motor vehicles. Requirement 1 is to ensure that pedestrian routes are
relatively easy to infer from trip data. Requirement 2 is to ensure that the data is not biased due to insufficient number of samples. Requirement 3 ensures that the char-acteristic discussed in Section 3.4 is visible in the simu-lation. That is to say, the implementer can choose her optimal type of mobile relay nodes depending on the amount of sensor data and the placement of the sensors, and handheld devices that cannot be employed in DakNet or Probe Car are suitable for mobile relay nodes.
Based on these requirements, we chose a 5 km square area centered on Tokyo Metropolitan City Hall.
Figure 3 shows a day's worth of pedestrian trip data by time. This shows that there is a rise at around 7:00 and a gradual fall starting at around 18:00. Therefore we used the data from 8:00 through 19:00 where the number of trips is relatively stable. The total number of trips within this time slot is 331,303, and the average hourly number of trips is 30,118. The number of unique persons that passed through this area in this time slot is 18,342, and the hourly average is 1667. The reason why Figure 3 shows spikes at the tops and bottoms of the hours is be-cause the traffic surveys are performed as questionnaires at those certain points of time.
0
200
400
600
800
1000
1200
1400
1600
1800
2000
0:00 2:00 4:00 6:00 8:00 10:00 12:00 14:00 16:00 18:00 20:00 22:00
Nu
mb
er o
f p
edes
tria
n t
rip
s
Time
Figure 3. Transition of pedestrian trips.
5.2. Picking Out the Initial Data
Table 1 shows the parameters used in the simulation. Data generations at the sensor nodes are to take place every 1 minute. Because we ran the simulation at a 1-minute reso- lution, this means that data is accumulated continuously. Data sizes at the sensor nodes are 100, 300, 500, 700 and 900 KBytes. Communicable proximity between a sensor node and a mobile relay node using PAN is to be 10 m. Data transmission rate using PAN is to be 1600 Kbps. These numbers are based on Bluetooth's capabilities. Min- imum sensor node proximity, or the minimum distance between two sensor nodes, is to be 20 m. This is because sensors placed too close to each other do not produce valuable data. Also, because the communicable proximity is 10 m, this ensures that a single mobile relay node does not come in range of multiple sensor nodes at the same time. Also, the simulation disregards PAN connection overheads normally produced on startup and termination.
5.3. Sensor Node Placement
To best collect data from the environment, it is obvious that the more sensor nodes placed the better. However, it is too costly to place all desired sensor nodes in a large scale urban sensing setup. Therefore, we employed the following rules in determining the placement of sensor nodes. Step 1: Sampling
The target area is 5 km wide by 5 km long in which there are innumerable candidates of sensor node place-ment. We reduce this area to a grid 1000 units wide by 1000 units long, where each unit is 5 m by 5 m. We will hereon refer to this grid as the “local map”. Step 2: Mapping and counting
We load the pedestrian trip data along with their loca-tion data. We map the latitude and longitude on to the local map. The local map holds the number of mappings given.
Table 1. Simulation parameters.
Parameter Value
Center of area (lat.) 35.689185
Center of area (long.) 139.691648
Height of area 5 km
Width of area 5 km
Data generation rate 1 min
Data generation sizes 100, 300, 500,
700, 900 Kbytes
Communicable proximity between sensor and mobile relay node
10 m
Data transmission rate between sensor and mobile relay node
1600 kbps
Minimum sensor-to-sensor distance 20 m
Copyright © 2012 SciRes. WSN
R. AYAKI ET AL. 5
Step 3: Sorting in ascending order by maximum latency
We place sensor nodes where the mapping count is 1 or larger and run the simulation. We measure the maxi-mum latency (the largest value from the latencies that the particular sensor yielded throughout the simulation) against each sensor node, and once the simulation is done, we sort the sensors in ascending order by the maximum latency. Step 4: Deletion of sensor nodes based on node-to- node distance
Finally, we delete the sensor nodes that violate the minimum sensor node proximity. Nodes sorted to a lower rank in Step 3 are deleted first.
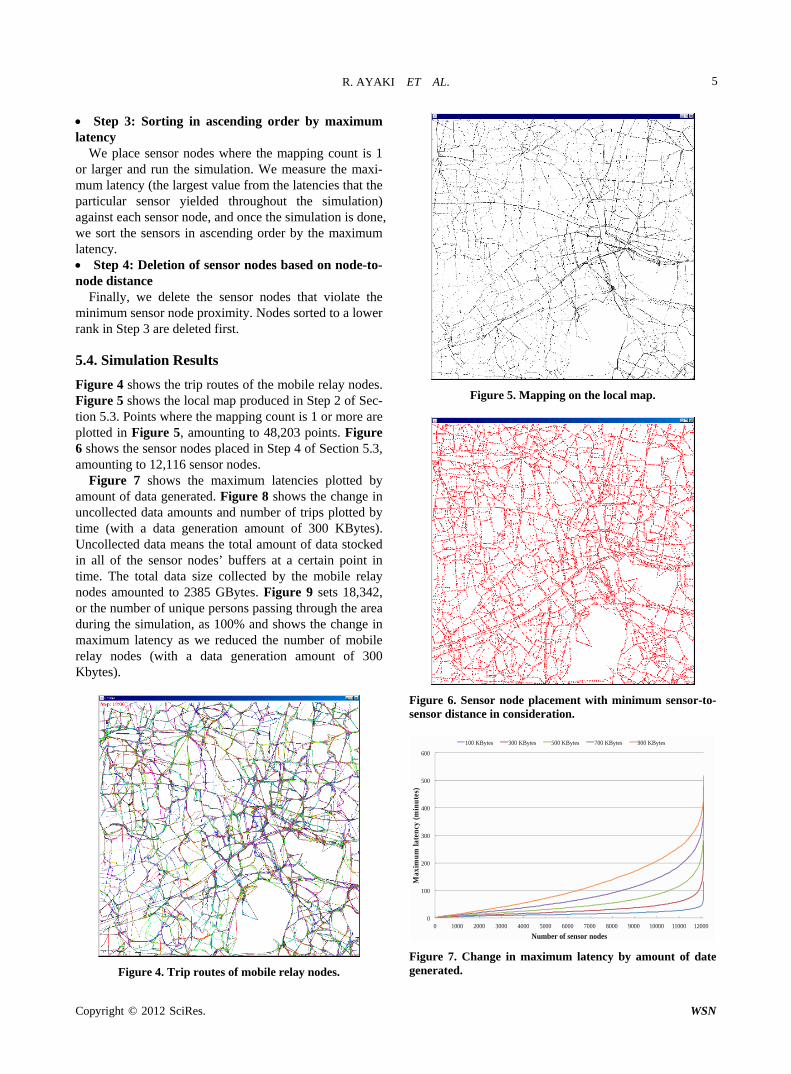
5.4. Simulation Results
Figure 4 shows the trip routes of the mobile relay nodes. Figure 5 shows the local map produced in Step 2 of Sec-tion 5.3. Points where the mapping count is 1 or more are plotted in Figure 5, amounting to 48,203 points. Figure 6 shows the sensor nodes placed in Step 4 of Section 5.3, amounting to 12,116 sensor nodes.
Figure 7 shows the maximum latencies plotted by amount of data generated. Figure 8 shows the change in uncollected data amounts and number of trips plotted by time (with a data generation amount of 300 KBytes). Uncollected data means the total amount of data stocked in all of the sensor nodes’ buffers at a certain point in time. The total data size collected by the mobile relay nodes amounted to 2385 GBytes. Figure 9 sets 18,342, or the number of unique persons passing through the area during the simulation, as 100% and shows the change in maximum latency as we reduced the number of mobile relay nodes (with a data generation amount of 300 Kbytes).
Figure 4. Trip routes of mobile relay nodes.
Figure 5. Mapping on the local map.
Figure 6. Sensor node placement with minimum sensor-to- sensor distance in consideration.
0
100
200
300
400
500
600
0 1000 2000 3000 4000 5000 6000 7000 8000 9000 10000 11000 12000
Max
imum
late
ncy
(m
inu
tes)
Number of sensor nodes
100 KBytes 300 KBytes 500 KBytes 700 KBytes 900 KBytes
Figure 7. Change in maximum latency by amount of date generated.
Copyright © 2012 SciRes. WSN

R. AYAKI ET AL. 6
0
200
400
600
800
1000
1200
1400
1600
1800
2000
0
5000
10000
15000
20000
25000
30000
35000
40000
45000
50000
8:00 9:00 10:00 11:00 12:00 13:00 14:00 15:00 16:00 17:00 18:00 19:00
Nu
mb
er o
f p
edes
tria
n t
rips
Tot
al a
mou
nt
of u
nco
llec
ted
dat
a (M
Byt
es)
Time
Total amount of uncollected data (MBytes) Number of pedestrian trips
Figure 8. Changes in total amount of uncollected data and number of pedestrian trips.
0
100
200
300
400
500
600
700
0 1000 2000 3000 4000 5000 6000 7000 8000 9000 10000 11000 12000
Max
imu
m la
ten
cy (
min
ute
s)
Number of sensor nodes
100% 90% 80% 70% 60% 50% 40% 30% 20% 10% Number of mobile relay nodes
Figure 9. Change in maximum latency by number of mobile relay nodes.
5.5. Discussion
We reduced the actual map to a grid and used mapping counts to determine sensor node placement. This proved to be effective in recognizing the places where more people pass through, such as major roads and intersec-tions, as shown in Figure 5. Figure 6 tells us that sensor nodes are placed with adequate distance from each other, and that sensor nodes are effectively placed in parks or shrines where motor vehicles cannot enter. Figure 7 tells us that the maximum latency increases as we increase the amount of generated data.
Let us assess these results in regard to the video sur-veillance system discussed in Section 3.4. Assuming that a common surveillance camera uses a 640 × 480 dpi resolution, MPEG-4 encoding, and a 1 FPS frame rate, data would be generated at a rate of approximately 300 Kbyte per minute. Figure 7 reads that at a 300 KByte data generation, the maximum latency ranges from 0 min to 280 min and the average is 29 min when the number of sensor nodes change from 0 to 12,116. This means that using this system, the surveillance system can pro-vide all video data from approximately 30 min ago and
Now
older.
let us discuss the amount of uncollected data and th
9 tells us that the maximum latency in
6. Conclusions
an sensing systems that provide users
roposed a new sensor data collec-tio
REFERENCES [1] I. Akyildiz, W aniam and E. Cay-
e number of trips based on Figure 8. Because the area used in the simulation is a business district, the number of trips is high at time slots when people commute to and from the office. Figure 8 also shows that at time slots when there are many pedestrians, the amount of uncol-lected data is kept down low by the large number of mo-bile relay nodes.
Finally, Figurecreases as the number of mobile relay nodes decrease.
This also means that not as many sensor nodes can be placed when there are fewer mobile relay nodes.
In recent years, urbwith valuable information using data collected with a large number of sensors is gaining demand. However, in achiev- ing urban sensing systems, the communication channel from the sensors to the data centers pose a problem. Ex-isting attempts to tackle this problem, such as the fixed- sensor model and the roaming-sensor model, generally limit either the types of sensors used or the distances among the sensors, so they are not suitable for urban sensing systems.
In this paper, we pn system model, the mobile relay node model, in
which nodes that transmit data are physically detached from nodes that sense environment data. We also evalu-ated the data collection ability of the model using a simulation imitating real-world environment using traffic survey data. We have verified that the proposed system model has sufficient data collection ability for use in ur-ban sensing systems that are not under the real-time con-straint.
. Su, W. Sankarasubramirci, “Wireless Sensor Networks A Survey,” Computer Networks Elsevier Journal, Vol. 38, No. 4, 2002, pp. 393- 422. doi:10.1016/S1389-1286(01)00302-4
[2] G. Pottie, “Wireless Sensor Networks,” Proceedings of Information Theory Workshop, 1998, pp. 139-140.
[3] K. Fall, “A Delay-Tolerant Network Architecture for
operative
Otsu, “Anomaly Detection in Motion
Information Processing Society of Japan, Vol. 46, No.
Challenged Internets,” Proceedings of the 2003 confer-ence on Applications, technologies, architectures, and protocols for computer communications, 2003.
[4] K. Mohri, T. Hasegawa and R. Kurazume, “CoTracking of Pedestrian by an On-Board LRF of Mobile Robot and a Fixed Vision,” Proceedings of the 2008 JSME Conference on Robotics and Mechatronics, Vol. 2P1-H10, 2008.
[5] T. Nanri and N.Images Containing Multiple Persons,” Transactions of
Copyright © 2012 SciRes. WSN

R. AYAKI ET AL.
Copyright © 2012 SciRes. WSN
7
sing Sparse Distributed Cam-
onitoring Servers,” Proceedings of
smail and S. Keshav, “Design and Imple-
land, R. Fletcher and A. Hasson, “DakNet: Re- SIG-15, 2005, pp. 43-50.
[6] Y. Kobayashi, Y. Sato and A. Sugimoto, “Estimation of People’s Trajectory by Ueras,” Meeting on Image Recognition and Understanding, 2006, pp. 1213-1218.
[7] T. Fukatsu and M. Hirafuji, “Long-Term Monitoring System Using Field MAFITA/WCCA Joint Congress on IT in Agriculture, 2004, pp. 685-691.
[8] S. Guo, M. Falaki, E. Oliver, S. Rahman, A. Seth, M. Zaharia, U. I mentation of the KioskNet System,” International Con- ference on Information Technologies and Development, 2007.
[9] A. Pentthinking Connectivity in Developing Nations,” Computer, Vol. 37, No. 1, 2004, pp. 78-83. doi:10.1109/MC.2004.1260729
[10] K. Oshima, Y. Ishida, S. Konomi and Y. Tobe, “Explor-
Kawakita and Y. Akiyama,
ing the Uses of Pressure Sensors and Accelerometers,” Proceedings of Forum of Information Technology, 2009, pp. 251-252.
[11] M. Izumi, R. Wakikawa, Y. “Internet ITS Project Overview,” Transactions of Infor- mation Processing Society of Japan, Vol. 43, No. 4, 2002.
[12] N. Tokitsu and K. Takahashi, “Internet ITS Project Veri- fication Test,” Transactions of Information Processing Society of Japan, Vol. 43, No. 4, 2002.