Embed Size (px)
Citation preview

Race to Equity A Project to Reduce Racial Disparities in Dane County
Wisconsin Council on Children and Families
Presenters Erica Nelson and Torry Winn

Who we are
Goals and purpose of the Project
The Project’s work over the last year
Some of our key findings
Some important take-aways from the numbers we found
Some preliminary ideas about local factors and forces behind these numbers
Some suggestions about the most important directions and goals we need to focus on going forward
Overview

Project of the Wisconsin Council on Children and Families
Funded by a multi-year grant from the Annie E. Casey Foundation
Staffed by small multi-racial team with experience in data collection, analysis, child welfare, youth development, community building, and advocacy for racial justice.
Supported by a diverse volunteer cadre of local and national leaders, thinkers and advisors who have wealth of experience, expertise and vision to share.
Determined to add our energy to the long history of local social justice work done by many individuals in the communiuty
Who We Are

Dane County is often considered one of the best places to live in America.
Dane County is resource rich and progressively minded.
Despite these positive attributes, Dane County also has some of the highest racial disparities in the United States.
Context

“Like many transplants from other U.S. cities to Madison, my husband and I were excited about raising our son in a college town that was known for inspiring intellectual activity and progressive politics. It was shocking to learn about the racial disparities in education and criminal justice in Madison especially as the mother of an African American boy. Addressing this issue is absolutely critical if I-and other middle-class African American families-are going to invest our time, energy, and resources in Madison.” - Dane County Mother

Goals: To collect, analyze, track and disseminate data on the kind and degree of racial and ethnic disparities that exist in Dane County.
Purpose: To use data and analysis, not as ends in themselves, but as tools to inform, guide and inspire results-based collective action to narrow racial and ethnic disparities in Dane County.
Vision: A more equitable, inclusive, diverse and thriving Dane County that works for all our children and families. A place that someday can serve as a model for disparity reduction in other communities across the country.
Goals, Purpose and Vision of the Project

Collecting and Analyzing Data
Gathering Community Feedback on Our Disparity Numbers, Including Ideas About the Causes of Our Problems and How to Best Address Them
Gathering Advice From Local and National Experts, Researchers and Practitioners, Funders and Advocates About How To Frame and Address Dane County’s Racial Equity Challenges
Putting Together Our Baseline Report On the State of Racial Disparities in Dane County
What We Have Worked On This Past Year

Dane County’s total population in 2010 was 488,073. The County’s African American population was 31, 300 (or 6.4%), (and was
made up of 25,347 identifying as “Black only”, and 5,953 as “Black with another race”).
The African American child population numbered 8,804, or 8.3% of the county’s total child population.
African American children make up about 20% of Madison public schools and 17% of public schools county-wide.
Since 2000 the African American population of Dane County grew by more than 50% (from 20,241 to 31,300), while the White population grew by only 10%.
In 2010 African Americans were the county’s most populous community of color, followed closely by an even faster growing populations of Hispanics (28,925) and Asians (26,698).
A Quick Demographic Profile of Dane County in 2010
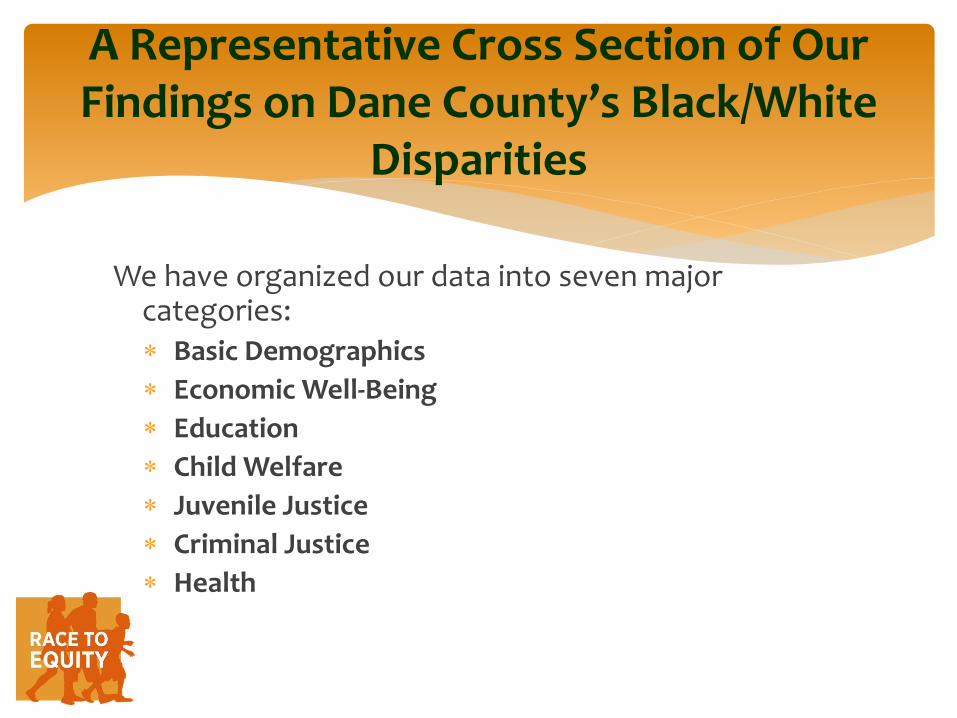
We have organized our data into seven major categories: Basic Demographics
Economic Well-Being
Education
Child Welfare
Juvenile Justice
Criminal Justice
Health
A Representative Cross Section of Our Findings on Dane County’s Black/White
Disparities

In this category, we compare Whites and African Americans on 4 key measures:
Unemployment Rate
Median Household Income
Poverty
Child Poverty
Economic Well-Being

In 2011, the unemployment rate for African Americans in Dane County was estimated by the ACS at 25.2%, compared to 4.8% for Whites.
Dane County’s 25.2% Black unemployment rate was significantly (and surprisingly) higher than the national African American jobless rate of 18% - a fact especially relevant given the county’s comparatively low overall unemployment rate throughout the recession.
Unemployment Rate

According to the 2011 ACS, the median household income of Dane County’s African American families was $20,664, less than 1/3 the median income enjoyed by White families ($63,673) .
The 2011 median income of African American households in Dane County ($20,664) was significantly lower than that for African American families statewide ($24,399), and far lower than the national median income of all African American households ($33,223).
Perhaps the most important take-away is that over half of Dane County’s African American households are getting by on less than $20,000 a year. By contrast, fewer than a quarter of the county’s African American households had earnings above $50,000.
Median Household Income

In 2011, the annual ACS survey reported that 54% of all Dane County African Americans lived below the poverty line, compared to 8.7% for Whites.
Even using the far more conservative ACS 3 –year averaging method, the Dane County Black poverty rate has consistently been in excess of 43%.
Under either calculation, African Americans in Dane County were 5 to 6 times more likely to be poor than their White counterparts.
Dane County’s Black poverty rate, conservatively estimated at 43%, was nearly one and half times the poverty rate for African Americans nationwide (28%) and higher than the poverty rate for Blacks in Milwaukee County (39%).
Poverty

The 2011 published Census ACS estimated the percentage of African American children in poverty in Dane County at an astounding 74.8%, compared to an estimate of 5.5% for White children.
Using the more conservative method of averaging annual ACS numbers over 3 years, the data still yields a Black child poverty estimate of greater than 56%.
This means that an African American child in Dane County is at least 11 times more likely to grow up in poverty than his White counterpart.
Similarly noteworthy, the child poverty rate for African Americans in Dane County was almost one and a half times as high as the nationwide child poverty rate for African Americans (39%) and was somewhat higher than that for African American kids elsewhere in Wisconsin (50%). In other words, Black children in Dane County were more likely to be poor than their counterparts in Milwaukee, and most other places in the United States.
Child Poverty

In this category, we compare Whites and African Americans on 5 key measures:
Third Graders Not Proficient in Reading
Rate of Suspension
Chronic Absences/Habitual Truancy
Students Not Graduating On Time
Students Not Taking the ACT
Education

In 2011 nearly half (48.1%) of all Dane County’s Black third graders failed to meet proficiency standards in reading, compared to 10.9% of White third graders.
In other words, Dane County Black third graders were 4.4 times more likely NOT to be proficient in reading than their White peers.
In 2011, third grade reading performance for Dane County’s Black children was measurably worse than for Black third graders statewide.
Beginning in 2012, 3rd grade reading proficiency was measured by a new threshold standard (WKCE). The results under the new standard indicate that 86.2% of African American third graders were not proficient, compared to 47.6% of White third graders.
Third Graders Not Proficient In Reading (2011)

In 2011, school suspensions of African American students in Dane County numbered 3,198, compared to 1,130 suspensions of White students.
After accounting for the relative size of the African American and White share of total students enrolled, we find that suspensions were 15 times more likely to involve an African American student than a White student.
Rate of Suspensions (or Expulsions) for Incidents Unrelated to Weapons
or Drugs

In the 2011-2012 school year nearly 20.5% or over 1/5 of Dane County African American students were labeled “habitually truant” (having unexcused absences more than 5 days a semester), compared to 2.2% of White students in that category.
In other words, Dane County African American students were 9 times more likely to be chronically absent than their White counterparts.
Chronic Unexcused Absences in Dane County

In the 2010-2011 school year nearly half of Madison’s African American high-school students failed to graduate on time, compared to 16% of White students.
Black students were more than 3 times less likely to graduate on time than their White classmates.
The 50% failure-to-graduate rate for Madison Black students appears to be measurably worse than the rate for African American students statewide (36.2%), based on the best available comparable data.
Students Failing to Graduate On Time in Madison Metropolitan School District

In the 2011-2012 school year, only 30.2% of African American seniors took the ACT compared to 63% of White fellow 12th graders meaning that African American students were less than half as likely to take the major college entrance exam as their white peers.
The 30% of Dane County African American seniors who chose to take the test was significantly less than the 50% of African American seniors who opted to take the test statewide.
Percent of Students Taking the ACT

In this category, we look at White and Black data on the following measures:
Referrals to Child Protective Services
Children in Foster Care During the Past Year
Juvenile Arrests
Juveniles Placed in County Secure Detention Pending Disposition
Juvenile’s Sent to the State’s Correctional Facility (Lincoln Hills)
Adult Arrests
New Prison Placements
Child Welfare, Juvenile Justice and Adult Corrections

In 2011, Dane County African American children were referred to Child Protective Services at a rate of 196 per 1,000 compared to 29.5 per 1,000 White children; African American children were 6.6 times as likely to be referred as Whites.
Referrals to Child Protective Services

Referrals to Child Protective Services

On a typical day in 2011, there were 124 Dane County African American children in Foster Care, compared to 58 White children.
This snapshot data suggests that African American children were approximately 15 times more likely to be in foster care than White children in Dane County.
While Black children make up about 10% of the County’s total child population, they typically constituted nearly 60% of all children in placement on any given day in 2011.
Children in Foster Care During 2011

In 2010 Dane County Black juveniles (ages 10-17) were arrested at a rate 6 times that of White juveniles. Although the absolute number of Black juvenile arrests has fallen significantly since 2005 and the disparity has improved somewhat, Dane County’s disparity numbers (6.1 to 1) still remain worse than the disparity rates for juvenile arrests in Wisconsin (3.4 to 1) and in the nation (2.1 to 1).
Juvenile Arrests

Juvenile Arrests

In 2011 Dane County Black youths were sent to secure detention at a rate of 102 per thousand, compared to 5.8 per thousand for White youths, creating a disparity ratio of 15.3 to 1.
Black youths in Dane County made up 10% of the total population between ages 12-17, but constituted 64% of the detention population.
Juveniles Placed in County Secure Detention Pending Disposition

Juveniles Placed in County Secure Detention Pending Disposition cont.

This means that a Dane County Black youth was 25 times more likely to be sent to the state’s secure facility than White youth.
Perhaps even more striking is that while Black youth made up 10% of the county’s adolescent population, they constituted almost 80% of all local youth admitted to correctional facilities.
Juveniles Sent to the State’s Correctional Facility (Lincoln Hills) in 2011

Juveniles Sent to the State’s Correctional Facility (Lincoln Hills) in the
Past Year

In 2012, Dane County African Americans were admitted to prison facilities at a rate 15 times greater than that for White adults.
While Dane County Black adults in 2012 made up only 4.8% of the total age 18 to 54 adult population, they constituted nearly 44% of all the new adult prison placements from the County.
New Adult Prison Placements

The Gap Between Black and White
First, our numbers, taken as a whole, suggest that the distance between Black and Whites in Dane County (in terms of well-being, condition and outcomes) is wider than almost any other jurisdiction (urban or rural, North or South) for which we have comparable statistics.
Four Key Take Aways About What The Data is Telling Us
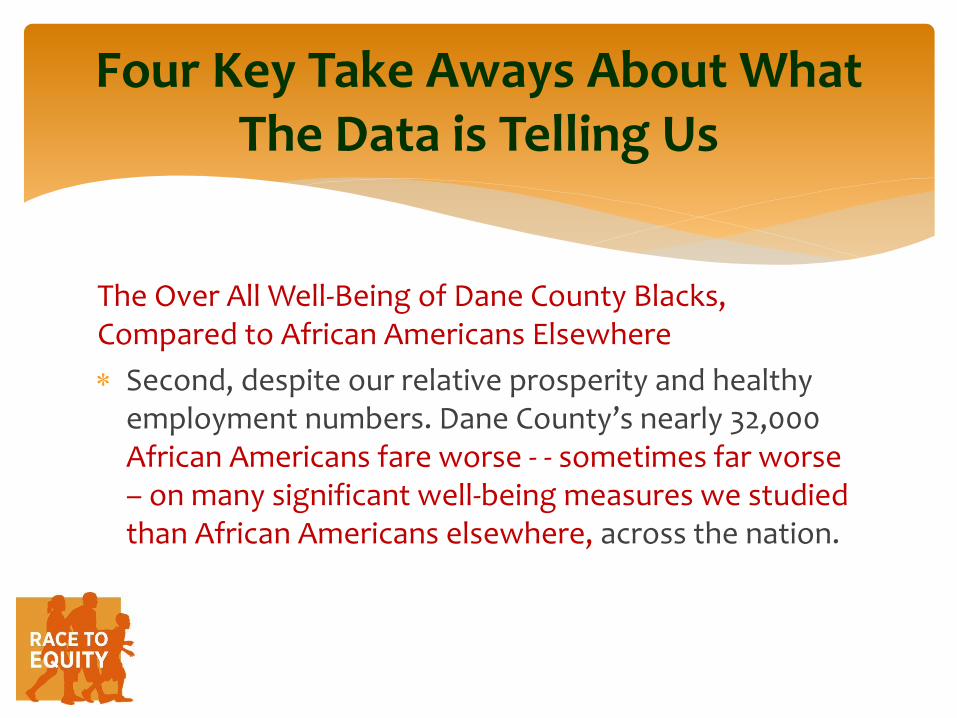
The Over All Well-Being of Dane County Blacks, Compared to African Americans Elsewhere
Second, despite our relative prosperity and healthy employment numbers. Dane County’s nearly 32,000 African Americans fare worse - - sometimes far worse – on many significant well-being measures we studied than African Americans elsewhere, across the nation.
Four Key Take Aways About What The Data is Telling Us

The Racialization of Disadvantage
Third, Dane County is a place where poverty and poor outcomes have an exceptionally strong correlation with race and color. Put another way, disadvantage here has become highly racialized.
Four Key Take Aways About What The Data is Telling Us (continued)

The Cost of Racializing Disadvantage
Finally, all the above patterns have the alarming potential to foster stereotyping, profiling or differential expectations based on color – a tendency that exacerbates and deepens the county’s racial equity challenge.
Conscious racism may not be the primary cause of these disparities but their continuation may well foster and reinforce discrimination and differential expectations based on race.
Four Key Take Aways About What The Data is Telling Us (continued)

The legacy of slavery –two and a half centuries of bondage, 100 years of segregation, discrimination, and exclusion and 50 years of persisting racism embedded in our attitudes, economy, politics, institutional practices and social structures – all of this is still very much disadvantaging African Americans and privileging white Americans. That is as true for us here as it is for everywhere else in the United States.
In addition to this universal driver of inequality in America there are some local factors that help explain the disadvantage of African Americans in Dane County.
Three Key Local Factors that Contribute to Our Exceptional Disparity Rates
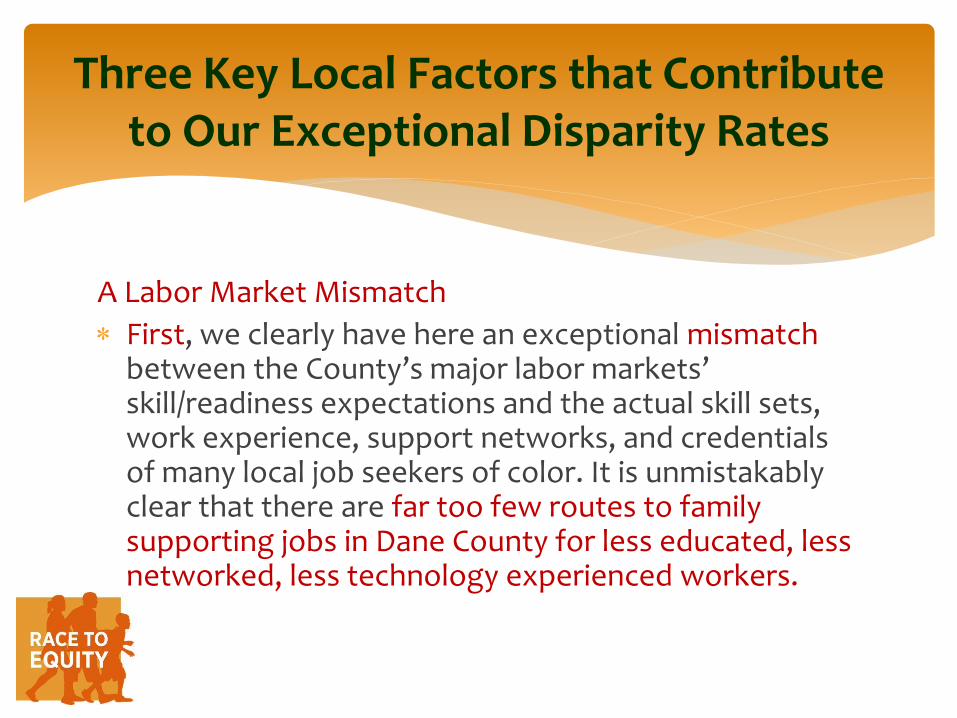
A Labor Market Mismatch
First, we clearly have here an exceptional mismatch between the County’s major labor markets’ skill/readiness expectations and the actual skill sets, work experience, support networks, and credentials of many local job seekers of color. It is unmistakably clear that there are far too few routes to family supporting jobs in Dane County for less educated, less networked, less technology experienced workers.
Three Key Local Factors that Contribute to Our Exceptional Disparity Rates

Neighborhood Isolation
Second, a significant fraction of at risk African American families (especially those who have arrived in the last 4 decades) live in scattered, small, socially isolated, residential concentrations that lack family-supporting institutions and networks; that have only limited community strengthening resources; and have few meaningful connections to surrounding neighborhoods, workplaces or broader civic participation opportunities.
Key Local Factors that Contribute to Our Exceptional Disparity Rates (continued)

A Need for Capacity Building in Our Family and Child Serving Systems Third, many of the county’s family serving, educational,
youth development, and employment and training institutions have incomplete experience, expertise, confidence, organizational support, and resources for effectively addressing the strengths and needs of low-income families of color. The apparent under-representation of persons of color in the workforce of many of these institutions and professions is doubtlessly one dimension of the problem.
Key Local Factors that Contribute to Our Exceptional Disparity Rates (continued)

Promote Employment, Financial Security and Economic Inclusion
First, we need the region’s public and private employers, (supported by employment training, family service and child care providers), to create more pathways into family-supporting careers for a significantly larger share of the under-employed or unemployed parents whose children are in or entering our county’s schools.
What We Need to Do

Support Parents and Strengthen Families
Second, We need to strengthen and target our county’s family support services and resources to help more fragile families fulfill and balance their aspirations to be both informed and effective parents, while at the same time taking up more productive roles in the economy and community.
What We Need to Do

Strengthen Neighborhoods and Communities
Third, we need to strengthen the county’s scattered and isolated high poverty neighborhoods by both increasing the leadership development opportunities, the family-supporting resources and social networks within those neighborhoods - - and by better connecting the residents of those communities to educational, training, employment, health, cultural and recreational and civic participation opportunities that exist across the county.
What We Need to Do (continued)

Increase Equity in Educational Opportunity and Achievement Fourth, we need to create stronger and more aligned
partnerships among the county’s early learning resources, our public school systems and the region’s post- secondary education and training institutions – a partnership capable of 1) intervening earlier and more effectively in the lives of our youngest children; and 2) assuring that a much higher percentage of those children are ready for kindergarten, can read proficiently at 3rd grade, and can graduate ready to take advantage of the post secondary training they need to succeed in a 21st Century economy.
What We Need to Do (continued)

Strengthen Effective Practice Fifth, we need to do more to strengthen and support the
workforces of the agencies and institutions who can make the greatest difference in the lives of the county’s most disadvantaged children and families – the professionals and staff in our early childhood, educational, youth development, family service, child welfare, juvenile justice and court systems. We not only need to achieve greater racial and ethnic diversity in many of these systems, we must also equip staff of all backgrounds with the ideas, techniques, training, resources, tools, coaching and supports they need to be even more effective in responding to both the strengths and challenges of low-income children and families of color.
What We Need to Do (continued)

We need to authentically engage the families and communities most affected by these disparities in identifying and implementing solutions.
Our approach needs to be a two generation strategy- - one that supports under-resourced parents while intensifying investments in at risk children, from cradle to career.
Our agency and sector specified programs and services to be woven together into a more integrated whole - - one that is comprehensive and collaborative, not siloed.
Our major investments of money and time must be more effectively targeted, recognizing the greatest needs are heavily concentrated among low-income families of color.
Given the depth and breadth of problems, our responses have to be driven by urgency and sustained by long term commitment.
Principles and Values That Need to Inform All Our Efforts To Address the Racial Equity Challenge
Our Strengths and Assets On the positive side, the comparative wealth of the county, the
progressive vision of many of its leaders, the social values of its citizens and the emergence of a growing and talented African American leadership cadre suggest we have a high capacity for making difficult social and institutional change.
Scale of the Problem is Manageable Furthermore, the scale of our challenge is not beyond addressing.
Altering (through targeted efforts) the family support, opportunity, educational experience, social networks, and employment status of one to two thousand households with children could dramatically impact the disparity in less than a decade… and set a very different and more equitable trajectory for the future.
Local Factors That Can Help Us Address this Challenge

Making Progress Is In All Our Interests Addressing racial disparities is critical, not only as a matter of simple justice,
but also for our county’s collective well-being. Narrowing racial resource and opportunity gaps will help to level the playing field for all citizens and, in turn, will make Madison and surrounding areas a more supportive environment for high achievement by all our children and families, including those of color. This is not only the right thing to do morally, it is the smart thing to do economically. Unless our entire community is thriving, the long term social, cultural and economic fate of our county will be far less promising. In the increasingly globalized world of the 21st Century, only a Dane County that is able to attract and support success for individuals and families of all backgrounds will be able to retain its long cherished status as one of the nation’s great places to live, study and work.
Local Strengths That Can Help Us Address this Challenge (continued)

“Four years ago, I decided Dane County was the place I wanted to raise my children because it truly is a great place to live. As a single mom, I found a terrific job and have been pleased with the education my children have received, but I know that our experience isn’t the experience of all families. Our community is poised to respond to these concerns, because one of the best things about living here is the people. The people truly care; our neighbors want to make a difference; our community is at a tipping point to becoming the community it always thought it was.”
- Dane County Mother

WE MUST FIX THIS
WE CAN FIX THIS
WE WILL FIX THIS
The One Thing We Are Sure About Is