Embed Size (px)
Citation preview

Page 1 of 25
Essex Local Authority Portraits A product of the Essex Joint Strategic Needs
Assessment (JSNA)
A profile of people living
in Chelmsford
May 2016 Organisational Intelligence
Covering approximately 343 square kilometres, the Chelmsford borough is situated at the heart of Essex and was granted city status in 2012. The borough consists of two main urban areas - the county town of Chelmsford and the town of South Woodham Ferrers - along with villages and other rural areas. The main arterial road of Essex, the A12, crosses through the borough providing the area with quick access to the rest of the county and London. The area attracts a large number of commuters due to the 30–35 minute journey to central London via the mainline train service.
Organisational
Intelligence
Page 2 of 25
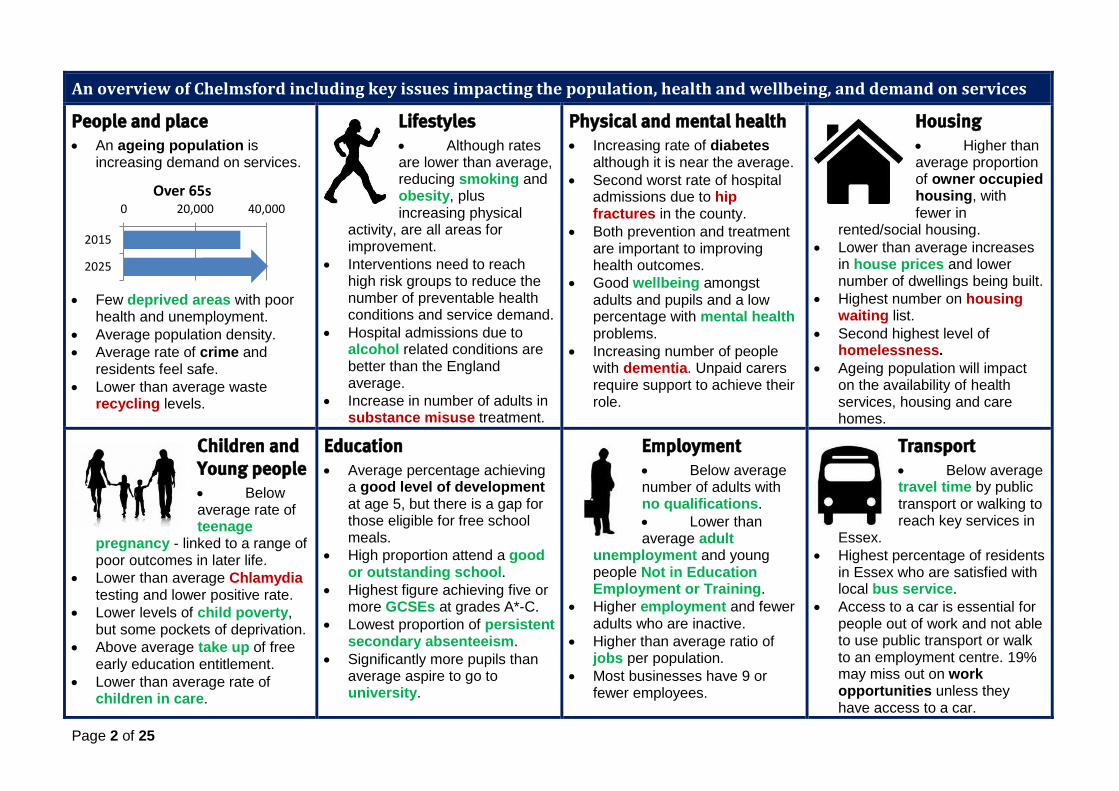
An overview of Chelmsford including key issues impacting the population, health and wellbeing, and demand on services
People and place An ageing population is
increasing demand on services.
Few deprived areas with poor
health and unemployment.
Average population density.
Average rate of crime and residents feel safe.
Lower than average waste recycling levels.
Lifestyles Although rates are lower than average, reducing smoking and obesity, plus increasing physical
activity, are all areas for improvement.
Interventions need to reach high risk groups to reduce the number of preventable health conditions and service demand.
Hospital admissions due to alcohol related conditions are better than the England average.
Increase in number of adults in substance misuse treatment.
Physical and mental health Increasing rate of diabetes
although it is near the average.
Second worst rate of hospital admissions due to hip fractures in the county.
Both prevention and treatment are important to improving health outcomes.
Good wellbeing amongst adults and pupils and a low percentage with mental health problems.
Increasing number of people with dementia. Unpaid carers require support to achieve their role.
Housing Higher than average proportion of owner occupied housing, with fewer in
rented/social housing.
Lower than average increases in house prices and lower number of dwellings being built.
Highest number on housing waiting list.
Second highest level of homelessness.
Ageing population will impact on the availability of health services, housing and care homes.
Children and Young people Below average rate of teenage
pregnancy - linked to a range of poor outcomes in later life.
Lower than average Chlamydia testing and lower positive rate.
Lower levels of child poverty, but some pockets of deprivation.
Above average take up of free early education entitlement.
Lower than average rate of children in care.
Education Average percentage achieving
a good level of development at age 5, but there is a gap for those eligible for free school meals.
High proportion attend a good or outstanding school.
Highest figure achieving five or more GCSEs at grades A*-C.
Lowest proportion of persistent secondary absenteeism.
Significantly more pupils than average aspire to go to university.
Employment Below average number of adults with no qualifications.
Lower than average adult
unemployment and young people Not in Education Employment or Training.
Higher employment and fewer adults who are inactive.
Higher than average ratio of jobs per population.
Most businesses have 9 or fewer employees.
Transport Below average travel time by public transport or walking to reach key services in
Essex.
Highest percentage of residents in Essex who are satisfied with local bus service.
Access to a car is essential for people out of work and not able to use public transport or walk to an employment centre. 19% may miss out on work opportunities unless they have access to a car.
0 20,000 40,000
2015
2025
Over 65s

Page 3 of 25
Greater demand on health and social care due to an ageing population and schools and services supporting 5-15 year olds
Chelmsford is the third largest district in Essex in terms of total population numbers, accounting for 12% of the total county population. It has a relatively high proportion of over 65s and a 23% increase is expected between 2015 and 2025. This ageing population will put greater demand on health, social care services and housing needs. The working population is essential for economic growth, requiring adequate housing, access to jobs and businesses, but the Chelmsford proportion is forecast to decrease by three percentage points by 2025.
8,000 6,000 4,000 2,000 0 2,000 4,000 6,000 8,000
0-4
5-9
10-14
15-19
20-24
25-29
30-34
35-39
40-44
45-49
50-54
55-59
60-64
65-69
70-74
75-79
80-84
85-89
90+
Population Pyramid for Chelmsford, 2015-2025
Male, 2015 Male, 2025 Female, 2015 Female, 2025
This section links to the following Essex County Council Outcomes
Children get the best start
Good health & wellbeing
Learning
Safer
communities Economic
growth Sustainable environment
Independence
Between 2015 and 2025:
The total population will increase from 172,370 to 184,340 - an increase of 7% or 11,970 more people.
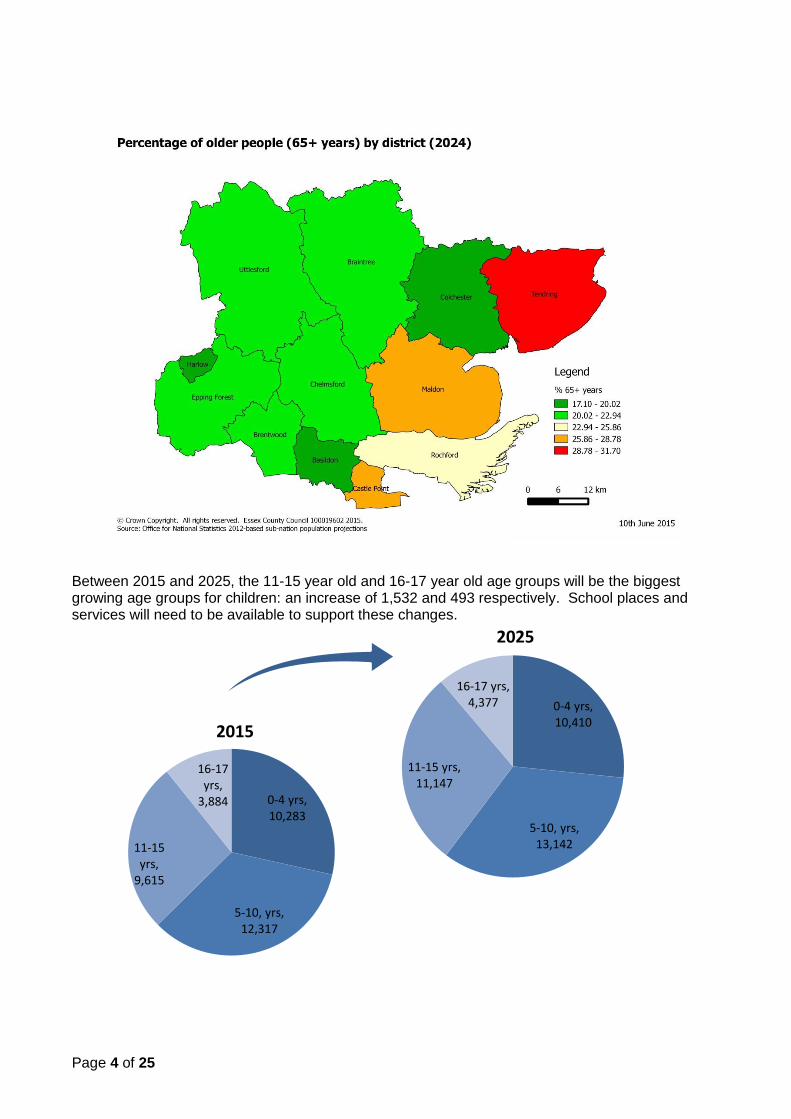
Over 65s will increase from 32,700 to 40,100: an increase of 23% (7,400) and will represent 22% of the total population in the district.
The working age proportion will fall slightly from 58% to 55%.
There will be 3,050 more under 19s.
22,140 new babies will be born over the period.
Source: ONS, 2012 sub-national populations
Page 4 of 25
Between 2015 and 2025, the 11-15 year old and 16-17 year old age groups will be the biggest growing age groups for children: an increase of 1,532 and 493 respectively. School places and services will need to be available to support these changes.
0-4 yrs, 10,410
5-10, yrs, 13,142
11-15 yrs, 11,147
16-17 yrs, 4,377
2025
0-4 yrs, 10,283
5-10, yrs, 12,317
11-15 yrs,
9,615
16-17 yrs,
3,884
2015
Page 5 of 25
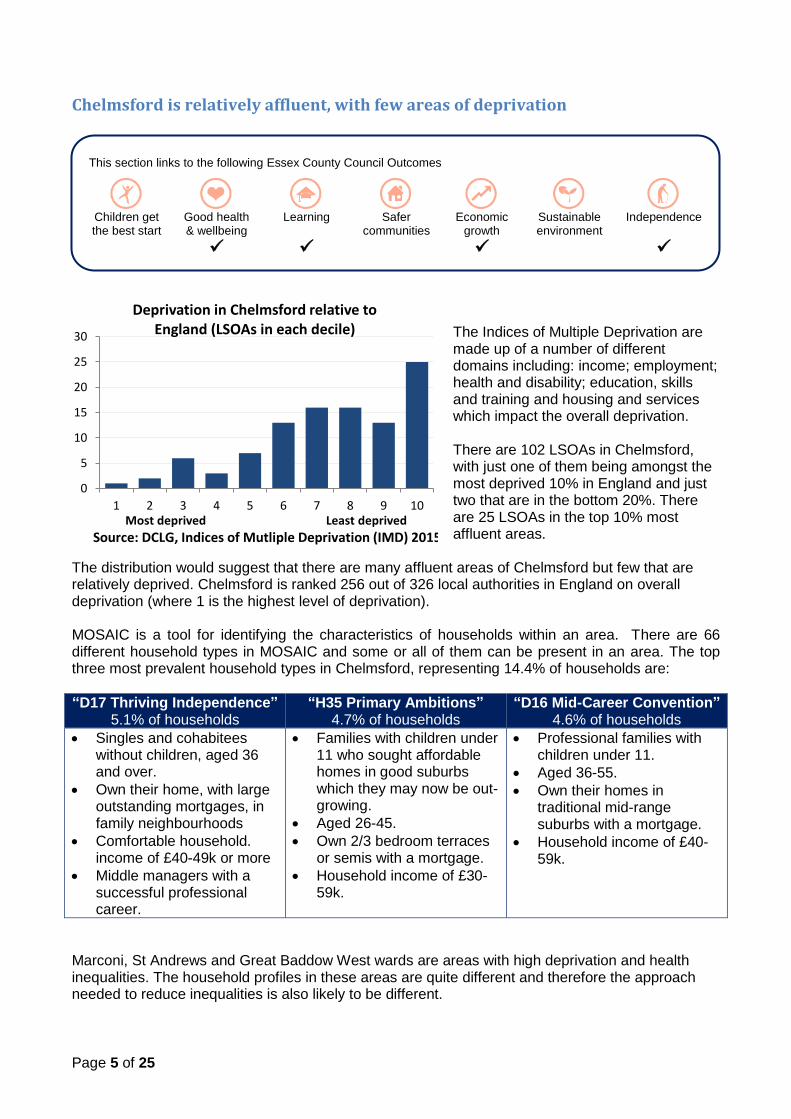
Chelmsford is relatively affluent, with few areas of deprivation
The Indices of Multiple Deprivation are made up of a number of different domains including: income; employment; health and disability; education, skills and training and housing and services which impact the overall deprivation. There are 102 LSOAs in Chelmsford, with just one of them being amongst the most deprived 10% in England and just two that are in the bottom 20%. There are 25 LSOAs in the top 10% most affluent areas.
The distribution would suggest that there are many affluent areas of Chelmsford but few that are relatively deprived. Chelmsford is ranked 256 out of 326 local authorities in England on overall deprivation (where 1 is the highest level of deprivation). MOSAIC is a tool for identifying the characteristics of households within an area. There are 66 different household types in MOSAIC and some or all of them can be present in an area. The top three most prevalent household types in Chelmsford, representing 14.4% of households are:
“D17 Thriving Independence” 5.1% of households
“H35 Primary Ambitions” 4.7% of households
“D16 Mid-Career Convention” 4.6% of households
Singles and cohabitees without children, aged 36 and over.
Own their home, with large outstanding mortgages, in family neighbourhoods
Comfortable household. income of £40-49k or more
Middle managers with a successful professional career.
Families with children under 11 who sought affordable homes in good suburbs which they may now be out-growing.
Aged 26-45.
Own 2/3 bedroom terraces or semis with a mortgage.
Household income of £30-59k.
Professional families with children under 11.
Aged 36-55.
Own their homes in traditional mid-range suburbs with a mortgage.
Household income of £40-59k.
Marconi, St Andrews and Great Baddow West wards are areas with high deprivation and health inequalities. The household profiles in these areas are quite different and therefore the approach needed to reduce inequalities is also likely to be different.
This section links to the following Essex County Council Outcomes
Children get the best start
Good health & wellbeing
Learning
Safer
communities Economic
growth Sustainable environment
Independence
0
5
10
15
20
25
30
1 2 3 4 5 6 7 8 9 10Most deprived Least deprived
Deprivation in Chelmsford relative to England (LSOAs in each decile)
Source: DCLG, Indices of Mutliple Deprivation (IMD) 2015
Page 6 of 25
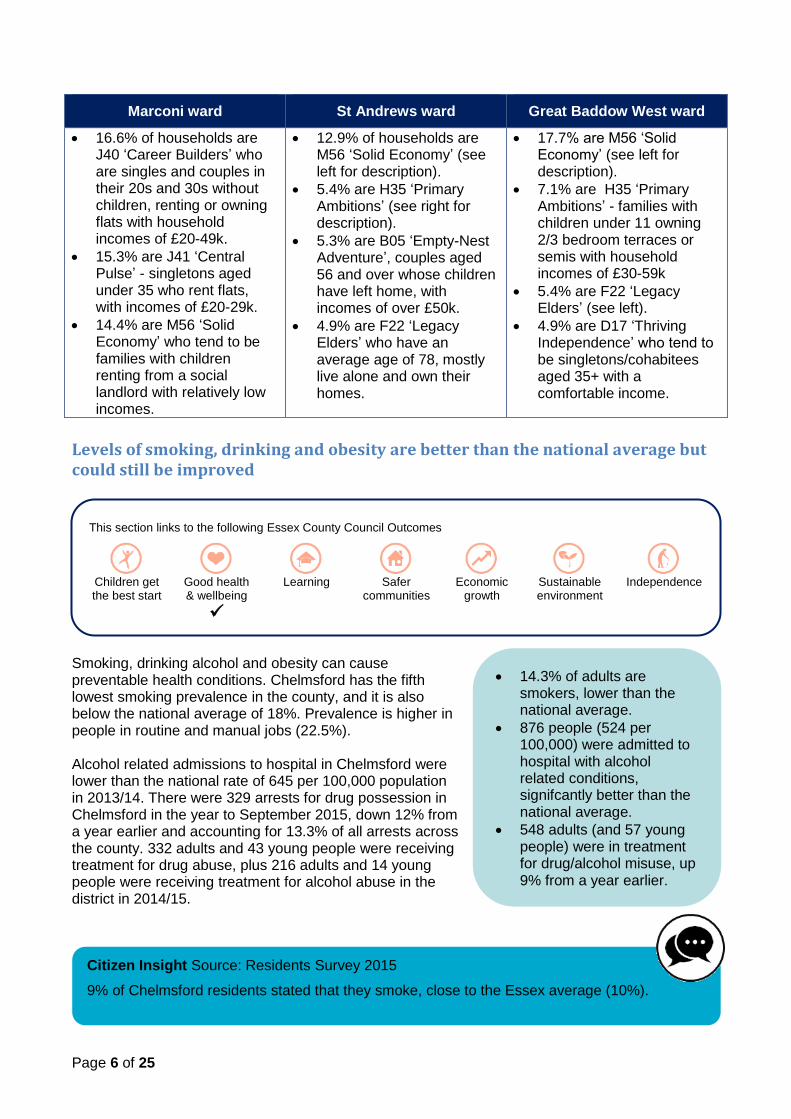
Marconi ward St Andrews ward Great Baddow West ward
16.6% of households are J40 ‘Career Builders’ who are singles and couples in their 20s and 30s without children, renting or owning flats with household incomes of £20-49k.
15.3% are J41 ‘Central Pulse’ - singletons aged under 35 who rent flats, with incomes of £20-29k.
14.4% are M56 ‘Solid Economy’ who tend to be families with children renting from a social landlord with relatively low incomes.
12.9% of households are M56 ‘Solid Economy’ (see left for description).
5.4% are H35 ‘Primary Ambitions’ (see right for description).
5.3% are B05 ‘Empty-Nest Adventure’, couples aged 56 and over whose children have left home, with incomes of over £50k.
4.9% are F22 ‘Legacy Elders’ who have an average age of 78, mostly live alone and own their homes.
17.7% are M56 ‘Solid Economy’ (see left for description).
7.1% are H35 ‘Primary Ambitions’ - families with children under 11 owning 2/3 bedroom terraces or semis with household incomes of £30-59k
5.4% are F22 ‘Legacy Elders’ (see left).
4.9% are D17 ‘Thriving Independence’ who tend to be singletons/cohabitees aged 35+ with a comfortable income.
Levels of smoking, drinking and obesity are better than the national average but could still be improved
Smoking, drinking alcohol and obesity can cause preventable health conditions. Chelmsford has the fifth lowest smoking prevalence in the county, and it is also below the national average of 18%. Prevalence is higher in people in routine and manual jobs (22.5%). Alcohol related admissions to hospital in Chelmsford were lower than the national rate of 645 per 100,000 population in 2013/14. There were 329 arrests for drug possession in Chelmsford in the year to September 2015, down 12% from a year earlier and accounting for 13.3% of all arrests across the county. 332 adults and 43 young people were receiving treatment for drug abuse, plus 216 adults and 14 young people were receiving treatment for alcohol abuse in the district in 2014/15.
This section links to the following Essex County Council Outcomes
Children get the best start
Good health & wellbeing
Learning
Safer
communities Economic
growth Sustainable environment
Independence
14.3% of adults are smokers, lower than the national average.
876 people (524 per 100,000) were admitted to hospital with alcohol related conditions, signifcantly better than the national average.
548 adults (and 57 young people) were in treatment for drug/alcohol misuse, up 9% from a year earlier.
Citizen Insight Source: Residents Survey 2015
9% of Chelmsford residents stated that they smoke, close to the Essex average (10%).

Page 7 of 25
Obesity in adults in Chelmsford is better than the national figures, and levels of physical activity are higher than average. The proportion of adults who are overweight or obese is the second lowest district figure in Essex and lower than the national average (64.6%). Chelmsford also performs better than the national average for 10-11 year old children (33.3% in 2014/15) and is below the county average of 30.7%. Compared to the county average Chelmsford has a higher level of physical activity in terms of organised sport participation (49.5% compared to 35.4% of adults) and higher participation as part of a club membership (37.9% against 22.9%). Residents should still do more to improve their levels of physical activity in order to benefit their health, to achieve a lower risk of cardiovascular disease, stroke and coronary heart disease and this may mean creating more opportunites for people to do so.
Increasing numbers of people with dementia, diabetes and admissions due to hip fractures will put demand on health services
Increasing numbers of people with dementia will have an impact on health services including training of staff, support for unpaid carers, and the available housing stock as more places in supported and sheltered housing and care homes will be needed.
This section links to the following Essex County Council Outcomes
Children get the best start
Good health & wellbeing
Learning
Safer
communities Economic
growth Sustainable environment
Independence
2,120 people aged over 65 are thought to have dementia and this number is expected to rise by 66% to 3,520 by 2030.
0
1,000
2,000
3,000
4,000
5,000
Nu
mb
er
of
pe
op
le
People aged 65+ estimated to have dementia
2014 2030
63.3% of adults and 28.5% of 10-11 year old children are overwieght or obese. This is lower than the national figure for adults and children.
18.9% of adults are doing enough physical activity to benefit their health (i.e. exercising three or more times per week), the fifth highest in the county and above the national average of 17.6%.
Citizen Insight Source: Residents Survey 2015
41% said that in the last week they did 30 minutes of moderate physical activity on five days or more, slightly above the county average (39%).
Chelmsford residents (44%) are most likely to cite lack of time as the main reason for not taking more exercise (similar to the Essex average). Other reasons given are lack of motivation or the expense.

Page 8 of 25
Chelmsford had the third lowest district figure for the rate of people who died prematurely from cardiovascular diseases (CVD), and the same for the rate of preventable deaths from CVD. These figures are both better than the national average. There has been a general improvement of these rates which is consistent with the national picture, and likely due to improvements in treatment and lifestyle. Prevention and treatment are important to improve things further.
The prevalence of hospital admissions due to hip fractures in the over 65s in 2014/15 was higher than the previous year. It was worse than the England average and the second worst district figure in the county. Hip fractures can cause a loss of independence and are likely to result in an increased need for social care and care home places. There was an increase in the number of recorded cases of diabetes in 2014/15, compared with the previous period, and the rate has been increasing over the last four years (as has the national figure). This may be due to higher levels of diabetes or improved detection by GPs. The rate is similar to the national average.
1,173 adults in Chelmsford were receiving social care support in 2014/15. 92% had personal budgets while 31% had Direct Payments, close to the proportions in the whole of Essex. 76% of adults who had accessed reablement services during the year had left as self-carers, i.e. being able to live independently, compared to 71% in the whole county. (Reablement is a short-term service to help people with their daily living activities in order to regain or increase their independence following an illness, injury, disability or when people need some support in re-building confidence).
56.4 per 100,000 people (243) died prematurely from cardiovascular disease (2012-2014), below the Essex rate of 62.4%. 35.3 per 100,000 (146) were preventable deaths from CVD.
Citizen Insight Source: Residents Survey 2015
75% of Chelmsford residents rate their general health as good, above the county average of 70%.
725 per 100,000 (232) residents aged 65+ were admitted to hospital with hip fractures in 2014/15.
Chelmsford is in the mid-range of districts for the rate of diabetes at 5.9% (8,846) of the GP registered population, and the rate has risen over the last four years.
1,173 adults in Chelmsford were receiving social care support in 2014/15.
92% of them had personal budgets, close to the county average.
Page 9 of 25
Pupils rate their overall wellbeing levels well and adult life satisfaction is high
National research highlights that good emotional and mental health is fundamental to the quality of life and productivity of individuals, families, communities and nations. It is associated with improved learning; increased participation in community life; reduced risk-taking behaviour and improved health outcomes. Poor child emotional well-being and mental health can have a lasting effect into adulthood. Research has shown that early intervention, preventative strategies and resilience building are effective to improve emotional wellbeing and mental health and are most effective when they take a holistic, family centred approach. People with a serious mental illness have mortality rates 2-3 times higher than the total population that is largely due to undiagnosed or untreated physical illness as there had been a focus on the mental illness. The proportion of people with a mental health problem in the Mid Essex CCG (0.68%) area is the lowest in Essex. This indicator shows the prevalence of schizophrenia, bipolar affective disorder and other psychoses. This figure is much lower than the 4.1% of those completing a GP survey who report they have a long term mental health problem, which may be due to an under recording of diagnosis or the increased likelihood of people with mental or physical health problems completing GP surveys. A large proportion of older people diagnosed with mental health problems are often related to dementia. During 2014/15 the Older Age Mental Health team conducted 15 assessments for people entering the service and 97 reviews on residents in Chelmsford. This represented 3% of all assessments and 5% of all reviews conducted in conducted in Essex: this is a disproportionately small number of assessments and reviews when compared to the district’s population.
This section links to the following Essex County Council Outcomes
Children get the best start
Good health & wellbeing
Learning
Safer
communities Economic
growth Sustainable environment
Independence
Citizen Insight
According to the 2015 School, Health and Education Unit (SHEU) survey:
Primary pupils in Chelmsford scored their overall wellbeing as 14.1 out of 20, close to the county average while secondary pupils scored their overall wellbeing as 12.9 out of 20, also close to the Essex figure.
19% of secondary school pupils in Chelmsford say they have sometimes felt afraid to go to school because of bullying, just below the Essex average of 20.5%.
80% of residents rated their life satisfaction at 7 or more out of 10, above the 72% in the whole of Essex and the highest in the county (Residents Survey 2015).
In the NHS Mid Essex CCG area, which covers Braintree, Chelmsford and Maldon:
0.68% have a mental health problem lower than the England figure (0.86%, QOF prevalence)
4.1% of people completing a GP survey report a long term mental health problem, lower than the England figure (5.1%)
Page 10 of 25
Below average rate of children in care, pockets of children in poverty and lower than average rate of teenage pregnancy
The wellbeing of children and young people can be affected by many factors. Children and young people in care are among the most socially excluded children in England and there tend to be significant health and social inequalities for these children compared with all children. At 24.0 per 10,000 population, the Chelmsford rate of children in care is below the county average of 33.3, although only a quarter of children originating from Chelmsford are placed there while over 40 of the children placed there originate from outside the area. The rate of children with a Child Protection Plan is 13.1 per 10,000 population, below the Essex average of 16.9, while its rate of children receiving other social care support at 148.4 is also lower than the county average of 152.5. During 2015, Chelmsford had 84 families commenced on a Family solutions episode, representing 8% of all episodes in Essex. Family Solutions is an early intervention project. The rate of hospital admissions caused by injury to children aged 0-14 (either unintentional or deliberate) was 95.1 per 10,000 in 2013/14, slightly above the Essex average of 92.3 and the fifth highest district in Essex
Inequalities that develop in childhood tend to also disadvantage people as they become adults, for example poor health and social exclusion of care leavers and poor health, and financial outcomes for children who experience poverty. Early support can help to mitigate these problems later in life. Free Early Education Entitlement (FEEE) is a priority nationally for early years and Chelmsford has the third lowest proportion of families who are eligible but the fourth highest take-up rate.
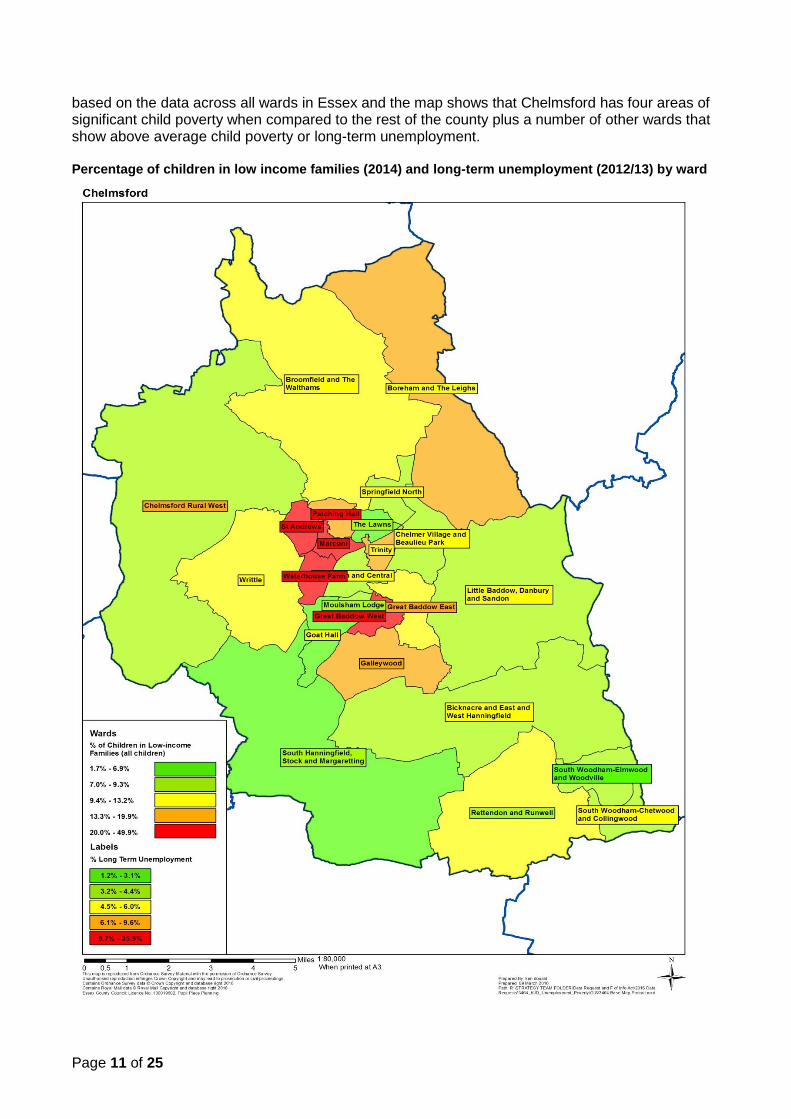
Low earnings and long-term worklessness are key factors impacting child poverty. Parental qualifications, family structure and size also have an impact on available income. Child poverty can lead to poor health outcomes including child-mortality and illness such as child mental health and low birth weight. Targeting initiatives at areas of high long-term unemployment may improve income and potentially reduce the risk of child poverty. The map below shows the percentage of children in low income families compared to long-term unemployment (those claiming Job Seekers Allowance for more than 12 months). The bandings are
This section links to the following Essex County Council Outcomes
Children get the best start
Good health & wellbeing
Learning
Safer
communities Economic
growth Sustainable environment
Independence
At the end of December 2015 there were 86 children in care originating from the Chelmsford district.
47 children with a Chelmsford postcode had a Child Protection Plan in place.
531 children received other social care support.
20.8% of two year olds were eligible for Free Early Education Entitlement and the take up rate was 74.2% in autumn term 2015.
During 2015, Chelmsford had 84 families commenced on a Family Solutions episode.
284 children were admitted to hospital due to injury in 2013/14, slightly higher than the Essex average.
Page 11 of 25
based on the data across all wards in Essex and the map shows that Chelmsford has four areas of significant child poverty when compared to the rest of the county plus a number of other wards that show above average child poverty or long-term unemployment. Percentage of children in low income families (2014) and long-term unemployment (2012/13) by ward
Page 12 of 25
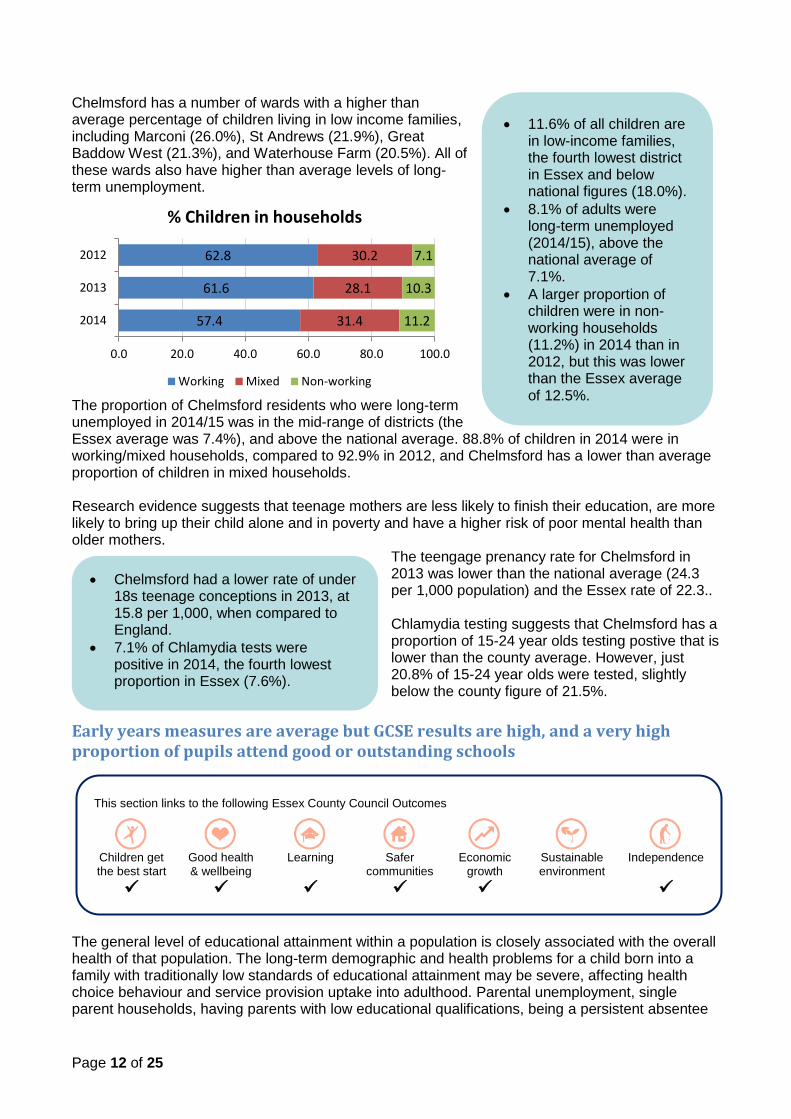
Chelmsford has a number of wards with a higher than average percentage of children living in low income families, including Marconi (26.0%), St Andrews (21.9%), Great Baddow West (21.3%), and Waterhouse Farm (20.5%). All of these wards also have higher than average levels of long-term unemployment.
The proportion of Chelmsford residents who were long-term unemployed in 2014/15 was in the mid-range of districts (the Essex average was 7.4%), and above the national average. 88.8% of children in 2014 were in working/mixed households, compared to 92.9% in 2012, and Chelmsford has a lower than average proportion of children in mixed households. Research evidence suggests that teenage mothers are less likely to finish their education, are more likely to bring up their child alone and in poverty and have a higher risk of poor mental health than older mothers.
The teengage prenancy rate for Chelmsford in 2013 was lower than the national average (24.3 per 1,000 population) and the Essex rate of 22.3.. Chlamydia testing suggests that Chelmsford has a proportion of 15-24 year olds testing postive that is lower than the county average. However, just 20.8% of 15-24 year olds were tested, slightly below the county figure of 21.5%.
Early years measures are average but GCSE results are high, and a very high proportion of pupils attend good or outstanding schools The general level of educational attainment within a population is closely associated with the overall health of that population. The long-term demographic and health problems for a child born into a family with traditionally low standards of educational attainment may be severe, affecting health choice behaviour and service provision uptake into adulthood. Parental unemployment, single parent households, having parents with low educational qualifications, being a persistent absentee
57.4
61.6
62.8
31.4
28.1
30.2
11.2
10.3
7.1
0.0 20.0 40.0 60.0 80.0 100.0
2014
2013
2012
% Children in households
Working Mixed Non-working
11.6% of all children are in low-income families, the fourth lowest district in Essex and below national figures (18.0%).
8.1% of adults were long-term unemployed (2014/15), above the national average of 7.1%.
A larger proportion of children were in non-working households (11.2%) in 2014 than in 2012, but this was lower than the Essex average of 12.5%.
Chelmsford had a lower rate of under 18s teenage conceptions in 2013, at 15.8 per 1,000, when compared to England.
7.1% of Chlamydia tests were positive in 2014, the fourth lowest proportion in Essex (7.6%).
This section links to the following Essex County Council Outcomes
Children get the best start
Good health & wellbeing
Learning
Safer
communities Economic
growth Sustainable environment
Independence
Page 13 of 25
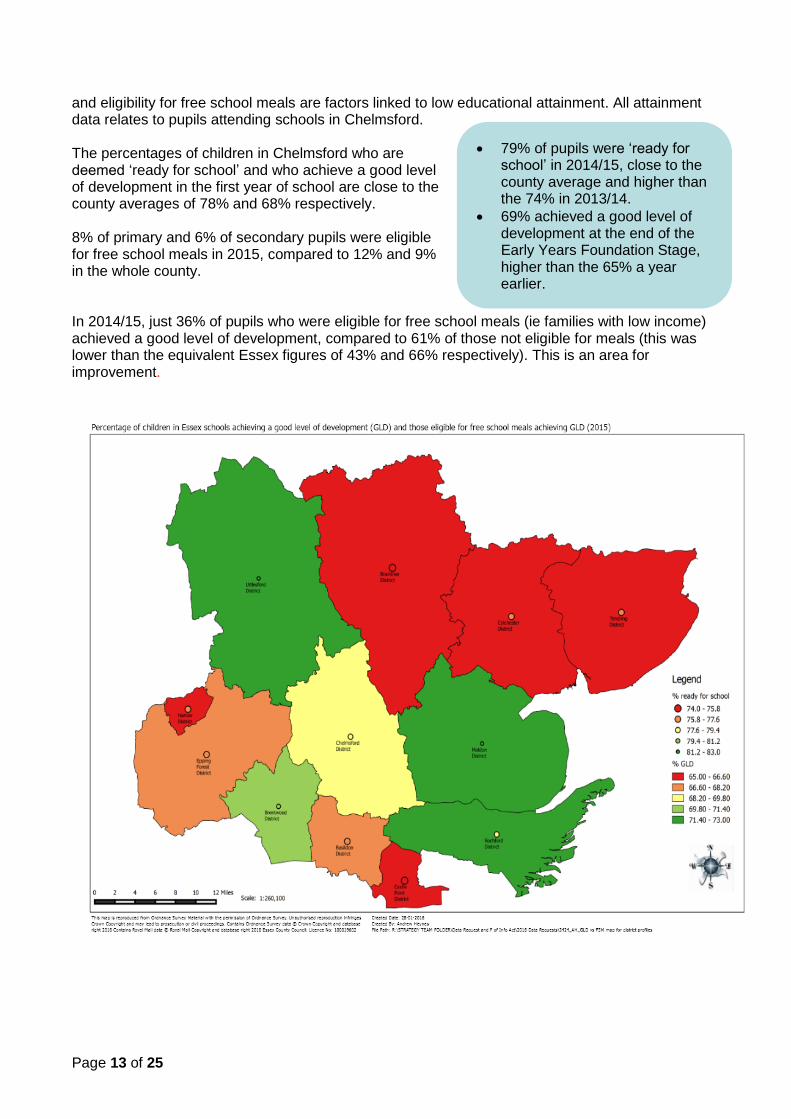
and eligibility for free school meals are factors linked to low educational attainment. All attainment data relates to pupils attending schools in Chelmsford. The percentages of children in Chelmsford who are deemed ‘ready for school’ and who achieve a good level of development in the first year of school are close to the county averages of 78% and 68% respectively. 8% of primary and 6% of secondary pupils were eligible for free school meals in 2015, compared to 12% and 9% in the whole county. In 2014/15, just 36% of pupils who were eligible for free school meals (ie families with low income) achieved a good level of development, compared to 61% of those not eligible for meals (this was lower than the equivalent Essex figures of 43% and 66% respectively). This is an area for improvement.
79% of pupils were ‘ready for school’ in 2014/15, close to the county average and higher than the 74% in 2013/14.
69% achieved a good level of development at the end of the Early Years Foundation Stage, higher than the 65% a year earlier.

Page 14 of 25
The percentage of pupils at Chelmsford secondary schools who achieved five or more GCSEs at grades A*-C including English & Maths in 2015 fell from 61.0% a year earlier. This appears to be in line with the national trend. The results are the highest in the county and are considerably above the Essex average of 57.6%. It should be noted that Chelmsford has two grammar schools whose results are included in this figure. 93.4% of all primary and secondary children studying in Chelmsford attend a good or outstanding school, higher than in 2014 and above the 84.3% in the whole of Essex.
Young people who attend school regularly are more likely to get the most they can out of their time at school, more likely to achieve their potential, and less likely to take part in anti-social or criminal behaviour. Reducing absenteeism and exclusion levels are therefore important. Chelmsford has a slightly lower absenteeism prevalence in state funded secondary schools than Essex (5.1%) and has the lowest percentage of persistent absentees in the county, below the Essex average of 4.8%.
Fewer adults with no qualifications, unemployment is lower and the proportion of economically inactive adults is lower than average Health and employment are intimately linked, and long term unemployment can have a negative effect on health and wellbeing. Unemployment leads to loss of income, which affects standards of living. The long-term effects can include depression and anxiety, a loss of identity and reduced perceptions of self-worth. In addition, work can play an important role in social networks and the
Citizen Insight Source: SHEU 2015
77% of primary and 67% of secondary pupils in Chelmsford say they enjoy school most or all of the time, above the Essex averages for primary(75%) and secondary (62%).
Aspirations in Chelmsford are high, with 60% of secondary pupils wanting to go to university compared to 54% overall in Essex.
4.9% of half days in state funded secondary schools were missed due to authorised or unauthorised absences in 2014/15.
4.3% of secondary pupils are deemed to be persistent absentees, the lowest district level.
67.3% of pupils attending secondary school in Chelmsford achieved five or more GCSEs at grades A*-C including English & Maths, the highest proportion in Essex.
93.4% of all pupils attend a good or outstanding school, the second highest in the county.
This section links to the following Essex County Council Outcomes
Children get the best start
Good health & wellbeing
Learning
Safer
communities Economic
growth Sustainable environment
Independence

Page 15 of 25
complex interactions between the individual and society, as work is an integral part of modern day social networking.
Young people with no qualifications are more likely to not be in education, employment or training post 16 and more at risk of not being in paid work and of receiving lower rates of pay. Fewer working age adults in Chelmsford have no qualifications when compared to the national and Essex averages. Chelmsford has a proportion of adults (53.6%) with qualifications at level NVQ 3 or above that is better than the county average of 49.5%. 2,150 adults were engaged in some form of further education in Chelmsford in 2014/15. There are slightly fewer adults over 16 who are unemployed in Chelmsford and a slightly lower percentage of young people aged 16-18 who are not in education, employment or training (NEET) than in the rest of Essex. 390 young people under 19 were in apprenticeships in 2014/15 (plus another 800 aged 19+), a 14% rise over the previous year.
Chelmsford has lower than average unemployment and had a percentage of adults aged 16-64 who were in employment in June 2015 that is above the county average of 76.2%. The district had a proportion who were economically inactive that is below the Essex figure of 19.7%. The latter group includes, for example, all those who are looking after a home, retired or studying.
0
5
10
2010 2011 2012 2013 2014 2015
Pe
rce
nta
ge
Unemployment Rate (16+)
UK Essex Chelmsford
60
70
80
90
2010 2011 2012 2013 2014 2015
Pe
rce
nta
ge
Employment Rate (16+)
UK Essex Chelmsford
78.1% of adults were employed in June 2015, the second highest district figure in Essex.
18.5% were economically inactive, below the county average.
6.9% of 16-64 year olds have no qualifications (2014), below the Essex and England averages (8.7% and 8.6%).
5.0% of young people were not in education, employment or training from Nov 2014 - Jan 2015, just below the Essex average of 5.7%.
4.1% of 16-64 year olds were unemployed in June 2015, below the Essex average of 4.9%.
1,190 people were in apprenticeships in 2014/15.
Citizen Insight Source: Residents Survey 2015
32% of Chelmsford residents consider themselves to be a participant in lifelong learning, just below the county average of 34%. The main barriers preventing them from participating in lifelong learning are lack of time and lack of interest.
Page 16 of 25
Higher than average job density, mostly small businesses and lower than average earnings
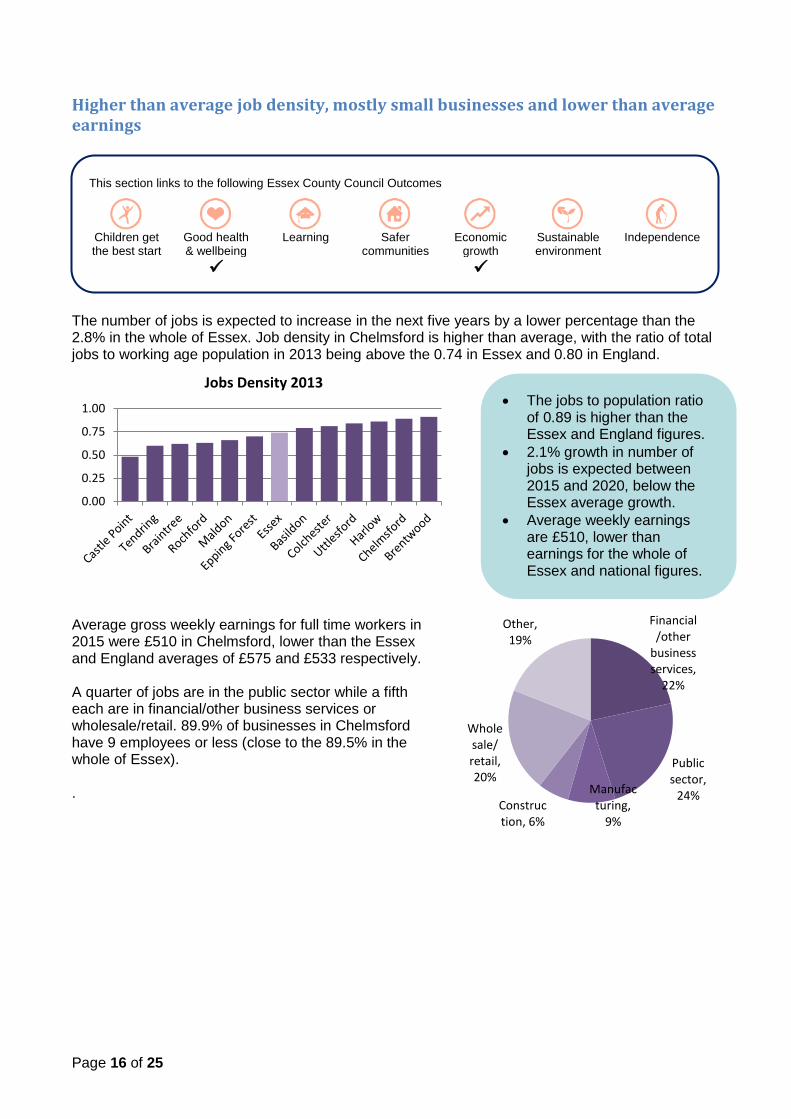
The number of jobs is expected to increase in the next five years by a lower percentage than the 2.8% in the whole of Essex. Job density in Chelmsford is higher than average, with the ratio of total jobs to working age population in 2013 being above the 0.74 in Essex and 0.80 in England.
Average gross weekly earnings for full time workers in 2015 were £510 in Chelmsford, lower than the Essex and England averages of £575 and £533 respectively. A quarter of jobs are in the public sector while a fifth each are in financial/other business services or wholesale/retail. 89.9% of businesses in Chelmsford have 9 employees or less (close to the 89.5% in the whole of Essex). .
0.00
0.25
0.50
0.75
1.00
Jobs Density 2013
This section links to the following Essex County Council Outcomes
Children get the best start
Good health & wellbeing
Learning
Safer
communities Economic
growth Sustainable environment
Independence
The jobs to population ratio of 0.89 is higher than the Essex and England figures.
2.1% growth in number of jobs is expected between 2015 and 2020, below the Essex average growth.
Average weekly earnings are £510, lower than earnings for the whole of Essex and national figures.
Financial/other
business services,
22%
Public sector,
24% Manufacturing,
9% Construction, 6%
Whole sale/ retail, 20%
Other, 19%
Page 17 of 25
Residents of Chelmsford feel safe and the rate of crime is close to the county average
The majority of Chelmsford residents feel safe during the day and many also feel safe after dark.
Motor vehicle traffic accidents are a major cause of preventable deaths, particularly in younger age groups. For children and for men aged 20-64 years, mortality rates for motor vehicle traffic accidents are higher in lower socio-economic groups. The vast majority of road traffic collisions are preventable and can be avoided through improved education, awareness, road infrastructure and vehicle safety. Chelmsford had a rate of people killed and seriously injured on the roads in 2012-2014 that was below both the Essex figure of 42.2 and the England rate of 39.3. There are many risk factors that increase the likelihood of offending and other poor outcomes. These risk factors include: a person’s attitude to crime, risk taking behaviour, substance misuse, mental and physical health, access to employment and training, financial issues and family relationships. These poor outcomes may not only impact the individual but their children and have long-lasting effect. The pathways into offending are very complex and there may be no link, an indirect link or direct link from risk factor to offending and some risk factors may make certain types of offending more likely. Evidence suggests that supporting people with the right support at the right time and ensuring that there are not any gaps or inconsistencies between agencies may be most effective way in reducing crime.
This section links to the following Essex County Council Outcomes
Children get the best start
Good health & wellbeing
Learning
Safer
communities Economic
growth Sustainable environment
Independence
Citizen Insight Source: Residents Survey 2015
90% of adults in Chelmsford say they feel safe during the day, the third highest district figure and above the Essex average of 85%.
60% say they feel safe after dark, considerably higher than the county average of 49%.
49% of adults are satisfied with safety on the roads, above the county average of 42%.
The rate of those
killed/seriously injured on the roads (37.0 per 100,000 population) is slightly above the national average.
Page 18 of 25
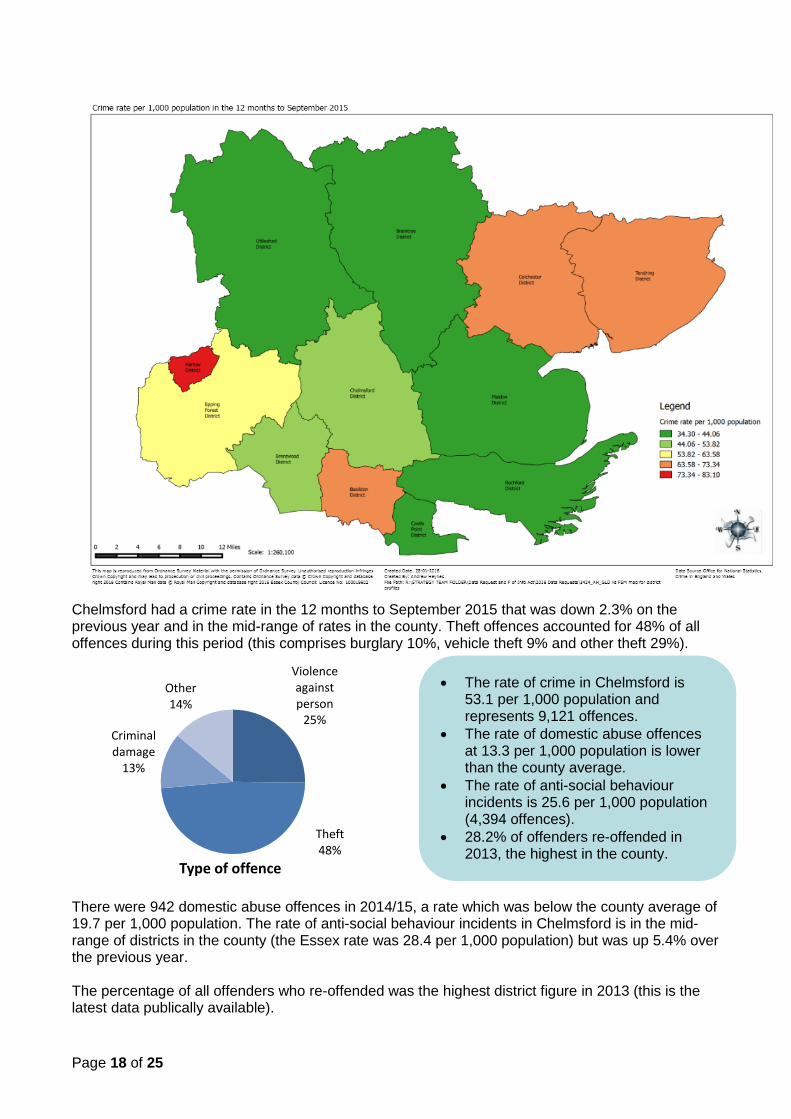
Chelmsford had a crime rate in the 12 months to September 2015 that was down 2.3% on the previous year and in the mid-range of rates in the county. Theft offences accounted for 48% of all offences during this period (this comprises burglary 10%, vehicle theft 9% and other theft 29%).
There were 942 domestic abuse offences in 2014/15, a rate which was below the county average of 19.7 per 1,000 population. The rate of anti-social behaviour incidents in Chelmsford is in the mid-range of districts in the county (the Essex rate was 28.4 per 1,000 population) but was up 5.4% over the previous year. The percentage of all offenders who re-offended was the highest district figure in 2013 (this is the latest data publically available).
Violence against person
25%
Theft 48%
Criminal damage
13%
Other 14%
Type of offence
The rate of crime in Chelmsford is 53.1 per 1,000 population and represents 9,121 offences.
The rate of domestic abuse offences at 13.3 per 1,000 population is lower than the county average.
The rate of anti-social behaviour incidents is 25.6 per 1,000 population (4,394 offences).
28.2% of offenders re-offended in 2013, the highest in the county.
Page 19 of 25
One area shows significantly worse health across a number of indicators, compared to England
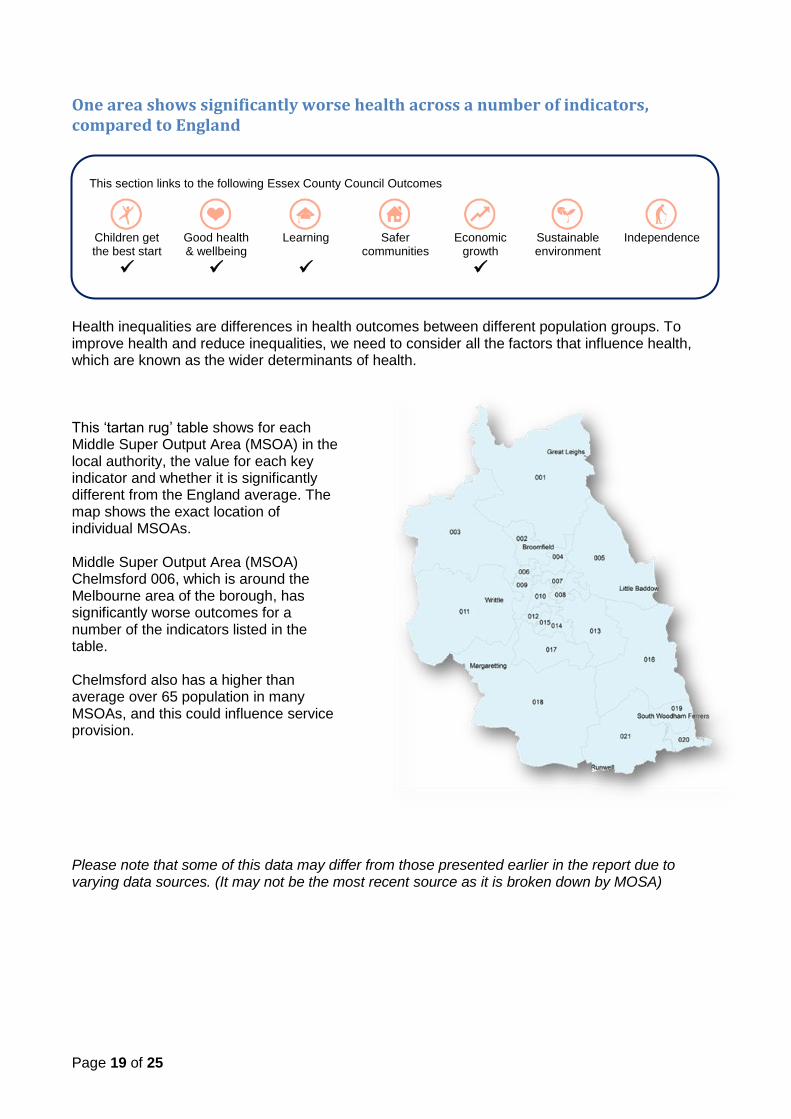
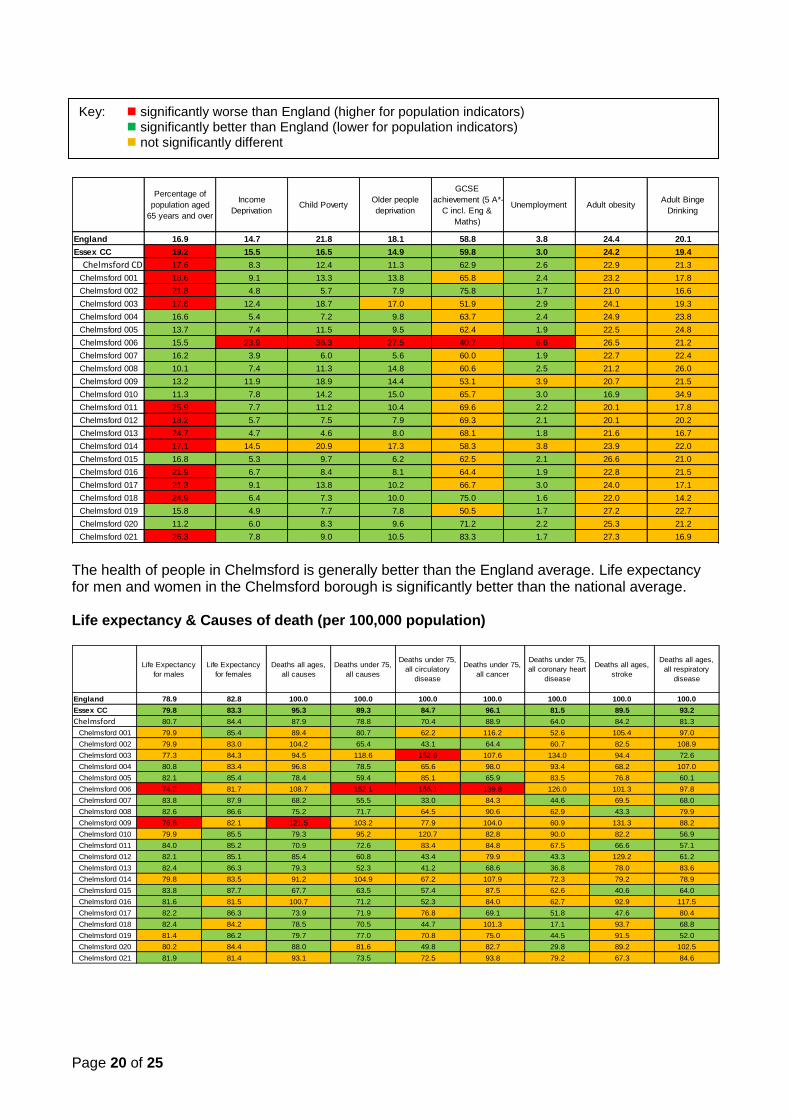
Health inequalities are differences in health outcomes between different population groups. To improve health and reduce inequalities, we need to consider all the factors that influence health, which are known as the wider determinants of health. This ‘tartan rug’ table shows for each Middle Super Output Area (MSOA) in the local authority, the value for each key indicator and whether it is significantly different from the England average. The map shows the exact location of individual MSOAs. Middle Super Output Area (MSOA) Chelmsford 006, which is around the Melbourne area of the borough, has significantly worse outcomes for a number of the indicators listed in the table. Chelmsford also has a higher than average over 65 population in many MSOAs, and this could influence service provision. Please note that some of this data may differ from those presented earlier in the report due to varying data sources. (It may not be the most recent source as it is broken down by MOSA)
This section links to the following Essex County Council Outcomes
Children get the best start
Good health & wellbeing
Learning
Safer
communities Economic
growth Sustainable environment
Independence
Contains Ordnance Survey data © Crown copyright and database right 2010 ONS, Super Output Area Boundaries. Crown copyright 2004. Crown
copyright material is reproduced with the permission of the Controller of HMSO. C2008001229.
Page 20 of 25
The health of people in Chelmsford is generally better than the England average. Life expectancy for men and women in the Chelmsford borough is significantly better than the national average. Life expectancy & Causes of death (per 100,000 population)
Percentage of
population aged
65 years and over
Income
DeprivationChild Poverty
Older people
deprivation
GCSE
achievement (5 A*-
C incl. Eng &
Maths)
Unemployment Adult obesityAdult Binge
Drinking
England 16.9 14.7 21.8 18.1 58.8 3.8 24.4 20.1
Essex CC 19.2 15.5 16.5 14.9 59.8 3.0 24.2 19.4
Chelmsford CD 17.6 8.3 12.4 11.3 62.9 2.6 22.9 21.3
Chelmsford 001 18.6 9.1 13.3 13.8 65.8 2.4 23.2 17.8
Chelmsford 002 21.8 4.8 5.7 7.9 75.8 1.7 21.0 16.6
Chelmsford 003 17.8 12.4 18.7 17.0 51.9 2.9 24.1 19.3
Chelmsford 004 16.6 5.4 7.2 9.8 63.7 2.4 24.9 23.8
Chelmsford 005 13.7 7.4 11.5 9.5 62.4 1.9 22.5 24.8
Chelmsford 006 15.5 23.9 36.3 27.5 40.7 6.6 26.5 21.2
Chelmsford 007 16.2 3.9 6.0 5.6 60.0 1.9 22.7 22.4
Chelmsford 008 10.1 7.4 11.3 14.8 60.6 2.5 21.2 26.0
Chelmsford 009 13.2 11.9 18.9 14.4 53.1 3.9 20.7 21.5
Chelmsford 010 11.3 7.8 14.2 15.0 65.7 3.0 16.9 34.9
Chelmsford 011 25.9 7.7 11.2 10.4 69.6 2.2 20.1 17.8
Chelmsford 012 18.2 5.7 7.5 7.9 69.3 2.1 20.1 20.2
Chelmsford 013 24.7 4.7 4.6 8.0 68.1 1.8 21.6 16.7
Chelmsford 014 17.1 14.5 20.9 17.3 58.3 3.8 23.9 22.0
Chelmsford 015 16.8 5.3 9.7 6.2 62.5 2.1 26.6 21.0
Chelmsford 016 21.9 6.7 8.4 8.1 64.4 1.9 22.8 21.5
Chelmsford 017 21.3 9.1 13.8 10.2 66.7 3.0 24.0 17.1
Chelmsford 018 24.9 6.4 7.3 10.0 75.0 1.6 22.0 14.2
Chelmsford 019 15.8 4.9 7.7 7.8 50.5 1.7 27.2 22.7
Chelmsford 020 11.2 6.0 8.3 9.6 71.2 2.2 25.3 21.2
Chelmsford 021 26.3 7.8 9.0 10.5 83.3 1.7 27.3 16.9
Life Expectancy
for males
Life Expectancy
for females
Deaths all ages,
all causes
Deaths under 75,
all causes
Deaths under 75,
all circulatory
disease
Deaths under 75,
all cancer
Deaths under 75,
all coronary heart
disease
Deaths all ages,
stroke
Deaths all ages,
all respiratory
disease
England 78.9 82.8 100.0 100.0 100.0 100.0 100.0 100.0 100.0
Essex CC 79.8 83.3 95.3 89.3 84.7 96.1 81.5 89.5 93.2
Chelmsford 80.7 84.4 87.9 78.8 70.4 88.9 64.0 84.2 81.3
Chelmsford 001 79.9 85.4 89.4 80.7 62.2 116.2 52.6 105.4 97.0
Chelmsford 002 79.9 83.0 104.2 65.4 43.1 64.4 60.7 82.5 108.9
Chelmsford 003 77.3 84.3 94.5 118.6 152.6 107.6 134.0 94.4 72.6
Chelmsford 004 80.8 83.4 96.8 78.5 65.6 98.0 93.4 68.2 107.0
Chelmsford 005 82.1 85.4 78.4 59.4 85.1 65.9 83.5 76.8 60.1
Chelmsford 006 74.2 81.7 108.7 152.1 166.1 139.8 126.0 101.3 97.8
Chelmsford 007 83.8 87.9 68.2 55.5 33.0 84.3 44.6 69.5 68.0
Chelmsford 008 82.6 86.6 75.2 71.7 64.5 90.6 62.9 43.3 79.9
Chelmsford 009 76.6 82.1 121.5 103.2 77.9 104.0 60.9 131.3 88.2
Chelmsford 010 79.9 85.5 79.3 95.2 120.7 82.8 90.0 82.2 56.9
Chelmsford 011 84.0 85.2 70.9 72.6 83.4 84.8 67.5 66.6 57.1
Chelmsford 012 82.1 85.1 85.4 60.8 43.4 79.9 43.3 129.2 61.2
Chelmsford 013 82.4 86.3 79.3 52.3 41.2 68.6 36.8 78.0 83.6
Chelmsford 014 79.8 83.5 91.2 104.9 67.2 107.9 72.3 79.2 78.9
Chelmsford 015 83.8 87.7 67.7 63.5 57.4 87.5 62.6 40.6 64.0
Chelmsford 016 81.6 81.5 100.7 71.2 52.3 84.0 62.7 92.9 117.5
Chelmsford 017 82.2 86.3 73.9 71.9 76.8 69.1 51.8 47.6 80.4
Chelmsford 018 82.4 84.2 78.5 70.5 44.7 101.3 17.1 93.7 68.8
Chelmsford 019 81.4 86.2 79.7 77.0 70.8 75.0 44.5 91.5 52.0
Chelmsford 020 80.2 84.4 88.0 81.6 49.8 82.7 29.8 89.2 102.5
Chelmsford 021 81.9 81.4 93.1 73.5 72.5 93.8 79.2 67.3 84.6
Key: significantly worse than England (higher for population indicators)
significantly better than England (lower for population indicators) not significantly different
Page 21 of 25
Satisfaction with bus services and local road conditions are the highest in Essex, but recycling levels are lower than average
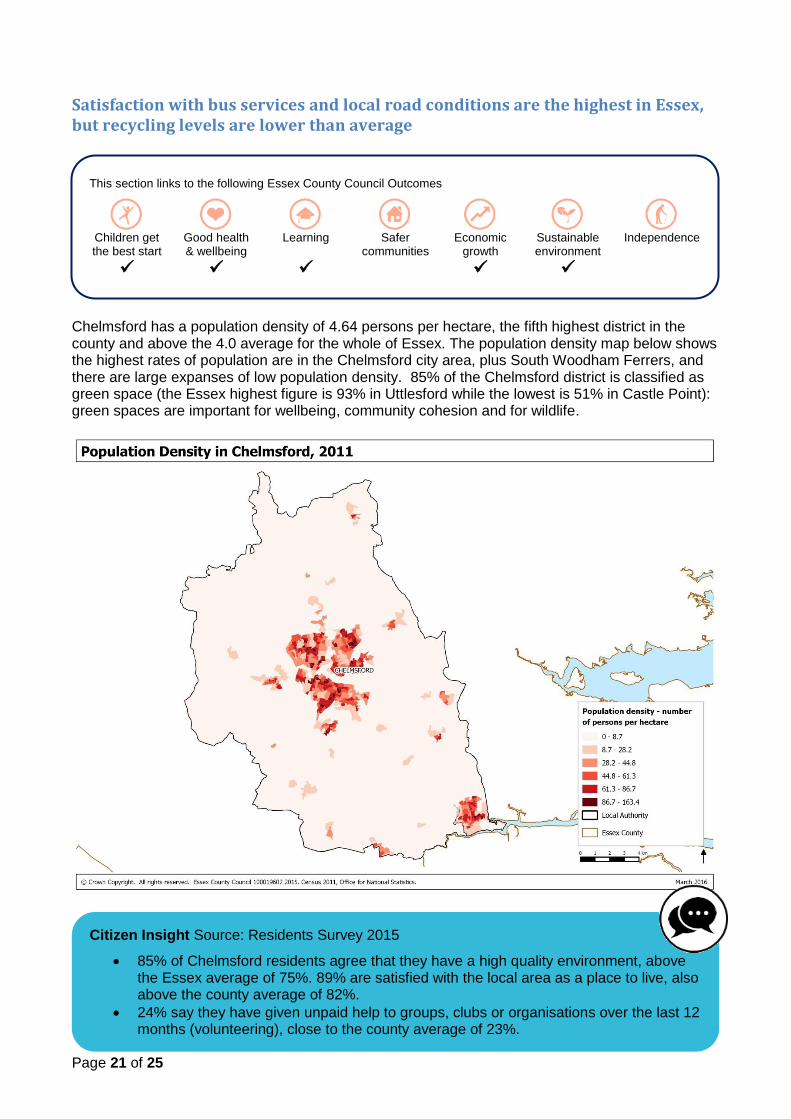
Chelmsford has a population density of 4.64 persons per hectare, the fifth highest district in the county and above the 4.0 average for the whole of Essex. The population density map below shows the highest rates of population are in the Chelmsford city area, plus South Woodham Ferrers, and there are large expanses of low population density. 85% of the Chelmsford district is classified as green space (the Essex highest figure is 93% in Uttlesford while the lowest is 51% in Castle Point): green spaces are important for wellbeing, community cohesion and for wildlife.
This section links to the following Essex County Council Outcomes
Children get the best start
Good health & wellbeing
Learning
Safer
communities Economic
growth Sustainable environment
Independence
Citizen Insight Source: Residents Survey 2015
85% of Chelmsford residents agree that they have a high quality environment, above the Essex average of 75%. 89% are satisfied with the local area as a place to live, also above the county average of 82%.
24% say they have given unpaid help to groups, clubs or organisations over the last 12 months (volunteering), close to the county average of 23%.
Page 22 of 25
Transport impacts on the health of a population via a number of factors including unintentional injuries, physical activity undertaken, air pollution and access to services. The last of these involves people traveling for basic necessities such as work, education, healthcare and purchasing food. Good transport links have an important role in enabling access to business and jobs which are important to allow for economic growth. Some 19% of people seeking jobs in Chelmsford (ie on job seekers allowance) may miss out on employment opportunities unless they have access to a car. The affordability and accessibility of driving a car has increased over the past 30 years and this has heavily influenced planning decisions to be car focussed. However, there is still a significant proportion of the population without car access who are reliant on public transport, cycling and walking. The 11 minute average travel time by public transport or walking to reach key services is just below to the Essex average of 13
Improvements in the travel time to key services (i.e. employment centres, primary schools, minutes. secondary schools, further education, GPs, hospitals and food stores) by public transport/walking is a national trend. In 2015, 2% of the main road network was in a condition where structural maintenance should be considered (similar to the countywide figure). However, 13% of the local road network was in this condition, the fifth highest district proportion in Essex and the same as the county average.
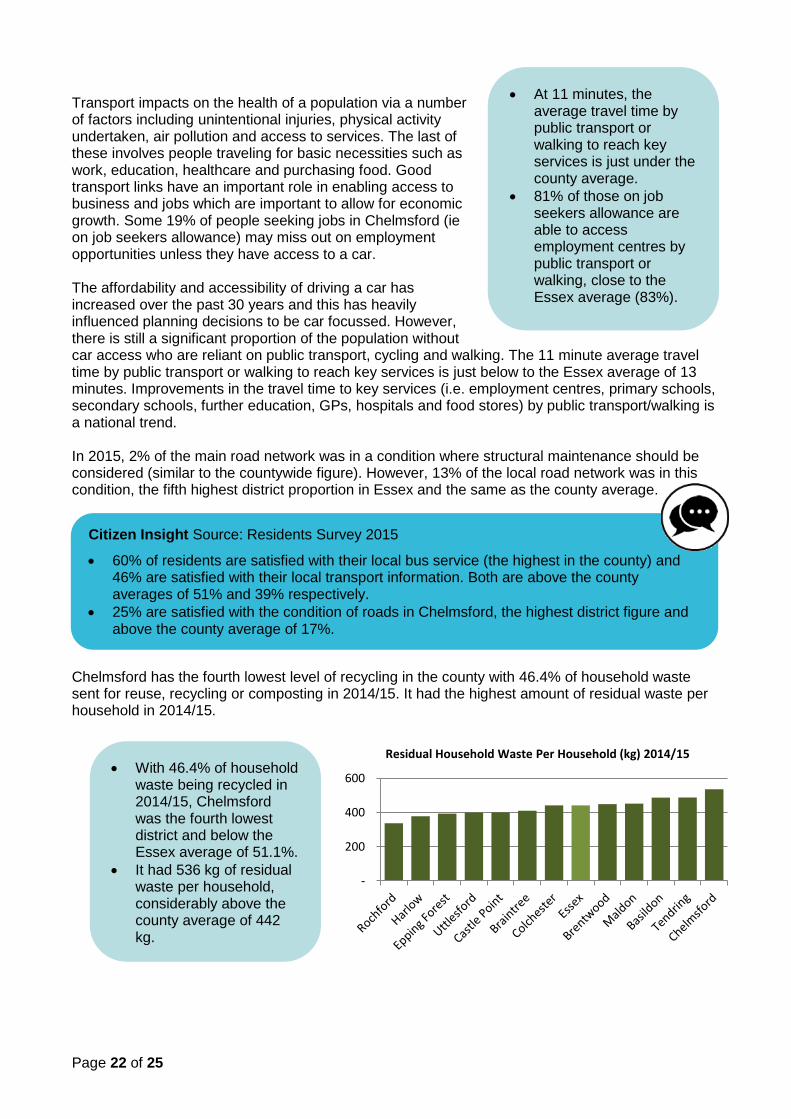
Chelmsford has the fourth lowest level of recycling in the county with 46.4% of household waste sent for reuse, recycling or composting in 2014/15. It had the highest amount of residual waste per household in 2014/15.
-
200
400
600
Residual Household Waste Per Household (kg) 2014/15
Citizen Insight Source: Residents Survey 2015
60% of residents are satisfied with their local bus service (the highest in the county) and 46% are satisfied with their local transport information. Both are above the county averages of 51% and 39% respectively.
25% are satisfied with the condition of roads in Chelmsford, the highest district figure and above the county average of 17%.
At 11 minutes, the average travel time by public transport or walking to reach key services is just under the county average.
81% of those on job seekers allowance are able to access employment centres by public transport or walking, close to the Essex average (83%).
With 46.4% of household waste being recycled in 2014/15, Chelmsford was the fourth lowest district and below the Essex average of 51.1%.
It had 536 kg of residual waste per household, considerably above the county average of 442 kg.

Page 23 of 25
Lower than average housing development, second highest homelessness rate and highest number on housing waiting list
The relationship between housing and health is a recognised association but a complex one. A number of elements in and around the home can impact on health and wellbeing and will be influenced by other determinants such as education, employment and infrastructure. Specific housing related issues affecting health are indoor pollutants, cold and damp, housing design, overcrowding, accessibility, neighbourhood safety, social cohesion and housing availability. Additionally as people get older and demand for people to stay within their own homes for longer increases the demand for specific housing needs will also increase. Economic growth and housing are inextricably linked. Without a sustainable housing programme providing homes for people to live in and without a growing local economy, an area will be unable to provide the jobs and homes to attract new people and retain current residents and drive the economy forward.
The increase in dwellings in Chelmsford since 2011 is one of the smallest rises in Essex. House prices across Essex have been increasing year on year outstripping wages, making home ownership less and less affordable for a large proportion of the Essex community. However, the rise in Chelmsford has been less than in the rest of Essex. High energy prices coupled with low income mean 7.4% of people in Chelmsford are considered to be fuel poor. (A household is said to be fuel poor if it needs to spend more than 10% of its income on fuel to maintain an adequate standard of warmth.) From 2013-2014 there were 38 excess winter deaths in Chelmsford. This is around 9.0% additional deaths, lower than the national average (11.6%).
This section links to the following Essex County Council Outcomes
Children get the best start
Good health & wellbeing
Learning
Safer
communities Economic
growth Sustainable environment
Independence
The number of dwellings in Chelmsford rose by 1.3% to 72,180 between 2011 and 2014, lower than the rise in Essex and England (both 1.7%).
House prices in Chelmsford have increased by12.0% since 2011, the fifth lowest district rise.
7.4% of Chelmsford households were deemed fuel poor in 2013, the fourth lowest in Essex.
Page 24 of 25
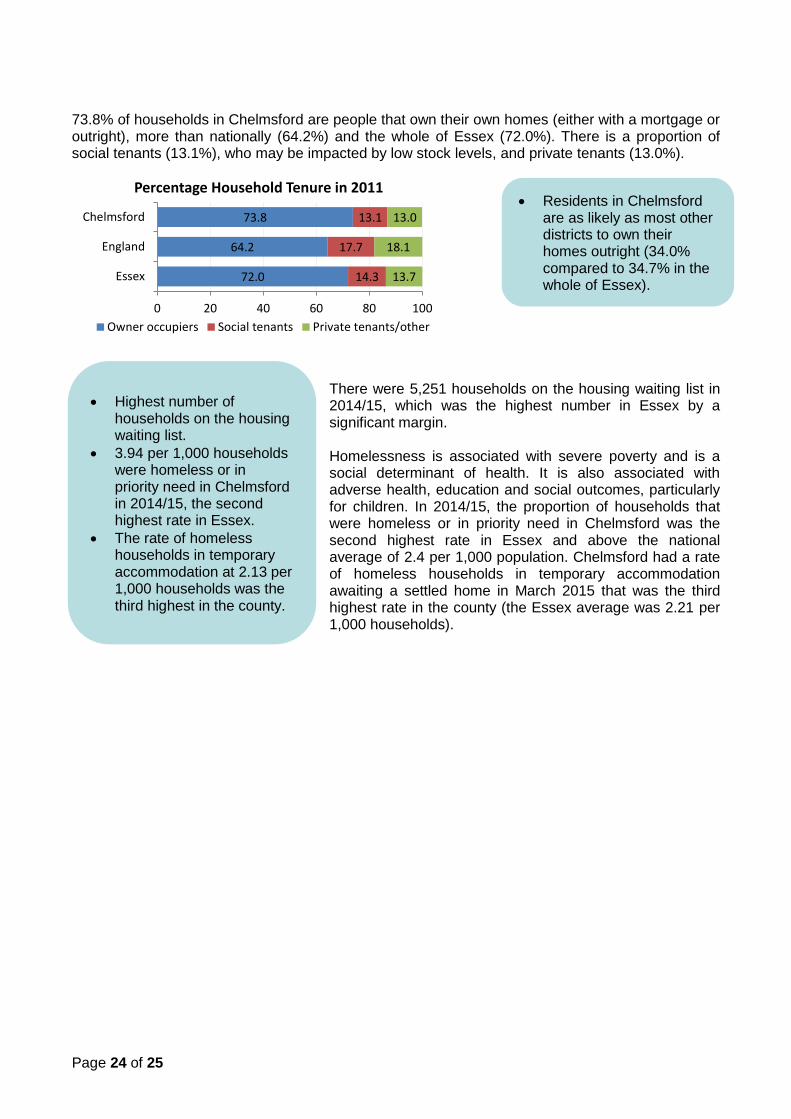
73.8% of households in Chelmsford are people that own their own homes (either with a mortgage or outright), more than nationally (64.2%) and the whole of Essex (72.0%). There is a proportion of social tenants (13.1%), who may be impacted by low stock levels, and private tenants (13.0%).
There were 5,251 households on the housing waiting list in 2014/15, which was the highest number in Essex by a significant margin. Homelessness is associated with severe poverty and is a social determinant of health. It is also associated with adverse health, education and social outcomes, particularly for children. In 2014/15, the proportion of households that were homeless or in priority need in Chelmsford was the second highest rate in Essex and above the national average of 2.4 per 1,000 population. Chelmsford had a rate of homeless households in temporary accommodation awaiting a settled home in March 2015 that was the third highest rate in the county (the Essex average was 2.21 per 1,000 households).
Residents in Chelmsford are as likely as most other districts to own their homes outright (34.0% compared to 34.7% in the whole of Essex).
72.0
64.2
73.8
14.3
17.7
13.1
13.7
18.1
13.0
Essex
England
Chelmsford
0 20 40 60 80 100
Percentage Household Tenure in 2011
Owner occupiers Social tenants Private tenants/other
Highest number of households on the housing waiting list.
3.94 per 1,000 households were homeless or in priority need in Chelmsford in 2014/15, the second highest rate in Essex.
The rate of homeless households in temporary accommodation at 2.13 per 1,000 households was the third highest in the county.
Page 25 of 25
Essex Insight is the Partnership information hub for Essex and a website about Essex and the people working and living in Essex. The website can be used to find data, also join in surveys and use table, charting and mapping tools to support reporting. It is home to a suite of products that supports the Joint Strategic Needs Assessment (JSNA). There are links in this report to the JSNA specialist topic reports found on Essex Insight e.g. Child Poverty and CAMHS Needs Assessments.
Bookmark it now as your one stop shop for data on Essex
www.essexinsight.org.uk