Embed Size (px)
Citation preview
Minority Health in Ohio, 2019 OMAS
A Prof i le of Minor i ty Heal th
in Ohio: 2019 Update
May 2021
1
Minority Health in Ohio, 2019 OMASMinority Health in Ohio, 2019 OMAS
AUTHORS
Townsand Price-Spratlen1, Kenneth J. Steinman2, Michael
Nau3, Timothy Sahr3, Danaye Nixon3, 4, Tom Albani3
2grc.osu.edu/OMAS
1The Ohio State University, Department
of Sociology 2The Ohio State University, College of
Education and Human Ecology3The Ohio Colleges of Medicine
Government Resource Center4The Ohio State University, Department
of Statistics
Minority Health in Ohio, 2019 OMASMinority Health in Ohio, 2019 OMAS
EXECUTIVE SUMMARY
This chartbook uses data from the 2019 Ohio Medicaid
Assessment Survey (OMAS), the 2019 Ohio Medicaid
Released Enrollees Study (OMRES), and the 2018
Behavioral Risk Factor Surveillance System (BFRSS) to
analyze the health and well-being of Ohioans based on
their racial or ethnic identity. The sample size of the 2019
OMAS allowed racial and ethnic breakdowns between
those who identified as White, Black or African American,
and Hispanic. The sample size was too small to analyze
other races or ethnic groups.
Key Findings
Chronic Health Disparities. Racial and ethnic health
disparities in Ohio were persistent and pervasive. In general,
be it diabetes, high blood pressure, obesity, or asthma, Black
or African Americans and Hispanics experienced chronic
health conditions more frequently than whites. For example,
Black or African Americans’ rate of death from diabetes was
75% higher than that of whites.
Subpopulation Chronic Concerns. Some disparities were
especially apparent among certain subgroups within the state.
For example, obesity disproportionately affected Black or
African American and Hispanic women and young adults.
Middle-aged Black or African Americans (45-64) had much
higher heart-related challenges compared to similarly aged
whites and Hispanics.
Access to Care. Racial and ethnic health disparities in access
to care were persistent and substantial. Among all Ohio adults,
Black or African Americans and Hispanics were more likely
than whites to have unmet health care needs and to have
frequent ER visits. Among lower-income uninsured adults,
Hispanics’ usual source of care was markedly lower,
compared to both whites and Black or African Americans.
Substance Use Disparities. Substance use disorder is a
profound challenge in Ohio, and there were marked
differences between racial and ethnic subgroups. Smoking
tobacco and marijuana use were highest among Black or
African Americans, particularly among Black or African
American men. Binge drinking of alcohol was highest among
Hispanic men. Regarding more immediate mortality risk, opioid
deaths were highest among whites, regardless of gender
(Ohio Department of Health Vital Statistics (2018 - 2019).
grc.osu.edu/OMAS 3
Minority Health in Ohio, 2019 OMASMinority Health in Ohio, 2019 OMAS
EXECUTIVE SUMMARY
Economic Challenges. With the nation’s ninth largest race
wage gap, in Ohio, whites’ median income was 84% higher
than that of Black or African Americans. These wage
differences have economic and health consequences including
housing burden and food insecurity, which are associated with
many negative health outcomes. Among all Ohio adults, the
Black or African American housing burden was twice that of
whites, and food insecurity was nearly three times that of
whites. Taken together, these economic social determinants
have many individual, household, and community
consequences that intensify health disparities.
Incarceration Differences. Incarceration is also associated
with poor health outcomes including infectious disease,
hypertension, cancer and mortality.12 Among Ohio men, Black
or African Americans were more than six times as likely to be
incarcerated compared to whites. For both women and men,
previously incarcerated whites were more likely to be
employed, to have less difficulty finding work, and had greater
confidence in Medicaid being helpful to them staying out of
prison in the future.
Health Disparities and Social Determinants. While not all
factors that contribute to race/ethnic health disparities are
known or understood, these analyses show that they exist in
large part because of disparities in social determinants of
health, such as wealth, education, housing, and criminal
justice participation.
Fewer Disparities Among Medicaid Affiliates. For most
health measures, Medicaid enrollment was associated with
smaller racial and ethnic disparities. For example, among
Medicaid enrollees, there were comparable race/ethnic levels
of usual source of care, and interracially similar levels of
diabetes and heart disease. This suggests that Medicaid was
associated with smaller chronic health disparities.
COVID-19 Comorbidity Relationships. Black or African
Americans and Hispanics are overrepresented among COVID-
19 cases, associated hospitalizations, and deaths.
Black/African-American Ohioans are overrepresented in
COVID-19 cases (25.5%), hospitalizations (30.4%) and deaths
(16.5%) compared to their percent of the state population
(13%).17 Though varying over time, COVID-19 was the
fourth leading cause of death for Black or African Americans in
Ohio, outranking death from stroke, diabetes, and
hypertension.17 Regarding comorbidities associated with
COVID-19, Black or African Americans had much higher rates
of obesity, high blood pressure and diabetes.
grc.osu.edu/OMAS 4
Visit grc.osu.edu/OMAS for additional
information about OMAS, including public use
files, codebooks, and methods
Minority Health in Ohio, 2019 OMASMinority Health in Ohio, 2019 OMAS
CONTENTS
Background Page 6
Objectives Page 8
Methods Page 9
Results
Population Characteristics Page 11
Health care Access Page 17
Chronic Health Challenges Page 27
Other Health Outcomes Page 38
Substance Use Page 43
Economic Challenges Page 50
Relation to Prior Research Page 60
Summary of Results Page 61
Policy Considerations Page 62
References Page 64
Acknowledgements Page 65
grc.osu.edu/OMAS 5
Minority Health in Ohio, 2019 OMASMinority Health in Ohio, 2019 OMAS
BACKGROUND
For over a century, researchers have documented how health
outcomes vary for different race/ethnic population groups in the
United States.1, 2 This chartbook describes what these health
disparities are, explains how they matter to Ohio, and considers
explanations for why they persist. Health disparities refer to
preventable differences in disease or injury experienced by
disadvantaged populations.3,4
Black or African Americans, Hispanics, and others
experience a greater burden of disease and injury across a wide
range of outcomes. Multiple explanations can help us
understand these differences. Recent discussions about social
determinants of health, consider circumstances in which people
are born, grow up, work, and play, as factors that may have
various effects on health. These discussions consider
differences in quality of care, service provider biases,
neighborhood inequality, or criminal justice differences. Other
explanations include racial or ethnic differences in access to
health care, insurance coverage or having a usual source of
care. Another explanation includes behavior differences like
smoking or exercise. Each explanation contributes to our
understanding of these differences.
In the U.S., compared to whites, Black or African Americans
are more likely to have asthma, obesity, high blood pressure,
frequent mental health distress, and no usual source of care.
They also have higher age-adjusted rates of mortality from heart
disease, diabetes, and homicide.5 In Ohio, Black or African
Americans have a 45% higher heart disease death rate and
have a 77% higher age-adjusted death rate from diabetes,
compared to whites.
These differences are largely explained by social
determinants of health. They reflect structural inequities
between whites, Black or African Americans, and Hispanics in
our society. These social determinants of health include but are
not limited to: inadequate access to quality health care, low
socioeconomic status, limited educational attainment,
institutionalized racism, food insecurity, and limited policy
coordination. Considering the patterns of social determinants of
health among certain groups is central to research in health
disparities and the potential means for addressing them.
Health equity means that everyone has a fair and just
opportunity to be as healthy as possible. This requires removing
obstacles to health such as poverty, discrimination, and their
consequences, including lack of access to health care. It means
reducing and ultimately eliminating disparities in health and its
determinants that negatively affect marginalized groups.18
This chartbook focuses only on Black or African American,
Hispanic, and White populations. Though Ohio has many
residents of other race/ethnic groups, the OMAS was unable to
sample enough of them to provide reliable estimates for other
groups.
grc.osu.edu/OMAS 6
Continued on next page
Minority Health in Ohio, 2019 OMASMinority Health in Ohio, 2019 OMAS
BACKGROUND
The content of this chartbook examines race/ethnic
disparities by sex, age group, and insurance status to help
pinpoint where disparities were greatest, understand why
they exist, and consider how these disparities are being
addressed. They include factors that help explain these
relationships including minority stress, resilience, and
potential links between racial and ethnic status and health
disparities.6 These and others have been identified in public
health research.
Previous research suggested that disparities are not
inevitable, that they vary, and that understanding the
variations could lead to new strategies to reduce disparities.
This could include leveraging successful programs or policies
from places with small disparities to places where disparities
are larger.7 Reversing them will likely require policies that
focus on structural and clinical and programmatic changes.
Decades of surveillance and research in the US have
documented health disparities in morbidity and mortality
among racial and ethnic minority groups and those of lower
socioeconomic status. It is estimated that in recent years,
the cost of health inequities and premature death in the US
totaled $1.24 trillion. Despite national initiatives such as
Healthy People 2000, 2010, and 2020, and the National
Partnership to End Health Disparities, many remain.
The average differences in health care quality for Blacks,
Hispanics, and Asians compared with whites ranks Ohio in
the worst quartile of the U.S.8 Our report contributes to an
understanding of the presence and size of health disparities
related to these differences in Ohio. Previous research has
noted that health equity means that everyone has a fair and
just opportunity to be as healthy as possible.9 By considering
these findings in relation to social determinants of health, our
report contributes to pathways toward achieving health
equity.
Note that this chartbook reports self-reported health
behaviors, events, and chronic conditions. With the chronic
conditions, the questions ask if a health care professional or
provider had ever informed the respondent that they had a
specific condition. Accordingly, these statistics may vary from
medical records, vital statistic, or other data sources in terms
of time reference and reoccurring diagnosis.
grc.osu.edu/OMAS 7
Minority Health in Ohio, 2019 OMASMinority Health in Ohio, 2019 OMAS
OBJECTIVES
The purpose of this chartbook is to provide a detailed report on differences in health and
well-being statuses between whites, Black or African Americans, and Hispanics as
measured in the Ohio Medicaid Assessment Survey. Our objectives were to:
1. Present estimates of health indicators, chronic conditions, health care access and
services, substance use, and economic constraints among Ohioans, and what, if any,
differences there were among them.
2. Estimate the health and health disparities across status characteristics including:
gender, age, race/ethnicity, and insurance status.
3. Consider these estimates and race/ethnic differences in relation to socioeconomic
inequalities associated with them, consistent with a social determinants of health
perspective.
4. Determine whether Medicaid coverage affected racial and ethnic disparities.
grc.osu.edu/OMAS 8
Minority Health in Ohio, 2019 OMASMinority Health in Ohio, 2019 OMAS
METHODS
Description of Data Sources
• The 2019 Ohio Medicaid Assessment Survey (OMAS) is the primary data source for this chartbook. Earlier OMAS surveys from 2010, 2012, 2015, and 2017 were also used for trending. Additional data used were from the 2019 Ohio Medicaid Released Enrollees Study (OMRES), and the 2018 Behavioral Risk Factor Surveillance System (BFRSS).
• OMRES data are from the Ohio Medicaid Pre-Release Enrollment (MPRE) program. In 2014, the Ohio Department of Medicaid (ODM), in collaboration with the Ohio Department of Rehabilitation and Correction (ODRC), initiated MPRE which enrolls incarcerated individuals in Medicaid prior to release from prison. The 2019 Ohio Medicaid Released Enrollees Study (OMRES) is an evaluation of the MPRE program and a follow-up to the 2018 OMRES.
Further Details on the 2019 OMAS
• The 2019 OMAS is an Ohio-specific assessment that provides health status and health system-related information about residential Ohioans at the state, regional and county levels, with a concentration on Ohio’s Medicaid, potentially Medicaid-eligible, and non-Medicaid populations.
• This multi-mode study collected data through a sample of landline and cellular phones in Ohio through random digit dialing, as well as by web-based or paper versions through address-based sampling (ABS).
• A total of 31,558 surveys of Ohioans 19 years of age and older and proxy interviews for 7,404 children 18 years of age and younger were completed by researchers in 2019: 30,068 by phone, 950 by web, and 540 by mail-in paper survey.
• The 2019 OMAS is the eighth iteration of the survey. For details, please see the OMAS methods at grc.osu.edu/OMAS.
• More information on the findings and methodology of the survey is accessible at: https://grc.osu.edu/OMAS/2019Survey.
Variable Definitions
• Adults were 19-64 years-old as identified in the OMAS.
• Adults identified in the survey as having Medicaid health insurance coverage were assigned to the Medicaid sub-population. Adults without Medicaid but at or below 138% of the Federal Poverty Level (FPL; $17,609 for a single person) were assigned to the Potentially Medicaid-Eligible sub-population. The Insured Potentially Medicaid-Eligible sub-population had Medicare only, Employer-Sponsored or Other/Private Insurance. The Uninsured Potentially Medicaid-Eligible sub-population had no known insurance.
• Race/ethnicity was self-reported in the OMAS using the U.S. Census Bureau short form question: “Which one or more of the following would you say is your race? Are you: White, Black or African American, American Indian, or Alaskan Native, Native Hawaiian or Pacific Islander, or some other race I have not mentioned?” The category other indicated a racial category not listed or self-reported unknown. When multiple race was reported, the respondent was asked to determine their primary race, which was used for analyses.
• Poor/Fair Health status combined the mutually exclusive self-reported health categories of Poor and Fair as recorded in the OMAS.
• Mental Health Impairment (MHI) was defined as at least 14 days in the past 30 days where mental health prevented work or day-to-day activities as recorded in the OMAS.
• Frequent ER visits was a count of having visited an ER three or more times in the previous 12 months
grc.osu.edu/OMAS 9
Continued on next page
Minority Health in Ohio, 2019 OMASMinority Health in Ohio, 2019 OMAS
METHODS
Variable Definitions (cont.)
• Binge Drinking was defined as at least one instance of
drinking 4 or more or 5 or more alcoholic beverages for
adult women or men, respectively, in the past 30 days as
recorded in the OMAS.
• Unmet Needs was at least one unmet dental, mental
health, prescriptions, or other needs within the past 12
months as recorded in the OMAS.
• Housing Burden was defined as having a monthly
rent/mortgage that exceeds 40% of the monthly income as
recorded in the OMAS.
• Food Insecurity was defined as running out of food before
getting money to buy more within the last 12 months.
• Heart disease was those diagnosed as having a heart
attack, coronary heart disease or congestive heart failure.
• Those who were Currently Smoking have smoked at least
100 cigarettes during their lifetime and currently smoke
some days or every day.
Analyses
• Descriptive statistics are reported in the trending figures
and bar charts that follow. The trending figures compared
nine subgroups (i.e., three different insurance groups,
among each of three ethnic/racial groups).
• For the 2019 data, significant differences were denoted
between bracketed groups by an asterisk (*). A significant
difference was a nonzero 95% confidence interval for the
difference between the two bracketed groups.
• Survey question estimates available in 2019 were
presented with those for earlier years, or for 2019 only, but
always where the data were sufficient for calculating and
presenting reliable estimates. Reliable estimates were
defined as one where the size of the unweighted
subpopulation of interest was greater than 30 individuals
and the coefficient of variation for the estimate was less
than 0.3. Otherwise, estimates were replaced by double
asterisks (**). Application of these rules resulted in the
exclusion of several OMAS survey questions or particular
subgroups from this chartbook.
grc.osu.edu/OMAS 10
Minority Health in Ohio, 2019 OMAS
C H A R A C T E R I S T I C S O F O H I O A D U LT S
This section overviews characteristics of Ohio’s Potentially
Medicaid-eligible, working-aged adults, 19-64 years old.
Race/ethnic, age and insurance status differences are featured.
Minority Health in Ohio, 2019 OMASMinority Health in Ohio, 2019 OMAS
Key F ind ings : Charac te r i s t i cs o f
Oh io Adu l ts
• When considering the findings that follow, it is important to keep two compilations of OMAS data in
mind. First, the total OMAS is an Ohio-specific assessment that provides health status and health
system-related information about all residential Ohioans. Second, our core OMAS subset was working
aged, lower-income OMAS adults (i.e., at <138% of the poverty level). All figures were labelled to
identify which of the two OMAS data sources the findings refer to. When considering the lower-income
OMAS respondents, we distinguished among three subgroups of potentially Medicaid-eligible Ohio
adults who: (1) Were enrolled in Medicaid, (2) had some other form of insurance, or (3) were
uninsured. Doing so more effectively detailed the experiences of health and health disparities in Ohio.
• When comparing these three insurance categories, there were notable age differences between those
who were Medicaid enrolled, those with other insurance, and the uninsured. Compared to Medicaid
enrolled adults, the uninsured were younger, while those with other insurance were older.
• There were race/ethnic differences among the three insurance categories. Compared to Medicaid
enrollees, the uninsured were less likely to be White and Black or African Americans and 4 times more
likely to be Hispanic. Those with other insurance were less likely to be Black or African American and
Hispanic.
• Among all potentially Medicaid-eligible adults in Ohio, Black or African Americans and whites were
similar in age. Similar to the general population, Hispanics were much younger. Additionally,
racial/ethnic diversity also differed by age. Among young adults, those identifying as Other
race/ethnicity were more than twice the percentage of older adults who did so.
grc.osu.edu/OMAS 12
Minority Health in Ohio, 2019 OMASMinority Health in Ohio, 2019 OMAS
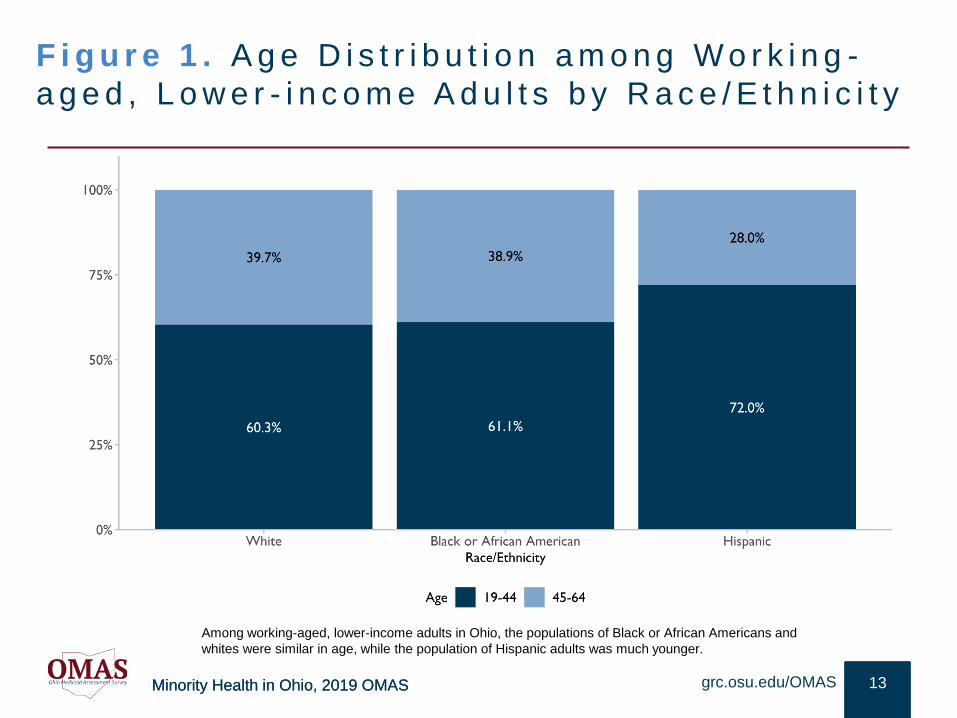
F i g u r e 1 . A g e D i s t r i b u t i o n a m o n g W o r k i n g -
a g e d , L o w e r - i n c o m e A d u l t s b y R a c e / E t h n i c i t y
13grc.osu.edu/OMAS
Among working-aged, lower-income adults in Ohio, the populations of Black or African Americans and
whites were similar in age, while the population of Hispanic adults was much younger.
Minority Health in Ohio, 2019 OMASMinority Health in Ohio, 2019 OMAS
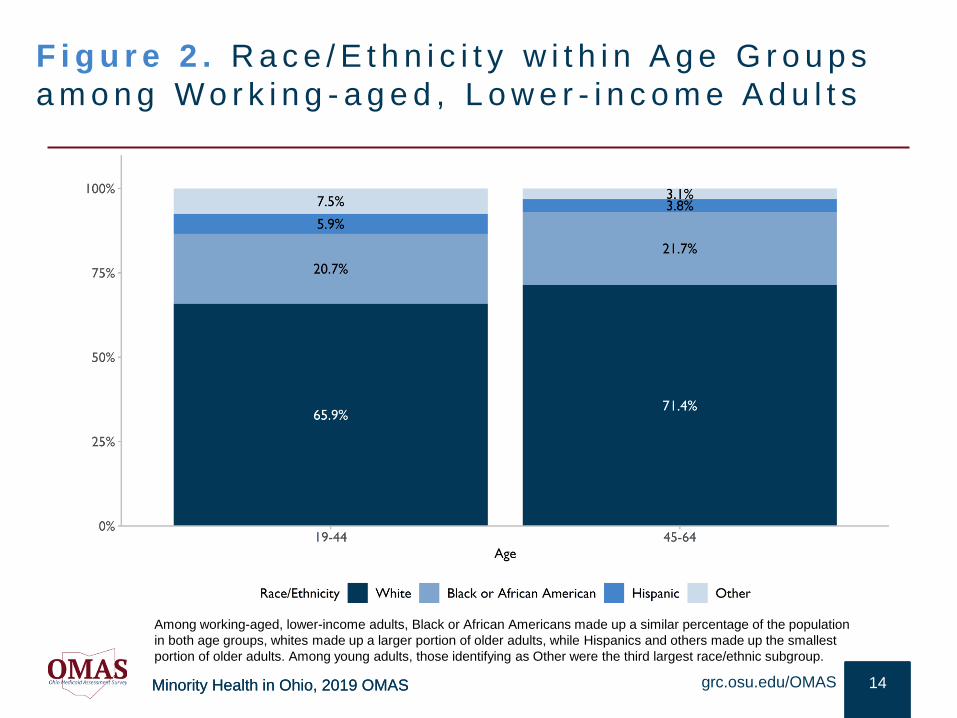
F i g u r e 2 . R a c e / E t h n i c i t y w i t h i n A g e G r o u p s
a m o n g W o r k i n g - a g e d , L o w e r - i n c o m e A d u l t s
14grc.osu.edu/OMAS
Among working-aged, lower-income adults, Black or African Americans made up a similar percentage of the population
in both age groups, whites made up a larger portion of older adults, while Hispanics and others made up the smallest
portion of older adults. Among young adults, those identifying as Other were the third largest race/ethnic subgroup.
Minority Health in Ohio, 2019 OMASMinority Health in Ohio, 2019 OMAS
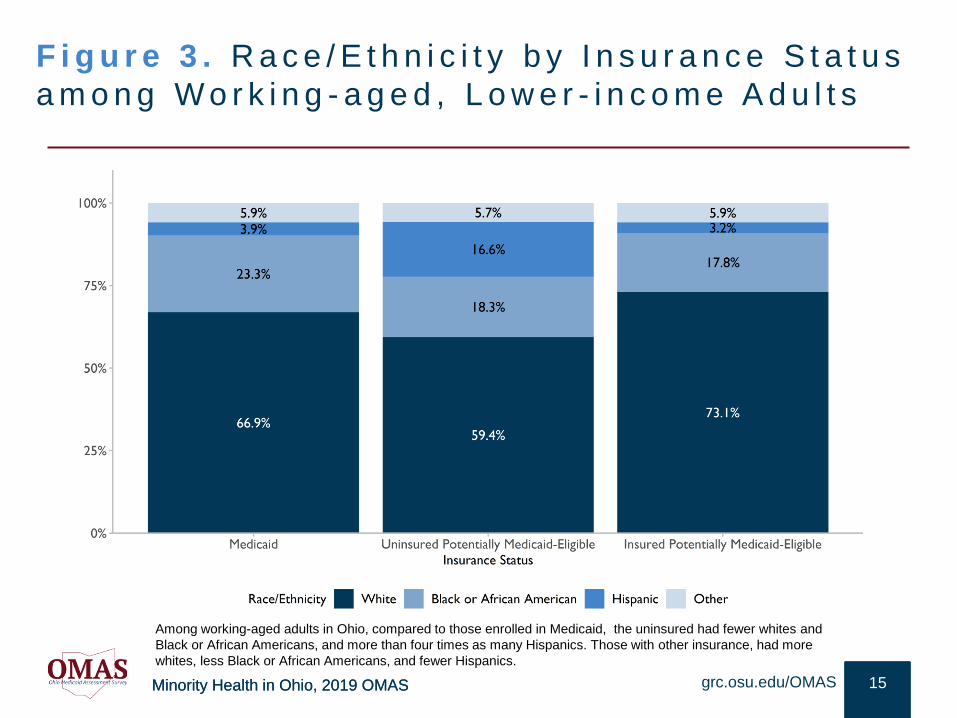
F i g u r e 3 . R a c e / E t h n i c i t y b y I n s u r a n c e S t a t u s
a m o n g W o r k i n g - a g e d , L o w e r - i n c o m e A d u l t s
15grc.osu.edu/OMAS
Among working-aged adults in Ohio, compared to those enrolled in Medicaid, the uninsured had fewer whites and
Black or African Americans, and more than four times as many Hispanics. Those with other insurance, had more
whites, less Black or African Americans, and fewer Hispanics.
Minority Health in Ohio, 2019 OMASMinority Health in Ohio, 2019 OMAS
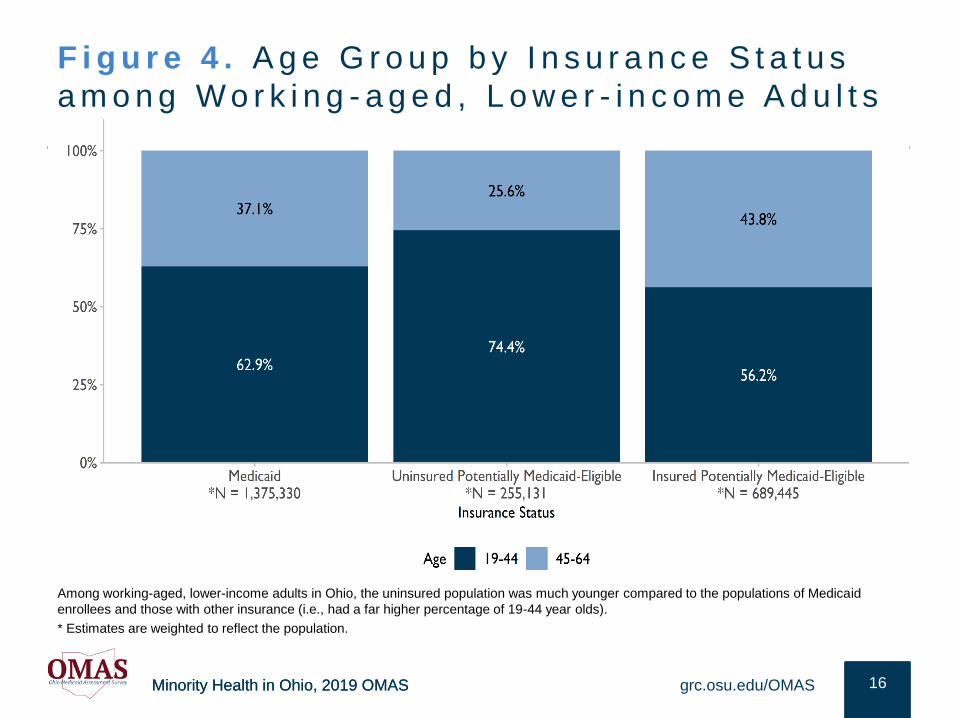
F i g u r e 4 . A g e G r o u p b y I n s u r a n c e S t a t u s
a m o n g W o r k i n g - a g e d , L o w e r - i n c o m e A d u l t s
16grc.osu.edu/OMAS
Among working-aged, lower-income adults in Ohio, the uninsured population was much younger compared to the populations of Medicaid
enrollees and those with other insurance (i.e., had a far higher percentage of 19-44 year olds).
* Estimates are weighted to reflect the population.
Minority Health in Ohio, 2019 OMAS
H E A LT H C A R E A C C E S S
The following section provides an overview of prevalence and trends in
health care services for various racial and ethnic subgroups of Ohio
residents. Focus was placed on having a usual source of care, emergency
room visits, and the level of unmet need. The data on each outcome were
not mutually exclusive, as some people may experience multiple health
service challenges.
Minority Health in Ohio, 2019 OMASMinority Health in Ohio, 2019 OMAS
Key F ind ings : Hea l th Care Access
• Many of the policies in the Affordable Care Act (ACA) are important because of improved health care
access and reduced health disparities associated with improved access. Among Medicaid enrollees,
having a usual source of care has steadily been at, or above 90% since 2010, with very few
differences by race/ethnicity.
• Consistent with high levels of a usual source of care, over time unmet health care needs among
Medicaid enrollees have been relatively stable. Among adults with Medicaid, Black or African
Americans reported having fewer unmet needs compared to both whites and Hispanics. Not
surprisingly, when comparing insurance groups among lower-income Ohio adults, the highest levels
of unmet need were among those uninsured, with more than half of uninsured whites having unmet
health care needs
• When considering all OMAS respondents, regardless of income, there were sizable unmet health
care need differences by race and ethnicity, with African Americans having a much higher level of
unmet need than whites. Yet, Hispanics had the highest level of unmet need.
• Among Medicaid enrollees, three trajectories of frequent ER visits emerged: (1) While White rates
have been stable, those of African Americans have slightly increased over time, and despite limited
data, Hispanic frequent ER visits are declining; (2) when considering all OMAS respondents, marked
race/ethnic differences include African Americans having the highest level of frequent ER visits; and
(3) this ER frequency finding was also true when comparing the experiences of Medicaid enrollees.
grc.osu.edu/OMAS 18
Minority Health in Ohio, 2019 OMASMinority Health in Ohio, 2019 OMAS
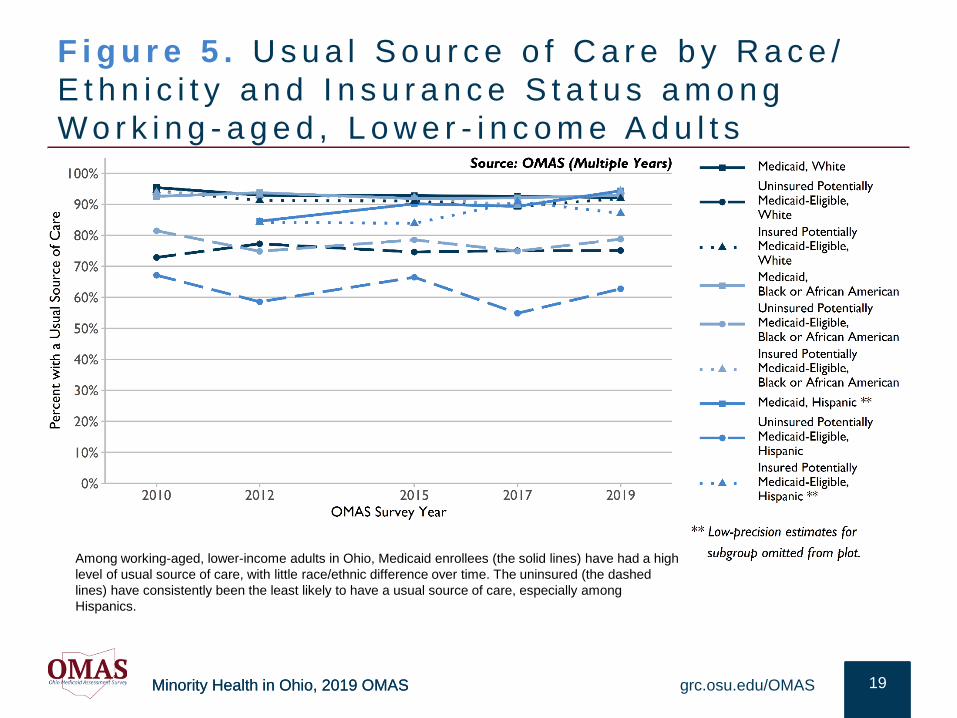
F i g u r e 5 . U s u a l S o u r c e o f C a r e b y R a c e /
E t h n i c i t y a n d I n s u r a n c e S t a t u s a m o n g
W o r k i n g - a g e d , L o w e r - i n c o m e A d u l t s
19grc.osu.edu/OMAS
Among working-aged, lower-income adults in Ohio, Medicaid enrollees (the solid lines) have had a high
level of usual source of care, with little race/ethnic difference over time. The uninsured (the dashed
lines) have consistently been the least likely to have a usual source of care, especially among
Hispanics.
Minority Health in Ohio, 2019 OMASMinority Health in Ohio, 2019 OMAS
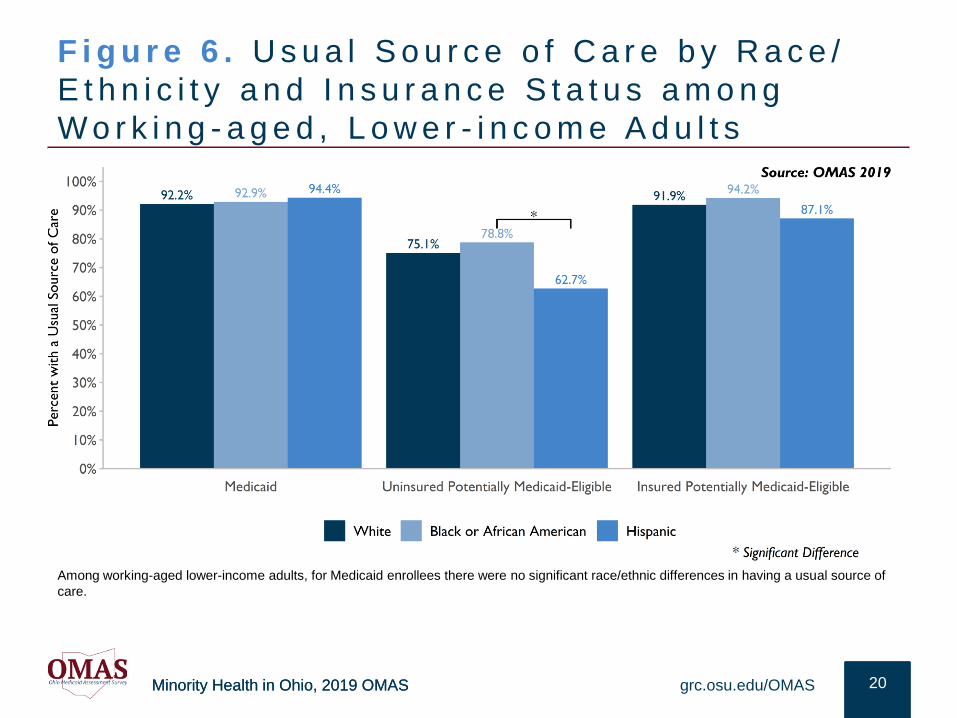
F i g u r e 6 . U s u a l S o u r c e o f C a r e b y R a c e /
E t h n i c i t y a n d I n s u r a n c e S t a t u s a m o n g
W o r k i n g - a g e d , L o w e r - i n c o m e A d u l t s
20grc.osu.edu/OMAS
Among working-aged lower-income adults, for Medicaid enrollees there were no significant race/ethnic differences in having a usual source of
care.
Minority Health in Ohio, 2019 OMASMinority Health in Ohio, 2019 OMAS
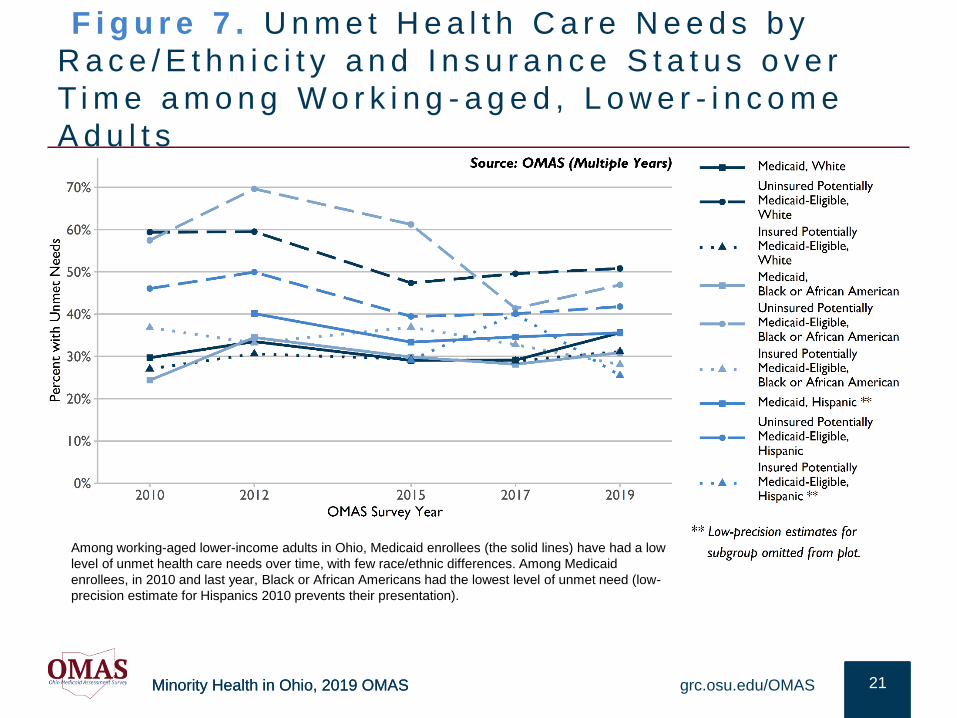
F i g u r e 7 . U n m e t H e a l t h C a r e N e e d s b y
R a c e / E t h n i c i t y a n d I n s u r a n c e S t a t u s o v e r
T i m e a m o n g W o r k i n g - a g e d , L o w e r - i n c o m e
A d u l t s
21grc.osu.edu/OMAS
Among working-aged lower-income adults in Ohio, Medicaid enrollees (the solid lines) have had a low
level of unmet health care needs over time, with few race/ethnic differences. Among Medicaid
enrollees, in 2010 and last year, Black or African Americans had the lowest level of unmet need (low-
precision estimate for Hispanics 2010 prevents their presentation).
Minority Health in Ohio, 2019 OMASMinority Health in Ohio, 2019 OMAS
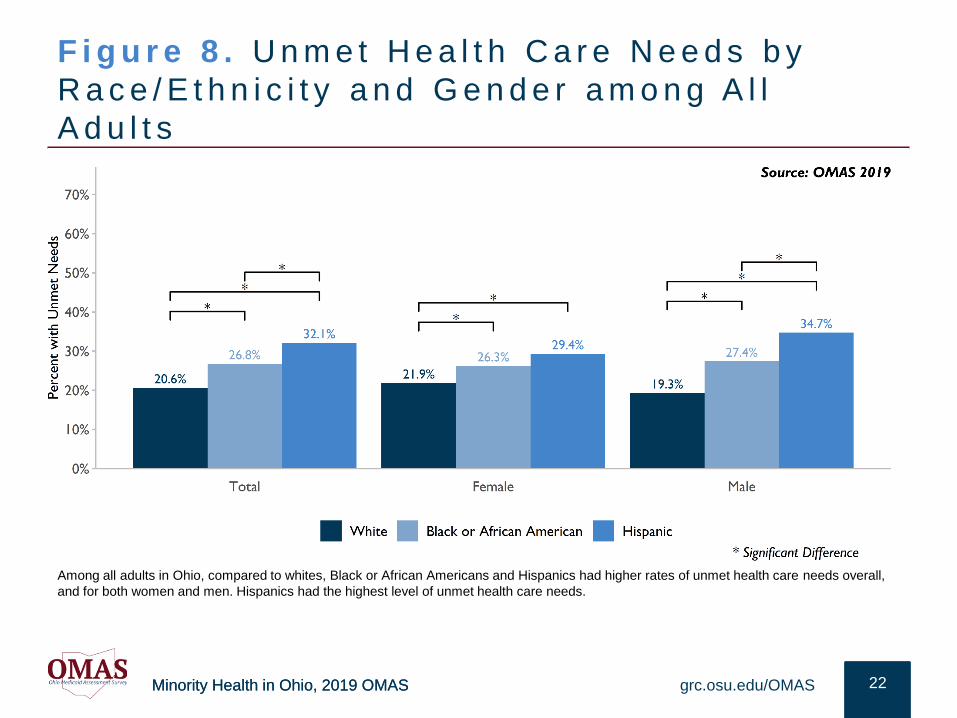
F i g u r e 8 . U n m e t H e a l t h C a r e N e e d s b y
R a c e / E t h n i c i t y a n d G e n d e r a m o n g A l l
A d u l t s
22grc.osu.edu/OMAS
Among all adults in Ohio, compared to whites, Black or African Americans and Hispanics had higher rates of unmet health care needs overall,
and for both women and men. Hispanics had the highest level of unmet health care needs.
Minority Health in Ohio, 2019 OMASMinority Health in Ohio, 2019 OMAS
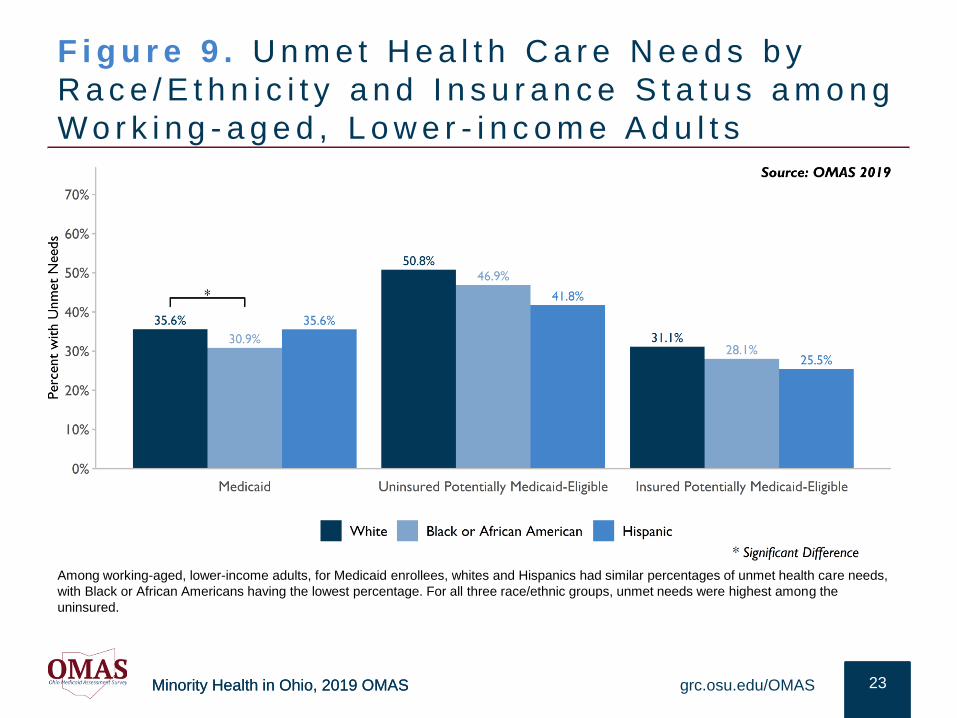
F i g u r e 9 . U n m e t H e a l t h C a r e N e e d s b y
R a c e / E t h n i c i t y a n d I n s u r a n c e S t a t u s a m o n g
W o r k i n g - a g e d , L o w e r - i n c o m e A d u l t s
23grc.osu.edu/OMAS
Among working-aged, lower-income adults, for Medicaid enrollees, whites and Hispanics had similar percentages of unmet health care needs,
with Black or African Americans having the lowest percentage. For all three race/ethnic groups, unmet needs were highest among the
uninsured.
Minority Health in Ohio, 2019 OMASMinority Health in Ohio, 2019 OMAS
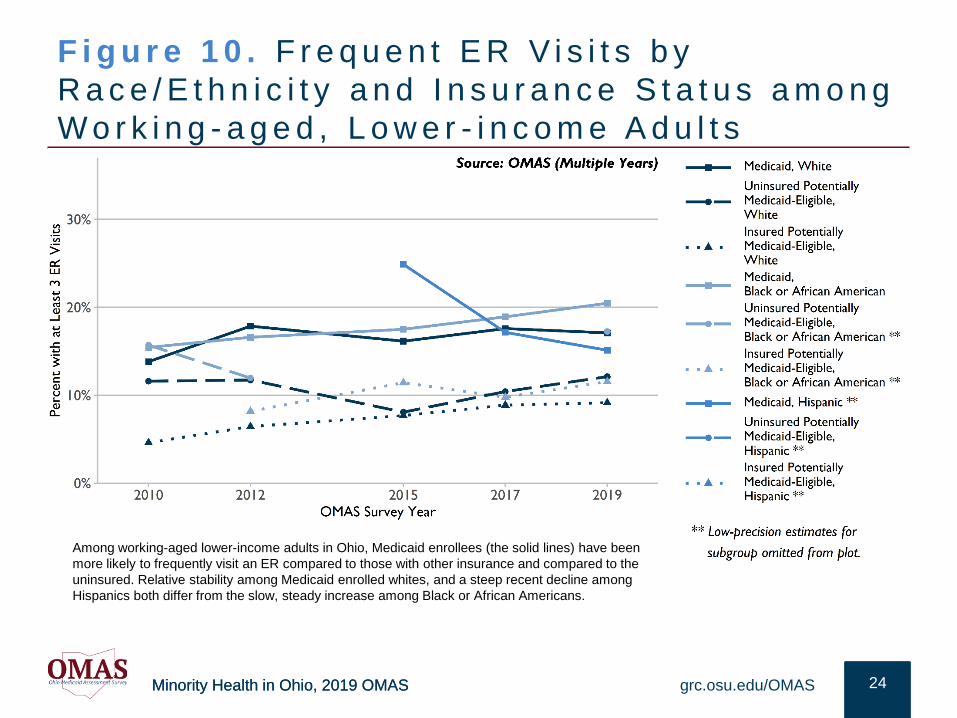
F i g u r e 1 0 . F r e q u e n t E R V i s i t s b y
R a c e / E t h n i c i t y a n d I n s u r a n c e S t a t u s a m o n g
W o r k i n g - a g e d , L o w e r - i n c o m e A d u l t s
24grc.osu.edu/OMAS
Among working-aged lower-income adults in Ohio, Medicaid enrollees (the solid lines) have been
more likely to frequently visit an ER compared to those with other insurance and compared to the
uninsured. Relative stability among Medicaid enrolled whites, and a steep recent decline among
Hispanics both differ from the slow, steady increase among Black or African Americans.
Minority Health in Ohio, 2019 OMASMinority Health in Ohio, 2019 OMAS
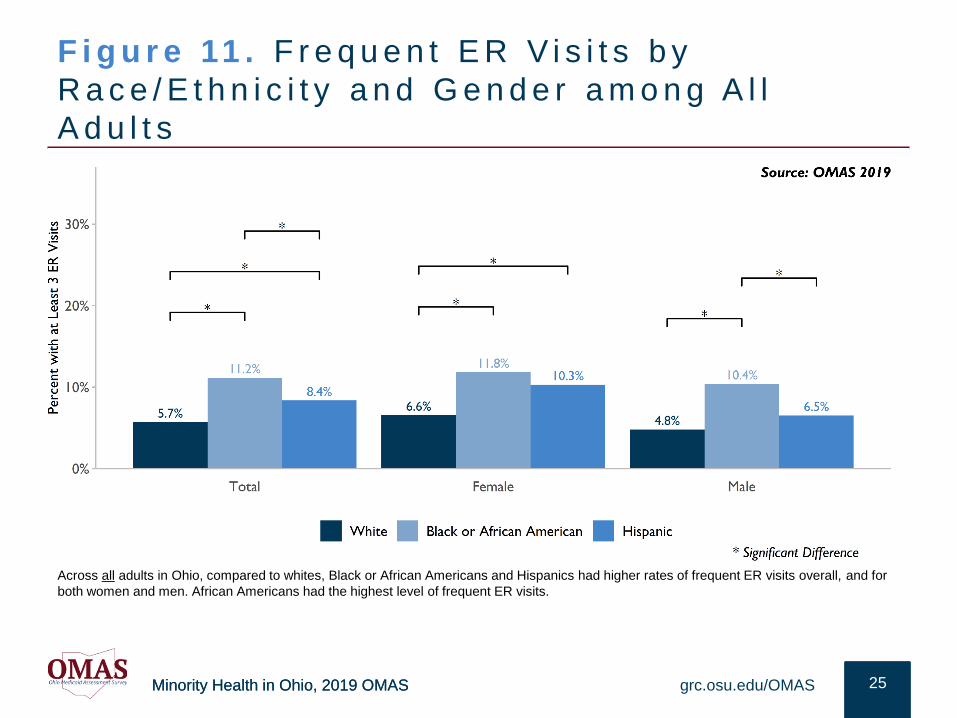
F i g u r e 11 . F r e q u e n t E R V i s i t s b y
R a c e / E t h n i c i t y a n d G e n d e r a m o n g A l l
A d u l t s
25grc.osu.edu/OMAS
Across all adults in Ohio, compared to whites, Black or African Americans and Hispanics had higher rates of frequent ER visits overall, and for
both women and men. African Americans had the highest level of frequent ER visits.
Minority Health in Ohio, 2019 OMASMinority Health in Ohio, 2019 OMAS
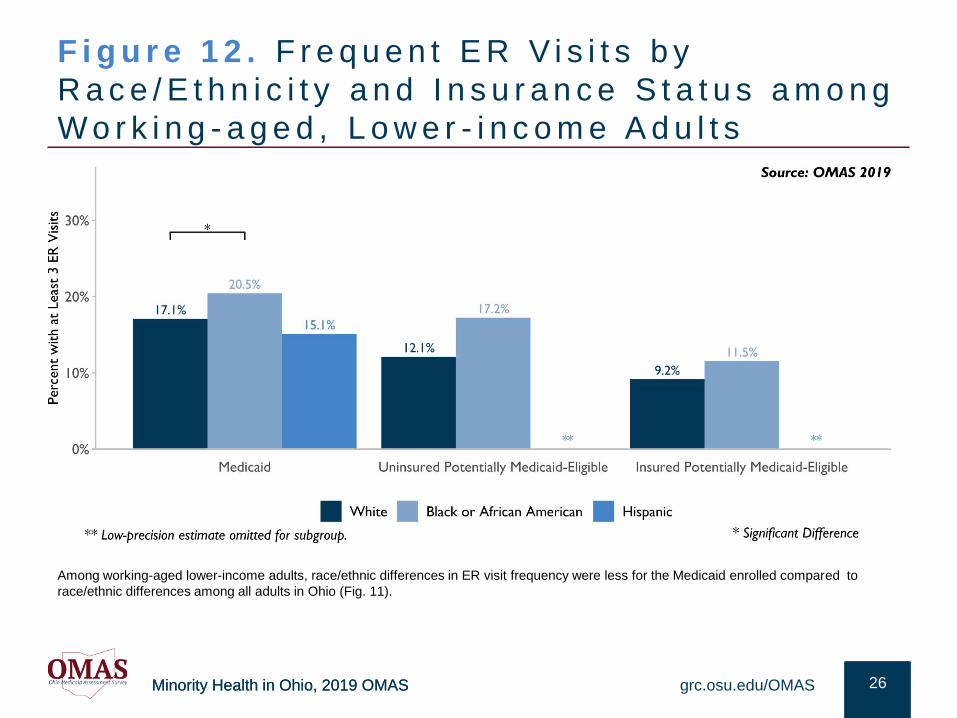
F i g u r e 1 2 . F r e q u e n t E R V i s i t s b y
R a c e / E t h n i c i t y a n d I n s u r a n c e S t a t u s a m o n g
W o r k i n g - a g e d , L o w e r - i n c o m e A d u l t s
26grc.osu.edu/OMAS
Among working-aged lower-income adults, race/ethnic differences in ER visit frequency were less for the Medicaid enrolled compared to
race/ethnic differences among all adults in Ohio (Fig. 11).
Minority Health in Ohio, 2019 OMAS
R E S U L T S : C H R O N I C H E A L T H C H A L L E N G E S
The following section provides an overview of prevalence and trends
in chronic health outcomes for various racial and ethnic subgroups of
Ohio residents. Focus was on heart-related challenges, high blood
pressure, obesity, asthma, and diabetes. The data on each outcome
were not mutually exclusive, as some people may experience multiple
health challenges.
Minority Health in Ohio, 2019 OMASMinority Health in Ohio, 2019 OMAS
Key F ind ings : Chron ic Cond i t ions
• Recent increases in diabetes contrasted with the decline among all Medicaid enrollees, 2012-2017 OMAS
results. Among Medicaid enrolled Ohio adult diabetes rates were quite similar by race/ethnicity in 2019.
When considering diabetes among all OMAS respondents there were notable race/ethnic differences.
Regardless of gender, Black or African Americans had higher rates of diabetes.
• Compared to other race/ethnic groups, African Americans most frequently had high blood pressure,
regardless of income, gender, and type of insurance.
• Ohio is the 11th most obese state in the U.S.10 Regardless of race/ethnicity, Medicaid enrolled adults were
more obese compared to their potentially Medicaid-eligible counterparts. Since 2015, for all insurance
groups and regardless of race/ethnicity, rates among potentially Medicaid-eligible adults are in the obese
range. Still, obesity differs by race and ethnicity among Ohio adults, with African Americans having
consistently been more obese over time. However, due to a marked increase in recent years, Hispanics
had the highest obesity in 2019. While there was very little race/ethnic difference in obesity among men,
among Medicaid enrollees there were marked race/ethnic differences among women. Nearly 60% of
uninsured African American women were obese.
• Among those enrolled in Medicaid, heart disease is similar among whites and Hispanics. When considering
all OMAS respondents, middle-aged African Americans had the highest prevalence of heart-related
challenges, compared to middle-aged whites and Hispanics.
• Among all OMAS respondents, asthma was much more common among African Americans and Hispanics.
Compared to other insurance groups, asthma rates were notably higher among those on Medicaid,
regardless of race/ethnicity.
grc.osu.edu/OMAS 28
Minority Health in Ohio, 2019 OMASMinority Health in Ohio, 2019 OMAS
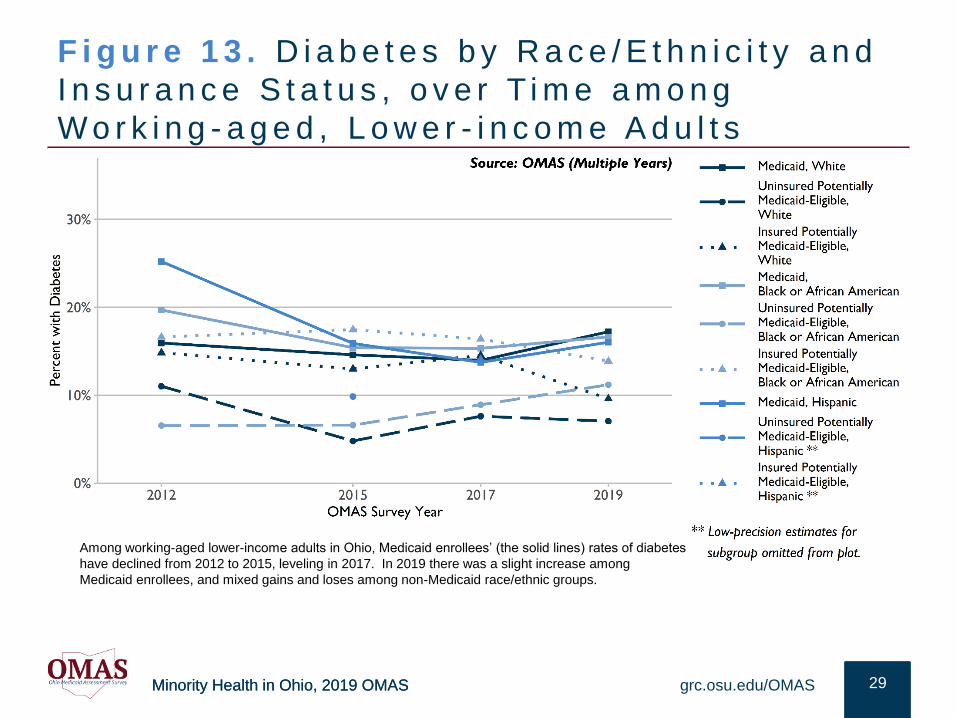
F i g u r e 1 3 . D i a b e t e s b y R a c e / E t h n i c i t y a n d
I n s u r a n c e S t a t u s , o v e r T i m e a m o n g
W o r k i n g - a g e d , L o w e r - i n c o m e A d u l t s
29grc.osu.edu/OMAS
Among working-aged lower-income adults in Ohio, Medicaid enrollees’ (the solid lines) rates of diabetes
have declined from 2012 to 2015, leveling in 2017. In 2019 there was a slight increase among
Medicaid enrollees, and mixed gains and loses among non-Medicaid race/ethnic groups.
Minority Health in Ohio, 2019 OMASMinority Health in Ohio, 2019 OMAS
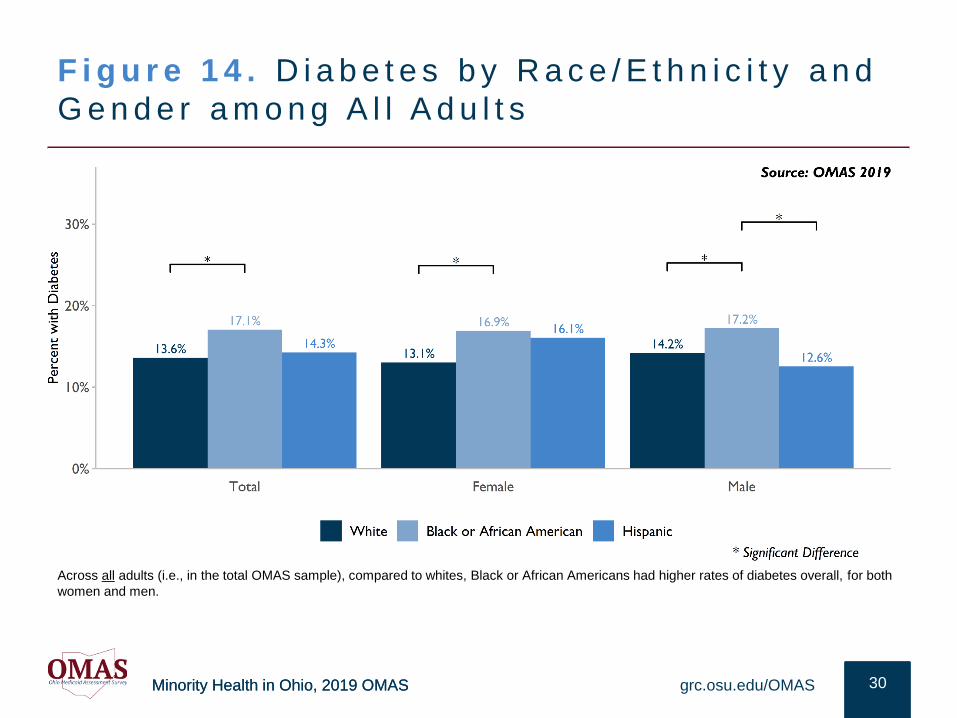
F i g u r e 1 4 . D i a b e t e s b y R a c e / E t h n i c i t y a n d
G e n d e r a m o n g A l l A d u l t s
30grc.osu.edu/OMAS
Across all adults (i.e., in the total OMAS sample), compared to whites, Black or African Americans had higher rates of diabetes overall, for both
women and men.
Minority Health in Ohio, 2019 OMASMinority Health in Ohio, 2019 OMAS
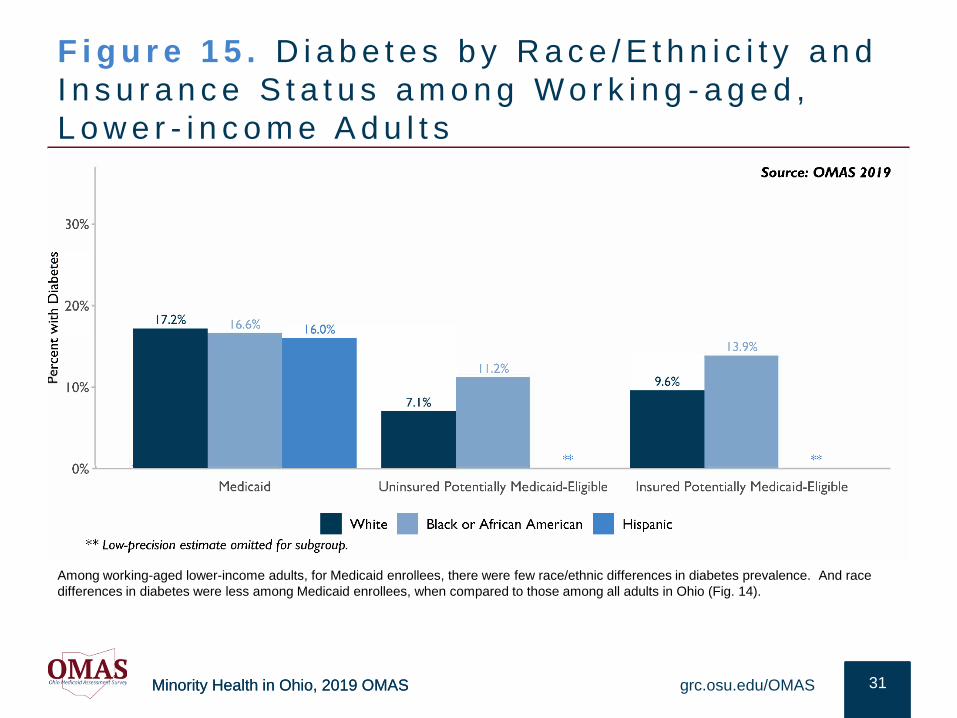
F i g u r e 1 5 . D i a b e t e s b y R a c e / E t h n i c i t y a n d
I n s u r a n c e S t a t u s a m o n g W o r k i n g - a g e d ,
L o w e r - i n c o m e A d u l t s
31grc.osu.edu/OMAS
Among working-aged lower-income adults, for Medicaid enrollees, there were few race/ethnic differences in diabetes prevalence. And race
differences in diabetes were less among Medicaid enrollees, when compared to those among all adults in Ohio (Fig. 14).
Minority Health in Ohio, 2019 OMASMinority Health in Ohio, 2019 OMAS
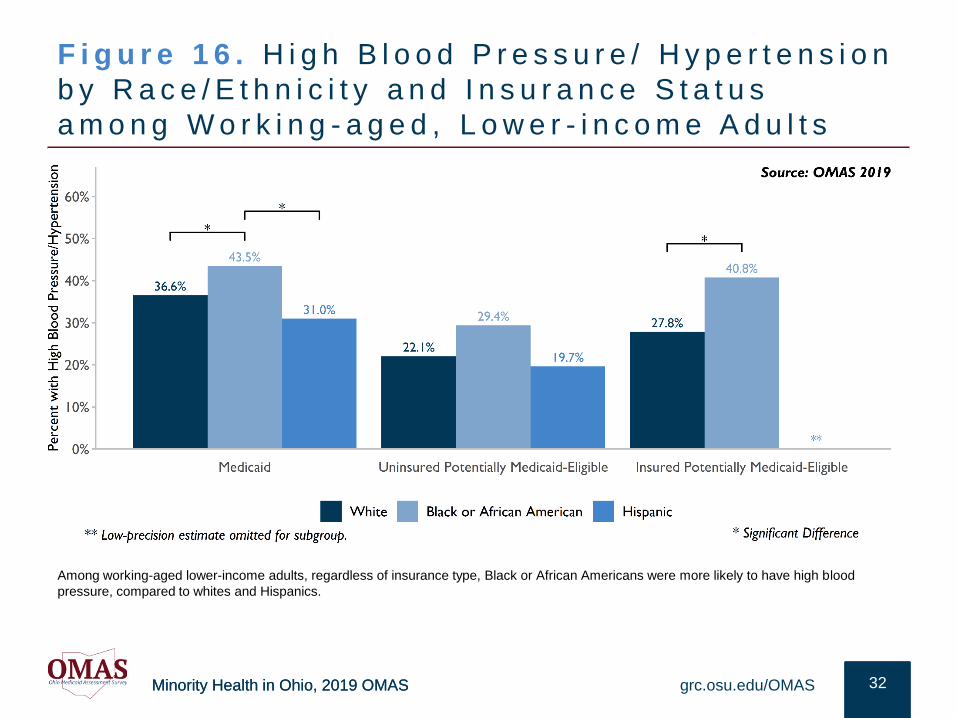
F i g u r e 1 6 . H i g h B l o o d P r e s s u r e / H y p e r t e n s i o n
b y R a c e / E t h n i c i t y a n d I n s u r a n c e S t a t u s
a m o n g W o r k i n g - a g e d , L o w e r - i n c o m e A d u l t s
32grc.osu.edu/OMAS
Among working-aged lower-income adults, regardless of insurance type, Black or African Americans were more likely to have high blood
pressure, compared to whites and Hispanics.
Minority Health in Ohio, 2019 OMASMinority Health in Ohio, 2019 OMAS
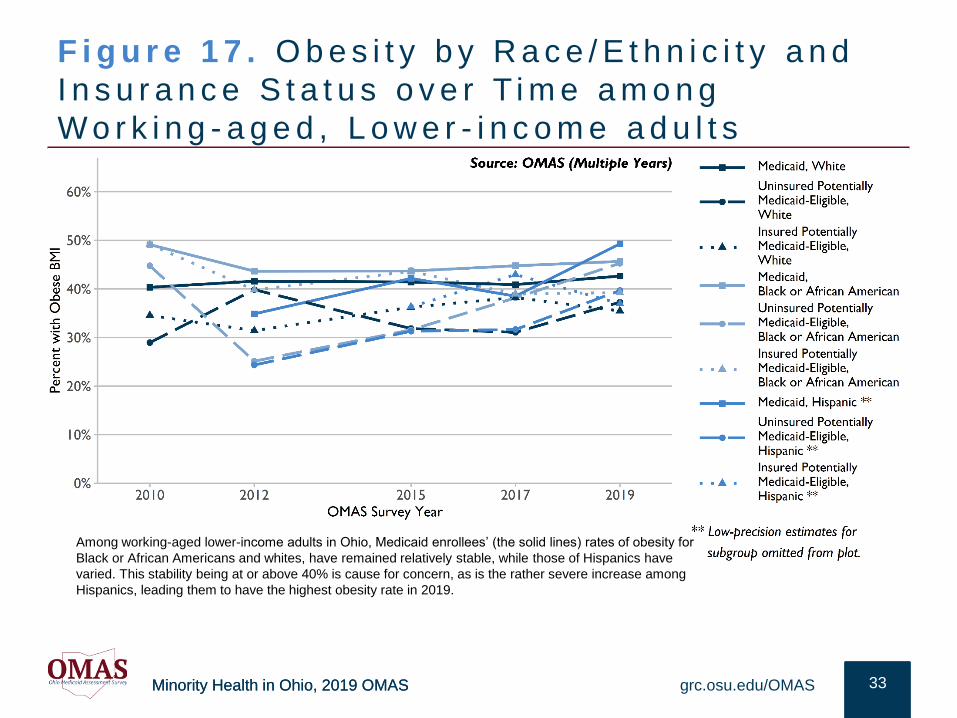
F i g u r e 1 7 . O b e s i t y b y R a c e / E t h n i c i t y a n d
I n s u r a n c e S t a t u s o v e r T i m e a m o n g
W o r k i n g - a g e d , L o w e r - i n c o m e a d u l t s
33grc.osu.edu/OMAS
Among working-aged lower-income adults in Ohio, Medicaid enrollees’ (the solid lines) rates of obesity for
Black or African Americans and whites, have remained relatively stable, while those of Hispanics have
varied. This stability being at or above 40% is cause for concern, as is the rather severe increase among
Hispanics, leading them to have the highest obesity rate in 2019.
Minority Health in Ohio, 2019 OMASMinority Health in Ohio, 2019 OMAS
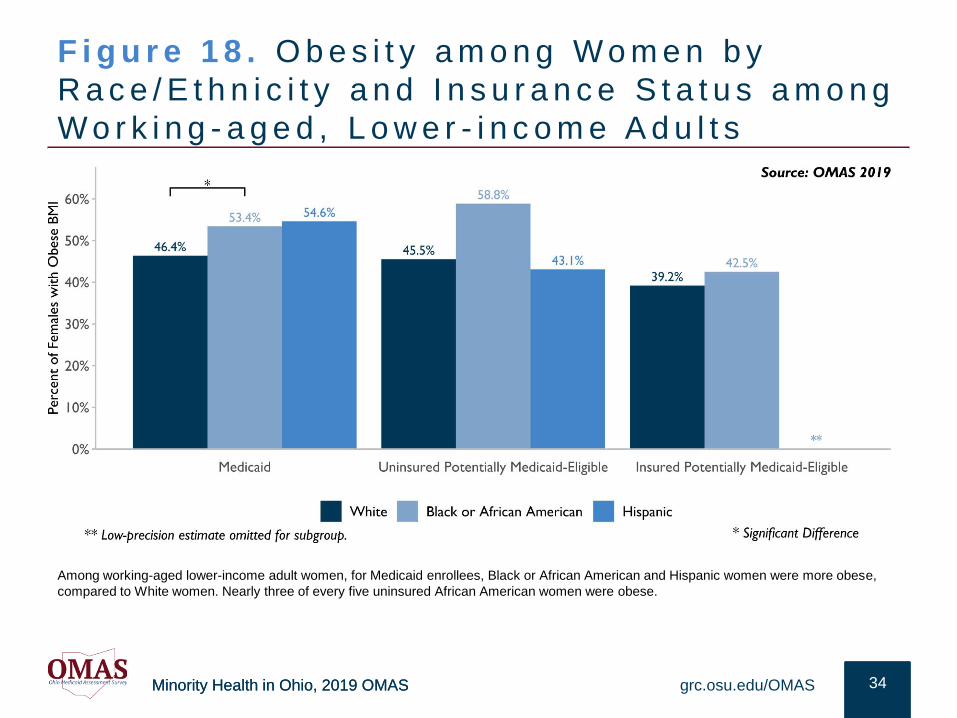
F i g u r e 1 8 . O b e s i t y a m o n g W o m e n b y
R a c e / E t h n i c i t y a n d I n s u r a n c e S t a t u s a m o n g
W o r k i n g - a g e d , L o w e r - i n c o m e A d u l t s
34grc.osu.edu/OMAS
Among working-aged lower-income adult women, for Medicaid enrollees, Black or African American and Hispanic women were more obese,
compared to White women. Nearly three of every five uninsured African American women were obese.
Minority Health in Ohio, 2019 OMASMinority Health in Ohio, 2019 OMAS
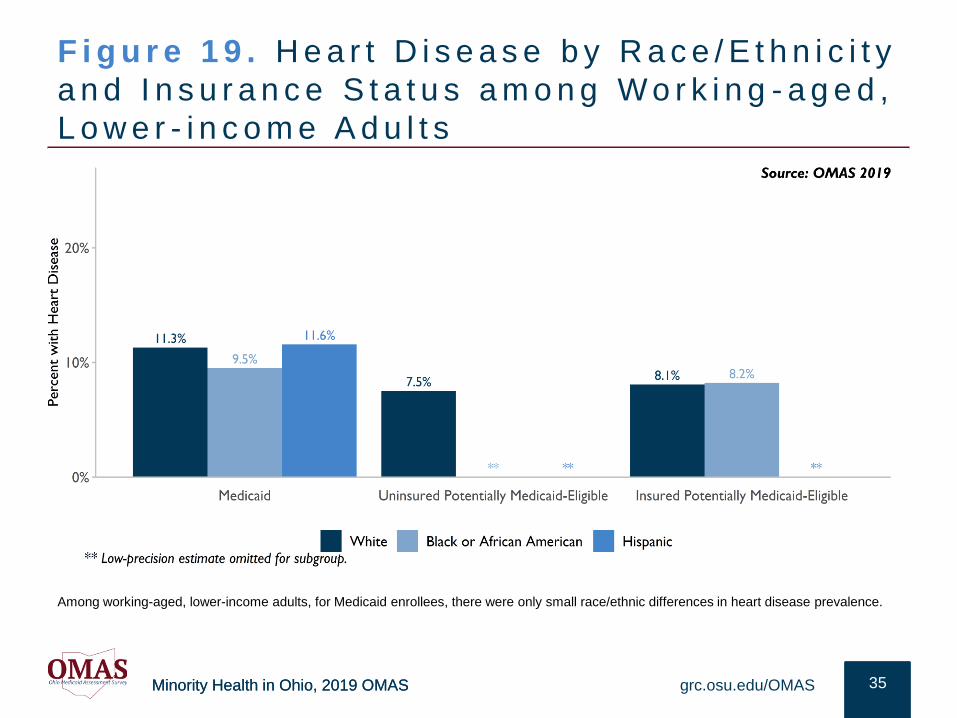
F i g u r e 1 9 . H e a r t D i s e a s e b y R a c e / E t h n i c i t y
a n d I n s u r a n c e S t a t u s a m o n g W o r k i n g - a g e d ,
L o w e r - i n c o m e A d u l t s
35grc.osu.edu/OMAS
Among working-aged, lower-income adults, for Medicaid enrollees, there were only small race/ethnic differences in heart disease prevalence.
Minority Health in Ohio, 2019 OMASMinority Health in Ohio, 2019 OMAS
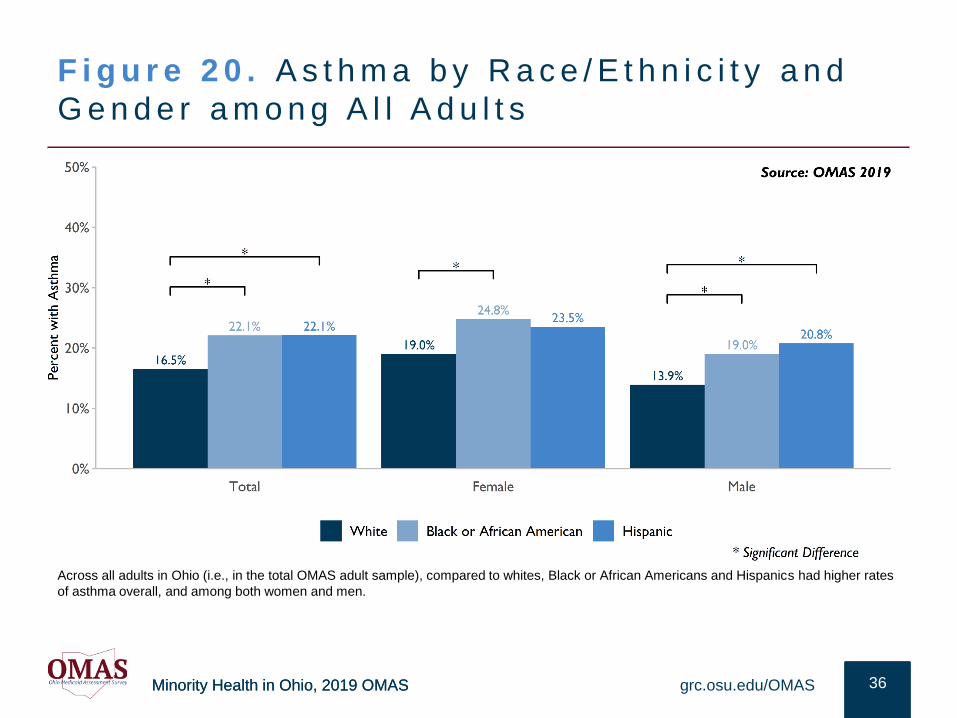
F i g u r e 2 0 . A s t h m a b y R a c e / E t h n i c i t y a n d
G e n d e r a m o n g A l l A d u l t s
36grc.osu.edu/OMAS
Across all adults in Ohio (i.e., in the total OMAS adult sample), compared to whites, Black or African Americans and Hispanics had higher rates
of asthma overall, and among both women and men.
Minority Health in Ohio, 2019 OMASMinority Health in Ohio, 2019 OMAS
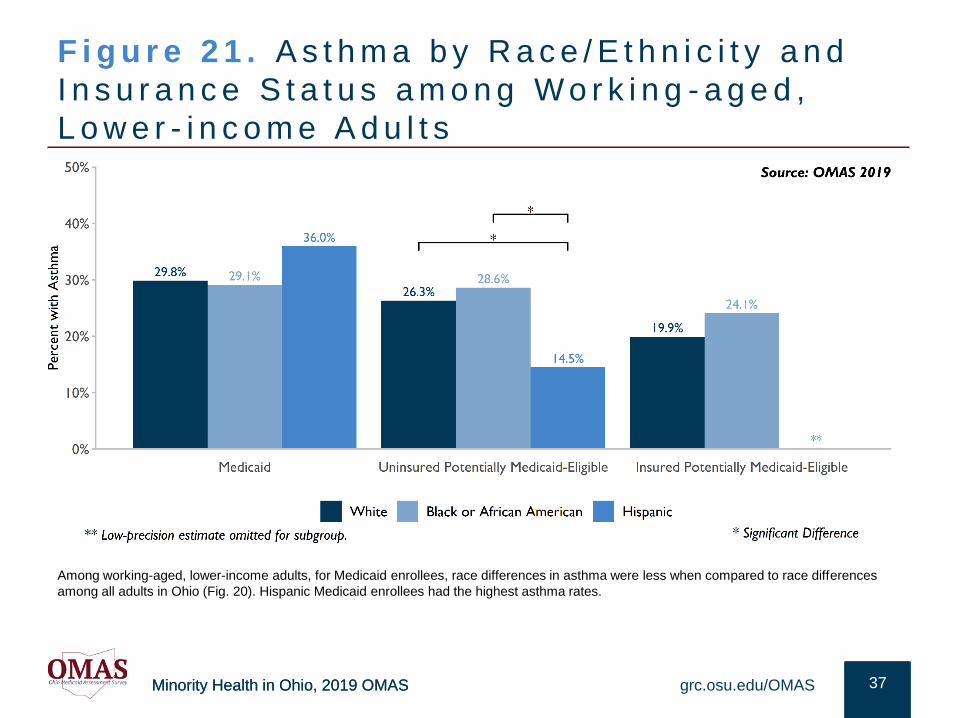
F i g u r e 2 1 . A s t h m a b y R a c e / E t h n i c i t y a n d
I n s u r a n c e S t a t u s a m o n g W o r k i n g - a g e d ,
L o w e r - i n c o m e A d u l t s
37grc.osu.edu/OMAS
Among working-aged, lower-income adults, for Medicaid enrollees, race differences in asthma were less when compared to race differences
among all adults in Ohio (Fig. 20). Hispanic Medicaid enrollees had the highest asthma rates.
Minority Health in Ohio, 2019 OMAS
OTH ER H EA LT H OU TC OM ESThe following section provides an overview of prevalence and trends in diverse
health outcomes among Black or African American, Hispanic and White Ohio
residents. Focus is on self-rated health and behavioral/mental health
impairment. The data on each outcome were not mutually exclusive, as some
people may experience multiple health challenges, and the data come from
multiple data sources.
Minority Health in Ohio, 2019 OMASMinority Health in Ohio, 2019 OMAS
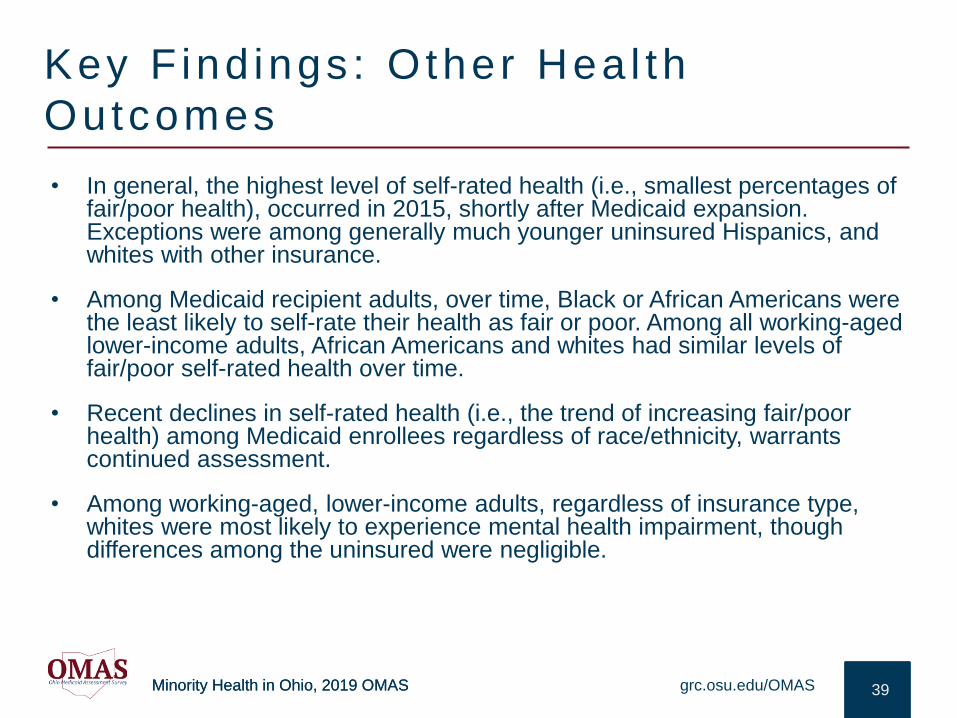
Key F ind ings : Other Hea l th
Outcomes
• In general, the highest level of self-rated health (i.e., smallest percentages of fair/poor health), occurred in 2015, shortly after Medicaid expansion. Exceptions were among generally much younger uninsured Hispanics, and whites with other insurance.
• Among Medicaid recipient adults, over time, Black or African Americans were the least likely to self-rate their health as fair or poor. Among all working-aged lower-income adults, African Americans and whites had similar levels of fair/poor self-rated health over time.
• Recent declines in self-rated health (i.e., the trend of increasing fair/poor health) among Medicaid enrollees regardless of race/ethnicity, warrants continued assessment.
• Among working-aged, lower-income adults, regardless of insurance type, whites were most likely to experience mental health impairment, though differences among the uninsured were negligible.
39grc.osu.edu/OMAS
Minority Health in Ohio, 2019 OMASMinority Health in Ohio, 2019 OMAS
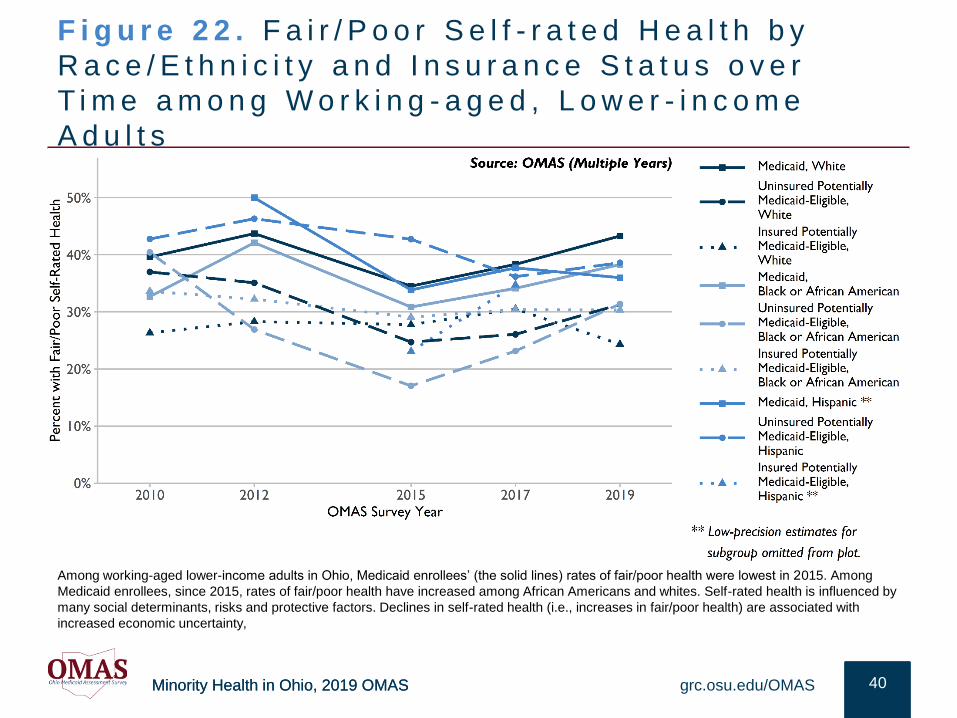
F i g u r e 2 2 . F a i r / P o o r S e l f - r a t e d H e a l t h b y
R a c e / E t h n i c i t y a n d I n s u r a n c e S t a t u s o v e r
T i m e a m o n g W o r k i n g - a g e d , L o w e r - i n c o m e
A d u l t s
40grc.osu.edu/OMAS
Among working-aged lower-income adults in Ohio, Medicaid enrollees’ (the solid lines) rates of fair/poor health were lowest in 2015. Among
Medicaid enrollees, since 2015, rates of fair/poor health have increased among African Americans and whites. Self-rated health is influenced by
many social determinants, risks and protective factors. Declines in self-rated health (i.e., increases in fair/poor health) are associated with
increased economic uncertainty,
Minority Health in Ohio, 2019 OMASMinority Health in Ohio, 2019 OMAS
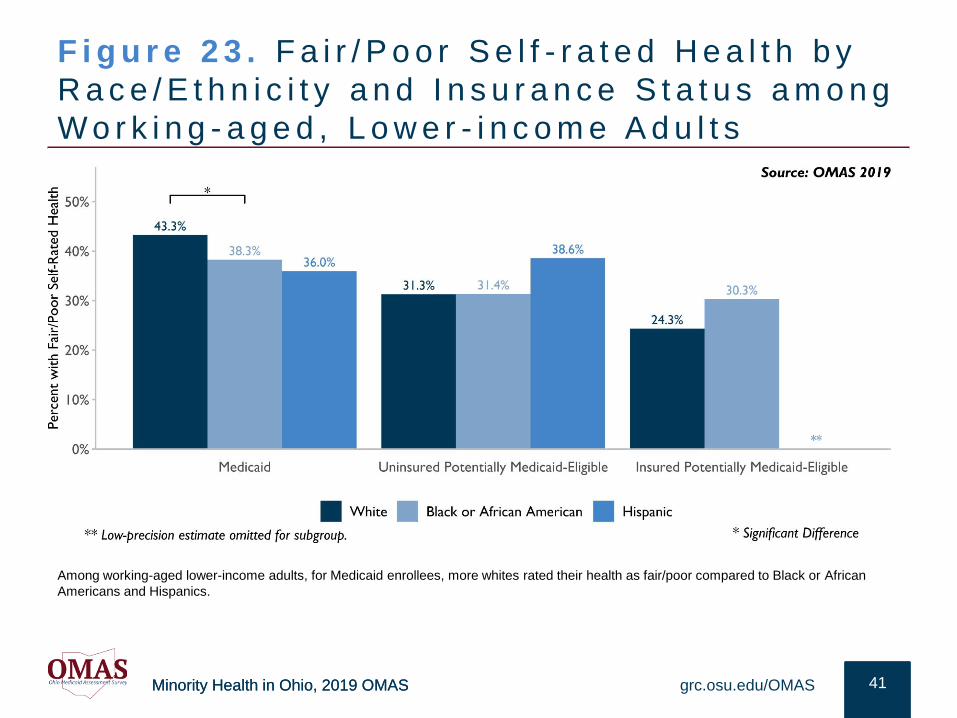
F i g u r e 2 3 . F a i r / P o o r S e l f - r a t e d H e a l t h b y
R a c e / E t h n i c i t y a n d I n s u r a n c e S t a t u s a m o n g
W o r k i n g - a g e d , L o w e r - i n c o m e A d u l t s
41grc.osu.edu/OMAS
Among working-aged lower-income adults, for Medicaid enrollees, more whites rated their health as fair/poor compared to Black or African
Americans and Hispanics.
Minority Health in Ohio, 2019 OMASMinority Health in Ohio, 2019 OMAS
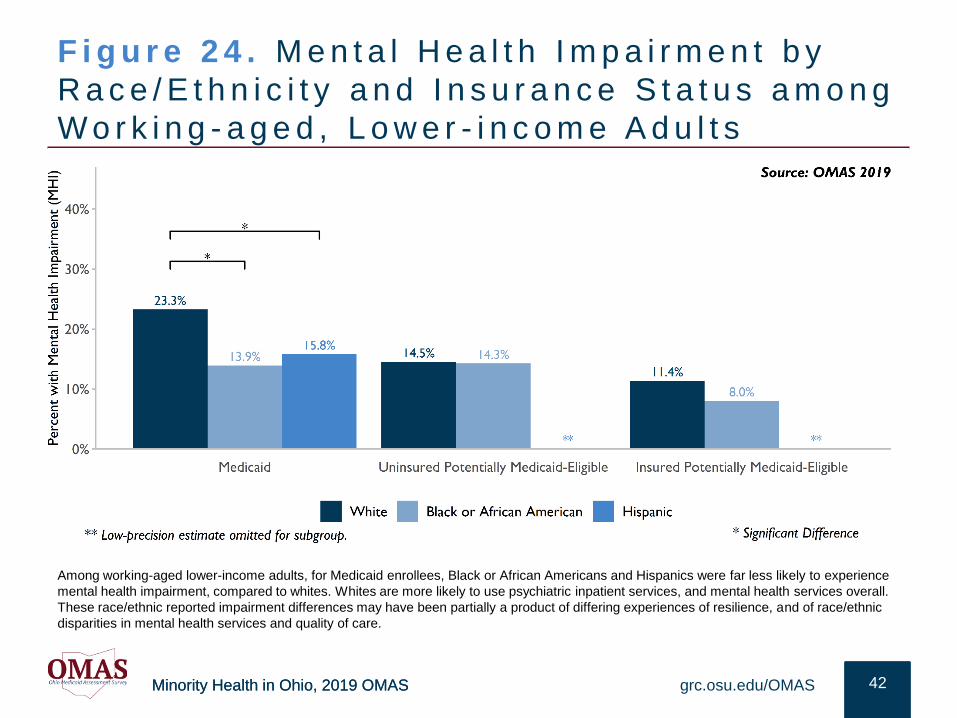
F i g u r e 2 4 . M e n t a l H e a l t h I m p a i r m e n t b y
R a c e / E t h n i c i t y a n d I n s u r a n c e S t a t u s a m o n g
W o r k i n g - a g e d , L o w e r - i n c o m e A d u l t s
42grc.osu.edu/OMAS
Among working-aged lower-income adults, for Medicaid enrollees, Black or African Americans and Hispanics were far less likely to experience
mental health impairment, compared to whites. Whites are more likely to use psychiatric inpatient services, and mental health services overall.
These race/ethnic reported impairment differences may have been partially a product of differing experiences of resilience, and of race/ethnic
disparities in mental health services and quality of care.
Minority Health in Ohio, 2019 OMAS
RESULT S: SUBSTA N C E USEThe following section provides an overview of prevalence and trends in
substance use for various racial and ethnic subgroups of Ohio residents.
Focus is on smoking, excessive drinking, and marijuana use. The data on
each outcome were not mutually exclusive, as some people may use
multiple substances.
Minority Health in Ohio, 2019 OMASMinority Health in Ohio, 2019 OMAS
Key Find ings: Substance Use
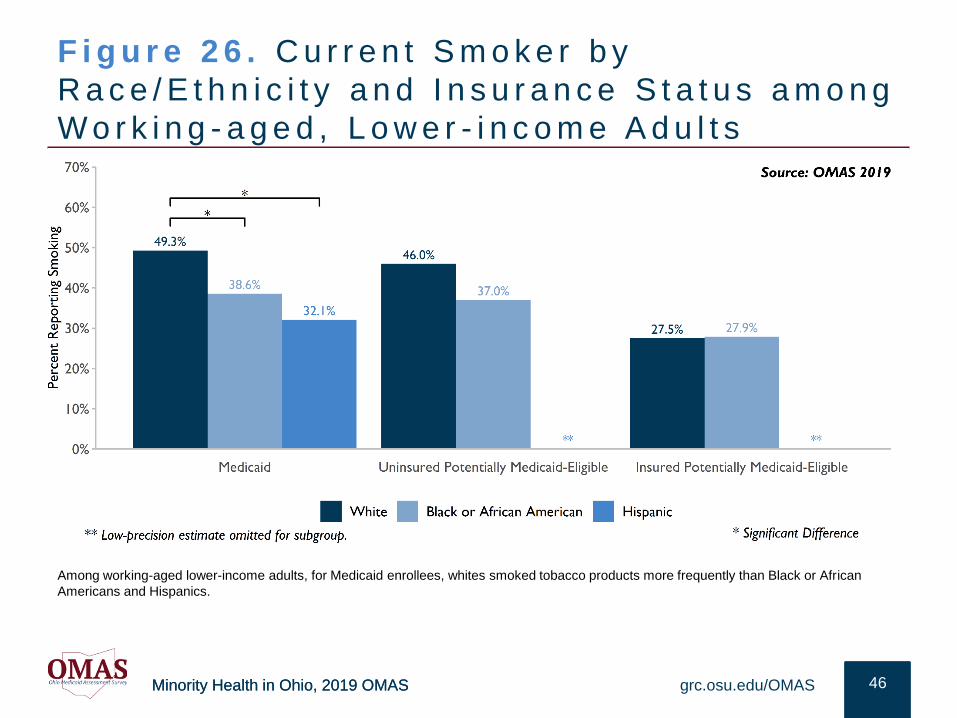
• Ohio ranks 7th among states of the U.S. in adult smoking percentage. Among all OMAS respondents, across all tobacco products, Black or African American men had the highest percentage of tobacco consumers, with Hispanic men having the next highest percentage. Among Medicaid enrollees, 49.3% of whites, 38.6% of African Americans, and 32.1% of Hispanic adults currently smoked.
• Among Ohioans, African American and Hispanic men have the highest percentages of marijuana consumption. African American men were almost twice as likely to smoke marijuana compared to White men. However, over time, these consumption differences and related health risks may be changing. Among young adults there were very small race/ethnic differences for both cigarettes and marijuana.
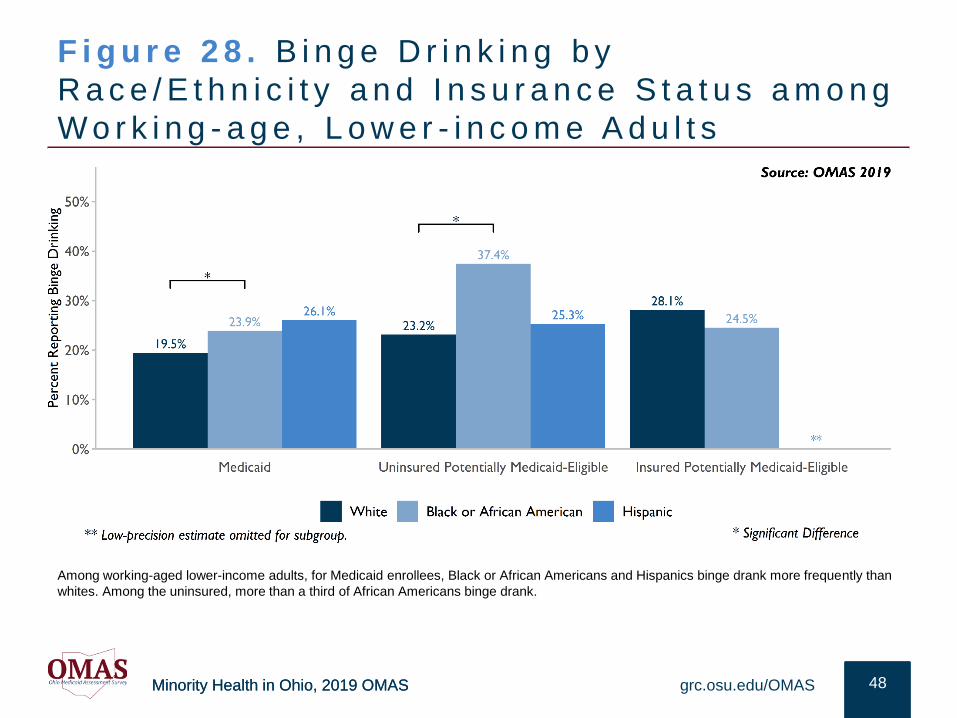
• Regarding excessive drinking, among adults with Medicaid Hispanics were more likely to binge drink than either whites or African Americans. However, among working-aged lower-income adults, uninsured African Americans were most likely to binge drink. When considering all OMAS respondents, Hispanic men had the highest percentage of excessive drinking
• United States Centers for Disease Control and Preventive data show that Ohio has the 19th highest opioid dispensing rate yet has the 4th highest overdose death rate in the U.S. whites had the highest overdose death rates, followed by African Americans and Hispanics.11
grc.osu.edu/OMAS 44
Minority Health in Ohio, 2019 OMASMinority Health in Ohio, 2019 OMAS
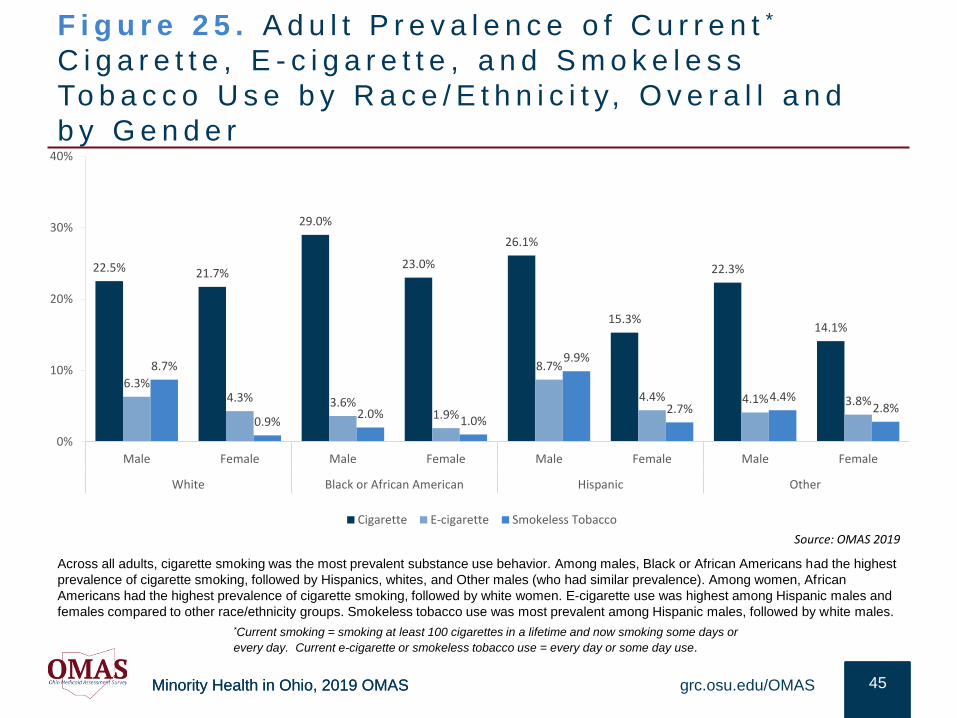
F i g u r e 2 5 . A d u l t P r e v a l e n c e o f C u r r e n t *
C i g a r e t t e , E - c i g a r e t t e , a n d S m o k e l e s s
To b a c c o U s e b y R a c e / E t h n i c i t y, O v e r a l l a n d
b y G e n d e r
45grc.osu.edu/OMAS
Across all adults, cigarette smoking was the most prevalent substance use behavior. Among males, Black or African Americans had the highest
prevalence of cigarette smoking, followed by Hispanics, whites, and Other males (who had similar prevalence). Among women, African
Americans had the highest prevalence of cigarette smoking, followed by white women. E-cigarette use was highest among Hispanic males and
females compared to other race/ethnicity groups. Smokeless tobacco use was most prevalent among Hispanic males, followed by white males.
*Current smoking = smoking at least 100 cigarettes in a lifetime and now smoking some days or
every day. Current e-cigarette or smokeless tobacco use = every day or some day use.
22.5% 21.7%
29.0%
23.0%
26.1%
15.3%
22.3%
14.1%
6.3%4.3% 3.6%
1.9%
8.7%
4.4% 4.1% 3.8%
8.7%
0.9%2.0%
1.0%
9.9%
2.7%4.4%
2.8%
0%
10%
20%
30%
40%
Male Female Male Female Male Female Male Female
White Black or African American Hispanic Other
Cigarette E-cigarette Smokeless Tobacco
Source: OMAS 2019
Minority Health in Ohio, 2019 OMASMinority Health in Ohio, 2019 OMAS
F i g u r e 2 6 . C u r r e n t S m o k e r b y
R a c e / E t h n i c i t y a n d I n s u r a n c e S t a t u s a m o n g
W o r k i n g - a g e d , L o w e r - i n c o m e A d u l t s
46grc.osu.edu/OMAS
Among working-aged lower-income adults, for Medicaid enrollees, whites smoked tobacco products more frequently than Black or African
Americans and Hispanics.
Minority Health in Ohio, 2019 OMASMinority Health in Ohio, 2019 OMAS
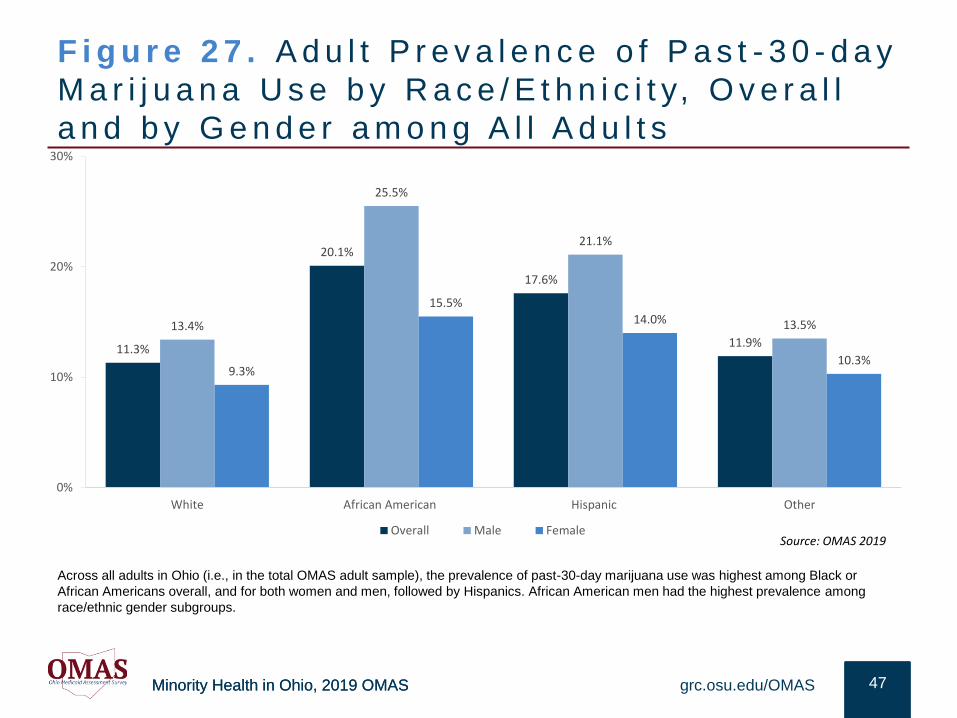
F i g u r e 2 7 . A d u l t P r e v a l e n c e o f P a s t - 3 0 - d a y
M a r i j u a n a U s e b y R a c e / E t h n i c i t y, O v e r a l l
a n d b y G e n d e r a m o n g A l l A d u l t s
47grc.osu.edu/OMAS
Across all adults in Ohio (i.e., in the total OMAS adult sample), the prevalence of past-30-day marijuana use was highest among Black or
African Americans overall, and for both women and men, followed by Hispanics. African American men had the highest prevalence among
race/ethnic gender subgroups.
11.3%
20.1%
17.6%
11.9%
13.4%
25.5%
21.1%
13.5%
9.3%
15.5%
14.0%
10.3%
0%
10%
20%
30%
White African American Hispanic Other
Overall Male FemaleSource: OMAS 2019
Minority Health in Ohio, 2019 OMASMinority Health in Ohio, 2019 OMAS
F i g u r e 2 8 . B i n g e D r i n k i n g b y
R a c e / E t h n i c i t y a n d I n s u r a n c e S t a t u s a m o n g
W o r k i n g - a g e , L o w e r - i n c o m e A d u l t s
48grc.osu.edu/OMAS
Among working-aged lower-income adults, for Medicaid enrollees, Black or African Americans and Hispanics binge drank more frequently than
whites. Among the uninsured, more than a third of African Americans binge drank.
Minority Health in Ohio, 2019 OMASMinority Health in Ohio, 2019 OMAS
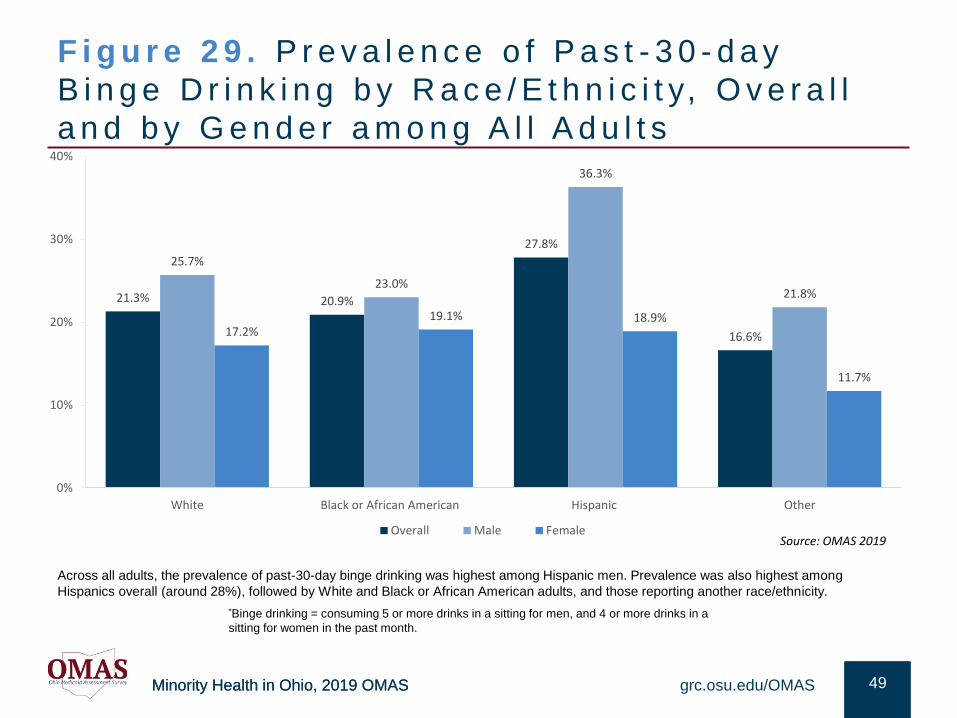
F i g u r e 2 9 . P r e v a l e n c e o f P a s t - 3 0 - d a y
B i n g e D r i n k i n g b y R a c e / E t h n i c i t y, O v e r a l l
a n d b y G e n d e r a m o n g A l l A d u l t s
49grc.osu.edu/OMAS
Across all adults, the prevalence of past-30-day binge drinking was highest among Hispanic men. Prevalence was also highest among
Hispanics overall (around 28%), followed by White and Black or African American adults, and those reporting another race/ethnicity.
*Binge drinking = consuming 5 or more drinks in a sitting for men, and 4 or more drinks in a
sitting for women in the past month.
21.3% 20.9%
27.8%
16.6%
25.7%
23.0%
36.3%
21.8%
17.2%19.1% 18.9%
11.7%
0%
10%
20%
30%
40%
White Black or African American Hispanic Other
Overall Male FemaleSource: OMAS 2019
Minority Health in Ohio, 2019 OMAS
R E S U LT S : E C O N O M I C C H A L L E N G E S
This section provides an overview of prevalence and trends in the experience
of economic challenges as a social determinant of health for various racial and
ethnic subgroups of Ohio residents. Focus was placed on housing burden,
food insecurity, and incarceration. Data on each outcome were not mutually
exclusive, as some people may experience simultaneous economic
challenges.
Minority Health in Ohio, 2019 OMASMinority Health in Ohio, 2019 OMAS
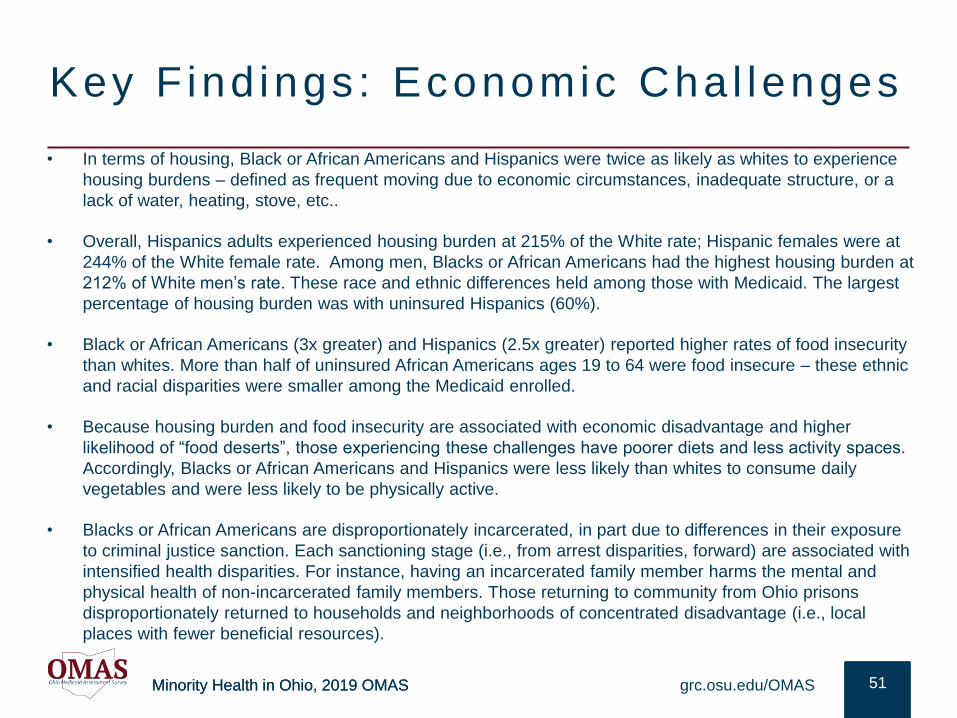
Key F ind ings : Economic Cha l lenges
• In terms of housing, Black or African Americans and Hispanics were twice as likely as whites to experience
housing burdens – defined as frequent moving due to economic circumstances, inadequate structure, or a
lack of water, heating, stove, etc..
• Overall, Hispanics adults experienced housing burden at 215% of the White rate; Hispanic females were at
244% of the White female rate. Among men, Blacks or African Americans had the highest housing burden at
212% of White men’s rate. These race and ethnic differences held among those with Medicaid. The largest
percentage of housing burden was with uninsured Hispanics (60%).
• Black or African Americans (3x greater) and Hispanics (2.5x greater) reported higher rates of food insecurity
than whites. More than half of uninsured African Americans ages 19 to 64 were food insecure – these ethnic
and racial disparities were smaller among the Medicaid enrolled.
• Because housing burden and food insecurity are associated with economic disadvantage and higher
likelihood of “food deserts”, those experiencing these challenges have poorer diets and less activity spaces.
Accordingly, Blacks or African Americans and Hispanics were less likely than whites to consume daily
vegetables and were less likely to be physically active.
• Blacks or African Americans are disproportionately incarcerated, in part due to differences in their exposure
to criminal justice sanction. Each sanctioning stage (i.e., from arrest disparities, forward) are associated with
intensified health disparities. For instance, having an incarcerated family member harms the mental and
physical health of non-incarcerated family members. Those returning to community from Ohio prisons
disproportionately returned to households and neighborhoods of concentrated disadvantage (i.e., local
places with fewer beneficial resources).
grc.osu.edu/OMAS 51
Minority Health in Ohio, 2019 OMASMinority Health in Ohio, 2019 OMAS
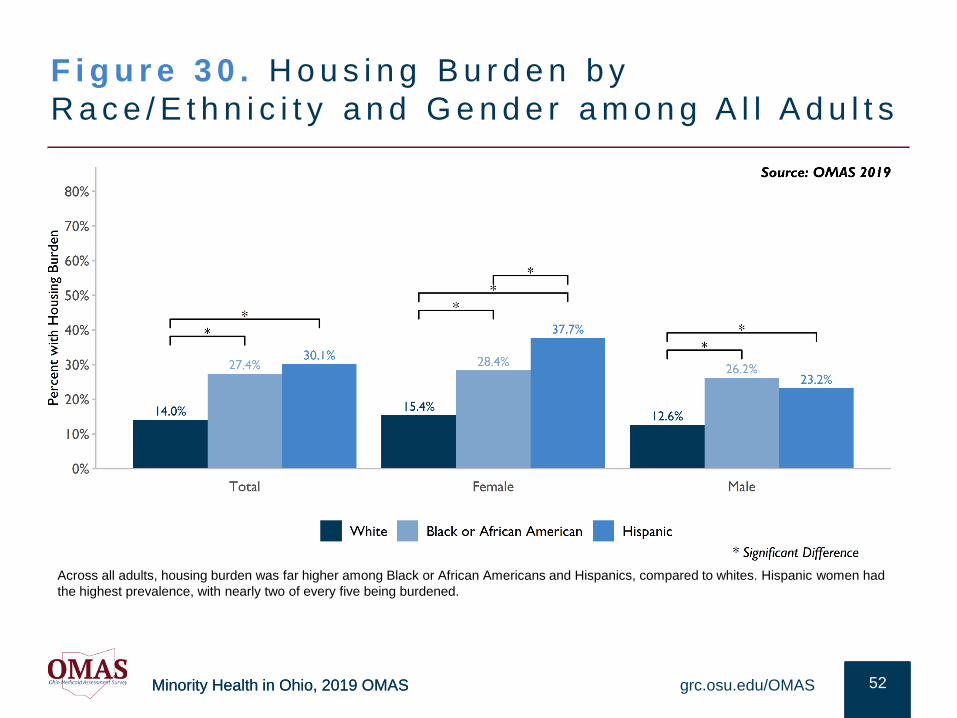
F i g u r e 3 0 . H o u s i n g B u r d e n b y
R a c e / E t h n i c i t y a n d G e n d e r a m o n g A l l A d u l t s
52grc.osu.edu/OMAS
Across all adults, housing burden was far higher among Black or African Americans and Hispanics, compared to whites. Hispanic women had
the highest prevalence, with nearly two of every five being burdened.
Minority Health in Ohio, 2019 OMASMinority Health in Ohio, 2019 OMAS
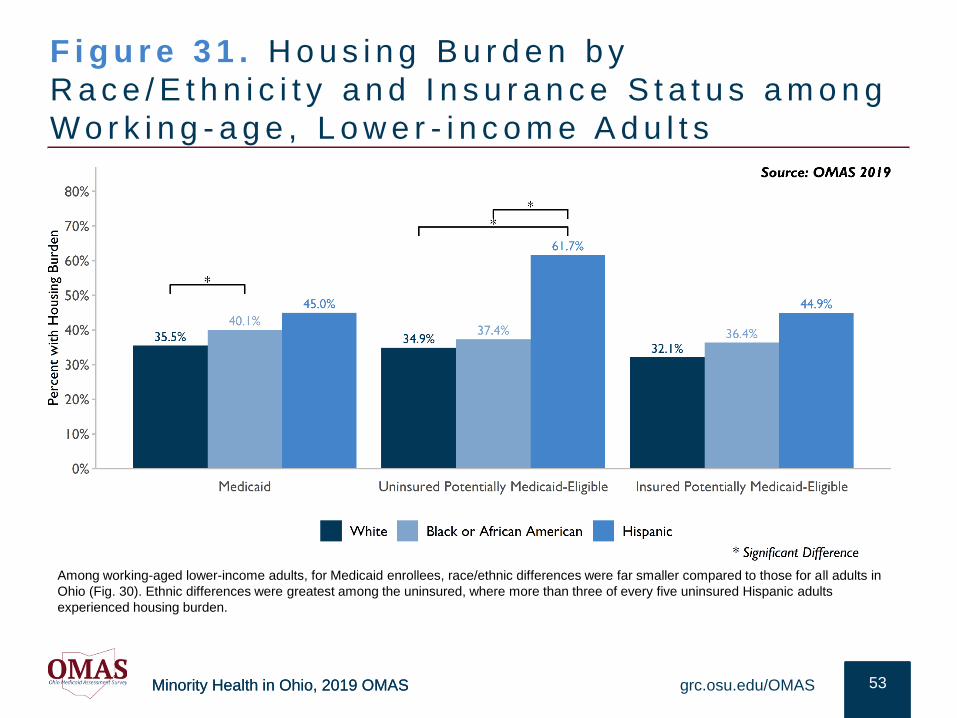
F i g u r e 3 1 . H o u s i n g B u r d e n b y
R a c e / E t h n i c i t y a n d I n s u r a n c e S t a t u s a m o n g
W o r k i n g - a g e , L o w e r - i n c o m e A d u l t s
53grc.osu.edu/OMAS
Among working-aged lower-income adults, for Medicaid enrollees, race/ethnic differences were far smaller compared to those for all adults in
Ohio (Fig. 30). Ethnic differences were greatest among the uninsured, where more than three of every five uninsured Hispanic adults
experienced housing burden.
Minority Health in Ohio, 2019 OMASMinority Health in Ohio, 2019 OMAS
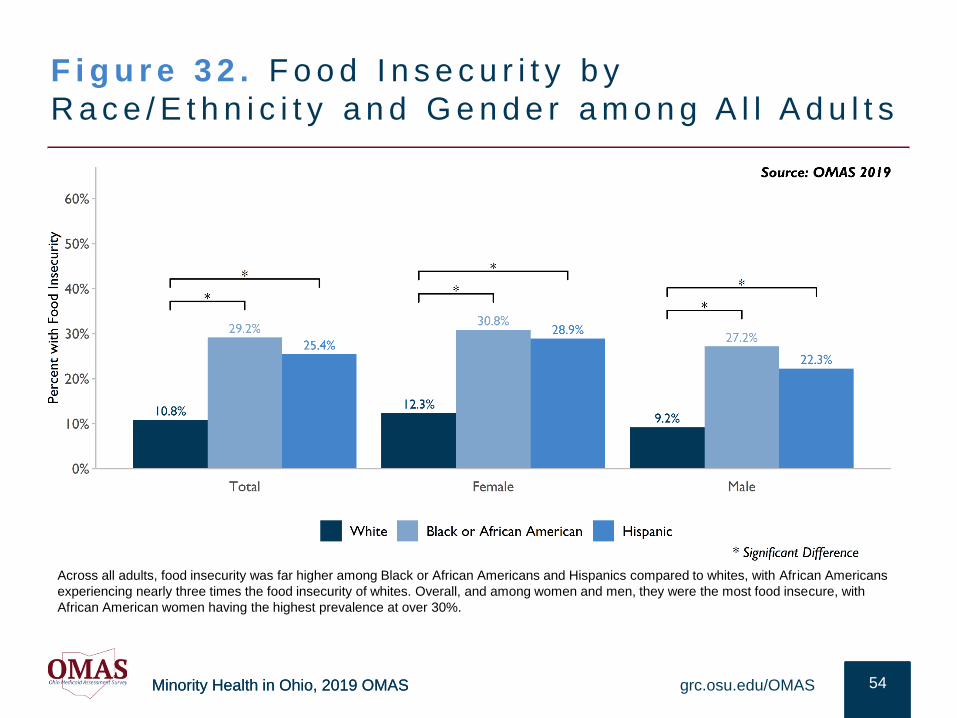
F i g u r e 3 2 . F o o d I n s e c u r i t y b y
R a c e / E t h n i c i t y a n d G e n d e r a m o n g A l l A d u l t s
54grc.osu.edu/OMAS
Across all adults, food insecurity was far higher among Black or African Americans and Hispanics compared to whites, with African Americans
experiencing nearly three times the food insecurity of whites. Overall, and among women and men, they were the most food insecure, with
African American women having the highest prevalence at over 30%.
Minority Health in Ohio, 2019 OMASMinority Health in Ohio, 2019 OMAS
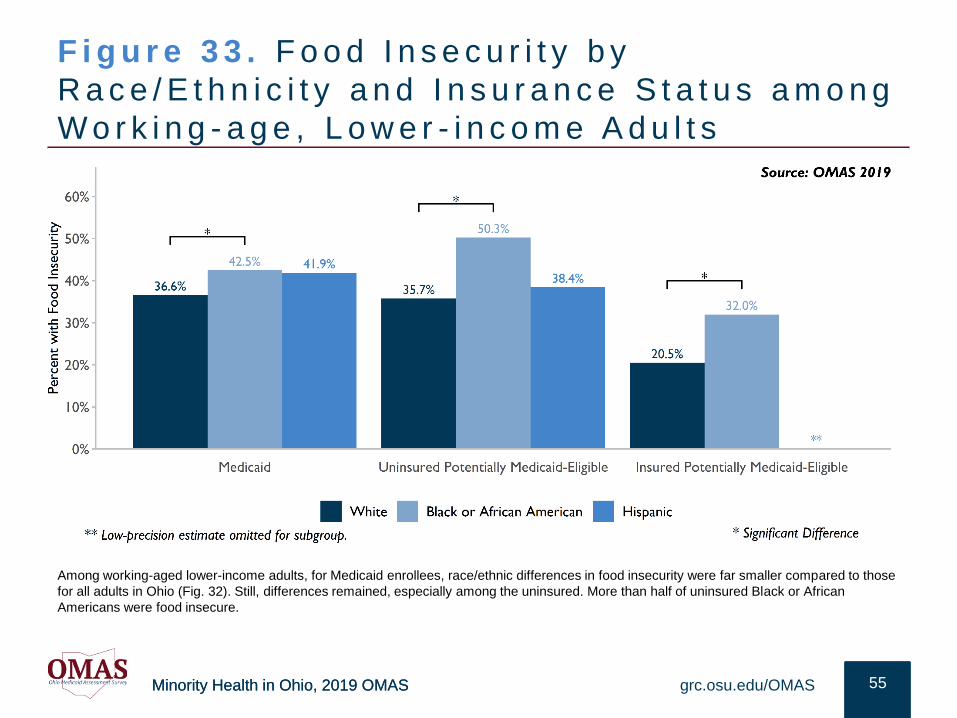
F i g u r e 3 3 . F o o d I n s e c u r i t y b y
R a c e / E t h n i c i t y a n d I n s u r a n c e S t a t u s a m o n g
W o r k i n g - a g e , L o w e r - i n c o m e A d u l t s
55grc.osu.edu/OMAS
Among working-aged lower-income adults, for Medicaid enrollees, race/ethnic differences in food insecurity were far smaller compared to those
for all adults in Ohio (Fig. 32). Still, differences remained, especially among the uninsured. More than half of uninsured Black or African
Americans were food insecure.
Minority Health in Ohio, 2019 OMASMinority Health in Ohio, 2019 OMAS
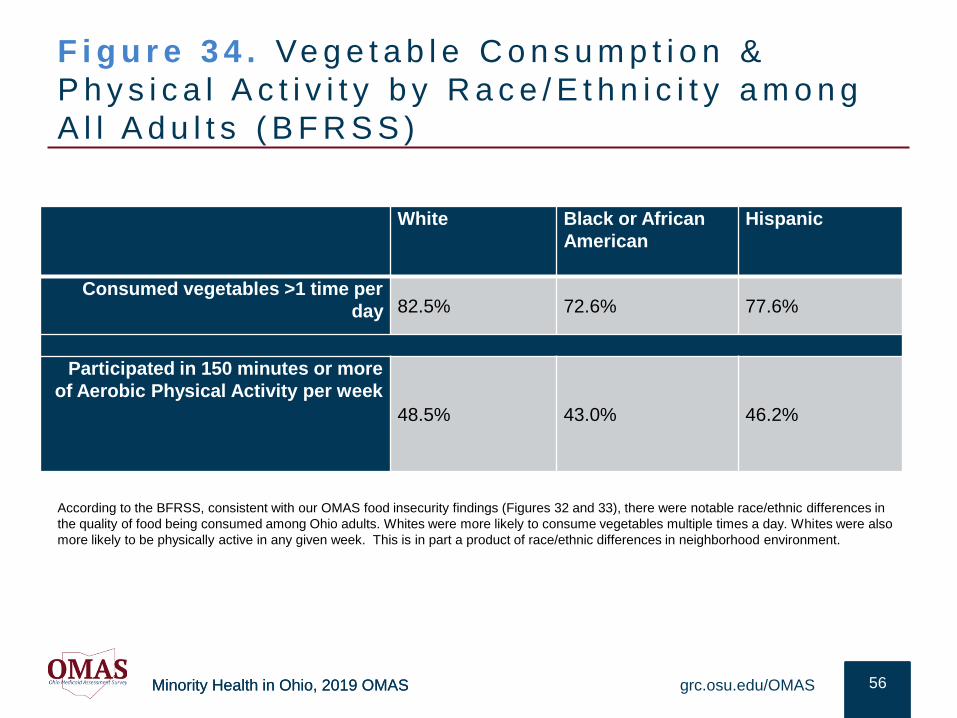
F i g u r e 3 4 . Ve g e t a b l e C o n s u m p t i o n &
P h y s i c a l A c t i v i t y b y R a c e / E t h n i c i t y a m o n g
A l l A d u l t s ( B F R S S )
56grc.osu.edu/OMAS
According to the BFRSS, consistent with our OMAS food insecurity findings (Figures 32 and 33), there were notable race/ethnic differences in
the quality of food being consumed among Ohio adults. Whites were more likely to consume vegetables multiple times a day. Whites were also
more likely to be physically active in any given week. This is in part a product of race/ethnic differences in neighborhood environment.
White Black or African
American
Hispanic
Consumed vegetables >1 time per
day 82.5% 72.6% 77.6%
Participated in 150 minutes or more
of Aerobic Physical Activity per week
48.5% 43.0% 46.2%
Minority Health in Ohio, 2019 OMASMinority Health in Ohio, 2019 OMAS
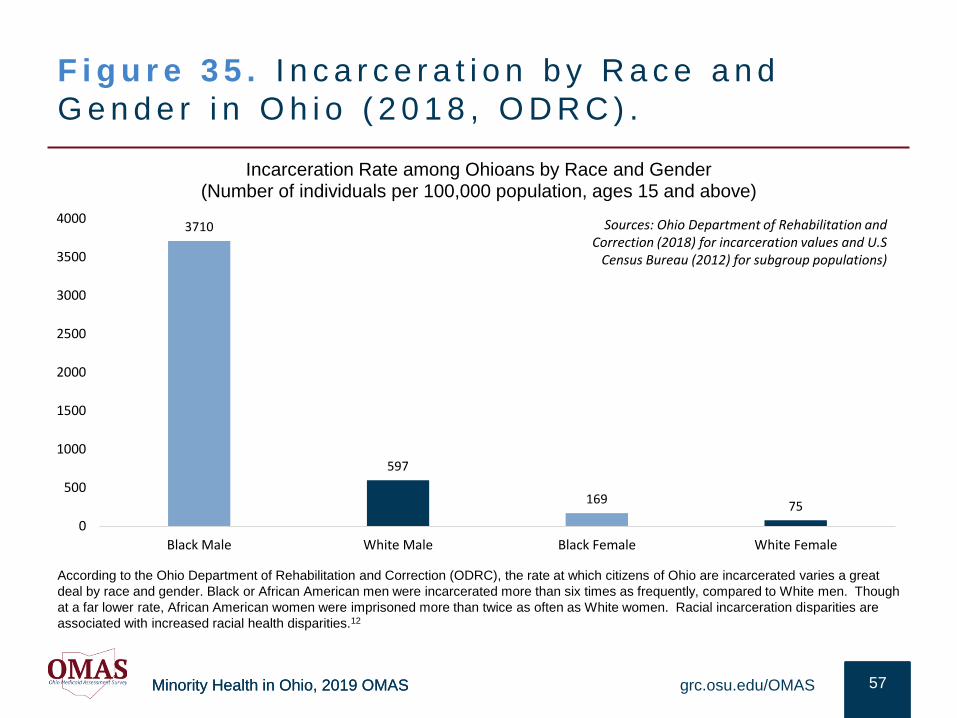
F i g u r e 3 5 . I n c a r c e r a t i o n b y R a c e a n d
G e n d e r i n O h i o ( 2 0 1 8 , O D R C ) .
57grc.osu.edu/OMAS
According to the Ohio Department of Rehabilitation and Correction (ODRC), the rate at which citizens of Ohio are incarcerated varies a great
deal by race and gender. Black or African American men were incarcerated more than six times as frequently, compared to White men. Though
at a far lower rate, African American women were imprisoned more than twice as often as White women. Racial incarceration disparities are
associated with increased racial health disparities.12
3710
597
16975
0
500
1000
1500
2000
2500
3000
3500
4000
Black Male White Male Black Female White Female
Incarceration Rate among Ohioans by Race and Gender(Number of individuals per 100,000 population, ages 15 and above)
Sources: Ohio Department of Rehabilitation and Correction (2018) for incarceration values and U.S
Census Bureau (2012) for subgroup populations)
Minority Health in Ohio, 2019 OMASMinority Health in Ohio, 2019 OMAS
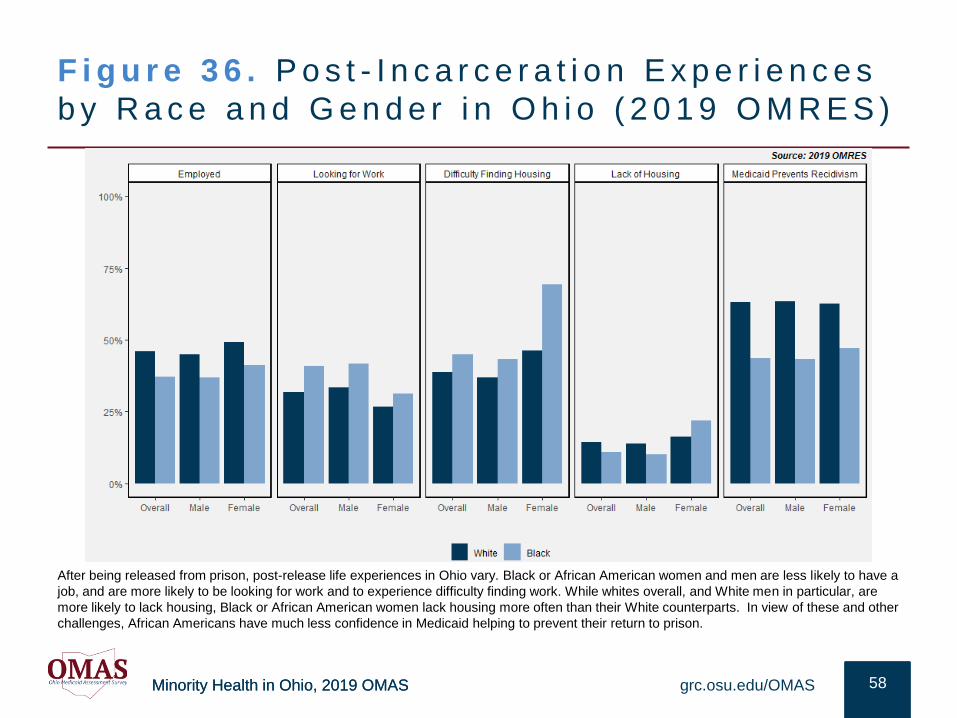
F i g u r e 3 6 . P o s t - I n c a r c e r a t i o n E x p e r i e n c e s
b y R a c e a n d G e n d e r i n O h i o ( 2 0 1 9 O M R E S )
58grc.osu.edu/OMAS
After being released from prison, post-release life experiences in Ohio vary. Black or African American women and men are less likely to have a
job, and are more likely to be looking for work and to experience difficulty finding work. While whites overall, and White men in particular, are
more likely to lack housing, Black or African American women lack housing more often than their White counterparts. In view of these and other
challenges, African Americans have much less confidence in Medicaid helping to prevent their return to prison.
Minority Health in Ohio, 2019 OMASMinority Health in Ohio, 2019 OMAS
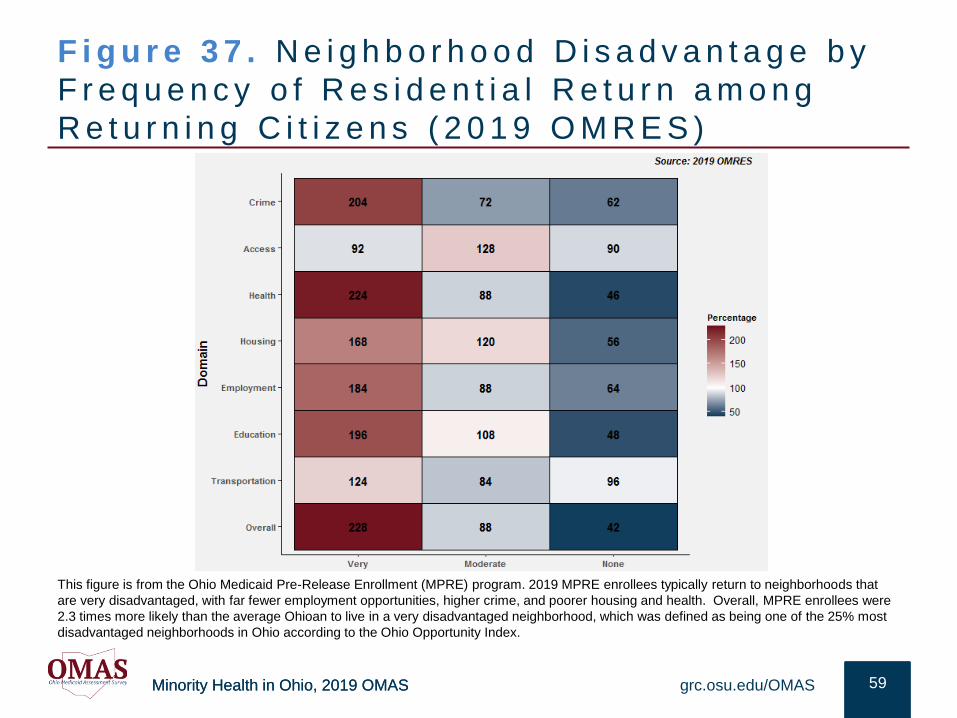
F i g u r e 3 7 . N e i g h b o r h o o d D i s a d v a n t a g e b y
F r e q u e n c y o f R e s i d e n t i a l R e t u r n a m o n g
R e t u r n i n g C i t i z e n s ( 2 0 1 9 O M R E S )
59grc.osu.edu/OMAS
This figure is from the Ohio Medicaid Pre-Release Enrollment (MPRE) program. 2019 MPRE enrollees typically return to neighborhoods that
are very disadvantaged, with far fewer employment opportunities, higher crime, and poorer housing and health. Overall, MPRE enrollees were
2.3 times more likely than the average Ohioan to live in a very disadvantaged neighborhood, which was defined as being one of the 25% most
disadvantaged neighborhoods in Ohio according to the Ohio Opportunity Index.
Minority Health in Ohio, 2019 OMAS
R E L AT I O N S H I P T O P R I O R R E S E A R C H
The following section considers the key findings of the Executive Summary in
relation to prior research.
Minority Health in Ohio, 2019 OMASMinority Health in Ohio, 2019 OMAS
SUMMARY OF RESULTS
Social Determinants of Health & Chronic Conditions. Race/ethnic health disparities in Ohio are persistent and pervasive. For example, for heart disease mortality, Blacks have a 45% death rate compared to whites at 25%. Black or African Americans die at a 77% higher age adjusted death rate than whites from diabetes. Yet, for some aspects of health, whites fair worse than Blacks/African Americans (e.g., mental health, current smokers among Medicaid recipients). While some disparities are partly explained by differences in health behavior (e.g., diet, exercise), they are largely associated with social determinants, perhaps as much as 50%. Reducing inequities in health requires renewed attention to the underlying systems that may initiate and sustain differences that drive inequities.
Race/ethnic health disparities and behavioral differences exist because of disparities in social determinants of health such as wealth, education, housing, and criminal justice exposure. Once racial/ethnic differences in the social determinants of health are accounted for, many disparities largely disappear.
Structural Inequality. Poor access to supermarkets has been associated with increased obesity and neighborhoods with increased walkability have been associated with lower obesity. “Better” neighborhoods are associated with better insulin sensitivity and decreased diabetes risk. “Lesser” neighborhoods are associated with increased smoking, physical inactivity and higher blood pressure.13 Thus, many
health disparities are grounded in community disparities, a long history of structural inequality, and policy practices that reinforcing disparities.
Access to Care. Consistent with the findings of this chartbook, a great deal of prior research has demonstrated that U.S. racial and ethnic minorities are: (1) Less likely to receive preventive medical treatments than whites; (2) more likely to receive lower-quality care; (3) often disparately targeted for tobacco and alcohol consumption; and, (4) more likely to experience negative outcomes from these dynamics that increase race/ethnic health disparities.8, 14
Even after taking into account relevant individual and social determinants including income, neighborhood, comorbid illnesses, and health insurance type, many African American and Hispanics health outcomes are still worse than those of whites.4, 14
Public policy can make helpful contributions to the reduction of health inequities, including those related to health care training in racial/ethnic equity, improving the culturally sensitivity of public health outreach, and mandating racial/ethnic equity as a strategic priority.
grc.osu.edu/OMAS 61
Visit grc.osu.edu/OMAS for additional
information about OMAS, including public use files,
codebooks, and methods
Minority Health in Ohio, 2019 OMASMinority Health in Ohio, 2019 OMAS
POLICY CONSIDERATIONS
Access to care. Many of the policies in the Affordable Care Act (ACA) are important because of improved health care access and reduced health disparities associated with improved access. As noted by the U.S. Department of Health and Human Services, the ACA has substantially reduced the level of uninsured whites, African Americans and Hispanics. Expanded access is among the policy means to reduce disparities 4, 9
Health monitoring. Sustaining funding for the detailed measurement of health and health disparities within institutions and providers can contribute to evidence-based strategies of action for change and health care improvements dependent on thorough evidence
Housing. Strengthening initiatives that can reduce the severe housing burden experienced by so many, and the food insecurity often associated with it are important. Reducing housing burden through vouchers or other subsidies would allow housing burdened households to spend resources on other things besides sustaining reliable residence. This could indirectly contribute to various health and well-being outcomes 7, 14
Medicaid. Medicaid coverage is associated with reduced race/ethnic disparities in various health outcomes. Broadening Medicaid resources and reach can make many beneficial contributions. Disparities in the comorbidities of COVID risk
(e.g., obesity, hypertension) have made the need for broadening these resources more apparent to contribute to a healthier Ohio.
Structural barriers. Focusing on policy interdependencies could be useful, since addressing social determinants of health will require tackling issues that are beyond the health care system’s capacity to address. These include resource deficiencies to meet social needs, such as affordable housing, and structural and institutional biases and racism 14
grc.osu.edu/OMAS 62
Visit grc.osu.edu/OMAS for additional
information about OMAS, including public use files,
codebooks, and methods
Minority Health in Ohio, 2019 OMASMinority Health in Ohio, 2019 OMAS
POLICY CONSIDERATIONSP r i o r R e s e a r c h
Consistent with our chartbook findings, prior research suggests that:
• Policy strategies that address health care disparities and expand organizational capacity to address racism can include equipping health care professionals with cultural and linguistic competency skill and initiating implicit bias training. diversifying the health care workforce and boards
• Education is a foundational resource that drives health seeking behaviors and informs health outcomes. Policy efforts to increase graduation rates to impact health status, increase access to affordable housing and increased employment opportunities can impact health equity. Policy strategies can focus on building and investing in healthy, affordable and walkable communities. In addition, policy can focus on decreasing the wealth gap. As individuals transition off Medicaid, being able to sustain affordable health care is essential for improving health outcomes
• Addressing racial and ethnic equity as a strategic priority may drive improved health outcomes for Ohioans. Any policy initiative may benefit from considering its tangible impact on greater equity.
• Policy strategies can include incentivizing providers to make regular examination of health outcomes by race/ethnicity and implementing disparity reduction efforts,
• Expanding and diversifying the health care workforce to increase access to culturally and linguistically appropriate care also underpin efforts to address disparities.14 This includes provisions within the ACA that can enhance capacity of the health care workforce, and making permanent those provisions that are time-limited;
• As suggested by a noted Harvard professor, one of the most respected researchers in this area, “new research is needed to identify the optimal strategies to build political will and support to address social inequities in health. This will include initiatives to…build empathy and support for addressing [structural] inequities, enhance the capacity of individuals and communities to actively participate in reduc[ing] racial prejudice, ideologies, and stereotypes that undergird policy preferences that initiate and sustain inequities” 14
grc.osu.edu/OMAS 63
Visit grc.osu.edu/OMAS for additional
information about OMAS, including public use files,
codebooks, and methods
Minority Health in Ohio, 2019 OMASMinority Health in Ohio, 2019 OMAS
REFERENCES
1. Du Bois, WEB. 1906. The Health and Physique of the Negro American. Atlanta: The Atlanta University Press
2. Institute of Medicine. 2003. Unequal Treatment: Confronting Racial and Ethnic Disparities in Health Care. Washington, DC: The National Academies Press. https://doi.org/10.17226/12875.
3. Institute of Medicine. 2001. Health and Behavior: The Interplay of Biological, Behavioral, and Societal Influences. Washington, DC: The National Academies Press.
4. Williams, DR, Lawrence, JA and Davis, BA. 2019. Racism and Health: Evidence and Needed Research. Annual Review of Public Health 40:105-125. doi.org/10.1146/annurev-publhealth-040218-043750.
5. Cunningham TJ, Croft JB, Liu Y, Lu H, Eke PI, Giles WH. Vital Signs: Racial Disparities in Age-Specific Mortality Among Blacks or Black or African Americans — United States, 1999–2015. MMWR Morb Mortal Wkly Rep 2017;66:444–456. DOI: http://dx.doi.org/10.15585/mmwr.mm6617e1External.
6. Ng, JH., Ward, LM, Shea, M, Hart, Lt, Guerino, P and Scholle, SH.. 2019. Explaining the Relationship Between Minority Group Status and Health Disparities: A Review of Selected Concepts. Health Equity 3:47-60
7. Beyer, Kristen M.M., Purushottam, LW, Zhou, Y, Nartinger, AB. 2019. Housing discrimination and racial cancer disparities among the 100 largest US metropolitan areas. 125: 3818-3827. doi.org/10.1002/cncr.32358.
8. U.S. Department of Health and Human Services, Agency for Healthcare Research and Quality. 2018 National Healthcare Quality and Disparities Report. Rockville, MD: Agency for Healthcare Research and Quality; September 2019. AHRQ Pub. No. 19-0070-EF.
9. Zimmerman, FJ., Anderson, NW. 2019. Trends in Health Equity in the United States by Race/Ethnicity, Sex, and Income, 1993-2017. JAMA Network Open 2: e199357. doi: 10.1001/jamanetworkopen.2019.6386.
10. 2020. World Population Review.
https://worldpopulationreview.com/state-rankings/obesity-rate-by-state..
11. Centers for Disease Control and Prevention (CDC), National Center for Health Statistics. Multiple Cause of Death 1999-2018 on CDC WONDER Online Database, released 2020. Data are from the Multiple Cause of Death Files, 1999-2018, as compiled from data provided by the 57 vital statistics jurisdictions through the Vital Statistics Cooperative Program.
12. Massoglia, M, Remster B. 2019. Linkages Between Incarceration and Health. Public Health Reports 134(Supplement 1): 8S-14S.
13. Spanakis EK, Golden SH. Race/ethnic difference in diabetes and diabetic complications. Curr Diab Rep. 2013;13(6):814-823. doi:10.1007/s11892-013-0421-9.
14. Williams DR, Cooper LA. Reducing Racial Inequities in Health: Using What We Already Know to Take Action. International Journal of Environmental Research and Public Health. 2019; 16(4):606.
15. Ohio Department of Rehabilitation and Correction (2008). 2007 Annual Report. State of Ohio. Retrieved March 12, 2008 from http://www.drc.state.oh.us/web/Reports/Annual/Annual%20Report%202007.pdf
16. U.S. Census Bureau. (2012). 2009-2011 American Community Survey 3-year Public Use Microdata Samples [SAS Data file]. Retrieved from https://factfinder.census.gov/faces/nav/jsf/pages/searchresults.xhtml?refresh=t
17. Health Policy Institute of Ohio Staff. 2020. Health Data Brief. Ohio COVID-19 disparities by race, May 20, 2020. Retrieved from https://piquaoh.org/download/racism/Ohio-COVID-19-Disparities-by-Race.pdf
18. Braveman P, Arkin E, Orleans T, Proctor D, and Plough A. 2017. What Is Health Equity? And What Difference Does a Definition Make? Princeton, NJ: Robert Wood Johnson Foundation.
grc.osu.edu/OMAS 64
500 Fifth St. N.W. | Washington, D.C. 20001
Copyright © 2020 National Academy of Sciences. All rights reserved
500 Fifth St. N.W. | Washington, D.C. 20001
Copyright © 2020 National Academy of Sciences. All rights reserved
Minority Health in Ohio, 2019 OMASMinority Health in Ohio, 2019 OMAS
ACKNOWLEDGEMENTS
grc.osu.edu/OMAS 65