Embed Size (px)
Citation preview
A probabilistic approach for A probabilistic approach for plant diversity monitoring in a plant diversity monitoring in a
European European NaturaNatura2000 network2000 network
AlessandroAlessandro Chiarucci, Chiarucci,GiovanniGiovanni Bacaro, Bacaro,DuccioDuccio Rocchini* Rocchini*
Department of Environmental Science “G. Sarfatti”Department of Environmental Science “G. Sarfatti”University of Siena, ItalyUniversity of Siena, Italy
**TerraData EnvironmetricsTerraData Environmetrics, www.terradata.it, www.terradata.it
49° IAVS Annual Conference - Palmerston North, New Zealand, 12-16 Feb 2007
22
Nature Reserve NetworksNature Reserve NetworksA high number of protected areas is spread in European A high number of protected areas is spread in European countries, often arranged in territorial networks.countries, often arranged in territorial networks.
In Europe, the In Europe, the Natura 2000Natura 2000 is the most important network is the most important network pf protected areas and it is supposed to preserve almost pf protected areas and it is supposed to preserve almost all the terrestrial species and habitats.all the terrestrial species and habitats.
The following specific objective has been set: The following specific objective has been set: “to achieve by 2010 a significant reduction of the current “to achieve by 2010 a significant reduction of the current rate of biodiversity loss at the global, regional and rate of biodiversity loss at the global, regional and national level".national level".
To understand if the existing reserve networks can To understand if the existing reserve networks can achieveme of this objective we need to quantify in an achieveme of this objective we need to quantify in an affordable way how much biodiversity is present within it affordable way how much biodiversity is present within it and how it is changing through time!and how it is changing through time!

49° IAVS Annual Conference - Palmerston North, New Zealand, 12-16 Feb 2007
33
Plant species diversityPlant species diversityVascular plants are the most important component of Vascular plants are the most important component of most terrestrial ecosystems because of their functional most terrestrial ecosystems because of their functional and structural role.and structural role.
The quantification and the monitoring of plant species The quantification and the monitoring of plant species diversity represents thus essential steps for the diversity represents thus essential steps for the management of protected areas and for understanding management of protected areas and for understanding how these are changing through time.how these are changing through time.
With this project we aimed to develop and test a method With this project we aimed to develop and test a method for evaluating and monitoring plant species diversity for evaluating and monitoring plant species diversity within a territorial Natura2000 Network, based on a within a territorial Natura2000 Network, based on a sample approach. sample approach.
This method is based on a constrained sampling effort This method is based on a constrained sampling effort and a high potential for spatial inference.and a high potential for spatial inference.
49° IAVS Annual Conference - Palmerston North, New Zealand, 12-16 Feb 2007
44
Assessment of plant species diversityAssessment of plant species diversity
Assessing and monitoring plant species diversity over very Assessing and monitoring plant species diversity over very large and fragmented areas is a really difficult task. Large large and fragmented areas is a really difficult task. Large databases are presently available but they present many databases are presently available but they present many problems for spatial and temporal inference.problems for spatial and temporal inference.
Some national and local monitoring programs use remote Some national and local monitoring programs use remote sensing, mapping or structural indicators.sensing, mapping or structural indicators.
Taxonomic information is still an essential data source for Taxonomic information is still an essential data source for describing and monitoring, biodiversity, at least until the describing and monitoring, biodiversity, at least until the potential use of other indicators will be clearer. potential use of other indicators will be clearer.
However, it is virtually impossible to get complete lists of However, it is virtually impossible to get complete lists of species for large areas. It is also very difficult to use the species for large areas. It is also very difficult to use the records when they are collected on non-homogeneous records when they are collected on non-homogeneous criteria.criteria.
49° IAVS Annual Conference - Palmerston North, New Zealand, 12-16 Feb 2007
55
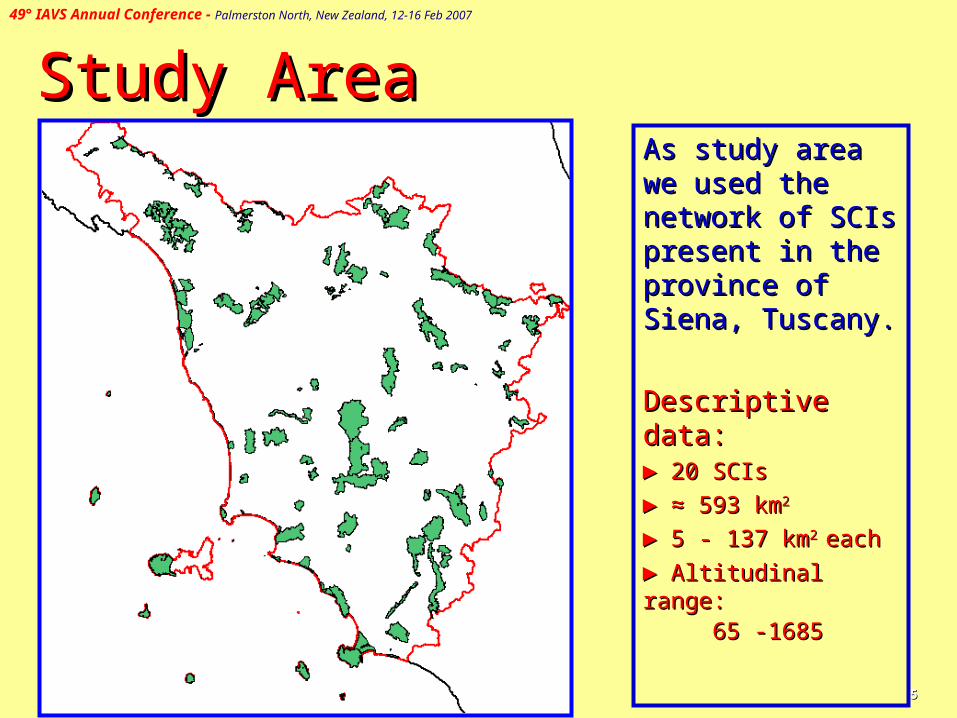
Study AreaStudy AreaAs study area we As study area we used the network of used the network of SCIs present in the SCIs present in the province of Siena, province of Siena, Tuscany.Tuscany.
Descriptive data:Descriptive data:► ► 20 SCIs20 SCIs
► ≈ ► ≈ 593 km593 km22
► ► 5 - 137 km5 - 137 km2 2 eacheach
► ► Altitudinal range:Altitudinal range: 65 -1685 65 -1685
49° IAVS Annual Conference - Palmerston North, New Zealand, 12-16 Feb 2007
66
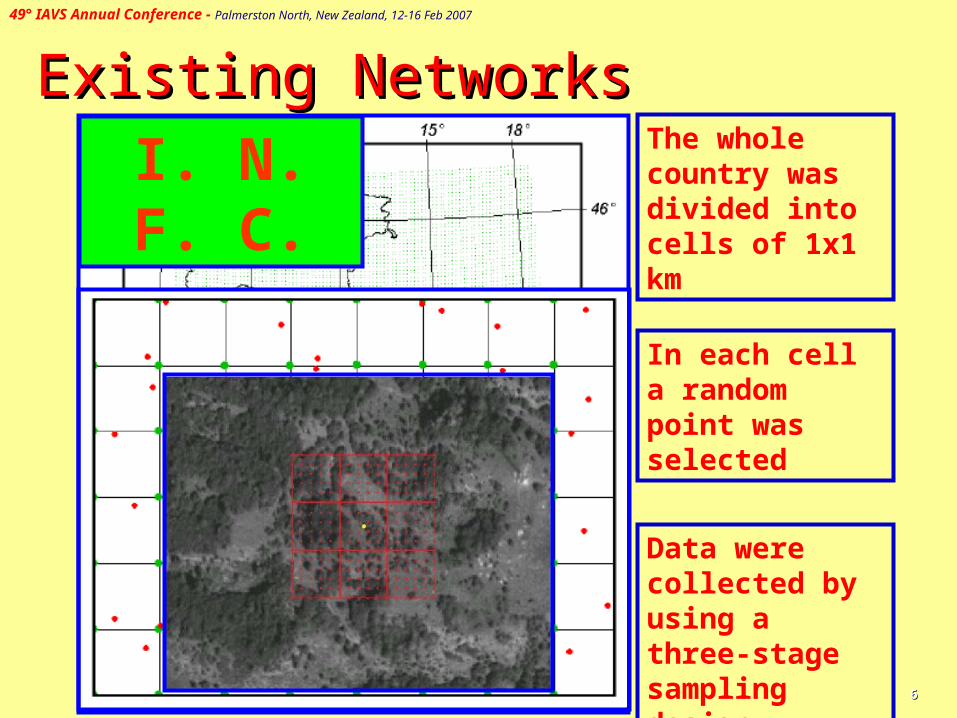
Existing NetworksExisting NetworksThe whole country was divided into cells of 1x1 km
In each cell a random point was selected
Data were collected by using a three-stage sampling design
I. N. F. C.
49° IAVS Annual Conference - Palmerston North, New Zealand, 12-16 Feb 2007
77
Sampling designSampling design
# # ###### # # ## ##
####### ## ####### ###
######## ## # ## ### ###########
#### #### ## ## ## ######## ###### ###
######### ### # # ##################
############## ##### ######## #############
####### #### ## ## ### ## ######## ## ###########
# ####### ### #### ## ### #####
####### ### #########
###### ##### ############# ########################
######### ##
###### ###### #### #####################
### ###### ################ ###### ##### ## ## ######## ####
## ### ## ##########
###################
#####
# ######## ## ### ## #### ######## ######## ####### ###
#################
# ### ###### ######## ########################
#### ### ######## ### ### ####### ##
### ######### ############## ############### ##
## ### ######## ### #####
#### ######### #### ####
###### ### ##### ###### ## ###### ##### ### ########### ## ########
###### ###############
###### #### ### ############ ### ########## #### ##########
# ####### #####
###### ############################# #####
############### #
####### #### ##### ### ## ####### ## ######
# ## ####### ################# ########## #### ####
#########
## ###### ######## ################## ### ############# ######
## ################ ################ ### ## ##
# ########### #
# ###
########### ####### ## ##### ## ## ################ ########
# ####
###############
# #######
## ############ ## ## ############
## ##
####################
##### ############ ### ## ####### ### ####
######## ############## ###################
## #######
## #######
###### ## ## ######## #### ########### ##### #####
######### ######
##### #### ##
#### ## #### ######### #### ##### ###
######## ######## ##
########## ######## ###
### ###### ### ######### ######### ########
#
####### ## #### ### ##### ############### #
####### #### ###
###########
#### # ### #### ### ### ############## ## ############# ############ ### #### ###
# #### ##### ######### #
###### ## ##### ####### ######## ####
# ######## ########
########### ## ############# ### ##### ##########
##################### #### ####
#### ##### ####### ######################### ## ############ #### ########
#####
#### ############ #####
## ### ## ############ ## ###### ####### ######## ## ########
#############
###### ##### ## ####
## ### ####### ##### ## ###### ### ### #####
########
###### #
########## ### ###### ### ### ##
##### ## ################ #########
# #######
##### ########## ### ########### ## #### #######
### ###### ########
############ # # #
### ### ##### ########### ####### ##
#### ### ########### ################## ### #
## ##### ########### ### ## ####### ##### #######
#### ###### ####### ############
## ### ## ########## ########## ######### ############## #### ###### ####### ####
##### ######## ######### ####### ##########
##### ############## ###### #####
# ########
#################### ### ############## #### #### ### ######### ## #
#### ########## ### ### #######
## #
###### #### ## ######### ######## ####### ###
# ###### ## ## ### ######### ## ##### ##### #### ############ ####### ##
#######
#
####### ### ############ ###### ## ### ######### ########### ###### #### ######
# ## ###### ######## ###########
### ### ## ### ## ############# ########
####
# ### ###### #### ################## ### ### ######## #####
###### ##### ## ####### ##### ######### ###
### ######
#### ## #### ###### ###########
############ ######## ##
######
####### #####
########## ### ######## ## ###### ##
##### ### ##
## ## ### ### ###### ########## ##
### ##### ####
######### ### ######## ##
##### ################### #####
######### ## ### ### ######### ######## ##### ####### ####
################### #### ### #########
# ######### ## ###
# ####### ####### ####
######### ###### ### ######
##### #
## ##############
## ########
### ### #### ### #### #### #
### ########
### ## ########## ##### ########## #####
##
### ######## ##### #############
####### ##########
#
#### ###### ############# ######## ########
#####
####### # ######
# #######################
# # ############ ## ########## ####
######### ### #### #### ########## ##########
######## ## ####
## ## ## ###### ##### ########
### ######### #######
### ###
#### ## ## ## ######### ### #### ##########
##### #### ##### ########### ####
#### ### ######## ######## ####### #### ################# ##
# #############
#### ## ####### ## #########
######## ##
### ####### ######## #######
### ###### ############## ###
## ## ##### #########
######
### ###### ###
#### ###
### ##### ####### # ##
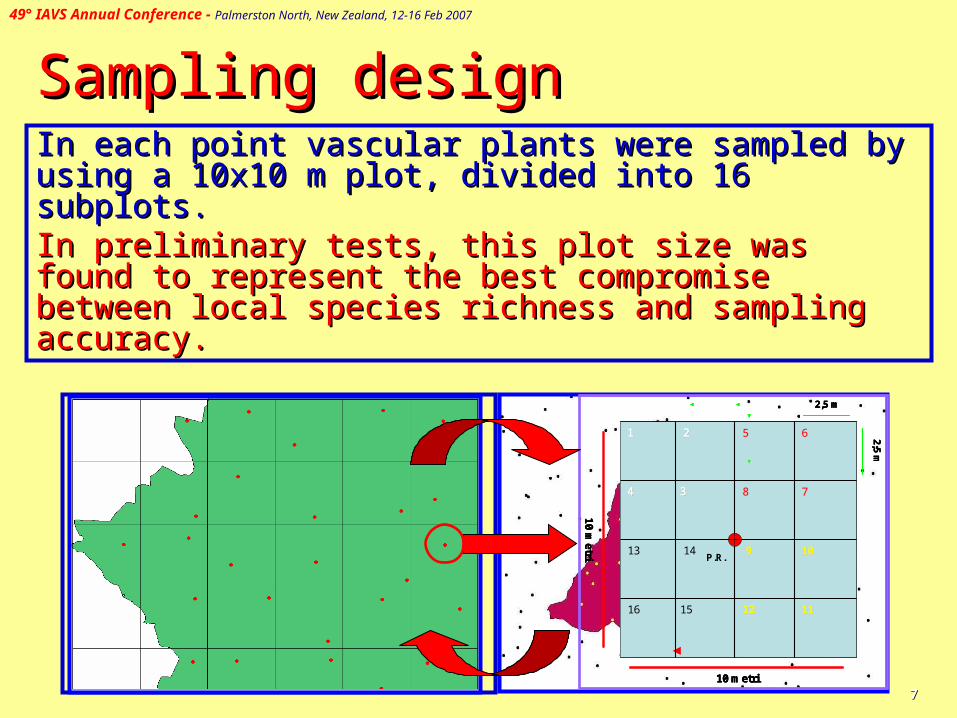
In each point vascular plants were sampled by using In each point vascular plants were sampled by using a 10x10 m plot, divided into 16 subplots.a 10x10 m plot, divided into 16 subplots.In preliminary tests, this plot size was found to In preliminary tests, this plot size was found to represent the best compromise between local represent the best compromise between local species richness and sampling accuracy.species richness and sampling accuracy.
10 m
etri
10 metri
P.R.
2,5 m
2,5 m
111 222 55 66
77333 88
14
444
13
1212
1010
1516 1111
99
10 m
etri
10 metri
P.R.
2,5 m
2,5 m
10 m
etri
10 metri
P.R.
2,5 m
2,5 m
111 222 55 66
77333 88
14
444
13
1212
1010
1516 1111
99
49° IAVS Annual Conference - Palmerston North, New Zealand, 12-16 Feb 2007
88
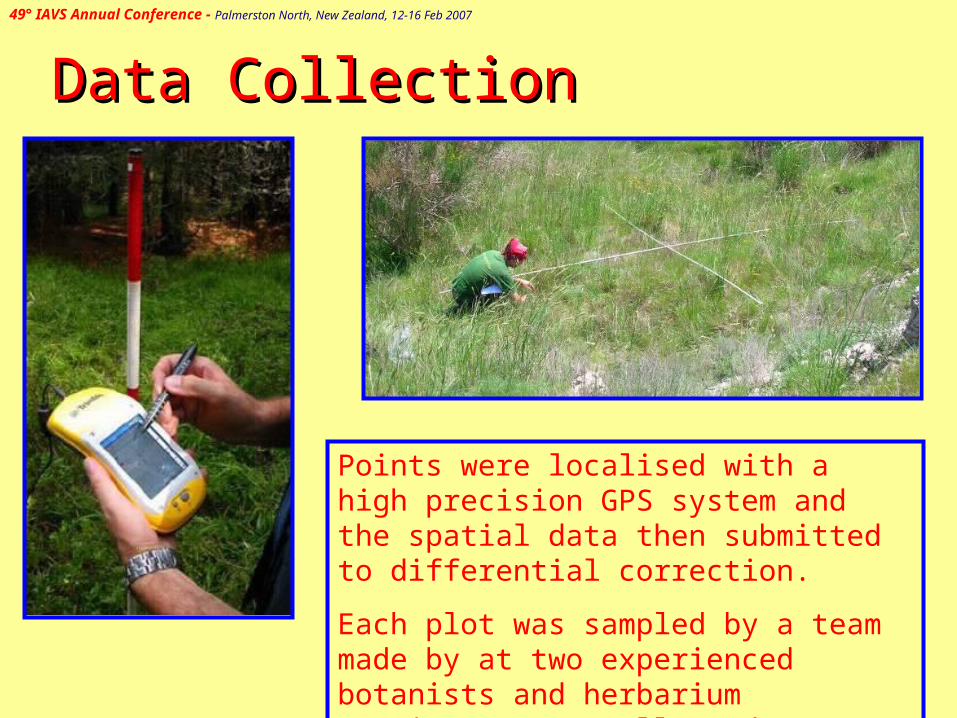
Points were localised with a high precision GPS system and the spatial data then submitted to differential correction.
Each plot was sampled by a team made by at two experienced botanists and herbarium specimens were collected.
Data CollectionData Collection

49° IAVS Annual Conference - Palmerston North, New Zealand, 12-16 Feb 2007
99
Floristic data were stored on a web-based relational database that guarantees the preservation of the data and their easy access to all the authorised users, for both research and management aims.
Data storageData storage
49° IAVS Annual Conference - Palmerston North, New Zealand, 12-16 Feb 2007
1010
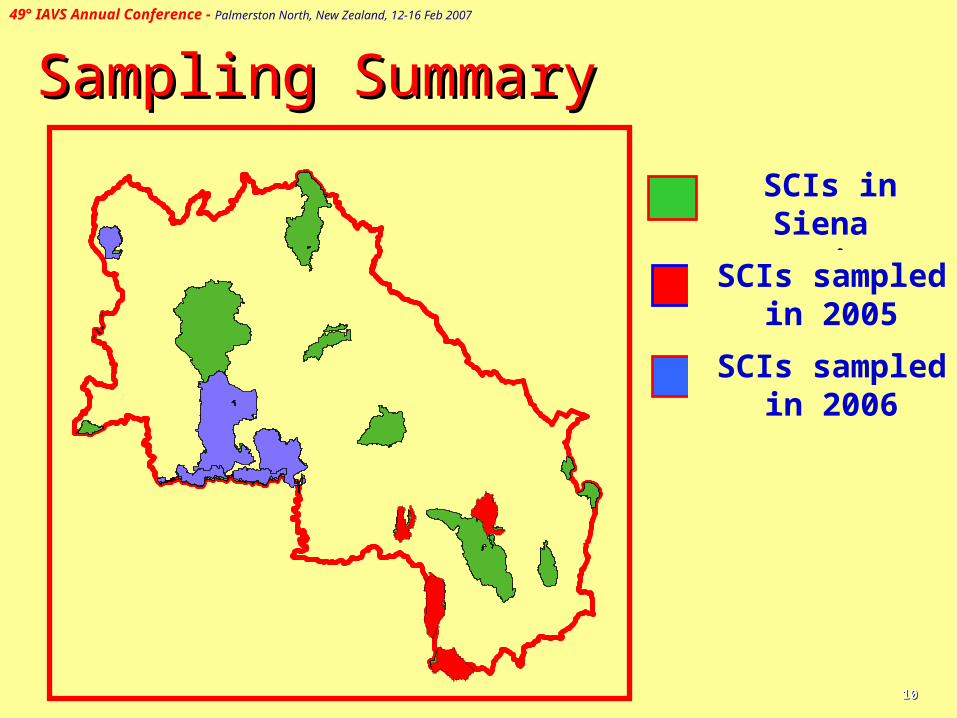
Sampling SummarySampling Summary
SCIs in Siena Province
SCIs sampled in 2006
SCIs sampled in 2005
49° IAVS Annual Conference - Palmerston North, New Zealand, 12-16 Feb 2007
1111
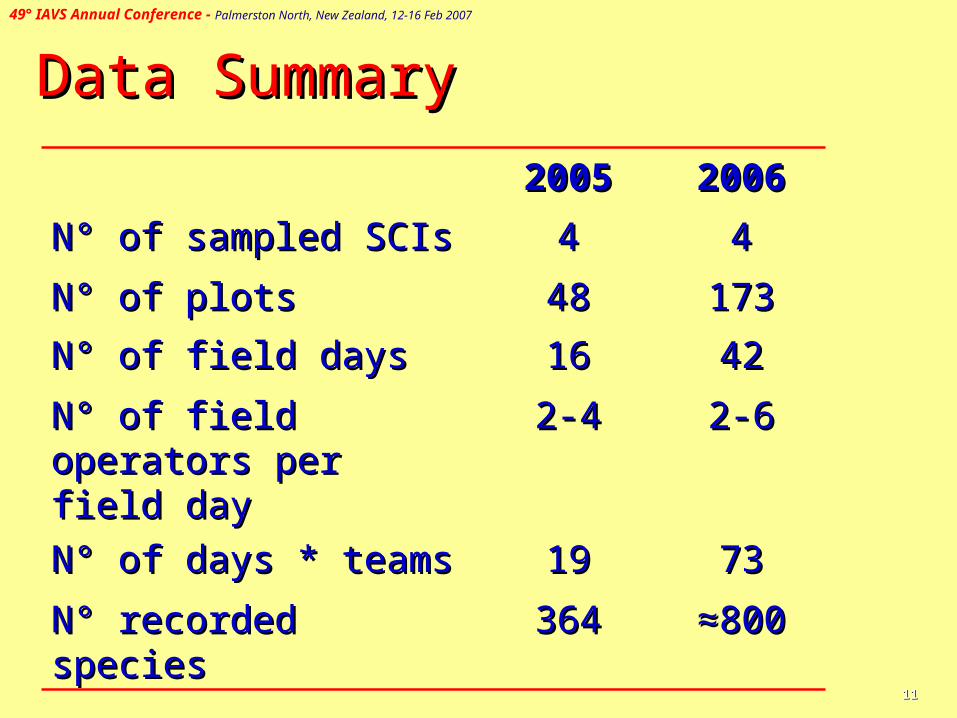
Data SummaryData Summary
20052005 20062006
N° of sampled SCIsN° of sampled SCIs 44 44
N° of plotsN° of plots 4848 173173
N° of field daysN° of field days 1616 4242
N° of field operators per N° of field operators per field dayfield day
2-42-4 2-62-6
N° of days * teamsN° of days * teams 1919 7373
N° recorded speciesN° recorded species 364364 ≈≈800800
49° IAVS Annual Conference - Palmerston North, New Zealand, 12-16 Feb 2007
1212
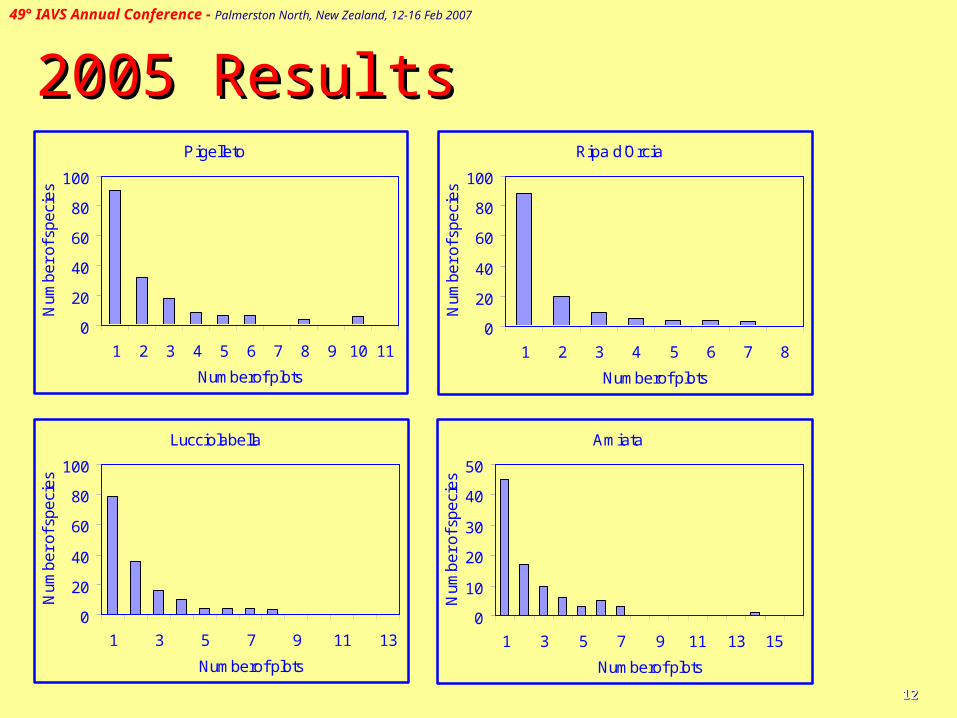
2005 Results2005 ResultsPigelleto
0
20
40
60
80
100
1 2 3 4 5 6 7 8 9 10 11
Numberof plots
Nu
mb
er
of s
pe
cie
s
Lucciolabella
0
20
40
60
80
100
1 3 5 7 9 11 13
Numberof plots
Nu
mb
er
of s
pe
cie
s
Ripa d'Orcia
0
20
40
60
80
100
1 2 3 4 5 6 7 8
Numberof plots
Nu
mb
er
of s
pe
cie
sAmiata
0
10
20
30
40
50
1 3 5 7 9 11 13 15
Numberof plots
Nu
mb
er
of s
pe
cie
s
49° IAVS Annual Conference - Palmerston North, New Zealand, 12-16 Feb 2007
1313
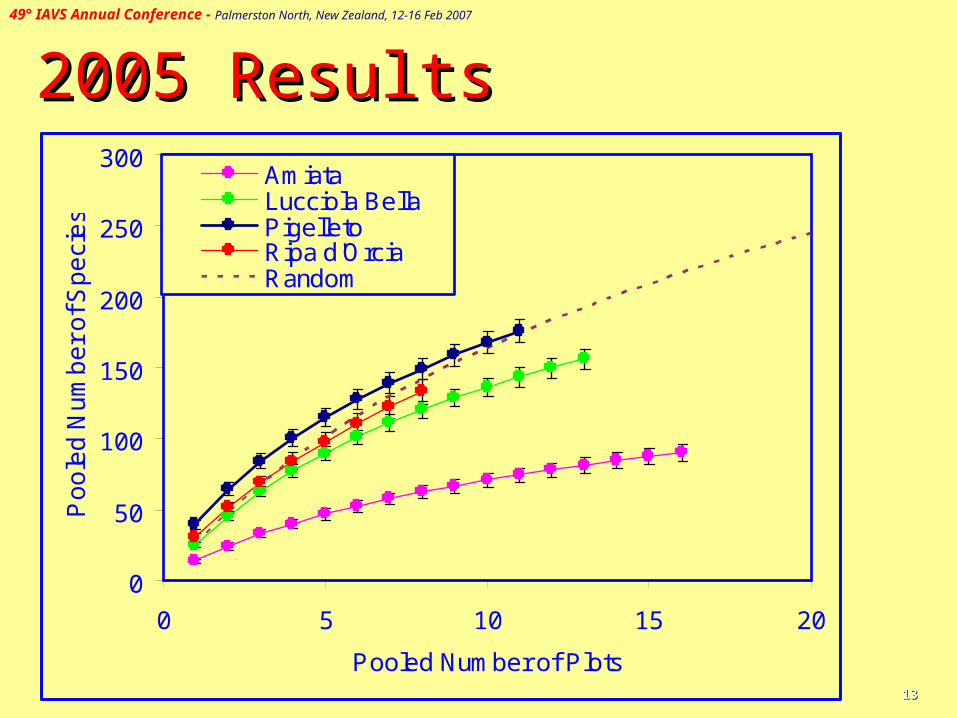
2005 Results2005 Results
0
50
100
150
200
250
300
0 5 10 15 20
Pooled Number of Plots
Po
ole
d N
um
be
r o
f Sp
eci
es
AmiataLucciola BellaPigelletoRipa d'OrciaRandom
49° IAVS Annual Conference - Palmerston North, New Zealand, 12-16 Feb 2007
1414
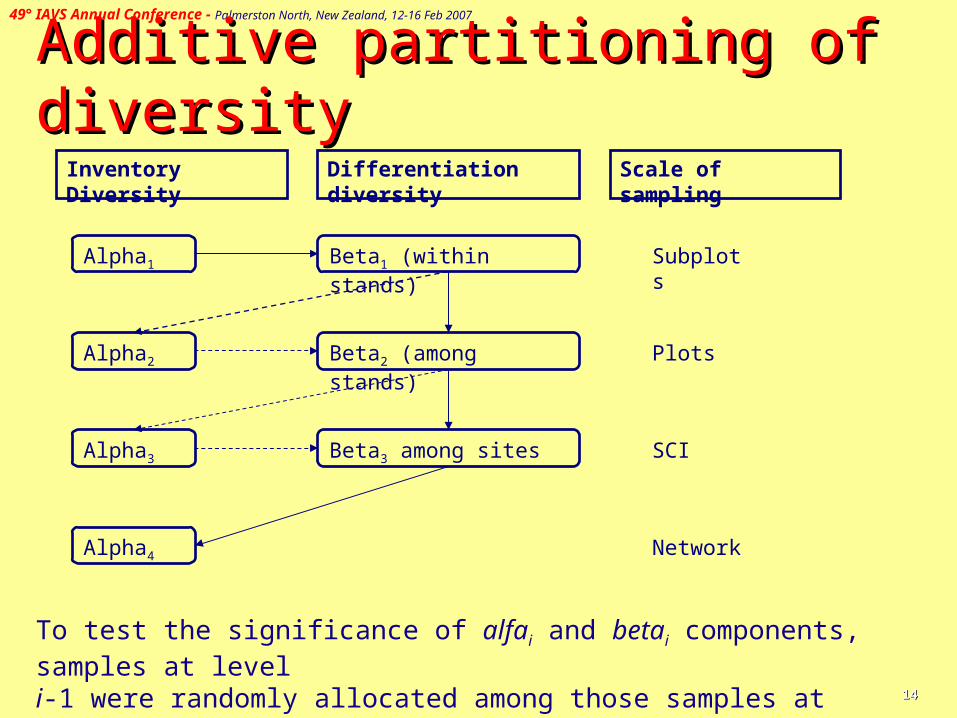
Additive partitioning of diversityAdditive partitioning of diversityInventory Diversity Differentiation diversity Scale of sampling
Alpha1
Plots
SCIBeta3 among sites
Alpha2
Alpha3
NetworkAlpha4
Beta2 (among stands)
SubplotsBeta1 (within stands)
To test the significance of alfai and betai components, samples at level i-1 were randomly allocated among those samples at level i that belong to the same sample unit at i+1.
49° IAVS Annual Conference - Palmerston North, New Zealand, 12-16 Feb 2007
1515
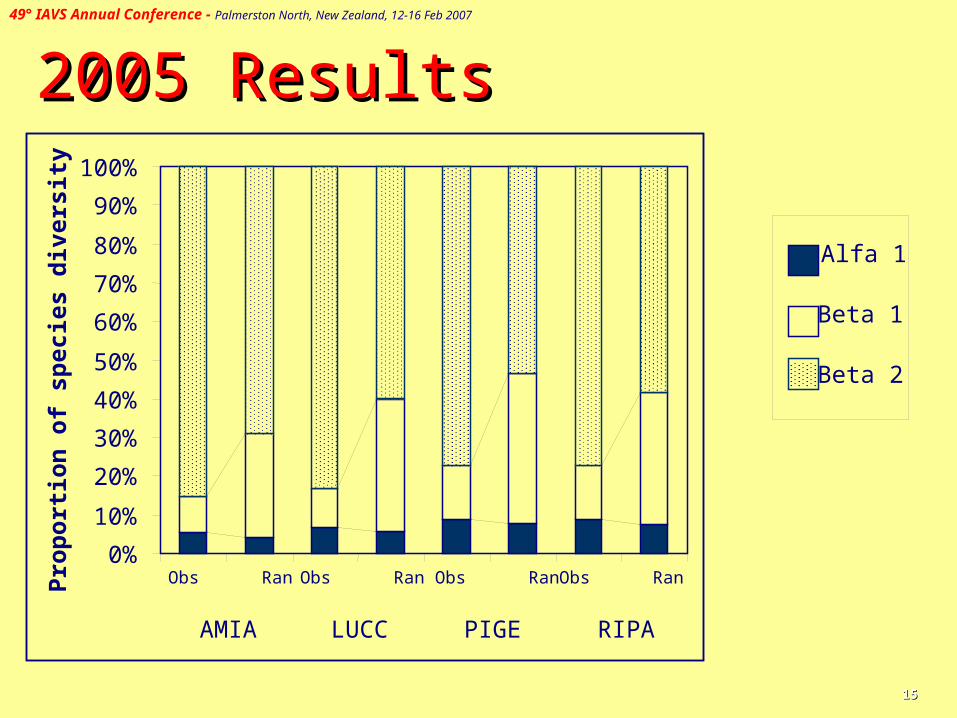
2005 Results2005 Results
Alfa 1
Beta 1
Beta 2
0%
10%
20%
30%
40%
50%
60%
70%
80%
90%
100%
AMIA LUCC PIGE RIPA
Pro
po
rtio
n o
f sp
ecie
s d
iver
sity
Obs Ran Obs RanObs RanObs Ran
49° IAVS Annual Conference - Palmerston North, New Zealand, 12-16 Feb 2007
1616
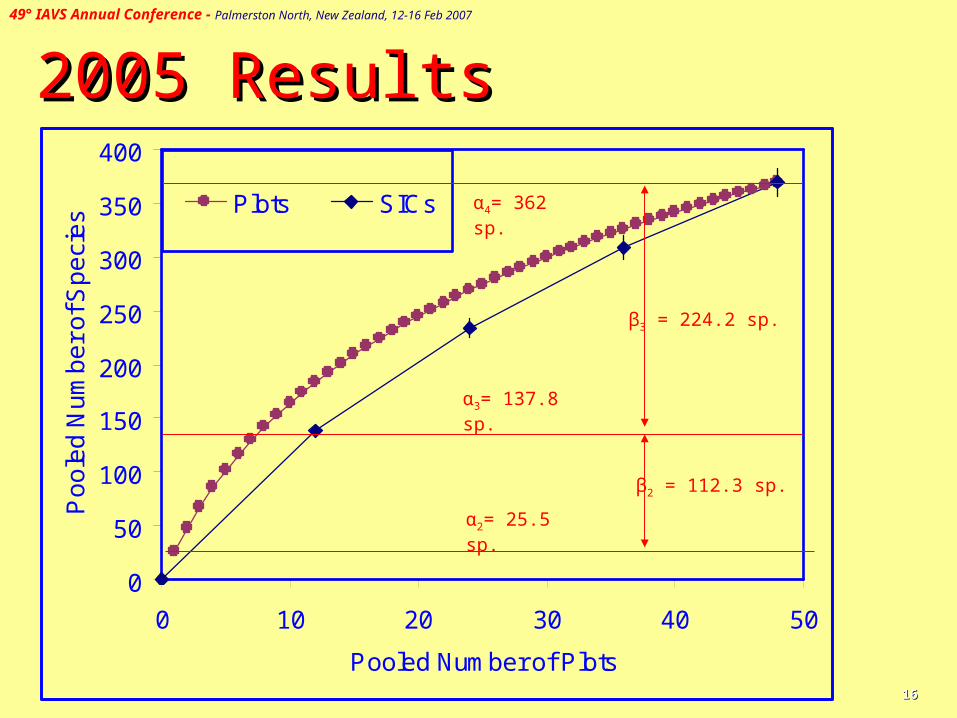
2005 Results2005 Results
0
50
100
150
200
250
300
350
400
0 10 20 30 40 50
Pooled Number of Plots
Po
ole
d N
um
be
r o
f Sp
eci
es
Plots SICs
α2= 25.5 sp.
α3= 137.8 sp.
β2 = 112.3 sp.
β3 = 224.2 sp.
α4= 362 sp.
49° IAVS Annual Conference - Palmerston North, New Zealand, 12-16 Feb 2007
1717
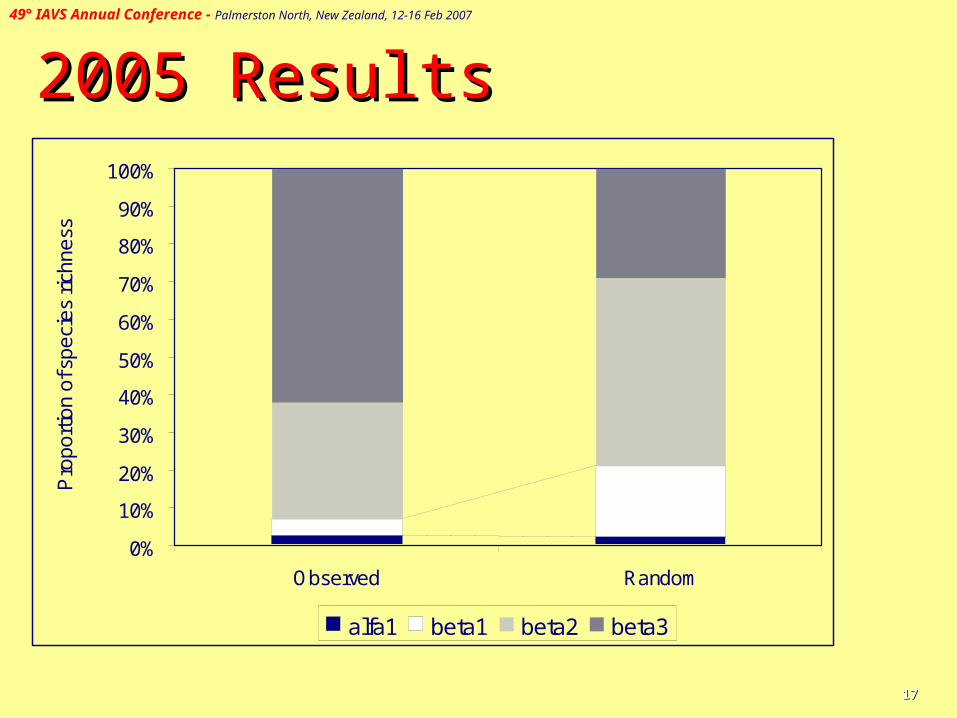
2005 Results2005 Results
0%
10%
20%
30%
40%
50%
60%
70%
80%
90%
100%
Observed Random
Pro
po
rtio
n o
f sp
eci
es
rich
ne
ss
alfa1 beta1 beta2 beta3
49° IAVS Annual Conference - Palmerston North, New Zealand, 12-16 Feb 2007
1818
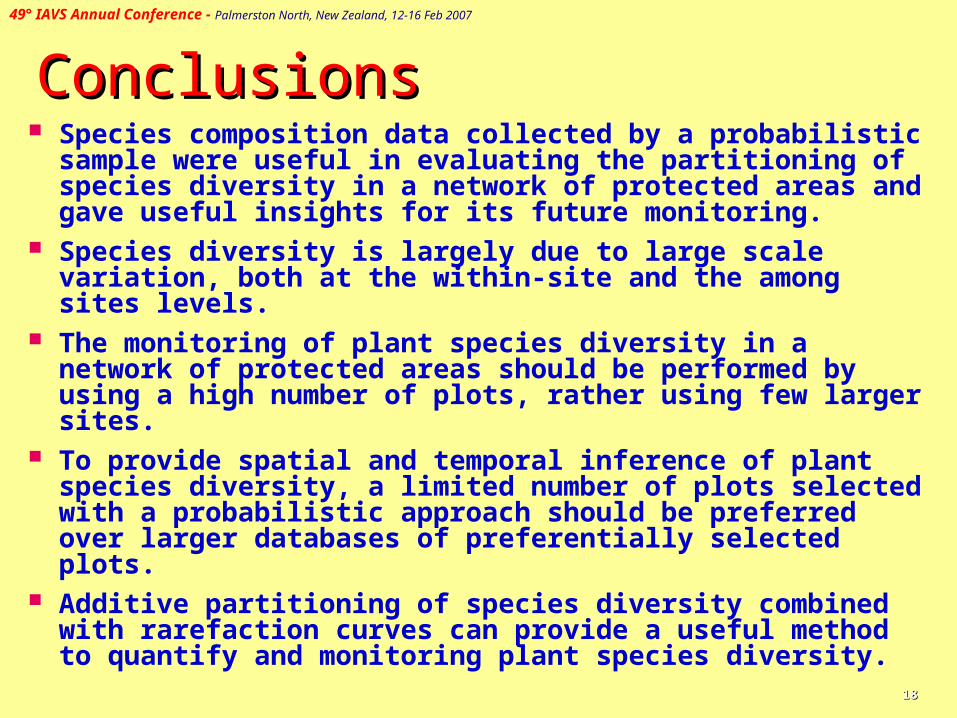
ConclusionsConclusions Species composition data collected by a probabilistic
sample were useful in evaluating the partitioning of species diversity in a network of protected areas and gave useful insights for its future monitoring.
Species diversity is largely due to large scale variation, both at the within-site and the among sites levels.
The monitoring of plant species diversity in a network of protected areas should be performed by using a high number of plots, rather using few larger sites.
To provide spatial and temporal inference of plant species diversity, a limited number of plots selected with a probabilistic approach should be preferred over larger databases of preferentially selected plots.
Additive partitioning of species diversity combined with rarefaction curves can provide a useful method to quantify and monitoring plant species diversity.

49° IAVS Annual Conference - Palmerston North, New Zealand, 12-16 Feb 2007
1919
We acknowledge all the students and
We acknowledge all the students and
colleagues that contributed to the project:
colleagues that contributed to the project:
Andrea Billi, Arianna Vannini, Elisa Baragatti, E
lisa
Andrea Billi, Arianna Vannini, Elisa Baragatti, E
lisa
Santi, Fernando Cortés Selva, Francesco Geri, Giulia
Santi, Fernando Cortés Selva, Francesco Geri, Giulia
Bennati, Lia Pignotti, Mauro Taormina, Patrizia Mosca,
Bennati, Lia Pignotti, Mauro Taormina, Patrizia Mosca,
Sara Ghisleni.
Sara Ghisleni.