Embed Size (px)
Citation preview
A Primer on Stormwater Runoff Issues as Pertinent to Coastal North Carolina
Carolina Environmental Program Capstone Project Fall 2004
Presented by Carolina Environmental Program Students:
Lindsay Leonard Michael McKay Glasgow
Ryan Nelson Jessica Stubbs Kate Morrison Brooke Willis
Under the Direction of Dr. Rachel T. Noble, Director, Carolina
Environmental Program Morehead City Field Site

Cover Photo Triple S Pier, Atlantic Beach, North Carolina, 6 May 2005. Photo courtesy of Jennifer Parker

Introduction The importance of water quality to humans and other organisms is immeasurable. Humans rely on clean water first and foremost for drinking. However, the water resource is invaluable for providing humans with a source of food ranging from fish to mollusks and shellfish, and an area to potentially grow food (sea vegetables, aquaculture). In Asia, over a billion people rely on fish as a primary source of protein (International Year of the Ocean, 1998). Good water quality also provides ideal conditions for many recreational activities such as going to the beach, SCUBA diving, going on boat rides, and more. Clean water is also important in a more intangible sense, aesthetically and spiritually, as evidenced by the sheer number of people in the world who desire to live with a visible “water view”. Of course, in this case, people tend to prefer clear water with no garbage or algae obstructing their view. While all of these contribute to the enjoyment and health of people, they also provide a substantial amount of money to the global economy of many nations each year. In southern California, an estimated 1.5 billion US dollars was spent by beach tourists in 1997 alone (Pendleton, 2001). Just about all of the economic benefits that are experienced due to water would not exist if it were not for the wide range of habitats that beneficial water quality helps create. Estuaries and oceans are just two types of marine environments, however they are responsible for creating many habitats for aquatic animals ranging from seagrass beds to coral and oyster reefs to deep-sea environments. Without water based ecosystems, the fishing industry would not exist, tourism would be greatly reduced in many tropical nations and the overall quality of the water itself would rapidly decline since many of the reefs are responsible for filtering the impurities out of the water. Impacts of water pollution have the potential to affect all uses of water through quality degradation. Degradation of ground water and lake reservoirs normally used for drinking could cause water shortages or costly treatment requirements. The introduction of pollutants into surface waters creates situations in which humans can be exposed to dangerous pathogenic bacteria and viruses (NCDENR, 2004), sometimes discouraging recreational uses. Similar pathogens, along with heavy metals and toxins, can be concentrated in the tissues of a variety of economically important filter-feeding species, such as oysters and clams, and cause declines in the availability of harvestable fisheries (NCDENR, 2004). These effects may be passed up the food chain by biomagnification, the transfer of pollutants concentrated at comparatively low levels at the base of the food chain to possible harmful and lethal doses at higher trophic levels (Kennish, 1992). Indirect effects through the alteration of the food web in waterways can occur if certain prey organisms are no longer available for predators. Debris from inland sources and phytoplankton or cyanobacteria blooms initiated by the introduction of excess nutrients from upstream greatly reduce the aesthetic values of aquatic areas (NCDENR, 2004 and Dyble, personal communication, 2004). Stormwater is thought to be a major contributor of contaminants to receiving waters the world over. Stormwater is defined as runoff associated with storm events. Storm events are any occurrence where precipitation takes place (e.g. thunderstorms, hurricanes,
showers). Stormwater running into bodies of water, as either point source runoff or non-point source (NPS) runoff, is a topic of concern because of the pollutants it carries causing the degradation of water quality. Point source runoff comes from a definite, identifiable source. Non-point source runoff has no specific point of origin and enters a body of water without the aid of a pipe. Stormwater entering bodies of water through trenches, ditches, or natural contours of the land at a specific point in a body of water is considered non-point source. As yet, stormwater is typically poorly characterized due to the wide range of runoff that can occur, and the difficulty of identifying sources for NPS runoff. The EPA estimates that of the total pollution to inland lakes, river, and estuaries, NPS pollution inputs represent 65% of the total (Mitchell et al. 1995). Agricultural components of runoff contribute a variety of pollutants to waterways including nutrients, pesticides, and suspended solids and comprise the largest category of NPS pollution (Kao et al. 2002). Some stormwater enters systems such as holding basins and wetlands that naturally filter pollutants and minimize their harmful effects. The number of definitions of stormwater make it difficult to gain a coherent understanding of the subject. However, it is clear that stormwater is difficult to manage. If 65% of stormwater runoff is NPS runoff, our current focus on managing stormwater runoff only at point source input locations is much too limited. Humanity should be concerned with stormwater issues because it affects each and every one of us in some form or another. Direct impacts on humans from stormwater are: impacts on human health through disease associated with pathogens in stormwater, and alterations in the quality of food from water resources, resulting in beach closings, shellfish bed closings, and many other consequences that affect our everyday lives. According to the North Carolina Department of Environment and Natural Resources (NCDENR), there were 567 beach days effected by closings/advisories lasting up to a week in 2003 (Miller, 2004). Most of the causes for these closings/advisories were related to stormwater runoff. The transport of pollutants into riverine and estuarine systems produces nutrient loading, increasing turbidity and proves to be detrimental to aquatic habitats. Furthermore, it is especially difficult to convey the impacts of stormwater runoff to the public and to educate as to its potential impacts. Typically, when a rainfall event occurs, humans can see evidence of stormwater through the pooling of water in their own neighborhoods and roads, but they often do not gain visual confirmation of the presence of stormwater in receiving waters. Sources of stormwater are difficult to pinpoint, and there often is no visible infrastructure of stormwater runoff in the form of an outfall (no pipes or conveyance structures). This in turn makes it challenging for stormwater to be managed because of the wide areal extent of stormwater flows, treatments tend to be expensive, and most people are not willing to control stormwater if they see no outfall or visible contaminants. Another aspect of the difficulty in managing stormwater runoff is that storms and their effects are highly variable. A principal dilemma with managing and controlling the increasing effects of stormwater is the shear volume of rain that falls during each storm event, and the duration of the storms. Storms vary with the season, storm size and population change. During high rainfall periods, stormwater runoff will have considerable impacts on water quality. For example, during fall 1999, Hurricanes
Dennis, Floyd and Irene inundated coastal NC with up to 1 m of rainfall, causing a 100-500 year flood in the watershed of the Pamlico Sound, a key fisheries nursery for the mid and southeast Atlantic regions (Paerl et al. 2000, 2001). This extreme example illustrates the linkage between stormwater pathogens and ecosystem and habitat quality. The frequency and amount of a storm are key issues. The larger and more powerful the storm, the more runoff will be accumulated, and the more severe the visible impacts to the natural habitat will be, increasing public awareness and concern. Logically, this would mean increased contaminant loading. However, this logic is not always followed. A phenomenon aptly termed ‘first flush’ says that a large storm after a period of no rainfall will carry a high level of stormwater contaminants, whereas a large storm after a prolonged period of heavy rainfall will not “flush” out as many contaminants from the system, as they have already been released by previous storms. Not only are the impacts of stormwater seasonally dependent as far as storm size is concerned, but the fluctuation of North Carolina’s coastal population is also another factor. With more people living and visiting the coast in the summer months than in the winter, it is probable that there is a higher, more severe impact on water quality associated with runoff with an increase in population size. With all of these possibilities for variability in the amount of stormwater runoff, monitoring becomes another important issue. Stormwater can be characterized in a variety of ways. A primary factor that must be considered is the sheer volume of water that falls during a storm event. The intensity of rainfall directly relates to how much, and often what is washed into a water body as stormwater runoff. Temporal characterization is closely linked to rainfall intensity as back-to-back storms that deposit a small quantity of water have a much different effect than a single storm that precipitates a huge volume sporadically. The geography of a particular landscape should also be taken into account because a nearly flat topography will have a dissimilar effect than a dramatically sloping area due to a variety of factors including slope of land, type of groundcover, soil type, etc. The potential impacts on the environment, both aquatic and terrestrial, also is a defining aspect of stormwater characterization and contains subcategories ranging from pathogen counts to inorganic and physical parameters. The method by which stormwater is introduced into a system either in a point source or NPS manner is also enormously important in characterizing stormwater. (Kellems, 2003) It is clear to see that due to the complexity and variability from site to site, stormwater is very difficult thing to characterize. Furthermore, temporal and spatial variability in the presence and amounts of specific pollutants in stormwater runoff complicate the issue. Another complication is our limitations in measuring/monitoring techniques, and limitations in resources allocation to sampling strategies. Stormwater is an incredibly interconnected phenomenon depending on a huge number of factors each with a varying degree of importance. As such its characterization mirrors its complexity and is likewise a mosaic of confounding facets. This paper provides a basic summarization of the stormwater runoff issues, especially as they pertain to coastal North Carolina, and other coastal areas along the mid-Atlantic seaboard. We have chose to use a multi-faceted approach, with the following foci:
characterization of stormwater runoff and its impacts on human health and ecosystems, relationships of impervious surface cover to stormwater runoff characteristics, remediation of stormwater runoff through natural mitigation systems, and the economic and societal impacts of stormwater. This project has been assembled by a team of undergraduate students participating in a “Capstone Experience” through the curriculum of the Carolina Environmental Program, that are interested in the impacts of stormwater runoff as a whole. As evidenced by the above description, a variety of different focal points based on the team’s individual interests and high priority issues in regards to stormwater are addressed. Focal points are investigated in this paper, but there are many other attributes and perspectives pertaining to stormwater which will not be addressed here. Specifically, the geographic scope for discussion focuses primarily on the impacts of stormwater to eastern North Carolina. The issue of stormwater must be addressed locally because different locations will have different quantity and quality of stormwater.
Chapter 1: The regulation and management of stormwater Stormwater is difficult to regulate and manage because of a variety of factors. As far as regulation, the difficulty comes in the variability of stormwater flows, contents, and contaminants; the array of factors that impact the variability of stormwater runoff include the size and duration of the storm, the land use types that runoff comes from, and the local hydrology and climate. Although stormwater proves to be the leading cause of degradation of watersheds nationwide, it is by far the least monitored and managed. Effective regulation and management of stormwater is a priority within the USEPA. The federal government as well as state governments have attempted to control point source (PS) stormwater sources, however, the majority of stormwater, which is nonpoint source pollution, goes uncontrolled and unregulated. This chapter discusses the evolution of PS, NPS, and stormwater regulations from a federal and state management perspective, and provides some basic background information on the development of useful management tools for stormwater runoff. Chapter 2: Characterization and Loading of Stormwater Contaminants: Implications for ecosystem and human health This chapter documents the variety of different contaminants that are present in water bodies due to loading from stormwater runoff. Among the variety of contaminants in stormwater; microbial contamination poses a direct and severe threat to human health. Pathogenic bacteria such as Salmonella sp., Campylobacter sp., and Vibrio vulnificus, and pathogenic viruses such as hepatitis A virus, norovirus, and adenovirus, are just a few of the microbial contaminates that have been documented in stormwater runoff contributed to coastal waters. Each of these organisms has its own set of symptoms and virulence factors, which cause human illness, however in-situ and rapid detection and monitoring strategies are lacking to protect public health. It is clear that there is much room for mitigation of microbial contaminants in stormwater runoff. Accurate quantification and detection of contaminants, however, is the first step to successful mitigation. Also threatening the health of both humans and ecosystem inhabitants are pesticides and other chemicals, oils and grease, heavy metals, sediments, and nutrients. These contaminants are loaded to a body of water in storms at a rate based on the storm
characteristics; including duration, intensity, and time since last storm. Information is presented in this chapter about loading of contaminants, and a real world example of fecal indicator bacteria loading from an eastern North Carolina coastal watershed is presented. The chapter also identifies that more resources need to be allocated to permit accurate and real-time monitoring of water for the benefit of human as well as the protection of ecosystem health. Chapter 3: Magnification of Stormwater Effects by Impervious Surfaces Stormwater runoff is affected by the hydrology of a watershed. Increasing development with the concomitant increase in paved and high density, impervious surfaces, has changed the hydrology of watersheds and degraded the water quality. The characteristics of stormwater and other NPS runoff are dramatically altered given an increase in impervious surface cover. Characteristics such as speed of flow, infiltration, degradation of contaminants, time to receiving water bodies, and shear, turbulence and mixing all have the potential to dramatically effect the loading of contaminants from stormwater runoff into receiving water bodies. As such, stormwater runoff is very difficult to manage because of its non-specific point of origin and release into the watershed. The decrease in water quality associated with impervious surface cover is evidenced by negative ecological, economic, and human health impacts. This chapter covers the negative impacts of impervious surface cover, the attributes of stormwater runoff that are most dramatically affected, and practices for remediation and reductions of impervious surface cover and related public policies. Chapter 4:Mitigation of Stormwater Runoff: Natural Ecosystems and Constructed Systems Problems with stormwater contaminants and their effects on water quality can be mitigated through a variety of methods that either decrease the volume of runoff or treat the contaminants in runoff before arrival at receiving waters. Some ecosystems naturally achieve this, but in the face of ecosystem degradation through development and a variety of other factors alternative practices, best management practices (BMPs), are being turned to in order to improve water quality. Stormwater runoff can be remedied through BMPs (decreased impervious surface cover, increased natural buffer areas, use of bioremediation, to name a few).Each mitigation strategy has its own advantages and disadvantages and a variety of factors, climate, land use, and problematic pollutants, must be assessed in each area before implementation of mitigation strategies. This chapter discusses the concept of mitigation strategies through the examination of naturally-found stormwater runoff reduction areas (wetlands, marsh areas, oyster reefs), and discusses the benefits of both conservation of buffer areas, as well as construction of artificially constructed remediation areas for restoration of waters impacted by stormwater runoff. Chapter 5: Effects of Stormwater Runoff on the Economy and Public Perception of Beach Water Quality
Stormwater pollution results in a large number of beach closing/advisories in many coastal regions, preventing residents and tourists from participating in certain desired activities. These closing/advisory days at the beaches deter people away from the beach and prevent certain jobs from operating, causing coastal states to lose millions of dollars. California has faced a lot of difficulties in the past twenty years with public health risks at beaches, beach closings, and the loss of large amounts of visitors because of this. As California still faces many problems today with beach closings and pollution, it is one of the leading states taking action against the sources. As stormwater becomes a hotter topic in North Carolina, it is important to compare it with a state that has a lot of history on the topic and is taking a lot of action. The public perception of stormwater runoff is, on a broad level, uneducated. People are simply not aware of the impacts related to stormwater. The politicians, scientists, and concerned citizens in both coastal and upstream locations need to work towards education the public on the environmental and human health impacts of NPS stormwater runoff, as well as, working towards effective mitigation and practical solutions that the broad scale public can employ. Water quality degradation has already become an important issue but will only increase in importance with an urgency that will need to be met with eager future generations. Chapter 6: Recommendations This chapter outlines summary material pertaining to the future successful management of stormwater runoff. Included is a set of recommendations that are made in order to make progress in achieving that goal.
Chapter 1: The regulation and management of stormwater Background The EPA defines stormwater as “discharges that are generated by runoff from land and impervious areas such as paved streets, parking lots, and building rooftops during rainfall and snow events that often contain pollutants in quantities that could adversely affect water quality” (USEPA, 2003). The EPA also states that most stormwater discharges are considered point sources, which require coverage by a National Pollutant Discharge Elimination System (NPDES) permit. This statement, however, is contradictory their own definition because stormwater runoff from land, in particular, is typically non point source and is often difficult to control. Stormwater discharges in large part across the country cannot be managed as a point source, as their inputs to receiving waters occur over a wide range of areal scales and flow levels. Even Combine Sewer Operations (CSOs) which serve to collect stormwater discharge and funnel it through a sewerage treatment plant operation, often end up not being properly treated due to the overflow of the sewerage system. In 1972, the NPDES program was established under the authority of the Clean Water Act. Efforts to improve water quality under the NPDES program traditionally have focused on reducing pollutants in discharges of industrial process wastewater and from municipal sewage treatment plants. Past efforts to address stormwater discharges under the NPDES program have generally been limited to certain industrial categories with effluent limitations for stormwater. It was soon discovered that a more comprehensive approach to stormwater requirements was needed and in response to this, amendments were made to the Clean Water Act in 1987. Along with these amendments the EPA developed the Phase I program of the NPDES Stormwater Program in 1990. Phase I addressed sources of stormwater runoff that had the “greatest potential to negatively impact water quality”. This included permit coverage for medium and large municipal separate storm sewer systems (MS4s) located in areas with populations of 100,000 or more, as well as eleven categories of industrial activity which includes construction activity that disturbs five or more acres of land (USEPA, 2003). An exception to Phase I was established in 1991 by the Transportation Act, which exempted certain industrial activities owned or operated by municipalities with a population of less than 100,000 from permit requirements. Such municipalities only had to submit storm water discharge permit applications for airports, power plants, and uncontrolled sanitary landfills that they own or operate (USEPA, 1996). Phase II of the NPDES program was established in 1995 and published in 1998, which required permit coverage for certain regulated small municipal separate storm sewer systems (MS4s) and construction activity disturbing between one and five acres of land, considered to be “small” construction activities. MS4s are now required to develop and implement a comprehensive stormwater management program that includes six minimum requirements: 1) public education and outreach on stormwater impacts; 2) public involvement/participation; 3) illicit discharge detection and elimination; 4) construction site stormwater runoff control; 5) post-construction stormwater management for new
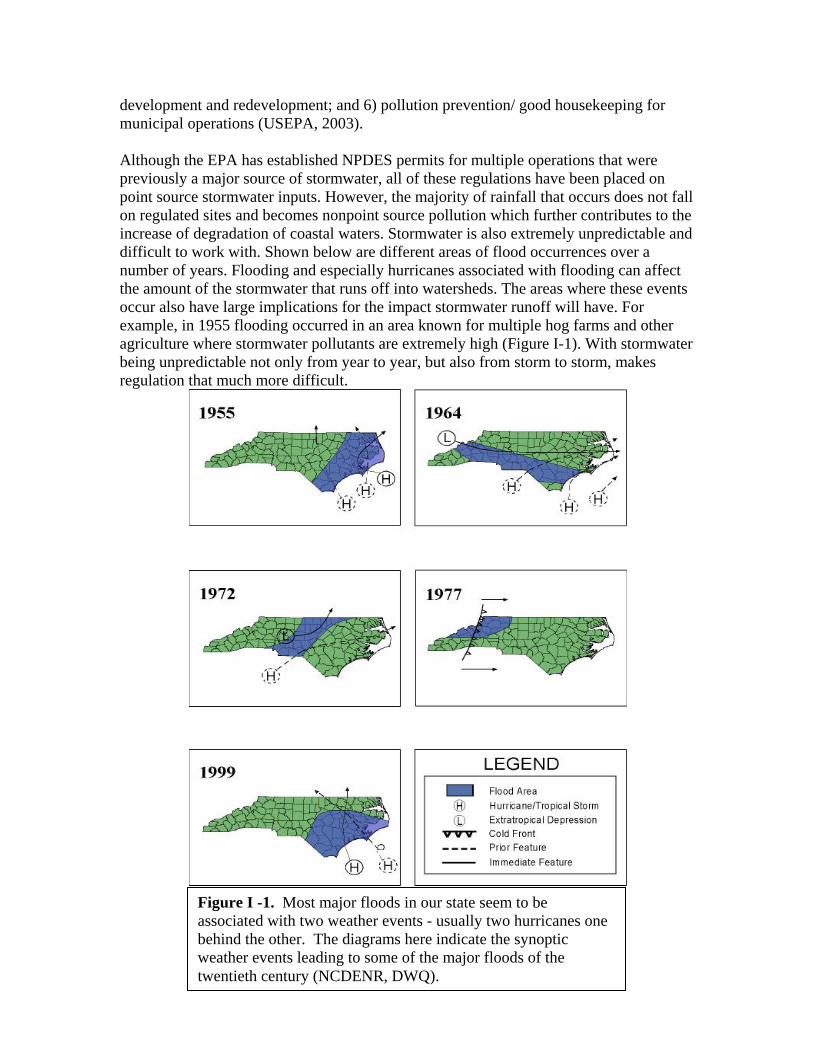
development and redevelopment; and 6) pollution prevention/ good housekeeping for municipal operations (USEPA, 2003). Although the EPA has established NPDES permits for multiple operations that were previously a major source of stormwater, all of these regulations have been placed on point source stormwater inputs. However, the majority of rainfall that occurs does not fall on regulated sites and becomes nonpoint source pollution which further contributes to the increase of degradation of coastal waters. Stormwater is also extremely unpredictable and difficult to work with. Shown below are different areas of flood occurrences over a number of years. Flooding and especially hurricanes associated with flooding can affect the amount of the stormwater that runs off into watersheds. The areas where these events occur also have large implications for the impact stormwater runoff will have. For example, in 1955 flooding occurred in an area known for multiple hog farms and other agriculture where stormwater pollutants are extremely high (Figure I-1). With stormwater being unpredictable not only from year to year, but also from storm to storm, makes regulation that much more difficult.
Figure I -1. Most major floods in our state seem to be associated with two weather events - usually two hurricanes one behind the other. The diagrams here indicate the synoptic weather events leading to some of the major floods of the twentieth century (NCDENR, DWQ).
North Carolina and Stormwater Regulations
There are multiple classifications of stormwater that are regulated by different state agencies. The main types of stormwater, as defined by the NC Division of Water Quality (DWQ) are agriculture, atmospheric deposition, construction, forestry, hydromodification, marinas and recreational boating, onsite wastewater systems, roads, highways and bridges, urbanization, and wetlands and riparian areas (NCDENR, DWQ, 2004). Agriculture, urbanization, and marinas and recreational boating are the leading producers of stormwater runoff in NC and their regulations are described below. Although the other sources are important, the agencies handling regulations often becomes confusing, therefore, they are not elaborated on here. All of these sources are regulated under the North Carolina Nonpoint Source Management Program, as a result of the Federal 1990 Coastal Zone Act Reauthorization Amendments (CZARA).
Agriculture
The primary agricultural nonpoint source pollutant is sediment that is eroded from tilled fields, drainage ditches, irrigation channels and areas where livestock congregate. Sediment is the number one pollutant of streams and lakes in North Carolina. Probably the second biggest pollutant of streams in North Carolina is nutrients. Excessive use of fertilizers causes nutrients to drain into streams and other surface waters. Agricultural operations may also contribute pesticides from crop production areas. The waste from animal operations and grazing lands can also contribute nutrients, bacteria, and pathogens to streams (NCDENR, DWQ, 2004).
The North Carolina Department of Agriculture and Consumer Services’ Pesticide Management Section of the Food and Drug Protection Division regulate pesticide use and disposal. Erosion control is primarily addressed through non-regulatory means such as cost-sharing implementation of BMPs. Nutrient runoff from agricultural land is also often addressed through cost-shared projects, but within the Neuse and Tar-Pamlico River basins this source is also regulated by rule. The North Carolina Division of Soil and Water Conservation within the NC DENR coordinate several programs to assist with agricultural nonpoint source control. One of these is the North Carolina Agriculture Cost Share Program, which is administered locally by a Soil and Water Conservation District. The program cost shares for installation or use of BMP that improve water quality at a 75% cost share, which is based on average cost of the BMP (NCDENR, DWQ, 2004).
The Division of Soil and Water also has a Nonpoint Source Management Section that manages or coordinates several programs. Among these are funding programs like the North Carolina Conservation Reserve Enhancement Program, which encourages landowners to convert highly erodible cropland or other environmentally sensitive acreage to vegetative cover crop such as grasses, filter strops, or riparian buffers. This is accomplished by providing landowners with annual payments over a predetermined time period for which the land is enrolled in the program. Cost share is provided to establish the practices (NCDENR, DWQ, 2004).
The Nonpoint Source Management Section also coordinates the Environmental Quality Incentive Program (EQIP), which is a program of the US Department of Agriculture that cost shares to install BMPs to address natural resource concerns. Under EQIP a conservation plan is developed for the land as well as a 5-10 year contract that provides incentive payments and cost share at the rate of 75% (NCDENR, DWQ, 2004).
Urbanization
There are several existing state regulatory programs that address various forms of urban runoff. The DWQ houses several of these programs including the NPDES Stormwater Program, the Water Supply Watershed Protection Program, and the Neuse and Tar-Pamlico River basin Nutrient Sensitive Waters strategies. The North Carolina Division of Water Quality (DWQ) is also responsible for implementing the EPA’s Total Maximum Daily Load, or TMDL Program, which will require strategies to address polluted waters (NCDENR, DWQ, 2004).
Other state agencies with regulatory program include the Division of Coastal Management (DCM) - which has some coastal buffer requirements and the Division of Land Resources, which along with local governments, regulates construction activities. Finally, the North Carolina Department of Transportation’s project development and Environmental Analysis Branch has the primary responsibility to prepare and develop environmental studies that adequately address environmental concerns and obtain the necessary permits for construction and maintaining the state’s highway system.
In the mid-1980's, the Pamlico River estuary saw an increase in problems that was caused by excessive levels of nutrients in the water. These problems included harmful algal blooms, low oxygen levels, increased numbers of fish kills, and other symptoms of stress and diseases in the aquatic biota. In response, the NC Environmental Management Commission (EMC) designated the Tar-Pamlico River Basin as "Nutrient Sensitive Waters", and called for a strategy to reduce nutrient inputs from around the basin to the estuary.
The strategy's first phase, which ran from 1990 through 1994, produced an innovative PS/NPS 'trading' program that allows PSs, such as wastewater treatment plants and industry, to achieve reductions in nutrient loading in more cost-effective ways. The second phase, which runs through 2004, established nutrient goals of a 30% reduction in nitrogen loading from 1991 levels and holding phosphorus loading to 1991 levels based on estuarine conditions. In addition to PSs, Phase II calls on NPSs to contribute to these goals, and establishes a set of NPS rules addressing agriculture, urban stormwater, fertilizer management across all land uses, and riparian buffer protection (NCDENR, 2004).
As a gauge of progress, DWQ staff performed a statistical evaluation of the reduction in nutrient concentrations instream at Grimesland a few miles upstream of Washington. Staff looked at the period of 1991 through 2002, and used statistical techniques to minimize the effects of flow and seasonal factors on nutrient concentrations. They found
statistically significant reductions in both total nitrogen and total phosphorus over this time period, as described in their report.
Marinas and Recreational Boating
Although North Carolina does not have a comprehensive marina policy, depending on their location and size, marinas may need to obtain a permit. The North Carolina Division of Coastal Management takes the primary responsibility for permitting marinas at the coast. The North Carolina Division of Water Quality’s “401 Wetlands Unit” is the state agency which regulates impacts from marinas to wetlands and water quality, in particular during construction and maintenance. This is accomplished primarily through review of the permits and Environmental Assessments prepared for new or expanding marinas. The federal regulatory counterpart for wetland impacts is the United States Army Corps of Engineers (NCDENR, DWQ, 2004).
Potential nonpoint source related pollution from recreational boating is also regulated through a combination of state and federal agencies. The North Carolina Wildlife Resources Commission has authority to establish and enforce no-wake zones, and may be petitioned by local governments to make such designations. The United States Coast Guard is responsible for regulating boating for safety and environmental protection, oil spill response.
The North Carolina Division of Environmental Health’s Onsite Wastewater Section and the U.S. Coast Guard jointly regulate onboard sewage. Responsibilities of each agency depend on the type of boat or vessel. Marinas which have repair facilities on site are also required to have an NPDES General Stormwater Permit from the NC Division of Water Quality.
Shellfish Sanitation and Recreational Water Quality As part of DENR, Shellfish Sanitation does not involve regulating stormwater runoff, but reacts to stormwater runoff after it occurs. Their main focus is on public health, monitoring outfalls where there are discharges to the ocean and posting precautionary advisories. There are 10 stormwater outfalls in NC that are dry weather outfalls, which means that there is constant flow from the pipes even in dry weather. There are about 35 total outfalls that are monitored statewide, the remaining of these being wet weather outfalls, meaning discharge only occurs after precipitation. There are sampling stations at each of these pipes which are regulated by standard EPA requirements. There are three categories of swimming areas defined by Shellfish Sanitation. These are a) Tier I- swimming area used daily during the swimming season, including any public access swimming area and any other swimming area where people use the water for primary contact, including all oceanfront beaches; b) Tier II- swimming area used an average of three days a week during the swimming season; and c) Tier III- swimming area used an average of four days a month during the swimming season (NCDENR, Coastal recreational waters monitoring, 2004). The bacteriological limits for these
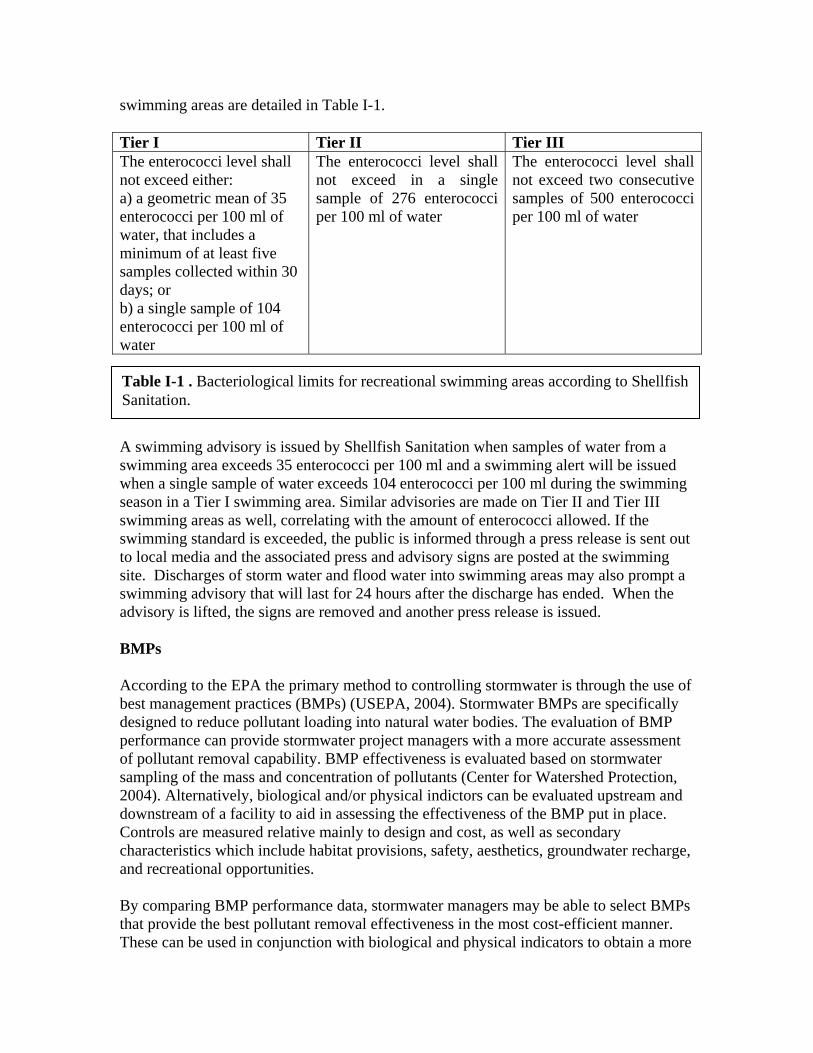
swimming areas are detailed in Table I-1. Tier I Tier II Tier III The enterococci level shall not exceed either: a) a geometric mean of 35 enterococci per 100 ml of water, that includes a minimum of at least five samples collected within 30 days; or b) a single sample of 104 enterococci per 100 ml of water
The enterococci level shall not exceed in a single sample of 276 enterococci per 100 ml of water
The enterococci level shall not exceed two consecutive samples of 500 enterococci per 100 ml of water
A swimming advisory is issued by Shellfish Sanitation when samples of water from a swimming area exceeds 35 enterococci per 100 ml and a swimming alert will be issued when a single sample of water exceeds 104 enterococci per 100 ml during the swimming season in a Tier I swimming area. Similar advisories are made on Tier II and Tier III swimming areas as well, correlating with the amount of enterococci allowed. If the swimming standard is exceeded, the public is informed through a press release is sent out to local media and the associated press and advisory signs are posted at the swimming site. Discharges of storm water and flood water into swimming areas may also prompt a swimming advisory that will last for 24 hours after the discharge has ended. When the advisory is lifted, the signs are removed and another press release is issued. BMPs According to the EPA the primary method to controlling stormwater is through the use of best management practices (BMPs) (USEPA, 2004). Stormwater BMPs are specifically designed to reduce pollutant loading into natural water bodies. The evaluation of BMP performance can provide stormwater project managers with a more accurate assessment of pollutant removal capability. BMP effectiveness is evaluated based on stormwater sampling of the mass and concentration of pollutants (Center for Watershed Protection, 2004). Alternatively, biological and/or physical indictors can be evaluated upstream and downstream of a facility to aid in assessing the effectiveness of the BMP put in place. Controls are measured relative mainly to design and cost, as well as secondary characteristics which include habitat provisions, safety, aesthetics, groundwater recharge, and recreational opportunities. By comparing BMP performance data, stormwater managers may be able to select BMPs that provide the best pollutant removal effectiveness in the most cost-efficient manner. These can be used in conjunction with biological and physical indicators to obtain a more
Table I-1 . Bacteriological limits for recreational swimming areas according to Shellfish Sanitation.
accurate representation of the total aquatic community condition. Most importantly, BMPs can be used as a basis to create, update, and enforce minimum design standards to meet target pollutant and removal applications. Moreover, since BMPs are specifically designed to provide a particular level of performance, it is relatively easy to determine whether their functions are being achieved. Education programs can also be developed to involve private organizations in data collection. The increased performance monitoring in turn increases the likelihood that BMPs will be properly maintained. There is however, little standardization for reporting BMP performance, which results in a wide range of effectiveness being reported. The problem also arises that many watershed managers choose BMPs based on cost, with design performance as a secondary concern. As a result, even if a BMP performs according to the design, it still may not adequately protect water quality. Effective performance of BMPs requires extensive monitoring and a large number of paired samples must be collected to establish an accurate performance assessment. The performance of a monitored BMP may also be site specific or watershed specific and should not be a generalized BMP. Problems with the System: Federal and State Regulations As far as the stormwater issue is concerned, there is not much of a focus on NPS runoff. All permits are placed on PS runoff which is a mere fraction of the pollution that is having drastic effects on the environment. Even of with the existence of the NPDES permits and other regulations, it was found in 1991 that almost 97% of stormwater permits were being violated in North Carolina (Stephenson, personal communication, 2004). This was most likely due to the lack of enforcement for stormwater permits. Enforcement of stormwater violations does not usually occur unless a complaint is called in where a source of pollutants is obvious. However, the fact that stormwater runoff is usually discrete and there are no visible outfalls means that violations are hardly ever reported. Furthering complicating the issue is that staffing has become a major problem when trying to enforce and monitor stormwater runoff. Funds are not available to support a staff that can monitor the extensive amount of stormwater runoff as well as keep a watchful eye on current permittees to make sure rules are being followed. It has also been found that fines associated with stormwater permit violations are not such that they become detrimental to the violator. Some companies will simply include permit violation fines into their yearly budget and continue to defy the rules. Jim Stephenson from the North Carolina Coastal Federation has stated that because of lack of enforcement, an inadequate fine system, among other things has created stormwater system that is “designed to fail” (Stephenson, personal communication, 2004). Also, because most stormwater projects are not monitored once they are put in place it does not do much of service unless the progress of the projects are monitored. It is also not known how to effectively monitor stormwater because flow is variable, contaminant load is variable, and inputs at specific locations (i.e. farm land vs. next to a housing development) will be completely different. It is also difficult to measure every event of stormwater everywhere that it needs to be monitored. It is not possible to this

and so some guidelines need to be in place that will at least get to the major problem areas. We also need to understand what precipitation means to loading. Is there a certain point (e.g. number of inches of rainfall) where we know that the system is contaminated and we shouldn’t even bother measuring contaminants? More monitoring needs to be done and the fact that stormwater is so extremely variable means that stormwater should be handled on a case-by-case basis.
Chapter 2: Characterization and Loading of Stormwater Contaminants: Implications for ecosystem and human health Stormwater loading to a body of water is difficult to characterize because of the many factors that influence a system as water is flowing. Most of the effects of SW loading to a system are through NPS SW runoff. It is very difficult to isolate the cause of contaminants to a system because the sources are non-point, i.e. they do not come out of a pipe. General sources of NPS pollution include agricultural operations, urban areas, timber harvesting, construction activities, solid waste disposal, on-site wastewater treatment, golf courses, and mining activities. Description of contaminants in NPS runoff follows, with details about the potential impacts of contaminants on ecosystem health and human health. Information is also provided detailing the relationship between land-use and loading of contaminants into watersheds.
Storm Characteristics All of the contaminants loaded into a water body are influenced by storm characteristics. The intensity, duration, and time since last storm event (soil absorption capabilities) all contribute to the amount of contaminants loaded to a body of water. The storm characteristics determine how fast water will move off land due to the absorption capabilities of the soil. If rainfall is allowed to filter through the sediment, many of the harmful contaminants will be filtered out of the SW, and will not adversely affect the water quality of a nearby stream, creek, river, or ocean. If the storm produces a lot of rainfall in a short amount of time, the soils may not have enough time to filter the amount of rain down into the sediment. This would cause water to quickly runoff into bodies of water, posing a threat to the quality of the water bodies. If you have a storm event after the soil is already soaked from previous rains, the abilities of the soil to filter out contaminants decreases because the water is not allowed to filter down through the soil. Thus, the SW and contaminants are flushed to bodies of water without filtration, causing greater threat to human and ecosystem health.
Other things that cause SW to be highly variable Land properties and flow affect SW runoff. In North Carolina, the state is divided into coastal plain, piedmont, and mountains. Topography, soils, vegetation, and drainage for these areas are different, and must be considered when implementing a plan to move and treat SW (NCDENR 1998). In coastal NC, the land is relatively flat, the soils are sandy, and rainfall can be very heavy at times. Normally drainage systems require a change in grade to move SW towards conduits, ditches, or pipes. So, in coastal NC, there must be a focus on reducing the amount of SW runoff, and reducing the distance over which SW is allowed to flow; more traditional engineered solutions may not be implemented due to the topography of the land. Also in coastal NC, the soils are very sandy. This means that the soil is able to drain very quickly. However, sand has very little filtering capabilities. So, in coastal areas, SW should be diverted to vegetated areas to allow for infiltration and pollution removal, because sandy soils will not improve the quality of the SW runoff. (NCDENR 1998). More detail on land properties and flow of water are presented in chapter 3 of this paper.
Characterization of SW Runoff SW carries with it a variety of different contaminants, including pesticides, chemicals, oils and grease, heavy metals, sediments, nutrients, and pathogens (microbial contaminants). Land use patterns influence NPS pollution loading to coastal bodies of water. Examples of different land-uses include, residential, rural, open agricultural, recreational (golf course), forestry, mining, crop production, animal feeding lots, and industrial. Based upon the land-use characteristics, the geography of the area, hydrology of the watershed and anthropogenic activities, the contaminants found in SW runoff will vary. The following is a broad-based description of the contaminants widely found in SW runoff and their effects.
Pesticides/Chemicals
Pesticides are used frequently in agricultural operations to ward off unwanted insects which eat the crops. Pesticides and other chemicals sprayed out over fields may be loaded to a nearby stream, and transported downstream to a larger body of water, until the pollutant reaches the coast. Management of agricultural discharges of pesticides and other chemicals determine the amount of chemicals loaded to a system. Types of pesticides include organophosphate, carbamate, and pyrethroid pesticides, as well as organochlorine insecticides. Organophosphate pestides may affect the nervous system by disrupting an enzyme that regulates acetylcholine, a neurotransmitter; however, they are not very persistant in the environment. Carbamate pesticides perform the same function as Organophosphates, by disrupting the enzyme that regulates acetylcholine. Pyrethroid pesticides have been modified to increase their stability in the environment, and some may be toxic to the nervous system. Finally, many organochlorine insecticides, including DDT, for example, have been taken off the market due to their environmental and health effects, as well as their persistence in the environment (USEPA). Other chemical contributors to SW contamination include urban discharge of a class of chemicals called VOCs, volatile organic compounds. Examples of VOCs include benzene, a component in gasoline and oil, dichloromethane, an industrial solvent, trichloroethylene, used in septic system cleaners, and tetrachloroethylene, used in the dry-cleaning industry. (Jennings et al. 1996) These VOCs may come from urban areas by spill of the above mentioned sources (oil, industrial solvent, septic systems, and dry-cleaning) to the environment. VOCs may be dangerous to humans at high levels of exposure by causing central nervous system depression, irritation upon contact with skin, and irritation to mucous membranes if inhaled. (Jennings et al. 1996)
Oils and Grease Oil and grease, two lipid polysaccharides, mainly contribute to water quality degradation from SW runoff due to urban runoff of impervious surfaces, and sewer outflows. These processes account for approximately 56% of the oil discharged to aquatic ecosystems (NCDENR, DWQ, 2004). Oil and grease are spilled, leaked, dumped, pumped, or thrown away on land. Once on land, they may leach to the groundwater, and eventually
make their way to surface water. They may also directly runoff, leach from landfills, or be loaded through illegal dumping into storm sewers. Oil and grease contribute to levels of polycyclic aromatic hydrocarbons (PAHs) in the watershed. PAHs are bad because they may be carcinogenic, as well as many PAHs may “taint edible species in concentrations as low as 1-10 ppb in very short periods of time (NCDENR, DWQ, 2004). Oil and grease can accumulate in organisms, especially filter-feeding organisms in the water column, and cause damage. Oil and grease may also form a film over the water surface and block the sun, which influences the phototrophic organisms in the water column. There are also direct effects felt by fish, among other large aquatic organisms due to PAHs in the water. For example, “Fish dosed with B(a)P or sediment extracts containing carcinogenic PAHs have developed skin and liver neoplasms”(Baumann 1998). While we may only think of oil spills contributing to this problem, such as large tanker spills in the oceans, (e.g. Exxon Valdez Spill in 1989), in fact, oil is spilt everyday into an urban environment by cars and trucks at alarming rates due to the vast number of cars and trucks. It is important to understand that“over the course of a year, urban runoff from a city of 5 million can contain as much oil and grease as a large tanker spill”(Dorfman and Stoner 2004). Also in coastal areas, oil runoff is increasing due to population increase as roads and parking lots are built to accommodate the growth”(Dorfman and Stoner 2004).
Heavy Metals Heavy metals such as lead, mercury, cadmium, and copper are common contaminants found in SW runoff. Heavy metals are dangerous due to their persistence, toxicity at high concentrations, and tendency to accumulate in tissues of marine organisms. Also, at elevated levels, heavy metals serve as enzyme inhibitors in organisms. (Kennish 1992) Major anthropogenic sources of heavy metals to aquatic environments include, “the production of cement and bricks, leaching of metals from garbage and solid waste dumps, and industrial processing of ores and metals”(Kennish 1992). Copper, for example, is loaded from many different sources; including, but not limited to, antifouling paints and smeltering plants. Copper has been shown to affect phytoplankton and “restrict the uptake and assimilation of nitrate and the uptake of silicate; furthermore, it inhibits photosynthesis, growth (i.e. cell division), and amino acid synthesis” Phytoplankton is an integral base to the aquatic food chain, and thus is crucial to sustain higher trophic levels. If Phytoplankton are negatively affected by copper contamination, they will first not be as fit, (i.e. likely to survive and reproduce), and in turn, not be able to offer higher trophic levels themselves for food. If the phytoplankton survive, they will pass on the copper contamination to higher trophic levels, allowing for bioaccumulation of copper in higher trophic levels. Also, the waste disposal of sewage-sludge and dredged-material tend to accumulate heavy metals on the bottom of the estuary. These heavy metals affect recreationally and commercially important fin and shellfish species; shellfish may inhabit the benthos (bottom of the estuary), finfish may feed on bottom-dwelling organisms. Specific effects of metal pollution to these organisms include growth inhibition, tissue degeneration, and lack of repair or regeneration of damaged tissue. (Kennish 1992)
Sediment
Another pollutant loaded by SW is sediment. Sediment is naturally introduced to a water body system through erosion, but sediment loading may be increased greatly when the landscape is altered through human processes. Sediment loading increases the total suspended solids (TSS) to a water body and as a result, increases the turbidity of a system. An increase in turbidity and TSS decreases the light penetration to the system, and will have adverse affects on the phototrophic organisms in the water column. Also, suspended sediments may clog the gills of fish, thus interfering with the respiratory abilities of the fish. Sources for sediment loaded to a system include; agriculture, forestry practices, streambank erosion, construction activities, and mining activities. The most significant sources for sediment loading include agriculture and land development (highways, shopping centers, and residential subdivisions). Sediment may often carry other contaminants including nutrients, bacteria, and toxic/synthetic chemicals which contribute to water quality degradation. All of these contaminants may concentrate on sediments, and thus be transported in one slug of material to a body of water. For example, a study was done to determine the fate and transport of mercury among other trace metals in Chesapeake Bay. Mercury is only one example of a contaminant able to concentrate on sediment, however, many other contaminants including nutrients, pesticides, chemicals, oils and grease, and pathogens follow suit.
Nutrients Nutrients are loaded into receiving waters through SW runoff, with primary concern being for N (nitrogen) and P (phosphorus) species. Non-point sources of nutrients include agricultural and urban runoff, wastewater treatment plants, forestry activities, and atmospheric deposition. Non-point source runoff of nutrients comes mostly in the form of fertilizer and animal wastes. Nutrients fuel primary production, meaning that phytoplankton consume nutrients. So, up to a certain level, nutrients are required in order for phytoplankton to survive and provide for higher trophic levels. However, if too many nutrients are loaded to a system, this will throw off the trophic balance, and higher trophic levels may not be able to keep up (consume) the primary production (phytoplankton). Also, the different forms of nitrogen loaded to a system support growth of different forms of phytoplankton, some of which may be toxic. For example, addition of ammonium, nitrate, and urea combined produce a higher percentage of cyanobacteria (12%) than did a control without these sources (1%). (Paerl 2004) Cyanobacteria may be especially harmful due to their toxicity. As a result, excessive nutrients loaded to a system may contribute to harmful algal blooms (HABs), which are very detrimental to the ecosystem. “Out of the thousand species of phytoplankton, 63 are known to be toxic to animals and humans”(Dorfman and Stoner 2004). The toxicity of these phytoplankton blooms may cause respiratory problems, eye irritation, short-term memory loss, dizziness, muscular aches, peripheral tingling, vomiting, and abdominal pain in humans. (Stoner et al. 2004) The most prevalent mode for human illness associated with toxic algal blooms derives from eating contaminated shellfish. Fish and other benthic invertebrates, as well as larger marine mammals may also be affected by toxic blooms. Algal blooms deplete the water column of oxygen, which increases occurrence of hypoxic and anoxic conditions, in turn affecting organisms which rely upon oxygen to
survive. Fish kills are sometimes a result of HABs due to oxygen depletion of the water. Decomposition of algal matter may also contribute to the sediment oxygen demand (SOD), which would further decrease the oxygen available in the water column. Greater production of algal particles in general by nutrient loading will contribute also to the transport and survival of pathogens in the water column. Algal particles are light particles, and so they remain suspended in the water column (i.e. they do not sink and deposit on the sediment). Algal particles then will suspend whatever is attached to them in the water column for longer periods of time than would heavier particles, thus presenting a larger amount of time in which the pathogens could come into contact with humans (see next section). Also, particles tend to shade the pathogens from sunlight, which would help to break them down, thus helping pathogen survival in the water column.
Pathogens Pathogen contamination to bodies of water due to SW runoff is one important pollutant which has large scale implications for human health. Pathogens have the ability to make humans sick and these illnesses can be carried through populations indirectly through contagious disease. Bacterial pathogens loaded into bodies of water through SW include Campylobacter jejuni, E. coli, Salmonella typhi, Shigella dysenteriae, Vibrio spp, Yersinia spp. Viral pathogens include Adenovirus, Coxsackievirus, Echovirus, Hepatitis, Norwalkvirus, Poliovirus, Reovirus, and Rotavirus. Harmful protozoa include Balantidium coli, Cryptosporidium, Entamoeba histolytica, Giardia lambia, Isospora belli, Isospora hominus, and Toxoplasma gondii. Each of these pathogenic organisms loaded to a body of water have corresponding illnesses associated. Thus, these pathogens have a direct impact to the health of fisheries and humans in contact with the contaminated system.
Microbial Contamination Microbial contamination to bodies of water has large-scale implications for human and ecosystem health. Bacterial pathogens are a subset of the microbial contaminants found in stormwater (SW) runoff that can impact both marine and freshwater receiving waters. The primary source of microbial contamination of concern is believed to be human and animal fecal waste and/or improperly treated sewage. Point source (PS) contamination of waters can come as a result of SW discharges that have been diverted through sewage treatment plants. Combined sewer overflows (CSOs) are one of the major causes of pathogen contamination in marine and Great Lakes waters near urban areas (Dorfman and Stoner 2004). CSOs are pipes designed to carry raw sewage and SW runoff from streets to sewage treatments plants. In the event of a heavy rain fall this volume of water often becomes too great for treatment plants to handle; flow is diverted to outflow points that discharge pollutants into the nearest stream or coastal waterway. Bacteria were recently cited as a major problem in urban runoff according to the EPA (Pitt et al. 2000). Bacteria are especially notorious for limiting human recreational and drinking water use due to their often low infectious doses and their ability to develop resistance to antibiotics. Exposure to water-borne disease can result from drinking infected water,
eating seafood from contaminated water, eating fresh produce irrigated or processed with polluted water, or from activities such as fishing or swimming in contaminated water.
Bacterial pathogens loaded into bodies of water through SW include Campylobacter jejuni, E. coli, Salmonella typhi, Shigella dysenteriae, Vibrio spp, Yersinia spp. Although they will not be reviewed in this paper there are a variety of other microbial contaminants that are substantial microbial contaminants. Viral pathogens include Adenovirus, Coxsackievirus, Echovirus, Hepatitis, Norwalkvirus, Poliovirus, Reovirus, and Rotavirus. Harmful protozoa include Balantidium coli, Cryptosporidium, Entamoeba histolytica, Giardia lambia, Isospora belli, Isospora hominus, and Toxoplasma gondii. These pathogens have a direct impact to the health of fisheries and humans in contact with the contaminated system.
Due to its complexity and physical nature, microbial contamination in SW has the immense potential to sicken a large number of people quickly and through a wide array of pathogens with little or no warning. This potential for an epidemic outbreak of disease is especially alarming considering what could be done to prevent such an event from occurring.
Part of the problem is that storm drain water is rarely subject to treatment and is often discharged directly into the ocean. Total and fecal coliforms, as well as Enterococci are found at such outfalls as well as pathogenic human enteric viruses. (Haile et al. 1999) The presence of these and other pathogens from raw, or poorly treated sewage, in water bodies, presents a potentially serious public health threat. Even if the receiving waters are not designated for water contact recreation, it often may not require much raw or poorly treated sewage to cause health problems due to pathogens. (Pitt et al. 2000). Comparatively, a major problem identified by NOAA’s Undersea Research Project (NURP) noted that illicit connections of sanitary discharges to SW sewer systems resulted in high bacterial counts and dangers to public health. Often these “illegal” forms of sanitary discharges are the result of intense rainfall in a brief period of time that overflows sewage containment facilities and sewer outfalls. Furthermore, indirect connections such as contributions from leaky sewerage lines can infiltrate a separate storm drainage system and load sizeable amounts of pathogens over time. (Pitt et al. 2000)
Methods of Exposure There are several exposure pathways through which contaminated SW can cause human health problems. These include exposure to SW contaminants at swimming and recreational areas affected by SW discharges, drinking water supplies contaminated by SW discharges, and the consumption of fish and shellfish that have been contaminated by SW pollutants (Pitt et al. 2000). Large portions of water borne pathogens are contracted while swimming. A typical scenario is that water play will occasionally result in the often-unconscious consumption of a small amount of contaminated water. If concentrations of a particular pathogen are high enough in the ingested water the individual becomes ill. Children and the elderly are typically more at risk due to
underdeveloped or waning immune systems. Immuno-compromised individuals due to predisposed illnesses are also at higher risk of contracting disease due to their weakened state of health. Surfers and more continuous ocean goers are also at an elevated risk of infection due to their large amount of time in the water. Ingestion and/or other exposure at low doses over an extended period can result in the internal accumulation of the pathogen and consequently a higher probability of contracting a disease. (Noble 2004) Additional pathogens are vectored by hosts such as shellfish and other edible marine organisms that are popular served raw or are unintentionally prepared incorrectly. In simplified terms, bacterial pathogens are unconsciously and easily contracted in what is becoming a more microbial contaminated environment due nearly exclusively to anthropogenic activities.
Impacts of Human Health
Much of the human risk assessment associated with SW exposure has been determined using theoretical evaluations, which rely on SW characteristics and laboratory studies instead of actual population studies. Some site investigations, especially related to swimming beach problems associated with nearby SW discharges, have been conducted in stream studies of the fate and transport of pathogens and indicator organisms (Easton 2000). Few epidemiological studies have been conducted to assess the linkage between SW runoff and human health. One study that does explore this topic, however, is work done by Robert Haile et al. completed in 1999. The basic premise of his study showed that symptoms relating to microbial contamination were elevate “for subjects swimming (a) closer to storm drains, (b) in water with high levels of single bacterial indicators and a low ratio of total to fecal coliforms, and (c) in water where enteric viruses were detected.” These results imply that there is an increased risk of adverse health effects associated with swimming in ocean water subject to runoff. He goes on to state that over 100 in 10,000 test subjects exposed to contaminated water presented a range of symptoms. Although these numbers may appear to be low, the risks are not trivial when considering the millions of people who visit beaches each year (Haile et al 1999).
An individual swimming beach study in Hong Kong revealed that water contained E. coli, Klebsiella spp., fecal streptococci, fecal coliforms, staphylococci, Pseudomonas aeruginosa, Candida albicans, and total fungi. Symptoms included gastrointestinal, ear, eye, skin, respiratory, and fever. While these symptoms are not pleasant, they are typically rather mild, and therefore are often not clinically documented. However, each symptom does have the potential to induce chronic health problems.
E. coli and Enterococci alone can result in fever, chills, eye discharge, earache, skin rashes, infected cuts, nausea, vomiting, diarrhea, bloody diarrhea, severe stomach pain, severe cough, cough with phlegm, runny nose, sore throat, Highly Credible Gastrointestinal Illness, (HCGI 1,2), as well as significant respiratory disease (Haile et al. 1999). A deadly rendition of the normally harmless E. coli family, strain O157:H7 was first identified in 1982 and remained somewhat of a medical mystery until 1993. This particular strain is a bacterial hybrid that clings to mucosal surfaces in the human intestine and produces toxins that trigger hemolytic uremic syndrome, the most common

cause of acute kidney failure in children. (Drexler 2002) A potent threat to children and the aged, E. coli O157:H7 “…can kill a previously healthy person in the space of a week”. (Drexler 2002) This microbial contaminant is becoming continuously more prevalent in coastal water bodies drastically impacting human health. The potentially severe consequences of E. coli O157 was illustrated in 2001with two deaths of preschool aged children in Minnesota due to hemolytic uremic syndrome caused by E. coli O157 infections (Minnesota Department of Health 2004).
Vibrio is a naturally occurring estuarine bacterium responsible for a high percentage of the deaths associated with shellfish consumption (National Assessment Synthesis Team, Health Sector, 2000). Vibrio vulnificus, which is a lactose-fermenting bacillus is known to produce severe localized or systemic illness. In both cases, the common features were ESRD-related immunocompromised state and exposure to marine environments. V. vulnificus causes primary septicemia and wound infections in humans. Primary septicemia usually occurs through ingestion of raw shellfish, especially oysters, by people who are predisposed to infection by increased serum iron levels or who are immunocompromised.
Development of new technologies Most microbiological water quality standards are based on indicator bacteria used as proxies of the presence of viral and bacterial pathogens. However there have been recent improvements in technology that have enabled detection and enumeration of pathogens that actually cause human health risks. It seems logical and more efficient, therefore, to
Figure II-1. Examples of Vibrio sp. wound infections from water contact
begin assessing health risks using new methods of pathogen measurement and detection, as opposed to maintaining a focus on the indicator species. The same technological advancements that have been made for detecting pathogens will allow for a more rapid estimation of indicator bacteria. This point is important, as the USEPA is likely to continue to require sampling for indicator bacteria, since the regulations and standards exist for this parameter. Currently there are few established thresholds for viral and bacterial pathogens in recreational and shellfish harvesting waters (like there are for food microbial contaminants). Those that are in place are out dated and in need of reform.
In 1943, California adopted a total coliforms standard of 10 MPN/1 mL for swimming areas. Surprisingly this standard was not based on any evidence, but was assumed to relate well with the drinking water standard at the time (Dufor 1984). Traditionally, indicator bacteria have been used to evaluate potential health risks of contaminated water (Geldreich 1976) as surrogates for the actual pathogens of concern due to the lack of technology, lack of expertise, and high cost of detecting and/or enumerating the actual pathogens. Indicator bacteria most commonly used in detection are total coliforms, E. coli, and Enterococci. Total coliforms refer to a number of bacteria including Escherichia, Klebsiella, Citrobacter, and Enterobacter. Each of these is a gram-negative asporogenous rod that is often associated with feces of warm-blooded animals (Dufour 1984).
The current method used to evaluate recreational waters requires an incubation period of 18 to 96 hours. Several studies have shown, however, that during this time, temporal changes in indicator bacteria levels may occur much more quickly and there-by make the results less useful (Noble 2004). This time lag is also problematic for tracking contamination sources. Fecal contamination signals, for example, can dissipate or become less concentrated while samples are being processed, further hindering tracing of the contamination (Noble 2004). Recently, indicator bacteria data used to evaluate health risk due to pathogens have been shown to be inadequate (Kay and Fricker 1997). The low infectious dose and high persistence of viral and protozoan pathogens confounds the use of indicator bacteria as predictors of health risk. The relationship is further convoluted by the fact that indicator bacteria and pathogens do not share identical sources (Pitt et al. 2000). Furthermore, E. coli has been located in pristine tropical rain forest and some species of Enterococci have been found on some plants, which suggest that both may not be a reliable indicator of human pathogen contamination (Bermudez and Hazen 1988).
There have been many recent improvements in technology that have enabled detection and enumeration of pathogens that actually cause human health risks. The benefits of such an improvement are discovering public beach contamination in half the time of standard methods, being able to re-open beaches in just 24 hours, and also eliminating tedious membrane filtration work.
Promising new techniques generally involve target capture, in which a specified microbial group of concern is removed, tagged and/or amplified to differentiate if from the remaining material in the sample. The next step involves “optical, electrochemical or
piezoelectric technologies are used to quantify the captured, tagged or amplified material” (Noble & Weisberg 2004). New molecular methods that now allow for the direct measurement of cellular properties without incubation are available and have the potential to reduce the measurement time lag to less than an hour. This new technology also allows for a greater number and more types of microbial indicators to be measured. This new technique does not require culturing and allow for microbial contaminants such as viruses to be measured as easily as bacterial indicators. The three primary capture methods used in rapid microbial detection are: molecular whole-cell and surface recognition methods, nucleic acid detection methods, and enzyme/substrate methods (Noble & Weisberg 2004). There are a number of rapid detection methods currently being refined which include but are not limited to: dual wavelength fluorometry, Immunoassaying, and PCR-based detection. These procedures are not yet perfected, however, as detection sensitivity and developing a relationship to health risks are primary obstacles (Noble & Weisberg 2004).
Different land-uses in NC along with implications of SW runoff (loading) of contaminants from different land uses
The type of land use correlates to loading of the above contaminants by SW into bodies of water. Watershed boundaries are defined as “high points where a drop of water landing outside of the boundary would drain to a different stream”(Stormwater Manager’s Resource Center 2004). Focus on mitigation measures to improve the water quality must begin with a focus on the watershed of the impaired water body. Citizens in the area must have a firm understanding of their actions and how they contribute to the pollutant loading to a water system. Population increase, especially to coastal areas, has caused a cascade of adverse affects to our water quality by changing land uses. This increase in population has lead to greater urbanization of coastal watersheds, more need for agricultural operations to provide food for the increase in population, more impervious land cover, and other affects. The type of land use will contribute to loading of different contaminants during storm events. Once rural land has now become urbanized, and changed the filtration abilities of the land. Also, for example, as SW washes over impervious land cover and agricultural lands, the contaminants loaded to receiving bodies will differ. Thus the type of land use has specific implications for loading of certain contaminants to bodies of water. Furthermore, the total loading of most all contaminants has increased due to the urbanization and population increase, especially in coastal areas.
There are many different land-uses which cause the contaminants detailed above to runoff due to SW and in turn, affect water quality. In many watersheds, the urbanization of once rural land has contributed to the amount of contaminants in our water bodies. With increase in urbanization there is more impervious surface cover (See Chapter 3), which not only collects contaminants, but also decreases the amount of land cover in which the contaminants could filter slowly through the sediment. “As SW washes over roads, rooftops, parking lots, construction sites, and industrial or commercial sites, it becomes contaminated with oil and grease, heavy metals, pesticides, litter, and pollutants
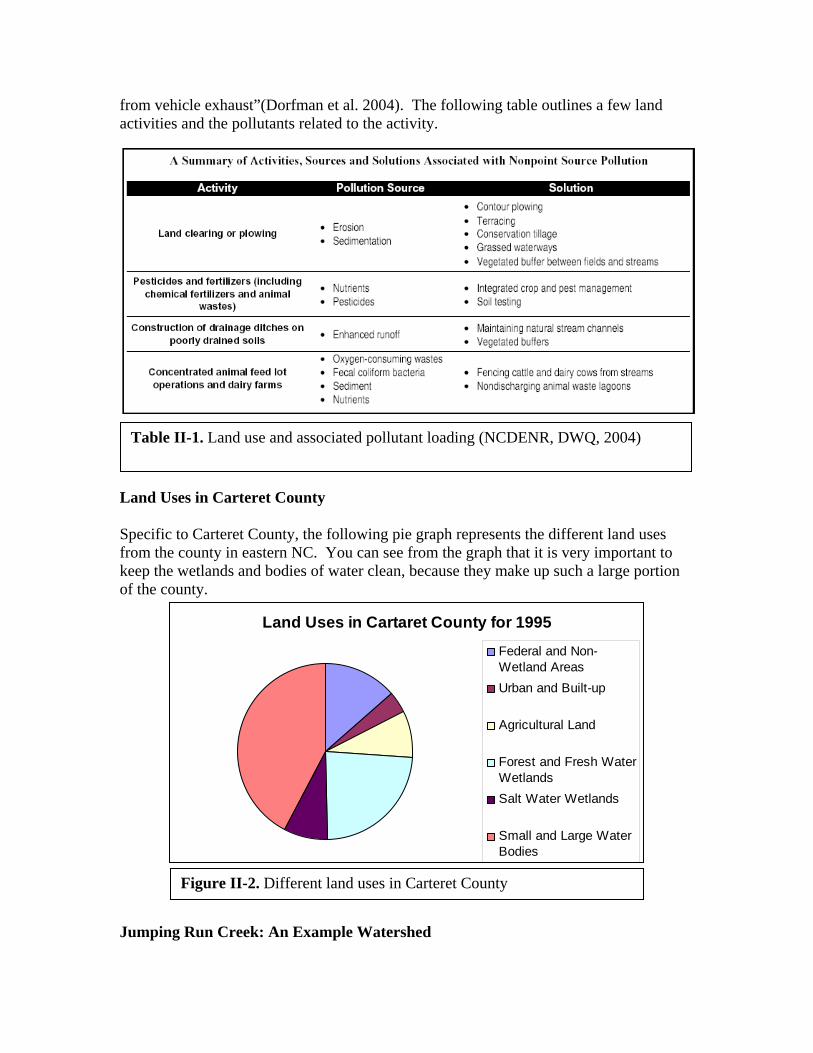
from vehicle exhaust”(Dorfman et al. 2004). The following table outlines a few land activities and the pollutants related to the activity.
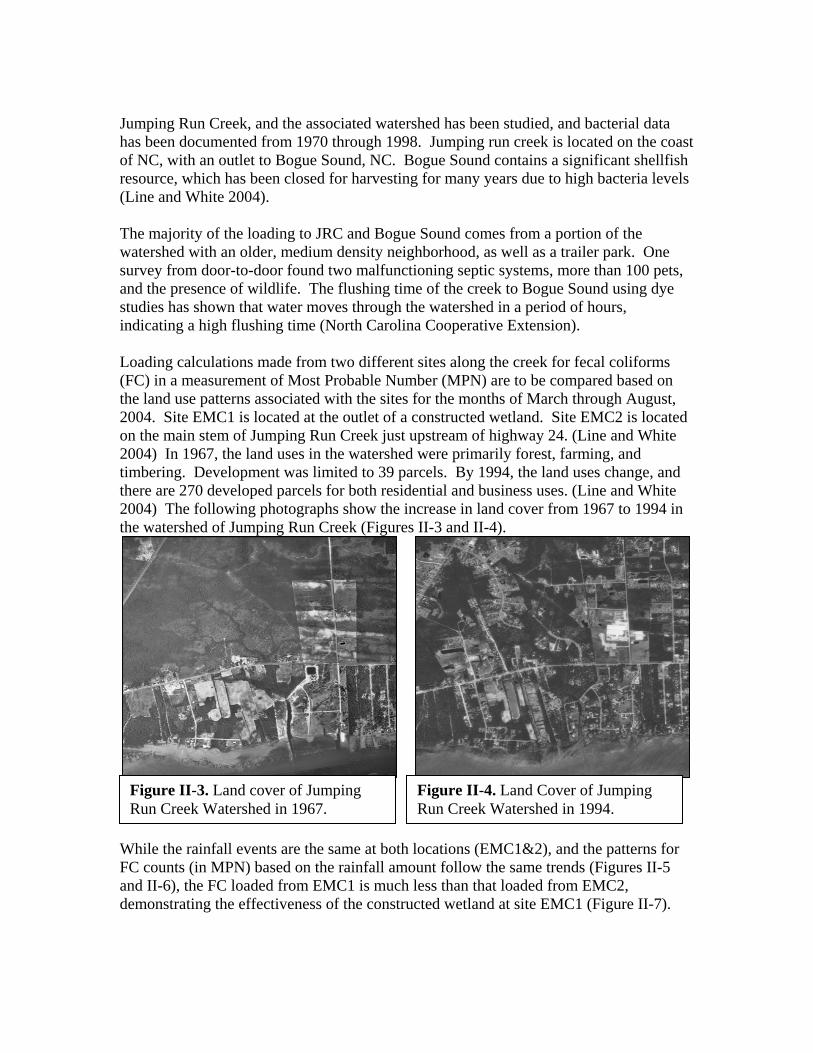
Land Uses in Carteret County Specific to Carteret County, the following pie graph represents the different land uses from the county in eastern NC. You can see from the graph that it is very important to keep the wetlands and bodies of water clean, because they make up such a large portion of the county.
Jumping Run Creek: An Example Watershed
Land Uses in Cartaret County for 1995
Federal and Non-Wetland Areas
Urban and Built-up
Agricultural Land
Forest and Fresh WaterWetlands
Salt Water Wetlands
Small and Large WaterBodies
Table II-1. Land use and associated pollutant loading (NCDENR, DWQ, 2004)
Figure II-2. Different land uses in Carteret County
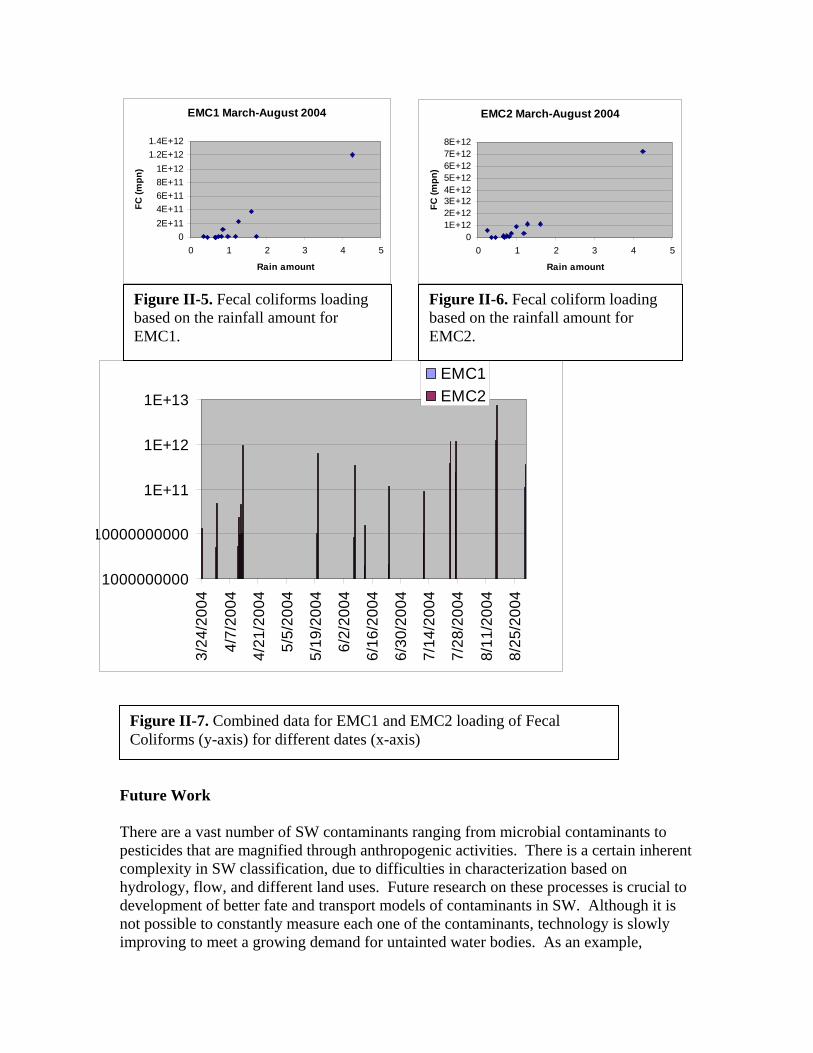
Jumping Run Creek, and the associated watershed has been studied, and bacterial data has been documented from 1970 through 1998. Jumping run creek is located on the coast of NC, with an outlet to Bogue Sound, NC. Bogue Sound contains a significant shellfish resource, which has been closed for harvesting for many years due to high bacteria levels (Line and White 2004).
The majority of the loading to JRC and Bogue Sound comes from a portion of the watershed with an older, medium density neighborhood, as well as a trailer park. One survey from door-to-door found two malfunctioning septic systems, more than 100 pets, and the presence of wildlife. The flushing time of the creek to Bogue Sound using dye studies has shown that water moves through the watershed in a period of hours, indicating a high flushing time (North Carolina Cooperative Extension).
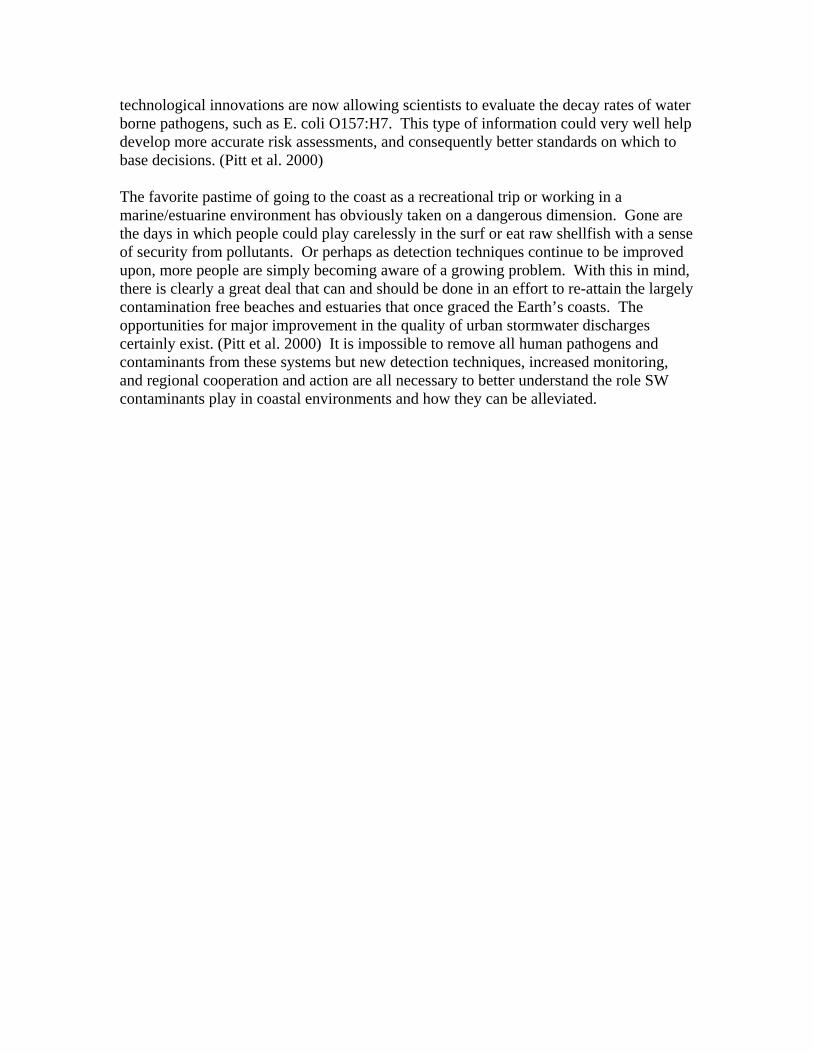
Loading calculations made from two different sites along the creek for fecal coliforms (FC) in a measurement of Most Probable Number (MPN) are to be compared based on the land use patterns associated with the sites for the months of March through August, 2004. Site EMC1 is located at the outlet of a constructed wetland. Site EMC2 is located on the main stem of Jumping Run Creek just upstream of highway 24. (Line and White 2004) In 1967, the land uses in the watershed were primarily forest, farming, and timbering. Development was limited to 39 parcels. By 1994, the land uses change, and there are 270 developed parcels for both residential and business uses. (Line and White 2004) The following photographs show the increase in land cover from 1967 to 1994 in the watershed of Jumping Run Creek (Figures II-3 and II-4).
While the rainfall events are the same at both locations (EMC1&2), and the patterns for FC counts (in MPN) based on the rainfall amount follow the same trends (Figures II-5 and II-6), the FC loaded from EMC1 is much less than that loaded from EMC2, demonstrating the effectiveness of the constructed wetland at site EMC1 (Figure II-7).
Figure II-3. Land cover of Jumping Run Creek Watershed in 1967.
Figure II-4. Land Cover of Jumping Run Creek Watershed in 1994.
Future Work There are a vast number of SW contaminants ranging from microbial contaminants to pesticides that are magnified through anthropogenic activities. There is a certain inherent complexity in SW classification, due to difficulties in characterization based on hydrology, flow, and different land uses. Future research on these processes is crucial to development of better fate and transport models of contaminants in SW. Although it is not possible to constantly measure each one of the contaminants, technology is slowly improving to meet a growing demand for untainted water bodies. As an example,
EMC1 March-August 2004
0
2E+11
4E+11
6E+11
8E+11
1E+12
1.2E+12
1.4E+12
0 1 2 3 4 5
Rain amount
FC
(m
pn
)
EMC2 March-August 2004
01E+122E+123E+124E+125E+126E+127E+128E+12
0 1 2 3 4 5
Rain amount
FC
(m
pn
)
1000000000
10000000000
1E+11
1E+12
1E+13
3/2
4/2
00
4
4/7
/20
04
4/2
1/2
00
4
5/5
/20
04
5/1
9/2
00
4
6/2
/20
04
6/1
6/2
00
4
6/3
0/2
00
4
7/1
4/2
00
4
7/2
8/2
00
4
8/1
1/2
00
4
8/2
5/2
00
4
EMC1
EMC2
Figure II-5. Fecal coliforms loading based on the rainfall amount for EMC1.
Figure II-6. Fecal coliform loading based on the rainfall amount for EMC2.
Figure II-7. Combined data for EMC1 and EMC2 loading of Fecal Coliforms (y-axis) for different dates (x-axis)
technological innovations are now allowing scientists to evaluate the decay rates of water borne pathogens, such as E. coli O157:H7. This type of information could very well help develop more accurate risk assessments, and consequently better standards on which to base decisions. (Pitt et al. 2000)
The favorite pastime of going to the coast as a recreational trip or working in a marine/estuarine environment has obviously taken on a dangerous dimension. Gone are the days in which people could play carelessly in the surf or eat raw shellfish with a sense of security from pollutants. Or perhaps as detection techniques continue to be improved upon, more people are simply becoming aware of a growing problem. With this in mind, there is clearly a great deal that can and should be done in an effort to re-attain the largely contamination free beaches and estuaries that once graced the Earth’s coasts. The opportunities for major improvement in the quality of urban stormwater discharges certainly exist. (Pitt et al. 2000) It is impossible to remove all human pathogens and contaminants from these systems but new detection techniques, increased monitoring, and regional cooperation and action are all necessary to better understand the role SW contaminants play in coastal environments and how they can be alleviated.
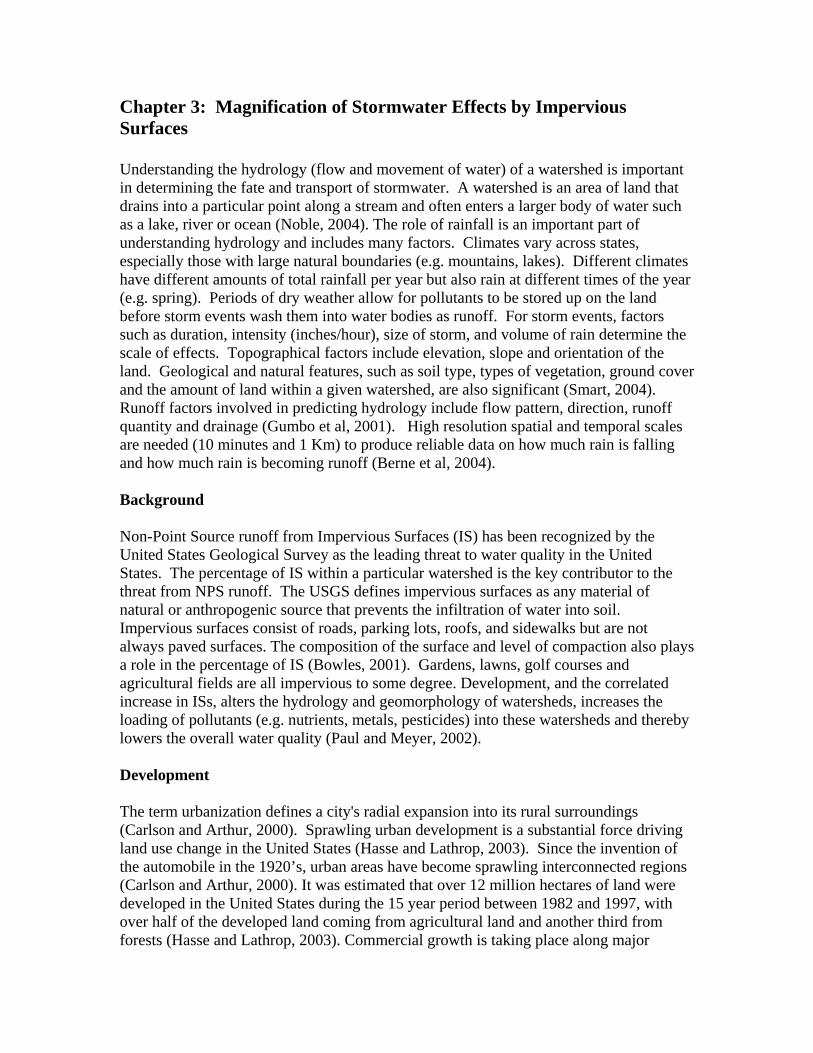
Chapter 3: Magnification of Stormwater Effects by Impervious Surfaces Understanding the hydrology (flow and movement of water) of a watershed is important in determining the fate and transport of stormwater. A watershed is an area of land that drains into a particular point along a stream and often enters a larger body of water such as a lake, river or ocean (Noble, 2004). The role of rainfall is an important part of understanding hydrology and includes many factors. Climates vary across states, especially those with large natural boundaries (e.g. mountains, lakes). Different climates have different amounts of total rainfall per year but also rain at different times of the year (e.g. spring). Periods of dry weather allow for pollutants to be stored up on the land before storm events wash them into water bodies as runoff. For storm events, factors such as duration, intensity (inches/hour), size of storm, and volume of rain determine the scale of effects. Topographical factors include elevation, slope and orientation of the land. Geological and natural features, such as soil type, types of vegetation, ground cover and the amount of land within a given watershed, are also significant (Smart, 2004). Runoff factors involved in predicting hydrology include flow pattern, direction, runoff quantity and drainage (Gumbo et al, 2001). High resolution spatial and temporal scales are needed (10 minutes and 1 Km) to produce reliable data on how much rain is falling and how much rain is becoming runoff (Berne et al, 2004). Background Non-Point Source runoff from Impervious Surfaces (IS) has been recognized by the United States Geological Survey as the leading threat to water quality in the United States. The percentage of IS within a particular watershed is the key contributor to the threat from NPS runoff. The USGS defines impervious surfaces as any material of natural or anthropogenic source that prevents the infiltration of water into soil. Impervious surfaces consist of roads, parking lots, roofs, and sidewalks but are not always paved surfaces. The composition of the surface and level of compaction also plays a role in the percentage of IS (Bowles, 2001). Gardens, lawns, golf courses and agricultural fields are all impervious to some degree. Development, and the correlated increase in ISs, alters the hydrology and geomorphology of watersheds, increases the loading of pollutants (e.g. nutrients, metals, pesticides) into these watersheds and thereby lowers the overall water quality (Paul and Meyer, 2002). Development The term urbanization defines a city's radial expansion into its rural surroundings (Carlson and Arthur, 2000). Sprawling urban development is a substantial force driving land use change in the United States (Hasse and Lathrop, 2003). Since the invention of the automobile in the 1920’s, urban areas have become sprawling interconnected regions (Carlson and Arthur, 2000). It was estimated that over 12 million hectares of land were developed in the United States during the 15 year period between 1982 and 1997, with over half of the developed land coming from agricultural land and another third from forests (Hasse and Lathrop, 2003). Commercial growth is taking place along major
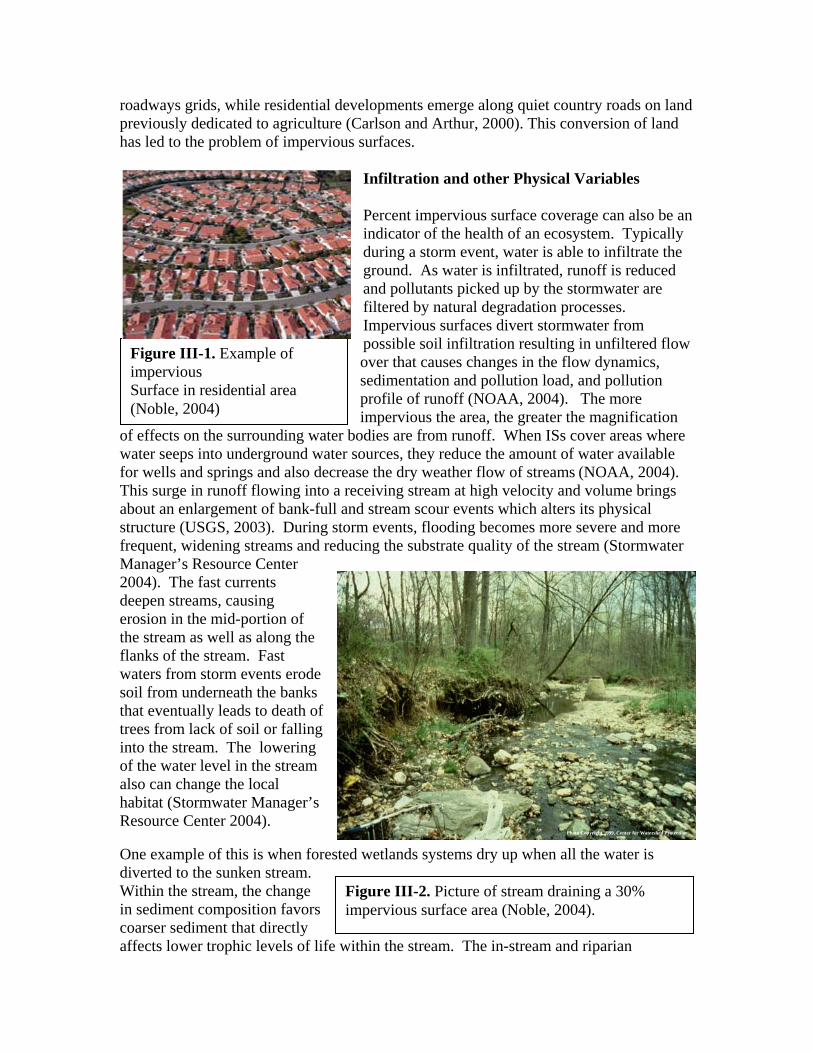
roadways grids, while residential developments emerge along quiet country roads on land previously dedicated to agriculture (Carlson and Arthur, 2000). This conversion of land has led to the problem of impervious surfaces.
Infiltration and other Physical Variables Percent impervious surface coverage can also be an indicator of the health of an ecosystem. Typically during a storm event, water is able to infiltrate the ground. As water is infiltrated, runoff is reduced and pollutants picked up by the stormwater are filtered by natural degradation processes. Impervious surfaces divert stormwater from possible soil infiltration resulting in unfiltered flow over that causes changes in the flow dynamics, sedimentation and pollution load, and pollution profile of runoff (NOAA, 2004). The more impervious the area, the greater the magnification
of effects on the surrounding water bodies are from runoff. When ISs cover areas where water seeps into underground water sources, they reduce the amount of water available for wells and springs and also decrease the dry weather flow of streams (NOAA, 2004). This surge in runoff flowing into a receiving stream at high velocity and volume brings about an enlargement of bank-full and stream scour events which alters its physical structure (USGS, 2003). During storm events, flooding becomes more severe and more frequent, widening streams and reducing the substrate quality of the stream (Stormwater Manager’s Resource Center 2004). The fast currents deepen streams, causing erosion in the mid-portion of the stream as well as along the flanks of the stream. Fast waters from storm events erode soil from underneath the banks that eventually leads to death of trees from lack of soil or falling into the stream. The lowering of the water level in the stream also can change the local habitat (Stormwater Manager’s Resource Center 2004). One example of this is when forested wetlands systems dry up when all the water is diverted to the sunken stream. Within the stream, the change in sediment composition favors coarser sediment that directly affects lower trophic levels of life within the stream. The in-stream and riparian
Figure III-1. Example of impervious Surface in residential area (Noble, 2004)
Photo Copyright 1999, Center for Watershed Protection
Figure III-2. Picture of stream draining a 30% impervious surface area (Noble, 2004).
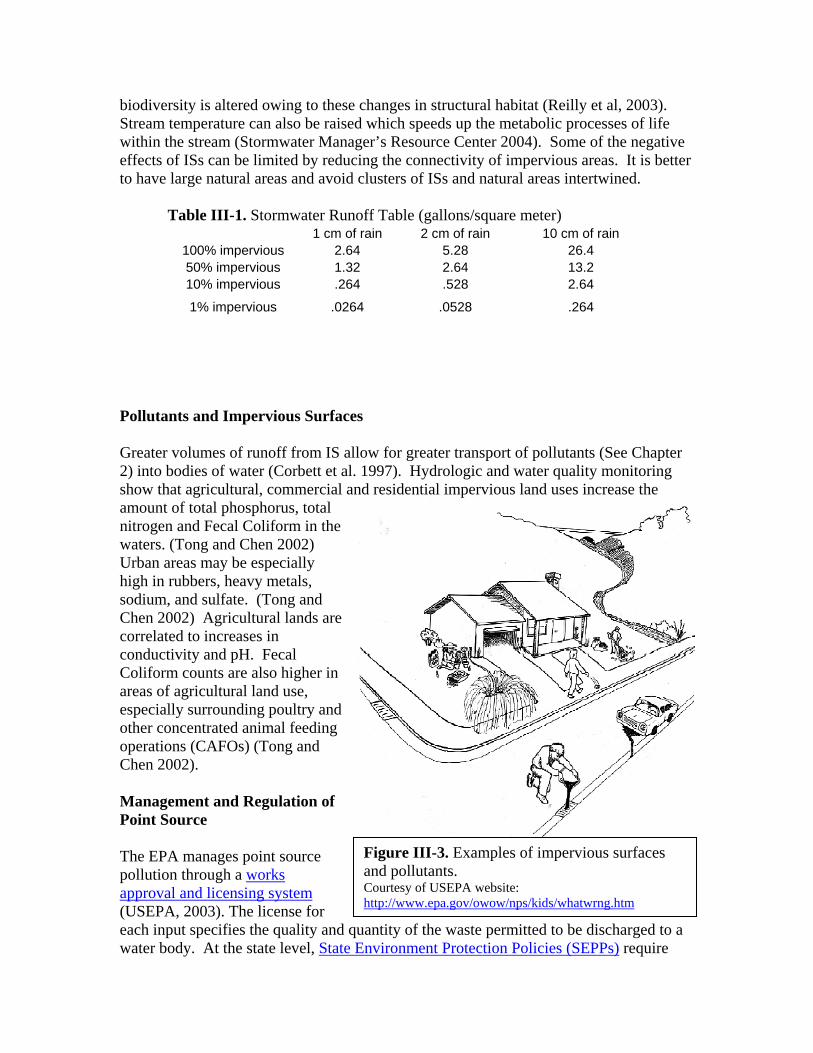
biodiversity is altered owing to these changes in structural habitat (Reilly et al, 2003). Stream temperature can also be raised which speeds up the metabolic processes of life within the stream (Stormwater Manager’s Resource Center 2004). Some of the negative effects of ISs can be limited by reducing the connectivity of impervious areas. It is better to have large natural areas and avoid clusters of ISs and natural areas intertwined. Table III-1. Stormwater Runoff Table (gallons/square meter)
1 cm of rain 2 cm of rain 10 cm of rain 100% impervious 2.64 5.28 26.4 50% impervious 1.32 2.64 13.2 10% impervious .264 .528 2.64
1% impervious .0264 .0528 .264 Pollutants and Impervious Surfaces Greater volumes of runoff from IS allow for greater transport of pollutants (See Chapter 2) into bodies of water (Corbett et al. 1997). Hydrologic and water quality monitoring show that agricultural, commercial and residential impervious land uses increase the amount of total phosphorus, total nitrogen and Fecal Coliform in the waters. (Tong and Chen 2002) Urban areas may be especially high in rubbers, heavy metals, sodium, and sulfate. (Tong and Chen 2002) Agricultural lands are correlated to increases in conductivity and pH. Fecal Coliform counts are also higher in areas of agricultural land use, especially surrounding poultry and other concentrated animal feeding operations (CAFOs) (Tong and Chen 2002). Management and Regulation of Point Source The EPA manages point source pollution through a works approval and licensing system (USEPA, 2003). The license for each input specifies the quality and quantity of the waste permitted to be discharged to a water body. At the state level, State Environment Protection Policies (SEPPs) require
Figure III-3. Examples of impervious surfaces and pollutants. Courtesy of USEPA website: http://www.epa.gov/owow/nps/kids/whatwrng.htm
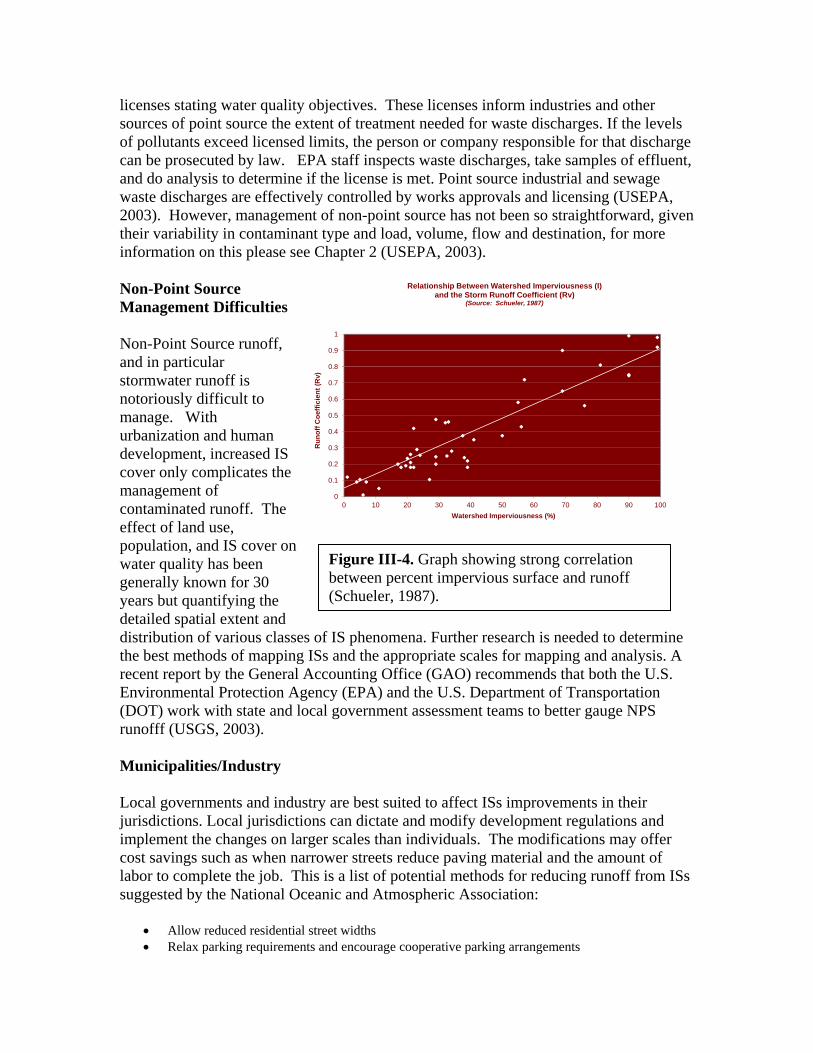
0
0.1
0.2
0.3
0.4
0.5
0.6
0.7
0.8
0.9
1
0 10 20 30 40 50 60 70 80 90 100
Ru
no
ff C
oef
fici
ent
(Rv)
Watershed Imperviousness (%)
Relationship Between Watershed Imperviousness (I)and the Storm Runoff Coefficient (Rv)
(Source: Schueler, 1987)
licenses stating water quality objectives. These licenses inform industries and other sources of point source the extent of treatment needed for waste discharges. If the levels of pollutants exceed licensed limits, the person or company responsible for that discharge can be prosecuted by law. EPA staff inspects waste discharges, take samples of effluent, and do analysis to determine if the license is met. Point source industrial and sewage waste discharges are effectively controlled by works approvals and licensing (USEPA, 2003). However, management of non-point source has not been so straightforward, given their variability in contaminant type and load, volume, flow and destination, for more information on this please see Chapter 2 (USEPA, 2003). Non-Point Source Management Difficulties Non-Point Source runoff, and in particular stormwater runoff is notoriously difficult to manage. With urbanization and human development, increased IS cover only complicates the management of contaminated runoff. The effect of land use, population, and IS cover on water quality has been generally known for 30 years but quantifying the detailed spatial extent and distribution of various classes of IS phenomena. Further research is needed to determine the best methods of mapping ISs and the appropriate scales for mapping and analysis. A recent report by the General Accounting Office (GAO) recommends that both the U.S. Environmental Protection Agency (EPA) and the U.S. Department of Transportation (DOT) work with state and local government assessment teams to better gauge NPS runofff (USGS, 2003). Municipalities/Industry Local governments and industry are best suited to affect ISs improvements in their jurisdictions. Local jurisdictions can dictate and modify development regulations and implement the changes on larger scales than individuals. The modifications may offer cost savings such as when narrower streets reduce paving material and the amount of labor to complete the job. This is a list of potential methods for reducing runoff from ISs suggested by the National Oceanic and Atmospheric Association:
Allow reduced residential street widths Relax parking requirements and encourage cooperative parking arrangements
Figure III-4. Graph showing strong correlation between percent impervious surface and runoff (Schueler, 1987).
Eliminate paved sidewalks or narrow them to four feet in width Encourage use of alternative paving materials for sidewalks, parking lots, and roads Encourage cluster development and allow taller buildings Avoid clear-cutting lots where possible Encourage green roofs Preserve existing vegetation and plant more vegetation to absorb extra runoff Provide public transit to reduce the traffic demand for widened or new roads Encourage infill development in existing built areas
For jurisdictions that are at or near build-out, new development may be relatively infrequent and many areas may be already overwhelmed by imperviousness. When a regions development slows and ISs are already prolific, retrofitting and implementing stormwater best management practices (BMPs) exist as alternatives (NOAA, 2004).
Domestic/Individual
Rain barrels can be used to collect runoff from rooftops of houses and commercial buildings. Rain gardens or bioretention zones are aesthetic solutions to runoff in impervious areas such as parking lots where water can be directed to so natural degradation of nutrients and the infiltration of pollutants can take place over time (Piehler, 2004). Driveways can be shortened or one driveway can lead to multiple homes. Pervious materials acting as partial filters to stormwater can also be used for the construction of driveways (Piehler, 2004)
Aerial photography and digital maps The relative contribution of different land use categories can be quanitfied by high-resolution imagery and aerial photographs. (USGS, 2004)
One widely accepted watershed-based water quality assessment tool, the Better Assessment Science Integrating Point and Non-Point Sources (BASINS), has been implemented in Ohio to model the relationship between land use and water quality (Tong and Chen, 2002). A tool such as BASINS that could be easily adapted to unique
Figure III-5. Examples of GIS mapping (USGS, 2004)
watersheds would allow for the better understanding of NPS runoff so that management can assess and regulate. Stormwater Billing/Economics Since stormwater has no single output point, ways for managing stormwater are being developed. Stormwater billing is one option that uses statistical sampling to charge for stormwater costs. Annual stormwater program costs are divided by total impervious area. Areas are measured and a median IS area is determined. Single-family homes are charged a rate of $4 each month with alterations based on the size of the home. Single-family Equivalent Units (SFEU) are the basis for how larger areas of ISs are billed. A SFEU is 2,260 square feet of IS. Non-residential properties are determined by dividing the amount of the property's IS by 2,260. Some issues surrounding stormwater billing have to do with whether billing should be annual or based on frequency and amount of rainfall. Benefit of natural areas Natural areas are an important part of maintaining water quality because they allow infiltration. Impervious surfaces create a barrier between the ground and vegetation that changes the flow rate and path that water takes into water bodies (Piehler, 2004). Vegetation such as trees and grass anchor the soil and take up water in their leaves. They prevent erosion from rain and wind as well as acting as a canopy with large surface area allowing evapotranspiration to take place (NOAA, 2004). Water that reaches the ground is absorbed by the complex shallow root systems of living vegetation and also by dead vegetation such as leaves and wood. Natural land coverage also facilitates the lateral movement of water into lakes, streams and wetlands called interflow. Vegetation surrounding bodies of water act as buffers which can reduce the amount of runoff and pollutants entering the body of water and increase aesthetic appeal (Piehler, 2004).The suggested ratio of impervious land to natural areas is 10% ISs. Water systems and ecosystems in areas with this amount of imperviousness are usually healthy and water quality exceeds EPA standards (Noble, 2004). When ISs exceed 30% coverage, the health of streams and watersheds severely declines (NOAA, 2004). Best Management Practices for Impervious Surfaces Stormwater BMPs for IS can be structured into four categories: filtration, infiltration, ponds, and wetlands (NOAA, 2004). Filtration BMPs use the natural capacity of plants to slow and filter runoff, increasing infiltration and reducing pollutant loads. Buffers made up of vegetation along the edges of streams and also grassy swales along roadways fall into this category. Infiltration devices like porous pavement are not completely impervious, allowing some water to soak into the ground so that overall runoff volume is reduced (NOAA, 2004). This method is often hindered by clogging from large particles. Stormwater ponds offer a collection point for runoff where natural processes are able to occur over a lengthened period of time. The settling of pollutants to the bottom of these ponds takes place where the natural nutrient needs of vegetation reduces input to
groundwater. Although not as applicable to upstream urban regions (impervious surfaces) because of the lack of available space, improvement of water quality through natural processes can be used for remediation in rural downstream locations. Natural areas in general can be constructed such as wetlands (See Chapter 4) to reduce runoff volume and pollutant loads as well as facilitate infiltration (NOAA, 2004).
The prevention of infiltration by impervious surfaces is a major problem for water quality because of increased runoff and pollutant loading in receiving bodies of water. The understanding of ISs will be improved with management and technology involving the government, private agencies, industry and individuals. It will be important for progress to be obvious through observation and empirical testing so that better water quality will continue to be sought after.
Chapter 4: Mitigation of Stormwater Runoff: Natural Ecosystems and Constructed Systems Mitigation efforts to alleviate consequences of stormwater can be achieved by decreasing the volume of runoff input (and consequently pollutant loads) or removing pollutants from the water before it enters larger systems (Barr Engineering Company, 2001). Opportunities for either mitigation means are vast, each offering advantages and disadvantages that deserve consideration before implementation. Mitigation strategies that pertain to urbanized and upstream areas have been a topic of the previous chapter. Here a focus lies on mitigation efforts in downstream locations with less development, near receiving waters. Generally, water pollution is most easily and cost effectively moderated through prevention. Reducing the volume of water used, reusing the same water for multiple purposes, and recycling in general are the most direct methods of reducing water quality degradation. Prevention or efficient clean-up of oil or industrial spills would likewise prevent the introduction of those pollutants into aquatic environments. Once added to water, pollutants can be directly treated to improve water quality before it is introduced to a larger system. Wastewater treatment plants and industrial sites use methods such as filtration, chlorination, ultraviolet degradation, ozonation, and settlement to remove pollutants (Vigil, 2003). Components of these treatments could be used to improve water quality that is degraded through stormwater pollution, but are probably not the most appropriate methods for Eastern North Carolina. Treatment similar to those that occur at wastewater treatment plants would be more effective in densely populated areas where infrastructure development, including a treatment facility and piping to collect and reroute stormwater, would be necessary to treat the vast quantity of stormwater resulting from large areas of impervious surface (see Chapter 3). The basic methods used to improve water quality have nature as their foundation. Sedimentation, biodegradation, filtration, and sorption (Vigil, 2003) are all processes that occur in the natural environment and which are modified to more directly and immediately treat degraded water in various situations (wastewater, industrial discharge treatments). The ecosystems that provide these services do so at a rate that unable to compete with increasing water quality degradation. In the face of increasing population growth and conversion of sensitive environmental areas to agricultural or real estate property, the incorporation of constructed stormwater mitigation systems, BMPs, is becoming increasingly important in downstream areas (Hunt and Doll, 2000). Background Stormwater and associated pollutants enter lakes and rivers upstream and eventually arrive at coastal receiving waters, where ecosystem and water quality degradation is continued. The presence of natural buffers and utilization of BMPs can interrupt the direct link between pollutants that enter waterways upstream and downstream receivers by encouraging infiltration, slowing runoff, utilizing pollutants, and a variety of other methods. Coastal areas vary from other locations in circumstances surrounding
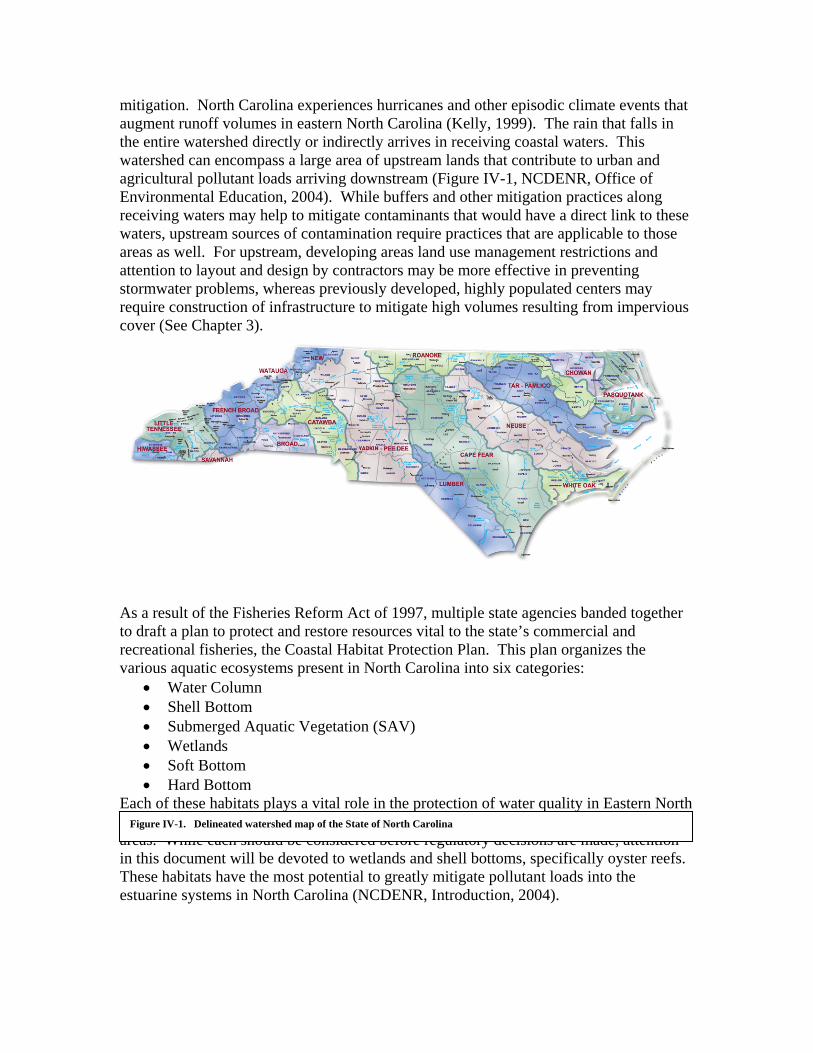
mitigation. North Carolina experiences hurricanes and other episodic climate events that augment runoff volumes in eastern North Carolina (Kelly, 1999). The rain that falls in the entire watershed directly or indirectly arrives in receiving coastal waters. This watershed can encompass a large area of upstream lands that contribute to urban and agricultural pollutant loads arriving downstream (Figure IV-1, NCDENR, Office of Environmental Education, 2004). While buffers and other mitigation practices along receiving waters may help to mitigate contaminants that would have a direct link to these waters, upstream sources of contamination require practices that are applicable to those areas as well. For upstream, developing areas land use management restrictions and attention to layout and design by contractors may be more effective in preventing stormwater problems, whereas previously developed, highly populated centers may require construction of infrastructure to mitigate high volumes resulting from impervious cover (See Chapter 3).
As a result of the Fisheries Reform Act of 1997, multiple state agencies banded together to draft a plan to protect and restore resources vital to the state’s commercial and recreational fisheries, the Coastal Habitat Protection Plan. This plan organizes the various aquatic ecosystems present in North Carolina into six categories:
Water Column Shell Bottom Submerged Aquatic Vegetation (SAV) Wetlands Soft Bottom Hard Bottom
Each of these habitats plays a vital role in the protection of water quality in Eastern North Carolina and all are interdependent on each other, the water column uniting the other areas. While each should be considered before regulatory decisions are made, attention in this document will be devoted to wetlands and shell bottoms, specifically oyster reefs. These habitats have the most potential to greatly mitigate pollutant loads into the estuarine systems in North Carolina (NCDENR, Introduction, 2004).
Figure IV-1. Delineated watershed map of the State of North Carolina
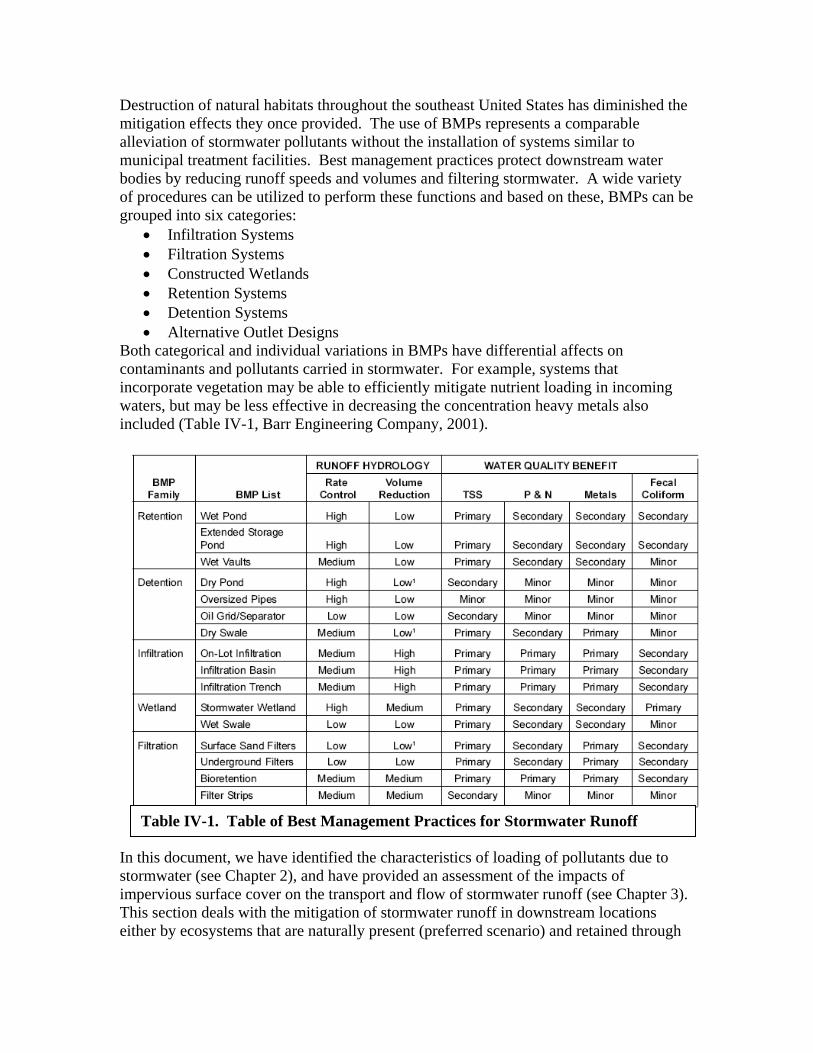
Destruction of natural habitats throughout the southeast United States has diminished the mitigation effects they once provided. The use of BMPs represents a comparable alleviation of stormwater pollutants without the installation of systems similar to municipal treatment facilities. Best management practices protect downstream water bodies by reducing runoff speeds and volumes and filtering stormwater. A wide variety of procedures can be utilized to perform these functions and based on these, BMPs can be grouped into six categories:
Infiltration Systems Filtration Systems Constructed Wetlands Retention Systems Detention Systems Alternative Outlet Designs
Both categorical and individual variations in BMPs have differential affects on contaminants and pollutants carried in stormwater. For example, systems that incorporate vegetation may be able to efficiently mitigate nutrient loading in incoming waters, but may be less effective in decreasing the concentration heavy metals also included (Table IV-1, Barr Engineering Company, 2001).
In this document, we have identified the characteristics of loading of pollutants due to stormwater (see Chapter 2), and have provided an assessment of the impacts of impervious surface cover on the transport and flow of stormwater runoff (see Chapter 3). This section deals with the mitigation of stormwater runoff in downstream locations either by ecosystems that are naturally present (preferred scenario) and retained through
Table IV-1. Table of Best Management Practices for Stormwater Runoff
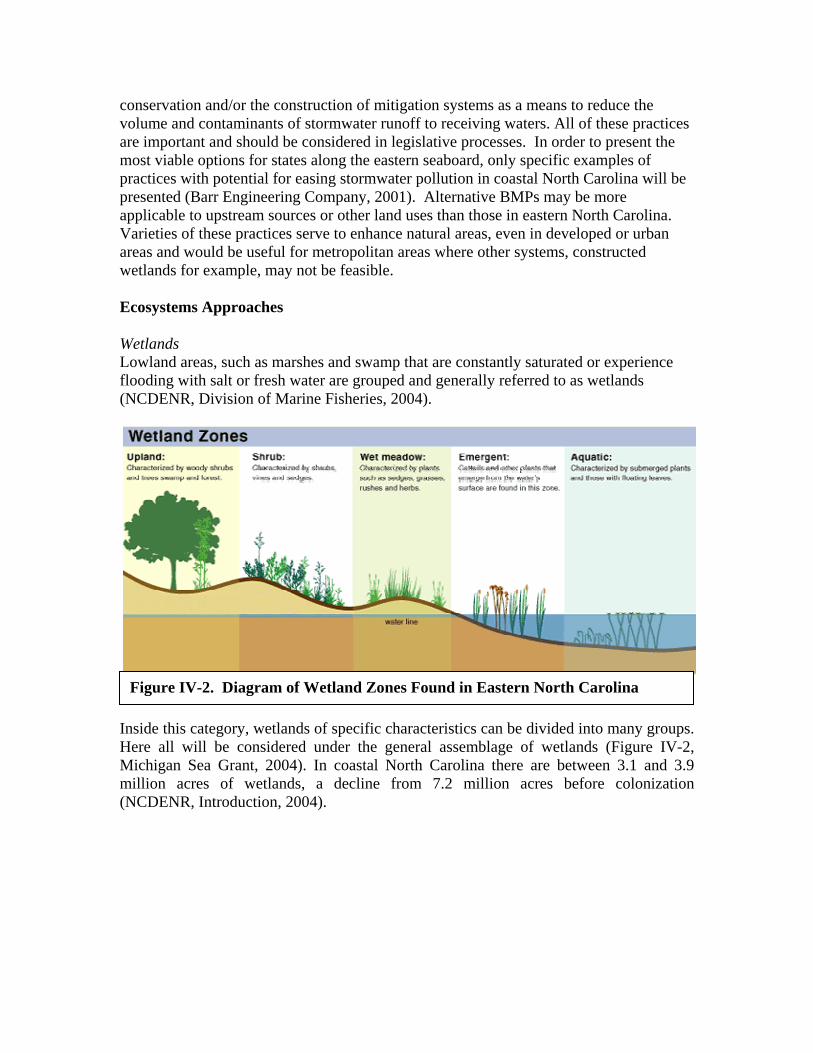
conservation and/or the construction of mitigation systems as a means to reduce the volume and contaminants of stormwater runoff to receiving waters. All of these practices are important and should be considered in legislative processes. In order to present the most viable options for states along the eastern seaboard, only specific examples of practices with potential for easing stormwater pollution in coastal North Carolina will be presented (Barr Engineering Company, 2001). Alternative BMPs may be more applicable to upstream sources or other land uses than those in eastern North Carolina. Varieties of these practices serve to enhance natural areas, even in developed or urban areas and would be useful for metropolitan areas where other systems, constructed wetlands for example, may not be feasible. Ecosystems Approaches Wetlands Lowland areas, such as marshes and swamp that are constantly saturated or experience flooding with salt or fresh water are grouped and generally referred to as wetlands (NCDENR, Division of Marine Fisheries, 2004).
Inside this category, wetlands of specific characteristics can be divided into many groups. Here all will be considered under the general assemblage of wetlands (Figure IV-2, Michigan Sea Grant, 2004). In coastal North Carolina there are between 3.1 and 3.9 million acres of wetlands, a decline from 7.2 million acres before colonization (NCDENR, Introduction, 2004).
Figure IV-2. Diagram of Wetland Zones Found in Eastern North Carolina
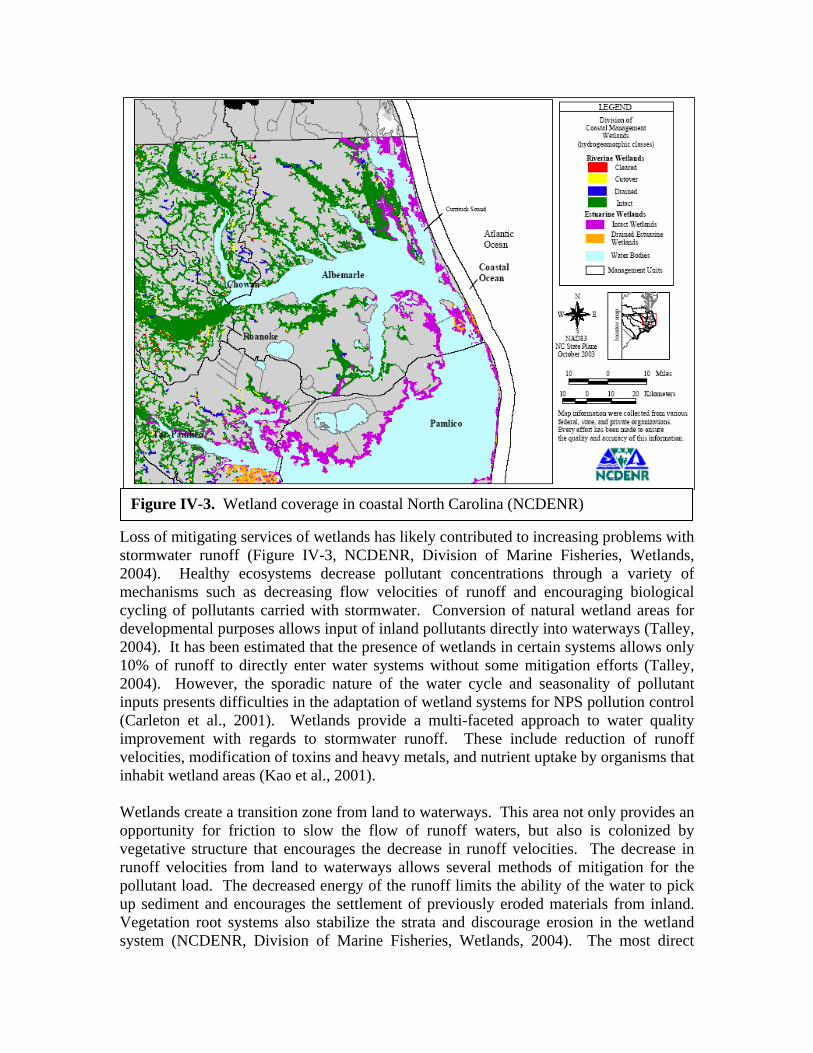
Loss of mitigating services of wetlands has likely contributed to increasing problems with stormwater runoff (Figure IV-3, NCDENR, Division of Marine Fisheries, Wetlands, 2004). Healthy ecosystems decrease pollutant concentrations through a variety of mechanisms such as decreasing flow velocities of runoff and encouraging biological cycling of pollutants carried with stormwater. Conversion of natural wetland areas for developmental purposes allows input of inland pollutants directly into waterways (Talley, 2004). It has been estimated that the presence of wetlands in certain systems allows only 10% of runoff to directly enter water systems without some mitigation efforts (Talley, 2004). However, the sporadic nature of the water cycle and seasonality of pollutant inputs presents difficulties in the adaptation of wetland systems for NPS pollution control (Carleton et al., 2001). Wetlands provide a multi-faceted approach to water quality improvement with regards to stormwater runoff. These include reduction of runoff velocities, modification of toxins and heavy metals, and nutrient uptake by organisms that inhabit wetland areas (Kao et al., 2001). Wetlands create a transition zone from land to waterways. This area not only provides an opportunity for friction to slow the flow of runoff waters, but also is colonized by vegetative structure that encourages the decrease in runoff velocities. The decrease in runoff velocities from land to waterways allows several methods of mitigation for the pollutant load. The decreased energy of the runoff limits the ability of the water to pick up sediment and encourages the settlement of previously eroded materials from inland. Vegetation root systems also stabilize the strata and discourage erosion in the wetland system (NCDENR, Division of Marine Fisheries, Wetlands, 2004). The most direct
Figure IV-3. Wetland coverage in coastal North Carolina (NCDENR)
improvement to water quality through this process is the decrease of turbidity and improvement of water clarity in waterways. However, the settlement of suspended solids also encourages deposition of nutrients, toxins, and trace metals adsorbed to these particulate materials (NCDENR, Division of Marine Fisheries, Wetlands, 2004). In this manner, wetlands have been shown to act as both temporary and permanent sinks for nutrients, specifically nitrogen and phosphorous (Kadlec and Knight, 1996, Carleton et al., 2001). Sedimentation is also believed to be the most significant removal mechanism of adsorbed heavy metals from stormwater runoff. A preferential settlement of finer particulate matter suggests that even small decreases in flow velocity would encourage the deposition of the metal-suspended particle complexes (Walker and Hurl, 2002). The decrease in water velocities from land to waterways also increases the exposure of water quality degrading pathogens to sunlight. This is effective in killing pathogens, which normally cannot survive between 24 and 72 hours of exposure to ultraviolet radiation (Noble, 2004). As a secondary means of mitigating pollutant in stormwater, wetlands provide a habitat for a variety of organisms that assist in water quality improvement. Decreased rates of flow allow filtration of polluted stormwater runoff through the wetland soil and make pollutants available for uptake by microbial and vegetative communities, preventing release into the waterways (NCDENR, Division of Marine Fisheries, Wetlands, 2004). Microbial communities have the ability to incorporate nutrients arriving in runoff into their biomass. As much of wetland soil has little oxygen, anaerobic microbes utilize incoming nutrients in remineralization processes, such as denitrification, to convert incoming nitrate and ammonia into inert nitrogen gas, N2O and N2 (Kao et al., 2001, NCDENR, Wetlands, 2004). Microbial communities have also been demonstrated to biodegrade pesticides that enter wetlands. Wetland areas in Catawba River Basin, NC have been shown to encourage the removal of 100% of the commonly used pesticide atrazine (Kao et al., 2002). As wetlands are one of the most biologically productive marine ecosystems, vegetative uptake of excess nutrients is also important (NCDENR, Wetlands, 2004) and similar process have been demonstrated to assist in the removal of heavy metals percolating through the soil (Walker and Hurl, 2002). Vegetation functions similarly to microbes in incorporation of nutrients into biomass through the uptake of nutrient to use in growth of root and rhizome systems (Mitsch and Gosselink, 1986). The performance of wetlands in the removal of stormwater runoff pollutants is dependent on a variety of factors, namely storm intensity, runoff volume, and wetland size. Studies suggest a wetland area of 3% the catchment area is capable of producing measurable pollutant removal rates. The presence of plants and the nature of their root systems also influence the effectiveness of wetland systems (Carleton et al., 2001). Residence time played a large role in the effectiveness of suspended sediment and total phosphorous removal (Tilley and Brown, 1998). Some researchers (Tilley and Brown, 1998) propose that area requirements for stormwater mitigation by wetlands vary depending on the relative amount of urbanization
characteristic of an area. The study analyzed the relationship between urbanization and necessary wetland area for the achievement of stormwater mitigation. Watersheds were divided into various spatial scales and the efficiency of wetlands, designed to perform specific mitigation roles in removal of pollutants was measured. They suggest that all scales of wetland mitigation are necessary and as a result use ratios of catchment to wetland area for the various categories to arrive at quantities capable of summation. These figures allow calculation of a total wetland area required for a particular urbanization percentage. It is estimated that if a catchment area is more than 60% urban, the total wetland area need for effective pollution control is 25%. For medium intensity of urbanization (10%<urban area<60%), a wetland area of 10% is recommended. This figure declines to less than 5% of the basin if the urban percentage of an area is less than 10%. Wetland capabilities are reduced if sulfate, an abundant source of sulfur that common occurs in soils and minerals are introduced to an iron depleted system. When systems are iron limited, sulfate can be converted into dissolved sulfide, which is highly toxic to plants (NCDENR, Wetlands, 2004). Shell Bottom: Oyster Reefs Shell bottom habitat includes areas occupied by living oysters or oyster shells in sounds and estuaries (NCDENR, Introduction, 2004). The services provided by oyster reefs are numerous. These ecosystems provide biogenic habitat, stocks for commercial harvest, encourage biodiversity, act as a natural breakwater, and are a source of filtration (Peterson, 2004). Their continued decline since the late nineteenth century has resulted in the demise of these services. Decreased filtration rates and reef area in estuarine systems have added to problems with poor water quality (Figure IV-4, NCDENR, Shell Bottom, 2004).
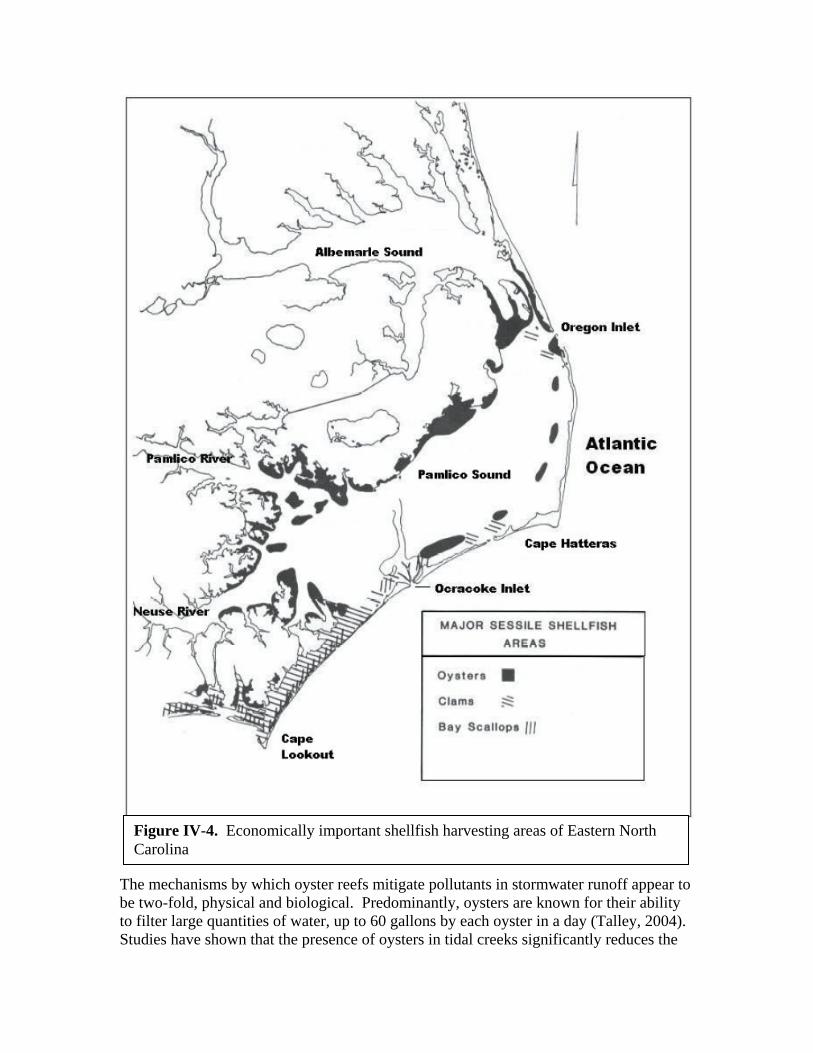
The mechanisms by which oyster reefs mitigate pollutants in stormwater runoff appear to be two-fold, physical and biological. Predominantly, oysters are known for their ability to filter large quantities of water, up to 60 gallons by each oyster in a day (Talley, 2004). Studies have shown that the presence of oysters in tidal creeks significantly reduces the
Figure IV-4. Economically important shellfish harvesting areas of Eastern North Carolina
nutrient concentrations in those systems (Dame and Libes 1993). The three-dimensional structure created by these organisms in the reef building process also influence hydrodynamics of physical water transport processes, in many cases slowing flow and encouraging deposition of sediments suspended in the water column (Nelson et al., 2004). Bed roughness is expected to increase turbulence at the apex of the reef, enhancing filtration by individual organisms in this area (Nelson et al., 2004). Similarly to wetlands, oyster reefs appear to have an optimal size to flow discharge ratio that provides optimal filtration of the water column, though this ratio has yet to be determined (Nelson et al., 2004). Filtration and growth rates appear to be higher in low velocity locations (Nelson et al., 2004). Pilot studies have in fact demonstrated reductions in total suspended solids and chlorophyll a concentrations with the placement of constructed reefs (Nelson et al., 2004). Increases in reef size also appear to increase the efficiency of sediment and chlorophyll a removal (Nelson et al. 2004). The input of this contaminant in stormwater could be greatly mitigated by the existence of oyster reefs. The organisms appear to benefit initially from increased inputs of these pollutants. However, the loading of concentration higher than optimal levels can reverse roles and provide a hazard to oyster survivorship (Shaffer, 2003). In areas where natural oyster reefs are not a feasible mitigation strategy, other constructed practices could provide an implementation option that would combine the nature filtration of oysters with a constructed infrastructure. Treatments involving the capture and recirculation of polluted water to allow maximum biofiltration demonstrate a greatly enhanced decline in pollutant concentration compared to flow-through systems (Jones et al., 2002). In a trial of effluent treatment incorporating four circuits, levels of incoming pollutants were reduced to 12, 4, and 16% for bacteria, chlorophyll a, and total suspended solids respectively (Jones et al., 2002). In absences of recirculation, oysters still remove up to 61% of bacterial numbers. It also significantly reduced chlorophyll a concentrations to 76% of the initial numbers. Nitrogen and phosphorous reductions were 64 and 55%, respectively. Suspended particle concentrations were reduced to 36% the initial concentration. Use of oysters as biofilters in implemented treatment facilities promotes the capture and utilization of valuable nutrient that can be incorporated into biomass (Jones et al., 2002). As with wetlands, oyster reefs provide useful stormwater pollution mitigation possibilities. Neither of these systems, however, is capable of removing all contaminants at perfect efficiencies from inputting waters. The volume of stormwater that episodically arrives after rain events is often too large to be filtered by such systems and in other incidences the pollutant loads are simply too large to be effectively reduced. Likewise, the other services provided by these ecosystems, habitat or fisheries resources, may be greatly diminished if they are used specifically for stormwater mitigation. All of these consequences must also be weighed to fit a solution to stormwater pollution to specific areas. Upstream, urbanized areas would not be candidates for using an ecosystem approach to mitigation because they can only be used in estuarine areas on the coast. It is also essential to remember that wetlands and oyster reefs are merely examples of possible ecosystem approaches to water quality enhancement. Other systems may provide similar
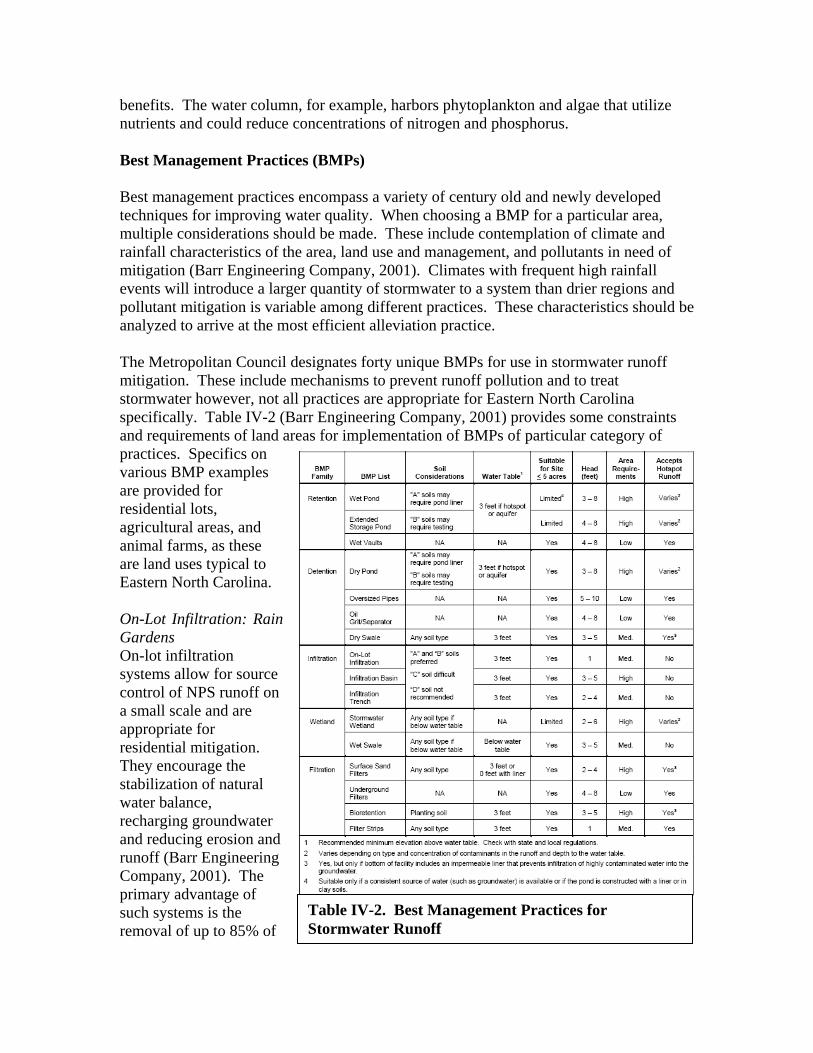
benefits. The water column, for example, harbors phytoplankton and algae that utilize nutrients and could reduce concentrations of nitrogen and phosphorus. Best Management Practices (BMPs) Best management practices encompass a variety of century old and newly developed techniques for improving water quality. When choosing a BMP for a particular area, multiple considerations should be made. These include contemplation of climate and rainfall characteristics of the area, land use and management, and pollutants in need of mitigation (Barr Engineering Company, 2001). Climates with frequent high rainfall events will introduce a larger quantity of stormwater to a system than drier regions and pollutant mitigation is variable among different practices. These characteristics should be analyzed to arrive at the most efficient alleviation practice. The Metropolitan Council designates forty unique BMPs for use in stormwater runoff mitigation. These include mechanisms to prevent runoff pollution and to treat stormwater however, not all practices are appropriate for Eastern North Carolina specifically. Table IV-2 (Barr Engineering Company, 2001) provides some constraints and requirements of land areas for implementation of BMPs of particular category of practices. Specifics on various BMP examples are provided for residential lots, agricultural areas, and animal farms, as these are land uses typical to Eastern North Carolina. On-Lot Infiltration: Rain Gardens On-lot infiltration systems allow for source control of NPS runoff on a small scale and are appropriate for residential mitigation. They encourage the stabilization of natural water balance, recharging groundwater and reducing erosion and runoff (Barr Engineering Company, 2001). The primary advantage of such systems is the removal of up to 85% of
Table IV-2. Best Management Practices for Stormwater Runoff
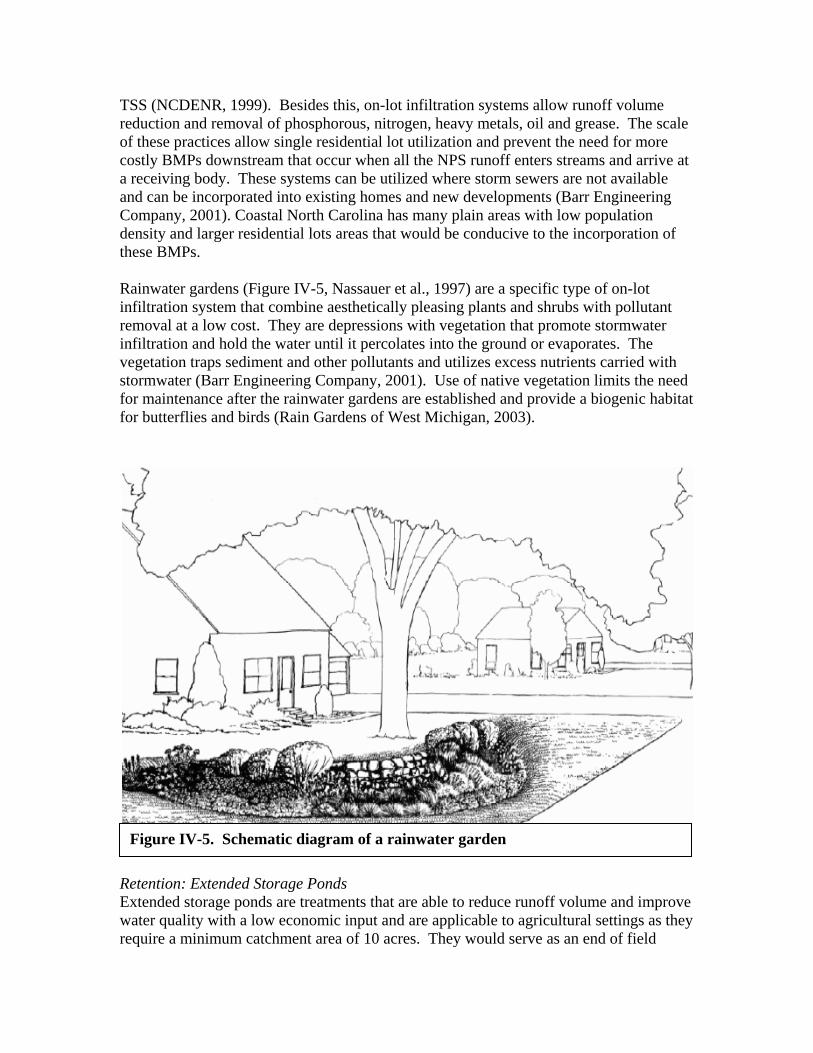
TSS (NCDENR, 1999). Besides this, on-lot infiltration systems allow runoff volume reduction and removal of phosphorous, nitrogen, heavy metals, oil and grease. The scale of these practices allow single residential lot utilization and prevent the need for more costly BMPs downstream that occur when all the NPS runoff enters streams and arrive at a receiving body. These systems can be utilized where storm sewers are not available and can be incorporated into existing homes and new developments (Barr Engineering Company, 2001). Coastal North Carolina has many plain areas with low population density and larger residential lots areas that would be conducive to the incorporation of these BMPs. Rainwater gardens (Figure IV-5, Nassauer et al., 1997) are a specific type of on-lot infiltration system that combine aesthetically pleasing plants and shrubs with pollutant removal at a low cost. They are depressions with vegetation that promote stormwater infiltration and hold the water until it percolates into the ground or evaporates. The vegetation traps sediment and other pollutants and utilizes excess nutrients carried with stormwater (Barr Engineering Company, 2001). Use of native vegetation limits the need for maintenance after the rainwater gardens are established and provide a biogenic habitat for butterflies and birds (Rain Gardens of West Michigan, 2003).
Retention: Extended Storage Ponds Extended storage ponds are treatments that are able to reduce runoff volume and improve water quality with a low economic input and are applicable to agricultural settings as they require a minimum catchment area of 10 acres. They would serve as an end of field
Figure IV-5. Schematic diagram of a rainwater garden
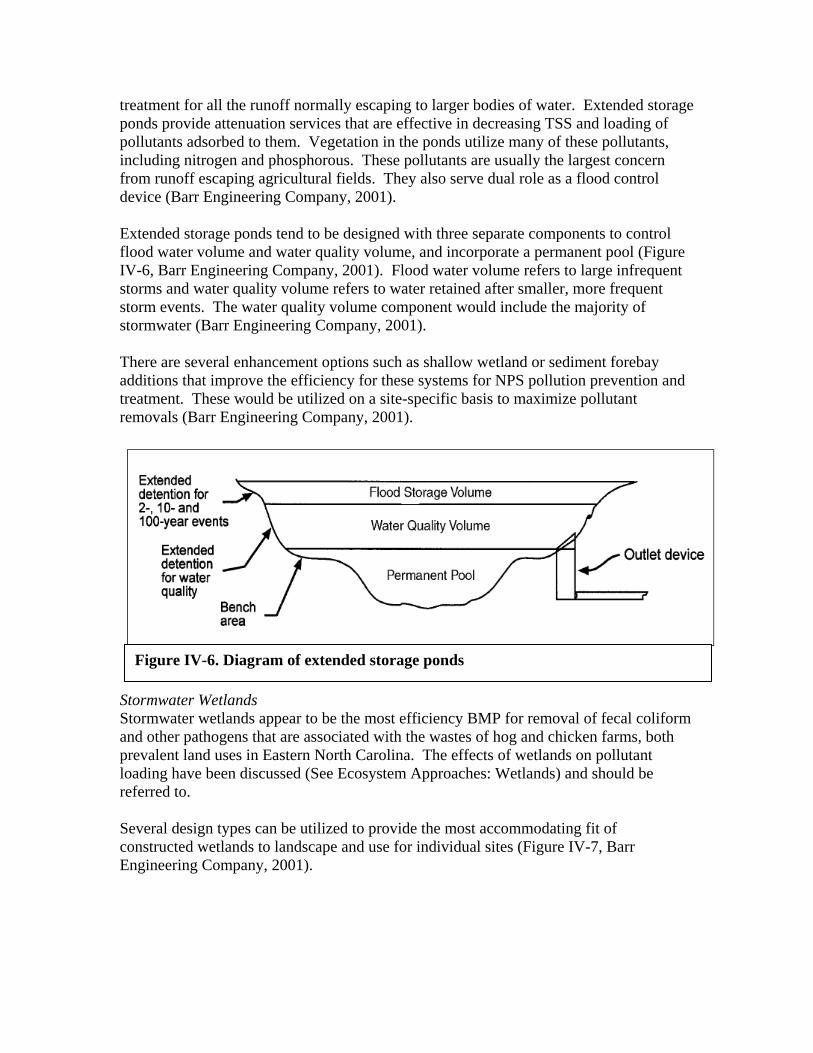
treatment for all the runoff normally escaping to larger bodies of water. Extended storage ponds provide attenuation services that are effective in decreasing TSS and loading of pollutants adsorbed to them. Vegetation in the ponds utilize many of these pollutants, including nitrogen and phosphorous. These pollutants are usually the largest concern from runoff escaping agricultural fields. They also serve dual role as a flood control device (Barr Engineering Company, 2001). Extended storage ponds tend to be designed with three separate components to control flood water volume and water quality volume, and incorporate a permanent pool (Figure IV-6, Barr Engineering Company, 2001). Flood water volume refers to large infrequent storms and water quality volume refers to water retained after smaller, more frequent storm events. The water quality volume component would include the majority of stormwater (Barr Engineering Company, 2001). There are several enhancement options such as shallow wetland or sediment forebay additions that improve the efficiency for these systems for NPS pollution prevention and treatment. These would be utilized on a site-specific basis to maximize pollutant removals (Barr Engineering Company, 2001).
Stormwater Wetlands Stormwater wetlands appear to be the most efficiency BMP for removal of fecal coliform and other pathogens that are associated with the wastes of hog and chicken farms, both prevalent land uses in Eastern North Carolina. The effects of wetlands on pollutant loading have been discussed (See Ecosystem Approaches: Wetlands) and should be referred to. Several design types can be utilized to provide the most accommodating fit of constructed wetlands to landscape and use for individual sites (Figure IV-7, Barr Engineering Company, 2001).
Figure IV-6. Diagram of extended storage ponds
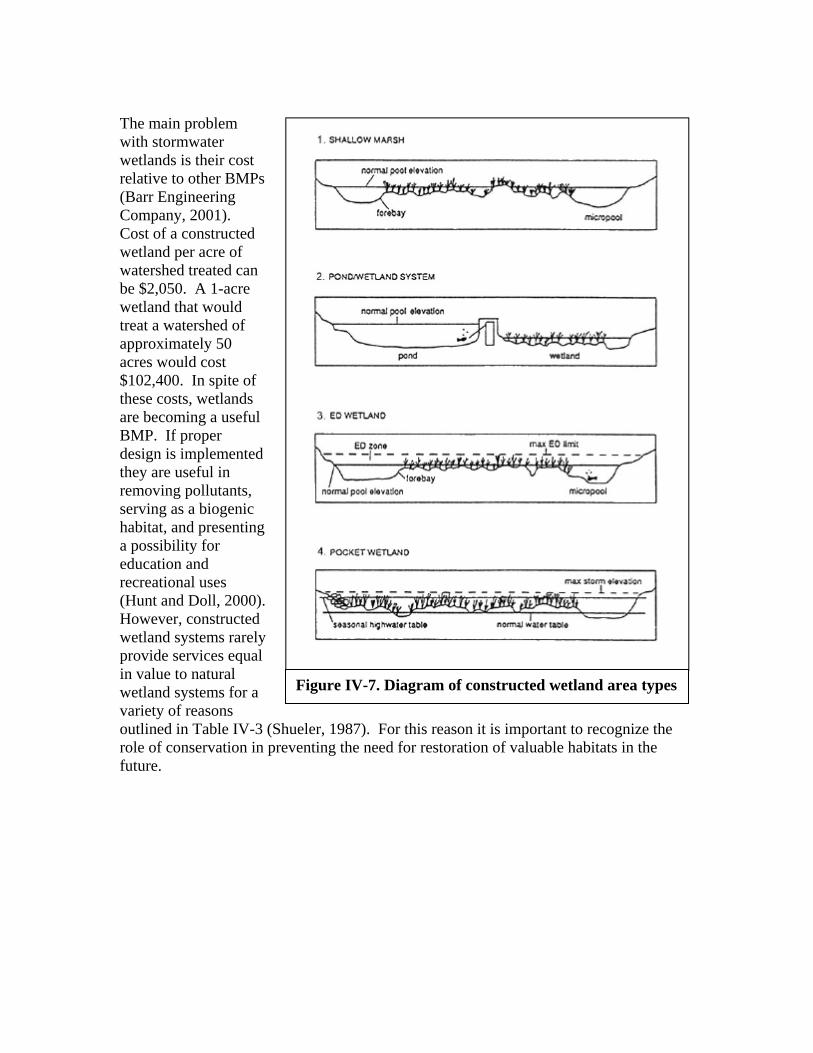
The main problem with stormwater wetlands is their cost relative to other BMPs (Barr Engineering Company, 2001). Cost of a constructed wetland per acre of watershed treated can be $2,050. A 1-acre wetland that would treat a watershed of approximately 50 acres would cost $102,400. In spite of these costs, wetlands are becoming a useful BMP. If proper design is implemented they are useful in removing pollutants, serving as a biogenic habitat, and presenting a possibility for education and recreational uses (Hunt and Doll, 2000). However, constructed wetland systems rarely provide services equal in value to natural wetland systems for a variety of reasons outlined in Table IV-3 (Shueler, 1987). For this reason it is important to recognize the role of conservation in preventing the need for restoration of valuable habitats in the future.
Figure IV-7. Various stormwater wetland designs
Figure IV-7. Diagram of constructed wetland area types
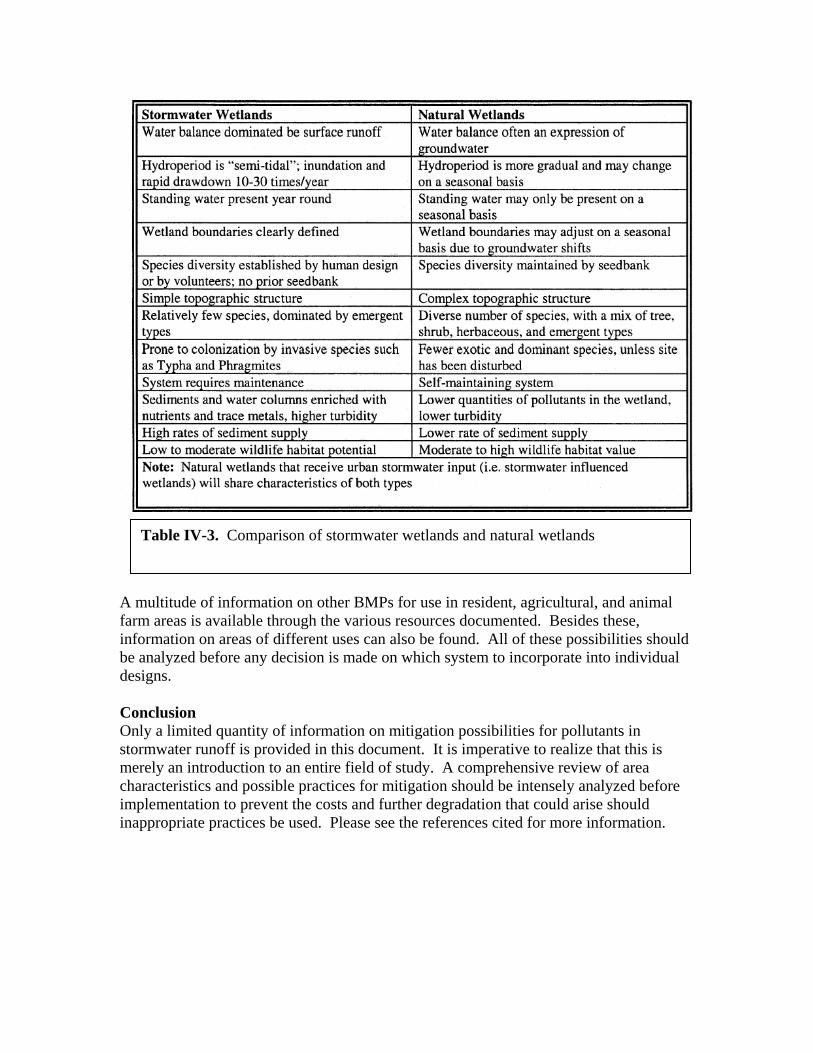
A multitude of information on other BMPs for use in resident, agricultural, and animal farm areas is available through the various resources documented. Besides these, information on areas of different uses can also be found. All of these possibilities should be analyzed before any decision is made on which system to incorporate into individual designs. Conclusion Only a limited quantity of information on mitigation possibilities for pollutants in stormwater runoff is provided in this document. It is imperative to realize that this is merely an introduction to an entire field of study. A comprehensive review of area characteristics and possible practices for mitigation should be intensely analyzed before implementation to prevent the costs and further degradation that could arise should inappropriate practices be used. Please see the references cited for more information.
Table IV-3. Comparison of stormwater wetlands and natural wetlands
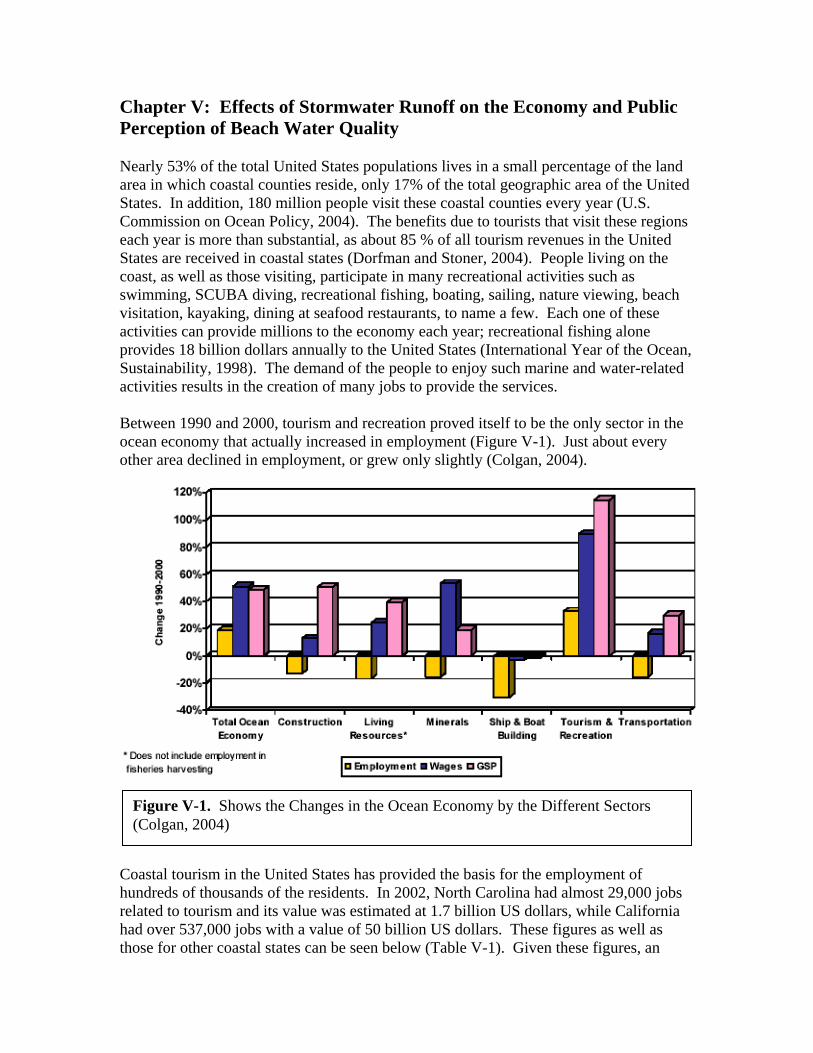
Chapter V: Effects of Stormwater Runoff on the Economy and Public Perception of Beach Water Quality Nearly 53% of the total United States populations lives in a small percentage of the land area in which coastal counties reside, only 17% of the total geographic area of the United States. In addition, 180 million people visit these coastal counties every year (U.S. Commission on Ocean Policy, 2004). The benefits due to tourists that visit these regions each year is more than substantial, as about 85 % of all tourism revenues in the United States are received in coastal states (Dorfman and Stoner, 2004). People living on the coast, as well as those visiting, participate in many recreational activities such as swimming, SCUBA diving, recreational fishing, boating, sailing, nature viewing, beach visitation, kayaking, dining at seafood restaurants, to name a few. Each one of these activities can provide millions to the economy each year; recreational fishing alone provides 18 billion dollars annually to the United States (International Year of the Ocean, Sustainability, 1998). The demand of the people to enjoy such marine and water-related activities results in the creation of many jobs to provide the services.
Between 1990 and 2000, tourism and recreation proved itself to be the only sector in the ocean economy that actually increased in employment (Figure V-1). Just about every other area declined in employment, or grew only slightly (Colgan, 2004).
Coastal tourism in the United States has provided the basis for the employment of hundreds of thousands of the residents. In 2002, North Carolina had almost 29,000 jobs related to tourism and its value was estimated at 1.7 billion US dollars, while California had over 537,000 jobs with a value of 50 billion US dollars. These figures as well as those for other coastal states can be seen below (Table V-1). Given these figures, an
Figure V-1. Shows the Changes in the Ocean Economy by the Different Sectors (Colgan, 2004)
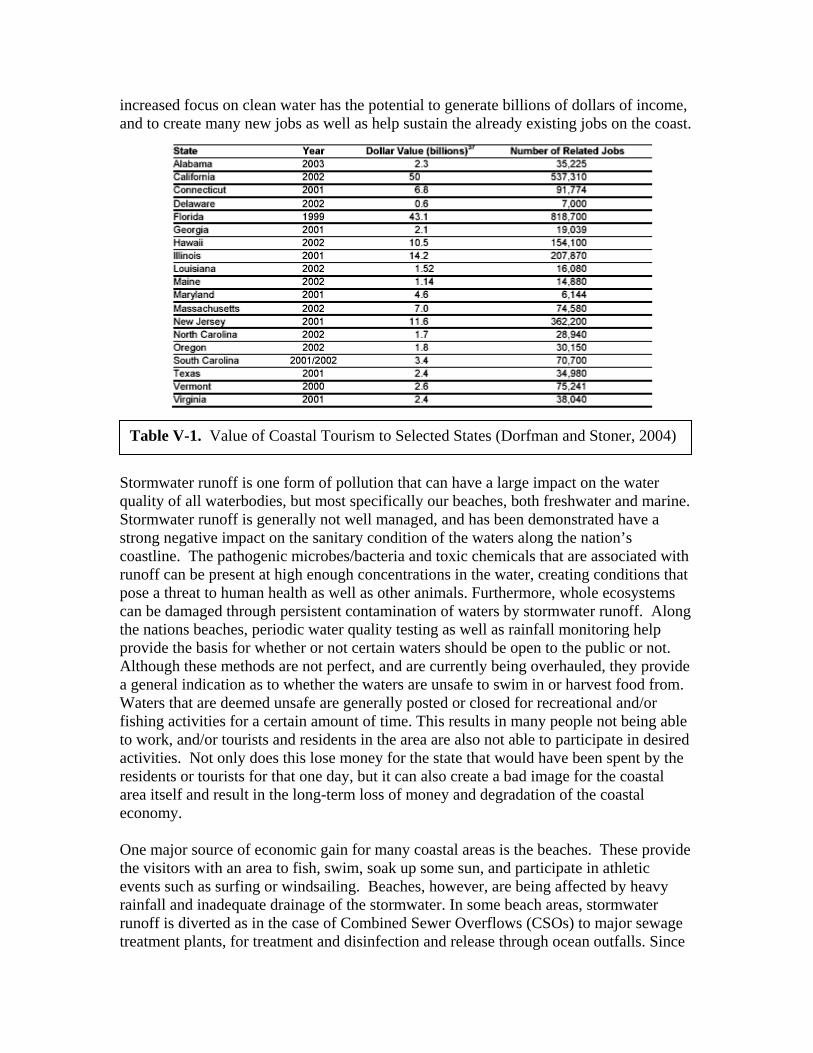
increased focus on clean water has the potential to generate billions of dollars of income, and to create many new jobs as well as help sustain the already existing jobs on the coast.
Stormwater runoff is one form of pollution that can have a large impact on the water quality of all waterbodies, but most specifically our beaches, both freshwater and marine. Stormwater runoff is generally not well managed, and has been demonstrated have a strong negative impact on the sanitary condition of the waters along the nation’s coastline. The pathogenic microbes/bacteria and toxic chemicals that are associated with runoff can be present at high enough concentrations in the water, creating conditions that pose a threat to human health as well as other animals. Furthermore, whole ecosystems can be damaged through persistent contamination of waters by stormwater runoff. Along the nations beaches, periodic water quality testing as well as rainfall monitoring help provide the basis for whether or not certain waters should be open to the public or not. Although these methods are not perfect, and are currently being overhauled, they provide a general indication as to whether the waters are unsafe to swim in or harvest food from. Waters that are deemed unsafe are generally posted or closed for recreational and/or fishing activities for a certain amount of time. This results in many people not being able to work, and/or tourists and residents in the area are also not able to participate in desired activities. Not only does this lose money for the state that would have been spent by the residents or tourists for that one day, but it can also create a bad image for the coastal area itself and result in the long-term loss of money and degradation of the coastal economy.
One major source of economic gain for many coastal areas is the beaches. These provide the visitors with an area to fish, swim, soak up some sun, and participate in athletic events such as surfing or windsailing. Beaches, however, are being affected by heavy rainfall and inadequate drainage of the stormwater. In some beach areas, stormwater runoff is diverted as in the case of Combined Sewer Overflows (CSOs) to major sewage treatment plants, for treatment and disinfection and release through ocean outfalls. Since
Table V-1. Value of Coastal Tourism to Selected States (Dorfman and Stoner, 2004)
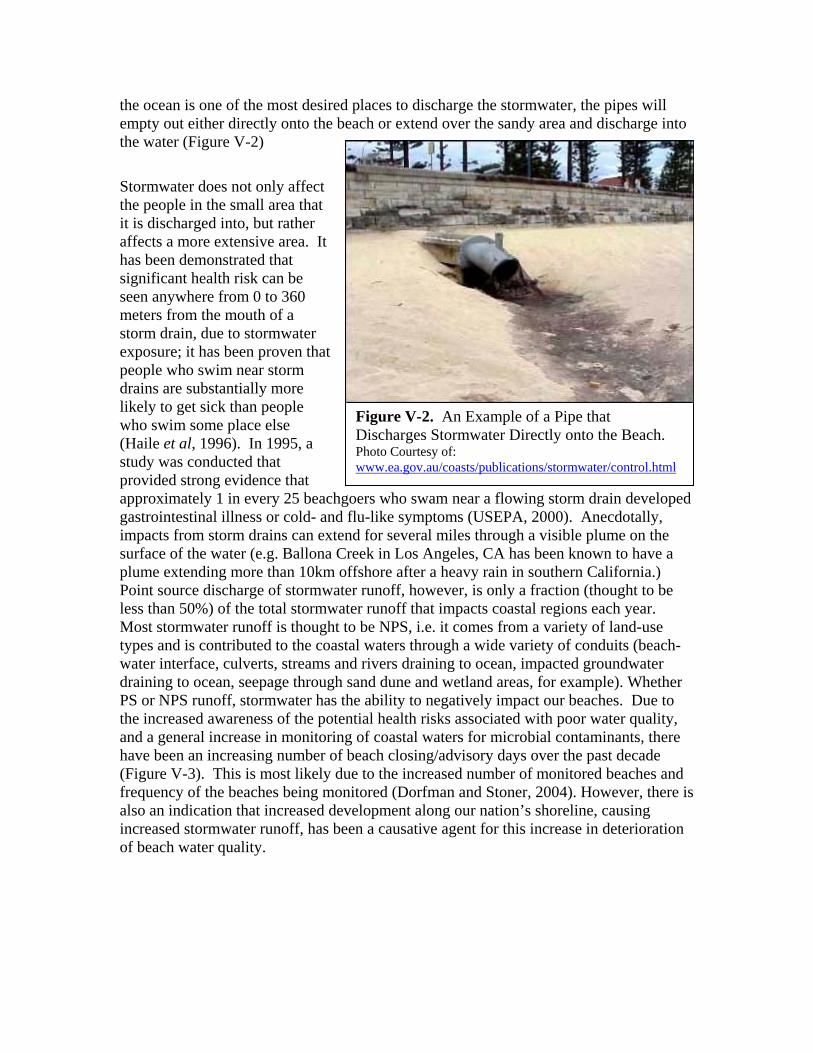
the ocean is one of the most desired places to discharge the stormwater, the pipes will empty out either directly onto the beach or extend over the sandy area and discharge into the water (Figure V-2)
Stormwater does not only affect the people in the small area that it is discharged into, but rather affects a more extensive area. It has been demonstrated that significant health risk can be seen anywhere from 0 to 360 meters from the mouth of a storm drain, due to stormwater exposure; it has been proven that people who swim near storm drains are substantially more likely to get sick than people who swim some place else (Haile et al, 1996). In 1995, a study was conducted that provided strong evidence that approximately 1 in every 25 beachgoers who swam near a flowing storm drain developed gastrointestinal illness or cold- and flu-like symptoms (USEPA, 2000). Anecdotally, impacts from storm drains can extend for several miles through a visible plume on the surface of the water (e.g. Ballona Creek in Los Angeles, CA has been known to have a plume extending more than 10km offshore after a heavy rain in southern California.) Point source discharge of stormwater runoff, however, is only a fraction (thought to be less than 50%) of the total stormwater runoff that impacts coastal regions each year. Most stormwater runoff is thought to be NPS, i.e. it comes from a variety of land-use types and is contributed to the coastal waters through a wide variety of conduits (beach-water interface, culverts, streams and rivers draining to ocean, impacted groundwater draining to ocean, seepage through sand dune and wetland areas, for example). Whether PS or NPS runoff, stormwater has the ability to negatively impact our beaches. Due to the increased awareness of the potential health risks associated with poor water quality, and a general increase in monitoring of coastal waters for microbial contaminants, there have been an increasing number of beach closing/advisory days over the past decade (Figure V-3). This is most likely due to the increased number of monitored beaches and frequency of the beaches being monitored (Dorfman and Stoner, 2004). However, there is also an indication that increased development along our nation’s shoreline, causing increased stormwater runoff, has been a causative agent for this increase in deterioration of beach water quality.
Figure V-2. An Example of a Pipe that Discharges Stormwater Directly onto the Beach. Photo Courtesy of: www.ea.gov.au/coasts/publications/stormwater/control.html
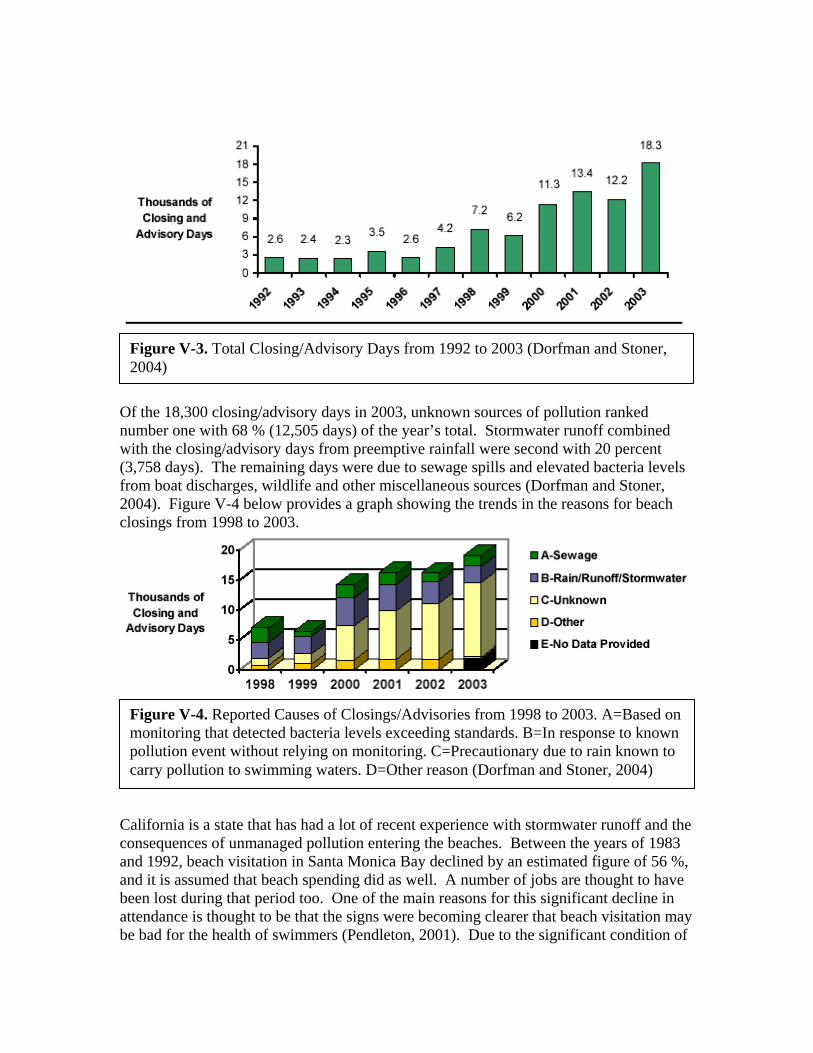
Of the 18,300 closing/advisory days in 2003, unknown sources of pollution ranked number one with 68 % (12,505 days) of the year’s total. Stormwater runoff combined with the closing/advisory days from preemptive rainfall were second with 20 percent (3,758 days). The remaining days were due to sewage spills and elevated bacteria levels from boat discharges, wildlife and other miscellaneous sources (Dorfman and Stoner, 2004). Figure V-4 below provides a graph showing the trends in the reasons for beach closings from 1998 to 2003.
California is a state that has had a lot of recent experience with stormwater runoff and the consequences of unmanaged pollution entering the beaches. Between the years of 1983 and 1992, beach visitation in Santa Monica Bay declined by an estimated figure of 56 %, and it is assumed that beach spending did as well. A number of jobs are thought to have been lost during that period too. One of the main reasons for this significant decline in attendance is thought to be that the signs were becoming clearer that beach visitation may be bad for the health of swimmers (Pendleton, 2001). Due to the significant condition of
Figure V-3. Total Closing/Advisory Days from 1992 to 2003 (Dorfman and Stoner, 2004)
Figure V-4. Reported Causes of Closings/Advisories from 1998 to 2003. A=Based on monitoring that detected bacteria levels exceeding standards. B=In response to known pollution event without relying on monitoring. C=Precautionary due to rain known to carry pollution to swimming waters. D=Other reason (Dorfman and Stoner, 2004)
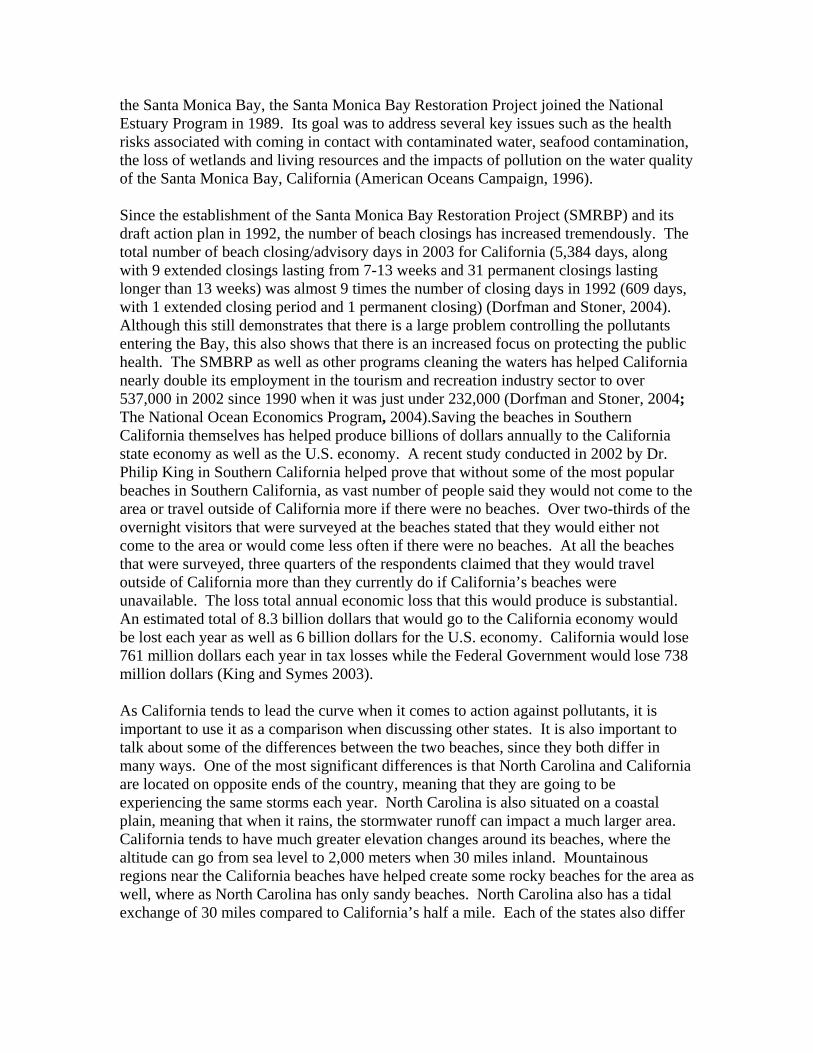
the Santa Monica Bay, the Santa Monica Bay Restoration Project joined the National Estuary Program in 1989. Its goal was to address several key issues such as the health risks associated with coming in contact with contaminated water, seafood contamination, the loss of wetlands and living resources and the impacts of pollution on the water quality of the Santa Monica Bay, California (American Oceans Campaign, 1996). Since the establishment of the Santa Monica Bay Restoration Project (SMRBP) and its draft action plan in 1992, the number of beach closings has increased tremendously. The total number of beach closing/advisory days in 2003 for California (5,384 days, along with 9 extended closings lasting from 7-13 weeks and 31 permanent closings lasting longer than 13 weeks) was almost 9 times the number of closing days in 1992 (609 days, with 1 extended closing period and 1 permanent closing) (Dorfman and Stoner, 2004). Although this still demonstrates that there is a large problem controlling the pollutants entering the Bay, this also shows that there is an increased focus on protecting the public health. The SMBRP as well as other programs cleaning the waters has helped California nearly double its employment in the tourism and recreation industry sector to over 537,000 in 2002 since 1990 when it was just under 232,000 (Dorfman and Stoner, 2004; The National Ocean Economics Program, 2004).Saving the beaches in Southern California themselves has helped produce billions of dollars annually to the California state economy as well as the U.S. economy. A recent study conducted in 2002 by Dr. Philip King in Southern California helped prove that without some of the most popular beaches in Southern California, as vast number of people said they would not come to the area or travel outside of California more if there were no beaches. Over two-thirds of the overnight visitors that were surveyed at the beaches stated that they would either not come to the area or would come less often if there were no beaches. At all the beaches that were surveyed, three quarters of the respondents claimed that they would travel outside of California more than they currently do if California’s beaches were unavailable. The loss total annual economic loss that this would produce is substantial. An estimated total of 8.3 billion dollars that would go to the California economy would be lost each year as well as 6 billion dollars for the U.S. economy. California would lose 761 million dollars each year in tax losses while the Federal Government would lose 738 million dollars (King and Symes 2003). As California tends to lead the curve when it comes to action against pollutants, it is important to use it as a comparison when discussing other states. It is also important to talk about some of the differences between the two beaches, since they both differ in many ways. One of the most significant differences is that North Carolina and California are located on opposite ends of the country, meaning that they are going to be experiencing the same storms each year. North Carolina is also situated on a coastal plain, meaning that when it rains, the stormwater runoff can impact a much larger area. California tends to have much greater elevation changes around its beaches, where the altitude can go from sea level to 2,000 meters when 30 miles inland. Mountainous regions near the California beaches have helped create some rocky beaches for the area as well, where as North Carolina has only sandy beaches. North Carolina also has a tidal exchange of 30 miles compared to California’s half a mile. Each of the states also differ
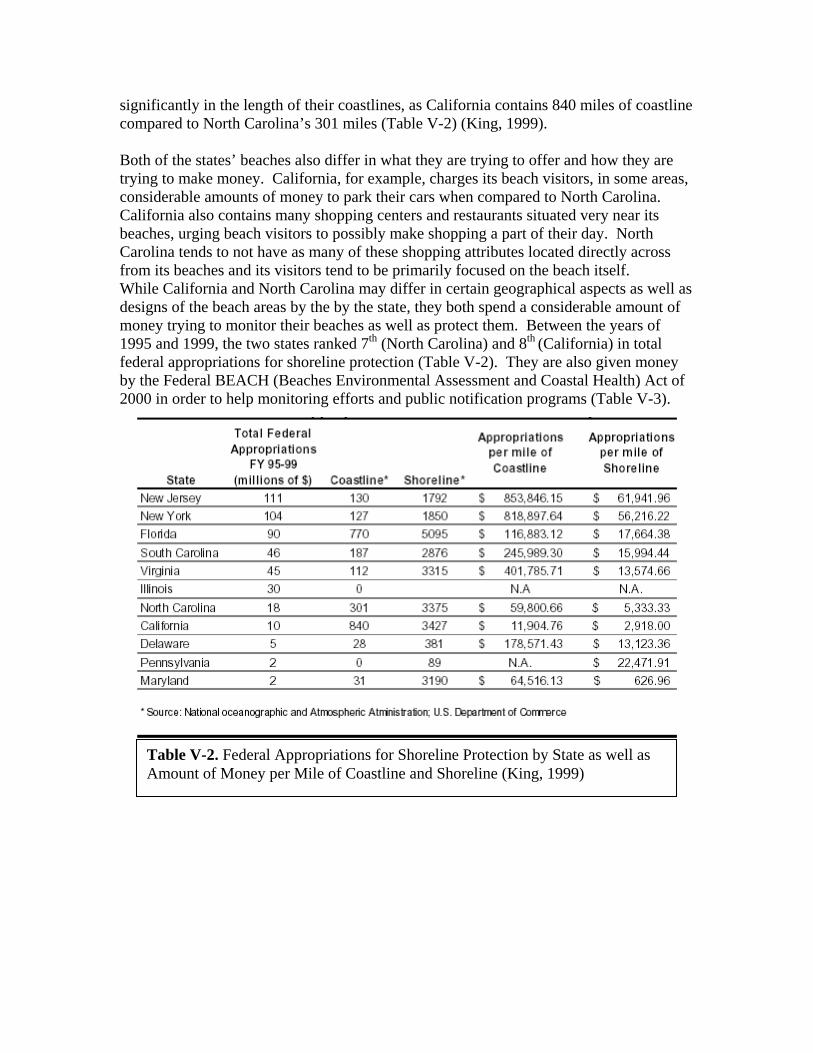
significantly in the length of their coastlines, as California contains 840 miles of coastline compared to North Carolina’s 301 miles (Table V-2) (King, 1999). Both of the states’ beaches also differ in what they are trying to offer and how they are trying to make money. California, for example, charges its beach visitors, in some areas, considerable amounts of money to park their cars when compared to North Carolina. California also contains many shopping centers and restaurants situated very near its beaches, urging beach visitors to possibly make shopping a part of their day. North Carolina tends to not have as many of these shopping attributes located directly across from its beaches and its visitors tend to be primarily focused on the beach itself. While California and North Carolina may differ in certain geographical aspects as well as designs of the beach areas by the by the state, they both spend a considerable amount of money trying to monitor their beaches as well as protect them. Between the years of 1995 and 1999, the two states ranked 7th (North Carolina) and 8th (California) in total federal appropriations for shoreline protection (Table V-2). They are also given money by the Federal BEACH (Beaches Environmental Assessment and Coastal Health) Act of 2000 in order to help monitoring efforts and public notification programs (Table V-3).
Table V-2. Federal Appropriations for Shoreline Protection by State as well as Amount of Money per Mile of Coastline and Shoreline (King, 1999)
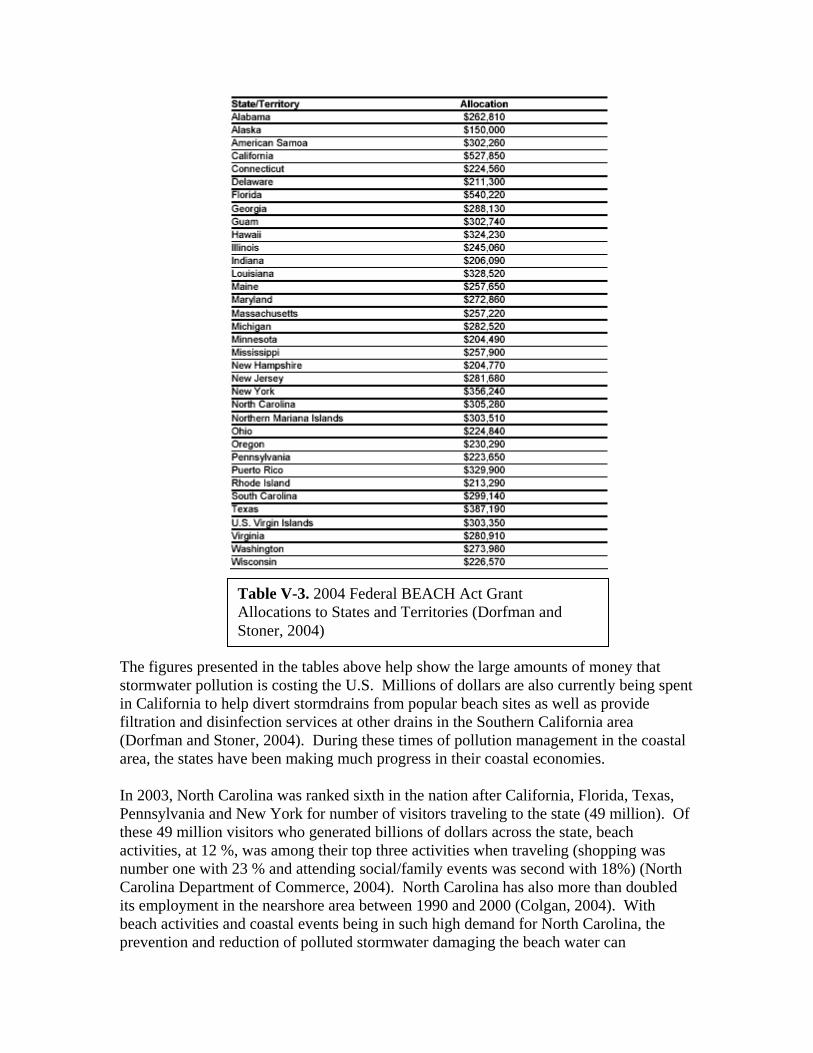
The figures presented in the tables above help show the large amounts of money that stormwater pollution is costing the U.S. Millions of dollars are also currently being spent in California to help divert stormdrains from popular beach sites as well as provide filtration and disinfection services at other drains in the Southern California area (Dorfman and Stoner, 2004). During these times of pollution management in the coastal area, the states have been making much progress in their coastal economies. In 2003, North Carolina was ranked sixth in the nation after California, Florida, Texas, Pennsylvania and New York for number of visitors traveling to the state (49 million). Of these 49 million visitors who generated billions of dollars across the state, beach activities, at 12 %, was among their top three activities when traveling (shopping was number one with 23 % and attending social/family events was second with 18%) (North Carolina Department of Commerce, 2004). North Carolina has also more than doubled its employment in the nearshore area between 1990 and 2000 (Colgan, 2004). With beach activities and coastal events being in such high demand for North Carolina, the prevention and reduction of polluted stormwater damaging the beach water can
Table V-3. 2004 Federal BEACH Act Grant Allocations to States and Territories (Dorfman and Stoner, 2004)
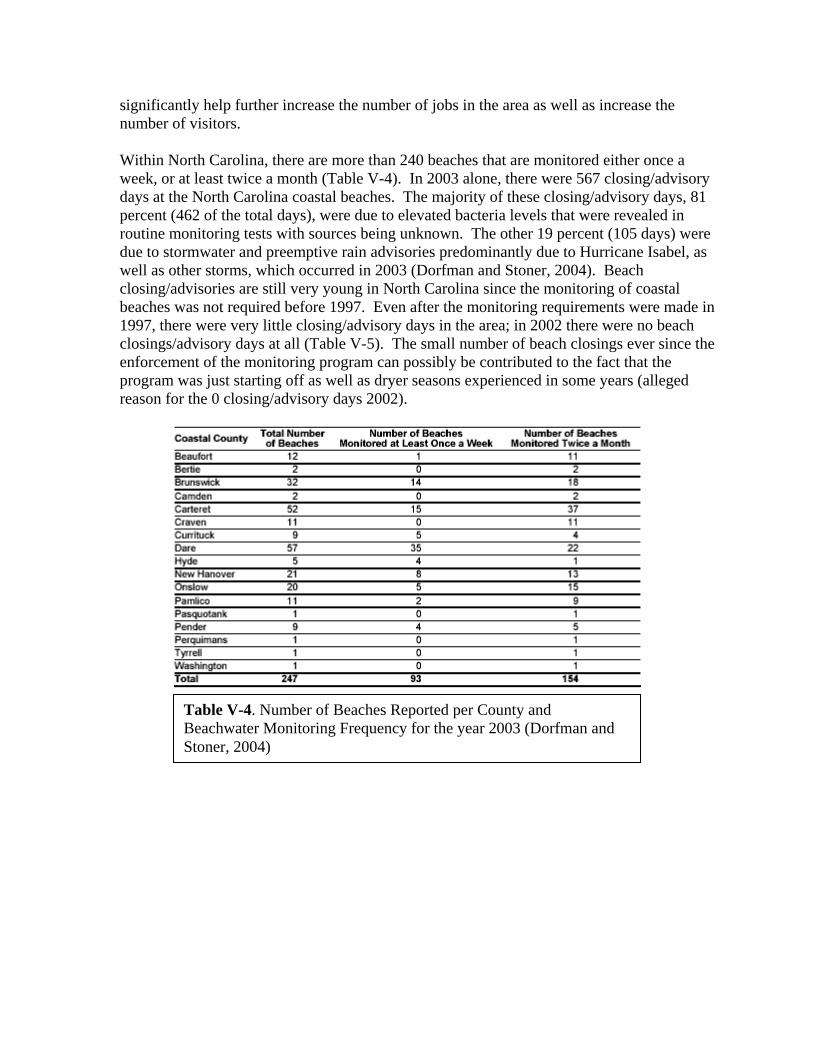
significantly help further increase the number of jobs in the area as well as increase the number of visitors.
Within North Carolina, there are more than 240 beaches that are monitored either once a week, or at least twice a month (Table V-4). In 2003 alone, there were 567 closing/advisory days at the North Carolina coastal beaches. The majority of these closing/advisory days, 81 percent (462 of the total days), were due to elevated bacteria levels that were revealed in routine monitoring tests with sources being unknown. The other 19 percent (105 days) were due to stormwater and preemptive rain advisories predominantly due to Hurricane Isabel, as well as other storms, which occurred in 2003 (Dorfman and Stoner, 2004). Beach closing/advisories are still very young in North Carolina since the monitoring of coastal beaches was not required before 1997. Even after the monitoring requirements were made in 1997, there were very little closing/advisory days in the area; in 2002 there were no beach closings/advisory days at all (Table V-5). The small number of beach closings ever since the enforcement of the monitoring program can possibly be contributed to the fact that the program was just starting off as well as dryer seasons experienced in some years (alleged reason for the 0 closing/advisory days 2002).
Table V-4. Number of Beaches Reported per County and Beachwater Monitoring Frequency for the year 2003 (Dorfman and Stoner, 2004)
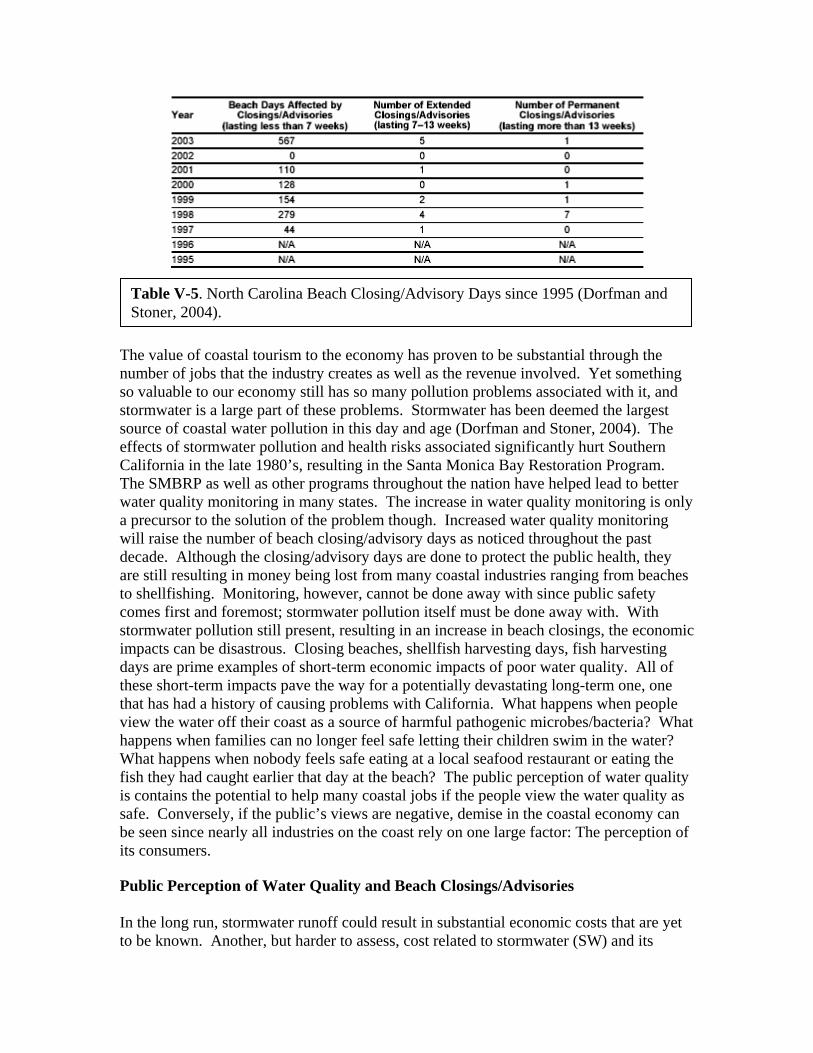
The value of coastal tourism to the economy has proven to be substantial through the number of jobs that the industry creates as well as the revenue involved. Yet something so valuable to our economy still has so many pollution problems associated with it, and stormwater is a large part of these problems. Stormwater has been deemed the largest source of coastal water pollution in this day and age (Dorfman and Stoner, 2004). The effects of stormwater pollution and health risks associated significantly hurt Southern California in the late 1980’s, resulting in the Santa Monica Bay Restoration Program. The SMBRP as well as other programs throughout the nation have helped lead to better water quality monitoring in many states. The increase in water quality monitoring is only a precursor to the solution of the problem though. Increased water quality monitoring will raise the number of beach closing/advisory days as noticed throughout the past decade. Although the closing/advisory days are done to protect the public health, they are still resulting in money being lost from many coastal industries ranging from beaches to shellfishing. Monitoring, however, cannot be done away with since public safety comes first and foremost; stormwater pollution itself must be done away with. With stormwater pollution still present, resulting in an increase in beach closings, the economic impacts can be disastrous. Closing beaches, shellfish harvesting days, fish harvesting days are prime examples of short-term economic impacts of poor water quality. All of these short-term impacts pave the way for a potentially devastating long-term one, one that has had a history of causing problems with California. What happens when people view the water off their coast as a source of harmful pathogenic microbes/bacteria? What happens when families can no longer feel safe letting their children swim in the water? What happens when nobody feels safe eating at a local seafood restaurant or eating the fish they had caught earlier that day at the beach? The public perception of water quality is contains the potential to help many coastal jobs if the people view the water quality as safe. Conversely, if the public’s views are negative, demise in the coastal economy can be seen since nearly all industries on the coast rely on one large factor: The perception of its consumers. Public Perception of Water Quality and Beach Closings/Advisories In the long run, stormwater runoff could result in substantial economic costs that are yet to be known. Another, but harder to assess, cost related to stormwater (SW) and its
Table V-5. North Carolina Beach Closing/Advisory Days since 1995 (Dorfman and Stoner, 2004).
effects on North Carolina beaches is the deterioration of the public’s perception of water quality. One way of quantifying this aspect is to look at beach visitation in the previous seasons and to hear what is important to the public in a particular region. In the case of this document, we have focused on the issues pertaining to coastal Eastern North Carolina, so an example of this approach has been to discuss the issues with residents and professionals in the water quality business that reside in Carteret County, North Carolina. The majority of citizens around the globe have a limited understanding of what SW runoff is or its potential impacts are on the degradation of water quality. As has been mentioned previously, SW runoff is an important cause of beach closures and postings. Swimming related illnesses are not usually severe or life threatening (as a matter of fact they are typically subclinical and not reported), but they can take a substantial toll when considering comfort, convenience and the health of the public. However, for the elderly, infants, children and those with compromised immune systems some cases of gastroenteritis can be a serious and even deadly problem (Dorfman and Stoner 2004). Other illnesses associated with swimming in contaminated waters are: dehydration, vomiting, and possibly collapse. Also, if the swimmer grows ill he/she could potentially pass the disease on to other household members that would, in turn, multiply the effect. (Dorfman and Stoner 2004) Managers must first assess how people use and perceive beaches in order to develop effective management strategies based on a projected demand for coastal recreation (Martin and Pendleton 2004). Target audiences are selected and targeted in public perception surveys to assess the general awareness of key water quality problems (Center for Watershed Protection, No. 17, 2004). Usually with survey work, the target group is requested to complete a direct mail-out or an interview or other form of personal communication in order to gather information. The results of the survey are then gathered, summarized and put into a report form. This information is then given to decision makers in order to facilitate the creation or amendments to watershed management policies. (Center for Watershed Protection, No. 17, 2004) Not only is it important to gain the support and educate the policy makers, but it’s equally important to make the public aware of SW runoff issues and gain their support. In turn, this support is dependent on the value placed on these issues by the public. Usually this value is based on more than just water chemistry. Some qualities that are valued by the average beachgoer are: ease of access, appearance, surroundings, and visual water quality. Floatables, trash, odor, and turbidity all detract from the overall appearance and feel of the beach or body of water. (Center for Watershed Protection, No. 20, 2004) Also, it is possible that water bodies that generally have good water quality may be seen as having poor quality by the public is closings occurs or if water is turbid. Conversely, waters that are biologically impaired can be seen as “clean” because they lack obvious pollution like floatables. (Center for Watershed Protection, No. 20, 2004). There is a mixed perception of what the effects of SW runoff are. People in Carteret County have become increasingly aware of SW runoff over the past ten years, but on the whole the public still seems to only be concerned with the immediate impacts. If heavy rainfall floods the roads the main concern for the people that live and drive in these areas
is expedited removal; usually because it becomes more of a nuisance than a threat. Although a reasonable response, the purpose is slightly misplaced. However, as mentioned above, awareness is increasing. In some cases, the public appears to be throwing issues related to flooding from SW back at the county commissioners by practically demanding that the township do something to clean it up. From a different standpoint and in the case of Atlantic Beach, the county commissioners would, with very high rainfall, pump the water off the road through to the beach. However, a large majority of the public is still not aware of the implications associated with SW. This becomes a scary realization for beachgoers when they are told to remove themselves and their children from the contaminated water. The issues surrounding SW runoff have not been a topic of hot debate for national news. Other issues seem to merit more attention and focus up to this point in time. Therefore, on a wide angle, the public has not been educated through news programs about how SW runoff is characterized and the environmental and human health risks associated with it. Also, in coastal Eastern North Carolina the public is just recently becoming aware of SW as it relates to water quality degradation. Without having a personal experience with the topic, the public is virtually unaware. As the public begins to realize that there are contaminants in SW because their daily lives have been impacted upon, only then will they begin to understand the potential negative effects. The public saw more beach advisories in Emerald Isle, NC and other beaches west of Atlantic Beach, NC, last year. The number of beach closings/advisories has increased significantly from none in 2002 to 567 in 2003 (Dorfman and Stoner 2004). The topic gained state wide attention with newspaper articles published last summer documenting beach advisory postings and the health of North Carolina’s coastline. One positive effect of state-wide coverage is increased awareness of SW runoff. It is also important to realize that newspapers may put a slant or bias on the issue being covered. Based on some of the articles that were published this past summer, there was a mixed idea of what swimming advisories represent to those visiting the beach. More regular postings for beach advisories gained the public’s attention and impacted many of the local and visiting beachgoers. If this pattern continues, beach advisories increase from year to year; local tourism will see a decrease in the number of people visiting the Crystal Coast. First of all, in order for the state to put an advisory into effect, the water is continually tested for certain pathogens in the coastal waters using indicators. These testing processes are seen as complex and are not wholly understood by the majority of the public. It could be that the problem with North Carolina’s waters is that they are not yet polluted enough. A tragic statement but there is some truth in it. It seems that in the history of the human race, concern does not run high until resources run low or the quality of the environment is degraded to an extreme level. To prevent further water quality degradation this “storage shift” issue will become increasing important for future generations. Beach closings, although indicators of water quality degradation, may be a good thing. With such a drastic increase in beach closings from previous years, mainly due to a higher rainfall (Dorfman et al. 2004), the public is personally affected and indirectly educated about the impacts of non-point source SW runoff. People visiting the beach are
made to stop and think of the reasons why they cannot get into the coastal waters and possibly what they can do to prevent closings from continuing. Hopefully this is the point where people want to become more educated about the impacts of SW runoff and where the scientists, politicians, and citizens can work together in educating the public.
Heal the Bay is a non-profit organization in California that has worked diligently to address the issue of SW runoff and sewage spill on Californian beaches. In 1990 beachgoers knew very little about the health risks associated with swimming polluted waters or even the water quality of their beaches, much like the state of North Carolina’s public awareness. (Heal the Bay, 2004) Heal the Bay has found that in the past four years water quality during dry weather at open ocean beaches is excellent and much cleaner than water quality at beaches being impacted by point source storm drains. It has also been determined through their studies that beaches have higher water quality results that are similar to those of open ocean beaches when storm water drains are not flowing, possibly caused by a lack or diversion of rain (Heal the Bay, 2004). They have found that the worst water quality can be found at enclosed beaches; this could in part be due to the lack of water circulation found at this type of beach. To find out more information about local closings on North Carolina beaches, visit North Carolina Department of the Environment’s Shellfish Sanitation section website. If the swimming standard is exceeded, the public is informed through a press release which is sent out to the local media and associated press and advisory signs are posted at the individual swimming site. Discharges from SW and flood water may also put into effect a 24 hour swimming advisory after the discharged has ended. With improvement of water quality, the advisories are lifted, signs are removed, and another press release is issued. However, Shellfish Sanitation does not have the power to close a beach. If the public was more aware of the impacts of SW runoff they would be smarter about their everyday decisions. It will take a vast increase in publicity concerning SW runoff before the general public becomes aware of what characterizes SW, the health risks associated with it, management practices that curb the effects and whose responsibility it will be to take the next step. Recommendations for Successful Regulation, Management and Mitigation of Stormwater Runoff: General:
1) Improve communication between federal, state, and local government on issues related to stormwater. Improved government involvement and communication will permit coordinated enforcement of stormwater runoff mitigation and regulation. Stormwater runoff in the US affects interests of USEPA, USDA, International Shellfish Sanitation Council, and federal, state, and local government, there needs to be a mobilization towards communication of the issues with all parties involved.
2) Increased resources for research, monitoring, and enforcement of regulations pertaining to stormwater runoff.
3) Staff of government agencies should be required to attend classes, symposia, and conferences to extend their knowledge of natural ecosystems and assist in management decisions.
4) Support conservation of large areas of natural vegetation in order to improve infiltration of stormwater and reduce stormwater runoff first, but also use funds to restore ecosystems in areas where they have been degraded.
5) Federally regulate land development, both to prevent ecosystem degradation and to control impervious surface cover.
6) Empower the individual: Inform people what they CAN do to minimize stormwater runoff, rather than what they CANNOT. Include monetary incentives, and educate people as to the benefits of stormwater mitigation for their own property.
7) People should be encouraged to be innovative about improving water quality and should be given an outlet to voice their ideas
Policy and Management:
1) Implement a federal plan for general stormwater billing. Evidence for the needs of stormwater billing are provided by research demonstrating that NPS runoff is the primary source of water quality degradation. If GIS database can be built (see Research related recommendations), more precise stormwater billing or even permitting could be possible. Could use stormwater billing to fund other projects, for example preservation of natural areas.
2) Implement appropriate monitoring strategies for stormwater runoff that will be successful and logical, i.e. sampling once per week strategy at coastal locations impacted by stormwater will not be effective if sampling day is different from day of precipitation.
3) Increased frequency of monitoring for stormwater contaminants in receiving waters, with mandated consequences for violation of stormwater permits
4) Develop diffuse source stormwater permits for polluters and enforce monitoring and regulation.
5) Residential zoning laws should be written up with impervious surface coverage in mind such as smaller lots, maximum impervious surface square footage, proximity of homes to each other.
6) Enact legislation for greater minimum requirements for buffer areas surrounding rivers and streams (250 ft instead of 150 ft). Buffer area legislation could also extend beyond main streams and rivers within watersheds and could also include smaller streams, troughs, urban catchments and drainage systems.
7) Improve requirements for active land use plans that reduce stormwater runoff to receiving waters, especially in coastal areas
Education and Outreach:
1) Educate the public about the impacts of water quality degradation associated with stormwater runoff and stress organization and mobilization of human effort, including the risks of swimming in contaminated waters.
2) Encourage people to talk to town commissioners and become more proactive, including education of land developers and contractors. Educate friends, family, co-workers and other about the affects of stormwater. Refer them to this document!
3) Create and publish something similar to Heal the Bay’s annual Beach Report Card for North Carolina’s popular beaches
4) Lobby for increased funding allotted to agencies such as the NC Shellfish Sanitation Section of the NC Division of Environmental and Natural Resources so that may create something like the Heal the Bay Beach Report Card
5) Increase the amount of positive articles written regarding mitigation and control of stormwater runoff in the local papers. Assemble special on public television that outlines general actions that the public can take to curb stormwater runoff and contamination.
6) Educate the public on the scale of local chronic car and truck oil contamination, versus single impact events such as large tanker oil spills, i.e. an urban town of 5 million is capable of producing as much oil contamination due to runoff as one Exxon Valdez oil spill every year.
7) Create brochure or pamphlet that outlines some of the major environmental and human health affects of stormwater runoff. Dispense through local tourist bureaus and visitors centers with other important phone number and contact information to prolong the use of the document.
8) Educate the general public as to the issues associated with swimming in waters that are contaminated by stormwater runoff to prevent illness.
9) Encourage the education of children through in-class visits or field trips on the basics of water quality.
Active mitigation:
1) Decrease the amount of stormwater runoff contamination by more/better controls on oil leaking cars/trucks by enforcing a yearly required check-up at State inspection stations, especially in coastal regions.
2) Decrease the nutrient loading by specific application of fertilizers and pesticides to agricultural operations, like at Open Grounds Farm, using the Precision Farming method
3) Mandated buffer areas for sewage treatment facilities and hog waste lagoons to retain their contents in the event of heavy precipitation, through higher retaining walls, and holding tanks.
4) Required yearly check for leaking sewage pipes and check of sewage infrastructure. Repairs municipal responsibility.
5) Improve stormwater runoff characteristics of highways through the use of alternative construction plans and alternative materials. For example, California is changing its highways in order to reduce as much as 80% of the pollutants in runoff from highways.
6) Construct more and improved treatment facilities so that less pollutants are discharged into the ocean, and remove or relocate active discharge pipes on popular beaches.
7) Stay in touch with your local and state representatives so that your voice may be heard concerning water quality issues.
Research:
1) Provide more funding to advance research, promote accurate and advance monitoring strategies, and enforce rules and regulations.
2) Construct a Geographic Information System (GIS) database with high spatial (1 km) and temporal (10 min) resolution to determine impervious surface, hydrology, topography, and rainfall amounts in watersheds.
3) Development improved detection and quantification techniques for stormwater contaminants, especially pathogens. Focus developments on testing that can yield real-time, in situ results.
4) Research stormwater inputs to coastal water bodies and variability of contaminant load versus flow and discharge rates.
5) Research to improve understanding of stormwater impacts, both long term and short term on ecosystem inhabitants.
6) Collect data and construct models for flow of stormwater in individual watersheds, apply models to like watersheds.
7) Improve communication of research findings with management agencies that work on stormwater related issues, funding for communication of research results through active workshops and retreats for scientists and managers.
8) Conduct research to understand fate and transport of contaminants, including fate of chemical contaminants (endocrine disruptors, antibiotics, pesticides).
9) Research should be undertaken on the different BMP strategies to determine which are the most effective and also which BMP's are the easiest and most efficient based on the region.
References: American Oceans Campaign. 1996. Santa Monica Bay in California. Estuaries on the
edge: the vital link between land and sea, 247-256. Atmospheric & Marine-Based Interdisciplinary Environmental Health Training
(AMBIENT). Water Microbes and Human Health Exercise, Water Module. Revised July 8, 2004. University of Miami, Miami, FL. http://www.rsmas.miami.edu/groups/niehs/ambient/teacher/water/MODULE%20SEGMENTS/fa%20watermicrobehealtheffectsactivity.pdf
Barr Engineering Company. 2001. Minnesota Urban Small Sites BMP Manual:
Stormwater BMPs for Cold Climates. Published by Metropolitan Council Environmental Services. Chapters 1, 2, 3: Stormwater Treatment BMPs.
www.metrocouncil.org Baumann, P.C. 1998. Epizootics of cancer in fish associated with genotoxins in sediment
and water. Mutation Research/Reviews in Mutation Research, 411: 227-233.
Bermudez, M. and T.C. Hazen. 1988. Phenotypic and genotypic comparison of Escherichia coli from pristine tropical waters. Applied and Environmental Microbiology, 54: 979-983.
Berne, A., G. Delrieu, J.D. Creutin, and C. Obled. 2004. Temporal and spatial resolution of rainfall measurements required for urban hydrology. Journal of Hydrology, 299(3-4): 166-179.
Birch, G.F., C. Matthai, M.S. Fazeli, and J.Y. Suh. 2004. Efficiency of a constructed wetland in removing contaminants from stormwater. Wetlands, 24: 459-466.
Bitton, G. 1994. Wastewater microbiology. John Wiley and Sons, Inc., New York, New
York.
Bowles, G. 2001. Impervious surfaces: an environmental indicator. Center for Land Use
Education. http://www.uwsp.edu/cnr/landcenter/pdffiles/EnvironmentalIndicatorFactSheet.pdf
Carleton, J.N., T.J. Grizzar, A.N. Godrej, and H.E. Post. 2001. Factors affecting the
performance of stormwater treatment wetlands. Water Research, 35(6): 1552-1562.
Carlson, T. and T. Arthur. 2000. The impact of land use - land cover changes due to
urbanization on surface microclimate and hydrology: a satellite perspective. Global and Planetary Change, 25(1-2): 49-65.
Carteret County Official Website: Land Use Plan pg. I-50 http://www.co.carteret.nc.us/departments/planning/cama/section1.pdf
Center for Watershed Protection. November 2004. Environmental Indicator Profile Sheet. Indicator Profile No. 17: Public Attitude Surveys. http://www.stormwatercenter.net/monitoring%20and%20assessment/ind%20profiles/IndPros17.pdf
Center for Watershed Protection. November 2004. Environmental Indicator Profile Sheet.
Indicator Profile No. 20: User Perception. http://www.stormwatercenter.net/monitoring%20and%20assessment/ind%20profiles/IndPros20.pdf
Center for Watershed Protection. Environmental Indicator Profile Sheet. Indicator Profile
No. 25: BMP Performance Monitoring. http://www.stormwatercenter.net/monitoring%20and%20assessment/ind%20profiles/IndPros25.pdf
Colgan, C. S. 2004. The changing ocean and coastal economy of the United States: a
briefing paper for governors. Prepared for National Governors Association. 18 pp. Corbett, C., M. Wahl, D. Porter, D. Edwards, and C. Moise. 1997. Nonpoint source
runoff modeling: a comparison of a forested watershed and an urban watershed on the South Carolina Coast. Journal of Experimental Marine Biology and Ecology, 213(1): 133-149.
Cottingham, K. L, D.A. Chiavelli, and R. A. Taylor. 2003. Environmental microbe and
human pathogen: the ecology and microbiology of Vibrio cholerae. Frontiers in Ecology and the Environment, 1(2): 80–86.
Dame, R. and S. Libes. 1993. Oyster reefs and nutrient retention in tidal creeks. Journal
of Experimental Marine Biology and Ecology, 171(2): 251-258. Dorfman, M. and N. Stoner. 2004. Testing the waters 2004: a guide to water quality at
vacation beaches. Natural Resources Defense Council. p.1-231
Drexler, M. 2002. Secret agents: the menace of emerging infections. National Academy of Sciences, Washington D.C.
Dufour, A. P. 1984. Bacterial indicators of recreational water quality. Canadian Journal of Public Health, 75: 49-56.
Dyble, Juli. October 2004. Personal Communication. Stormwater impacts on coastal
systems.
Easton, J. H. 2000. The development of pathogen fate and transport parameters for use in assessing health risks associated with sewage contamination. Ph.D. dissertation, Dept. of Civil and Envr. Engineering, University of Alabama at Birmingham, 1-9.
Environmental Protection Authority of Victoria (EPA Victoria), State Government of Victoria. Edited June 24, 2003. Understanding point source and non-point source pollution. Victoria, Australia.
http://www.epa.vic.gov.au/Water/Threats/sources.asp
Fowler, Patricia. November 8, 2004. Personal Communication. Beach advisories and
shellfish closures.
Geldreich, E. E. 1976. Fecal coliform and fecal streptococcus density relationships in waste discharges and receiving waters. Critical Reviews in Environmental Controls, 6: 349.
Gumbo, B., N. Munyamba, G. Sithole, and H. Savenije. 2001. Coupling of digital elevation model and rainfall-runoff model in storm drainage network design. Sanitation Connection Water Net Symposium. http://www.sanicon.net/titles/title.php3?titleno=504
Haile, R. W., J. Alamillo, K. Barrett, R. Cressey, J. Dermond, C. Ervin, A. Glasser, N.
Harawa, P. Harmon, J. Harper, C. McGee, R.C. Millikan, M. Nides, and J. S. Witte. 1996. An epidemiological study of possible adverse health effects of swimming in Santa Monica Bay. Santa Monica Bay Restoration Project. Final Report, 7 May (summary October 1996). Executive Summary, 2003.
Haile, R. W., J.S. Witte, M. Gold, R. Cressey, C. McGee, R.C. Millikan, A. Glasser, N.
Harawa, C. Ervin, P. Harmon, J. Harper, J. Dermand, J. Alamillo, K. Barrett, M. Nides, and Guang-yu Wang. 1999. The health effects of swimming in ocean water contaminated by storm drain runoff. Epidemiology, 10: 355-363.
Hasse, J. and R. Lathrop. 2003. Land resource impact indicators of urban sprawl. Applied
Geography, 23(2-3): 159-175.
Heal the Bay. May 2004. Beach Report Card 2003-2004. http://www.healthebay.org/brc/annual/2004/default.asp
Hunt, W.F. and B.A. Doll. 2000. Urban Waterways: Designing Stormwater Wetlands for Small Watersheds. Published by North Carolina Cooperative Extension Service, 1-14.
International Year of the Ocean. 1998. Ensuring the sustainability of ocean living
resources. National Meeting, discussion papers. NOAA Homepage Design and Construction Company.
http://www.yoto98.noaa.gov/yoto/meeting/liv_res_316.html International Year of the Ocean. 1998. Perspectives on marine environmental quality
today. National Meeting, discussion papers. NOAA Homepage Design and Construction Company.
http://www.yoto98.noaa.gov/yoto/meeting/mar_env_316.html
Jennings, G.D., R.E. Sneed, and M.B. St. Clair. 1996. Volatile organic compounds (VOCs) in drinking water. N.C Cooperative Extension Service: Water Quality & Waste Management.
Jones, A.B., N.P. Preston, and W.C. Dennison. 2002. The efficiency and condition of oysters and macroalgae used as biological filters of shrimp pond effluent. Aquaculture Research, 33: 1-9.
Kadlec, R..H and R.L. Knight. 1996. Treatment wetlands. CRC Press, Boca Raton, FL.
Kao, C.M., J.Y. Wang, H.Y. Lee, and C.K. Wen. 2001. Application of a constructed
wetland for NPS pollution control. Water Science and Technology, 44: 585-590. Kao CM, J.Y. Wang, K.F. Chen, H.Y. Lee, and M.J. Wu. 2002. Non-point source
pesticide removal by a mountainous wetland. Water Science and Technology, 46: 199-206.
Kay, D., and C. Fricker. 1997. Coliforms and E. coli: problem or solution? Royal Society of Chemistry, Cambridge, United Kingdom.
Kellems, B. L., R. Johnson, and F. Sanchez. 2003. Design of emerging technologies for
control and removal of stormwater pollutants. Water World & Environmental Congress, 1-10.
Kelly, J.J. 1999. Hurricanes and Coastal Hazards.
http://members.aol.com/EKlusmann/Prepare/Hurrican.htm
Kennish, M.J. 1992. Ecology of estuaries: anthropogenic effects. CRC Press, Boca Raton, Florida.
King, P. 1999. The fiscal impact of beaches in California. A report commissioned by the California Department of Boating and Waterways.
King, P and D. Symes. 2003. The potential loss in gross national product and gross state
product from a failure to maintain California’s beaches. A report prepared for the California Department of Boating and Waterways.
Line, D. and N. White. 2004. Jumping Run Creek Urban Planning and BMP Demonstration
Project (Ew01034, 4/1/01-9/30/04): Final Report. 319 (h) Program, NC Division of Environmental and Natural Resources, 1-29.
Martin, N and L.H. Pendleton. Perceptions of environmental quality and risk in beach recreation. University of Southern California, Los Angeles, CA.
http://www.sccoos.org/docs/riskperceptions.pdf (2004) Michigan Sea Grant. 2004. Wetlands. www.miseagrant.org. (12/6/2004) Miller, Christine. November 8, 2004. Personal communication. Recreational swimming areas. Minnesota Department of Health. 2004. Beaches and recreational waters in Minnesota:
waterborne pathogens. http://www.health.state.mn.us/divs/eh/beaches/beachbugs.html
Mitchell D.S., A.J. Chick, G.W. Raisin. 1995. The use of wetlands for water pollution
control in Australia. Water Science and Technology, 32: 365-373.
Mitsch, W.J. and J.G. Gosselink. 1986. Wetlands. Van Nostrand Reinhold Co. Inc, New York, NY.
Nassauer, J.I., B. Halverson, and S. Roos. 1997. Bringing garden amenities into your
neighborhood: infrastructure for ecological quality. Department of Landscape Architecture, University of Minnesota. Minneapolis.
National Assessment Synthesis Team, US Global Change Research Program. 2000.
Climate change impacts of the United States: the potential consequences of climate variability and change. Health sector.
http://www.usgcrp.gov/usgcrp/Library/nationalassessment/17HE.pdf
National Oceanic and Atmospheric Administration (NOAA). 2004. Indicators of impervious surfaces. http://www.csc.noaa.gov/alternatives/impervious.html
National Oceans Economics Program. 2004.
http://essp.csumb.edu/noep/
National Research Council (NRC), Groundwater Recharge Committee, National Academy of Science. 1994. Ground water recharge using waters of impaired quality. 20: 77-113.
Natural Resources Defense Council. August, 2004. Testing the waters: a guide to water
quality at vacation beaches.
Nelson, K.A., L.A. Leonard, M.H. Posey, T.D. Alphin, and M.A. Mallin. 2004. Using transplanted oyster (Crassostrea virginica) beds to improve water quality in small tidal creeks: a pilot study. Journal of Experimental Biology and Ecology, 298: 347-368.
Noble, R.T. November 2004. Watershed management. Lecture at University of North Carolina at Chapel Hill.
Noble, R.T. December 6, 2004. Personal Communication. Pathogen resistance to UV radiation.
Noble, R. T. and S.B. Weisberg. 2004. A review of technologies for rapid microbial
detection in recreational waters, 1-12. North Carolina Cooperative Extension. Saving the planet: one watershed at a time.
Jumping Run Creek, North Carolina. http://www.ces.ncsu.edu/depts/design/research/jumpingrun/index.html North Carolina Department of Commerce, Division of Tourism. 2003. Economic impact
of tourism in North Carolina. www.nccommerce.com/tourism North Carolina Department of Environment and Natural Resources (NCDENR). 2004.
Caring for our fisheries: an introduction to the Coastal Habitat Protection Plan. Published by NOAA.
North Carolina Department of Environment and Natural Resources (NCDENR). March
19, 2004. North Carolina Nonpoint Source Management Program. Program Background and Status.
http://h2o.enr.state.nc.us/nps/CNPSCP/background.htm North Carolina Department of Environment and Natural Resources (NCDENR), Division
of Environmental Health, Shellfish Sanitation and Recreational Water Quality Section. Effective February 1, 2004. Coastal recreational waters monitoring
evaluation, and notification. 15A NCAC 18A .3400 North Carolina Department of Environment and Natural Resources (NCDENR), Division
of Environmental Health, Shellfish Sanitation and Recreational Water Quality Section. October 2004. Water monitoring.
http://www.deh.enr.state.nc.us/shellfish/Water_Monitoring/water_monitoring.html
North Carolina Department of Environment and Natural Resources (NCDENR), Division
of Marine Fisheries. 2004. Coastal Habitat Protection Plan – Shell Bottom. www.ncfisheries.net.
North Carolina Department of Environment and Natural Resources (NCDENR), Division of Marine Fisheries. 2004. Coastal Habitat Protection Plan - Wetlands.
www.ncfisheries.net North Carolina Department of Environment and Natural Resources (NCDENR), Office
of Environmental Education. 2004. www.ee.enr.state.nc.us (12/6/2004)
North Carolina Department of Environment and Natural Resources (NCDENR), Division
of Water Quality. 1998. North Carolina stormwater site planning guidance manual. Section eleven: special concerns and problem areas, 87-89.
http://www.h2o.enr.state.nc.us/su/PDF_Files/SW_Documents/Site_Planning_Document.pdf
North Carolina Department of Environment and Natural Resources (NCDENR), Division
of Water Quality. 1999. Stormwater best management practices. http://h2o.enr.state.nc.us
North Carolina Department of Environment and Natural Resources (NCDENR), Division
of Water Quality. June 10, 2004. Stormwater unit: NPDES Phase II Stormwater Program. http://dem.ehnr.state.nc.us/su/NPDES_Phase_II_Stormwater_Program.htm
North Carolina Department of Environment and Natural Resources (NCDENR), Division of Water Quality. NC Water Quality Issues. http://www.dem.ehnr.state.nc.ud/basinwide/WQ%20citizen%20guide%20on%20the%20web.pdf
Oliver, J. D., and J. B. Kaper. 2001. Vibrio species. In M. P. Doyle, L. R. Beuchat, and T. J. Montville, editors. Food microbiology: fundamentals and frontiers. ASM Press, Washington, D.C. 228-264.
Paerl, H. October 26, 2004. Managing eutrophication along the estuarine-coastal salinity gradient. Lecture at University of North Carolina at Chapel Hill.
Paul, M. and J. Meyer. 2002. Streams in the urban landscape. Annual Review of Ecological Systems, 32: 333-365.
Pendleton, Linwood. 2001. Managing beach amenities to reduce exposure to coastal hazards: storm water pollution. Supported by The Wrigley Institute for Environmental Studies at the University of Southern California.
Peterson, C.H. October 21, 2004. Ecosystem engineers, oyster reefs. Lecture at University of North Carolina at Chapel Hill.
Peterson, C.H. November 16, 2004. Exxon Valdex oil spill (EVOS) legacy: shifting
paradigms in oil ecotoxicology. Lecture at University of North Carolina at Chapel Hill.
Piehler, M. November 2004. Better site design development to protect water quality.
Lecture at University of North Carolina at Chapel Hill.
Pitt, R., M. Lalor, and J. Easton. 2000. Potential human health effects associated with
pathogens in urban wet weather flows. Submitted to: Journal of American Water Resources Association, 1-23.
Pitt, R., M. Lalor, R. Field, D.D. Adrian, and D. Barbe. 1993. A user’s guide for the
assessment of non-stormwater discharges into separate storm drainage systems. U.S. Environmental Protection Agency, Storm and Combined Sewer Program, Risk Reduction Engineering Laboratory. EPA/600/R-92/238. PB93-131472. Cincinnati, Ohio.
Rain Gardens of West Michigan, West Michigan Environmental Action Council. 2003.
Grand Rapids, Michigan. www.raingardens.org
Reilly, J., P. Maggio and S. Karp. 2004. A model to predict impervious surface for regional and municipal land use planning purposes. Environmental Impact Assessment Review, 24(3): 363-382.
Ruiz, C. C., and M. Agraharkar. 2003. Unusual marine pathogens causing cellulitis and bacteremia in hemodialysis patients: report of two cases and review of the literature. Hemodialysis International (Blackwell Publishing), 7: 356-359.
Schmitz, R.J. 1995. Introduction to water pollution biology: pollution from petroleum
hydrocarbons. Shaffer, J.A. 2003. Water quality as a contemporary limiting factor to Olympia Oyster
(Ostreloa conchaphila) restoration in Washington State. Georgia Basin/Puget Sound Research Conference.
Shueler, T.R. 1987. Controlling urban runoff: a practical manual for planning and
designing urban BMPs. Publication number 87703. Metropolitan Washington Council of Governments, Washington, D.C.
Slonecker, E.T., D.B. Jennings, and D. Garofalo. 1994. Remote sensing of impervious
surfaces: a review. Remote Sensing Reviews, 20(3): 227-255. Smart, P. 2004. Understanding hydrology: a comparison of hydrologic methods.
Hydrocad Software Solutions, LLC. http://www.hydrocad.net/6166b.htm
Stephenson, J. North Carolina Coastal Federation. November 16, 2004. Personal Communication. Stormwater regulations and policy.
Stoner, N., M. Merkel, and M. Dorfman. February 2004. Swimming in sewage. NRDC, 1-83. Stormwater Manager’s Resource Center. August 9, 2004. Delineating subwatershed
boundaries. Slide show. www.stormwatercenter.net Stradling, R. September 13, 2004. Builders change the rules: group works system to get
stormwater compromise. The News & Observer, Raleigh, NC. Talley, J. 2004. The amazing oyster. DVD. Produced by North Carolina Sea Grant.
Tilley, D.R. and M.T. Brown. 1998. Wetland networks for stormwater management in
subtropical urban watersheds. Ecological Engineering, 10: 131-158.
Tong and Chen. 2002. Modeling the Relationship between Land Use and Surface Water Quality. Journal of Environmental Management. 66: 377-393.
U.S. Commission on Ocean Policy. 2004. Preliminary Report of the U.S. Commission on
Ocean Policy. Governor’s Draft. Washington, D.C. U.S. Environmental Protection Agency. June 1996. Overview of the Storm Water
Program. U.S. Environmental Protection Agency. 2000. Liquid assets 2000: America’s water
resources at a turning point. EPA-840-B-00-001. Office of Water (4101), United States Environmental Protection Agency, Washington, D.C.
U.S. Environmental Protection Agency. Updated December 8, 2003. National pollutant
discharge elimination system (NPDES). http://cfpub.epa.gov/npdes/
U.S. Geological Survey (USGS). Modified September 1, 2004. Determining the components
of impervious surfaces in urban watersheds. USGS Eastern Region Geography Office. Contact: Janet Tilley.
http://mac.usgs.gov/tilley/#disclaimers
Vigil. 2003. Clean water: an introduction to water quality and water pollution control. Oregon State University Press, Corvallis, 46-79.
Walker, D.J. and S. Hurl. 2002. The reduction of heavy metals in a stormwater wetland.
Ecological Engineering, 18: 407-414.