Embed Size (px)
Citation preview
White Paper
Karen ShakmanJessica BaileyNicole BreslowEducation Development Center
February 2017
A Primer for Continuous Improvement in Schools and Districts

The authors are indebted to the Carnegie Foundation for the Advancement of Teaching and the Institute for Healthcare Improvement for these two organization’s seminal contributions to the field of Continuous Improvement. The resources from these organizations were critical to the development of this resource.
This product was developed under a contract from the U.S. Department of Education for Teacher Incentive Fund (TIF) Technical Assistance, ED-ESE-15-A-0016/0001. The views expressed herein do not necessarily represent the positions or policies of the U.S. Department of Education. No official endorsement by the U.S. Department of Education of any product, commodity, service, or enterprise mentioned in this publication is intended or should be inferred. This product is public domain. Authorization to reproduce it in whole or in part is granted. For more information about the Teacher Incentive Fund’s work and its partners, see www.tlpcommunity.org.

Teacher & Leadership Programs
Table of Contents
What Is Continuous Improvement? 1
The Model for Improvement 2
Continuous Improvement in Education 3
The Plan-Do-Study-Act Cycle 5 Plan: Defining the Problem and Establishing the Aim 5
Do: Implementation and Measurement for Improvement 7
Study: Investigating the Data 9
Act: Determining Next Steps 9
Where to Go to Learn More 11
References 12
Appendix A. Fishbone Diagram for Causes of High Teacher
Turnover 13
Appendix B. Driver Diagram for Teacher Turnover 14

Teacher & Leadership Programs
1
What Is Continuous Improvement?
This brief orients educational practitioners to the continuous improvement process and how it can work in educational settings. The brief provides an overview and includes references and resources that school and district leaders may find helpful as they seek to integrate continuous improvement cycles into their work to improve teaching and learning.
Continuous improvement is a process that can support educational stakeholders in implementing and studying small changes with the goal of making lasting improvement. Continuous improvement helps educators address a specific problem through the use of iterative cycles to test potential solutions to the identified problem. These cycles support the development, revision, and fine-tuning of a tool, process, or initiative—such as an evaluation rubric or an induction program—that might lead to desired change. People who engage in the continuous improvement process identify specific problems, develop proposed solutions, (including new or revised tasks, processes, or tools); test them in real contexts; collect and study data on their effectiveness; and then make decisions based on what they learn. While similar to formative assessment, continuous improvement allows practitioners to engage in systematic inquiry without hiring an evaluator (Box 1).
Box 1. Continuous Improvement or Formative Evaluation?
Continuous improvement is closely related to program evaluation—specifically formative evaluation. Continuous improvement and formative evaluation both provide formative information to guide the improvement of program design, implementation, and performance. They differ in that continuous improvement focuses on a very specific task, process, or initiative while formative evaluation is often a more holistic approach. Formative evaluation may occur before a program’s implementation to improve its design or during implementation to ensure the program activities are delivered efficiently and effectively. By contrast, continuous improvement generally focuses on a program that is already underway. Although formative evaluation can be participatory and involve education practitioners, in continuous improvement, practitioners drive the process. The two approaches also differ in that continuous improvement uses a systematic approach (for example, the Plan-Do-Study-Act Cycle described in this brief) that requires practitioners to be deliberate in how they test and evaluate changes, while formative evaluation methods are not as prescriptive and may include a variety of approaches. When a group completes a cycle of continuous improvement, the findings may suggest a need for more substantive research or evaluation and can inform future formative or summative evaluation efforts conducted by outside experts.

Teacher & Leadership Programs
2
The Model for Improvement
Continuous improvement has been around for a long time, in industry and health care, before becoming popular in educational settings. A great many successful industry and health care examples are available, including increases in productivity at the assembly line or the reduction in mortality rates in large hospitals. The framework for continuous improvement that guides all the steps of the process is known as the “model for improvement.1” The model for improvement consists of three essential questions:
• What problem are we trying to solve? For an organization to improve, its leaders and other key participants must set clear and firm intentions. These intentions are derived by clearly articulating a problem or issue that requires attention.
• What changes might we introduce and why? Continuous improvement requires key participants to develop, implement, test, and further develop changes to tools, processes or practices.
• How will we know that a change is actually an improvement? An essential part of continuous improvement is to clearly examine whether the change has, in fact, addressed the identified problem and made some meaningful improvement. Clear and specific measures that capture both the processes and the outcomes are critical to the continuous improvement process.
1 These three questions are adapted from the “Model for Improvement,” which the Associates in Process Improvement developed and the Institute for Healthcare Improvement adapted (Institute for Healthcare Improvement, 2015).

Teacher & Leadership Programs
3
Continuous Improvement in Education
Consider a district that has observed that teachers in the science, technology, engineering, and math (STEM) fields tend to leave the district at a faster rate than their peers in other disciplines. The district has articulated this as a problem to address, and district leaders would like to use a continuous improvement approach to determine how to retain more high-quality STEM educators. How does the district do this? Let’s apply the three questions from above.
• What problem are we trying to solve? In this example, the district has already identified a specific problem it wants to solve. It wants to increase the retention of STEM teachers.
• What changes might we introduce and why? The district might introduce additional coaching supports or financial incentives to retain STEM teachers.
• How will we know what change is an actual improvement? The district will collect data that provide information about whether and how it is succeeding in retaining STEM teachers. The district will identify clear and specific measures—such as coaching logs, teacher satisfaction surveys, or teacher retention data—to capture both the processes and the outcomes that are critical to the continuous improvement process.
The Carnegie Foundation for the Advancement of Teaching developed the Six Principles of Improvement specifically for an education-focused audience (Box 2). These principles offer additional guidance regarding continuous improvement processes, specifically in educational settings.

Teacher & Leadership Programs
4
Box 2. The Six Principles of Improvement
The Carnegie Foundation for the Advancement of Teaching (2015) has established six core principles of improvement:
1. Make the work problem specific and user centered. Continuous improvement starts with this question: “what specifically is the problem we are trying to solve?” The idea is to engage key participants, particularly those who are closest to the work, in the early discussions and to determine what issue or problem they want to address.
2. Variation in performance is the core problem to address. Understanding variation is an essential task in continuous improvement. For example, if nearly half of the teachers in a school district leave after 5 years, and then the question to ask is: “Why are half of the teachers leaving the district? What is different about the teachers who stay?” This variation is a problem to address to ensure that all students have access to high-quality teachers.
3. See the system that produces the current outcomes. Continuous improvement assumes that systems are designed to get exactly the results they achieve. Therefore, it is critical to ask what system-design elements—at the classroom, school, or district level—may be causing the problem. For example, in the case of high teacher attrition, is the problem related to the preparation of teachers or to workplace conditions? It is important to understand the source of the problem as well as the system in which it exists.
4. We cannot improve at scale what we cannot measure. In order to achieve a goal, organizations, teams, or individuals must gather data about the problem or processes they want to change and the outcomes associated with those processes. This requires both process and outcome measures, to track whether a change, in fact, represents an improvement.
5. Anchor practice improvement in disciplined inquiry. Systematic processes, such as the plan-do-study-act (PDSA) cycle, involve continually measuring processes and progress toward outcomes and using the data generated to advance toward the defined goals.
6. Accelerate improvement through networked communities. Carnegie has promoted accelerating learning through networked improvement communities (NICs). NICs bring together many different individuals, from a range of organizations, to address a common problem and are designed so that participants have distinct roles, responsibilities, and norms for participation.
The text in this box is adapted from Bryk, A.S., Gomez, L.M, Grunow, A., & LeMahieu, P.G. (2015). Learning to improve: How America’s schools can get better at getting better. Cambridge, MA: Harvard Education Press.

Teacher & Leadership Programs
5
The Plan-Do-Study-Act Cycle
Groups commonly use the Plan-Do-Study-Act (PDSA) cycle in continuous improvement processes to formalize an investigation of the model for improvement—the three questions listed above. The PDSA cycle provides a structure for testing a change and guides rapid learning through four steps that repeat as part of an ongoing cycle of improvement.
• Plan: This step clarifies the problem and identifies the overall aim; the tool, process, or change to implement; and more specific targets or objectives of the continuous improvement process.
• Do: This step involves the implementation of the tool, process, or change and the collection of both process and outcome data.
• Study: In this step, participants examine the collected data and consider the extent to which the specific targets or objectives met those identified in the Plan step, as well as the overall aim.
• Act: This last step integrates all the learning generated throughout the process. The stakeholders, as needed, make adjustments to the specific objectives or targets, formulate new theories or predictions, make changes to the overarching aim of the continuous improvement work, and/or modify any tools or processes being tested.
Often, stakeholders must undertake multiple PDSA cycles to see a change that actually works. Each cycle builds on what was learned in the previous one, and, as a result, participants move closer to the targets they hope to achieve.
Plan: Defining the Problem and Establishing the Aim During the Plan step, team members define both what they intend to test (such as a coaching protocol for principals to use with early career teachers) and the metrics they will use to assess whether they have met their aim (including both process and outcomes measures). Two valuable tools that can guide participants through the process of defining a problem and establishing an aim are the Fishbone Diagram and the Driver Diagram.
Defining the Problem: Fishbone Diagram
As stated above, a group involved in a continuous improvement process must first clearly define the problem to be addressed. To do so, a Fishbone Diagram, also known as a Cause and Effect Diagram, is a useful tool (see Appendix A for an example). The Fishbone Diagram supports the group to more clearly define the problem and provides a graphic representation of the group’s rich discussion. This
Teacher & Leadership Programs
6
analytic tool is useful in developing a clear picture of both the issue itself and potential ways to address it. Using a Fishbone Diagram, participants generate multiple perspectives and hypotheses about why a specific problem occurs. Considering all the factors that might contribute to the problem before honing in on a specific approach ensures that participants are thorough and inclusive in determining the change to be tested.
Establishing an Aim: The Driver Diagram
Once the group members have clearly identified the problem using the Fishbone Diagram, they can establish the specific aim—or overarching improvement goal—and the change idea(s) they will test with the continuous improvement cycles. Whenever possible, it is valuable for groups to examine existing—or baseline—data both to support their problem definition and to help them determine a reasonable and measurable aim for the continuous improvement process. A Driver Diagram is a tool that helps to translate the work from the Fishbone Diagram—which defined the problem, contributing factors, and related causes—into a clearly articulated aim and goals to meet the aim (see Appendix B for an example). The Fishbone Diagram starts from a problem, such as STEM teacher attrition, and identifies factors contributing to that problem. For example, a factor related to teacher attrition might be poor workplace conditions. The Driver Diagram takes the problem statement (e.g., STEM teacher attrition), transforms it into an overarching aim (to increase retention of STEM teachers), and identifies ways to address the factors that might contribute to the problem, such as ways to improve workplace conditions. Teams use the Driver Diagram to identify a logical set of smaller, more tangible goals and then select a specific action or change that might address these goals. This is the change that the group
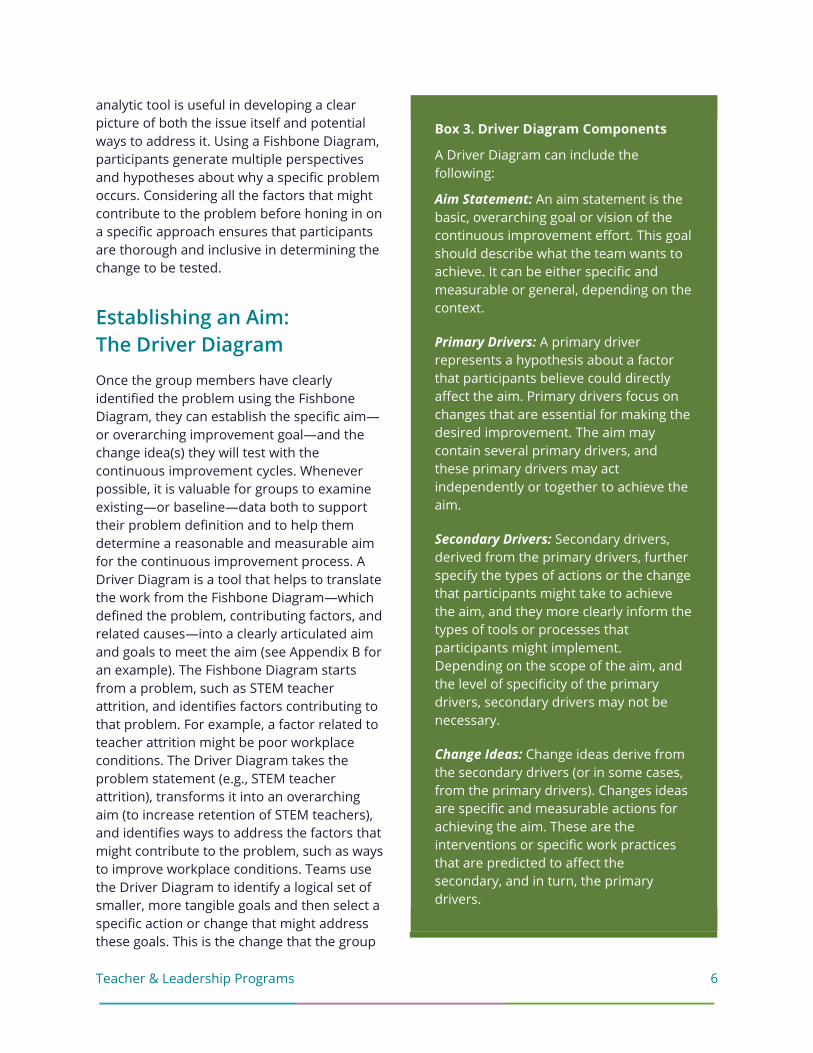
Box 3. Driver Diagram Components
A Driver Diagram can include the following:
Aim Statement: An aim statement is the basic, overarching goal or vision of the continuous improvement effort. This goal should describe what the team wants to achieve. It can be either specific and measurable or general, depending on the context.
Primary Drivers: A primary driver represents a hypothesis about a factor that participants believe could directly affect the aim. Primary drivers focus on changes that are essential for making the desired improvement. The aim may contain several primary drivers, and these primary drivers may act independently or together to achieve the aim.
Secondary Drivers: Secondary drivers, derived from the primary drivers, further specify the types of actions or the change that participants might take to achieve the aim, and they more clearly inform the types of tools or processes that participants might implement. Depending on the scope of the aim, and the level of specificity of the primary drivers, secondary drivers may not be necessary.
Change Ideas: Change ideas derive from the secondary drivers (or in some cases, from the primary drivers). Changes ideas are specific and measurable actions for achieving the aim. These are the interventions or specific work practices that are predicted to affect the secondary, and in turn, the primary drivers.

Teacher & Leadership Programs
7
will try, or test, as part of the continuous improvement process. Box 3 provides additional information about the components of a Driver Diagram.2
Driver Diagrams can be used for the following reasons:
• To help a group or team determine what factors need to be addressed to achieve their aim. Creating a list of such factors as a team helps ensure that everyone understands what the aim is and how it can be achieved;
• To show how the various factors may connect to each other;
• To communicate the change strategy visually;
• To serve as the foundation for a measurement framework.
Do: Implementation and Measurement for Improvement During the Do step, the team first implements the change idea for a designated period of time. In our example, the change proposed is a new teacher-principal conversation protocol that is designed to identify early-career STEM teachers’ needs and concerns so the district can provide them with support and hopefully prevent them from leaving. For an initial Do cycle, it may be appropriate for four principals to implement this conversation protocol with five teachers each during the first cycle, which may last for six weeks.
As they use the conversation protocol, the principals will collect their own data on the process. For example, did the protocol guide them to identify teacher needs? Did they provide the teachers with follow-up supports? In addition, the district might also collect data via a survey of the teachers, to learn whether the teachers believed the conversations supported their needs. The data collected in this first cycle might then inform changes to the protocol (for its use in the next cycle) and might suggest whether the protocol appears to be having the desired effect, even though outcome data in the form of teacher retention would not be available in this early cycle.
Measurement for Improvement
As described above, continuous improvement is about more than just experimenting with new strategies to solve a problem. It also requires the systematic collection of data to study the effectiveness of the new strategies in achieving the specific goals related to the overall aim. However, measurement for improvement is different from measurement for accountability or for
2Driver diagrams have some similarities to Logic Models in that they both provide a graphic representation of a theory of change that helps to guide programs and policies. However, driver diagrams work from an existing program and identify one specific goal or aim and generate a specific and focused change idea to implement. Logic models often start from a problem to be addressed and specify several outcomes—short and long term—and then build a program or policy to meet that outcome.

Teacher & Leadership Programs
8
research. We describe some of these differences below, with specific focus on measurement for improvement. In addition, Box 4 describes “practical measures,” which are recommended for continuous improvement.
• Measurement for accountability generally focuses on outcomes or results, is used to make high-stakes decisions, and often does not provide information about how outcomes were achieved.
• Measurement for research is intended to generate theories that may be generalizable to varying contexts and environments.
• Measurement for improvement generally focuses on a relatively small set of change ideas that groups may implement, study, and refine. Rather than advancing generalizable theory, measurement for improvement tests out a working theory of change in a particular context. In short, measurement for improvement:
– Identifies which problems or opportunities for improvement exist within the system, – Generates baseline data for the purpose of assessing improvements, – Gathers data related to improvements from the baseline, and – Gathers data about the processes used.
Box 4. What Are “Practical Measures”?
The Carnegie Foundation for the Advancement of Teaching identifies a set of criteria for practical measures that are recommended for continuous improvement. These criteria suggest practical measures should be:
• Embedded in practitioners’ regular work in the process of teaching and learning (and ideally, those doing the “improving” are involved in the selection of the measures);
• Administered frequently in order to identify opportunities for change and to assess whether the tool or process is yielding the desired results; and
• Made accessible, in language, tone, and content, for those who are using the measures as well as those who will be making decisions based on the results.
"Practical measures” are those that practitioners can collect, analyze, and use within their daily work lives. Practitioners should be able to use these measures to identify improvement targets while also learning whether the tested change led to any an actual improvement. The focus here is on collecting the right data that will inform practitioners that an improvement has occurred without overburdening them in the collection process.
In the example of the principal-teacher conversation protocol to support teacher retention, data collected may include: principal notes on the conversations they have with teachers, including data on the kinds of needs identified; responses to a teacher survey in which the teachers report on the perceived value of the conversations, on their needs and how they were addressed, and on their plans for the next year; and teacher retention data, when it becomes available. Together, these measures capture both the process employed (the conversations) and the outcome of interest (increased teacher retention).

Teacher & Leadership Programs
9
Study: Investigating the Data Once the team collects the desired data in the Do step, team members come together to analyze the data. Using a formal protocol or process to guide a team’s data inquiry discussions helps educators make the most of their data and their limited time together. Several protocols exist for this purpose, but they all guide participants to begin by simply stating what they see in the data, without making judgments or interpreting why the data look as they do. As participants continue the discussion, they move from lower-inference statements that simply describe the data (e.g., “I see that 30 percent of teachers who responded to the survey agreed or strongly agreed with the statement: The conversation with my principal gave me concrete ideas about actions I could take to improve my practice.”) to higher-inference statements that make comparisons or offer interpretations of the data (e.g., “As I look across the data, I think the teachers who responded favorably to the principal conversations were also those teachers who had more classroom experience.”). During this analysis discussion, participants should also raise questions for further investigation (e.g., “I wonder what topics the teachers and principals covered during their conversations.” or “I want to know whether there is any relationship between the topics covered and the teachers’ satisfaction with the conversations.”). This formal process, and the questions that emerge from the discussion, guides decisions about additional cycles of implementation and data collection.
Act: Determining Next Steps After the data have been collected and analyzed, the team determines whether the change or changes that they introduced and tested should be adopted, adapted, or abandoned altogether. During this Act step, the team decides whether to modify and fine-tune the tested change. In our example with the new STEM teacher-principal conversation protocol, the team will make decisions regarding next steps for the use of the conversation protocol, such as making revisions to the protocol, scaling up to use the protocol with more principals and teachers, or changing the types of questions asked in the follow-up teacher survey. During this last stage of the PDSA cycle, teams decide what to do next based on what they learned. Critical questions before moving to another cycle of implementation include the following:
• Should the change be tested on a larger scale? If the team saw actual improvement and positive movement toward the aim (even if they do not yet have data specifically related to the aim, such as retention data), it may be time to expand the change effort and test it with more teachers and principals or in more classrooms or schools. Several PDSA cycles may be necessary before this option is appropriate.
• Do adjustments need to be made? If adjustments are needed to the tool, protocol, or process, the team will need to re-test it through another cycle. In the example of a district wanting to improve early-career STEM teacher retention, if the data indicate that the teachers still need more support, then the teacher-principal conversation protocol could be adjusted to better address this.
Teacher & Leadership Programs
10
• Should the idea be abandoned? Sometimes the data indicate no improvement or progress toward the desired goal, and the team realizes that what it tested did not achieve, or does not appear to suggest it will achieve (if outcome data are not yet available), the desired outcomes. The best course in this case may be to return to the Driver Diagram and consider whether the team needs to introduce and test a new tool, protocol, or process.
Before You Begin…
To successfully conduct cycles of continuous improvement, it is critical that people within an organization have:
• The collective will to persevere through the process;
• Some clearly defined ideas about the problem and ways to address it; and
• The capacity to execute some of these ideas.
Before a team embarks on a continuous improvement project, school and district leaders should take stock of their group and situation. Consider the group members’ willingness to engage with a process that requires their commitment, patience, and perseverance; the group members’ ability to clearly and creatively define a problem and generate ideas about how to address the problem; and their capacity (e.g., time, resources, and staffing) to execute. Are they all sufficiently present to support embarking on cycles of continuous improvement? If not, what would it take to get the group there?

Teacher & Leadership Programs
11
Where to Go to Learn More
While this brief provides an introduction to continuous improvement, the resources listed below provide tools and templates that may be useful for groups interested in embarking on continuous improvement work.
Centers for Medicare and Medicaid Services (n.d.). Plan, do, study, act (PDSA) cycle template. Retrieved from https://www.cms.gov/Medicare/Provider-Enrollment-and-Certification/QAPI/downloads/PDSACycledebedits.pdf.
The Associates for Process Improvement developed this template to assist groups to plan and document their progress designing and testing changes. It provides guiding questions for each of the Plan, Do, Study, Act phases of the process.
Institute for Healthcare Improvement (2015a). Improvement Capability: Overview. Retrieved from http://www.ihi.org/Topics/ImprovementCapability/Pages/default.aspx
The Institute for Healthcare Improvement website provides a wealth of information, tools, and resources to guide continuous improvement processes. These resources include: (1) How to Improve: The Model for Improvement and PDSA Cycles, a guide to improvement that includes sections on forming the right improvement team; setting aims; establishing measures; and selecting, testing, implementing, and spreading changes; (2) a collection of videos discussing the different elements of the Model for Improvement; and (3) an online course on how to improve using the Model for Improvement.
Langley, G.J., Moen, R.D., Nolan, K.M., Nolan, T.W., Norman, C.L., & Provost, L.P. (2009). The Improvement Guide: A Practical Approach to Enhancing Organizational Performance. San Francisco, CA: Jossey-Bass.
This book provides an in-depth discussion of the Model for Improvement and provides a road map for how to use it. It includes case studies in improvement across a range of disciplines, including education. The appendix provides a large collection of tools and resource, organized according to which component of the Model it supports.
Park, S., & Takahashi, S. (2013). 90-Day Cycle Handbook. Stanford, CA: Carnegie Foundation for the Advancement of Teaching. Retrieved from https://www.carnegiefoundation.org/wp-content/uploads/2014/09/90DC_Handbook_external_10_8.pdf
This handbook provides an overview of a 90-Day Cycle, a disciplined and structured form of inquiry that supports improvement work. The handbook describes the different processes involved in 90-Day Cycles, including the pre-cycle period; the three phases of the cycle—scan, focus, and summarize; and the post-cycle period. The handbook also provides guidance on roles and responsibilities and provides templates to support the different cycle phases.

Teacher & Leadership Programs
12
References
Bryk, A.S., Gomez, L.M, Grunow, A., & LeMahieu, P.G. (2015). Learning to improve: How America’s schools can get better at getting better. Cambridge, MA: Harvard Education Press.
Bryk, A.S., Gomez, L., & Grunow, A. (2010). Getting ideas into action: Building networked improvement communities in education. Stanford, CA: Carnegie Foundation for the Advancement of Teaching. Retrieved from https://www.carnegiefoundation.org/wp-content/uploads/2014/09/bryk-gomez_building-nics-education.pdf
Carnegie Foundation. (2017). The six core principles of improvement. Retrieved from https://www.carnegiefoundation.org/our-ideas/six-core-principles-improvement/
Cohen-Vogel, L., Cannata, M., Rutledge, S.A., & Rose Socol, A. (2016). A model of continuous improvement in high schools: A process for research, innovation design, implementation, and scale. Teachers College Record Yearbook (Yearbook) 118(13), 1-x. Retrieved from http://www.tcrecord.org/Content.asp?ContentId=20656
Health Foundation. (2011). Evidence scan: Improvement science. Retrieved from http://www.health.org.uk/sites/health/files/ImprovementScience.pdf
Institute for Healthcare Improvement. (2017). How to improve. Retrieved from http://www.ihi.org/resources/Pages/HowtoImprove/default.aspx
Park, S., Hironaka, S., Carver, P., & Nordstrum, L. (2013). Continuous improvement in education. Palo Alto, CA: Carnegie Foundation for the Advancement of Teaching. Retrieved from https://www.carnegiefoundation.org/wp-content/uploads/2014/09/carnegie-foundation_continuous-improvement_2013.05.pdf
Smylie, Mark A. (2010). Continuous School Improvement. Thousand Oaks, CA: Corwin Press.
Willis D. Hawley and Donald L. Rollie (2007). The Keys to Effective Schools: Education Reform as Continuous Improvement (2nd Ed.) Thousand Oaks, CA: Corwin Press.

Teacher & Leadership Programs
13
Appendix A. Fishbone Diagram for Causes of High Teacher Turnover

Teacher & Leadership Programs
14
Appendix B. Driver Diagram for Teacher Turnover


![Lecture 5 1 Continuous distributions Five important continuous distributions: 1.uniform distribution (contiuous) 2.Normal distribution 2 –distribution[“ki-square”]](https://img.pdfslide.us/doc/110x75/56649c735503460f9492621f/lecture-5-1-continuous-distributions-five-important-continuous-distributions.jpg)