Embed Size (px)
Citation preview
7th Pipeline Technology Conference,| 3/1/2012
1 Pipeline technology Conference | Weatherford International. P&SS 2012
A Pipeline Inspection Case Study:
Design Improvements on a New Generation UT In-line Inspection Crack
Tool
Author:
Mark Slaughter
Global Product Line Manager – ILI
Weatherford International, P&SS
Co-authors:
Ing. Michael Huss Yuriy Zakharov
Projects and Maintenance Head of Data Analysis Department
Adria – Wien Pipeline Gmbh (AWP) Weatherford International, P&SS
[email protected] [email protected]
Andrey Vassiljev
Product Line Specialist – ILI
Weatherford International, P&SS
ABSTRACT
For over 20 years, ultrasonic in-line inspection (ILI) tools have played a crucial role in
helping operators manage pipeline integrity threats. The predominant ILI applications
utilizing ultrasonic technology have been for wall loss and crack inspection.
Despite the high success rate experienced with ultrasonic ILI tools, there are still
technological improvements needed to help operators manage the integrity of an aging
pipeline infrastructure. Among the improvements needed are at a higher confidence level in
the Probability of Detection (POD), improving detection reliability under different pipeline
conditions, increased ranges for pipeline operating parameters and leveraging synergies from
a Combo WM-CD in a single run.
7th Pipeline Technology Conference,| 3/1/2012
2 Pipeline technology Conference | Weatherford International. P&SS 2012
In 2010, Weatherford Pipeline and Specialty Services (P&SS) commissioned its new
generation fleet of ultrasonic wall measurement and crack detection tools. One of the design
objectives was to address some of the ILI tool limitations identified above.
This paper focuses on reviewing the latest design improvements for the new generation tools
and presenting a case study on a recent survey conducted on the Adria-Wien Pipeline (AWP).
The pipeline sections inspected were the 30” x 4 kilometer and 18” by 420 kilometer
pipeline. This is a joint collaboration between AWP (represented by Michael Huss) and
Weatherford Pipeline &Specialty Services.
Project Scope
The Adria–Wien Pipeline GmbH operates a crude oil pipeline, which connects the
Transalpine Pipeline from Würmlach at the Italian-Austrian border with the Schwechat
Refinery near Vienna, Austria. It allows oil supplies to Austria from the Italian oil terminal in
Trieste.
The length of the pipeline is 416 kilometres. The diameter of the main pipeline is 18 inches
(460 mm), divided into 3 section, and there is a section of 30” x 4 kilometre pipeline which
connects the main pipeline with the TAL system.
The pipeline was constructed in 1970 of seam welded pipe material conforming to API 5L
Grade X52. The nominal wall thickness was 6.35 mm to 9.52 mm. The pipeline has external
DANSO-3-Bandsystem coating.
Several in-line inspection surveys were performed in 1991, 2000 and 2006 using geometry
and MFL tools to determine the condition of the pipeline and identify any potential threats to
pipeline integrity.
In 2010 Weatherford were awarded a contract to inspect 4 sections of the AWP pipeline
using the latest generation of angled beam ultrasonic crack detection technology tools. The
pipeline reference names are:
PS -1 to PS06 18” x 169 km
PS06 to PS09 18” x 121,5 km
PS 09 to US02 18” x 123 km
TAZ1 to PS01 30” x 4 km
The project scope called for identification of axial cracks, crack-like anomalies in welded
seams, and parent material. Following the crack detection survey the vendor also performed a
crack assessment in accordance with API 579.
7th Pipeline Technology Conference,| 3/1/2012
3 Pipeline technology Conference | Weatherford International. P&SS 2012
Summary of Crack Inspection Field Operations
It should be noted that the marker locations were provided by AWP from previous run data.
In addition, a geometry survey was performed prior to mobilization. Weatherford have
mobilized its crew from an ILI base in Germany to provide the turnkey service. This service
included:
Pre-inspection cleaning by magnetic and brush scrapers
A Gauge Pig run
UT-CD inspection runs
After demobilization from site it was determined the UT-CD tool accurately recorded the
locations, crack sizes and crack-like anomalies. Features also recorded were axially-oriented
manufacturing anomalies.
Because pipeline integrity operations are comprised of several stages it was important to meet
AWP’s planned schedule. All 4 sections were completed within scheduling parameters.
After completion of the field inspection work Weatherford performed analysis of the
recorded data and provided AWP with a preliminary report. The preliminary report included
also reportable cracks, crack-likes and axially-oriented anomalies. Based on analysis of the
preliminary report AWP selected 4 locations in order to verify the accuracy of the defect
sizing and location. The 4 features excavated are comprised of two crack, one crack-like and
I seamweld anomaly.
During the verification process Weatherford provided a verification specialist to aid AWP
personnel in locating, classifying and identifying the dimensions of the selected anomalies.
All of the 4 verified locations confirmed the ILI predicted measurements were within stated
tolerance. The probability of detection and probability of classification specifications were
also confirmed as adhering to stated specification tolerances.
In addition to the ILI analysis, an API 579 assessment was performed which enabled the
operator to confidently continue to operate the asset with an understanding of Remaining
Strength Factors and Maximum Allowable Operating Pressure pursuant to industry standards.
This also provided detailed sizing information to enable the operator to monitor defect
growth following future inspections.
ILI tool Technology Characteristics
The latest generation of UT ILI pigs was introduced to the market in 2009 – 20101 after
having utilized the previous generation since 2003. The latest generation of
UT-CD pigs are better adapted for challenging pipeline conditions. For example, this
generation has improved the bend passing capability (1st generation 3D versus 2
nd
7th Pipeline Technology Conference,| 3/1/2012
4 Pipeline technology Conference | Weatherford International. P&SS 2012
generation1.5D bend capability), the probability of detection (POD), defect sizing, and
improved performance in challenging pipeline environments.
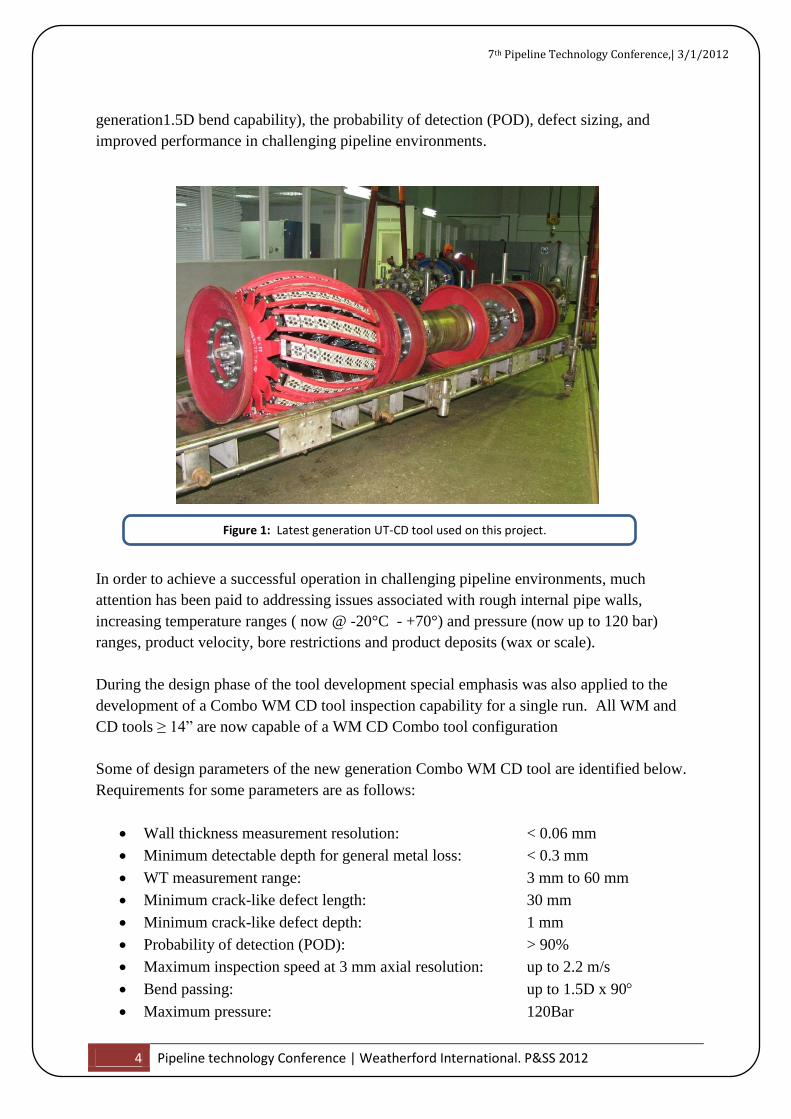
In order to achieve a successful operation in challenging pipeline environments, much
attention has been paid to addressing issues associated with rough internal pipe walls,
increasing temperature ranges ( now @ -20°C - +70°) and pressure (now up to 120 bar)
ranges, product velocity, bore restrictions and product deposits (wax or scale).
During the design phase of the tool development special emphasis was also applied to the
development of a Combo WM CD tool inspection capability for a single run. All WM and
CD tools ≥ 14” are now capable of a WM CD Combo tool configuration
Some of design parameters of the new generation Combo WM CD tool are identified below.
Requirements for some parameters are as follows:
Wall thickness measurement resolution: < 0.06 mm
Minimum detectable depth for general metal loss: < 0.3 mm
WT measurement range: 3 mm to 60 mm
Minimum crack-like defect length: 30 mm
Minimum crack-like defect depth: 1 mm
Probability of detection (POD): > 90%
Maximum inspection speed at 3 mm axial resolution: up to 2.2 m/s
Bend passing: up to 1.5D x 90
Maximum pressure: 120Bar
Figure 1: Latest generation UT-CD tool used on this project.

7th Pipeline Technology Conference,| 3/1/2012
5 Pipeline technology Conference | Weatherford International. P&SS 2012
Operating temperature range: -20C…+70C
Embedded IMU XYZ mapping accuracy: 1:2000
Improved Ultrasonic Transducers
A lot of combo ultrasonic immersion-type transducers have been investigated in order to
ensure appropriate characteristics for the UT ILI pigs.
The type of ultrasonic transducers that was selected for this technology has the following key
attributes and advantages:
High sensitivity (transducer signal is 15-20 dB greater than transducers of the
previous generation, allowing for increased sensor density and better signal to noise
ratio)
Improved transducer (Photo located in Figure 2) focusing based on new design
providing the following advantages:
o less sensitive to medium acoustical properties
o Reduction in signal losses from transducer to medium transition
Higher resolution due to shortened pulse width and customized signal processing
Improved operation parameters:
o Improved operating pressure up to 200 bar
o A temperature range of -20С to 120С
Figure 2: 2nd
Generation Ultrasonic transducers
7th Pipeline Technology Conference,| 3/1/2012
6 Pipeline technology Conference | Weatherford International. P&SS 2012
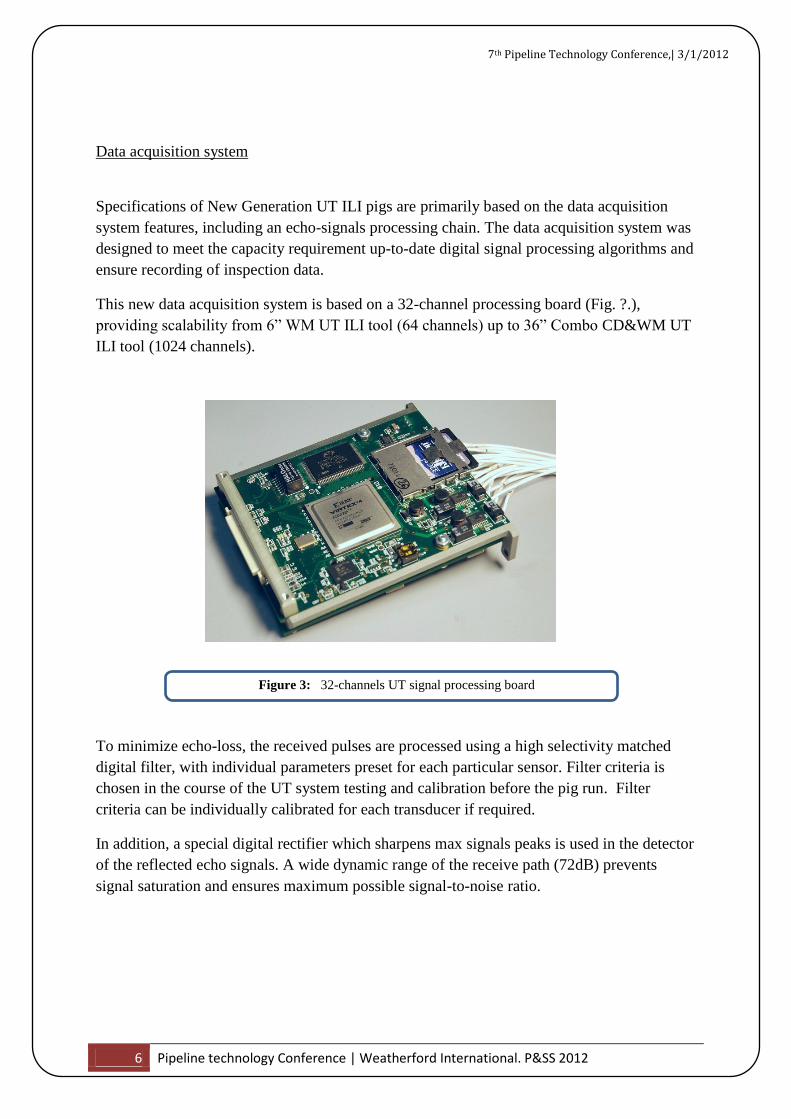
Data acquisition system
Specifications of New Generation UT ILI pigs are primarily based on the data acquisition
system features, including an echo-signals processing chain. The data acquisition system was
designed to meet the capacity requirement up-to-date digital signal processing algorithms and
ensure recording of inspection data.
This new data acquisition system is based on a 32-channel processing board (Fig. ?.),
providing scalability from 6” WM UT ILI tool (64 channels) up to 36” Combo CD&WM UT
ILI tool (1024 channels).
To minimize echo-loss, the received pulses are processed using a high selectivity matched
digital filter, with individual parameters preset for each particular sensor. Filter criteria is
chosen in the course of the UT system testing and calibration before the pig run. Filter
criteria can be individually calibrated for each transducer if required.
In addition, a special digital rectifier which sharpens max signals peaks is used in the detector
of the reflected echo signals. A wide dynamic range of the receive path (72dB) prevents
signal saturation and ensures maximum possible signal-to-noise ratio.
Figure 3: 32-channels UT signal processing board

7th Pipeline Technology Conference,| 3/1/2012
7 Pipeline technology Conference | Weatherford International. P&SS 2012
Confirmation of Latest Generation UT ILI Specification
Numerous laboratory, bench, and pull-through tests (containing artificial and natural defects)
have been performed to validate the design specifications1, 2
of the new UT ILI tools. In
addition, subsequent customer inspection surveys (including this case study project) have
further validated the published specifications for this technology. Photos of lab and field trials
are located below [Figure 5, 6]
-32
0
32
15.9
6
16.5
2
17.0
8
17.6
4
18.2
18.7
6
19.3
2
19.8
8
20.4
4
21
21.5
6
22.1
2
22.6
8
23.2
4
23.8
24.3
6
24.9
2
25.4
8
26.0
4
26.6
27.1
6
27.7
2
28.2
8
28.8
4
29.4
29.9
6
30.5
2
31.0
8
31.6
4
Am
pli
tud
e
Time, sec
Weak Echoes
-32
0
32
15.9
6
16.5
2
17.0
8
17.6
4
18.2
18.7
6
19.3
2
19.8
8
20.4
4
21
21.5
6
22.1
2
22.6
8
23.2
4
23.8
24.3
6
24.9
2
25.4
8
26.0
4
26.6
27.1
6
27.7
2
28.2
8
28.8
4
29.4
29.9
6
30.5
2
31.0
8
31.6
4
Am
pli
tud
e
Time, sec
Weak Echoes Filtered
0
32
64
15.9
6
16.5
2
17.0
8
17.6
4
18.2
18.7
6
19.3
2
19.8
8
20.4
4
21
21.5
6
22.1
2
22.6
8
23.2
4
23.8
24.3
6
24.9
2
25.4
8
26.0
4
26.6
27.1
6
27.7
2
28.2
8
28.8
4
29.4
29.9
6
30.5
2
31.0
8
31.6
4
Am
pli
tud
e
Time, sec
Weak Echoes Filtered
Pre-processed Signal
Digital Filtering
Figure 6: Mechanical field tests for
new generation UT
Figure 5: Sensor lab test for
surface roughness capability
-32
0
32
15.9
6
16.5
2
17.0
8
17.6
4
18.2
18.7
6
19.3
2
19.8
8
20.4
4
21
21.5
6
22.1
2
22.6
8
23.2
4
23.8
24.3
6
24.9
2
25.4
8
26.0
4
26.6
27.1
6
27.7
2
28.2
8
28.8
4
29.4
29.9
6
30.5
2
31.0
8
31.6
4
Am
pli
tud
e
Time, sec
Weak Echoes
-32
0
32
15.9
6
16.5
2
17.0
8
17.6
4
18.2
18.7
6
19.3
2
19.8
8
20.4
4
21
21.5
6
22.1
2
22.6
8
23.2
4
23.8
24.3
6
24.9
2
25.4
8
26.0
4
26.6
27.1
6
27.7
2
28.2
8
28.8
4
29.4
29.9
6
30.5
2
31.0
8
31.6
4
Am
pli
tud
e
Time, sec
Weak Echoes Filtered
0
32
64
15.9
6
16.5
2
17.0
8
17.6
4
18.2
18.7
6
19.3
2
19.8
8
20.4
4
21
21.5
6
22.1
2
22.6
8
23.2
4
23.8
24.3
6
24.9
2
25.4
8
26.0
4
26.6
27.1
6
27.7
2
28.2
8
28.8
4
29.4
29.9
6
30.5
2
31.0
8
31.6
4
Am
pli
tud
e
Time, sec
Weak Echoes Filtered
Rectification
Figure 4: Illustration of noisy weak echo signals with onboard digital filtering
process followed by rectification process for improved detecting and recording
accuracy
Figure 5: Illustration of noisy weak echo signals with
onboard digital filtering process followed by
rectification process for improved detecting and
recording accuracy
7th Pipeline Technology Conference,| 3/1/2012
8 Pipeline technology Conference | Weatherford International. P&SS 2012
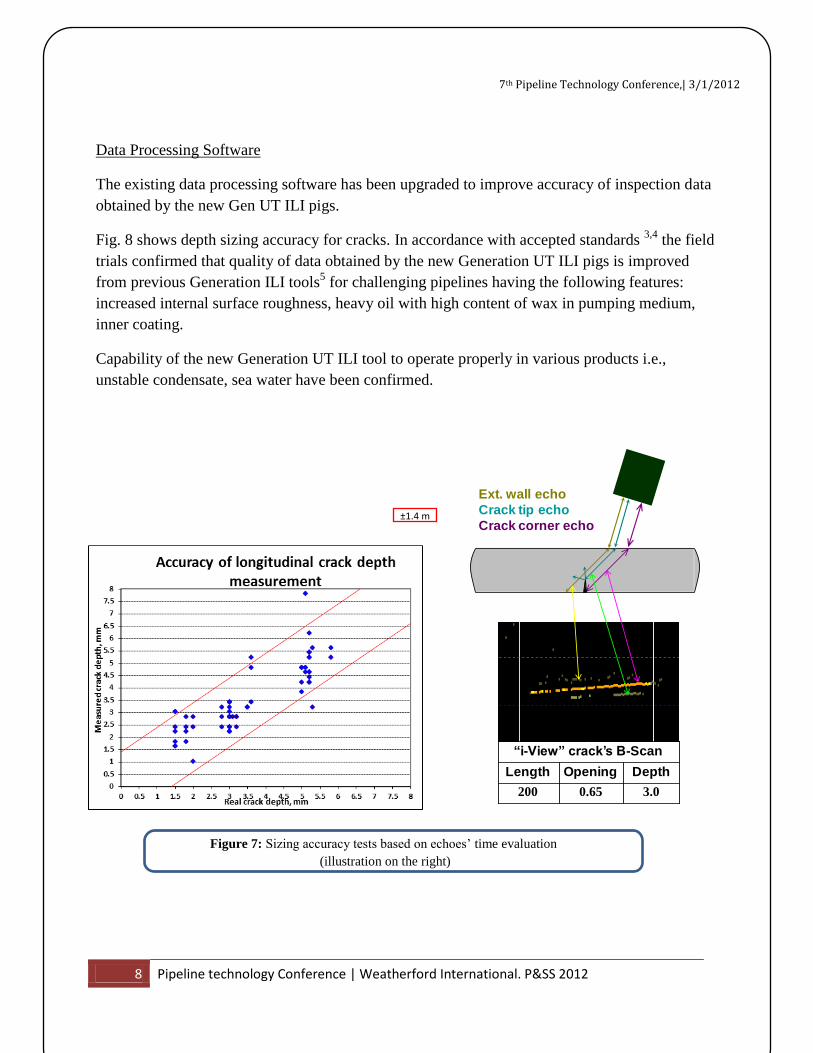
Data Processing Software
The existing data processing software has been upgraded to improve accuracy of inspection data
obtained by the new Gen UT ILI pigs.
Fig. 8 shows depth sizing accuracy for cracks. In accordance with accepted standards 3,4
the field
trials confirmed that quality of data obtained by the new Generation UT ILI pigs is improved
from previous Generation ILI tools5 for challenging pipelines having the following features:
increased internal surface roughness, heavy oil with high content of wax in pumping medium,
inner coating.
Capability of the new Generation UT ILI tool to operate properly in various products i.e.,
unstable condensate, sea water have been confirmed.
±1.4 m
Figure 7: Sizing accuracy tests based on echoes’ time evaluation
(illustration on the right)
“i-View” crack’s B-Scan
3.00.65200
DepthOpeningLength
Ext. wall echo
Crack tip echo
Crack corner echo

7th Pipeline Technology Conference,| 3/1/2012
9 Pipeline technology Conference | Weatherford International. P&SS 2012
0
1024
2048
3072
4096
5120
6144
7168
8192
9216
16.0
2
18.8
4
21.6
6
24.4
8
27.3
30.1
2
32.9
4
35.7
6
38.5
8
41.4
44.2
2
47.0
4
49.8
6
52.6
8
55.5
58.3
2
61.1
4
63.9
6
Am
pli
tud
e
Time, sec
Waxy & Clean Surface Comparison
Figure 8: WM sensor echoes comparison: 1mm hard wax deposit blue
and clean internal surface (magenta)
0
256
512
768
1024
1280
1
37
73
109
145
181
217
253
289
325
361
397
433
469
505
541
577
613
649
685
721
757
793
829
865
901
937
973
Am
pli
tud
e
Time, sec
Waxy Surface Rectified Echoes
Figure 9: WM echoes with 1 mm hard wax deposit (zoomed), measurement
capability is maintained
Leveraging
technology to
minimize
impact of
degraded data

7th Pipeline Technology Conference,| 3/1/2012
10 Pipeline technology Conference | Weatherford International. P&SS 2012
Summary of Data Analysis
Below are the results of the ultrasonic crack inspection of the 30'' and 18”' TAZ1 – USO1 pipeline with
the total length 418 km.
ILI Def. # DescriptionDepth
mmDecription
Depth
mmEstimate of the convergence
18” PS01 – PS06,
169 km31 external crack 2 internal crack 1.9 Possible inclined crack
18” PS06 – PS09,
121.5 km2149 external crack 2
laminations and
external surface
crack
0.9
Possible the signal amplitude on
data is increased due to a
combination of crack + lamination.
18” PS06 – PS09,
121.5 km2148
possible
external crack1
laminations and
external crack 1.1 Satisfactory
18” PS09 – US02,
123 km2348
poss. long
weld anomaly2
weld anomaly,
linear slag
inclusions
1.6 Satisfactory
ILI Predicted Verification
Table 1 Feature Summary
Table 2 Verification Detail Summary
Cracks NotchesLW
AnomalyTotal
30” TAZ1 - PS01, 4 km 0 0 0 0
18” PS01 – PS06, 169 km 25 297 12 334
18” PS06 – PS09, 121.5 km 34 228 4 266
18” PS09 – US02, 123 km 20 258 2 280
Grand Total of Anomalies 880
7th Pipeline Technology Conference,| 3/1/2012
11 Pipeline technology Conference | Weatherford International. P&SS 2012
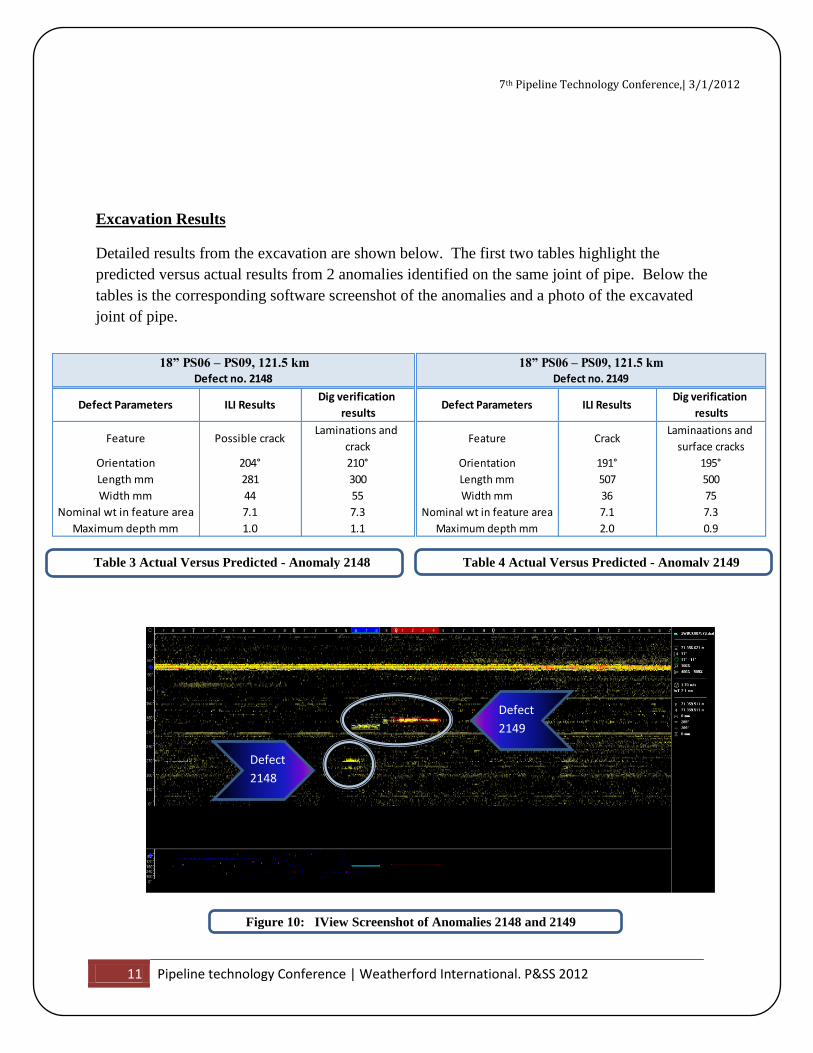
Excavation Results
Detailed results from the excavation are shown below. The first two tables highlight the
predicted versus actual results from 2 anomalies identified on the same joint of pipe. Below the
tables is the corresponding software screenshot of the anomalies and a photo of the excavated
joint of pipe.
Figure 10: IView Screenshot of Anomalies 2148 and 2149
Defect
2148
Defect
2149
18” PS06 – PS09, 121.5 km 18” PS09 – US02,
Defect no. 2148 Defect no. 2149
Defect Parameters ILI ResultsDig verification
results
Feature Possible crackLaminations and
crack
Orientation 204° 210°
Length mm 281 300
Width mm 44 55
Nominal wt in feature area 7.1 7.3
Maximum depth mm 1.0 1.1
Table 3 Actual Versus Predicted - Anomaly 2148
18” PS06 – PS09, 121.5 km
Defect no. 2149
Defect Parameters ILI ResultsDig verification
results
Feature CrackLaminaations and
surface cracks
Orientation 191° 195°
Length mm 507 500
Width mm 36 75
Nominal wt in feature area 7.1 7.3
Maximum depth mm 2.0 0.9
Table 4 Actual Versus Predicted - Anomaly 2149
7th Pipeline Technology Conference,| 3/1/2012
12 Pipeline technology Conference | Weatherford International. P&SS 2012
The actual versus predicted results of Feature no 31 and Feature no 2348 are outlined in tables 5
and 6 below.
18” PS01 – PS06,169 km 18” PS06 – PS09, 121.5 km
Defect no. 31 Defect no. 2148
Defect Parameters ILI ResultsDig verification
results
Feature Crack Crack
Orientation 69° 68°
Length mm 156 160
Width mm 32 25
Nominal wt in feature area 6.3 6.3
Maximum depth mm 2.0 1.9
Table 5 Actual vs Predicted - Anomaly 31
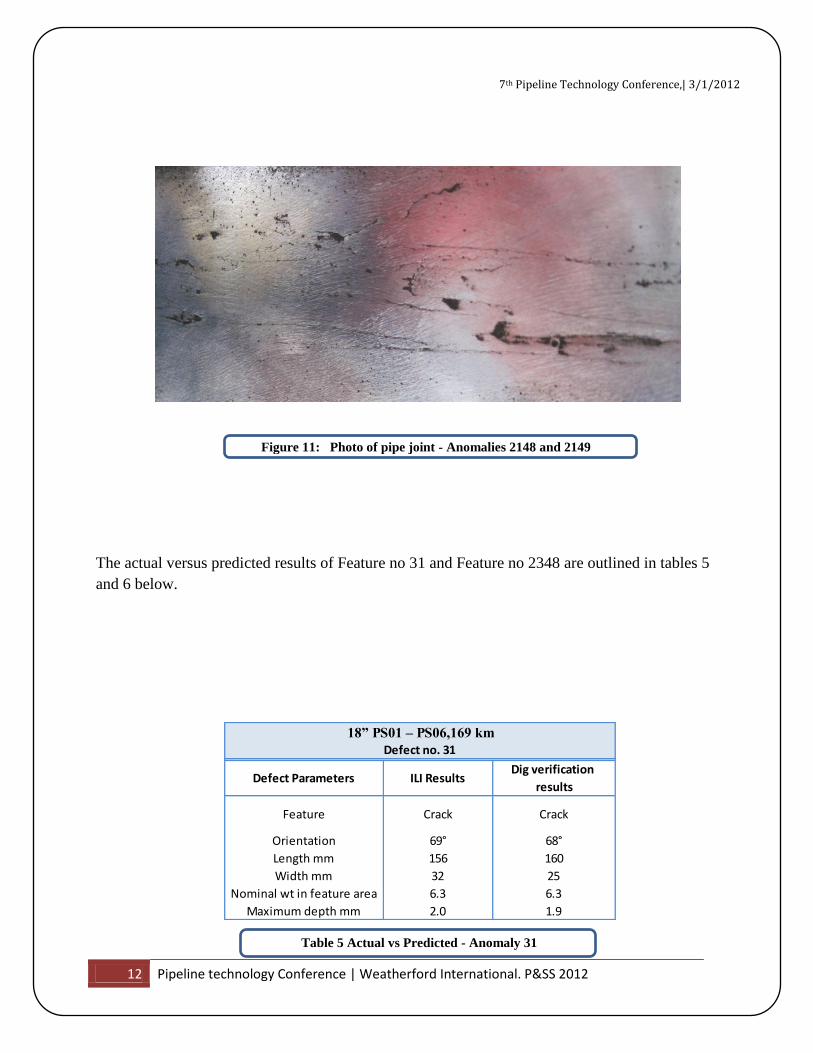
Figure 11: Photo of pipe joint - Anomalies 2148 and 2149

7th Pipeline Technology Conference,| 3/1/2012
13 Pipeline technology Conference | Weatherford International. P&SS 2012
Crack Assessment
To assess the cracks calculations were performed in accordance with API 5796
methodology
(LEVEL 2). Below is an example of a Failure Assessment Diagram (FAD) highlighting defects
in red that fall outside the acceptable size for the pipeline section. The defects in red represent
defect that are > 1 for the defect acceptability factor (DAF) described in API 579
18” PS09 – US02, 123 km 18” PS01 – PS06,169 km
Defect no. 2348 Defect no. 31
Defect Parameters ILI ResultsDig verification
results
FeaturePossible long weld
anomalylinear slag edges
Orientation 23° 26°
Length mm 275 330
Width mm 64 -
Nominal wt in feature area 6.3 6.4
Maximum depth mm 2.0 1.6
Table 6 Actual vs Predicted - Anomaly 2348

7th Pipeline Technology Conference,| 3/1/2012
14 Pipeline technology Conference | Weatherford International. P&SS 2012
Conclusion
The project preparation and planning, tool technology, and positive client-vendor collaboration
contributed to a successful project. In accordance with the vendor’s internal project management
performance indicators, the scope was delivered on time, within budget forecast and to the
client’s satisfaction. Also, from the vendor’s perspective, this was a very successful and
important project, successfully introducing the newest generation UT-CD tool to the European
market.
References
1. Weatherford of Mexico SA de CV; ILI inspections run between January and April 2009
2. IPC2010‑31140, Assessment and Management of SCC in a Liquid Pipeline — Case Study; P.
Cazenave, S. Tandon, R. Krishnamurthy, M. Gao, Blade Energy Partners; R. Peverelli, PIMS of
London; C. Moreno Ochoa, E. Diaz Solis, Pemex Refinacion
3. Pipeline Operators Forum- Specifications and Requirements for Intelligent Pig Inspection of
Pipelines, Version 2009
4. American Peroleum Institute; API Standard 1163, In-Line Inspection Systems Qualification
Standard. August 2005.
5. Weatherford New Generation ILI Tools; S. Panteleymonov, PhD, A. Smirnov, Weatherford
P&SS, Lukhovitsy, Russia.
6. American Petroleum Institute, API RP, 579 Second Addition.
Figure 12 Example of FAD diagram, API 579 Level 2


![AWP [UandiStar.org]](https://img.pdfslide.us/doc/110x75/563dbaa4550346aa9aa72043/awp-uandistarorg.jpg)