Embed Size (px)
Citation preview

A Photometric Sampling Strategyfor Reflectance Characterization and Transference
Mario Castelan, Elier Cruz-Perez, Luz Abril Torres-Mendez
Centro de Investigacion y Estudios Avanzados del Instituto Politecnico Nacional,Grupo de Robotica y Manufactura Avanzada, Ramos Arizpe, Coah.,
Mexico
Abstract. Rendering 3D models with real world re-flectance properties is an open research problem withsignificant applications in the field of computer graphicsand image understanding. In this paper, our interest isin the characterization and transference of appearancefrom a source object onto a target 3D shape. To thisend, a three-step strategy is proposed. In the first step,reflectance is sampled by rotating a light source in con-centric circles around the source object. Singular valuedecomposition is then used for describing, in a pixel-wisemanner, appearance features such as color, texture, andspecular regions. The second step introduces a Markovrandom field transference method based on surface nor-mal correspondence between the source object and asynthetic sphere. The aim of this step is to generate asphere whose appearance emulates that of the sourcematerial. In the third step, final transference of propertiesis performed from the surface normals of the generatedsphere to the surface normals of the target 3D model.Experimental evaluation validates the suitability of theproposed strategy for transferring appearance from avariety of materials between diverse shapes.
Keywords. Reflectance transference, singular valuedecomposition, random Markov fields.
1 Introduction
The interaction of surface with light is an activetopic of interest in the fields of computer visionand computer graphics, since recovering shapeand appearance is possible through the compre-hension of such interaction. In this sense, un-derstanding the reflecting behavior of real worldmaterials represents a challenge as they exhibitdifferent properties such as specularity, diffuse-ness, anisotropy, and retro-reflection. Appearance
models are helpful in areas such as image interpre-tation, 3D reconstruction from images, perception,lighting interpolation, and image synthesis. Partic-ularly, the photo-realistic rendering of 3D modelshas been the subject of study for many years, and itremains an open research topic. The patterns andcharacteristics to be recognized are focused onthe appearance properties in terms of illuminationchanges together with camera motion. Generally,these problems can be solved by considering threeelements: (1) a model of the properties to be deter-mined, (2) the characteristics taken from the scene,and (3) an algorithm to find the parameters of themodel that better adjust to these characteristics.
Among the variety of methods for characteriz-ing appearance from imagery, some use math-ematical models aimed at accurately describingthe reflectance phenomenon [20, 4, 12], i.e., aparametric equation that helps rendering the ap-pearance of 3D models in accordance with theexpected reflectance. Unfortunately, these ap-proaches depend on the choice of a specific para-metric family and do not deal with spatially varyingreflectance. Other strategies use special samplingdevices which require spherical or planar samplesof the material to be analyzed [16, 7, 17, 11], con-straining the characterization of reflectance to theexistence of the physical specimen. In general, at-tention has been paid to characterizing reflectanceby acquiring a considerable amount of imagesthrough special devices which consider calibrationof light sources, introducing additional issues suchas computational storage and errors in calibration.
Alternatively, in this work we focus on thestatistical analysis of the appearance of a pixel
Computación y Sistemas, Vol. 19, No. 2, 2015, pp. 255–272ISSN 1405-5546
doi: 10.13053/CyS-19-2-1944

which, in the form of a compact matrix, containsthe behavior of a surface patch with a moving lightsource. Our main goal is to automatically estimate,from a source object, appearance models suitablefor transferring properties to target objects withknown 3D geometry. The appearance behavior isrelated to the optical properties of a material aswell as properties of the illumination source whichis incident on the material; these properties beingrecorded by a camera are considered in this paperas the appearance information of the scene.
The contributions of this article are as follows.First, a novel representation based on the statis-tical decomposition of luminance matrices is pro-posed for the purposes of reflectance characteri-zation. Such representation can be convenientlycoupled with a Markov Random Field strategy thatsolves for correspondence between the surfacenormals of the source object and those of a syn-thetic sphere, which is used as an intermediatereflectance object in order to diminish transferenceerrors.
The second contribution of this work is thereforea methodology for reflectance transference thatconsiders, after alteration of their singular values,a weighted reconstruction of luminance matricesthat reflects the correspondence error betweensurfaces normals. Fig. 1 illustrates the result ofusing our method for transferring the reflectanceof styrofoam mannequins covered with differentmaterials onto the surface normals of Stanford’sBuddah, dragon, and rabbit.
1.1 Related Work
The idea of reflectance was mathematically intro-duced by the BRDF [10] (Bidirectional ReflectanceDistribution Function), a function that relates in-coming energy over a surface patch (radiance) withthe outcoming energy (irradiance) captured by thecamera. The aim of BRDFs is to analytically repre-sent the physical reflectance of real world materialsas a mathematical function that considers localshape and illumination parameters.
Reflectance may also be understood as the frac-tion of luminous flow striking a surface which isreflected of it. The basic form of the BRDF can
Fig. 1. Reflectance transference. A source object isilluminated in concentric paths in order to sample andtransfer its reflectance onto the surface normals of atarget object. The figure illustrates the result of using ourmethod for transferring the reflectance of styrofoam man-nequins covered with different materials onto the surfacenormals of different objects of the Stanford database.
be found in the Lambertian model, which can beexpressed by the following equation for each pixelat a position (u, v):
I(u, v) = ρ(u, v)λln(u, v), (1)
where I is the image irradiance, ρ is the albedo (ascaling factor indicating the amount of light to be re-flected), λ is the light source intensity, l = (lx, ly, lz)is the illuminant vector, and n = (nx,ny,nz) isthe surface normal vector. Eq. 1 is a commonreference for many BRDFs which consider morecomplex reflectance such as specular regions andspatially varying albedo [20, 4, 12].
Computación y Sistemas, Vol. 19, No. 2, 2015, pp. 255–272ISSN 1405-5546doi: 10.13053/CyS-19-2-1944
Mario Castelán, Elier Cruz-Pérez, Luz Abril Torres-Méndez256

Traditionally, the BRDF of a sample material ismeasured using gonioreflectometers, special de-vices that position a light source and a detec-tor (photometer) in several directions over a pla-nar sample material. Unfortunately, these devicesmeasure one reflectance value at a time, makingthe gathering process slow. In the last decade,however, digital cameras have been used to assistthe sampling process, as in the work of Ward [25],where a hemispherical mirror was used with a fish-eye camera and a moving light source in order tomeasure reflectance in all incident angles and forBRDF modeling.
In [8], Dana et al. developed a device to measurespatially varying BRDFs. To this end, a digitalcamera, a robotic arm, and a light source wereused in order to measure reflectance on planarsurface sample materials. In their work, sampleswere taken from varying angles of the light sourceand camera poses, from which a database of 60types of materials can be found in [6]. Later, Danaet al. [7] made their previous device more efficientusing a parabolic mirror. Similarly, Ghosh et al.[11] proposed using illumination basis functions forspeeding up the measuring process. Additionally,in the works of [16] and [17], sampling is performedusing superficial curves in order to recover BRDFsand reduce the number of images to be sampledalong the hemisphere. In these methods, sphericalsamples of the material to be characterized arerequired. The above approaches share some com-mon features: (1) reflectance is measured fromimages in accordance with changes in both illumi-nation direction and camera pose, (2) the surfacenormals of the samples are known for each surfacepatch of the sample, 3) irradiance is determined af-ter performing a radiometric calibration process onthe light sources, which may imply using additionaloptical devices and samples of a highly diffusematerial like spectralon, and (4) they consider theexistence of either planar or spherical samples ofthe analyzed material.
Alternatively, Mertens et al. [18] proposed atexture transference method from a known 3D ge-ometry object with known texture onto a target 3Dmodel. Their work is based on the correlationbetween local shape and texture of the sourceobject. In this sense, this approach focuses on both
geometric and texture information for transference,while ignoring the effect of changes in illuminationwhich avoids BRDF modeling. Although the re-ported results keep an accurate level of photoreal-ism, no reflectance information is characterized inthe generated rendered view which only considersthe light source direction of the source object.
In this paper, we introduce a novel solutionto the above problems with a method that onlyrequires features (1) and (2), i.e. no calibration ofthe light source is needed nor planar or sphericalsample materials are assumed available. Instead,our approach is based on a recent work developedby [13] that considers the statistical analysis ofa pixel’s reflectance along concentric circles ofa light source. While this analysis is useful forthe purposes of reflectance characterization, thetransference method solves for surface normalcorrespondence via Markov Random Fields.
The rest of the paper is organized as follows: inSection 2, the reflectance characterization devel-oped for a pixel-wise decomposition is described;later, in Section 3, a Markov Random Field modelfor surface normal correspondence is depictedin order to establish a reflectance transferencemethod between a source object and a targetgeometry; Section 4 presents experimental eval-uation for characterizing and transferring the re-flectance of objects with varying textures; finally,Section 5 provides conclusive remarks and futureextensions of this work.
2 Reflectance Characterization
Photometric sampling can be defined as a processwhere the surface normals of an object are esti-mated through the excitation of the object’s surfacewhile a light source rotates around it. The methodcan be regarded as a special case of photomet-ric stereo where extensive sampling is performedusing a moving light source. Traditional photo-metric sampling approaches [22, 15] consider onlyvariations around the azimuth angle of the movinglight source, i.e., a single circle is used to samplereflectance. Recently, an extended photometricsampling methodology was introduced in [13] forthe purposes of correcting photometric databases.
Computación y Sistemas, Vol. 19, No. 2, 2015, pp. 255–272ISSN 1405-5546
doi: 10.13053/CyS-19-2-1944
A Photometric Sampling Strategy for Reflectance Characterization and Transference 257
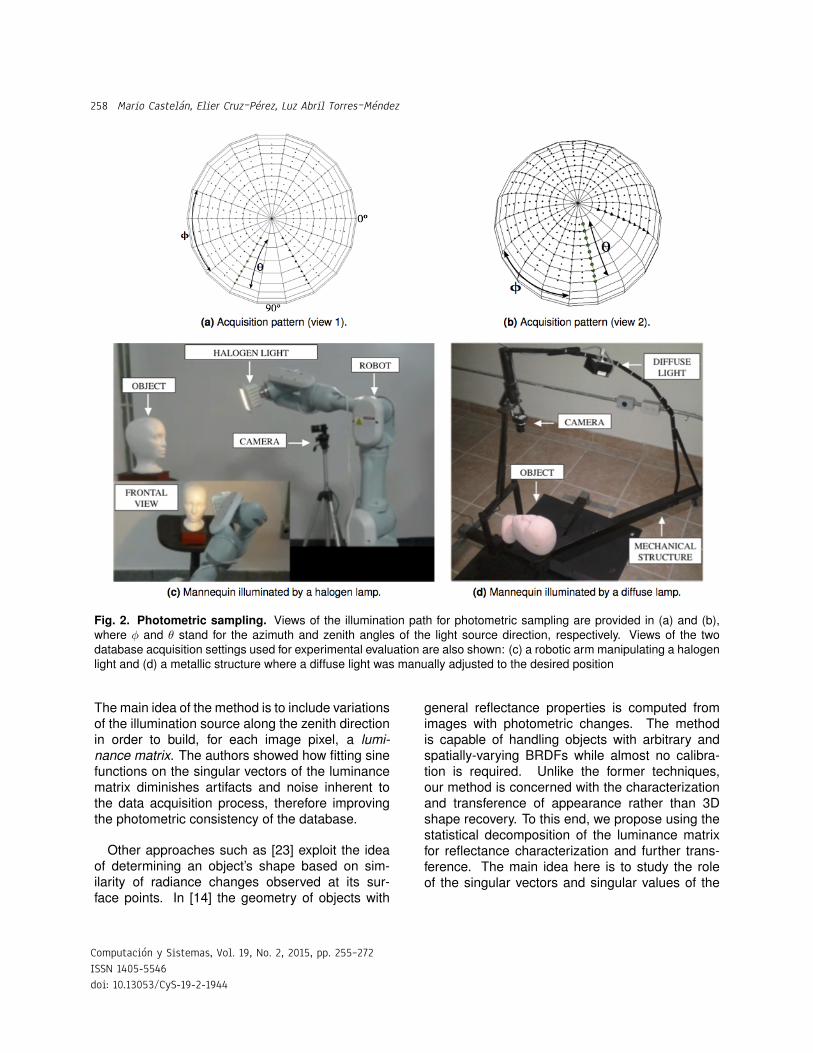
Fig. 2. Photometric sampling. Views of the illumination path for photometric sampling are provided in (a) and (b),where φ and θ stand for the azimuth and zenith angles of the light source direction, respectively. Views of the twodatabase acquisition settings used for experimental evaluation are also shown: (c) a robotic arm manipulating a halogenlight and (d) a metallic structure where a diffuse light was manually adjusted to the desired position
The main idea of the method is to include variationsof the illumination source along the zenith directionin order to build, for each image pixel, a lumi-nance matrix. The authors showed how fitting sinefunctions on the singular vectors of the luminancematrix diminishes artifacts and noise inherent tothe data acquisition process, therefore improvingthe photometric consistency of the database.
Other approaches such as [23] exploit the ideaof determining an object’s shape based on sim-ilarity of radiance changes observed at its sur-face points. In [14] the geometry of objects with
general reflectance properties is computed fromimages with photometric changes. The methodis capable of handling objects with arbitrary andspatially-varying BRDFs while almost no calibra-tion is required. Unlike the former techniques,our method is concerned with the characterizationand transference of appearance rather than 3Dshape recovery. To this end, we propose using thestatistical decomposition of the luminance matrixfor reflectance characterization and further trans-ference. The main idea here is to study the roleof the singular vectors and singular values of the
Computación y Sistemas, Vol. 19, No. 2, 2015, pp. 255–272ISSN 1405-5546doi: 10.13053/CyS-19-2-1944
Mario Castelán, Elier Cruz-Pérez, Luz Abril Torres-Méndez258

luminance matrix in the generation of reflectancefeatures of the object such as color, texture, andshininess, as well as the illumination properties ofthe light source.
2.1 The Luminance Matrix
A luminance matrix may be thought of as a col-lection of pixel intensity measurements whosecolumns and rows respectively span variationsalong the azimuth and zenith angles of the lightsource. In this sense, a luminance matrix repre-sents the energy captured in each pixel for the setof all the illuminations used during the photometricsampling process. In order to illustrate how thesampling is performed, Fig. 2 presents views ofthe concentric pattern used to illuminate the object.The variations in azimuth and zenith angles of thelight source are represented by φ (from 0o to 360o)and θ (from 0o to 90o), respectively. The acquisi-tion settings used for our experimental evaluationare also shown in the figure. The first setting isdepicted in (c), where a robotic arm surrounds theobject of interest, sampling the reflected luminancefrom a halogen light source attached to the endeffector of the robot. The second setting is shownin (d), where a metallic structure is used to imposevariations in azimuth and zenith angles of a diffuselight source.
Let us turn our attention to the core equationof the extended photometric sampling: for eachimage pixel of the source object, the singular valuedecomposition of the luminance matrix M can bedefined as
Ma×z = Ua×rΣr×rVTr×z, (2)
where U and V are the matrices whose columnscontain the left and right singular vectors of therank-r matrix M, and Σ is the diagonal matrix ofthe singular values of M, namely [σ1,σ2, · · ·σr].The numbers of lighting variations are representedby a and z respectively for the azimuth and zenithangles of the light source. An example of the lumi-nance matrix for an image pixel of a mannequinis provided at the top panel of Fig. 3 (a). Thehighlighted pixel appears below the right eye of themannequin. In the exampled pixel, the luminancematrix presents variations for ten zenith angles of
the light source, i.e., ten concentric circles wereperformed during the photometric sampling pro-cess. Note how the measured intensities alongthe columns of the luminance matrix resemble sinefunctions, where departures from sine mean de-partures from Lambertian reflectance.
The main idea of the extended photometric sam-pling of [13] is to fit sine functions onto the singularvectors of the luminance matrix of all of the pixelsso as to impose Lambertian-like reflectance. Asa consequence, numerical artifacts that may affectthe photometric consistency of the database arediminished. Fig. 3 (b) presents results obtainedafter applying the photometric correction on ourdatabases. The correction is performed separatelyon each color channel on the RGB space. From leftto right, four different substances covering a styro-foam mannequin are shown: matte paint, sawdust,nail varnish, and crayon. The top row of the panelpresents the original images (before correction),the middle row depicts the corrected images, andthe bottom row shows difference maps betweenthe original and corrected images. Note how, asan effect of the sine fitting, the shadowed areasin the original images appear recovered while thespecular region result lowered.
As far as the statistical decomposition of theluminance matrix is concerned, the first singularvectors for two luminance matrices are shown atthe bottom-left diagram of Fig. 3 (a), for Lam-bertian (diffuse) and specular (Phong [20]) ren-dered spheres. Let us refer to Md and Ms asthe luminance matrices for a pixel of diffuse andspecular synthetic spheres, respectively. The fig-ure presents plots of the first left singular vectorof the luminance matrices of a highlighted pixelfor both spheres. Note how the singular vectorof the specular pixel exhibits a peak revealing thenature of its specular reflectance. This suggeststhat the singular vectors contain information abouthow a surface patch of an object tends to reflectlight. According to this idea, assigning the singularvectors of a luminance matrix from a source objectonto a similar surface patch of a target object mayresult in transferring reflectance information. In thispaper, we explore the role of singular values andsingular vectors in the generation of reflectance
Computación y Sistemas, Vol. 19, No. 2, 2015, pp. 255–272ISSN 1405-5546
doi: 10.13053/CyS-19-2-1944
A Photometric Sampling Strategy for Reflectance Characterization and Transference 259

Fig. 3. Luminance matrix and reflectance correction. The figure presents in (a) an example of the luminance matrixof a pixel of a mannequin image. The first left singular vector of luminance matrices for a pixel of Lambertian andspecular synthetic spheres are also shown in (a); Md and Ms refer to the diffuse and specular luminance matrices ofthe spheres, respectively. The right diagram of the figure presents results after applying the reflectance correction of [13]on databases of four different materials: matte painting, sawdust, red nail varnish, and orange crayon. The differencebetween original and corrected images is shown at the bottom row of the panel
and how this could be further used for the purposesof reflectance transference.
2.2 Pixel-Wise Factorization
It is important to recall that there is one luminancematrix attached to each image pixel. This ma-trix spans variations of the light source along itscolumns (azimuth angles) and rows (zenith an-gles). Unlike performing SVD on the database asa whole (i.e., taking each image in the databaseas a long vector), the aim of separately performingSVD on each luminance matrix is to isolate, pixelby pixel, the lighting variations imposed by the mov-ing light source over the object’s surface normals.Such separation avoids mixing up the reflectance
contribution of all the pixels in the database, fa-cilitating the characterization of reflectance at thelocal (surface patch) level. A pixel-wise decompo-sition is also convenient for the reflectance trans-ference method proposed in this work.
In order to provide further details on the lumi-nance characterization at the local level, Fig. 4explores the appearance of the singular values andsingular vectors of the luminance matrices for thered varnish mannequin. The figure is organized intwo panels: the top panel refers to variations alongthe zenith angle of the light source while the az-imuth angle remains fixed; the opposite case (fixedzenith angle, varying azimuth angle) is depicted atthe bottom panel of the figure. In the figure, thefirst singular value, first left and first right singular
Computación y Sistemas, Vol. 19, No. 2, 2015, pp. 255–272ISSN 1405-5546doi: 10.13053/CyS-19-2-1944
Mario Castelán, Elier Cruz-Pérez, Luz Abril Torres-Méndez260

Fig. 4. Decomposing the luminance matrices of a styrofoam mannequin covered with red nail varnish. The figureillustrates the first singular values and the first singular vectors of the luminance matrices of the mannequin covered withred nail varnish. The top panel shows the results on varying the zenith angle of the light source while fixing the azimuthangle. The opposite case is shown in the bottom panel. The singular values are represented by σ1 while the left andright singular vectors are referred to as u1 and vT
1 , respectively
vectors of each image pixel are referred to as σ1,u1, and vT
1 , respectively. The first singular valueis shown in (a), for each luminance matrix as apixel map. The visual analysis of the resulting
image suggests that singular values are weightingfactors representing the color variation with whicheach surface normal reflects the light source usedin the sampling process. Particularly, the surface
Computación y Sistemas, Vol. 19, No. 2, 2015, pp. 255–272ISSN 1405-5546
doi: 10.13053/CyS-19-2-1944
A Photometric Sampling Strategy for Reflectance Characterization and Transference 261

normals with greater slant, (the ones around theboundaries of the mannequin’s face, and edges ofnose and mouth) appear in a darker tone of red, re-vealing that the lighting variation imposed over themannequin caused a greater luminance responseover those surface normals with a smaller slantangle (forehead, cheeks, and continuous areas ofthe surface).
As far as the singular vectors are concerned, theelement of the first left singular vector at 10o az-imuth angle is depicted in (b) as u1 along with theweighted image σ1u1 (the singular vector scaledby its corresponding singular value). Similarly, thepair (vT
1 , σ1vT1 ) is shown in (c), where images at
10o, 30o, and 60o zenith angles are depicted fromtop to bottom. The scaling of both left and rightsingular vectors by its corresponding singular valueis shown in (d) as u1σ1v
T1 . The visual analysis of
the pairs (u1, σ1u1) and (vT1 , σ1vT
1 ) reveals that thesingular vectors encode information about whichsurface normals are illuminated or shadowed at aparticular azimuth and zenith angles of the lightsource.
Additionally, the singular vectors appear to in-clude color information (red) around the shadowedareas of the mannequin while remaining in a ratherneutral tone (gray) around the illuminated areas.The former observation indicates that, on onehand, the singular vectors of the luminance matrixare responsible of representing intrinsic featuresof the object such as color, specularity, and localshape of the sampled material. Singular values,on the other hand, determine aspects related withthe light source and the effect it causes over theobject’s material. The color of the light source,the nature of the ambient light, the color of thesurrounding objects, and inter-reflections might bementioned amongst some of the features explainedby singular values.
Results on fixing the zenith angle of the lightsource while varying the azimuth angle are shownin the bottom panel of Fig. 4. The first singularvalue is shown as a pixel map in (e), the pair(vT
1 , σ1vT1 ) is shown in (f) for a fixed zenith angle
of 30o, the pair (u1, σ1u1) is depicted in (g) forvariable azimuth angles of 120o, 190o, and 340o.The final weighting u1σ1v
T1 is shown in (h). Similar
observations as those made above can be derived
from the visual analysis of the panel: (1) both thecolor and local shape of the object seem to becharacterized by vT
1 as the shadowed areas of themannequin intensify the redness of the nail varnishand (2) the singular values have a major influencearound the illuminated areas, providing the colorof the illuminated surface patch in accordance withthe nature of the light source.
To conclude the analysis of Fig. 4, it is worthcommenting that SVD appears to decompose aluminance matrix into orthogonal basis functions(singular vectors) spanning the reflectance prop-erties inherent to the object’s material, such ascolor, shininess, texture, and local surface orienta-tion. These orthogonal basis functions are relatedthrough weighting factors (singular values) repre-senting the characteristics inherent to the particularlighting with which the luminance matrices werecreated, such as color, intensity, and influence ofthe ambient and other lighting present at the mo-ment of sampling. In the next section, it will beshown how this luminance matrix decompositioncan be used in order to transfer reflectance be-tween surface normals of different objects.
3 Correspondence and Transference
Each surface point is related to a reflectance his-tory that can be transferred to another point withthe same or very similar surface orientation. Thus,knowing the correspondences of the surface nor-mals between the source and target objects is akey step. The correspondence process determineswhich surface normal locations are more similarbetween the source and target objects. This pro-cess can be achieved by exhaustively searchingthe normal maps of both objects. A normal mapcontains the surface orientation at each coordinateaxis.
However, this search results impractical andcomputational time consuming. We take advan-tage of the nature of Markov Random Fields (MRF)[5] and propose a method that statistically learnsthe surface normal correspondences between thesource and target objects. We explain this methodin what follows.
Computación y Sistemas, Vol. 19, No. 2, 2015, pp. 255–272ISSN 1405-5546doi: 10.13053/CyS-19-2-1944
Mario Castelán, Elier Cruz-Pérez, Luz Abril Torres-Méndez262

3.1 MRF Model for Surface NormalCorrespondence
Our MRF model determines the correspondencedistribution wt in a searching area Ap of radiusr. In this region, and by using a distance metricd(wt,ws), we select the most similar neighborhoodto ws as the correspondence neighborhood wt, i.e.,
wt = {wt ∈ Ap : d(wt,ws) = 0}; Ap ∈ NT . (3)
where ws ∈ NS and wt ∈ NT are square windowscentered in ns and nt, respectively. Subindexes sand t are used to refer to the source and targetobjects. Matrices N represent the whole set ofsurface normals for each object, while n are usedto depict a single surface normal vector.
In an MRF model, the probability distribution ofeach normal n, given the normals of its neighbors,is considered independent of the rest of locationsin the normal map. The correspondence based onsearch regions requires a priori knowledge of somegeometric relation between the source and targetobjects. The reason for this is that the initial normalnt must be located in a geometrically similar regionto the source object where ns is located. This cor-respondence works well for objects that are similarin geometry, such as spherical objects.
However, as we want to be able to transfer thereflectance properties to objects with different ge-ometry, we propose to group together the normalsaccording to their surface orientation. Each nor-mal has three components that correspond to itsorientation at each axis coordinates. The normalorientations in the x and y axis contain values inthe open interval (−1 , 1) and the orientation in thez axis is delimited by the interval (0 , 1). The group-ing of normals allows to divide the normal maps Ns
and Nt into eight sectors S and eight sectors T ,respectively, according to the magnitude and signof its components. For each neighborhood ws ina given sector Si, the corresponding neighborhoodin Ti is determined by using a similarity distancebetween ws with each neighborhood wt in sectorTi (see the right image in Fig. 5). A weightedEuclidean distance metric between each pair ofneighborhood is used to evaluate ws with eachneighborhood wt.
Fig. 5. Surface normal correspondence. A window ofcorrespondence wt is searched in the map of normalsNT of the transfer object for each window ws of thesource object (face images). The region of search Ap
is depicted by the circle (middle image) and is used tocompute the probability distribution of the most probablewindow wt that is similar to ws. This type of correspon-dence works well for source and target objects that aregeometrically similar. The squares at the right show thedistribution of correspondence of normals based on itsgrouping. For each distribution ws of sector Si, the distri-bution of correspondence wt is determined through theevaluation of a weighted distance d2 of each distributionin Ti with ws
This distance is described as follows: given ws ∈Si and some neighborhood wt ∈ Ti, which containthree layers of components corresponding to theorientation in axis x, y, and z, matrices Ws andWt are build such that each row is formed by twovalues of each layer, respectively. The dimensionof each row vector is k = kmkn, where km and knrepresent the number of rows and columns of eachneighborhood. The construction of matrices Wallows us to estimate a distance metric between ws
and wt through the sum of the Euclidean distancesbetween the row vectors of Ws and Wt.
Given that each surface point in each neighbor-hood is mutually related to its neighboring surfacepoints, the local surface structure of the surface
Computación y Sistemas, Vol. 19, No. 2, 2015, pp. 255–272ISSN 1405-5546
doi: 10.13053/CyS-19-2-1944
A Photometric Sampling Strategy for Reflectance Characterization and Transference 263

must be kept. This is achieved by assigning moreweight to the normals that are close to ns and nt,and less weight to those that are far. However, theEuclidean distance does not maintain the surfacelocality as the values of each normal are consid-ered independent. Furthermore, it is prone to vari-ations due to surface scale. To preserve locality, aGaussian kernel G(σ) is taken into account, whichis contained in a vector g of same dimension of rowvector of matrices W and weights the Euclideandistance, i.e.,
d2(ws,wt) =
3∑i=1
g1(Ws(i,1) −Wt(i,1))2+
g2(Ws(i,2) −Wt(i,2))2+
· · ·+ gk(Ws(i,k)−Wt(i,k)
)2
12
(4)Equation 4 allows the evaluation of distance at
each distribution ws ∈ Si with all distributions wt
of the corresponding sector Ti. Each evaluation isthen registered to a vector d, such that the windowof correspondence wt is the window related to theminimum value of vector d, i.e.,
d = d2(wt,ws); ∀wt ∈ Ti, (5)wt = {wt ∈ Ti : d2(wt,ws) = min(d)}. (6)
The normals of correspondence ns and nt willsimply be the central elements of the neighbor-hoods of correspondence ws and wt, which areobtained from Equation 6. This process of cor-respondence is repeated for all the normals con-tained in sectors S of the map of normals of thesource object Ns. This way, the correspondence ofnormals between the source and transfer object isobtained.
3.2 Reflectance Transference
In order to calculate the new luminance matricesto be transferred onto the pixels of the target ob-ject, the original matrix M is altered in accordancewith the surface normal difference between ns andnt, where subindexes s and t respectively standfor source and target objects. As an exampleof the error calculation, the first singular value ofM is weighted by the absolute difference of the
z-component between source and target surfacenormals as
σ′1 = σ1
(1 + w (|nsz| − |ntz|)2
);
where w =
{1; |nsz| < |ntz|−1; |nsz| > |ntz|
(7)
where nsz and ntz are respectively the z-component of the source and target surface nor-mals, σ1 is the first singular value of the luminancematrix, and σ′1 is the first singular value of the newluminance matrix. The new second singular value,σ′2, is modified in accordance with the differencebetween the x-components of the surface normals,(|nsx|−|ntx|)2. This similarly holds for the modifiedthird singular value, σ′3, which is weighted using they-component difference (|nsy| − |nty|)2. The newluminance matrices to be assigned to the pixels ofthe target object have now the form
M′ = UΣ′VT ;
with Σ′ =
σ′1 0 0 · · · 00 σ′2 0 · · · 00 0 σ′3 · · · 0...
......
. . ....
0 0 0 · · · 0
r×r
(8)
where the main diagonal of Σ′ starts with the threemodified singular values calculated using Eq. 7,containing zeros in the rest of the diagonal.
The fact that the first three singular values ofthe luminance matrices are individually modifiedusing the z, x, and y components of the surfacenormals relies on two considerations. The firstof these is concerned with the variability of theluminance matrix mostly retained by only a fewbasis vectors. The characterization of reflectancethrough low dimensional spaces has been widelystudied [1, 9, 3], leading to the conclusion thatreflectance of convex objects can be linearly ap-proximated by a small number of principal com-ponents, in particular, the three first componentssuffice to characterize at least 90% of the appear-ance of the object under the imposed illuminationchanges. The second consideration is related with
Computación y Sistemas, Vol. 19, No. 2, 2015, pp. 255–272ISSN 1405-5546doi: 10.13053/CyS-19-2-1944
Mario Castelán, Elier Cruz-Pérez, Luz Abril Torres-Méndez264

(a) Lambertian. (b) Noise added. (c) Transfered. (d) Noise added. (e) Transfered.
Fig. 6. Altering singular values of the luminance matrix. The figure illustrates the effect of transferring an alteredluminance matrix in accordance with Eq. 8. In (a) a Lambertian sphere used as a source object is shown. The normalsof the sphere are randomly rotated within ±20o in (b), i.e., becoming the target surface. Reflectance transferenceconsidering the difference error between surface normals is shown in (c). A further level of noise added (±45o) isdepicted in (d) and its corresponding transference in (e). Note how not considering the surface normal error would haveresulted not only in reflectance, but in shape transference as well
Fig. 7. Transferring reflectance onto synthetic spheres. Styrofoam mannequins covered with different substancessuch as a matte paint, sawdust, red nail varnish, and orange crayon are shown row-wise. Rendered views of a syntheticsphere after reflectance transference appear next to each mannequin image for illuminations with diffuse (left panel)and halogen (right panel) light sources. Note how appearance changes considerably when different light sources areapplied on the same objects
the influence of the lighting variability on the builtbasis functions [21], i.e., the singular vectors ofa database considering photometric changes willtend to characterize the three main variabilities asorthogonal basis functions along the z, x, and ydirections.
The effect of using Eq. 7 is explored in Fig. 6.Here, the surface normals of a Lambertian sphereare used as those of the source object. A rendered
view of the Lambertian sphere is shown in (a). Inorder to create the target surface normal field, eachsource surface normal is randomly rotated within a±20o interval, as shown in (b).
Let us assume the pixel position (x, y) in theLambertian sphere corresponds to the pixel posi-tion (x, y) in the disturbed sphere. If the corre-spondence error were not considered for alteringthe singular values of the luminance matrix of the
Computación y Sistemas, Vol. 19, No. 2, 2015, pp. 255–272ISSN 1405-5546
doi: 10.13053/CyS-19-2-1944
A Photometric Sampling Strategy for Reflectance Characterization and Transference 265

Fig. 8. The sphere as an intermediate reflectance object. Results of transferring reflectance from different materialsonto the surface normals of a face from the Max Planck database are shown along the columns of the figure for twocases: (a) direct reflectance transference, (b) indirect reflectance transference using an intermediate sphere
source object, not only the reflectance but alsothe shape would be transferred, i.e., the renderedviews of the target object would be exactly thesame rendered views of the source object. Theresult of modifying the luminance matrix is shownin (d), where it is clear the transference processtakes into account the shape of the target object.A further level of added disturbance (±45o) is de-picted in (d) and its corresponding transference in(e). Note how the quadratic term of Eq. 7 tendsto punish greater correspondence errors betweensurface normals. This supports the idea of usingSVD for luminance matrix decomposition as op-posed to using the original values of the luminancematrix directly, since altering reflectance at thepixel level would be difficult otherwise.
3.3 A Sphere as a Transference Object
Fig. 7 presents results for transferring reflectanceof different materials onto the surface normals of asynthetic sphere. The figure contains two panels.The left panel shows results for the objects illumi-nated by a diffuse light while the right panel showsresults for illumination with a halogen light. Notehow each light is differently reflected by the sameobject, i.e., the color of the mannequin changeswhen using different light sources. This makes,for example, the matte painting look ochre underdiffuse lighting and reflect an orange tonality un-der halogen lighting. As previously discussed in
Section 2, it was observed that reflectance fea-tures caused by the nature of the light source aretransferred onto the surface normals of the spheresthrough the singular values of its luminance ma-trices. The weighting process carried out in Eq.7 assigns a transference confidence dependingon the discrepancy between corresponded surfacenormals. It is also noticeable how the specularbehavior mainly exposed by the crayon and var-nish materials is conserved after luminance matrixtransference. Similar observations hold for thediffuse reflectance of the matte paint and the scat-tered texture of the sawdust.
The importance of using a sphere as an inter-mediate reflectance object is illustrated in Fig. 8,where transference results on a face of the MaxPlank database [2] are shown. The top row of thecolumn presents rendered views of the face afterdirect transference, i.e., performing surface normalcorrespondence directly between the surface nor-mals of the different mannequins and the surfacenormals of the face model. The bottom row ofthe figure depicts results after using a sphere asan intermediate reflectance object, i.e., luminancematrices are first transferred from the mannequinmodels to a synthetic sphere (as in Fig. 7), thena new transference process is performed using thesphere as the source object. The visual compari-son of the rows of the figure demonstrates a benefitwhen the sphere is used to transfer reflectance
Computación y Sistemas, Vol. 19, No. 2, 2015, pp. 255–272ISSN 1405-5546doi: 10.13053/CyS-19-2-1944
Mario Castelán, Elier Cruz-Pérez, Luz Abril Torres-Méndez266

between the two gradient fields. Specifically, re-gions where the surface normals are subject tochange in direction, such as edges around theface, appear more defined in the results shownin the bottom row, diminishing abrupt transitionsbetween neighboring pixels. Interestingly, the maindifferences between the images corresponding tothe crayon material are located around the eyes,eyebrows, and mouth areas, where the crayonmannequin was painted on purpose with a blackcrayon. For direct transference, it is evident that thelocal correspondence between the facial areas ofthe mannequin and the face model are responsiblefor the black crayon being assigned onto the pixelsof the target object. This effect is nonetheless sup-pressed after using a sphere as an intermediatesource object.
4 Experimental Results
This section presents experimental results for theproposed reflectance transference methodology. Asphere sized 150 × 150 pixels was applied in allthe experiments as an intermediate reflectance ob-ject. Also, for all experiments, three target objectswere used from the Stanford database [24]: rabbit(150 × 150 pixels), dragon (150 × 200 pixels), andBuddah (200×80 pixels). The results are organizedin panels, each of them presenting in its first rowthe source object (mannequin) as illuminated bydifferent light source directions. The remainingrows present reflectance transference for the tar-get objects. Both scenarios using the diffuse andhalogen lighting are depicted in the figures.
Transference results for the matte paint and thesawdust mannequins are illustrated in Fig. 9. Thefirst feature to note from the figure is that the re-flected color seems to be accurately transferredonto the Stanford surfaces. The subtle differ-ence in the orange tone provoked by the halogenlight between the matte paint and the sawdustmannequins is also noticeable along the renderedviews of the target objects. In a similar way, thisphenomenon is observable for the diffuse lightingcase, where the difference between the ochre andthe golden tones for the matte paint and the saw-dust is also present after reflectance transference.
Another feature to note from the figure is the scat-tered texture of the sawdust, which is passed ontothe surface of the target objects.
Fig. 10 presents the specular reflectance cases,showing results for the nail varnish and crayonmannequins. Again, the tones of orange and redcolor are evidently transferred over the target ob-jects. The strong specularities of the nail varnishappear as well strengthened along the novel ren-dered views, particularly for the halogen lighting.Also, the wax-like consistency of the crayon is no-ticeable, especially for the diffuse light renderings.
It is worth commenting on the presence of am-bient light in the source database. For the dif-fuse lamp, the data acquisition was performed ina closed dark room, therefore, the only illuminationaffecting the mannequins was the diffuse light itselfand, as a consequence, pronounced shadowedregions appear over the surface of the illuminatedmannequins.
On the contrary, the halogen lamp was subjectto the influence of ambient light, as experimentswere performed in our lab, where artificial and nat-ural light coming from open windows intervened inthe sampling process. In this case, transferenceresults obtained using the halogen lamp revealmore illuminated regions around the boundariesof the mannequins, as opposed to the shadowedregions exhibited by the examples correspondingto the diffuse lamp setting. This observation iscorroborated in the transferred reflectance of theStanford objects, i.e., the ears of the bunny appearshadowed for the diffuse lighting, while this effectis lessened for the halogen lighting.
Figures 9 and 10 present individual images fromboth the source and transferred databases, allow-ing a qualitative examination of the transferenceresults obtained from the method proposed in thispaper. Results at the global level, nonetheless, arenecessary to assess similarity between databasesin a numerical way.
To this end, we chose a methodology similar tothe parametric eigenspace of [19], where each im-age is projected onto a considerably lower dimen-sional space in order to analyze the behavior ofthe image ensemble in the feature space spannedby the database. The experiment is described asfollows: for each image, a long column vector was
Computación y Sistemas, Vol. 19, No. 2, 2015, pp. 255–272ISSN 1405-5546
doi: 10.13053/CyS-19-2-1944
A Photometric Sampling Strategy for Reflectance Characterization and Transference 267

Fig. 9. Reflectance transference for matte and scattered surfaces. The figure illustrates how the reflectanceof a styrofoam mannequin is transferred onto the 3D shape of the Stanford database rabbit, dragon, and Buddah.The mannequin was illuminated using a diffuse and a halogen light. Corresponding rendered views after reflectancetransference are shown in (a) and (b) for the matte paint, while the results for transferring sawdust reflectance are shownin (c) and (d)
created by stacking the image columns in orderto create a big matrix A, whose SVD was laterapplied for calculating singular values and singular
vectors as
Ap×n = Up×3Σ3×3VT3×n. (9)
Computación y Sistemas, Vol. 19, No. 2, 2015, pp. 255–272ISSN 1405-5546doi: 10.13053/CyS-19-2-1944
Mario Castelán, Elier Cruz-Pérez, Luz Abril Torres-Méndez268

Fig. 10. Reflectance transference for specular surfaces. The figure illustrates how the reflectance of a styrofoammannequin is transferred to the 3D shape of the Stanford database rabbit, dragon, and Buddah. The mannequin wasilluminated using a diffuse and a halogen light. The corresponding rendered views after reflectance transference areshown in (a) and (b) for red nail varnish, while the results for transferring orange crayon are shown in (c) and (d)
where p is the number of image pixels and n is thenumber of images in the database. The columnsof VT contain the projection of the n databaseimages in R3. Each database was decomposed
separately for the R, G, and B channels, and re-sults of this decomposition are shown in Fig. 11.The retained variability for the databases is shownin (a), where four diagrams depict the cumulative
Computación y Sistemas, Vol. 19, No. 2, 2015, pp. 255–272ISSN 1405-5546
doi: 10.13053/CyS-19-2-1944
A Photometric Sampling Strategy for Reflectance Characterization and Transference 269

Fig. 11. Reflectance analysis in the parametric eigenspace. In (a) the retained variability of the original mannequinsdatabases and synthetically generated databases is shown for the halogen (blue) and diffuse (red) lines. The purposeof these diagrams is to show how the databases cluster depending on the light source used in the original experiment,indicating that this information has been passed onto the target objects after transference. The results of projectingeach image of the database onto the parametric eigenspace are depicted in (b) for the red varnish and matte mannequindatabases (natural reflectance) and (c) for the reflectance transferred bunny databases. Each image is shown in coloreddots, where the color refers to database decomposition for the red, green, and blue color channels
singular values for the different sampled materials:matte paint, red varnish, orange crayon, and saw-dust. Each of the four diagrams is related to onesingle material, presenting cumulative plots for thefour objects (mannequin, bunny, Buddha, dragon),three color channels (R, G, B) and two illuminationsources (diffuse, halogen) for a total of 4×3×2 = 24line plots for each material. The singular valuesof the databases acquired using halogen light areshown with blue lines, while those acquired underdiffuse illumination are presented in red. The inten-tion of the plots is to show how the databases can
be clustered mainly in accordance with the type ofillumination used to create the source database,regardless of the shape of the object or whether thedatabase was generated naturally or by reflectancetransference.
The remaining rows of Fig. 11 show the spacialarrangement of the eigenvectors of the databases,i.e., each image in the database is projected ontothe three dimensional eigenspace using vT
i Σ, i ={1, 2, · · · ,n}, where the row vector vT
1×3 is a col-umn of the right singular matrix V. The resultsof this projection are depicted in (b) for the red
Computación y Sistemas, Vol. 19, No. 2, 2015, pp. 255–272ISSN 1405-5546doi: 10.13053/CyS-19-2-1944
Mario Castelán, Elier Cruz-Pérez, Luz Abril Torres-Méndez270

varnish and matte mannequin databases (naturalreflectance) and the reflectance transferred bunnydatabases appear in (c). In all the diagrams, theprojected images are shown in colored dots, wherethe color refers to database decomposition for thered, green, and blue color channels. The visualanalysis of the plots reveals a resemblance be-tween the natural and the transferred reflectancebehaviors, suggesting that both original and syn-thetically generated databases span the similar illu-mination subspaces, corroborating the success ofthe reflectance transference process.
5 Conclusions
A method for characterization and transferenceof reflectance has been proposed in this paper.Ideas borrowed by extended photometric sampling,which decomposes luminance matrices into singu-lar vectors and singular values are used to rep-resent reflectance variations of a source objectacquired by a camera and a moving light source.A method based on Markov Random Fields is alsointroduced to solve the correspondence problembetween the surface normals of a source objectand the surface normals of a sphere, which is laterused to transfer reflectance of the source objectonto a target object.
Experiments demonstrate that our method suc-cessfully transfers reflectance behavior for a va-riety of materials and under different illuminationsettings. Given that the statistical decomposi-tion of reflectance allows a further analysis, theparametrization of the luminance matrices, i.e.,through the manipulation of the singular values isconsidered as future work for generating syntheticreflectance.
References
1. Basri, R. & Jacobs, D. (2003). Lambertian re-flectance and linear subspaces. IEEE Trans. onPattern Analysis and Machine Intelligence, Vol. 25,No. 6, pp. 383–390.
2. Blanz, V. & Vetter, T. (1999). A morphable modelfor the synthesis of 3d faces. Proc. SIGGRAPH,volume 1, pp. 187–194.
3. Chen, H., Belhumeur, P., & Jacobs, D. (2000). Insearch of illumination invariants. Proc. IEEE Inter-national Conference in Computer Vision and PatternRecognition, pp. 1–8.
4. Cook, L. R. & Torrance, K. E. (1982). A reflectancemodel for computer graphics. ACM Trans. Graph.,Vol. 1, pp. 7–24.
5. Cross, G. R. & Jain, A. K. (1983). Markov randomfield texture models. Pattern Analysis and MachineIntelligence, IEEE Transactions on, Vol. 5, pp. 25–39.
6. Curet (1999). Columbia-utrech Re-flectance and Texture Database.Http://www.cs.columbia.edu/CAVE/curet/.
7. Dana, K. J. (2001). Brdf/btf measurement device.Proc. IEEE International Conference in ComputerVision, volume 2, pp. 460–466.
8. Dana, K. J., Ginneken, B. V., Nayar, S. K., &Koenderink, J. J. (1999). Reflectance and textureof real-world surfaces. ACM Trans. Graph., Vol. 18,pp. 1–34.
9. Epstein, R., Hallinan, P. W., & Yuille, A. L. (1995).5±2 eigenimages suffice: an empirical investigationof low-dimensional lighting models. Proc. Workshopon Physics-based Modelling in Computer Vision,pp. 108–116.
10. F. E. Nicodemus, I. W. G., J. C. Richmond &Limperis, T. (1977). Geometrical considerationsand nomenclature for reflectance. NBS Monograph.
11. Ghosh, A., Heidrich, W., Achutha, S., & O’Toole,M. (2010). A basis illumination approach to BRDFmeasurement. International Journal of ComputerVision, Vol. 90, pp. 183–197.
12. He, X. D., Torrance, K. E., Sillion, F. X., & Green-berg, D. P. (1991). A comprehensive physical modelfor light reflection. Proc. SIGGRAPH ComputerGraphics, volume 25, pp. 175–186.
13. Hernandez-Rodrıguez, F. & Castelan, M. (2012).A method for improving consistency in photometricdatabases. Proc. British Machine Vision Confer-ence, pp. 1–10.
14. Hertzmann, A. & Seitz, S. M. (2005). Example-based photometric stereo: Shape reconstructionwith general, varying brdfs. IEEE Transactions onPattern Analysis and Machine Intelligence, Vol. 27,No. 8, pp. 1254–1264.
15. Liu, R. & Han, J. (2010). Recovering surface normalof specular object by hough transform method. IETComputer Vision, Vol. 4, No. 2, pp. 129–137.
Computación y Sistemas, Vol. 19, No. 2, 2015, pp. 255–272ISSN 1405-5546
doi: 10.13053/CyS-19-2-1944
A Photometric Sampling Strategy for Reflectance Characterization and Transference 271

16. Marschner, S. R., Westin, S. H., Lafortune, E.P. F., & Torrance, K. E. (2000). Image-based bidi-rectional reflectance distribution function measure-ment. Appl. Opt., Vol. 39, No. 16, pp. 2592–2600.
17. Matusik, W., Pfister, H., Brand, M., & McMillan,L. (2000). A data-driven reflectance model. ACMTrans. Graph., Vol. 22, No. 3, pp. 759–769.
18. Mertens, T., Kautz, J., Chen, J., Bekaert, P., &Durand, F. (2006). Texture transfer using geome-try correlation. Proc. Eurographics Symposium onRendering, pp. 273–284.
19. Murase, H. & Nayar, S. (1993). Parametriceigenspace representation for visual learning andrecognition. Proc. SPIE Geometric Methods in Com-puter Vision II, volume 2031, pp. 378–391.
20. Phong, B. T. (1975). Illumination for computer gen-erated pictures. Communications of ACM, Vol. 18,No. 6, pp. 311–317.
21. Ramamoorthi, R. (2002). Analytic pca reconstruc-tion for theoretical analysis of lighting variability inimages of a lambertian object. IEEE Trans. onPattern Analysis and Machine Intelligence, Vol. 24,No. 10, pp. 1322–1333.
22. Saito, H., Omata, K., & Ozawa, S. (2003). Re-covery of shape and surface reflectance of specularobject from relative rotation of light source. Imageand Vision Computing, Vol. 21, pp. 777–787.
23. Sato, I., Okabe, T., Yu, Q., & Sato, Y. (2007).Shape reconstruction based on similarity in radiancechanges under varying illumination. IEEE Interna-tional Conference in Computer Vision, pp. 1–8.
24. Standford Repository (2011). TheStanford 3D scanning repository.http://graphics.stanford.edu/data/3Dscanrep/.
25. Ward., G. J. (1992). Measuring and modelinganisotropic reflection. Proc. SIGGRAPH Comput.Graph., volume 24, pp. 265–272.
Mario Castelan obtained his Ph.D. in ComputerScience from the University of York, U.K., in2006. Currently, he is a full-time researcher at theRobotics and Advanced Manufacturing ResearchGroup of CINVESTAV - Saltillo. His researchinterests are focused on 3D shape analysis andstatistical learning for data analysis, computervision, and robotics applications.
Elier Cruz-Perez obtained the M.Sc. in Roboticsand Advanced Manufacturing in 2013 fromCINVESTAV, Mexico. His research interests are incomputer vision, machine learning, and advancedmanufacturing.
Luz Abril Torres-Mendez received her Ph.D. de-gree from the McGill University, Canada, in 2005.Since 2006 she has been a Full Professor at theRobotics and Advanced Manufacturing Group ofthe Research Centre and Advanced Studies (CIN-VESTAV) Campus Saltillo, Mexico. She is theFounder and Head of the Vision for Robotics Labin the same institution. Her primary research inter-ests are computer vision and mobile robotics: inparticular, 3D environment modeling, active per-ception, underwater image enhancement, super-resolution, color and surface normal synthesis onfaces; human-robot interaction, transferring cog-nitive skills to robots, sensor fusion, vision-basednavigation for wheeled and underwater robotics.
Article received on 20/02/2014; accepted on 06/05/2015.Corresponding author is Mario Castelan.
Computación y Sistemas, Vol. 19, No. 2, 2015, pp. 255–272ISSN 1405-5546doi: 10.13053/CyS-19-2-1944
Mario Castelán, Elier Cruz-Pérez, Luz Abril Torres-Méndez272