Embed Size (px)
Citation preview
arX
iv:0
812.
1386
v1 [
phys
ics.
atom
-ph]
7 D
ec 2
008
Two-color modulation transfer spectroscopy
A. Perez Galvan∗, D. Sheng, Luis A. Orozco1 and Y. Zhao2
1Joint Quantum Institute, Department of Physics,
University of Maryland and National Institute of Standards and Technology,
College Park, MD 20742-4100, USA.
2State Key Laboratory of Quantum Optics and Quantum Optics Devices,
College of Physics and Electronics Engineering,
Shanxi University, Taiyuan 030006, China∗
(Dated: May 21, 2018)
Abstract
We present two-color modulation transfer spectroscopy as a tool for precision studies of atomic
properties of excited states. The bi-colored technique addresses a narrow set of velocity groups of a
thermal atomic vapour using a two-step transition to “burn a hole” in the velocity distribution. The
resulting spectrum presents sub-Doppler linewidths, good signal to noise ratio and the trademark
sidebands that work as an in situ ruler for the energy spacing between atomic resonances. The
spectra obtained can be used for different applications such as measurements of energy splittings
or stabilization of laser frequencies to excited atomic transitions.
PACS numbers:
∗Electronic address: [email protected]
1

I. INTRODUCTION
Spectroscopic studies of hyperfine manifolds in alkalies, such as measurements of energy
separations, have benefitted by the high precision of the experimental techniques available
to interrogate atoms [1]. Their hydrogen-like structure makes interpretation of experimental
results straightforward in terms of electromagnetic fields generated by the valence electron
and nuclear moments. Precise measurements in higher excited states accessible through
two-step transitions[2, 3, 4, 5] have appeared in recent years. This has renewed interest
in improving calculations in other states where theoretical methods such as many-body
perturbation theory (MBPT) (see for example the recent book of W. R. Johnson [6] ) are
yet to be tested against experimental results .
Precise measurements in excited states, beyond the first one, have several experimental
complications. Standard spectroscopic techniques rely on the high population of atoms in
the ground state to guarantee a good signal to noise ratio of the fluorescence or absorption
of the atomic sample. In two-step transitions this is no longer the case. The amount of
population transferred to the intermediate level, for reasonable powers of the lasers, tends
to be small, and detectors at the desired frequency might no be readily available.
We present in this paper two-color modulation transfer spectroscopy as a tool for stud-
ies of atomic properties of higher excited states. The method consist of two lasers (pump
and probe) counter-propagating through a thermal vapour. Before being directed to the
interaction region, one of the lasers is modulated. The first step of the transition i.e. the
pump, connects the ground state to a resonant intermediate state while the probe scans
over the desired energy manifold. We monitor the absorption of the pump laser as a func-
tion of probe laser detuning. The non-linear interaction of the lasers “burns a hole” in the
atomic ground state population. The generated spectra presents sub-Doppler peaks (some-
times called Lamb-Bennett dips) corresponding to the atomic resonances with the trademark
sidebands at their side. This technique overcomes the two main inconveniences of direct ab-
sorption of the probing laser i.e. low signal to noise ratio and non-availability of detectors
at the desired wavelength.
We present two ladder systems in 87Rb to illustrate the main features of the technique and
two different applications of the modulation. We select the 5S1/2 → 5P1/2 → 6S1/2 and the
5S1/2 → 5P3/2 → 5D5/2 ladder transitions to illustrate their different uses. The amplitude
2

of the probe laser is modulated for the first system while the second system has its pump
frequency modulated. The frequency modulation of the pump laser and good signal to noise
ratio allows us to lock the probe laser to the 5P3/2 → 5D5/2 excited atomic resonance. In
this case the probe laser remains modulation free. This is highly desired since the electronic
modulation of the laser itself can carry unwanted effects such as sidebands at higher or lower
frequencies as well as bandwidth problems. The method we are presenting is, of course, not
limited to these two cases and can be extended to other atomic levels.
The organization of the paper is as follows: section II contains the theoretical model,
section III explains the experimental setup and results, section IV has a summary of the
precise measurements using this method, and section V presents the conclusions.
II. THEORETICAL MODEL
We start with a three level model that can show some of the qualitative features of the
experimental spectra. We use a density matrix formalism to describe a three level atom in
ladder configuration interacting with two lasers, one of which has sidebands. We model our
system as Doppler-free ignoring Zeeman sublevels to keep it tractable. The experimental
situation is more complex and for quantitative analysis it is necessary to take into account
those same effects that we are ignoring.
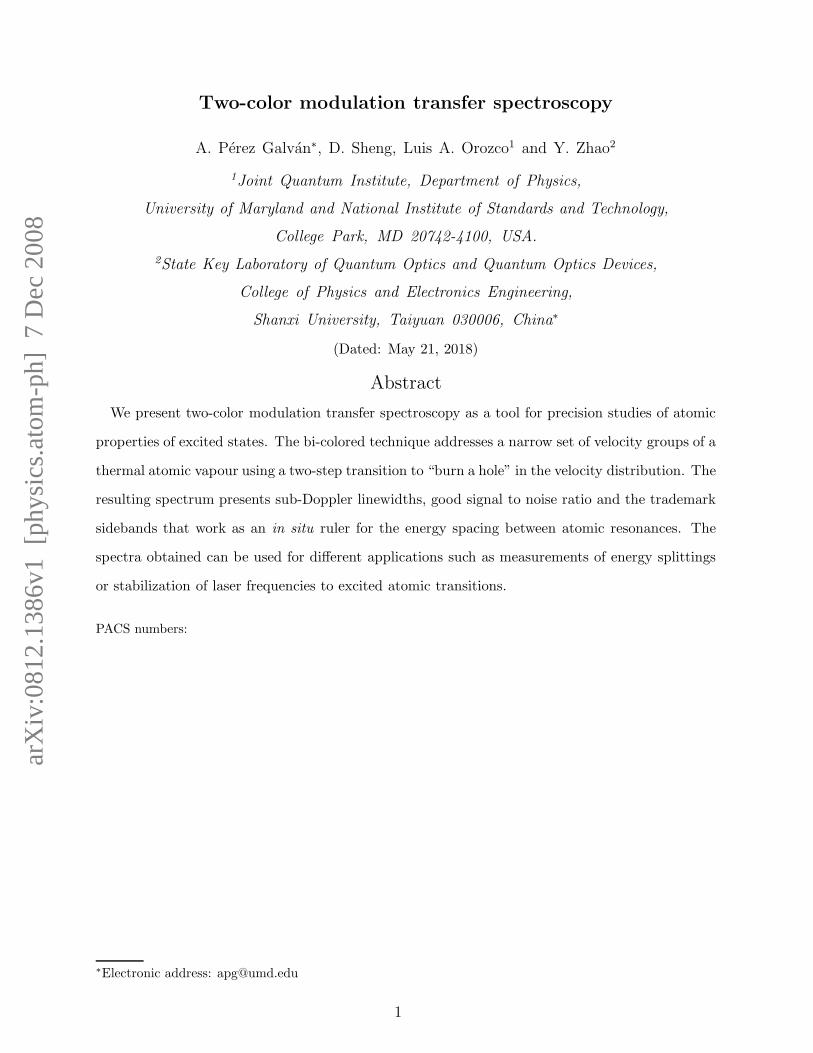
Figure 1 shows our theoretical model. We treat two cases. Fig 1 (a) is a ladder type
system with an amplitude modulated probe (AMP). Fig (b) presents the same system except
it has a frequency modulated pump (FMP).
The intermediate and last levels are coupled by a single laser with three frequencies: a
carrier and two sidebands separated form the carrier by ∆ (in MHz). We represent the
amplitude of the carrier by a Rabi frequency α32 and the sidebands by a modulation depth
β. The ground and intermediate states are coupled by α21. The detuning of the carrier
between levels |1〉 and |2〉 is zero in the model as it is for our experiment and we let the
detuning between levels |2〉 and |3〉 vary as δ23. The total population is normalized to unity.
Fig. 1 (b) follows the same nomenclature except that the sidebands arise from frequency
modulation and they appear in the pump laser α21. For the FMP systems the sidebands
have the appropriate sign difference.
We have a set of nine linear equations for the slowly varying elements of the density
3
1>
2>
3>
γ32
γ21
α32
α21
δ
23
1>
2>
3>
γ32
γ21
α32
α21
δ
23
a) b)
β
β
β
Δ
−β
Δ
FIG. 1: Theoretical model of two-step transition with (a) amplitude modulated probe and (b)
frequency modulated pump.
matrix σnm after using the rotating wave approximation with the sidebands rotating - one
clockwise, one counter clockwise - at a frequency ∆ . The equations are:
∑
k
(γknσkk − γnkσnn) +
i
2
∑
k
(αnkσkn − σnkαkn) = σnm for n = m,
[i(Ωnm − ωnm)− Γnm)]σnm +
i
2
∑
k
(αnkσkm − σnkαkm) = σnm for n 6= m,
where ωnm = (En−Em)/~ is the transition frequency, and Ωnm = −Ωmn is the laser frequency
connecting the levels. The damping rate is given by:
Γnm =1
2
∑
k
(γnk + γmk),
and α21 = α021(1+βei∆t−βe−i∆t) for the FMP system and α32 = α0
32(1+βei∆t+βe−i∆t) for
the AMP system. The time dependence of the Rabi frequency makes the standard approach
of obtaining the steady state solution of the system not feasible. Instead, we use a Floquet
basis expansion of the density matrix [7] to solve our system of equations. We replace each
of the slowly rotating elements of the density matrix by:
4
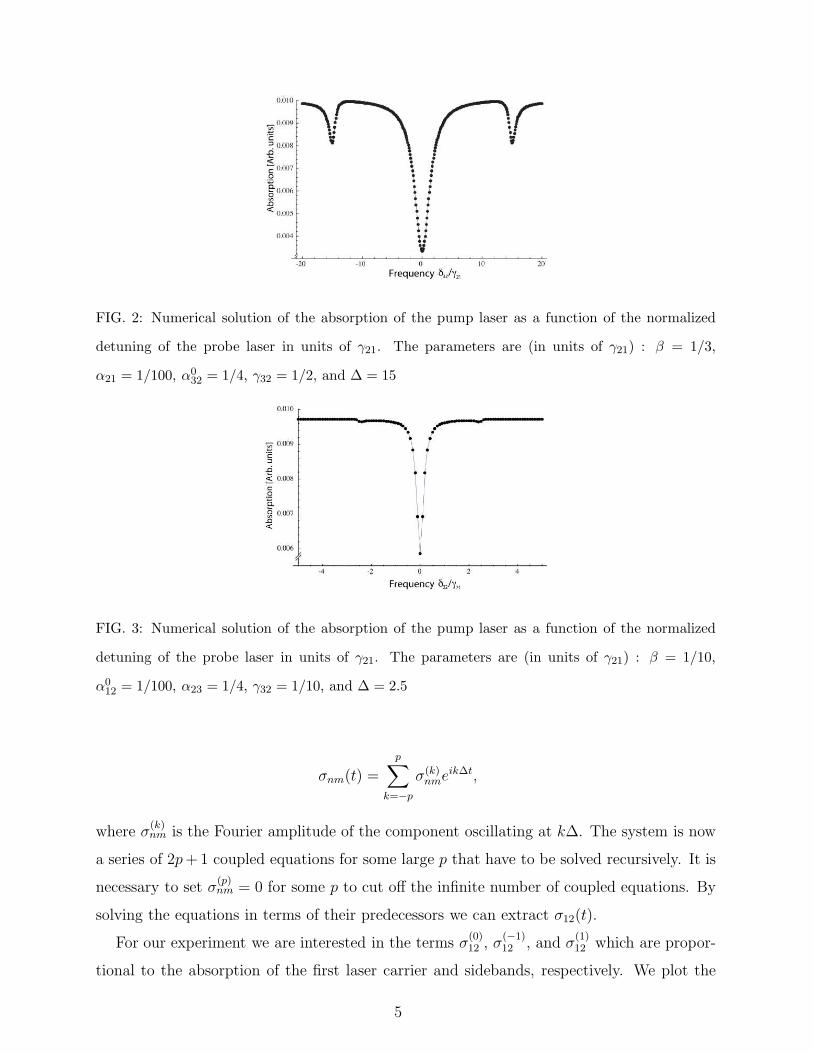
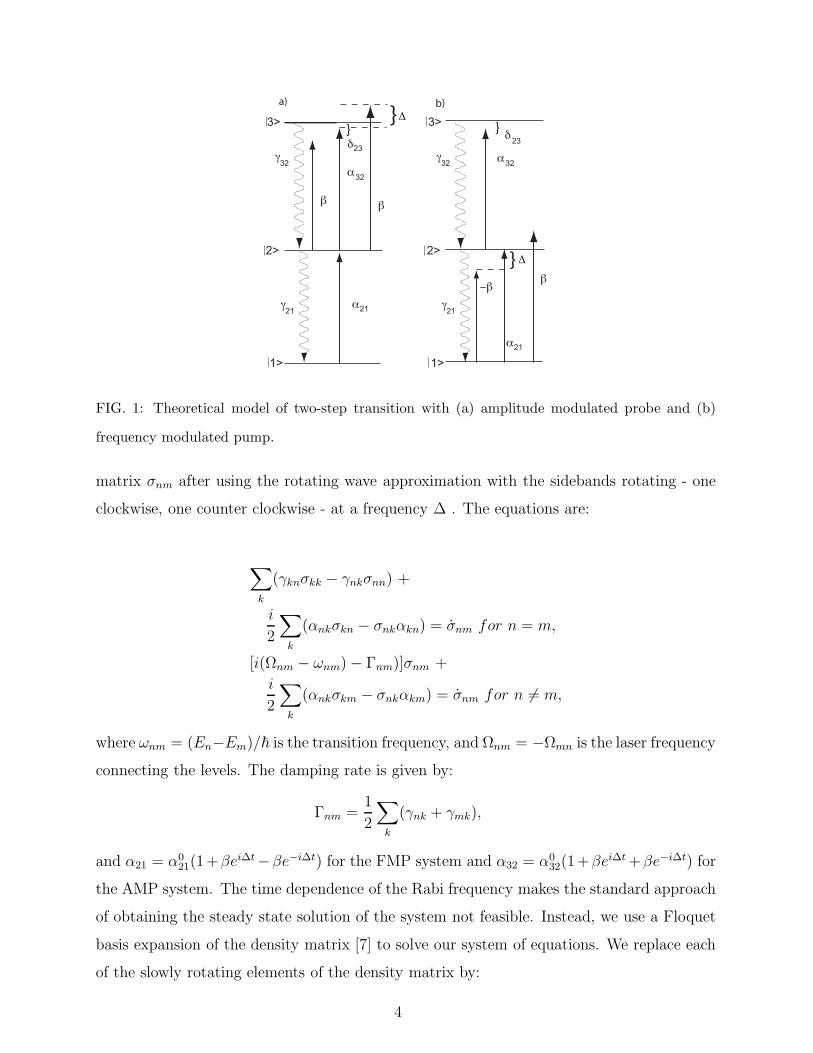
FIG. 2: Numerical solution of the absorption of the pump laser as a function of the normalized
detuning of the probe laser in units of γ21. The parameters are (in units of γ21) : β = 1/3,
α21 = 1/100, α032 = 1/4, γ32 = 1/2, and ∆ = 15
FIG. 3: Numerical solution of the absorption of the pump laser as a function of the normalized
detuning of the probe laser in units of γ21. The parameters are (in units of γ21) : β = 1/10,
α012 = 1/100, α23 = 1/4, γ32 = 1/10, and ∆ = 2.5
σnm(t) =
p∑
k=−p
σ(k)nme
ik∆t,
where σ(k)nm is the Fourier amplitude of the component oscillating at k∆. The system is now
a series of 2p+1 coupled equations for some large p that have to be solved recursively. It is
necessary to set σ(p)nm = 0 for some p to cut off the infinite number of coupled equations. By
solving the equations in terms of their predecessors we can extract σ12(t).
For our experiment we are interested in the terms σ(0)12 , σ
(−1)12 , and σ
(1)12 which are propor-
tional to the absorption of the first laser carrier and sidebands, respectively. We plot the
5

4 2 2 4
-5X10 -7
5X10⁻⁷
Absorption [Arb. units]
Frequency 32δ γ/21
FIG. 4: Numerical simulation of the demodulated absorption of the pump laser for the FMP system
as a function of the normalized detuning of the probe laser in units of γ21. The parameters are (in
units of γ21) : β = 1/10, α012 = 1/100, α32 = 1/4, γ = 1/10, and ∆ = 2.5
absolute value of the imaginary part as a function of δ23 to recover the absorption. This
is necessary to take into account the square-law nature of the photodiode. Our three level
model reproduces the resonance features of the absorption observed as the second excitation
goes into resonance for both AMP and FMP systems (see Fig. 2 and Fig. 3, respectively).
The demodulation of the FMP signal yields the expected error-like feature shown in Fig. 4.
The size of the sidebands in our model depends on the modulation index (separation from
resonance and strength), as well as the specific decay rates of the levels which set up the
Rabi frequencies αij in the AMP and FMP systems.
III. APPARATUS AND METHOD
Figure 6 and Fig. 7 present block diagrams of the FMP and AMP systems, respectively.
A Coherent 899-01 Ti:sapphire laser with a linewidth of less than 100 kHz is the pump laser
in both cases. A small amount of laser power from the pump laser is frequency modulated
by a small bandwidth electro-optical modulator at ≈15 MHz and sent to a glass cell filled
with rubidium at room temperature to lock the laser frequency to the 5P3/2 crossover line
of the F = 1 and F = 3 hyperfine levels for the FMP system and to the on resonance
F = 1 → F = 2 transition of the 5P1/2 level for the AMP system at 795 nm with a
Pound-Drever-Hall lock.
Level |1〉 in the AMP system corresponds to the lower hyperfine state of the 5S1/2 level
(F = 1) while |2〉 is the highest hyperfine state of the 5P1/2 level (F = 2) of 87Rb . The
6

F= 1 5S
1/2
780 nm
F=2 5P 3/2
5D 5/2
F= 2
F=0
F=3
F=1
F=2
F=4
F=1
F=3
776 nm
a)
γ5D
5/2
γ5P
3/2
= 0.66 MHz
= 6 MHz 795 nm
b)
1/2 6S
F= 1
F= 2
F= 1
F= 2
γ6S
5/2
= 3.5MHz 5/2
γ1/2
= 5.7 MHz 5P
F= 1
F= 2
F= 1
F= 2 5P
1/2
1/2 5S
FIG. 5: a) Relevant energy levels for the modulation of the pump atomic system. (b) Relevant
energy levels for the modulation of the probe atomic system.
decay rate between the two levels is γ21/2π = 5.7 MHz [8]. We simplify the hyperfine states
of the 6S1/2 level to just one level with decay rate γ32/2π = 3.5 MHz [9].
For the FMP system, the probe laser is an SDL diode laser with a linewidth of 5 MHz at
776 nm. The lasers overlap inside an independent rubidium glass cell at room temperature
wrapped in µ-metal in lin-perp-lin polarization configuration. Their 1/e2 power diameter of
the laser beams is 1 mm. We scan the probe laser over the 5D5/2 level hyperfine manifold
and observe the absorption of the pump laser as a function of the probe laser detuning using
a fast photodetector. We send the signal to a bias-T and record the DC and demodulated
AC components with a WaveSurfer digital oscilloscope with an 8-bit resolution from Lecroy.
We keep the power of the pump laser and the modulation depth fixed to a value of
100 µW and β = 0.2, respectively. We change the power of the probe beam and observe
its influence on the spectra. It is possible to observe the resonant features of the 5D5/2
hyperfine manifold with little as 100 µW of probe power. Higher probe power increases
the signal size and the width of the features. Playing with the polarization and powers we
also observe EIT features [10]. We restrict ourselves to a space parameter where these very
narrow features are absent.
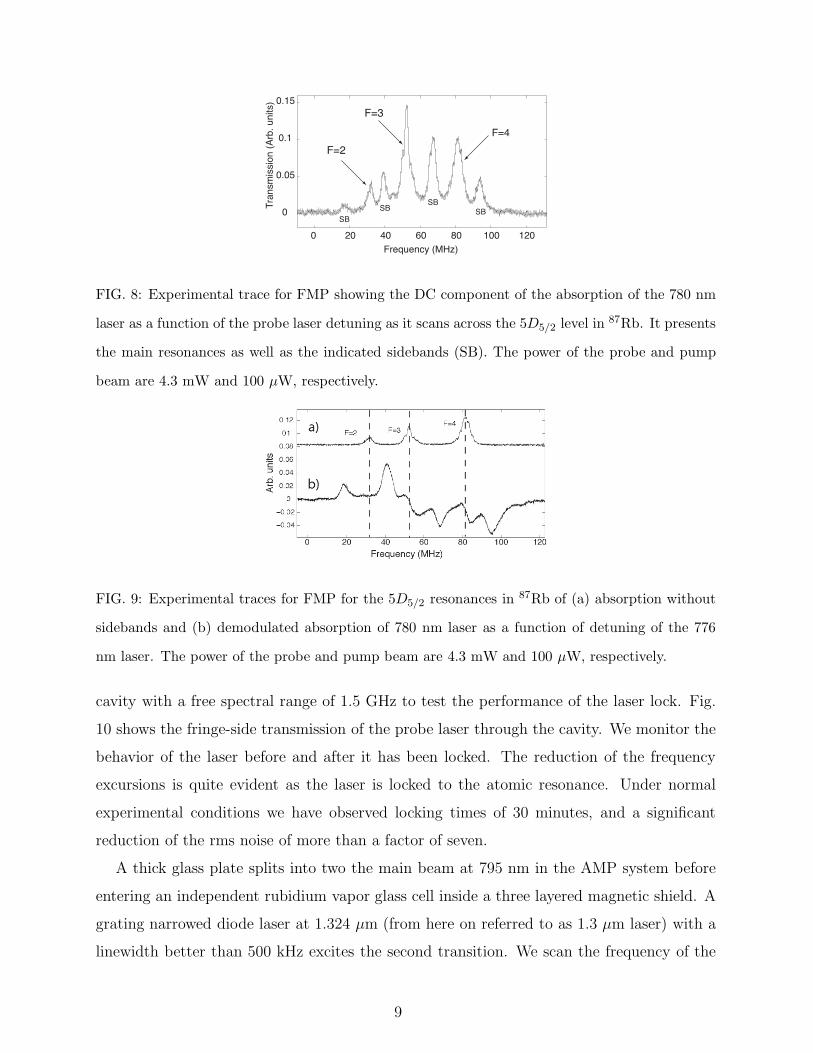
Figure 8 (FMP) and 9 (FMP) show typical experimental traces of the absorption of the
780 nm laser. The spectrum has been offset to zero transmission for convenience. The first
of these, Fig. 8, has the DC component of the absorption with the sidebands appearing
on both sides of the main resonances. No Doppler background is observed for any of the
7

LO
Rb
cell
PD
EOM
776
nm la
ser
780
nm la
ser
Optical
isolator
BS
BS
PD
Rb cell
PID
PID
To experiment
BS
BS
BS
AOM
FIG. 6: Block diagram of the experimental. Key for the figure PD: photodiode, AOM: acousto-
optical modulator, LO: local oscillator, BS: beam splitter.
LO
Rb
cell
PD
EO
M
1.3 μ
m la
ser
780
nm la
ser
Optical
isolator
BS
BS
PD
Rb cell
PID
BS
BS
Amplifier
&
Modulator
PD Mag. shield
FIG. 7: Block diagram of the experimental. Key for the figure PD: photodiode, LO: local oscillator,
BS: beam splitter.
experimental conditions explored, showing that this is a Doppler free spectrum. Fig. 9 (a)
shows the lower hyperfine states of the 5D5/2 level manifold with no sidebands for clarity.
Fig. 9(b) has the demodulated AC component of the absorption. The dashed lines identify
the error-like features with their corresponding hyperfine levels. We use this spectrum to
stabilize the frequency of the probe laser.
We monitor the laser frequency of the probe beam using a Coherent confocal Fabry-Perot
8
0 20 40 60 80 100 120
0
0.05
0.1
0.15
Tra
nsm
issio
n (
Arb
. u
nits)
Frequency (MHz)
F=2
F=3
F=4
SBSB
SBSB
FIG. 8: Experimental trace for FMP showing the DC component of the absorption of the 780 nm
laser as a function of the probe laser detuning as it scans across the 5D5/2 level in 87Rb. It presents
the main resonances as well as the indicated sidebands (SB). The power of the probe and pump
beam are 4.3 mW and 100 µW, respectively.
FIG. 9: Experimental traces for FMP for the 5D5/2 resonances in 87Rb of (a) absorption without
sidebands and (b) demodulated absorption of 780 nm laser as a function of detuning of the 776
nm laser. The power of the probe and pump beam are 4.3 mW and 100 µW, respectively.
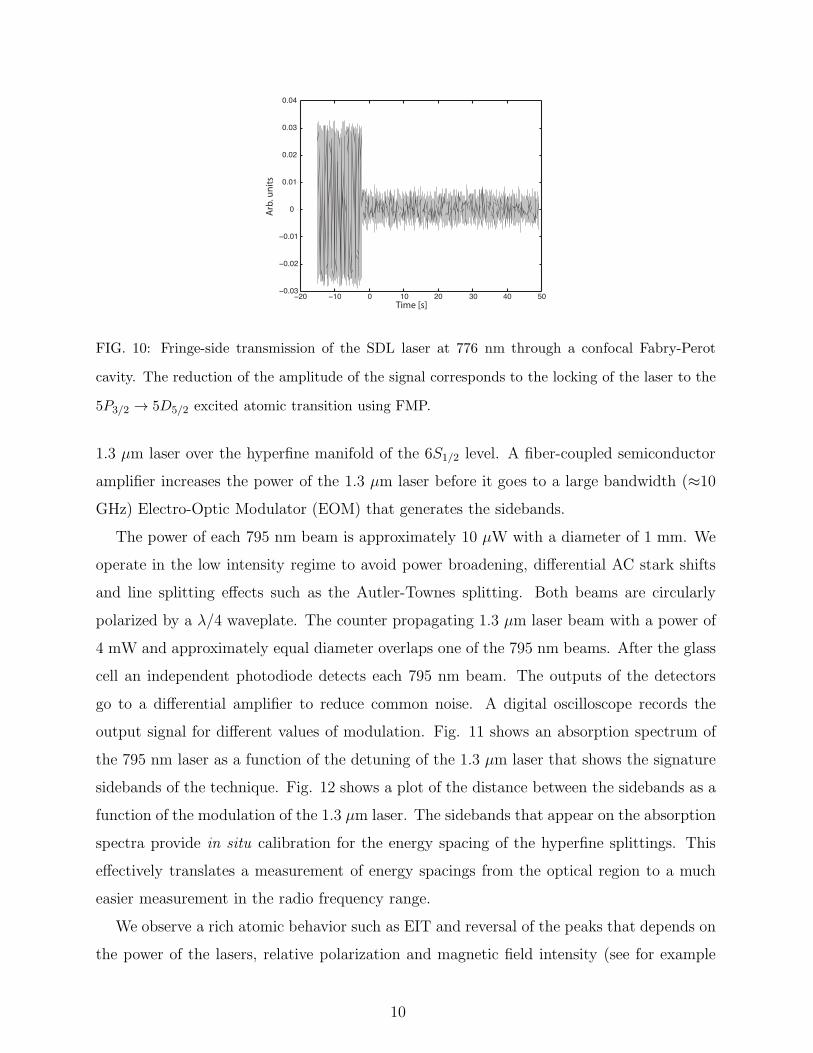
cavity with a free spectral range of 1.5 GHz to test the performance of the laser lock. Fig.
10 shows the fringe-side transmission of the probe laser through the cavity. We monitor the
behavior of the laser before and after it has been locked. The reduction of the frequency
excursions is quite evident as the laser is locked to the atomic resonance. Under normal
experimental conditions we have observed locking times of 30 minutes, and a significant
reduction of the rms noise of more than a factor of seven.
A thick glass plate splits into two the main beam at 795 nm in the AMP system before
entering an independent rubidium vapor glass cell inside a three layered magnetic shield. A
grating narrowed diode laser at 1.324 µm (from here on referred to as 1.3 µm laser) with a
linewidth better than 500 kHz excites the second transition. We scan the frequency of the
9
−20 −10 0 10 20 30 40 50−0.03
−0.02
−0.01
0
0.01
0.02
0.03
0.04
Time [s]
Arb
. u
nit
s
FIG. 10: Fringe-side transmission of the SDL laser at 776 nm through a confocal Fabry-Perot
cavity. The reduction of the amplitude of the signal corresponds to the locking of the laser to the
5P3/2 → 5D5/2 excited atomic transition using FMP.
1.3 µm laser over the hyperfine manifold of the 6S1/2 level. A fiber-coupled semiconductor
amplifier increases the power of the 1.3 µm laser before it goes to a large bandwidth (≈10
GHz) Electro-Optic Modulator (EOM) that generates the sidebands.
The power of each 795 nm beam is approximately 10 µW with a diameter of 1 mm. We
operate in the low intensity regime to avoid power broadening, differential AC stark shifts
and line splitting effects such as the Autler-Townes splitting. Both beams are circularly
polarized by a λ/4 waveplate. The counter propagating 1.3 µm laser beam with a power of
4 mW and approximately equal diameter overlaps one of the 795 nm beams. After the glass
cell an independent photodiode detects each 795 nm beam. The outputs of the detectors
go to a differential amplifier to reduce common noise. A digital oscilloscope records the
output signal for different values of modulation. Fig. 11 shows an absorption spectrum of
the 795 nm laser as a function of the detuning of the 1.3 µm laser that shows the signature
sidebands of the technique. Fig. 12 shows a plot of the distance between the sidebands as a
function of the modulation of the 1.3 µm laser. The sidebands that appear on the absorption
spectra provide in situ calibration for the energy spacing of the hyperfine splittings. This
effectively translates a measurement of energy spacings from the optical region to a much
easier measurement in the radio frequency range.
We observe a rich atomic behavior such as EIT and reversal of the peaks that depends on
the power of the lasers, relative polarization and magnetic field intensity (see for example
10
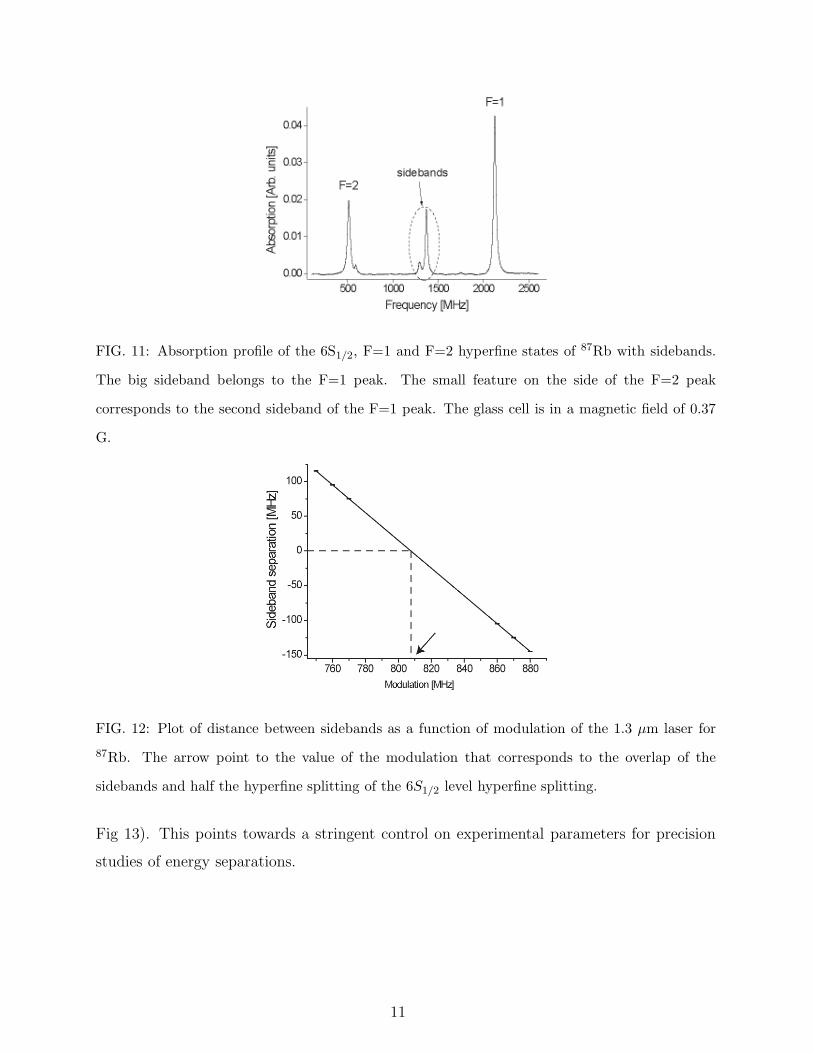
FIG. 11: Absorption profile of the 6S1/2, F=1 and F=2 hyperfine states of 87Rb with sidebands.
The big sideband belongs to the F=1 peak. The small feature on the side of the F=2 peak
corresponds to the second sideband of the F=1 peak. The glass cell is in a magnetic field of 0.37
G.
FIG. 12: Plot of distance between sidebands as a function of modulation of the 1.3 µm laser for
87Rb. The arrow point to the value of the modulation that corresponds to the overlap of the
sidebands and half the hyperfine splitting of the 6S1/2 level hyperfine splitting.
Fig 13). This points towards a stringent control on experimental parameters for precision
studies of energy separations.
11
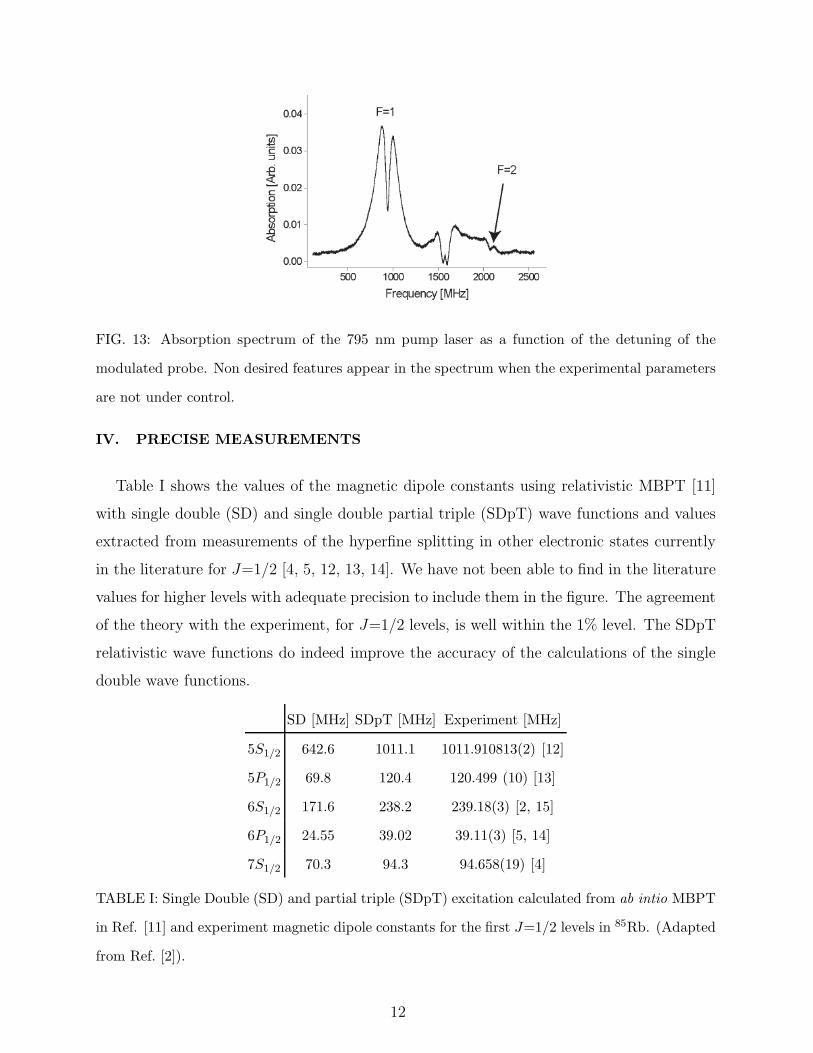
FIG. 13: Absorption spectrum of the 795 nm pump laser as a function of the detuning of the
modulated probe. Non desired features appear in the spectrum when the experimental parameters
are not under control.
IV. PRECISE MEASUREMENTS
Table I shows the values of the magnetic dipole constants using relativistic MBPT [11]
with single double (SD) and single double partial triple (SDpT) wave functions and values
extracted from measurements of the hyperfine splitting in other electronic states currently
in the literature for J=1/2 [4, 5, 12, 13, 14]. We have not been able to find in the literature
values for higher levels with adequate precision to include them in the figure. The agreement
of the theory with the experiment, for J=1/2 levels, is well within the 1% level. The SDpT
relativistic wave functions do indeed improve the accuracy of the calculations of the single
double wave functions.
SD [MHz] SDpT [MHz] Experiment [MHz]
5S1/2 642.6 1011.1 1011.910813(2) [12]
5P1/2 69.8 120.4 120.499 (10) [13]
6S1/2 171.6 238.2 239.18(3) [2, 15]
6P1/2 24.55 39.02 39.11(3) [5, 14]
7S1/2 70.3 94.3 94.658(19) [4]
TABLE I: Single Double (SD) and partial triple (SDpT) excitation calculated from ab intio MBPT
in Ref. [11] and experiment magnetic dipole constants for the first J=1/2 levels in 85Rb. (Adapted
from Ref. [2]).
12
The accuracy of the 6S1/2 measurement is high enough to extract a hyperfine anomaly
[15] in an excited state, which shows that the effect is independent of the n state of the level,
as originally predicted by Bohr and Weiskopf [16].
V. CONCLUSIONS
We have presented two-color modulation transfer spectroscopy as reliable and simple
method for studies of atomic properties in excited states. The characteristic sidebands ap-
pearing the spectra have the two-fold utility of working as an in situ ruler for measurements
of energy separations or to lock the frequency of a laser to an excited transition. The good
quality of the data presented is due to monitoring of the absorption of the pump beam
instead of direct absorption of the probe beam. The absorption of the pump beam (or lack
thereof), is always guaranteed since a vast amount of atoms are always in the ground state
and even small changes i.e. excitation to the last step of the transition, will be noticeable
even for small powers of the pump beam. In addition, the spectra does not show a Doppler
background due to the lack of an equilibrium thermal population in the intermediate state.
It is the hope that the method will stimulate studies of atomic properties of excited states
and further push the experimental precision and theoretical work in excited atomic states.
VI. ACKNOWLEDGMENTS
Work supported by NSF. A.P.G. would like to thank E. Gomez for discussions on the
subject of this article and P. Barberis for help on the theory of three level atoms.
[1] W. Demtroder, Laser Spectroscopy (Springer-Verlag, New York, 1996).
[2] A. Perez Galvan, Y. Zhao, and L. A. Orozco, Phys. Rev. A 78, 012502 (2008).
[3] W.-K. Lee, H. S. Moon, and H. S. Suh, Opt. Lett. 32, 2810 (2007).
[4] H.-C. Chui, M.-S. Ko, Y.-W. Liu, J.-T. Shy, J.-L. Peng, and H. Ahn, Opt. Lett. 30, 842
(2005).
[5] A. Marian, M. C. Stowe, J. R. Lawall, D. Felinto, and J. Ye, Science 306, 2063 (2004).
13
[6] W. R. Johnson, Atomic Structure Theory: Lectures on Atomic Physics (Springer, New York,
NY, 2007).
[7] V. Wong, R. S. Bennink, A. Marino, R. W. Boyd, and C. R. Stroud Jr., Phys. Rev. A 70,
053811 (2004).
[8] J. E. Simsarian, L. A. Orozco, G. D. Sprouse, and W. Z. Zhao, Phys. Rev. A 57, 2448 (1998).
[9] E. Gomez, F. Baumer, A. Lange, L. A. Orozco, and G. D. Sprouse, Phys. Rev. A 72, 012502
(2005).
[10] J. Gea-Banacloche, Y.-Q. Li, S.-Z. Jin, and M. Xiao, Phys. Rev. A 51, 576 (1995).
[11] M. S. Safronova, W. R. Johnson, and A. Derevianko, Phys. Rev. A 60, 4476 (1999).
[12] E. Arimondo, M. Inguscio, and P. Violino, Rev. Mod. Phys. 49, 31 (1977).
[13] G. P. Barwood, P. Gill, and W. R. C. Rowley, Appl. Phys. B 53, 142 (1991).
[14] A. Marian, M. C. Stowe, D. Felinto, and J. Ye, Phys. Rev. Lett. 95, 023001 (2005).
[15] A. Perez Galvan, Y. Zhao, L. A. Orozco, E. Gomez, F. J. Baumer, A. D. Lange, and G. D.
Sprouse, Phys. Lett. B 655, 114 (2007).
[16] A. Bohr and V. F. Weisskopf, Phys. Rev. 77, 94 (1950).
14