Embed Size (px)
Citation preview
A PAVEMENT FEEDBACK DATA SYSTEM
by
Oren G. Strom W. Ronald Hudson
James L. Brown
Research Report Number 123-12
A System Analysis of Pavement Design and Research Implementation
Research Project 1-8-69-123
conducted
in cooperation with the U. S. Department of Transportation
Federal Highway Administration
by the
Highway Design Division Texas Highway Department
Texas Transportation Institute Texas A&M University
Center for Highw'ay Research The University of Texas at Austin
May 1972

The contents of this report reflect the views of the authors, who are responsible for the facts and the accuracy of the data presented herein. The contents do not necessarily reflect the official views or policies of the Federal Highway Administration. This report does not constitute a standard, specification, or regulation.
i1

PREFACE
This report describes a conceptual feedback data system for flexible
highway pavement design and is an extension of the research reported in
Report 123-4, ''Developing a Pavement Feedback Data System." It also represents
a coordinated plan of action to activate the information subsystem identified
in the initial project report 123-1.
Included herein is a discussion of the concepts of management information
systems and their relationship to a pavement feedback data system (PFDS).
Emphasis is placed on the collection and storage of carefully screened pave
ment data which meet strict essentiality criteria. The resulting data bank
i,:; a fundamental complement to the flexible pavement design system (FPS) now
being pilot implemented in ten districts of the Texas Highway Department.
This is the twelfth in a series of reports emanating from the project
entitled "A System Analysis of Pavement Design and Research Implementation."
The project is sponsored by the Texas Highway Department in cooperation with
the Federal Highway Administration, and proposes a systematic and comprehen
sive program to achieve improved pavement design methods.
Special appreciation is extended to Hr. Frank Yu for his technical ad
vice and consultation in the area of systems analysis and computer program
ming. His efforts have been especially helpful in the resolution of numerous
system automation problems and the development of workable file concepts for
the proposed pavement data system.
The cooperation and assistance given by several Texas Highway Department
and Center for Highway Research personnel are also sincerely appreciated.
Messrs. Ben Barton, Tom Cartier, and Duval Jar1 of the Texas Highway Depart
ment were particularly helpful in several phases of this research effort.
May 1972
iii
Oren G. Strom
W. Ronald Hudson
James L. Brown

!!!!!!!!!!!!!!!!!!!"#$%!&'()!*)&+',)%!'-!$-.)-.$/-'++0!1+'-2!&'()!$-!.#)!/*$($-'+3!
44!5"6!7$1*'*0!8$($.$9'.$/-!")':!

LIST OF REPORTS
Report No. 123-1, "A Systems Approach Applied to Pavement Design and Research," by ,~. Ronald Hudson, B. Frank McCullough, F. H. Scrivner, and James L. Brown, describes a long-range comprehensive research program to develop a pavement systems analysis and presents a working systems model for the design of flexible pavements.
Report No. 123-2, "A Recommended Texas Highway Department Pavement Design System Users Manual, II by James L. Brown, Larry J. Buttler, and Hugo E. Orellana, is a manual of instructions to Texas Highway Department personnel for obtaining and processing data for flexible pavement design system.
Report No. 123-3, "Characterization of the Swelling Clay Parameter Used in the Pavement Design System," by Arthur W. Witt, III, and B. Frank McCullough, desc~ibes the results of a study of the swelling clay parameter used in pavement design system.
Report No. 123-4, "Developing A Pavement Feedback Data System," by R. C. G. Haas, describes the initial planning and development of a pavement feedback data system.
Report No. 123-5, "A Systems Analysis of Rigid Pavement Design," -by Ramesh K. Kher, W. R. Hudson, and B. F. McCullough, describes the development of a working systems model for the design of rigid pavements.
Report No. 123-6, "Calculation of the Elastic Moduli of a Two Layer Pavement System from Measured Surface Deflections," by F. H. Scrivner, C. H. Michalak, and W. M. Moore, describes a computer program which will serve as a subsystem of a future Flexible Pavement System founded on linear elastic theory.
Report No. 123-7, "Annual Report on Important 1970-71 Pavement Research Needs," by B. Frank McCullough, James L. Brown, W. Ronald Hudson, and F. H. Scrivner, describes a list of priority research items based on findings from use of the pavement design system.
Report No. 123-8, "A Sensitivity Analysis of Flexible Pavement System FPS2," by Ramesh K. Kher, B. Frank McCullough, and W. Ronald Hudson, describes the overall importance of this system, the relative importance of the variables of the system and recommendations for efficient use of the computer program.
Report No. 123-9, "Skid Resistance Considerations in the Flexible Pavement Design System," by David C. Stei t1e and B. Frank McCullough, describes skid resistance consideration in the Flexible Pavement System based on the testing of aggregates in the laboratory to predict field performance and presents a nomograph for the field engineer to use to eliminate aggregates which would not provide adequate skid resistance performance.
v

vi
Report No. 123-10, r~lexible Pavement System - Second Generation, Incorporating Fatigue and Stochastic Concepts," by Surendra Prakash Jain, B. Frank McCullough, and W. Ronald Hudson, describes the development of new structural design models for the design of flexible pavement which will replace the empirical relationship used at present in flexible pavement systems to simulate the transformation between the input variables and performance of a pavement.
Report No. 123-12, "A Pavement Feedback Data System," by Oren G. Strom, W. Ronald Hudson, and James L. Brown, defines a data system to acquire, store, and analyze performance feedback data from in-service flexible pavements.

ABSTRACT
The complex character of highway pavements coupled with ever-increasing
traffic volumes and variability of climatic conditions have made it imperative
that service life data be collected and analyzed to guide the design of new
and reconstructed pavements. The road test approach inevitably omits some
important aspects of performance and the mechanistic approach has thus far
failed to yield the rational design models sought for so long.
Development of a system to collect, store and analyze carefully selected
performance feedback data from full-scale, in-service pavements is proposed
to overcome the inherent deficiencies of the mechanistic and road-test research
techniques. This report is a case study example of such a data system for the
State of Texas, and the selected performance factors are basically the inputs
to a computer-based pavement design system known as Flexible Pavement System
(FPS).
The most logical and efficient method of storing, retrieving, and analyz
ing vast quantities of data involves a modern electronic computer system pro
grammed to perform typical file processing and management information system
functions for the highway design and research engineer. Particular care must
be taken to prevent intrusion of excess or irrelevant data into the system
since this soon leads to system overloading and breakdown. The needs of the
potential highway engineer users must govern system development to insure
responsiveness.
A fundamental decision must be made regarding the record control key for
the data system so that data is tied uniquely to that segment of highway pave
ment it describes. While many methods of record keying are in common use,
there is a strong argument for using the existing Texas method for this system
with appropriate, minor modifications.
There are several sources of feedback data and the methods of acquisition
must be tailored accordingly. While some data needs can only be satisfied by
initiation of new, statistically designed sampling and reporting procedures,
there are already in existence a number of automated data files containing
vii
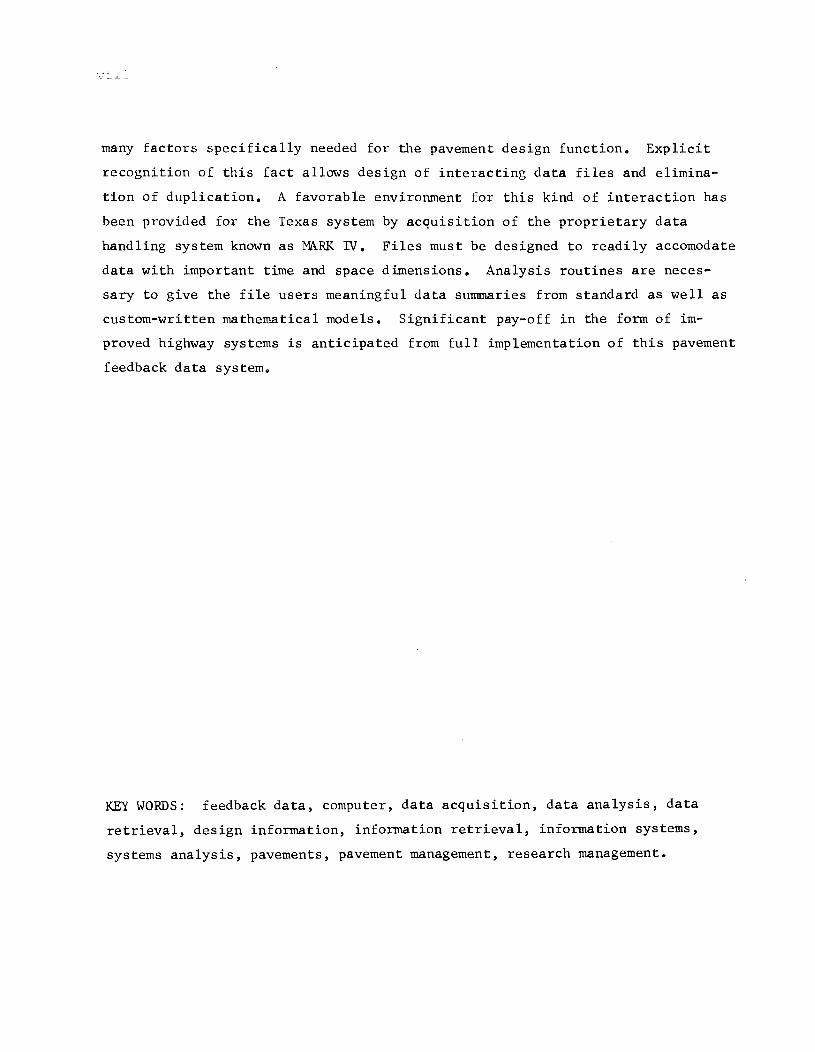
many factors specifically needed for the pavement design function. Explicit
recognition of this fact allows design of interacting data files and elimina
tion of duplication. A favorable environment for this kind of interaction has
been provided for the Texas system by acquisition of the proprietary data
handling system known as MARK IV. Files must be designed to readily accomodate
data with important time and space dimensions. Analysis routines are neces
sary to give the file users meaningful data summaries from standard as well as
custom-written mathematical models. Significant pay-off in the form of im
proved highway systems is anticipated from full implementation of this pavement
feedback data system.
KEY WORDS: feedback data, computer, data acquisition, data analysis, data
retrieval, design information, information retrieval, information systems,
systems analysis, pavements, pavement management, research management.

SmlNARY
The data system defined in this report is a suggested plan for the dis
criminate acquisition and analysis of data needed to properly execute the
Flexible Pavement System (FPS). The concepts of management information systems
presented herein are applicable to any pavement design system, and the system
defined may therefore serve as a model for eventual development of a comprehen
sive and integrated highway management system. Immediate application to the
flexible pavement design system will allow checking of the design models and
submodels, thus leading to development of new models/submodels as appropriate.
Some basic management parameters are also included in the form of pavement
performance factors and will serve to augment data now used by the District
Engineer in his highway management program. A much more responsive data and
information system is envisioned with no increase in personnel resources.
ix

!!!!!!!!!!!!!!!!!!!"#$%!&'()!*)&+',)%!'-!$-.)-.$/-'++0!1+'-2!&'()!$-!.#)!/*$($-'+3!
44!5"6!7$1*'*0!8$($.$9'.$/-!")':!

INPLEMENTATION STATEMENT
The specific steps to practical application of these research findings
are discussed in detail in Chapter 10 of this report. Two points merit
emphasis: (1) implementation of a pavement feedback data system generally as
outlined herein is absolutely imperative in an organized, methodical attack
upon the pavement design problem, and (2) implementation of the proposed data
system can be achieved without additional personnel by reordering priorities
and reassigning resources to the acquisition and handling of only that data
having specific functional uses. It may be anticipated that benefits will
include improved pavement design procedures and a responsive management in
formation system for the highway engineer.
xi

!!!!!!!!!!!!!!!!!!!"#$%!&'()!*)&+',)%!'-!$-.)-.$/-'++0!1+'-2!&'()!$-!.#)!/*$($-'+3!
44!5"6!7$1*'*0!8$($.$9'.$/-!")':!
TABLE OF CONTENTS
PREFACE iii
LIST OF REPORTS • • v
ABSTRACT • • • • • • • • • • • vii
SUMMARY • • ix
IMPLEMENTATION STATEMENT • • xi
CHAPTER 1. INTRODUCTION
The Systems Approach . • • • • • • 1 Scope of Report • • • • • • • • 2
CHAPTER 2. DEFINITION OF A PAVEMENT FEEDBACK DATA SYSTEM
Expert Observations • • • • • • • • 5 Management Information Systems • • 6 PFDS Design Objectives • • • • • • • • • • • 6 PFDS Development Phases • • • • • 8
CHAPTER 3. EVALUATION OF GENERALIZED DATA MANAGEMENT SYSTEMS
Hardware Constraints . • • 11 Generalized Software Evaluation • • • • 11 An Operational Decision • • • • • • 13 MARK IV Application to PFDS • 13 A Master THD System? • • • • • • • 14
CHAPTER 4. RECORD CONTROL KEY
Definitions 15 Methods of Location Control • • 15 The Texas System of Data Control • • • • • • • • • 16 Desirable Features ~ • • • • • • 17 Record Control Key Selection . • • 18 Modifications Required • • • • • 19 Conclusions • • • • 25
xiii
xiv
CHAPTER 5. SELECTION OF ESSENTIAL FACTORS
Introduction and Background • • • • • • • • • • • • • • • • • • • • Relation to Other Functions • • • • • • • • • • · . . • • • • • Future Additions ••••••••••••••••••••• • • • Current Design System • • • • Future Research Projects •• Essential Factors for PFDS •
• • • • • • • • • • • • • • • • • • • • • • • • • • • • • • • • • • • • • • • • • • • • • • • • • • • • • • • • •
Undefined Influences Upon Performance • • • • The PFDS Files and Factors •••••••••
• • • • • • • • • • • • • • • • • e • •
Management Factors • Special Research Files
• • • • • • • • • • • • • • • • • • • • •
CHAPTER 6. EXISTING DATA FILES AND SOURCES
• • • • • • • • • • • • • • • • 8 • • • • • •
Scope of Existing Files • D-lO Data File Relevancy
• • • • • • • • • • • • • • • • • • • • • • • • • • • • • • • • • • • • • • • • • •
OLler Data Files ••• • • • • • • • • · . . . Summary • • • • • • • • • • • • • • • • • • • • • • • • • •
CHAPTER 7. DATA SAMPLING
Sampling Concepts • • • • • • • • • • • • • • • Sampling Techniques • • • • • • • • • • • • • • • • • • •
• · . • • • • • • • • •
• • • • • • • • • • • • • • • •
Stratum Equals Job Number • • • • • • • • • • • •• Sampling as a Function of Objective. ••• Sampling as a Function of Resources • • • • • • • • Standardized Measuring Apparatus and Techniques • • Future Action • • • • • • • • • • • • • • • • • • • • • • • • • •
CHAPTER 8. FILE STRUCTURE AND DATA ANALYSIS
Overview of System and File Structure ••••••••••••••• Data Coding • • • • •• ••• ••••••••••••••••• Structural File • • •• ••••••••••••••••••••• Environment File ••••• •• • • • •• •••••••• Performance File • Costs File ••••
• . . . · . . . • • • • • •
· . . . . . . . . . • • • • • • • • • • • • • • • •
Traffic File • • • • • • • • · . . . • • • • • • • • • • • • • • • • • .. .. • • • • • · . . • • • • Constraints File
A Reference File • • • • • • • • • • • • · . . . . • • • • • • • • File Combinations • • • • • • • • Prospects with MARK IV • Custom~Written Analysis Programs
CHAPTER 9. PFDS INFORMATION POTENTIAL
PFDS Equals Information • • • • Information for District Manager
• • • • . . . . . . . .
• • · . • •
• • • • • • • • • • • • • • • • • • · ... • • • • • •
· . . • • • • • • • • • • • • • • • • • •
27 27 29 32 37 38 39 40 45 46
47 47 52 54
55 55 56 57 57 58 61
63 65 66 69 72 72 72 77 77 79 79 80
85 86
Information for Administration ••••• Information for the Research Engineer
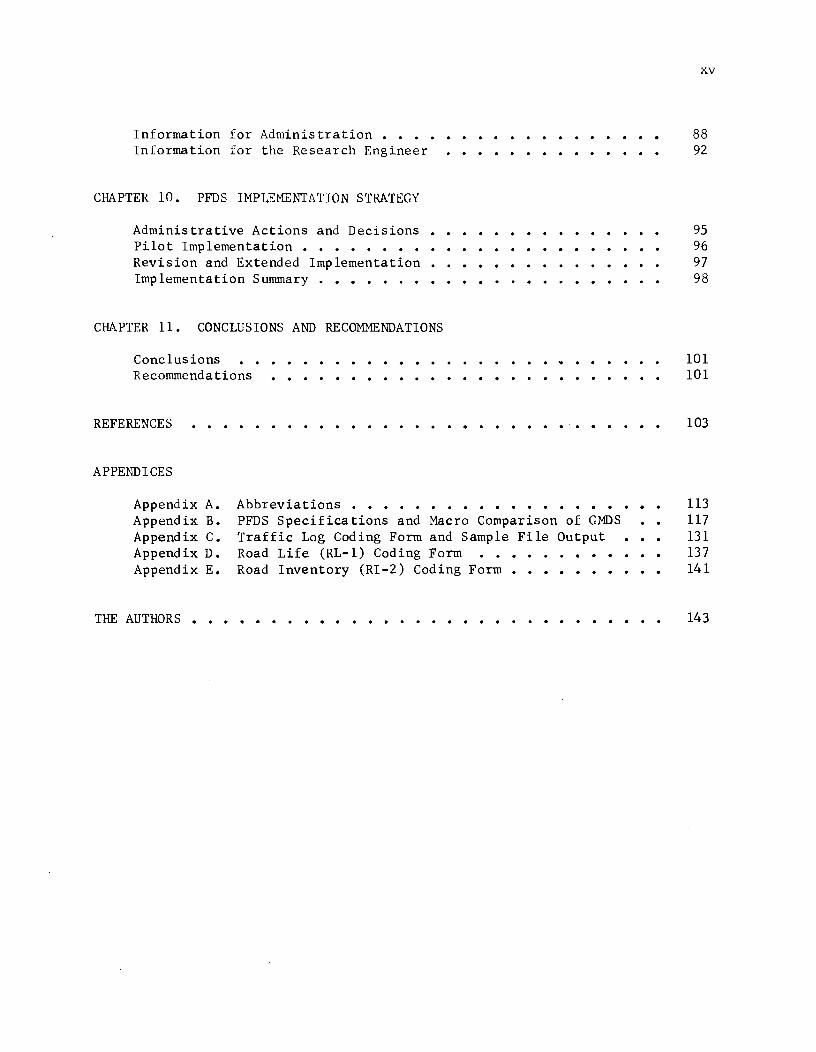
CHAPTER 10. PFDS IMPLEMENTATION STRATEGY
Administrative Actions and Decisions •••• Pilot Implementation • • • • • • • • • • • • Revision and Extended Implementation. • • • • • ••• Implementation Summary • • • • • • • • • • • • • • • •
CHAPTER 11. CONCLUSIONS AND RECOMMENDATIONS
Conclusions Recommendations . . . . . . . . .
REFERENCES . . . . . . . . . . . . . . . . . . . . . . . ... . . . . .
APPENDICES
Appendix A. Appendix B. Appendix C. Appendix D. Appendix E.
Abbreviations • • • • • • • • • • • • • • • • • • PFDS Specifications and Macro Comparison of GMDS Traffic Log Coding Form and Sample File Output Road Life (RL-l) Coding Form Road Inventory (RI-2) Coding Form ••••••••
xv
88 92
95 96 97 98
101 101
103
113 117 l3l l37 141
THE AUTHOR S • • • • • • • • • • • • • • • • • • • • • • • • • • • • •• 143

CHAPTER 1. INTRODUCTION
Highway engineers have always sought a rational pavement design procedure.
Some have said that classical mechanics would soon provide better design equa
tions, while others have pursued the non-mechanistic, road test type approach.
Meanwhile, the nation's automobile and truck traffic has grown at a furious
rate, and vast sums of money have gone into the highway system. The pavement
structure itself has been no small investment.
Unfortunately, much of the Interstate System has begun to show early
distress and the General Accounting Office, the congressional watchdog on
federal spending, has criticized the pavement designer and his works (Ref 80).
W. N. Carey, Jr., in his opening remarks to the Highway Research Board (HRB)
Workshop on Structural Design of Asphalt Concrete Pavement Systems, Austin,
Texas, December 7, 1970, reminded his colleagues of these facts and admonished
that '\ve better hurry to get Some rational answers" (Ref 37). He went on to
observe that this situation "is no longer a minor skirmish - an interesting
intellectual exercise - it is a serious situation for all of us and for American
transportation."
The Systems Approach
Although the road tests have provided answers to some questions, there
remain the many unknowns that were beyond the limits of these experiments.
The past five years has seen a great deal of emphasis placed upon a coordinated,
systematic approach to pavement design. A cooperative research program in
volving the Texas Highway Department, the Texas Transportation Institute of
Texas A&M University, and the Center for Highway Research of The University of
Texas at Austin, has been underway since 1968 to provide some systematic im
provements to the entire pavement design and management problem. Project
1-8-69-123, "A Systems Approach Applied to Pavement Design and Research," has
yielded a number of findings and conclusions documented in a series of reports
(Refs 28, 40, 45,47,56, 66, and 90).
1
Scope of Report
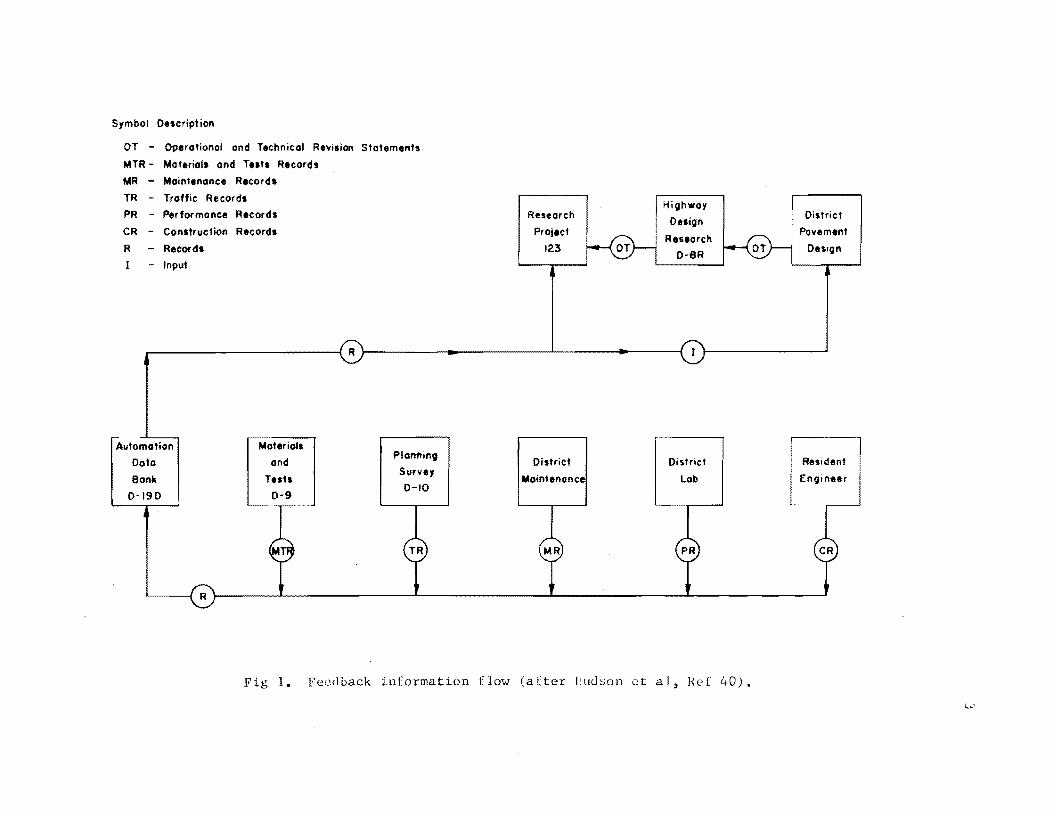
One of the fundamental objectives of the project has been to develop an
information subsystem to yield research information, design information and
feedback data (Ref 40). Figure 1 illustrates the basic characteristics of
feedback information network envisioned in Project 123. Some preliminary
planning guides for a data system were provided previously by R. Haas (Ref 28),
and this report is a continuation to describe a Pavement Feedback Data System
(PFDS) to be initially implemented for flexible pavements only. However, the
concepts and principles of Management Information Systems (MIS) presented
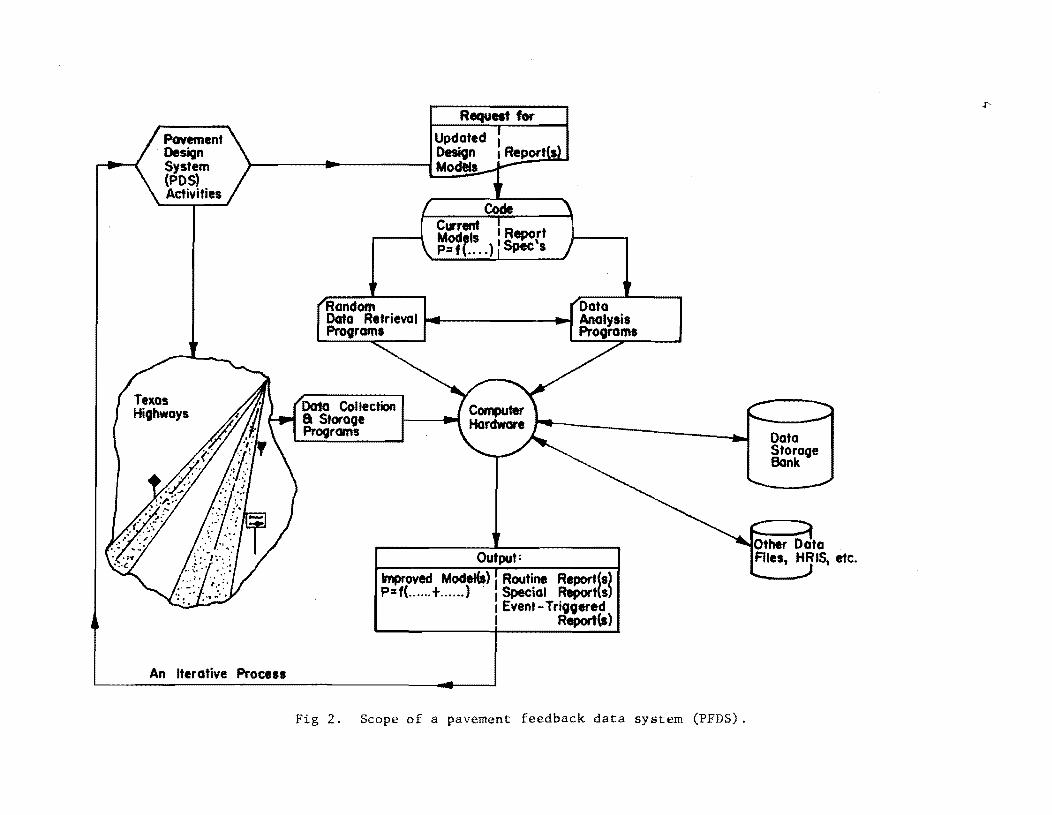
herein are equally applicable to rigid (or any) pavement system. Figure 2
depicts the various elements of this report and their relationship to the
Pavement Design System (PDS) that has evolved from the research efforts of
Project 123.
Chapter 2 presents the why of a PFDS, with special emphasis on the feed
back loop from real in-service pavement systems instead of experimental sections.
Chapter 3 summarizes the state-of-the art in Generalized Data Management
System (GDMS) software development, while the vital aspects of data control
and coordination are discussed in Chapter 4.
Chapter 5 goes directly to the heart of the Flexible Pavement System (FPS)
design method and sets forth those essential factors for which data should be
collected, stored and analyzed in the feedback loop.
Chapter 6 is a summary of the existing data files of the Texas Highway
Department, with main emphasis on those factors of direct application in the
FPS design procedure.
Chapter 7 discusses sampling procedures to acquire reliable and repres~nt
ative data, and Chapter 8 presents conceptual and actual versions of file
structures within the proposed PFDS.
Chapter 9 presents some potential user interactions with PFDS and il
lustrates some typical information output from the system.
Chapter 10 is a detailed implementation guide suggested for use by the
Texas Highway Department.
Chapter 11 contains conclusions and specific recommendations for PFDS
related research and administrative actions.
Symbol Description
OT - Operational and Technical Revision Statements
MTR - Materials and Tuts Records
MR - Maintenance Records
TR - Traffic Records
PR Performance Records
CR - Construction Records
R - Records
1 - Input
.-------------{R
Automation Materials
Data and Planning
Bonk Tuts Survey
0-9 0-10
0-190
Highwciy Research
Design Project
Research 123
D-8R
District District
Maintenance Lob
Fig 1. Feedback information flow (after Hudson ct ai, Ref 40).
District
Pavement
Design
Resident
EnOlneer
An Iterative Process
Request for
Random Data Data Retrieval ..... ------...... Analysis Programs Programs
Data Collection a Storage Programs
Output: improved Modet(s) I Routi,"' Repart(s) p:t(. ..... t ...... ) I Special Report(s)
I Event-Triggered I Report(s)
Fig 2, Scope of a pavement feedback data system (PFDS).

Cl-L PTER 2. DEFINITION OF A PAVEMENT FEEDBACK DATA SYSTEM
Expert Observations
In a memorandum dated October 23, 1962, D. C. Greer, Texas State Highway
Engineer, advised his Chief of Design of the increase in research funding to
be expected a& a result of the Federal Aid Highway Act of 1962 (Ref 27). In
directing the initiation of an expanded research program to properly utilize
the increased fllnding, he stated:
For many years, I have been convinced that the best research laboratory available to uS is the Texas Highway System. It is possible that this is the time that we could take advantage of these funds that we will be required to expend to set up a research project to visit, inspect, and tabulate all information available on all concrete pavements built on the Texas Highway System in the past 25 years, together with the subsequent cost of maintenance and perpetuation. It is possible that such accumulation of data might then be handled through computers in such a manner as to give to uS the tools whereby we might intelligently interpret the experiences of the past to guide us in subgrade and concrete pavement design in the future.
These words precisely describe the needed Pavement Feedback Data System (PFDS).
Nearly eight years later, Karl Pister, Professor of Engineering Science
at the University of California, stated the mechanist's viewpoint of a PFDS
(Ref 61). In his paper, he referred to systematic and continuous observations
of performance of full scale pavements and stated:
It is only through such a data acquisition program that any hope of pattern recognition will emerge to guide the formalization of operational rules leading to rational design. For example, without this, mathematical simulation of pavement systems, no matter how fascinating a game in itself, will remain precisely a game with very little pay-off to pavement systems.
Somewhat later in the same paper, Pister observed that rational but inadequate
models of pavement behavior have been used successfully, primarily by allowing
the engineer to use his judgment. He continued:
In other words, the engineer is a short circuit of the rational design process. Our attempts should be, it would seem, directed toward continued use of the engineer in this role but supplying him with the best possible data upon which to base his judgments, thereby minimizing the possibility of irrational short-circuits.
5
o
The preceding descriptions of a PFDS by a practicing engineer-manager
and an engineering mechanist leave little more to say by way of definition
and purpose. The title, Pavement Feedback Data System, is considered a logical
and appropriate summarization. In a sentence, a PFDS is an automated system
containing select feedback data from actual in-service highway pavements, to
be used for research, design, and management functions.
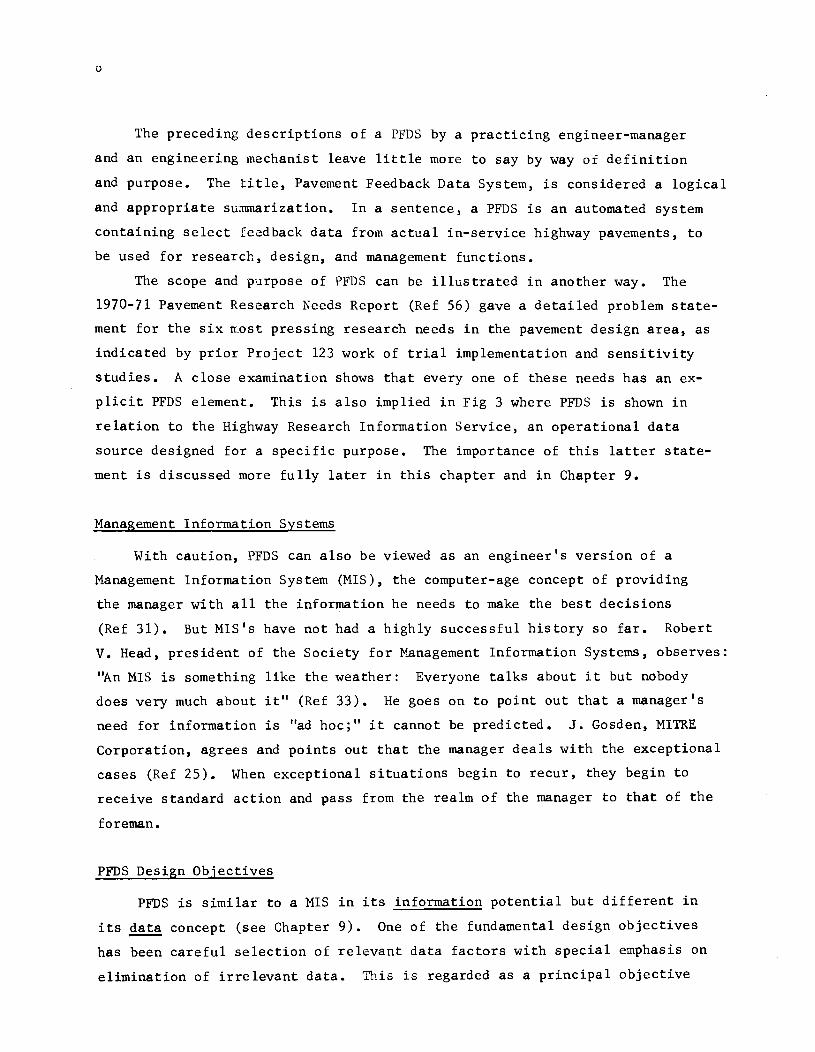
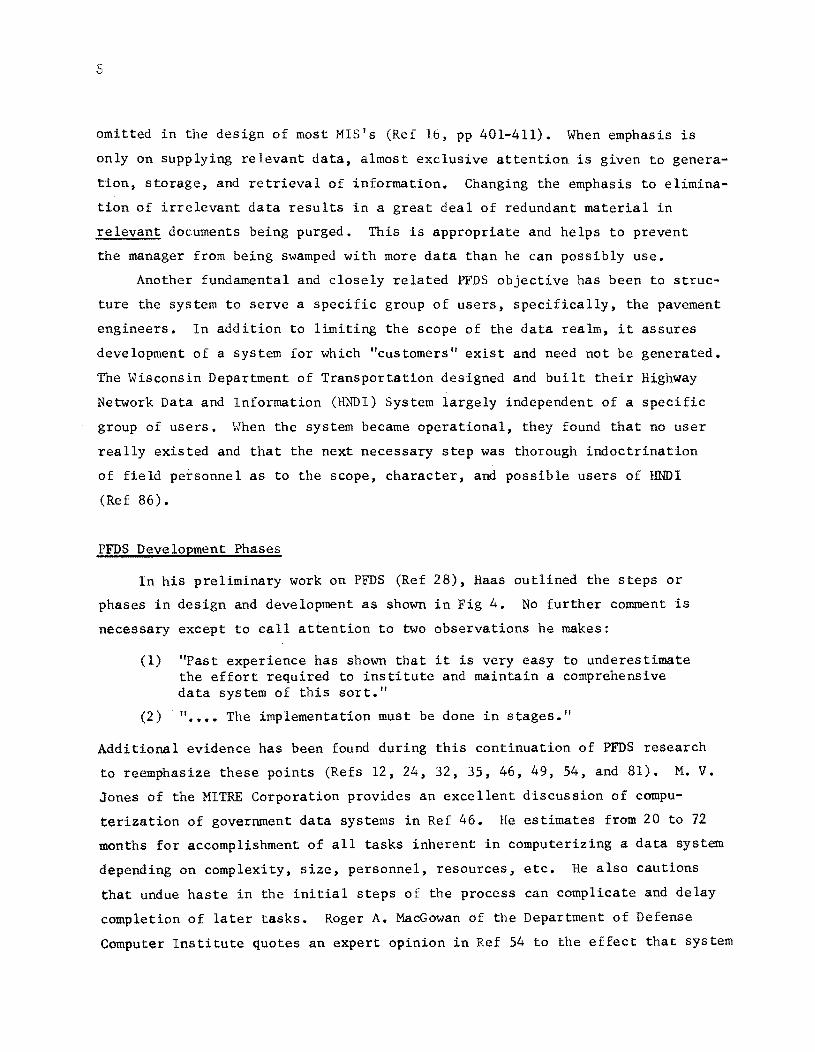
The scope and purpose of PFDS can be illustrated in another way. The
1970-71 Pavement Research Needs Report (Ref 56) gave a detailed problem state
ment for the six ~ost pressing research needs in the pavement design area, as
indicated by prior Project 123 work of trial implementation and sensitivity
studies. A close examination shows that everyone of these needs has an ex
plicit PFDS element. This is also implied in Fig 3 where PFDS is shown in
relation to the Highway Research Information Service, an operational data
source designed for a specific purpose. The importance of this latter state
ment is discussed more fully later in this chapter and in Chapter 9.
Management Information Systems
With caution, PFDS can also be viewed as an engineer's version of a
Management Information System (MIS), the computer-age concept of providing
the manager with all the information he needs to make the best decisions
(Ref 31). But MIS's have not had a highly successful history so far. Robert
V. Head, president of the Society for Management Information Systems, observes:
"An MIS is something like the weather: Everyone talks about it but n()body
does very much about it" (Ref 33). He goes on to point out that a manager's
need for information is "ad hoc;" it cannot be predicted. J. Gosden, MITRE
Corporation, agrees and points out that the manager deals with the exceptional
cases (Ref 25). When exceptional situations begin to recur, they begin to
receive standard action and pass from the realm of the manager to that of the
foreman.
PFDS Design Objectives
PFDS is similar to a MIS in its information potential but different in
its data concept (see Chapter 9). One of the fundamental design objectives
has been careful selection of relevant data factors with special emphasis on
elimination of irrelevant data. This is regarded as a principal objective
Complete Research ~ ImpiementF~I4I". in;s Ttru ImprO\Oed Subsystems
Develop and FUND New Research Projects
4 Reseort:h Manoqement Loop
Modify CIS Needed
to use in System
OPERATING
SYSTEM
4 Implementation Loop
De'teIop Improved Subsystems
HRIS = Highwoy Research
Information Service
Compore Existinq Methods and Performance
Evaluation Sensitivity Analysis
Implementation
Field Use
PFDS = Pavement Feedback
Data System
Fig 3. Interaction of PFDS with the operating pavement system.
omitted in the design of most MIS's (Ref 16, pp 401-411). When emphasis is
only on supplying relevant data, almost exclusive attention is given to genera
tion, storage, and retrieval of information. Changing the emphasis to elimina
tion of irrelevant data results in a great deal of redundant material in
relevant documents being purged. This is appropriate and helps to prevent
the manager from being swamped with more data than he can possibly use.
Another fundamental and closely related PFDS objective has been to struc
ture the system to serve a specific group of users, specifically, the pavement
engineers. In addition to limiting the scope of the data realm, it assures
development of a system for which "customers" exist and need not be generated.
The Wisconsin Department of Transportation designed and built their Highway
Network Data and Information (HNDI) System largely independent of a specific
group of users. When the system became operational, they found that no user
really existed and that the next necessary step was thorough indoctrination
of field personnel as to the scope, character, and possible users of HNDI
(Ref 86).
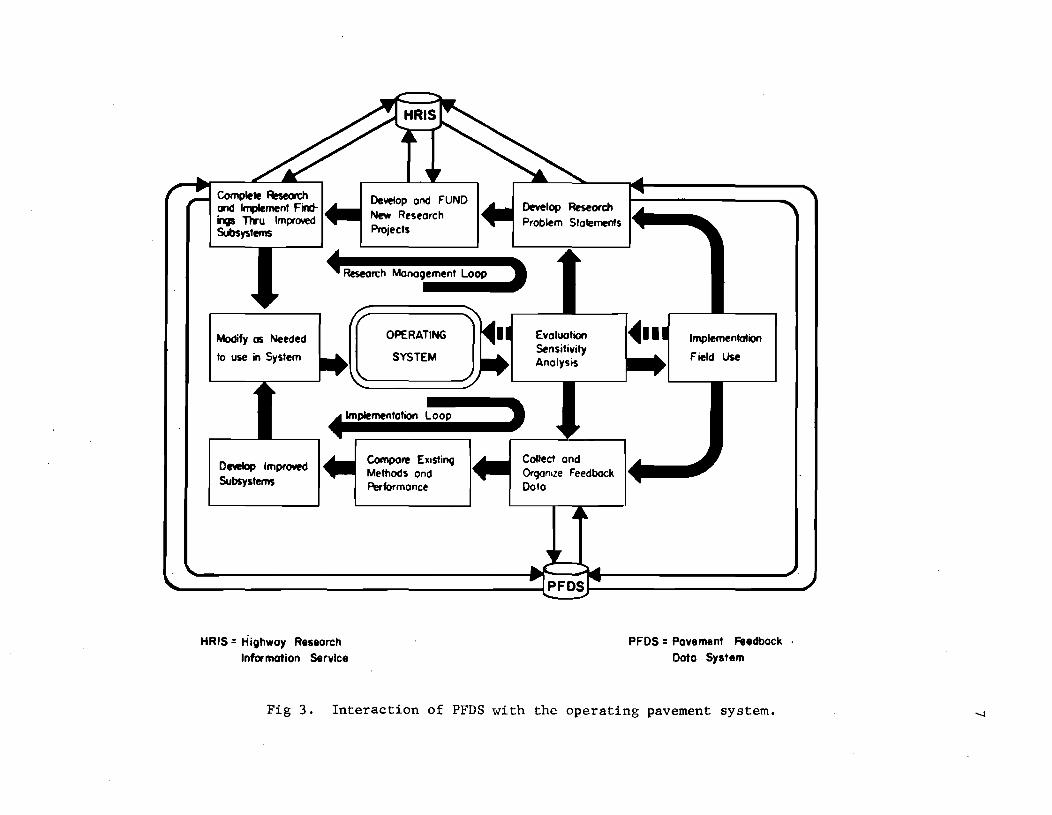
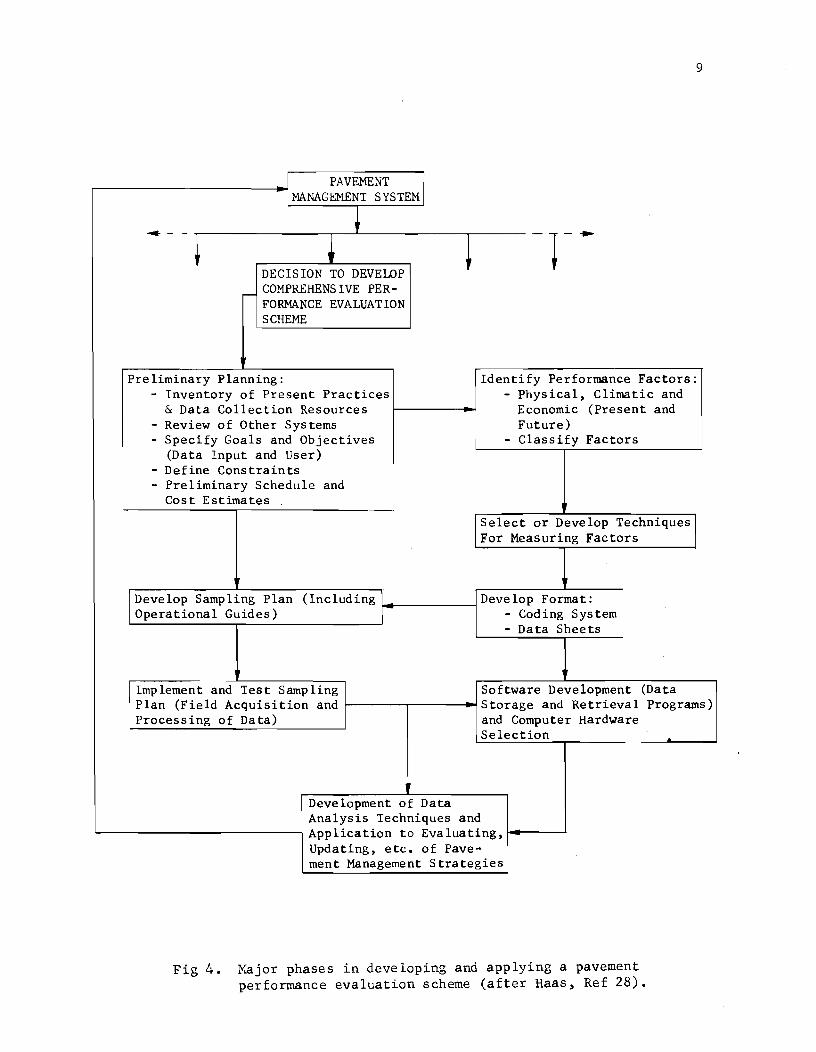
PFDS Development Phases
In his preliminary work on PFDS (Ref 28), Haas outlined the steps or
phases in design and development as shown in Fig 4. No further comment is
necessary except to call attention to two observations he makes:
(1) "Past experience has shown that it is very easy to underestimate the effort required to institute and maintain a comprehensive data system of this sort."
(2) " •••• The implementation must be done in stages."
Additional evidence has been found during this continuation of PFDS research
to reemphasize these points (Refs 12, 24, 32, 35, 46, 49, 54, and 81). M. V.
Jones of the MITRE Corporation provides an excellent discussion of compu
terization of government data systems in Ref 46. He estimates from 20 to 72
months for accomplishment of all tasks inherent in computerizing a data system
depending on complexity, size, personnel, resources, etc. He also cautions
that undue haste in the initial steps of the process can complicate and delay
completion of later tasks. Roger A. MacGowan of the Department of Defense
Computer Institute quotes an expert opinion in Ref 54 to the effect that system
,-_________ ~J PAVEMENT I I MANAGEMENT SYSTEM
-- - ~ +
DECISION TO DEVELOP ~ COMPREHENSIVE PER
FORMANCE EVALUATION SCHEME
Preliminary Planning: - Inventory of Present Practices
& Data Collection Resources Review of Other Systems Specify Goals and Objectives (Data Input and User) Define Constraints Preliminary Schedule and Cost Estimates
Identify Performance Factors: - Physical, Climatic and
Economic (Present and Future)
- Classify Factors
Select or Develop Techniques I For Measuring Factors
Develop Sampling Plan (Including 1~ ________ ~Develop Format: Operational Guides) I - Coding System
- Data Sheets
Implement and Test Sampling Software Development (Data
9
Plan (Field Acquisition and ~------.-------~Storage and Retrieval Programs) Processing of Data) and Computer Hardware
Selection
Development of Data Analysis Techniques and
~------------------------~Application to Evaluating,~----~ Updating, etc. of Pave-
Fig 4.
ment Management Strategies
Major phases in developing and applying a pavement performance evaluation scheme (after Haas, Ref 28).

10
designers have found the management information task to be a "far more comp1ex~
far more difficult process than they ever anticipated."
The several phases of PFDS are all addressed to a varying degree in the
following chapters.
CHAPTER 3. EVALL"ATION OF GENERALIZED DATA MANAGEMENT SYSTEMS
Hardware Constraints
When the automation of a data system is being planned, two important
considerations besides the data itself are:
(1) hardware - the computer, and
(2) software - the computer programs.
The hardware part of this problem is already solved in that the Texas Highway
Department is already equipped with some of the most powerful and modern com
puter equipment available. In July 1971, THD installed the first of two new
IBM System 370 Model 155 computers. These units replaced IBM 360 Model 50
units, so there never was any question about what brand of equipment would be
handling the PFDS data files in an operational environment. By going to the
new System 370, THD acquired four times the internal operating speed of their
previous 360 units (Ref 18). This new computing power has already begun to
show its effect and backlogged computing work has been eliminated.
Generalized Software Evaluation
Hardware is important for reasons other than computing speed. It lit
erally locks a user in on certain computer programs and methods (software);
and this is especially true in the area of generalized data management systems
(GDMS), or in equivalent terms, general purpose software. This became an
important consideration in PFDS research because it was logical to first seek
a general purpose software package for data management rather than write one
from scratch. There has been a good deal of effort made in the past "15 to
20 years to develop a general system that can be adapted to any situation.
John B. Glore of the MITRE Corporation (Ref 24) describes the potential
advantages of a GDMS as
(1) ease of use,
(2) fast response,
(3) economical use of computer equipment,
11
, .. .l"-
(4) sufficient flexibility to configure and reconfigure solutions to a wide variety of problems, and
(5) relatively little programming effort required.
Charles Kriebel, Carnegie-Mellon University, (Ref 50) states that there were
about 50 such software systems commercially available in early 1969. Madill
and Kuss of Simon-Fraser University (Ref 55) speculate that there are probably
in excess of 100 existing software packages that perform data management func
tions. In any event, there is certainly a wide choice, both in vendors and
price. A fairly recent summary (Ref 2) of file management systems by Altman,
et aI, reports that the commercial packages vary in cost from $10,000 to over
$100,000.
With this kind of software marketplace, an effort was made to evaluate
as many systems as possible for application to PFDS. The primary sources of
information included Refs 7, 9, 21, 22, 24, 43, 44, 49, 58, 71, 79, 88, and 93.
One of the difficulties encountered in this study was acquisition of objective
information. Most available information is contained in vendor sales brochures
and Jules Schwartz observes in Ref 54 that the seller's words have not been a
notably accurate source for measuring the quality of software or its documenta
tion. Objective evaluations by impartial authorities are limited.
Evaluation of 21 specific packages was undertaken by the Project 123
staff. All but five of these ~yere promptly eliminated because of incompati
bility with IBM hardware or the resident operating system, or because the
package was no longer being maintained. The remaining five were (Appendix A)
(1) DM-l,
(2) COGENT III,
(3) MARK IV,
(4) GIS, and
(5) NIPS.
Detailed specifications for PFDS software were prepared and grouped as
mandatory, desirable, and optional. An attempt was then made to match the
commercial package capability against the specifications. The result was
that no system, as then defined, met all of the specifications for PFDS (see
Appendix B). A tentative conclusion was made that a best all-around answer
would be to write the software package patterned after a system prepared for
the Montana Highway Department (Ref 93).
13
An Operational Decision
Concurrently, the THD Automation Division, D-19, was conducting an evalua
tion of generalized systems to be used for several departmental functions of
personnel, equipment, and fiscal accounting. Regular coordination was main
tained between D-19 and the Project 123 research staff to share information
and findings. In February 1972, D-19 decided to purchase the MARK IV/260 file
handling system marketed by Informatics, Inc.
This decision by D-19 is regarded as a very discriminate selection and
immediately marked a turning point in PFDS planning. In the evaluation con
ducted by the Project 123 staff, MARK IV was noted as the only system that
was in wide commercial use and acclaimed by the users as capable of everything
claimed by the vendor. Even Glore acknowledged it as an apparently successful
"limited system" in his discussion of GDMS shortcomings (Ref 24). However,
its initial cost of $40,000 was more than could be amortized at this time with
PFDS alone. The use to be made of MARK IV in the entire Texas Highway Depart
ment is a completely different matter and adequately justifies such an ex
penditure.
MARK IV Application to PFDS
One of our first actions was acceptance of a D-19 invitation to look at
MARK IV for possible application to PFDS. This first look revealed that the
system has undergone constant improvement and now possesses capabilities not
inherent in the earlier versions. One of the most important of these is an
optional extra cost feature "Indexed Coordinated Files" that permits random
access to the data base. Without this feature, the file can be processed
sequentially only, a very slow and inefficient method of retrieving specific
data items as needed. Random data access is considered an absolute must for
PFDS and has always been a mandatory feature of the requisite software system.
The Planning Survey Division (D-lO) has indicated that this feature is es
sential for their file manipulations also.
Another extra cost feature of considerable value to PFDS is '~xtended
File Processing." This permits the simultaneous processing of nine files as
compared with four in the basic MARK IV/260. This greatly improves processing
time and efficiency and is also a valuable asset to D-lO operations.
14
It is concluded the MARK IV with the Indexed Coordinated Files feature
can do the PFDS job very adequately. The system possesses several character
istics that make its use for PFDS very promising:
(1) Data fields are referred to by name.
(2) File record structure may be changed with little effort to insert or delete data fields. This is a powerful asset in any research endeavor.
(3) The coding forms are preprinted by the vendor and vastly simplify the use of the system (see Fig 28).
(4) The files created by MARK IV are fully compatible with the existing operating system (OS) and are readily available for accessing by custom-written analysis routines.
A Master THD System?
In summary, it is important to emphasize that MARK IV offers many ad
vantages to PFDS as well as to the Texas Highway Department. Perhaps the most
important of these is that it creates a common environment for all THD files,
thus allowing them to readily interact and interchange information. This is
a vital asset in PFDS functions as will become evident in later discussion.
It is also important to THD because it standardizes the terminology for use
of all data files, regardless of content or principal user. This may represent
an important first step to master THD files, with the concomitant benefit of
true information exchange and elimination of duplication.

CHAPTER 4. RECORD CONTROL KEY
Definitions
In the design of a computerized highway network data system, a method
must be devised to uniquely identify data with a particular segment or point
of roadway. The resulting device is a "record control key." If several
data files are used to describe different highway system characteristics, it
is important that the same record control key be used for all files in order
to allow combined files processing and data analysis. This is a process
called "correlation of data" and the control key is the common base of refer-
ence.
An analogy might be computer files on people in an organization. One
file may contain personal data (height, weight, etc.) whereas two other files
may contain previous employment records and current earnings data respectively.
If we use the individuals' social security number as our record control key
(in all files), we have uniquely identified the people in a consistent manner
in our data files. We may therefore retrieve any combination of data per
taining to any particular person.
Methods of Location Control
The situation in regard to the highway system is similar but more com
plicated. Unlike people, our highway system is not a series of discrete units.
Instead, it is a continuous ribbon of asphalt or concrete with constantly
changing characteristics. Many different methods of location reference have
been used to uniquely describe highway networks and William E. Blessing of
the Federal Highway Administration discusses several in Ref 4. The principal
methods are
(1) Route number and mi1epoint - Use of the federal or state highway number and a mi1epoint measured from some political or geographic feature such as state or county line. Field marking of the mi1epoint is done with uniformly or non-uniformly spaced mileposts. Data valid for only a point on a highway or for a given length of highway may be identified with this method.
15

l,G
(2) Reference posts - Unlike the milepost (or mi1epoint) method, reference posts each have a unique identification number without regard for the high'\vay number. Central office records reflect the actual location of reference posts tied to route number, county, and mi1epoint from some starting point. Both length and point data may be tied to reference posts.
(3) Route special feature log - This method employs no field signing or posts. A straight line diagram or log is kept in a central office, showing the significant features encountered along the roadway. Highway intersections, bridges, county lines, etc. are the political, geographical, and man-made features with recorded mi1epoints that serve as the common base of reference.
(4) Coordinates - This method of position identification is exemplified by the international global method of latitude and longitude; a given latitude and longitude define a point on the earth's surface. On a smaller scale, state plane coordinates have frequently been used to locate specific points within a given state. This method necessitates several maps of the state along with a template or "Romer" to scale the coordinate locations (Ref 82). No field signing is used; data values are recorded in terms of north-south and eastwest coordinates.
The Texas System of Data Control
An additional method not discussed by Blessing is that used in Texas,
the Control Section numbering system. Originated about 1935, the control
section method was intended to provide a master reference system within which
all subsequent physical and cost data could be tied to specific segments of
the highway system. The system has been applied universally in Texas to all
road systems over the years until today, all of the 70,000 miles of Texas
highway are so identified. The following definitions apply (Ref 76):
Control
Section
- a length of roadway 50 to 100 miles long with well-defined geographic termini,
- a sub-unit or length of "control," typically 10 to 15 miles long with well-defined geographic termini, and
Job Number - a sequentially assigned number within the control section to identify special maintenance and/or construction work to be performed on a given segment of roadway at a given time. The job number may cover all or any fractional part of a control section, and jobs extending over more than one control section are assigned a separate job number within each control section.
This Texas system is therefore a three-level 10cationa1 identifier having a
time (or event) as well as space dimeGsion. Although the controls and sections
were initially assigned in numerical sequence from west to east and from north
to south, this uniform sequence has been interrupted by the irregular develop
ment of the state system. Today, there are 3,233 controls assigned and a
total of about 8,000 control sections. This suggests that the "typical" con
trol section is about 8-1/2 miles in length. It is important to emphasize
that no portion of roadway has more than one control section number. However,
frontage roads parallel to Interstate highways carry the same control section
number as the Interstate.
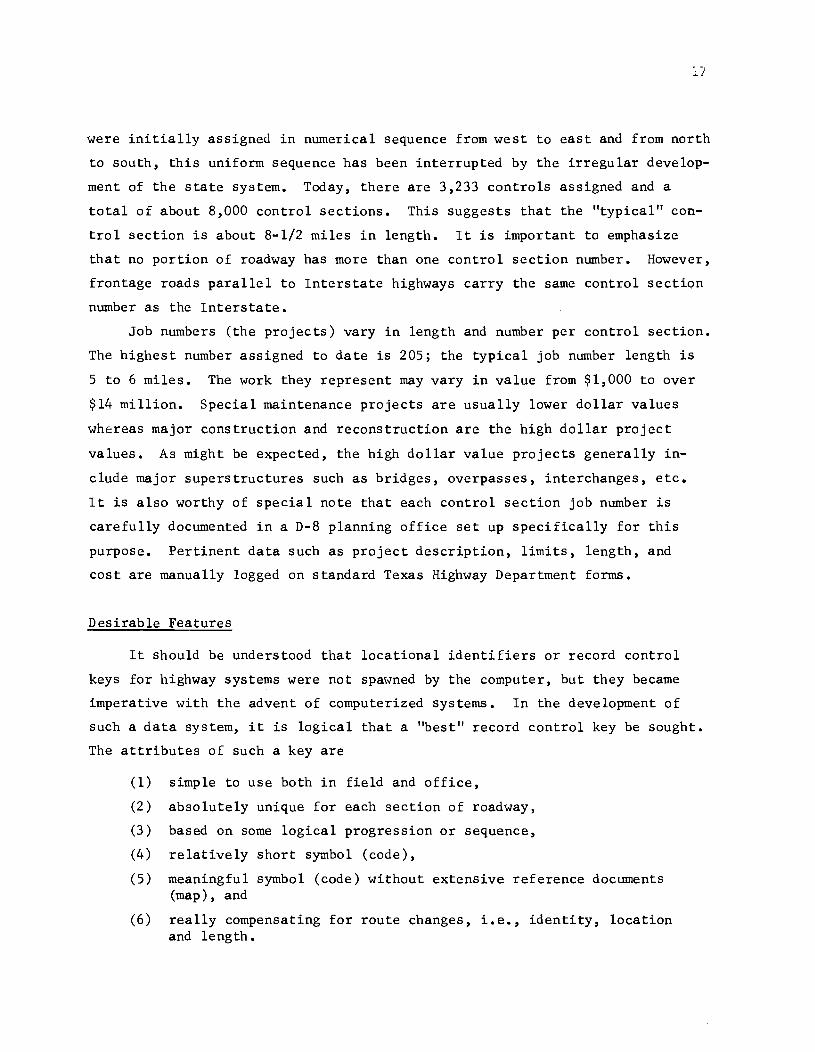
Job numbers (the projects) vary in length and number per control section.
The highest number assigned to date is 205; the typical job number length is
5 to 6 miles. The work they represent may vary in value from $1,000 to over
$14 million. Special maintenance projects are usually lower dollar values
whereas major construction and reconstruction are the high dollar project
values. As might be expected, the high dollar value projects generally in
clude major superstructures such as bridges, overpasses, interchanges, etc.
It is also worthy of special note that each control section job number is
carefully documented in a D-8 planning office set up specifically for this
purpose. Pertinent data such as project description, limits, length, and
cost are manually logged on standard Texas Highway Department forms.
Desirable Features
It should be understood that 10cationa1 identifiers or record control
keys for highway systems were not spawned by the computer, but they became
imperative with the advent of computerized systems. In the development of
such a data system, it is logical that a "best" record control key be sought.
The attributes of such a key are
(1) simple to use both in field and office,
(2) absolutely unique for each section of roadway,
(3) based on some logical progression or sequence,
(4) relatively short symbol (code),
(5) meaningful symbol (code) without extensive reference documents (map), and
(6) really compensating for route changes, i.e., identity, location and length.

In PFDS research, a thorough review was made of all known existing methods
and combinations. Some methods were strong in one area and weak in others;
Some were designed especially for item 6 above. Without resorting to any
elegant techniques of evaluation, the various methods seemed to answer all
desired attributes to about the same cumulative degree.
Because it is so different from the other methods, state plane coordinates
deserve special comment. This method exploits the power of computer plotting
techniques and possesses other characteristics so useful in many instances.
It allows unique identification of a point rather than a cross section, with
only two data values. In right-of-way and earthwork design situations, it
allows computer processed plans, thus expediting the process and reducing
manpower required. THD has a promising design system to accomplish just such
work (Ref 3, pp 155-186). However, these many advantages are offset by the
difficulty of using the method in the field. Other methods use the roadway
centerline as one 10cationa1 parameter, whereas state plane coordinates re
quire two parameters of location, north-south and east-west coordinates. This
requires elaborate control mechanisms not universally available and understood.
Other problems recognized by John A. Vance, Toronto Transportation Systems
Engineer, (Ref 82) are accuracy and data correlation. Thus, the coordinate
method is considered a future improvement with much promise but not currently
practical.
Blessing (Ref 4) concluded that the best method is a function of
(1) installation and maintenance costs,
(2) educational effort required, and
(3) flexibility of the system.
For Texas, a fourth factor had to be considered, namely, convertibility
from control section to whatever new method was selected. Closely related to
the educational aspect, convertibility specifically means that data now em
bedded in control section can be successfully tied to the new 10cationa1
identifiers.
Record Control Key Selection
During the evaluation process, a visit was made to the Wisconsin Depart
ment of Transportation (WISDOT) to discuss their newly established Highway

:L9
Network Data and Information (HNDI) System. Oddly enough, WISDOT had been
faced with the identical decision and had changed from log mile to the refer
ence point method, backed up by state plane coordinates and "project nLimbers"
(Ref 34). The back-up methods were intended to permit interaction of budget,
accounting, and engineering design systems with the HNDI data base. Their
experience was less than totally satisfactory. After considerable time and
dollar expenditures, they were unable to assimilate the historical data on
12,000 miles of State Trunk Highway. This necessitated a resurvey of the
system to obtain basic data. Furthermore, they have discovered that their
reference point method occasionally yields some strange code designations,
i.e., a "west" designation on a northbound lane of a divided highway (Ref 6).
Their system employs the directional component in the key for a divided highway,
and the anomaly occurs when the highway begins as a basic east-west roadway
but runs north-south for appreciable distances.
Despite some deficiencies, it was concluded that the Texas control sec
tion method has far too many practical advantages to consider a completely
new method. The most important advantages are:
(1) The basic data on 70,000 miles of existing highway are all tied to control section and are excellently maintained.
(2) The department procedures are now all based on control section.
(3) The control section method works.
It is concluded that the existing control section method with some additional
features should be used for PFDS.
Modifications Required
Some fundamental computer file concepts for PFDS will be presented in
Chapter 8, but it is important here to recognize two basic computer system
features that should influence development of a record key. First, the sys
tem feature called "Indexed Sequential Access Method II (ISAM) allows retrieval
of data without sequentially searching the data tape until the desired values
are encountered. To do this, the system must be given the unique (and exact)
key for the data item (example: Social Security number precisely identifies
a person). The second feature is re lated and is suggested by the word IIpre-
cisely." If the precise key is not provided, the system (ISAM) will not
function (except in specially programmed instances). Suppose, for example,
we have stored data on a bridge in our data system using the simple key of
highway number and milepoint;
IH 35 72 .553
Later, we desire to retrieve certain data on this bridge and our milepoint
measuring device yields a reading of 72.549. The system will not retrieve
the data record unless a special search mechanism is written in the program.
The MARK IV data management system does not have such a special search feature.
Therefore, it appears wise to avoid such precise components in the record key.
As mentioned previously, the key should be as simple as possible. Those
who have worked with these features in data systems will quickly agree that
the human error potential increases with complexity of the code, and the com
puter is completely intolerant of errors.
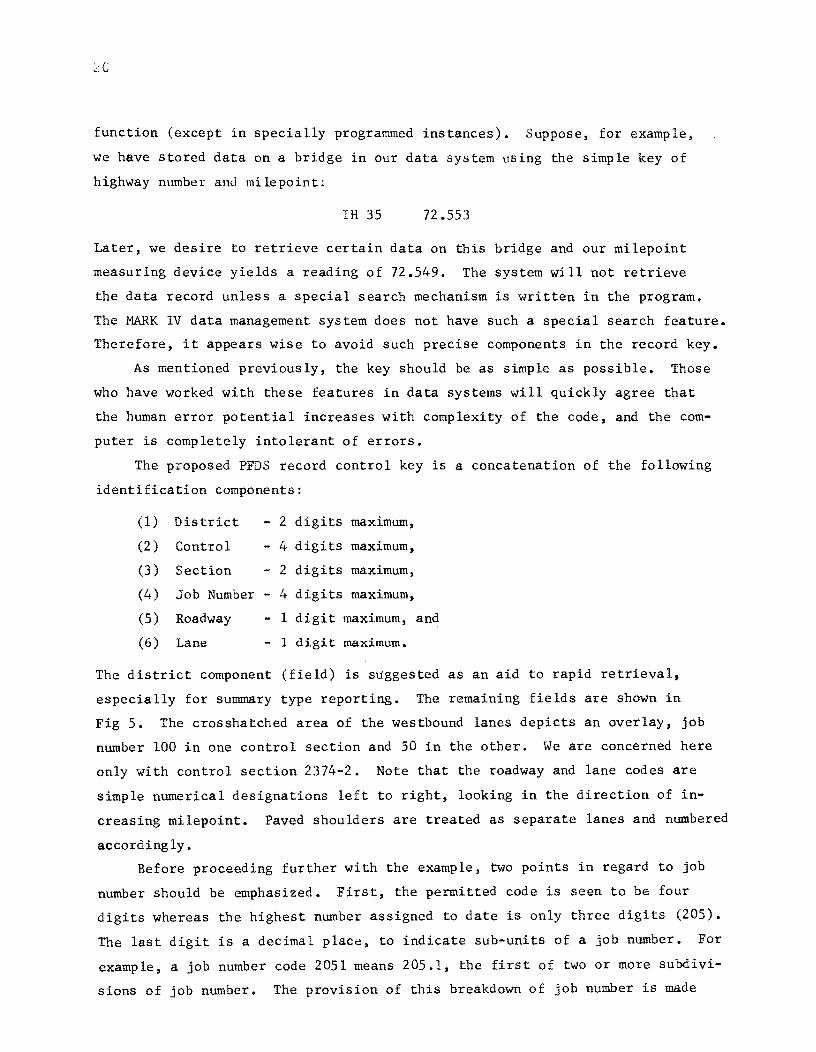
The p~oposed PFDS record control key is a concatenation of the following
identification components:
(1) District 2 digits maximum,
(2 ) Control 4 digits maximum,
(3 ) Section 2 digits maximum,
(4) Job Number 4 digits maximum,
(5) Roadway 1 digit maximum, and
(6) Lane 1 digit maximum.
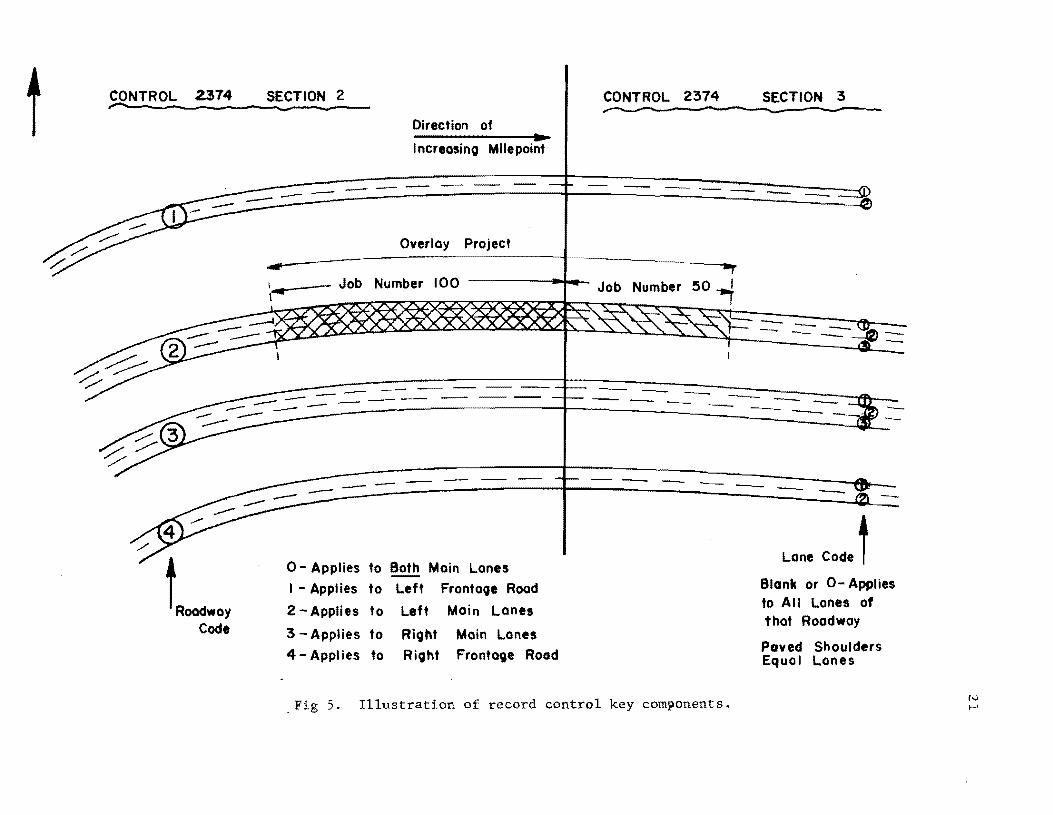
The district component (field) is suggested as an aid to rapid retrieval,
especially for summary type reporting. The remaining fields are shown in
Fig 5. The crosshatched area of the westbound lanes depicts an overlay, job
number 100 in one control section and 50 in the other. We are concerned here
only with control section 2374-2. Note that the roadway and lane codes are
simple numerical designations left to right, looking in the direction of in
creasing milepoint. Paved shoulders are treated as separate lanes and numbered
accordingly.
Before proceeding further with the example, two points in regard to job
number should be emphasized. First, the permitted code is seen to be four
digits whereas the highest number assigned to date is only three digits (205).
The last digit is a decimal place, to indicate sub-units of a job number. For
example, a job number code 2051 means 205.1, the first of two or more subdivi
sions of job number. The provision of this breakdown of job number is made
t CONTROL .2374 SECTION 2 ~ --- ----
Direction of .... CONTROL 2374
I ncreosing Milepoint
--- - --
Overlay Project
_--- Job Number 100 Job Number
-- -----
- - -~-- ---
toadwOY
0- Applies to Both Main Lones
I - Applies to Left Frontoc;ae Rood
2 -Applies to Left Main Lanes Code 3 - Applies to Right Main Lones
4 - Applies to Ric;aht Frontage Rood
. Fig 5. Illustration of record control key components.
SECTION 3
--
-- ------~::::
-Lone Code ~
Blank or 0- Applies to All Lones of that Roadway
Poved Shoulders Equal Lones

necessary to properly identify changes in design, construction, or performance
characteristics within a job number. In some cases, great variation in sub
grade materials may necessitate a change in design within the job and such
discontinuity must be recorded. In the vast majority of cases, the last place
of the job number will be zero, indicating consistent design (or construction,
etc.) for the entire job number length. In our example in Fig 5, the numbers
100 and 50 mean that job numbers 10 and 5 are consistent designs for the entire
length of the project (job number).
The second point is that the termini for job numbers are indicated by
milepoints included in the data part of the record. These essential loca
tional features are parts of a space and time component of the data record as
explained in Chapter 8.
The illustration here depicts the most complex situation probably to be
encountered in reasonable practice. If a future need is shown for collecting
and storing data for elaborate geometric situations such as interchanges, etc.,
a refined keying method may be necessary.
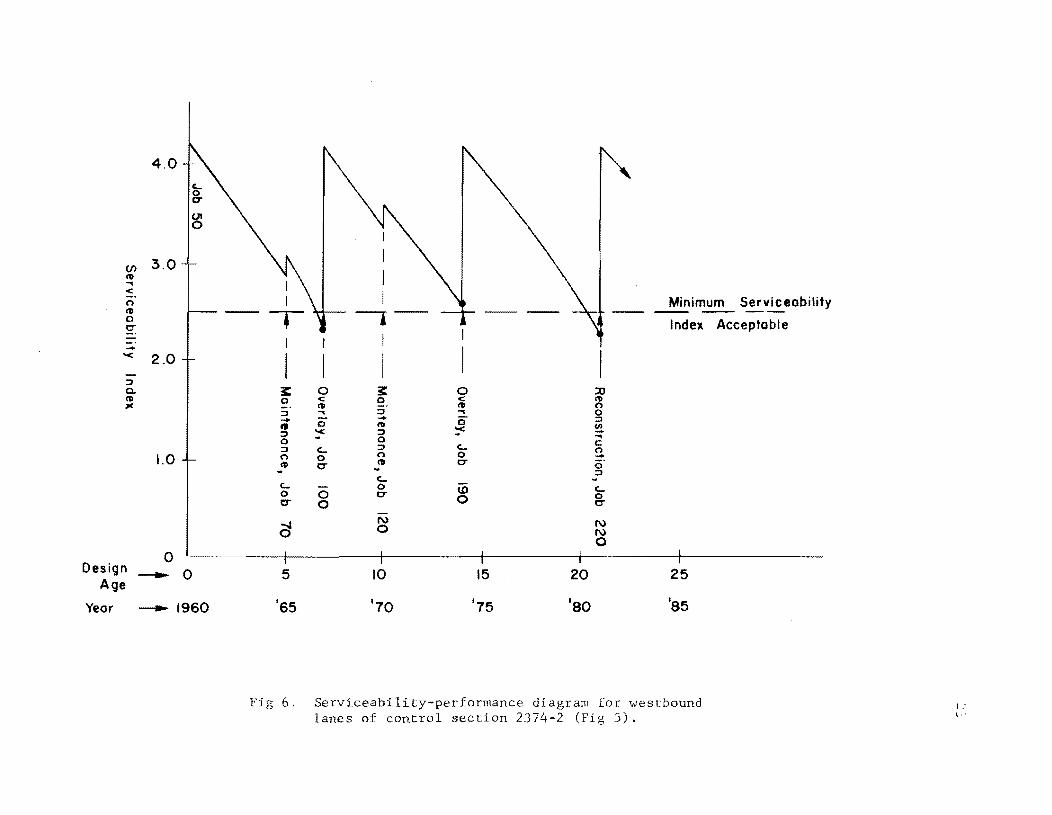
The serviceability-performance diagram for our example in Fig 5 is shown
in Fig 6. This is for the westbound lanes only. Complete reconstruction was
done as job number 50 in 1960 and brought the serviceability index (SI) up
to 4.2. In 1965, a seal coat was applied as job number 70. Performance
dropped to minimum acceptable in 1967 and an overlay was placed as job number
100, the one shown in Fig 5. Another special maintenance job and an overlay
are to be accomplished before complete reconstruction in 1981 as job number 220.
The missing job numbers (60, 80, 90, etc.) are work projects of no consequence
to the pavement engineer, such as painting centerline and edge stripes and
repair of bridge railings.
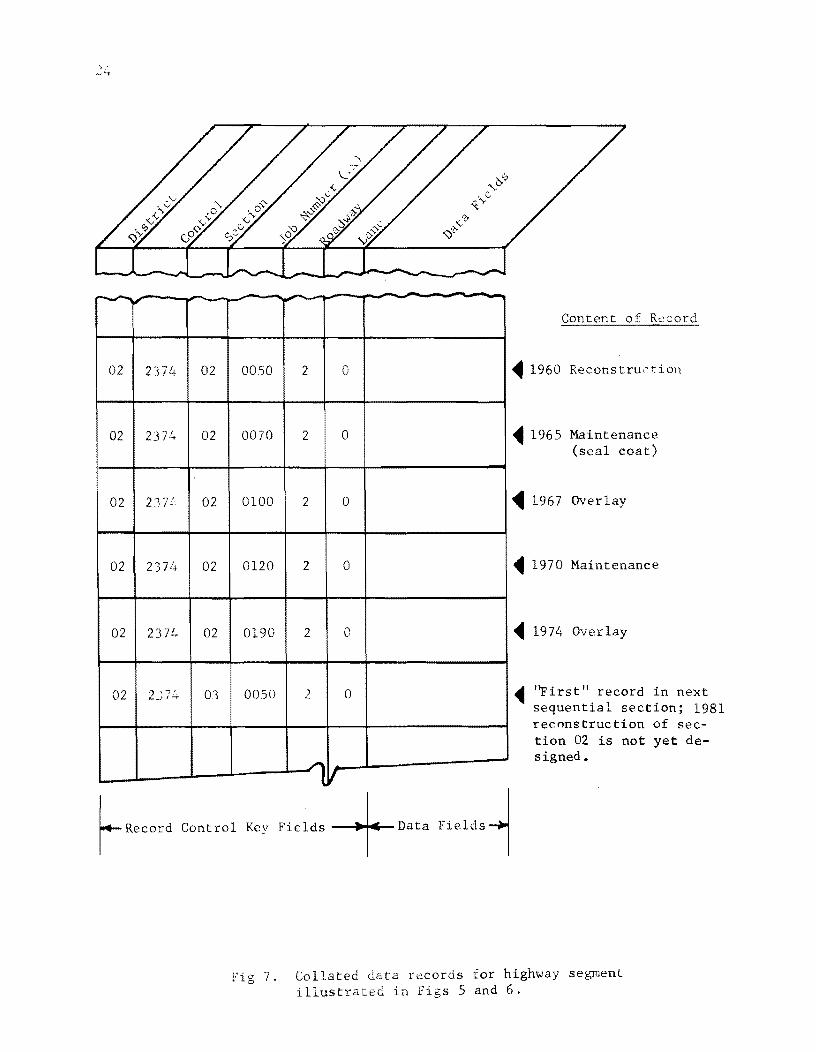
The collated data records for this pavement segment are illustrated in
Fig 7. The district is number 2 in this case. It is seen that each record
contains data on a unique segment of roadway at a unique time (occurrence of
event).
Some meditation on this system of record control will generate the ques
tion as to how succeeding data entries are made. For example, if one of the
data fields is serviceability index (SI), we may wish to enter 10 such readings
each year for 20 years on our particular road segment. These additional data
values will be contained in a supplementary file with a record key basically
4.0
(f) 3.0 I'D .... < n I'D 0 0""
-'< 2.0 ::l c.. I'D
""
1.0
0 Design -..... 0
Age
Year ---- 1960
I
I I I Minimum Serviceability
-- -----.- Index Acceptable
J:: 0 J:: 0 :::0 0 < 0 < I'D
I'D I'D n ::l .... ::l .... 0 -. 0"" - 0"" ::l It I'D
'< UI ::l '< ::l -0 0 ....
C ::l c- ::l c- n n 0 n 0 -I'D 0"" I'D 0"" o· - c- ::l
c- o iD c-o 0 0- 0 0 0"" 0 0""
a N N 0 N 0
5 10 15 20 25
'65 '70 '75 'SO 'S5
Fig 6. Serviceability-performance diagram for westbound lanes of control section 2374-2 (Fig 5).
~r'-
02 2374 02 0050
02 2374 02 0070
02 237 f . 02 0100
02 237[f 02 0120
02 2374 02 0190
02 2J7~ 03 0050
".-
2
2
2
2
2
2
1 I(
-
0
0
0
0
0
0
~ 1960 Reconstru~tion
~ 1965 Maintenance (seal coat)
~ 1967 Overlay
~ 1970 Maintenance
~ 197f t Overlay
~ ''First'' record in next sequential section; 1981 reconstruction of section 02 is not yet designed.
~Record Control Key Fields +oata Fields1
Fig 7. Collated data records for highway segment illustrated in Figs 5 and 6.

25
the same as the master record. Explanation of this situation is provided in
Chapter 8; it is sufficient here to recognize that no radical changes in method
are needed to meet such situations.
Although this proposed record control key is believed to be sufficiently
definitive for PFDS at this point, it should be observed that one additional,
one-digit, field \vill specify wheel path also. The concept used in roadway
and lane designations is equally applicable \vith no difficulty. It is also
important to mention in passing that the roadway designation coding proposed
here is analogous to a data field called "Travel Class" in the D-10 Road Life
(RL-l) file (see Chapter 6).
It is especially important to recognize an important benefit to be ac
crued with this proposed record control key. As discussed in Chapter 6, some
esp~cially applicable and valuable data files now being maintained by the
Planning Survey (D-10) Division are keyed with control section and milepoint,
and in some cases, with job number as an added field. This means that con
ditions are present for complete compatibility of files, i.e., PFDS with
existing D-10 files.
Conclusions
As a concluding thought, it has been suggested that certain deficiencies
in the actual use of the control section and milepoints (or mileposts) have
made the method less than completely effective. For example, there are re
ported instances where mileposts have not been changed from the old south to
north increasing sequence. Others have reported that mileposts are missing,
thus making field locational identifications difficult or impossible. It is
axiomatic that no system or method, however good in concept, can work if not
fully implemented. Certainly, the system most easily understood has a better
chance of working than a new method which must be learned. It then becomes
a matter of making existing methods work in accordance with established di
rectives.

!!!!!!!!!!!!!!!!!!!"#$%!&'()!*)&+',)%!'-!$-.)-.$/-'++0!1+'-2!&'()!$-!.#)!/*$($-'+3!
44!5"6!7$1*'*0!8$($.$9'.$/-!")':!

CHAPTER 5. SELECTION OF PFDS ESSENTIAL FACTORS
Introduction and Background
The preceding discussion of management information systems (MIS) has
stressed simplicity and the importance of collecting and storing only relevant
data. A tenacious effort has been made to abide by these principles in the
PFDS research. Like business executives, engineers have often been drowned
in information, and the result may be manifested somewhat in the lingering
reluctance highway engineers have for using computer-based information systems.
Stacks of unused computer output have all too frequently been the visible
evidence of a working MIS. The HRB Workshop on Structural Design of Asphalt
Concrete Pavement Systems (Ref 37) recognized this situation as "data pol
lution" and concluded that it is a primary factor in abuse and misuse of data
systems. Thus, this stage of PFDS development is perhaps the most important
of all. The term "essential" has therefore been employed to convey the idea
that only those factors absolutely necessary for an operating feedback data
system are to be included. The decisions to exclude are difficult ones.
Relation to Other Functions
Before proceeding further, explicit recognition of the pavement design
engineer's part in the overall highway system may serve to abate fears that
disproportionate influence upon management is sought. While the service
ability of the highway system, as discussed herein, is the riding quality of
the surface as expressed by serviceability index (SI), it is fully acknowledged
that there is much more to the problem than the pavement system (or subsystem).
Just as there are many types of highway maintenance efforts that have nothing
to do with the pavement, so are there many considerations other than pavement
structural adequacy that determine when a highway must be reconstructed.
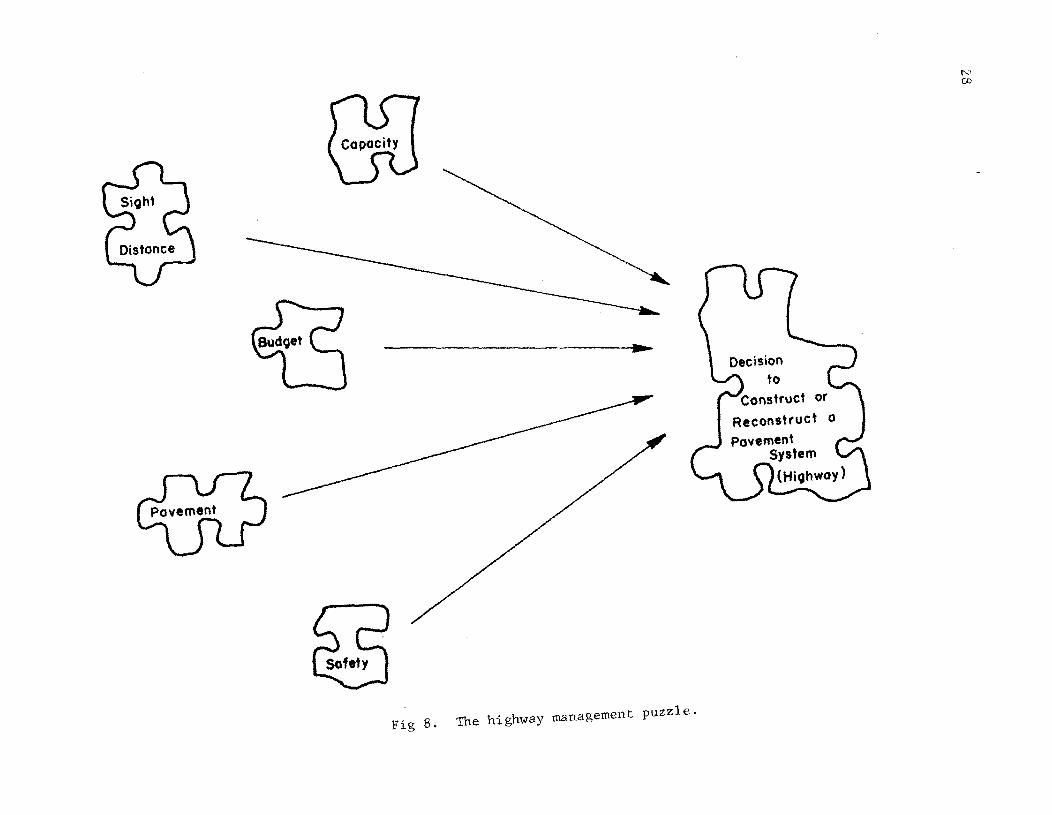
Figure 8 illustrates some elements of this puzzle. The highway system managers
use all the pieces to arrive at a decision. It is not an objective herein to
suggest the relative sizes of these pieces of the puzzle. All efforts are
27
....
Fig 8. The highway management puzzle.
29
bent to furnishing the best possible pav~lent piece, one that is derived from
logical analysis of the synergy of the pavement system components.
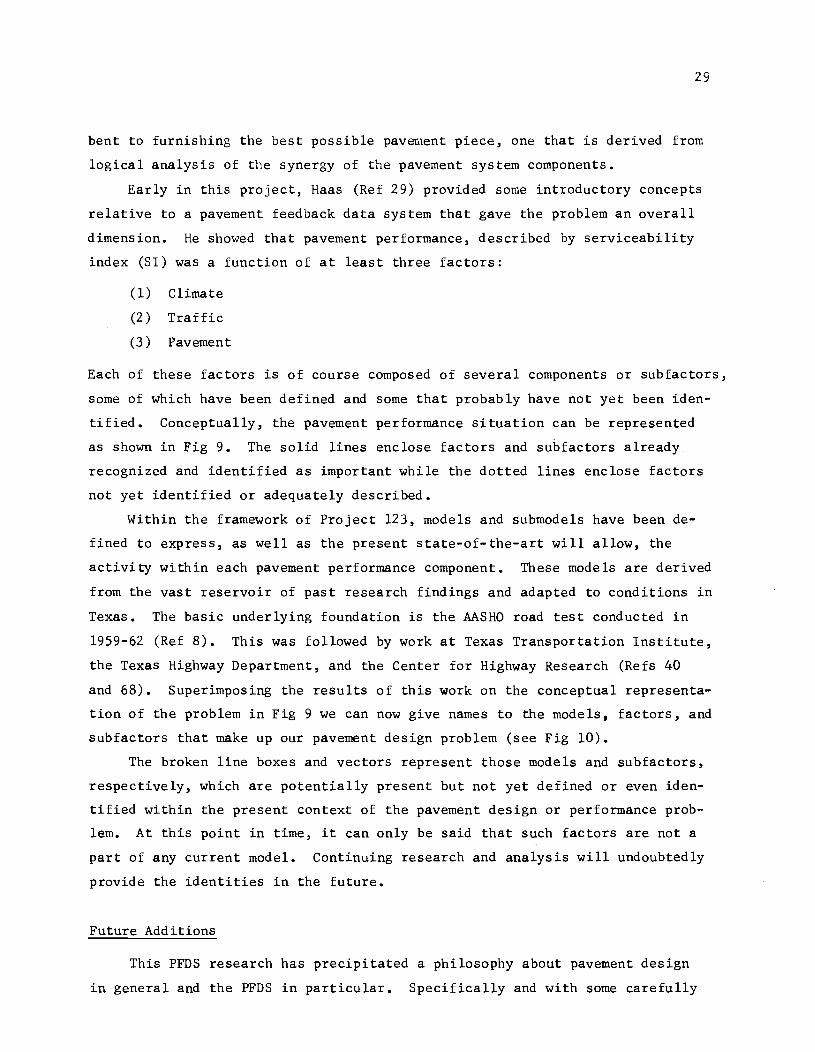
Early in this project, Haas (Ref 29) provided some introductory concepts
relative to a pavement feedback data system that gave the problem an overall
dimension. He showed that pavement performance, described by serviceability
index (SI) was a function of at least three factors:
(1) Climate
(2) Traffic
(3) Pavement
Each of these factors is of course composed of several components or subfactors,
some of which have been defined and some that probably have not yet been iden
tified. Conceptually, the pavement performance situation can be represented
as shown in Fig 9. The solid lines enclose factors and subfactors already
recognized and identified as important while the dotted lines enclose factors
not yet identified or adequately described.
Within the framework of Project 123, models and submodels have been de
fined to express, as well as the present state-of-the-art will allow, the
activity within each pavement performance component. These models are derived
from the vast reservoir of past research findings and adapted to conditions in
Texas. The basic underlying foundation is the AASHO road test conducted in
1959-62 (Ref 8). This was followed by work at Texas Transportation Institute,
the Texas Highway Department, and the Center for Highway Research (Refs 40
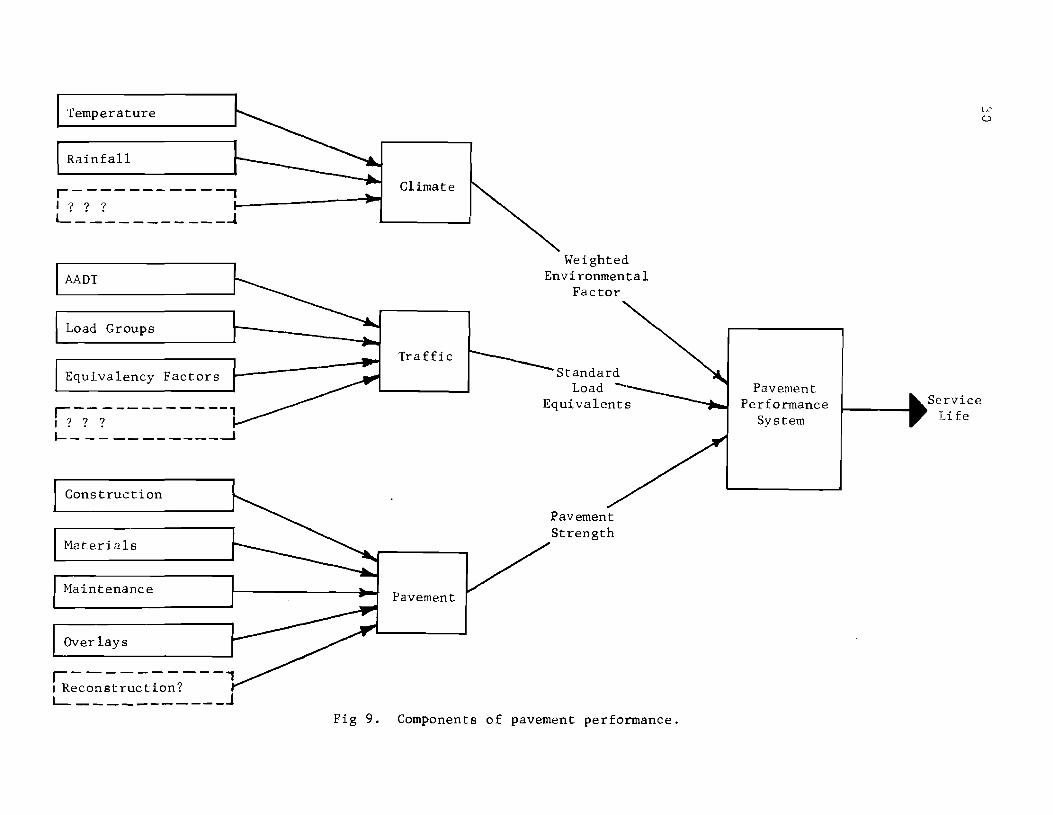
and 68). Superimposing the results of this work on the conceptual representa
tion of the problem in Fig 9 we can now give names to the models, factors, and
subfactors that make up our pavement design problem (see Fig 10).
The broken line boxes and vectors represent those models and subfactors,
respectively, which are potentially present but not yet defined or even iden
tified within the present context of the pavement design or performance prob
lem. At this point in time, it can only be said that such factors are not a
part of any current model. Continuing research and analysis will undoubtedly
provide the identities in the future.
Future Additions
This PFDS research has precipitated a philosophy about pavement design
in general and the PFDS in particular. Specifically and with some carefully
Temperature
Rainfall
Climate r---- --- -- ---, I ? ? ? ~-------.... ., L_·_" ______ ___ ...l
AADT
Load Groups
Equivalency Factors
r-- ----- -----, , ? ? ? I-- __ ___ ______ --.l
Construction
Haterials
Haintenance
Overlays
r----------, , Reconstruction? L. ___________ J
Traffic
Pavement
Weighted Environmental
Factor
Equivalents
Pavement Strength
Fig 9. Components of pavement performance.
Pavement Performance
System
Service Life
(" .. ':' o

Max & Min Daily Temp.
,------------, I Weather Factor X 1--· L _____ ________ ....1
,------------ -j,' I Weather Factor Y r L ____ -. __ ..,... ____ --'
Loadometer Data
Growth Rate
Design Life I I ,
r------------.." I Traffic Factor X r L ____________ ..a
Stiffness Coefficient
Layer Thickness .- ----- ------"", I Material Parameter X r L ____________ ...J
Swell Probability
Potential Vertical Rise
Swell Rate Constant
Climatic Model
Traffic Model
Deflection Model
Swelling Clay
Model
-a
N
Qsc
Cl'
K
S
T
Legend:
:::: l8-kip single axles
service loss due to swelling clay
:::: district temperature constant
= regression constant
surface curvature index
= service 1 He
Performance Model
Service
T
Fig 10. Flexible pavemen~ system (FPS) design components.

32
selected exceptions, the variables or factors identified in the described
process of model analysis are the only ones for which data will be collected
and stored at the start. As pointed out in Chapter 2, the initial goal of
PFDS is to provide fundamental research and management tools, later maturing
into a design and more complete management complement. However, the first
data inserted into PFDS will be used primarily for select management functions
and to check the various design models. During this model checking process,
it is important that results of other, even though directly related, research
in-progress not be inserted into the operational design methods until a dis
tinct need for such is indicated by performance data. Even though some theo
retical breakthroughs may be apparently concluded during this period of
performance data collection and analysis, implementation should be effected
only upon demonstration of an omission or change in performance prediction
that call for a rational revision to the applicable model(s). Such a policy
should help to prevent premature changes in design procedures and assure that
modifications to models are made in the proper priority.
Some research in progress can be used to illustrate this point. M. Y.
Shahin, a graduate student on Project 123 at The University of Texas, has
developed distress prediction models for asphalt pavements that may soon allow
refinement of design techniques to limit temperature cracking (Ref 70). This
research is an attempt to quantify the solution to a problem which has plagued
engineers for years. However theoretically sound it may now appear, no at
tempt should be made to introduce the models into operational design systems
until they are verified by performance data. In many respects, operational
design systems are also experimental processes and introduction of new factors
and models before performance feedback is acquired simply enlarges the in
ference space and introduces new and unknown interactions. In other words,
while the pavement engineer may have a reliable estimate of the direction in
which he is headed or diverted, he cannot be sure of his starting pOint. If
PFDS is allowed to function in conjunction with the operational pilot design
system, a reliable origin can be established and the engineer may proceed
more accurately toward his goal.
Current Design System
The current operational pilot design procedure for flexible pavements
used by THD is designated FPS-ll and uses the inputs shown in Table 1. The
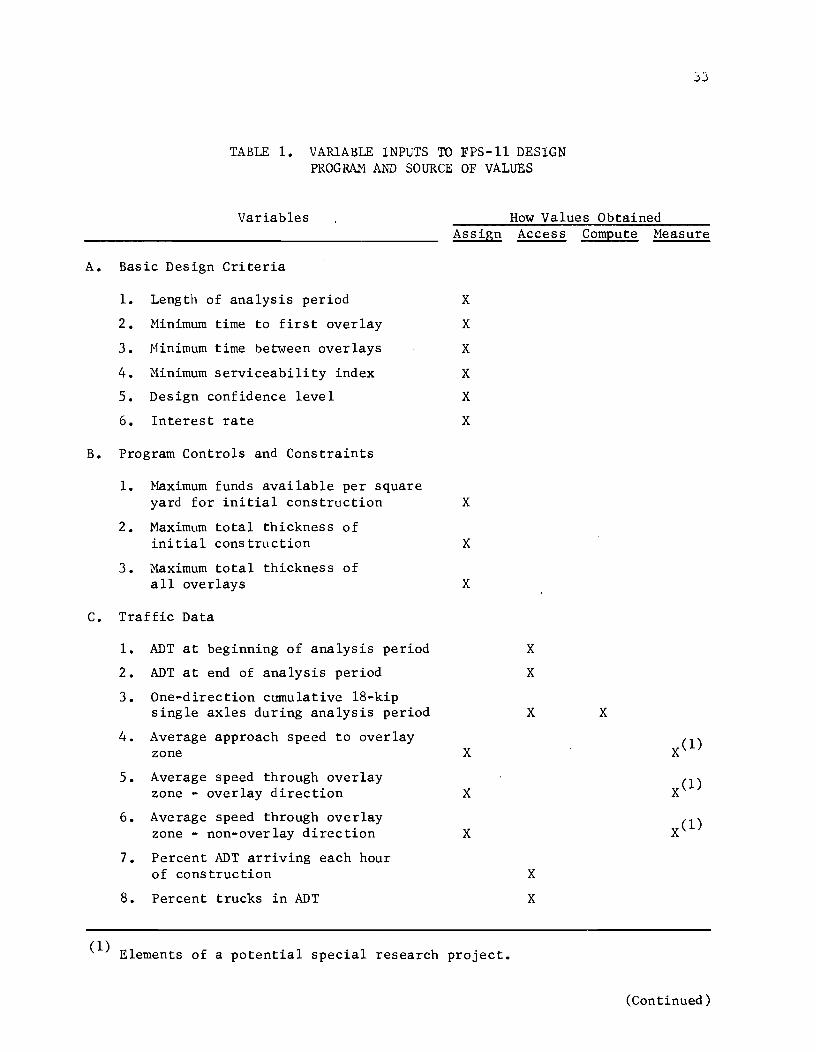
TABLE 1. VARIABLE INPUTS TO FPS-ll DESIGN PROGRAM AND SOURCE OF VALUES
33
Variables How Values Obtained Assign Access Compute Measure
A. Basic Design Criteria
1. Length of analysis period
2. Minimum time to first overlay
3. Minimum time between overlays
4. Minimum serviceability index
5. Design confidence level
6. Interest rate
B. Program Controls and Constraints
1. Maximum funds available per square
x X
X
X
X
X
yard for initial construction X
2. Maximum total thickness of initial construction X
3. Maximum total thickness of all overlays X
C. Traffic Data
1. ADT at beginning of analysis period
2. ADT at end of analysis period
3. One-direction cumulative 18-kip single axles during analysis period
4. Average approach speed to overlay zone
5. Average speed through overlay zone - overlay direction
6. Average speed through overlay zone - non-overlay direction
7. Percent ADT arriving each hour of construction
8. Percent trucks in ADT
X
X
X
(1) Elements of a potential special research project.
X
X
X
X
X
X
(Continued )
34
TABLE 1. (Continued)
Variables How Values Obtained Assign Access Compute Measure
D. Environment and Subgrade
1. District temperature constant
2. Swelling probability - clay subgrade
3. Potential vertical rise - clay subgrade
4. Swelling rate constant - clay subgrade
5. Subgrade stiffness coefficient
E. Construction and Maintenance Data
x
1. Initial serviceability index X(3)
2. Serviceability index after overlaying X(3)
3. Minimum overlay thickness X
4. Overlay construction time X
5. Asphalt concrete compacted density X
6. Asphalt concrete production rate
7. Width of each lane
8. First year cost of routine maintenance
9. Incremental increase in maintenance cost per year
F. Detour Design for Overlays
1. Detour model used during overlay X
2. Total number of lanes of the facility
(1) Elements of a potential special research project.
x
x
X
X X
X
X·
x
x
X
X
X
X
(2) Adjusted values may be computed from maximum and minimum daily temperatures for the specific locality.
(3) For design purposes.
(4) In Road Life file (RL-l) as plan quantity; see Chapter 6. (Continued)
35
TABLE 1. (Continued)
Variables How Values Obtained Assign Access Compute Measure
3. Number of lanes open in the overlay direction
4. Number of lanes open in the non-overlay direction
5. Distance traffic is slowed -overlay direction
6. Distance traffic is slowed -non-overlay direction
7. Detour distance around the overlay zone
G. Existing Pavement and Proposed ACP
1. SCI of existing pavement
2. Standard deviation of SCI
3. Composite thickness of existing pavement
4. In-place cost (compacted) C.Y. of proposed ACP
5. Proposed ACP's salvage value as percent of original cost
6. In-place value of existing pavement-compacted C.Y.
7. Existing pavement's salvage value as percent or present value
8. Level-up required for the first overlay
9. Number of years existing pavement has been open to traffic
H. Paving Material Information (All for each material to be considered in design.)
1. Layer designation
x
x
x
x
x
x
x
x
x
x
x
(1) Elements of a potential special research project.
x
x
(4) In Road Life file (RL-l) as plan quantity; see Chapter 6.
x
x
x
(Continued)
36
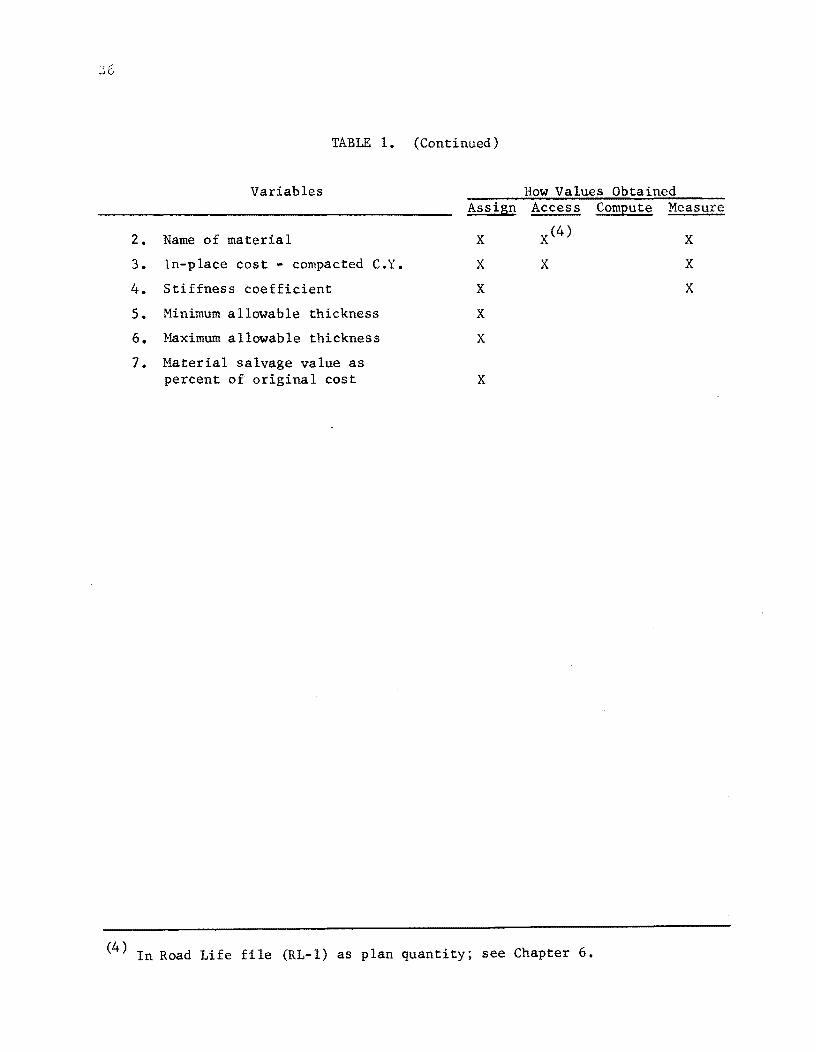
TABLE 1. (Continued)
Variables How Values Obtained Assisn Access ComEute Measure
2. Name of material X x(4) X
3. In-place cost - compacted C. y. X X X
4. Stiffness coefficient X X
s. Minimum allowable thickness X
6. Maximum allowable thickness X
7. Material salvage value as percent of original cost X
(4) In Road Life file (RL-l) as plan quantity; see Chapter 6.

37
background and explanation of this computerized design system are contained
in a report entitled "A Systems Approach App lied to Pavement Design and Re
search" (Ref 40). Also shown is the probable source of the data values. The
following definitions regarding how values are obtained apply:
"Assign" means that values are selected by the designer based on engineering judgment or as reasonable program constraints to prevent unreasonable design results.
"Access" means that values are obtained from existing data sources such as the THD D-lO, D-8, or D-18 data files.
"Compute" means that values are obtained from computation upon raw data either accessed or measured.
''Measure'' means that field sampling of data values is or will be necessary.
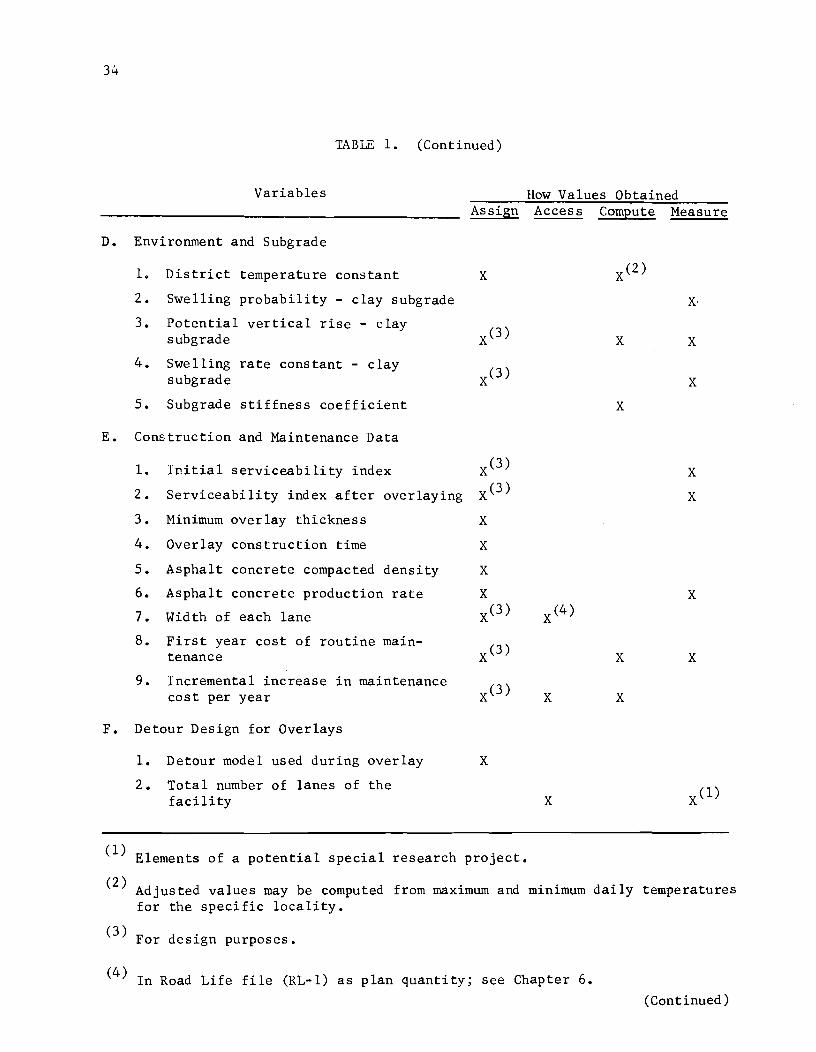
It will be noted on the second page of the table that certain variables (marked
by note 2) are shown to have values "assigned" as well as "measured." This
situation occurs whenever insufficient performance (measured) data is available,
or whenever two different times in the design, construction and performance
process are inherent in the particular variable values. An example of this
is initial serviceability index, 1 in group E. A design value, which repre
sents the mean value for new flexible pavements in Texas, will be assigned.
When the pavement is constructed, the actual serviceability index will be
measured and compared to the design value. The resulting difference is a
measure of the variability in construction practices and techniques.
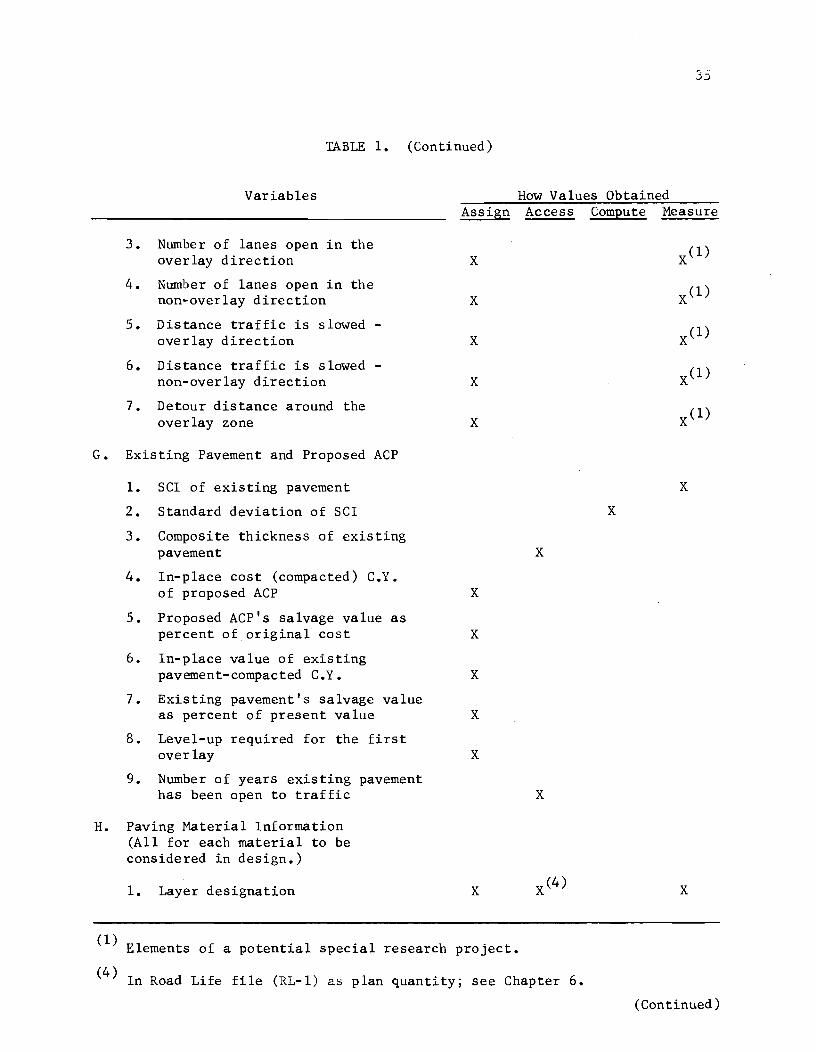
Future Research Projects
Under groups C and F of Table 1, nine variables are designated as poten
tial special research items for measurement (note 1). All of these items are
used to compute the "user-costs" incurred during overlay projects at one or
more times in the future use of the particular highway system (Ref 67). The
user-cost models tend to oversimplify a very complex situation and this whole
matter could easily use a separate research effort. Instead of collecting
data on every detour used in practice, a well-designed experiment will probably
yield more discernible results in a more efficient manner.
The note 4 refers to the Road Life file (RL-l) of D-IO. This file will
be discussed in detail in Chapter 6; however, at this point, it is sufficient
to recognize that the indicated variables are currently included in an existing
38
file and the data should serve adequately for future reliability and stochastic
research within Project 123.
Essential Factors for PFDS
The basis for variables to be included in PFDS must necessarily Come from
FPS-ll; input variables to that program are the basic essential factors for
PFDS. However, these factors have both a time and space dimension that must
also be sampled. All factors will exhibit variability as we progress down a
roadway; for example, as-built surface thickness will vary around Some mean
value, possibly the design or plan quantity. Other factors will vary with
time; for example, serviceability index will tend to decline with time from
some high initial value. The handling of this situation will be evident in
the discussion of the PFDS files later in the chapter. The acquisition of
time-dependent data values is also discussed in Chapters 4 and 8.
Specific recognition of the time and space dimensions of the factors,
and the formation of a plan to sample accordingly, provides the raw data
needed to further the probabilistic and reliability concepts now being actively
pursued in the Flexible Pavement System (FPS) (Refs 13 and 15). Darter (Ref
14) considers three types of variability in his reliability concepts
(1) variability within a project such as pavement thickness, material strength, etc.;
(2) variability between design (plan) quantities and as-built values; and
(3) variability due to lack-of-fit of design models in FPS-ll.
Recognition of these sources of variation serves as an important second devel
opment parameter for PFDS, specifically, the need to be adequately responsive
to the active research in reliability and stochastic applications in FPS.
Just as important in any sampling plan is the determination of methods
or techniques for taking data measurements. The methods must be standardized
in so far as possible so that direct comparisons are valid. For example, the
serviceability index of all highways must be determined by devices all cali
brated to a common reference device. This is done in the Texas method (see
Ref 85). Another example is the Texas Triaxial Class, a material property
that is fundamental to a standard design procedure used in Texas (Ref 74).
Because the cost of this test is high, the triaxial class is often determined

from one of several possible "shortcut" techniques. Therefore, the record
must specify the method which was actually used. This is discussed in more
detail in Chapter 7.
Undefined 1nf luences Upon Perfo.rmance
Before proceeding to definition of the proposed PFDS files and essential
factors, it will be helpful to examine again the typical serviceability/per
formance diagram shown in Fig 6 of Chapter 4. Each of the abrupt increases
in the performance index values represents an event that should be recorded
to permit complete subsequent analysis of the pavement system. Seal coats
and overlays are certainly two significant events to record. Beyond those
two, however, problems are promptly faced. Hhat maintenance work affects
the serviceability/performance life to an extent that it should be recorded
for analysis? How much cracking must exist before sealing becomes significant?
Cracking influence upon present serviceability index (Sl) was quantified in
the AASHO Road Test equations (Ref 8) but no satisfactory method of relating
distress to performance (failure) has been derived. When sufficient data are
collected, researchers will be in a position to ascertain this relationship
more readily. The potentials of PFDS are described in Chapter 9.
The same thing can be said for other types of distress upon which im
portant maintenance is performed. The Texas Highway Department Maintenance
Manual (Ref 75) recognizes five types of asphaltic concrete distress and pre
scribes repair and prevention methods. Most of these maintenance and repair
efforts will be specifically identified and pursued as individual job numbers
in the regular THD accounting system, as discussed in Chapter 4, and the basic
parameters of cost and general description can be easily included in PFDS.
However, a distress survey something like that now being proposed in a new
research study (Ref 57) is needed. The findings should be implemented as a
future revision to the PFDS files and essential factors. In summary, it is
fully acknowledged that maintenance efforts are very important in pavement
performance and life, but until the significant factors can be explicitly de
fined in the FPS context, detailed distress and maintenance data collection
and storage are premature. During the interim, maintenance costs can serve
as a substitute parameter to measure distress.
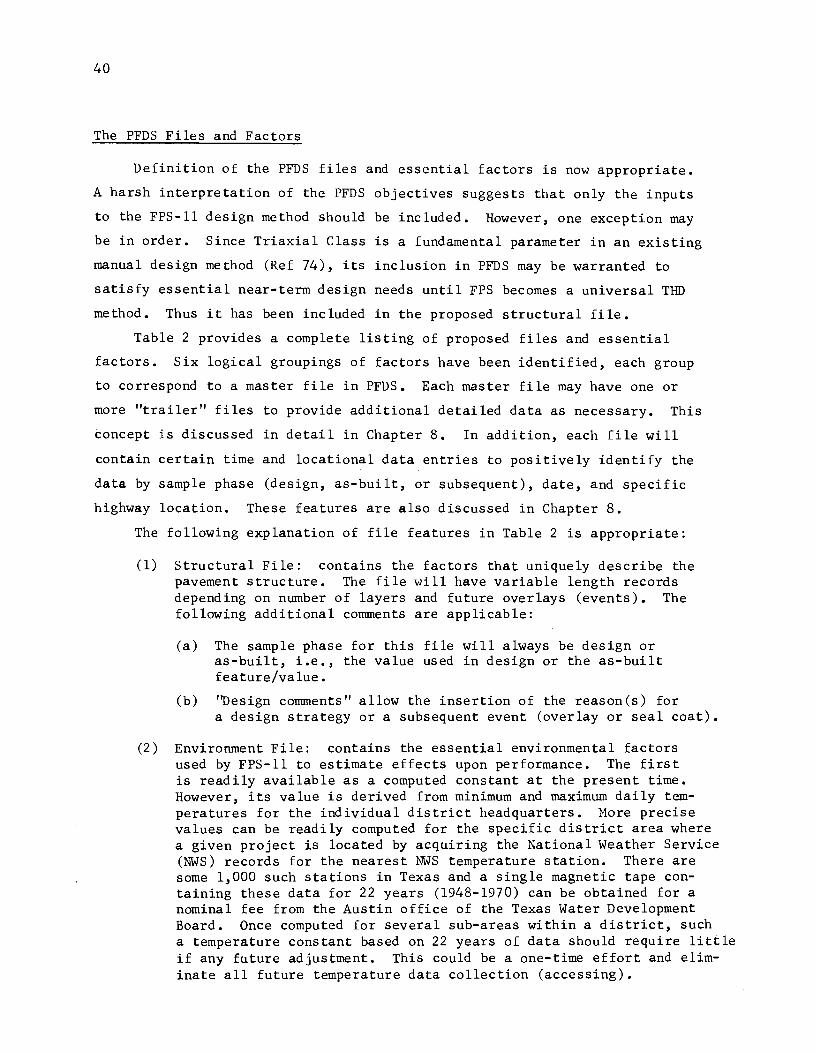
40
The PFDS Files and Factors
Definition of the PFDS files and essential factors is now appropriate.
A harsh interpretation of the PFDS objectives suggests that only the inputs
to the FPS-ll design method should be inc luded. However, one excepti.on may
be in order. Since Triaxial Class is a fundamental parameter in an existing
manual design method (Ref 74), its inclusion in PFDS may be warranted to
satisfy essential near-term design needs until FPS becomes a universal THD
method. Thus it has been included in the proposed structural file.
Table 2 provides a complete listing of proposed files and essential
factors. Six logical groupings of factors have been identified, each group
to correspond to a master file in PFDS. Each master file may have one or
more "trailer" files to provide additional detailed data as necessary. This
concept is discussed in detail in Chapter 8. In addition, each file will
contain certain time and locational data entries to positively identify the
data by sample phase (design, as-built, or subsequent), date, and specific
highway location. These features are also discussed in Chapter 8.
The following explanation of file features in Table 2 is appropriate:
(1) Structural File: contains the factors that uniquely describe the pavement structure. The file will have variable length records depending on number of layers and future overlays (events). The following additional comments are applicable:
(a) The sample phase for this file will always be design or as-built, i.e., the value used in design or the as-built feature/value.
(b) ''Design comments" allow the insertion of the reason (s) for a design strategy or a subsequent event (overlay or seal coat).
(2) Environment File: contains the essential environmental factors used by FPS-ll to estimate effects upon performance. The first is readily available as a computed constant at the present time. However, its value is derived from minimum and maximum daily temperatures for the individual district headquarters. More precise values can be readily computed for the specific district area where a given project is located by acquiring the National Weather Service (NWS) records for the nearest NWS temperature station. There are some 1,000 such stations in Texas and a single magnetic tape containing these data for 22 years (1948-1970) can be obtained for a nominal fee from the Austin office of the Texas Water Development Board. Once computed for several sub-areas within a district, such a temperature constant based on 22 years of data should require little if any future adjustment. This could be a one-time effort and eliminate all future temperature data collection (accessing).
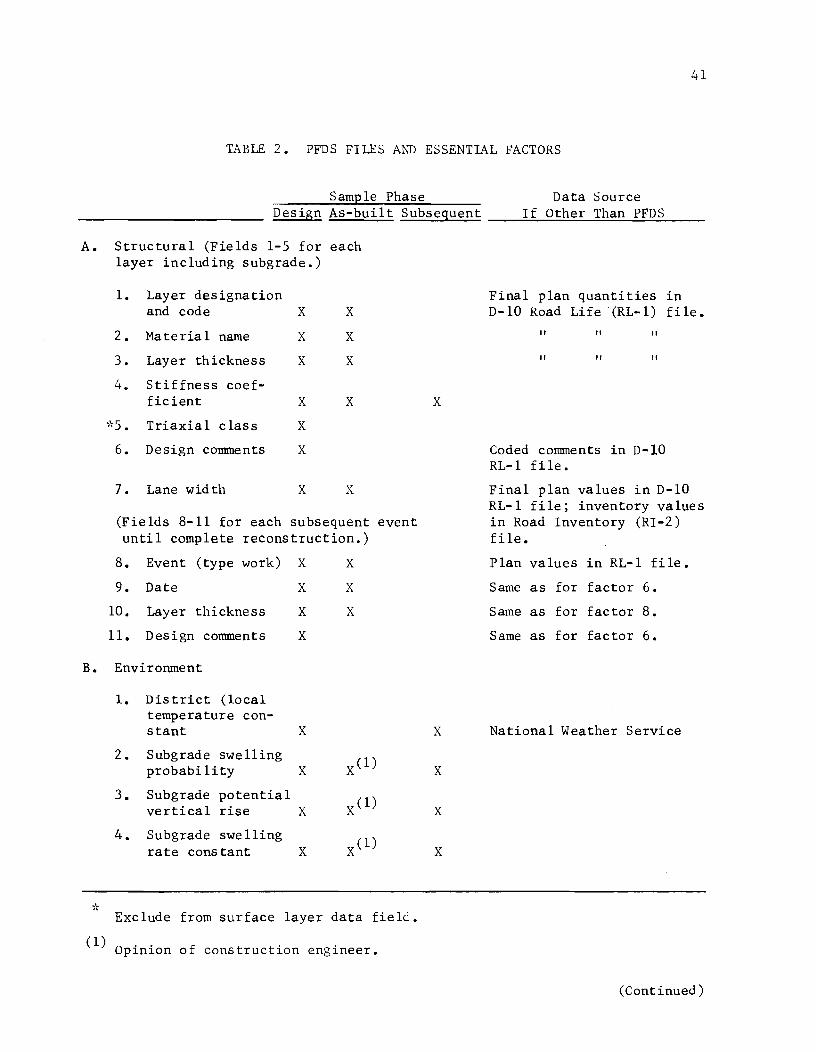
41
TABLE 2. PFDS FILES A~~ ESSENTIAL FACTORS
Sample Phase Data Source Design As-built Subsequent ____ ~I~f~O~t~h~e~r~T~h~a=n=_P~F~D~S ____ _
A. Structural (Fields 1-5 for each layer including subgrade.)
1. Layer designation and code X
2. Material name
3. Layer thickness
4. Stiffness coefficient
X
X
X
*5. Triaxial class X
6. Design comments X
7. Lane width X
X
X
X
X
X
(Fields 8-11 for each subsequent event until complete reconstruction.)
8. Event (type work) X
9. Date X
10. Layer thickness X
11. Design comments X
X
X
X
B. Environment
* (1)
1. District (local temperature constant
2. Subgrade swelling
X
probability X
3. Subgrade potential vertical rise X
4. Subgrade swelling rate constant X
Exclude from surface layer data field.
Opinion of construction engineer.
X
X
X
X
X
Final plan quantities in D-lO Road Life (RL-l) file.
" " " " " "
Coded comments in D-IO RL-l file.
Final plan values in D-lO RL-l file; inventory values in Road Inventory (RI-2) file.
Plan values in RL-l file.
Same as for factor 6.
Same as for factor 8.
Same as for factor 6.
National Weather Service
(Continued)
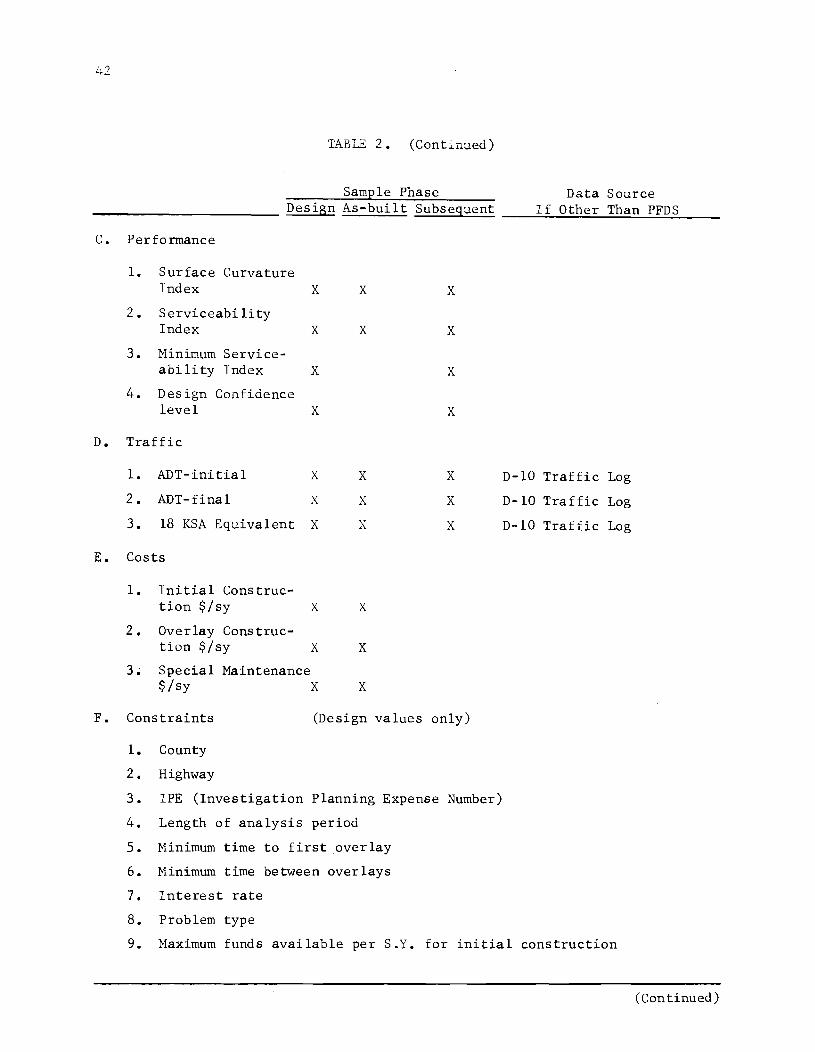
C.
D.
E.
TABLE 2. (Continued)
Sample Phase Data Source Design As-built Subsequent ____ ~I~f~O~t~h~e~r~T~h~a~n~P~F~D~S~ __ __
Performance
1. Surface Curvature Index
2. S erviceabi li ty Index
3. Minimum Service-ability Index
4. Design Confidence level
Traffic
1. ADT-initial
2. ADT-final
3. 18 KSA Equivalent
Costs
1. Initial Construc-tion $/sy
2. Overlay Construc-tion $/sy
3~ Special Maintenance $/sy
X
X
X
X
X
X
X
X
X
X
X
X
X
X
X
X
X
X
X
X
X
X
X
X
X
D-10 Traffic Log
D-10 Tra ffic Log
D-10 Traf fic Log
F. Constraints (Design values only)
1. County
2. Highway
3. IPE (Investigation Planning Expense Number)
4. Length of analysis period
5. Minimum time to first overlay
6. Minimum time between overlays
7. Interest rate
8. Problem type
9. Maximum funds available per S.Y. for initial construction
(Continued)
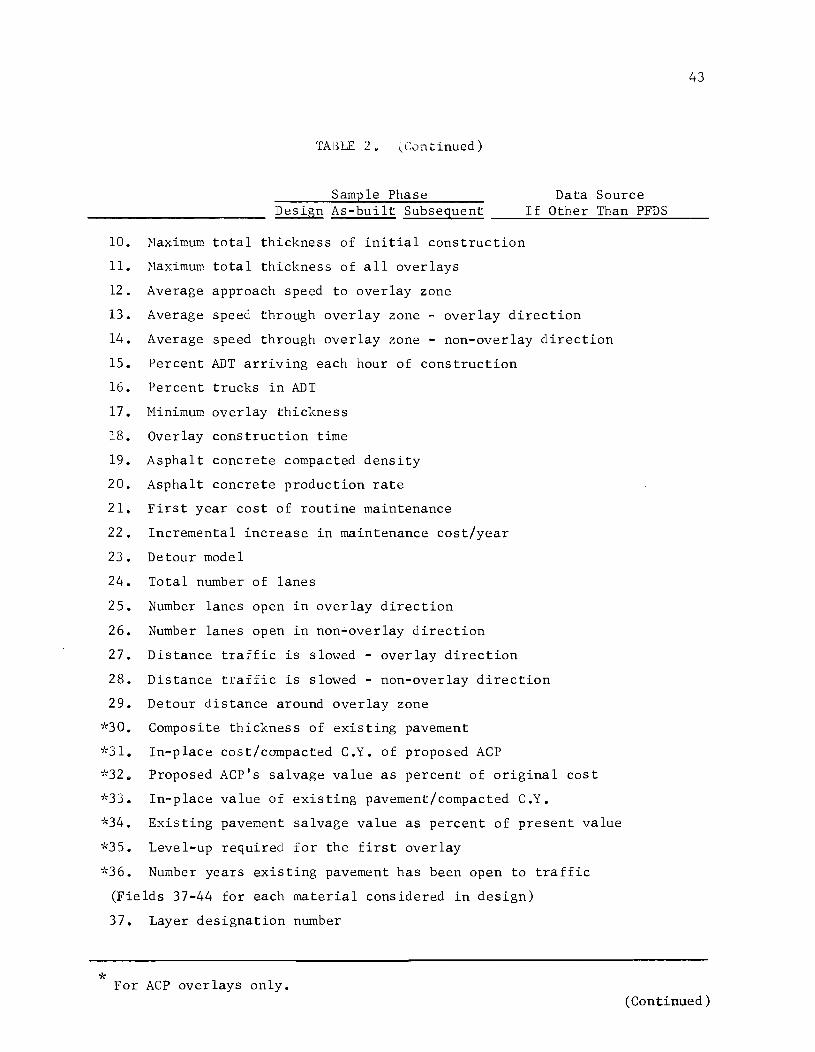
43
TABLE 2. (Continued)
Sample Phase Data Source Design As-built Subsequent ____ ~I~f~O~t~h~e~r~T~h~a~n~~P~F~D~S ____ __
10. Naximum total thickness of initial construction
ll. Haximum total thickness of all overlays
12. Average approach speed to overlay zone
13. Average speed through overlay zone - overlay direction
14. Average speed through overlay zone - non-overlay direction
15. Percent ADT arriving each hour of construction
16. Percent trucks in ADT
17. Minimum overlay thickness
18. Overlay construction time
19. Asphalt concrete compacted density
20. Asphalt concrete production rate
21. First year cost of routine maintenance
22. Incremental increase in maintenance cost/year
23. Detour model
24. Total number of lanes
25. Number lanes open in overlay direction
26. Number lanes open in non-overlay direction
27. Distance traffic is slowed
28. Distance traffic is slowed
overlay direction
non-overlay direction
29. Detour distance around overlay zone
-;'(30. Composite thickness of existing pavement
"',31. In-place cost/compacted C.Y. of proposed ACP
*32. Proposed ACP's salvage value as percent of original cost
*33. In-place value of existing pavement/compacted C.Y.
*34. Existing pavement salvage value as percent of present value
*35. Level-up required for the first overlay
*36. Number years existing pavement has been open to traffic
(Fields 37-44 for each material considered in design)
37. Layer designation number
* For ACP overlays only. (Continued)
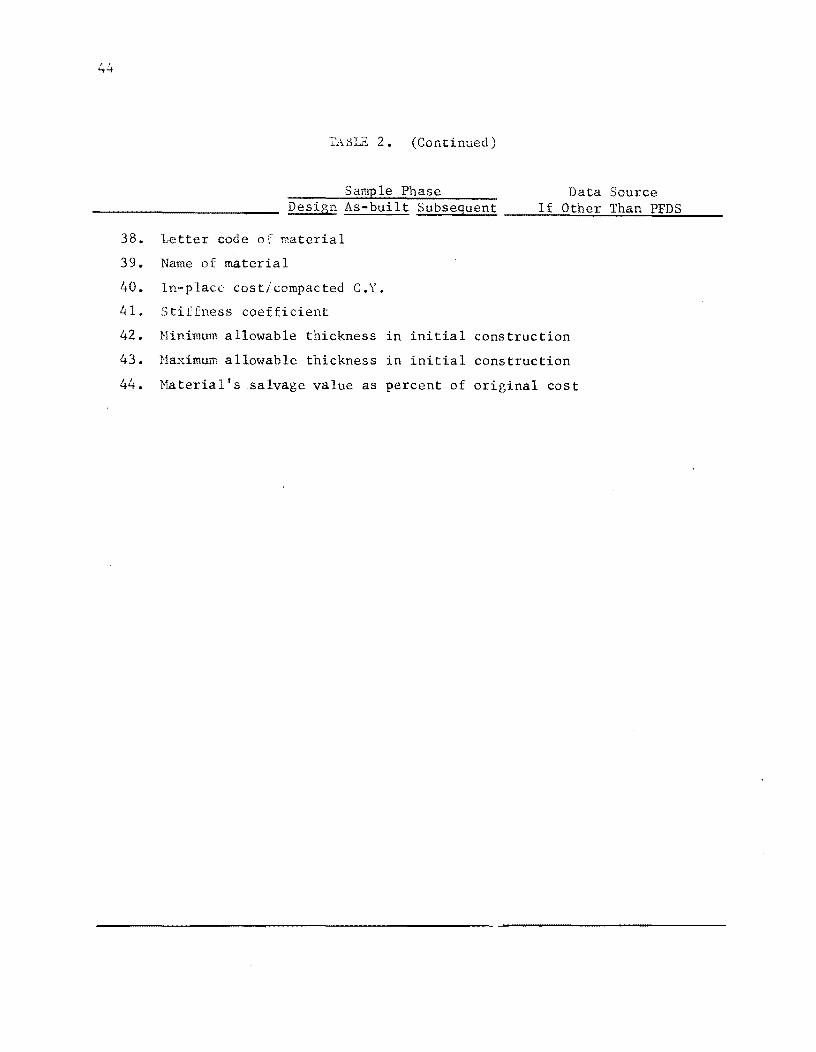
44
l.'..;\J::\L£: 2. (Continued)
Sample Phase Data Source Design As-built Subsequent ____ ~I~f~O~t~h~e~r~T~h~a~n~P~F~D~S~ __ _
38. Letter code of material
39. Name of material
40. In-place cost/compacted C.Y.
41. Stiffness coefficient
42. Minimum allowable thickness in initial construction
43. Maximum allowable thickness in initial construction
44. Material's salvage value as percent of original cost
It may also be pertinent to note that other climatological data may be obtained just as easily. Rainfall, wind, and evaporation are three such factors that could eventually become inputs to a new environment effects submodel within the pavement design system.
The other three factors in the environmental file all contribute to the swelling clay model that estimates performance degradation due to subgrade movements. These factors are unique to FPS-II and must be acquired and contained in PFDS.
(3) Performance File: contains those factors essential to describing the pavement performance. The first two factors are self-explanatory; they are fundamental to any measure of performance. Minimum serviceability index and design confidence level are shown to fall in subsequent data phases, or sometime during the life of the pavement. This possibility could arise only if these design parameters are changed in a subsequent overlay design.
(4) Traffic File: contains the essential traffic data for design. Note that all of these are shown to exist in the THD D-IO traffic file; therefore, no data storage in PFDS is necessary. This file will consist only of a computer instruction to access the D-IO Traffic File by its proper name.
(5) Costs File: these three factors are the only ones for which as-built or subsequent data collection appears appropriate.
(6) Constraints File: this file will be a simple listing of all of the remaining FPS-II inputs not already a part of another file. These data factors are the program constraints and judgment values of the designer. They have a design value only and will be used to reconstruct the design strategy at a later date.
Management Factors
The management potential of the proposed PFDS is somewhat difficult to
predict, but the one most important management factor is clearly service
ability index. Different factor combinations will undoubtedly be used by each
District Engineer to satisfy his own particular needs. Service life estimates
derived from design and as-built data should serve adequately for construction
programming and budgeting purposes.
One other management factor not included in PFDS merits mention here.
The Skid Resistance Factor is a measure of increasing importance in the inter
est of highway safety. It indicates when some type of maintenance action or
surface treatment is needed to improve skid resistance, and D-8R has begun an
extensive program of testing and recording this information. Like D-IO files,
this file will be accessible in ~~RK IV by its proper name as needed; there is
no apparent need to store skid data in PFDS files.
Special Research Files
Most of the special research projects discussed earlier v]ill involve
acquisition and analYSis of varying quantities of data. It may be advantageous
to utilize computer processing of such data and consideration should be given
to definition of temporary fi les 'wi thin PFDS to serve the research project.
MARK IV makes creation of temporary and working files relatively simple and
this capability should be exp loited fu 11y.

CHAPTER 6. EX1STl0lG DATA FiLES AND SOURCES
Scope of Existing Files
With the essential data factors for PFDS identified, it is now logical
to examine the existing data assets of THD to ascertain how many factors are
already included in current files. Over the years, the Texas Highway Depart
ment has acquired a wealth of highway data and developed a comprehensive set
of files for many purposes. When the computer came along, the Planning Survey
Division (D-lO), along with the Automation Division (D-19), promptly set about
automating the data handling procedures so that today, practically all of the
D-IO files have some form of computer handling. J. E. Wright, THD D-IO Divi
sion Head, announced the Texas plan for a state-wide data base at the Highway
Research Board symposium on automation in August 1971 (Ref 91). Over three
years before, D-IO had completed a thorough system analysis and published a
two volume report (Ref 78). By December 1971, D-IO was operating 10 data files
consisting of over a half million records and another 350,000 accident records
were being processed each year.
D-IO Data File Relevancy
An early PFDS research objective was to thoroughly examine these D-IO
files and identify data needed for the pavement design and research process.
This proved very profitable as was indicated in the preceding chapter. Many
of the essential factors are already in one or another of the D-IO files and
the problem then becomes only a matter of how to access such files and fields.
This problem appears well on the way to solution with the acquisition of the
MARK IV file handling system and the potential for a universal record key dis
cussed in Chapter 4. The remaining obstacles are discussed in Chapter 8.
Although identification of the specific essential factors that could be
accessed from D-IO files was made in the preceding chapter, it is doubtful
that the scope is adequately defined without a look at the files and their
contents. Two D-IO files are highly relevant to PFDS:
47

(1) Traffic Log - with approximately 66)500 records - and
(2) Road Life (RL-l) - with approximately 161,000 records.
The Traffic Log. Other than the basic highway identification information,
there are 31 different fields of data in this file. Ten fields are Annual
Average Daily Traffic (AADT) for the preceding 10 years. This information is
derived from both automatic and manual counting stations throughout the state.
The remaining data items are essentially for future design functions and are
derived from loadometer studies as well as computation. Included in this
group are traffic growth factor, 18 kip single axles, and percent trucks. All
of the data items used in a standard THD pavement design procedure 74)
are contained in this file, and are made available to other divisions and dis
tricts upon request. Data records are coded with the beginning and ending
~ilepoints, so the specific segment of a given control section can be readily
pinpointed. In summary, this file is already used as an important information
source for the pavement engineer and will continue to be important (see coding
form and sample output, Appendix C).
The Road Life File (RL-l). This file is probably the most relevant,
comprehensive, and consolidated source of information that the THD pavement
engineer can find anywhere in the Department. Furthermore, examination of the
manual records from which the computer file is derived will show that they
have been diligently maintained. This would suggest a high degree of data
accuracy.
The system analysis staff report (Ref 78) states that the RL-l records
are "in detail as to type and design of construction and the dollar investment
by construction components." The following discussion will attempt to sum
marize how comprehensive that statement is as applied to the pavement design
function.
The manual records consist of the penciled form RI-2, "Log Record of
Project Construction and Retirements. 1I A typical record was selected at ran
dom and is shown in Fig 11. Note that the control section information is
prominently displayed in the upper right corner; each control section is a
separate record. The local features describing the termini of the control
section are given on the top left. The next significant feature is the job
number, the fourth column from the left. T~is record depicts every item of
work performed on this segment of roadway since 1927. Each of the parallel
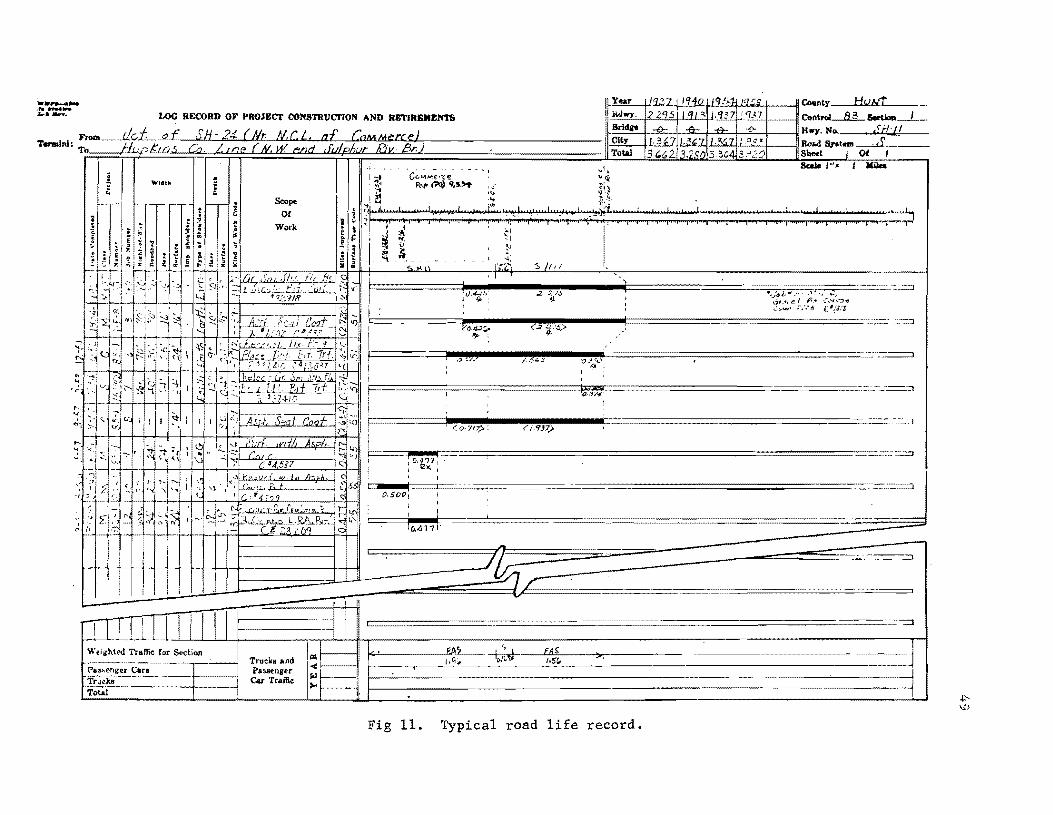
· ........... .. - ... ............ LOG RECORD OF PROJECT CONSTRUCTION AND RETIREMENTS
F'rorA_-1i"L 0 f SH- 24 fUr. MeL. of COMMerce) T-'nJ: To---!J.!/;.?l:ia.s en. /. {riP fN. J1( end ,[u/phur Dr: 13r.}
, i I =
I I I ~Jl> Truck. and :L- I,G·' P .... enru 1 Car Traffic
Weighted Traffic for Section f-----... -------,---...,
,:':;::: ::::;: ~:, ':; : ::::,: : :,:, ~
=
............................ _ .... --S FAS
' • .'!)bl 1a'Sr.,
:1 I 1 I ~----------------------.-------------.-----------------.-.
Fig 11. 1ypical road life record.
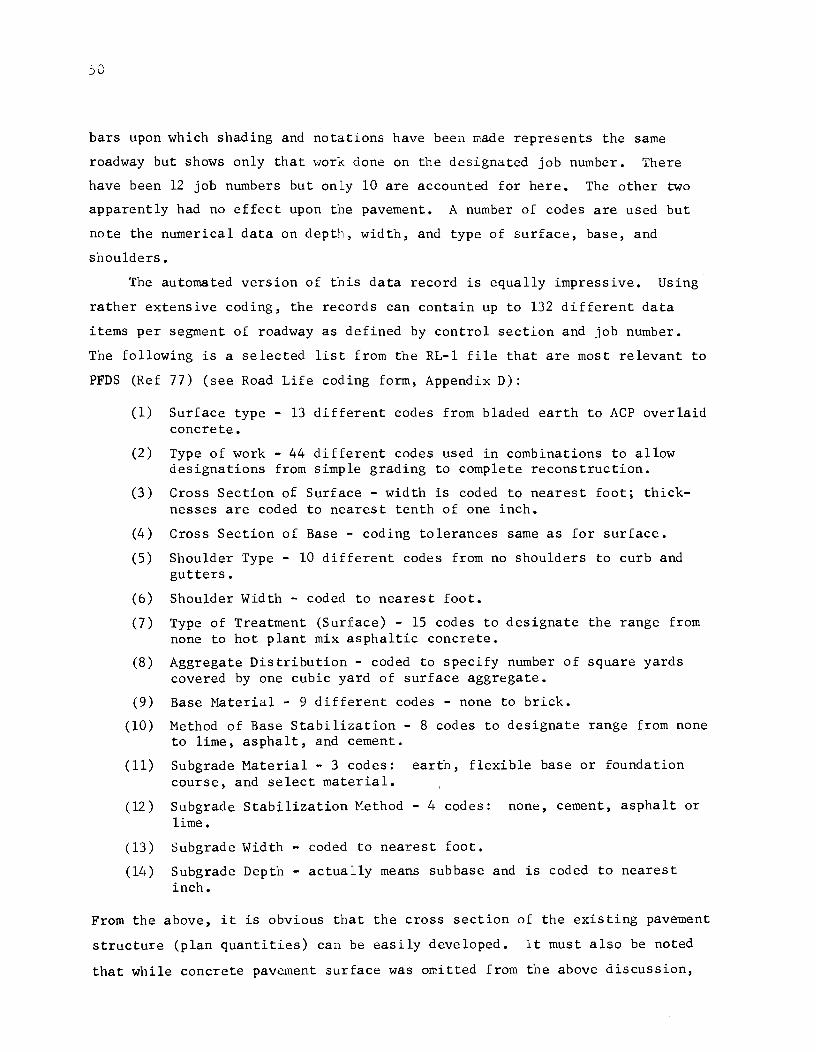
bars upon which shading and notations have been made represents the same
roadway but shows only that work done on the designated job number. There
have been 12 job numbers but only 10 are accounted for here. The other two
apparently had no effect upon the pavement. A number of codes are used but
note the numerical data on depth, width, and type of surface, base, and
shoulders.
The automated version of this data record is equally impressive. Using
rather extensive coding, the records can contain up to 132 different data
items per segment of roadway as defined by control section and job number.
The following is a selected list from the RL-l file that are most relevant to
PFDS (Ref 77) (see Road Life coding form, Appendix D):
(1) Surface type - 13 different codes from bladed earth to ACP overlaid concrete.
(2) Type of work - 44 different codes used in combinations to allow designations from simple grading to complete reconstruction.
(3) Cross Section of Surface - width is coded to nearest foot; thicknesses are coded to nearest tenth of one inch.
(4) Cross Section of Base - coding tolerances same as for surface.
(5) Shoulder Type - 10 different codes from no shoulders to curb and gutters.
(6) Shoulder Width - coded to nearest foot.
(7) Type of Treatment (Surface) - 15 codes to designate the range from none to hot plant mix asphaltic concrete.
(8) Aggregate Distribution - coded to specify number of square yards covered by one cubic yard of surface aggregate.
(9) Base Material - 9 different codes - none to brick.
(10) Method of Base Stabilization - 8 codes to designate range from none to lime, asphalt, and cement.
(11) Subgrade Material - 3 codes: earth, flexible base or foundation course, and select material.
(12) Subgrade Stabilization Method - 4 codes: none, cement, asphalt or lime.
(13) Subgrade Width - coded to nearest foot.
(14) Subgrade Depth - actually means subbase and is coded to nearest inch.
From the above, it is obvious that the cross section of the existing pavement
structure (plan quantities) can be easily developed. It must also be noted
that while concrete pavement surface was omitted from the above discussion,

there is comparable informa.;:~oi1 in the ~il02 for that material as well (see
data fields 21-24, Appendix 0).
In addition to the above pavement structure data, the file contains in
teresting information on the reason and method of pavement retirement, along
with the length, date, and cost of the retired pavement. The term "retirement"
as used herein means removal of the pavement from service for one or more of
several reasons. For example, the pavement may have failed or become obsolete.
RL-l allows 28 different coded reasons for retirementoMethods of retirement
have 51 different coding options varying from simple resurfacing to reconstruc
tion along new line and new grades. This type of information is analogous to
the design comments specified as an essential factor in the Structural File
of PFDS.
The net potential of the RL-l file is to provide data for all but two of
the essential factors in the PFDS Structural File as indicated in Table 2.
This data could initially suffice for the design sample phase until a recon
struction design is prepared using FPS-ll or its successor program. However,
one significant problem exists in regard to this data file. Specifically,
data records are set up for each job number, but the physical limits of the
job number are not contained in the file. This means that there is no direct
measure of the beginning and ending points referenced to some common base such
as milepoint or beginning of control section. As previously pointed out, the
traffic log contains these essential data.
To be of full value to PFDS, this type of locational parameter must be
incorporated in the file. D-10 has given this matter consideration in the
past and decided that insertion of the milepoint data for all previously ac
complished projects was simply too large a task to be practical. It should
be emphasized that milepoints for each job number could be derived from the
manual RL-l records; each job number is defined on the final plans with sta
tioning referenced to some known point such as beginning or ending of control
section, geographical feature, or political boundary.
It is suggested that a limited effort could provide a reasonable solution
to this problem. D-10 has already reserved columns in the RL-l file record
format for beginning and ending milepoints. Therefore, no format changes are
necessary and a coordinated effort between D-8 and D-10 could be undertaken
to

(1) begin coding beginEing anu ending milepoints [or each ne\v job number being entered in 1\L-1, a.1G
(2) select on a case by case hasis certain previously accomplished major construction/reconstruction or overlay job numbers to compute the milepoints (or stationing) from penciled RL-I records and enter in the automated file.
For the immediate future, the above two steps can probably be done manu
ally as needed with acceptable efficiency. Hhen :t-lARK IV is fully operational
wi th a random access capabi li ty, the data fie Ids in RI-2 can be accessed to
yield certain milepoint data upon which calculations for RL-I data can be auto
matically performed. For example, where control section milepoints are al
ready entered in the road inventory (RI-2) riles, a processing program could
be written to take the job number stationing from RL-I input, access milepoint
from RI-2, compute job number milepoint limits and store the result in the
appropriate record files in RL-I. In any event, the existing deficiency of
detailed locational data for job number in RL-I can conceivably be eliminated
on a phased basis with little total increase in existing workloads. The
amount of extra work is acknowledged to be an important consideration and
should be carefully weighed in any adopted course of action.
Another limitation of the RL-I file is the existing provision for only
two subsurface layers. Data describing the surface and base layers appear
completely adequate and the data entered in the subgrade field (field 28,
Appendix D) are descriptive of the subbase. \~hen more than one subbase layer
is used in construction, all are combined as one composite layer for recording
purposes. In some instances, t,vo markedly different materials could be used
for subbase layers and the data entered may not be sufficiently descriptive
for both layers. On the other hand, a continuously reinforced concrete pave
ment (CRCP) overlay of an existing jointed portland cement concrete (PCC)
pavement with a bond breaker may be considered as different layers 0 D-8 and
D-IO should evaluate this restriction and determine whether there is sufficient
merit in establishing more data fields to accomodate additional subbase layers.
Other Data Files
The automated data ~ilc Road Inventory (RI-2) preViously referred to
could be relevant to pavement design functions and is certainly an excellent
management tool. RI-2 contains broad summaries of the structural composition

)J
besides highway grades, curves, and administrative information. In some
respects, it is representative of the other more detailed files of traffic,
structure, and geometrics. It has the disadvantage of being a sequential tape
file as is RL-l and random access of the data records is impossible (see Ap
pendix E).
For environmental information, the National Weather Service (m~S) possesses
records that are readily accessed by computer to yield a wide variety of data
factors. The ones essential to PFDS are maximum and minimum daily temperatures,
from which the district temperature constant is derived. As discussed in
Chapter 5, this data is readily available for the past 22 years for all 1,000
NWS temperature stations in Texas. In addition, the following data are avail
able from the same source for the period 1948-1970:
(1) daily and monthly precipitation for 1,400 stations,
(2) daily and monthly pan evaporation for 600 stations, and
(3) daily and monthly wind movement for 300 stations.
The acquisition of only the temperature data tapes is suggested for the
present. These should be used in a special research project to evaluate
whether temperature constants vary sufficiently within the district to warrant
use of "localized" values. If not, there seems little point in transferring
Some 16 million temperature readings to a computerized direct access storage
device, even though it would be a simple matter to do so. Frank Scrivner,
Texas Transportation Institute, (Ref 66) computed the district temperature
constants now being used in FPS-ll from 10 years of data, and appreciable de
parture from such values seems highly unlikely, even with over twice the data.
Furthermore, Ramesh Kher et al found in Project 123 sensitivity studies that
the factor is only a moderate influence upon optimal design strategy (Ref 47).
Such a special research effort could also conclude whether future acquisition
and analysis of temperature data are warranted and if so, in what summary form
they should be stored.
In the area of manual data files, the scope is simply too large to even
sumlnarize. 3esiC:es the vast fi les of the Equipment and Procurement Division
(D-4), the indivicual districts possess a wealth of information from the con
struction control process. These records may become important in the develop
ment of sampling processes since there may already exist adequate procedures

54
for acquiring the data. Sampling may then reduce to a problem of selective
reporting via remote computer terminals according to some specified format.
This is discussed further in Chapters 7 and 8.
Summary
The D-IO Traffic Log and Road Life (RL-I) file are by far the most im
portant records of immediate interest. Hopefully, THD acquisition of MARK IV
coupled with redefinition of these files with compatible record control keys
will make the data immediately available to the pavement designer and manager.
It is emphasized that these records appear to be reliable and complete and it
is suggested that they be used to the maximum extent. Furthermore, where
changes and/or additions are desired to some data fields, a first recourse
should b8 to work through existing procedures to obtain satisfaction. Just
as witll the record control key, the emphasis should be on making existing
mechanisms work unless clear-cut deficiencies dictate otherwise. The great
value of such efforts can be seen from the milepoint deficiency in the RL-I
file; the vast and relevant data elements therein can be had for relatively
small additional effort.

CPAPTER 7. iJATA SN-1PLING
Sampling Concepts
After the fundamental decision is made as to what data to collect, the
next step is recognition of the sources of dat~. Except for the assigned
and computed data values, all other data must be obtained from either acces
sing other data files or sources, or measuring the factors in the field.
Either way, the pavement engineer must be confident that the numbers he gets
are valid representations of the pavement design problem. This means that a
data sampling plan or philosophy must be developed and applied to both parts
of the problem. For data to be accessed, the sampling plan and procedures
must be checked; for data to be collected, the plan and procedures must be
developed.
Sampling Techniques
Consultation with statisticians reveals that the best practical sampling
approach for this type of data system is a systematic random sample on a
stratified basis. Loosely translated, this simply means that the highway
from which data is to be measured is first separated into strata or levels
that are fairly homogeneous within themselves. Then each strata is sampled
by beginning at a random point and taking sample values at regular intervals
throughout the strata. As an example, serviceability index (SI) may be our
particular pavement factor. First we select a segment of highway that has the
same type surface and was probably constructed by the same contractor at the
same time (same contract); this is our stratum. Then we pick a random starting
point and measure and record an SI value every 2,000 feet throughout our se
lected segment.
Two significant features of the stratified, systematic random sampling
method should be explicitly recognized (Ref 10, pp 206-230):
(1) There should be no cyclic effects within a stratum. For example, seasonal changes are a cyclic effect upon climate and any factor dependent upon climatic conditions must be sampled so that appropriate representation of each season is obtained. In some areas

of Texas, the surface CLrvaturC! index (SCI) is direct:ly dependent on time of year. SCI reacings should the~ be taken within each season.
(2) The variance tends to be overestimated, i.e., larger than the true variance. In general, this means that probabilistic design values derived from such data should be conservative, i.e., there should be a kind of safety factor.
The same sampling procedure is applicable to time variable data as well.
After selecting the strata of the factor, each stratum is sampled at a regular
interval of time, i.e., each year. The same example of SI may serve here;
SI values will be taken each year at some particular time.
This time interval of sampling will be, of course, dependent upon capa
bility to take the sample. Presently available THD resources may not permit
annual sampling. For example, THD has four Mays Road Meters for taking SI
readings. Simple arithmetic shows that to cover the 70,000 miles of state
system in one year, each unit must cover about 70 miles per day. This kind
of schedule may not be possible for several reasons and the plans would have
to be changed to fit equipment, or vice versa. However, implementation of
PFDS will be a phased procedure and will not require immediate sampling on all
highways. Therefore, sampling capability can be matched to needs on a pro
gressive basis.
Stratum Equals Job Number
In Chapter 4, a record control key was defined to include the job number
of the particular work being performed. The definition of job number shows
that it is variable in length and scope of work but is generally a consistent
type of pavement work, i.e., maintenance, overlay, reconstruction, or con
struction. In general, it will all be done by the same work force (THD work
force or contractor) at one given period of time. If it involves reconstruc
tion or construction of a new pavement, the same design thickness and materials
will probably be used throughout the length of the job. There are a number
of other variations SUcll as number and type of superstructures, but these
generally have DG ::earir.g on pavement construction. The net effect is that
job number as a '.".,~t of work rJeasure becomes a natural and practical homo
geneous stratum for sawpling purposes as far as pavement structure is concerned.
This was a consideration in the selection of job number as an element in the

57
record control key and the res:.llt is a ~rlaximum benefit from a consistent method
of highway identification in the existing Texas Highway Department records
system.
There will undoubtedly be instances where distinct breaks in pavement
characteristics or design will occur within the length specified by a single
job number. For this reason, a decimal position has been allotted to the job
number to permit up to nine subdivisions of a given project (job number). This
is emphasized to app ly to such situations as a change in design thickness of
pavement, not to stochastic variability expected within a project.
Sampling as a Function of Objective
Sampling must be guided by the purpose for which the data will ultimately
be used. PFDS is expected to contain data for
(1) management,
(2) design, and
(3) research.
For management, a single representative data value may adequately represent a
factor in a control section and job number segment of roadway. Design will
probably require more data values to permit selection of a critical value upon
which to base a design. The term "critical" is used here in the statistical
sense and refers to that value which gives the engineer a specific level of
confidence that his design will be adequate. Research undoubtedly needs more
detailed information than either of the other two objectives. In the beginning,
the essential factors are probably a common denominator for all three objec
tives and were selected accordingly for PFDS. This will change with time; as
design models prove adequate for a situation, they may be moved from the re
search to the design realm. Management factors will probably always be highly
summarized values of a few basic factors.
Sampling as a Function of Resources
Each essential factor must be looked at individually to establish its
desired sampling density. Now another consideration comes into focus, namely,
the availability of THD personnel and equipment resources. This was briefly
introduced in an earlier discussion of serviceability index sampling. Equipment

available will be a fundamental limitation ii1 many cases. In other situations,
the number of qualified personnel available \vill govern. This will be influ
enced greatly by the policies and interests of the particular District Engineer.
In fact, the District Engineer may determine the success or failure of the
data system in his own district. Therefore, it is especially important that
he be given all the facts and potential in the most concise, accurate, and
direct manner.
Standardized Measuring Apparatus and Techniques
In order that data from district to district may be directly comparable,
it is important that the measuring apparatus and techniques be standardized.
For example, it would be undesirable for one district to use a Mays Road Meter
to sample serviceability index while another uses a rating panel. Similarly,
the techniques for arriving at triaxial class should be the same for all dis
tricts. In some cases, this is going to require a great deal of coordination.
However, much has already been done. A method for calibrating the various
Mays Road Meters has been developed and is being refined now (Ref 85). For
many years, the quality control tests for materials have been standardized
and codified. This is well illustrated by the job control and progress record
testing required in the Texas Highway Department by the construction manual
(Ref 72). Figures 12 and 13 are taken from that manual and show the guide
test schedule for asphaltic concrete pavements, surface treatments, and the
base, subbase, and embankment materials. It will also be noted that the con
cept of systematic sampling discussed earlier in this chapter has been followed
in the illustrated sampling guides. In summary, it appears that most of the
established sampling methods will probably suffice for PFDS and the problem
is reduced to standardizing tests for those essential factors that are new to
the design engineer and were first introduced to the pavement design field by
the flexible pavement system (FPS). Such factors number only six:
(1) serviceability index,
(2) stiffness coefficient,
(3) subgrade swelling probability,
(4) subgrade potential vertical rise,
(5) subgrade swelling rate constant, and
(6) surface curvature index.
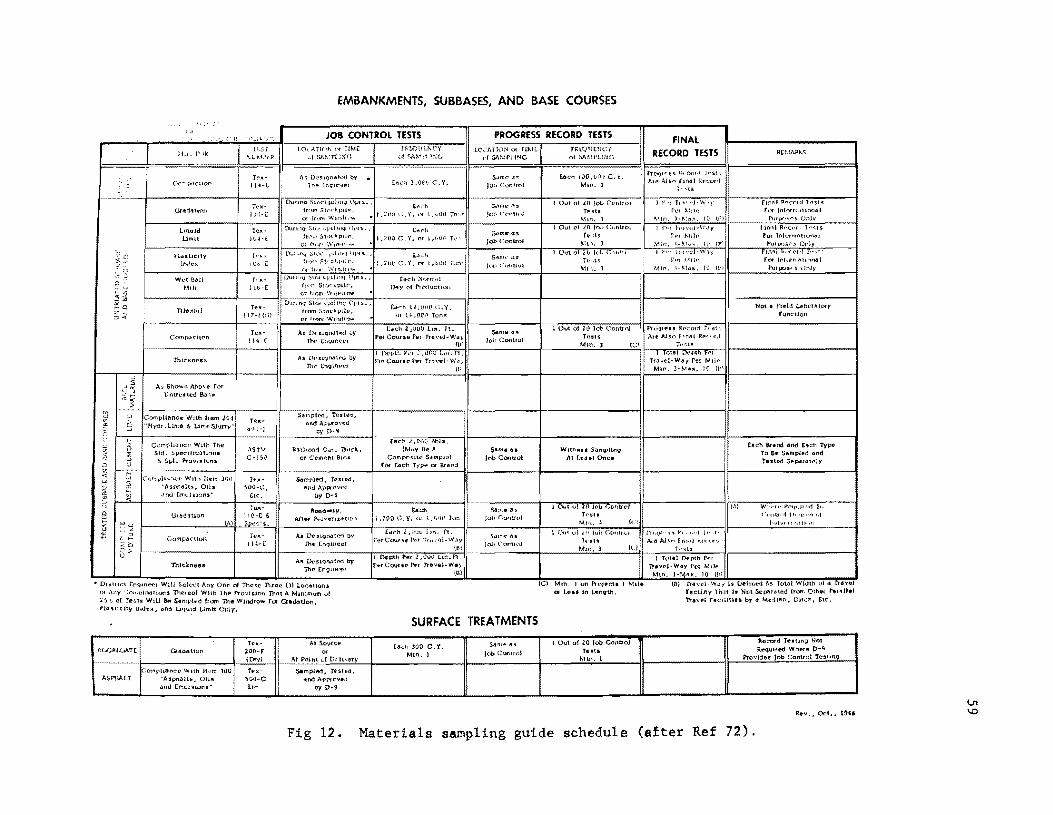
~ "~ I; ,~
;~ ~ ,~
w ~~ -, ~
-' ,.
3 ~
" .~
Cl " " I-
'" w :$ ~ 0:
~ G '3 ;S ~~ ~ Lf-o
:.::C,i C::;: u
tU~t,lld
Umu
fl,utlCity Ifkk);
CompucuC'n
ihkkness
Ai Shown Abo...-~ rN t;ntredt~d Sa,,!!,
Compliance WUt, hem l&4 H1{Ydr.Un,e & UffieSiurry"
Comph.lllc(' W~th The Std. ~J.lttCIIH;':Hl<'jns
6. $pl. Prov'::51ooJ,
t.~Ot'l1~H'.:l('" With Hem 300 "A:iph"lt5,OUs .nKl l:ml.lls;;lons"
vtl)d"Uon. 1M
Comp;,ctlon
Thlc;,;n9ss
T€x~
117-tOn
r('x~
';oOO-C.
ttc.
EMBANKMENTS, SUBBASES, AND BASE COURSES
JOB CONTROL TESTS PROGRESS RECORD TESTS FINAL RECORD TESTS
J\~ Dt'sJQn<!I0t! by • 11'1e (D~lr<!~t
As O~'s1f)n.tth.i by TIl!' !..:nQUh·'-'f
S~lnplt'd. T~st~d. 31\d ApJXovetl
by D-')
f{,)thOi1Jl Cot. !'tock. Of C('ItI"",t 8ma
wrh li,{IIll! C.Y. d1 I j, ,oe'J lon~
lO(.''\TION 01 nML 1'( SM ... 1P! tNG
$.Jmc- d!>
joo Control
nW:,Jl;rNC"( 01 SAMrUNG
Eat;h lOO.O('i(t C. 'to Mm. ]
Proqrr s .. « •. corJ TC' .. t" AfP IUs .... fum) K('covl
1 p ~t!'
Not e rteld (..eb«,ijtOfY function
[ac:h 2,0(10 8bh, (Mol.,. 8t:.' A Same.u WJtn~u Sillllpl1nv tach e.r./1d and E"cl1 TyPE'
Co •• ~.,t,. SO-")'>.1 1_' C I! To De Sall1pJl'd .snd t-..... '" ".... l....... ontro At ,('IU1Once- Testoo S~pdr41l"IY
______________ ~-r-~--~-c-.h-T~f~p-e-cr--s-'.-"-d~~------------_+------------------~~--------------~~----------------------_1 S<tmplfOd. Tuted,
af\dbY"'O~-g
A!I LK'S19nJtM by The En';lln<,er
(,'I) Wllf'tl' 1I(,II'J1I1"1 Tt, COHlJr,j H'·'lll"t.,;
• DI:>IIICl tn91n~1 WllJ S(!J<"ct Any On(' 01 These TIirCe 0) 1.0C"tiQ1U O( '\11.,. ,.:."t·-.tliMHl$IS Tht!'leof WHh The J"rov!Jion Thot A Ml.nlmum 01 :'j',S't; of Tcstli wl1J &.t Sa'nt'l~d ,rQftl Tht Wlndro_ ror GrOdatJon. f"1""tlr:lty Int.l~x~ and Ltqu~d Limit Only.
(Ci Mm. I un f'wlecU • MtJe (8) Tlavcl-W"i [s OttHned ft.s Towl Whlth 01 "" rreV.,J or Leu in l.en9th. r"CuJty ihil:t S. Not Scpl'Hdtod iTOI'I''' Other Plf,..,Ut'
'l'ravel fAcllltie. by e Mr1illO. OUch, Etc.
SURFACE TREATMENTS
Tcx~ At SO'olICt! Eo!Jch )00 C. 't. s"mt!' a.s lOut of 2:0 fob Collttol Aecvrd T~.tin.Q Not
AL(;;U:'GI\T[: Grl1oa\1on 200-t 0' Job Control Te.ts Rl"Ql,Ilred Whe-re P-q
(Dry) At Point of Dc hvery Min. I Min. 1 Provldu Job Control Te,t.nq
lcC(t\pliarw:-e With Item ]00 Tex- Sampi8d. Ttlsted. ASPHA.t'f "Aspn.:nu, Oi1!1 ~OO-C 4tid Apr'f(\ved
.:sod Emt.1'iwns" ttt'" by D-9
Rt!'v .• Oct... I ~i6
Fig 12. Materials sampling guide schedule (after Ref 72).
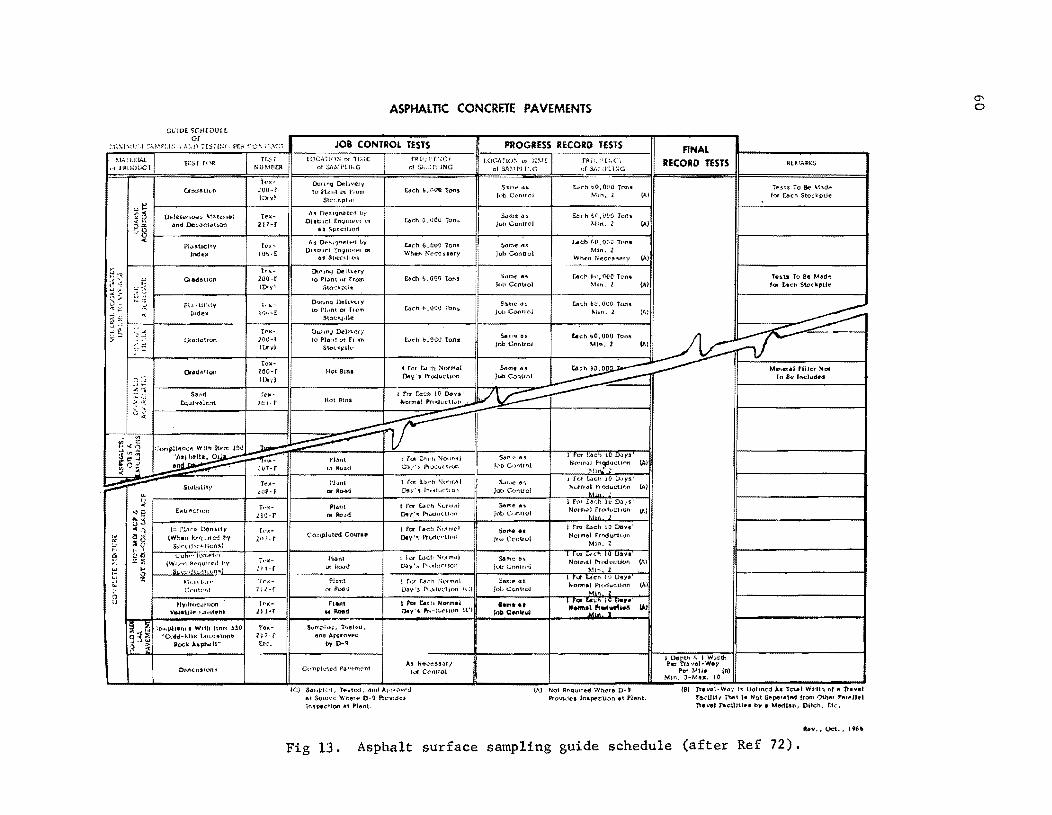
.\t;.'U'v..l "f J'ROO i.'C T
G\J1Dt ~CHW\Jtt or
nSf r(iR
Qad<lt!un
ut:! ';! ~ D.lelo"ou, "Ale".l ",," e 8 and {)ecant.,hoo ..
w u
!) ,. u C.od4\lon
~ .~ r
'" u G
S ;- ~ ~ FlJ. ,Hetty .. ~
-' " Im:.le:.f g . ~
.. .< - ,~
;;: (;rodilhon
:~ "
Tf...s ;-NU~HltJl
i~)I:-
;;'QU~f
([)ry)
Tex-217-r
T('x~
IO!j~£
t("x-lOO-r (D~.,.l
Il )\~
lOh-t
ASPHALTIC CONCRETE PAVEMENTS
JOB CONTROL TESTS lOC,\1h';'I.: Of 11.'.;(:
of $Id\,;i'l!hG
l:k.mnq .DP.l!very to PIc fit Of from
St('d(.ptk~
As De!;.19MtC(i by
OUtuct f.n',Jtnt'N ('f
&~ Specified
I.,:;, D"'~~9n~tt'rj Ly District n"ilHlO:t'1 Of
as S~C'cIIIC'.I
0l11UKI Delivery to PI~nl Hr from
Stoclo:p;l41
D'lfmg Oeli'lr(:'IY to P1,,0, or rl('m
StoCk-I,Ue
01.0;'"9 DeHvtH'/ to f'lcnt <Jf rrl'm
S\ot.k~lk
fH' .. ' l'r:'l:C 'l' rof s.\:,~ ['liNG
EAch b ,tWO Tons
[;,)ch Ij,UOU Ton.:.
tach ~. {RIO 10m, When Neec:i uny
tbch ~,OOO tons
Ldrh b. 000 TOfl:.
rl
PROGRESS RECORD TESTS
5lt"~ ., .. L<'l:ctt tl'O,()!iO tc'O. Jot: Ce>nlfol Mm. I
Sam':!' as toch Li\ (lUO 1011s JoO Connol Min. ,
S<tme .,s uch &0.000 Tuns
Job CoOtfo! Min. Z Wh~n.r:~CC'S"fY
':id~f: /I~ [6<'''' 61l, I'It.'O tC'n4 h,b C(.1"bo~ MIn. 1
Same d!:i r..."ch bU,OOO t,ms JUl) COtl!h",j Mill. 1
(AI
!A)
(Al
(A)
(AI
FINAL RECORD TESTS
T4!'$tll To Be M..)d" lor u,ch Stockplie
t.u. to Be M.!Id"! IOf l'4ch Sto('ltpUe
Or.d,l1iQfl
" >-t! ;~
~ ________________ ~_~_~~_'X~'~ II ~f
HQt Bins
... ,. e, .. .. h "
,-, " ~ (j i.
'"
Sand [qulv~ltat
Sldb.lHty
t>.lLI:'\'I'" l~!'nll",1
HVdthC • .ubCln
"a,leui. C..-,n'''"'
20j~ r Ho~ Btns
1 rOf' C",,'h Now)·,} 0.)/>:- PtQ<lu('tlon
1 for 1.,,"),-11 ~('r1l\111
Da'y"s hnillClJOIl
I for ~C'h f\urlJ1.tj Ds\",. 1'r,jdII<.th1n
I f!;Jf [tten f';mmel Oty't; Ptu:h.'t"Um;
! rOl t<lltl, ~tJon.J~ [,),)y's. r"ducltol1
1 r0f t('ch t'ur",,,,1 u<>y's f'l, .... Jv~·Hrm (1.:1
t J'oI Cae Ii HOfmttl I).oIY'4, ".,·il.lC"'Kln '('I
A.s Noceu,HI l<lf C('>ntrol
(C) S&r"p!tcd. 14':atoo, "net A~,pr"vru at Soutn: Wh~tf! 0-9 Pl"ovldcl InSPt'ctlon at PI$nt.
Sdr <':" "5 Ie'\) COfltrO!
S,u:)C ~'>
JQL Corneol
3amc cHi
100 C,.ntt",J
Stll1\a a. JIWC'l;'OI1(Jl
Same c ... 1,,0 Cnnlr!'i
Scr.:P .!IS
Joi; Control
S.m ••• 101> eMit",
! fur f"uch )0 DdyS' 1\ofw.d r""JductJl')n (A)
",
IA) Not RCQutad Where D~9 Pl"Qvldel In.".,cUon .' Plent.
Ip~~:V~t~:.l:1h Per M1J. (nl
MIn. 3-10.10 •• 10
{BJ Tr.vl!l~Wl\IY Is l)(!flncd A.. Total WI/Uh of e lh\leJ facUltv TNt 1_ Not Be-po ret'" !rOOI Other P8r~U«1 navel racUmu by • Median, DUC::h. etc.
Rev., Oct •• ,.66 Fig 13. Asphalt surface sampling guide schedule (after Ref 72).

61
Factor (1) has received much attention and procedures for data acquisition
are well developed (Refs 31, 84, and 85); procedures for factors (2) and (6)
are standardized to a degree in Ref 73; Lytton discusses methods for quanti
fying factors (3), (4), and (5) in Ref 53. A forthcoming revision to Ref 73
is expected to clarify the procedures for acquiring swelling clay parameters
and should be consulted in conjunction with the theory presented in Ref 53.
Future Action
Because the THD districts are highly autonomous, it is imperative that
one or more of them be selected for PFDS pilot implementation on the basis of
their interest. The plan of action should then be:
(1) Review the array of essential factors proposed herein and add those meeting some agreed essentiality criteria. On this point, it will be vitally important for someone to constantly stress the importance of eliminating data as discussed previously or data volume will grow without bounds.
(2) Examine existing district data collection plans to determine how many PFDS essential factors are already being sampled.
(3) Evaluate the existing data collection procedures to be satisfied that sampling is consistent with concepts previously discussed.
(4) Device sampling plans and procedures for the remaining essential factors.
With the new remote computer terminals in the district headquarters, the
option of inputting data via punched cards (or some other medium) should be
explored with D-19. However, this action should probably be deferred until
MARK IV is fully operational and D-19 has had time to publish some basic
operating procedures.

!!!!!!!!!!!!!!!!!!!"#$%!&'()!*)&+',)%!'-!$-.)-.$/-'++0!1+'-2!&'()!$-!.#)!/*$($-'+3!
44!5"6!7$1*'*0!8$($.$9'.$/-!")':!

CHAPTER 8. FILE STRUCTURE AND DATA ANALYSIS
Overview of System and File Structure
This chapter was written for the pavement engineer, not the computer
programmer or systems analyst. The latter two may even cringe at the liberties
taken herein with computer systems terminology, but the object is to clearly
depict to the practicing engineer some basic features of the proposed PFDS
files. It is readily acknowledged that some of the resulting illustrations
do not reflect the precise form of the computer handling of the data but it
is contended that there is no harm done by looking at them in this way (see
later discussion titled ''File Combinations ").
Another important point to emphasize is that this discussion is gener
alized and applies to no particular data handling system or language. The
MARK IV file handling system now being introduced in the Texas Highway Depart
ment has its own way of defining, creating, and processing files, trailer
files, temporary files, etc. The options in MARK IV far exceed anything en
visioned herein, so the computer programmer will be able to easily define the
desired file manipulations with the system.
The basic concept of the PFDS file structure is to store all design values
in "prime" files and all as-built and subsequent detailed values in "trailer"
files. The trailer files can be processed individually or together with their
prime file (Ref 42). Each of the PFDS files as described in Chapter 5 will be
illustrated and described in order to make the operating concept clear.
First, however, an overview of the file structure will be helpful to
identify major groupings of data fields. Figure 14 shows both the conceptual
prime and trailer file structure. Note that two differences are illustrated:
(1) The record control key for the trailer file is longer than for the primary. Since the records in the trailer file are detailed components of the prime file records, it is necessary to extend the data definition.
(2) The data fields are fewer in the trailer file. This simply illustrates that, in general, not all factors present in design need additional sampling in time and space. Therefore, only those factors to be further sampled are found in the trailer file.
63
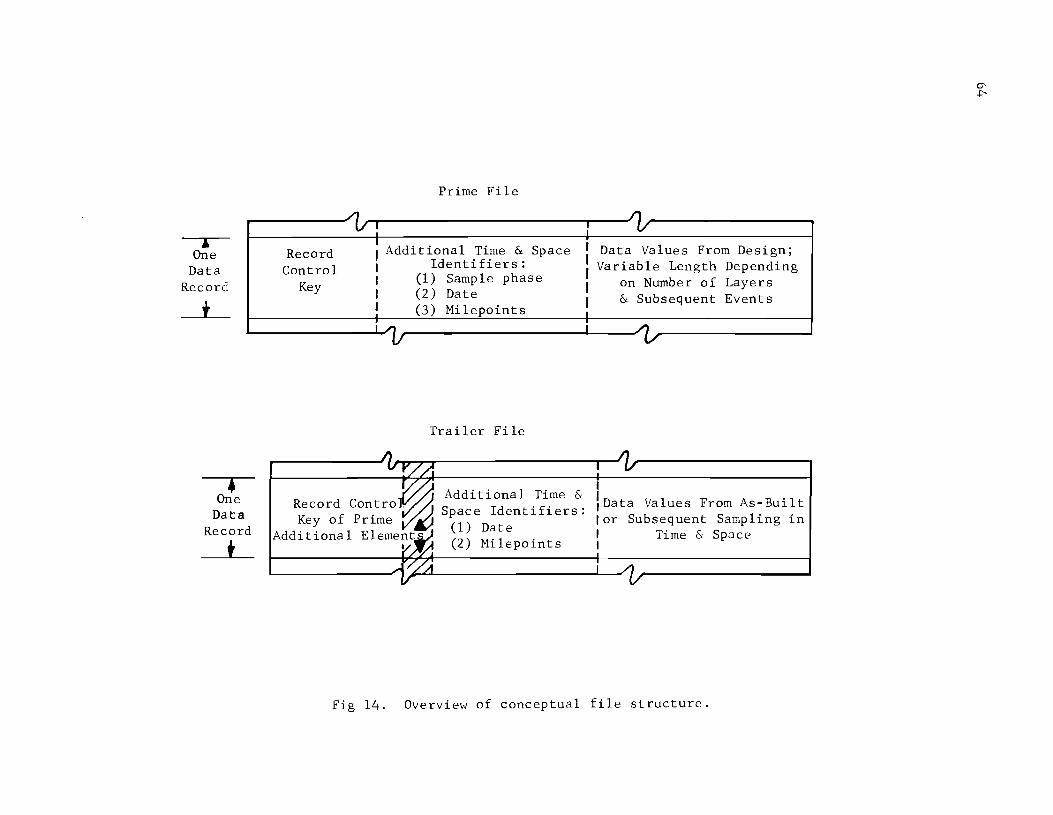
Prime File
...-----1;: , One Data
Record
t
• One Data
Record
t
Record Control
Key
; Additional Time & Space I Identifiers: I (1) Sample phase I (2) Date I (3) Milepoints i
Trailer File
Additional Time & Space Identifiers:
(1) Date (2) Milepoints
: Data Values From Design; I Variable Length Depending I on Number of Layers I & Subsequent Events I
i
I
\Data Values From As-Built lor Subsequent Sampling in I Time & Space I
Fig 14. Overview of conceptual file structure.

65
There are some minor deviations from the structures shown in Fig 14 and they
will become evident when the files are examined. Essentially, the deviations
amount to certain omissions of data fields not needed. This is particularly
evident in the environment and costs trailer files.
One objective in structuring these files has been to preclude as many
"embedded" empty data fields as possible. This is accomplished primarily by
utilizing variable length records that are extended or collapsed to fit the
requirements of the particular record. For example, if a data record contains
data on a two-layer pavement, no provision is made for a nonexistent third
layer that might ordinarily exist. This should conserve storage space although
storage for PFDS will probably not be a problem for a long time.
Data Coding
A determined effort has been made to keep data coding to an absolute
minimum in order to keep the system input and output as readable as possible.
However, a certain number of codes appears desirable and they have been de
vised to be as logical as possible. They apply to all files shown in Figs 15
to 22. Coding used in only one file is defined in the legend on the corre
sponding figure. The following definitions and codes are applicable:
(1) Sample phase: designates the time when data values are to be acquired as indicated also in Table 2. The following numbers designate
1. design values
2. as-built values
3., 4., 5., etc. subsequent measurements in time.
(2) Date: always a 4-digit number, the first two digits being year and the second two designating the month.
(3) Layer designation and code: these entries are generally the same as those used in FPS-ll; layers are designated 1, 2, 3, etc. and materials A, B, C, etc. as part of the program input. Two additional codes that may be used in this field are: OL = overlay and SC = seal coat •
(4) Sample number: sequentially assigned numbers within a sample phase to identify number of the sample value. These numbers uniquely identify the sample with date and milepoint and may go to 99.
Decimal points have been omitted in most of the illustrations to conserve

66
space. This is analogous to the assumed decimal points in the actual data
files to conserve storage space.
Structural File
Figures 15 and 16 depict the prime and trailer structural files. Repre
sentative numbers have been entered to illustrate how the file records would
be collated; dashes indicate that the entry in the preceding record is still
valid in that field and to help accent record changes.
Note that in Fig 15 each job number is one record in the prime file, and
all the pertinent design data appear in that one record. The result is a very
long record; for a three-layer design with two subsequent overlays and design
comments limited to 80 characters, the record length would be over 200 columns.
This length could be reduced by shortening the names of materials to an ab
breviation, etc. However, there may be many instances where the design com
ments should be longer than 80 columns. It is therefore suggested that all
of the comments be designed into trailer records as described by Ref 42 and
equated in the MARK IV system. This should pose no difficulty for the pro
grammer.
In the trailer file depicted in Fig 16 there can be several records for
each job number because of the need for specific date and milepoint sampling.
For this reason, the record control key must have two additional fields to
uniquely identify the record. As pointed out in Chapter 4, the record control
key must be given exactly to the system or the record cannot be located in
a random access environment. Since milepoint computed to three decimals may
be difficult to recover at a later date, it is not a good key component. There
fore it is proposed as an item of data since its presence in the file is es
sential.
The multiple samples for any job number define the variability inherent
in construction practices, the principal objective of this file structuring.
Note that this trailer file should always contain the as-built data, sample
phase code 2.
Description of one series of the illustrated data examples should help
to clarify these and subsequent figures. In Fig 15, the first record shown
is job number 1550 in control 2374 section 15. The design of this project
was an asphaltic concrete surface five inches thick and a gravel base 12 inches
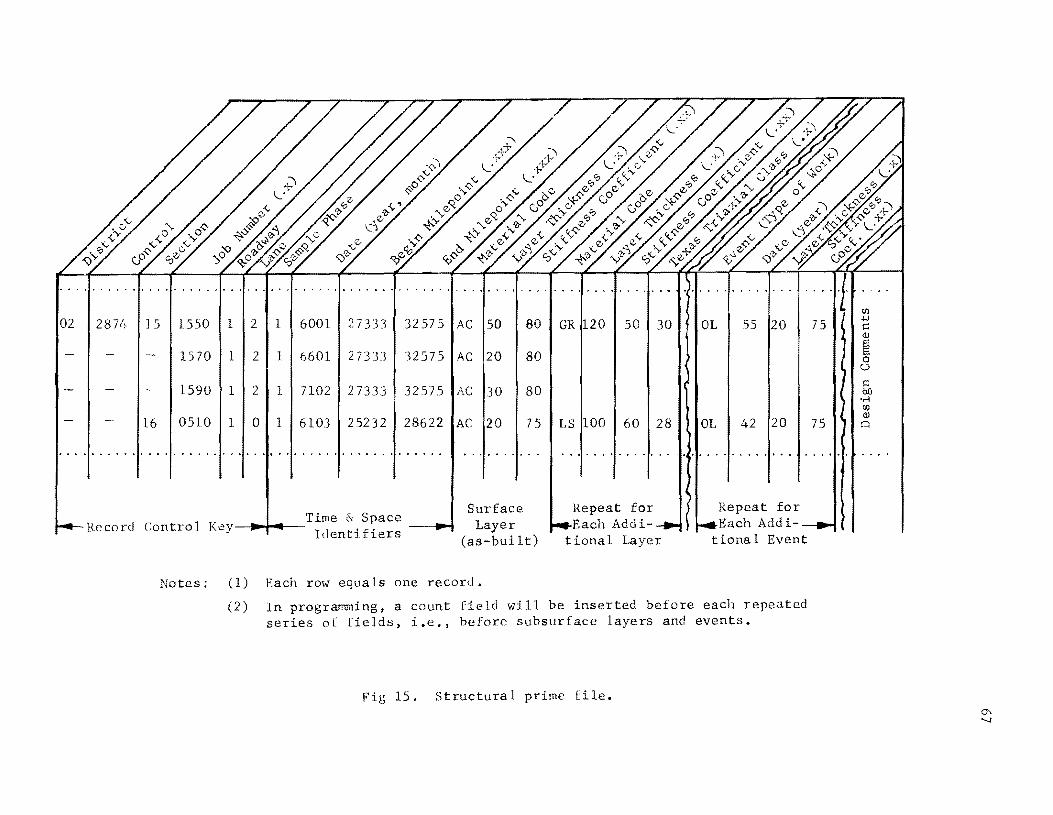
. . ~ .
02
.....
~ , . . . . . . . . ~ . . . . . . .. . .. ... . ..... . ...... ~ . . . . . . " ... . . . . . . . , ..... .... . . . . . . . . .... " . . . . . . .. , .... . ~ ~ , . .
til
287/1 15 1550 1 2 1 6001 27333 32575 AC 50 80 GR 120 50 30 OL 55 20 75 +J c (l)
1570 1 2 1 6601 27333 32575 AC 20 80 ~ 0 u
1590 1 2 1 7102 27333 32575 AC 30 80 c bO
• .-1 til
16 0510 1 0 1 6103 25232 28622 AC 20 75 100 60 20 (l)
LS 28 OL 42 75 0
• • <0 ~ • • .... . .. . . . . . .. " . . .. .. . . . . . . ...... . . . ~ . . . " . .. . . . . . ... ..... . . ~ . . . . .. ..... . ~ . . . . .. . .....
Time & Space Record Control Key-.... r-ooIIl--- Identi Hers
Surface Layer
(as-built)
Notes; (1) Each row equals one record.
Repeat for Each Addi
tional Layer
Repeat for Each Addi
tiona 1 Event
(2) In prograrrnning, a count field will be inserted before each repeated series of fields, i.e., before subsurface layers and events.
Fig 15. Structural prime file.
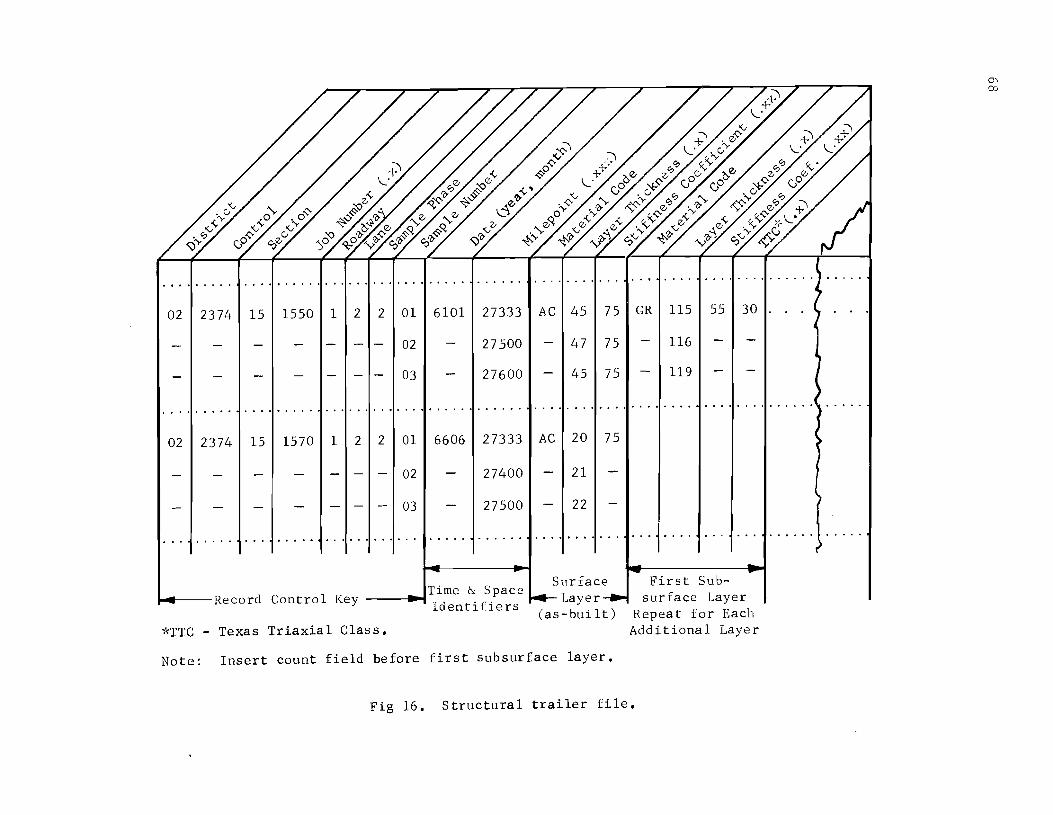
........ , ............................ ...... . ......... .
02 2374 15 1550 1 2 2 01 6101 27333 AC 45 75 GR 115 55 30
02 27500 47 75 116
03 27600 45 75 119
. . . . . . . .. . ..................................................... .
02 2374 15 1570 1 2 2 01 6606 27333 AC 20 75
02 27400 21
03 27500 22
. . . . .. ........... . .. i ... .
~--Record Control Key ____ .... Time & Space Identifiers
"<TTC - Texas Triaxial Class.
Surface Layer
(as - bui It)
Note: Insert count field before first subsurface layer.
First Subsurface Layer
Repeat for Each Additional Layer
Fig 16. Structural trailer file.

69
thick. Only one overlay is illustrated at 5.5 years after initial construction.
The next record is for job number 570, and contains the design values for the
overlay predicted in job number 1550; note that it was designed exactly six
years after the initial pavement construction.
The first three records illustrated in Fig 16 are individual as-built
samples from the initial construction of job number 1550. The next three
records show as-built samples taken from the overlay constructed five months
after design and five years and five months after construction of the initial
pavement. This latter value corresponds to the 5.5 years predicted in inital
designo
The horizontal rows of dots between records in all figures represent
records omitted. In Fig 16, an unspecified number of additional as-built
samples from both the initial construction and overlay have been omitted.
Job number 1560 has also been omitted but will be seen to be a special main
tenance project in the cost files (Figs 21 and 22).
Environment File
Figure 17 shows the proposed environment prime file structure with sample
entries to illustrate how the records would be sorted. Again, this file con
tains only design data, sample phase code 1, and each record is a different
job number. The trailer file is shown in Fig 18; note that the milepoint
field has been deleted. Since swelling clay data are generally representative
of entire projects, single observed values for swelling probability and swell
rate constant for the entire project (job number) are probably all that is
required. Milepoints for job numbers are contained in the prime file. Note
also that the sample number field is not needed when the specific milepoint
is not used.
A value for potential vertical rise is shown for subsequent sampling
phases but not for the as-built phase, and this warrants a brief explanation.
This is intended to depict a possible way of collecting meaningful data on
this parameter. Specifically, potential vertical rise is a long-term effect
and no new evidence on its value is likely to be uncovered during construction.
However, during the life of the pavement, the vertical rise should be measur
able and these values can be used to verify estimates made during design.
Therefore, the subsequent (sample phase 3 and 4) values of vertical rise shown
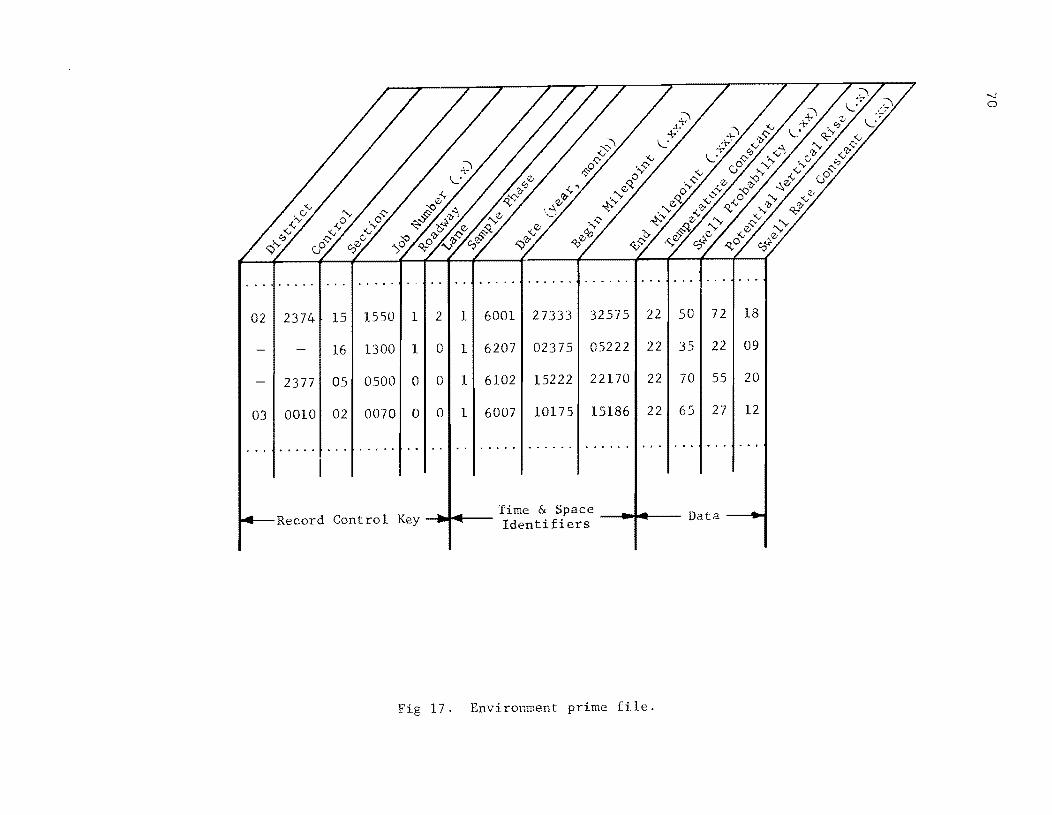
02 2374 15 1550 1 2 1 6001 27333 32575 22 50 72 18
16 1300 1 0 1 6207 02375 05222 22 35 22 09
2377 05 0500 0 0 1 6102 15222 22170 22 70 55 20
03 0010 02 0070 0 0 1 6007 10175 15186 22 65 27 12
Time & Space Record Control Key ~~~-- Identifiers --~~---- Data ----~
17. Environment prime file.
"'-J a
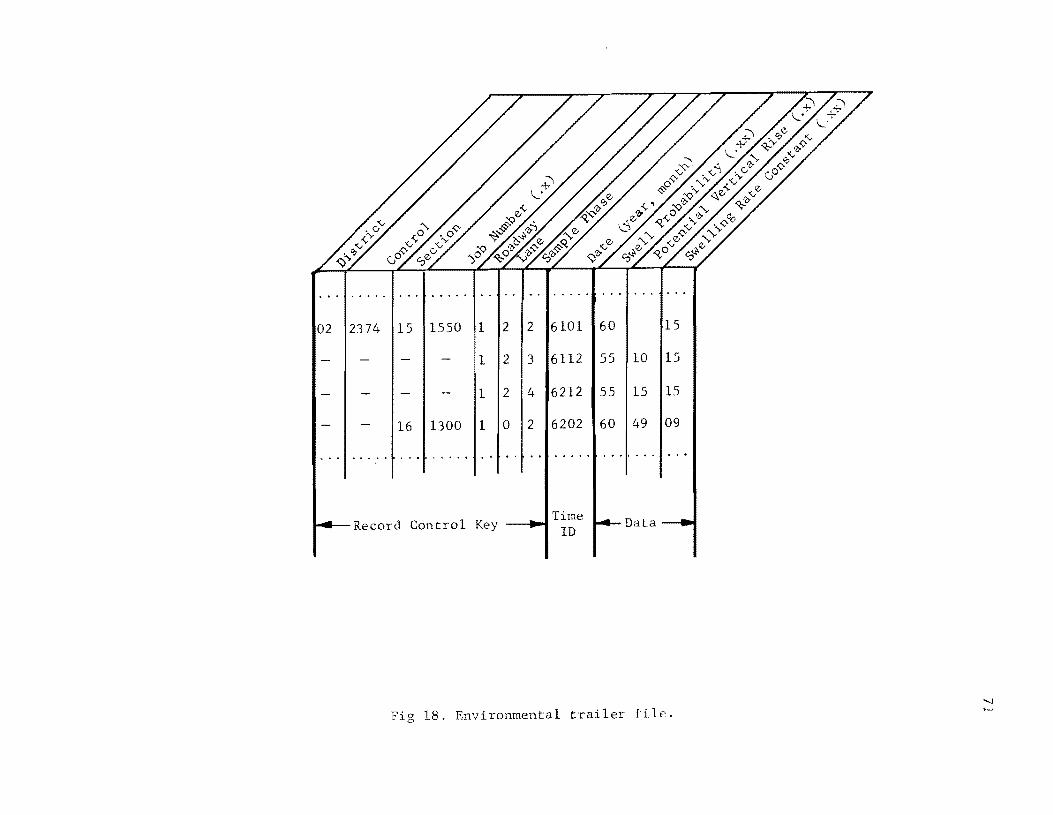
02 2374 15 1550 1 2 2 6101 60 15
1 2 3 6112 55 10 15
1 2 4 6212 55 15 15
16 1300 1 0 2 6202 60 49 09
Record Control Key __ ~~Time ID
Data
18. Environmental trailer file.

72
in Fig 18 are cumulative values to be compared to value of 7.2 used in design
(sec Fig 17).
Since the temperature constant is assumed fixed within each district,
there is no need to repeat values for it in the trailer file. However, if
additional research shows localized temperature constants to be significant,
there must be a field in the prime file for it and such has been provided.
Performance File
Figures 19 and 20 illustrate the prime and trailer performance files.
These files conform very closely to the conceptual file plan illustrated
earlier. The explanation of the design confidence level code is given in Fig
19. Since these data are point data for the most part, the trailer file must
accomodate both time and space sampling as shown.
Costs File
This file deviates from the conceptual structure to a greater degree than
the others. The prime file shown in Fig 21 has the typical record control key
and the usual time and space identification fields. Each record is a separate
job number containing design data (estimate of cost) as is true for other
prime files. However, note that job number 1560 has data entries for routine
maintenance only. This value is computed per square yard and will cumula
tively compare with the design value of 0.13 shown as routine maintenance
cost in the first record. Since all special maintenance projects, as well as
overlays, seal coats, and construction, receive separate job numbers, the es
timated costs for each will always appear as design values (sample phase 1)
in this file. The trailer file in Fig 22 has the usual record control key
minus sample number, since no milepoints are needed. To simplify these data
items, a new field entitled type work has been introduced; codes are as shown.
Numerical entries are as-built pavement costs per square yard. These values
are directly comparable to the costs shown for the corresponding job numbers
in the prime file.
Traffic File
The traffic file is not depicted herein since it is anticipated that all
necessary traffic data can be obtained from the D-10 files. The only things
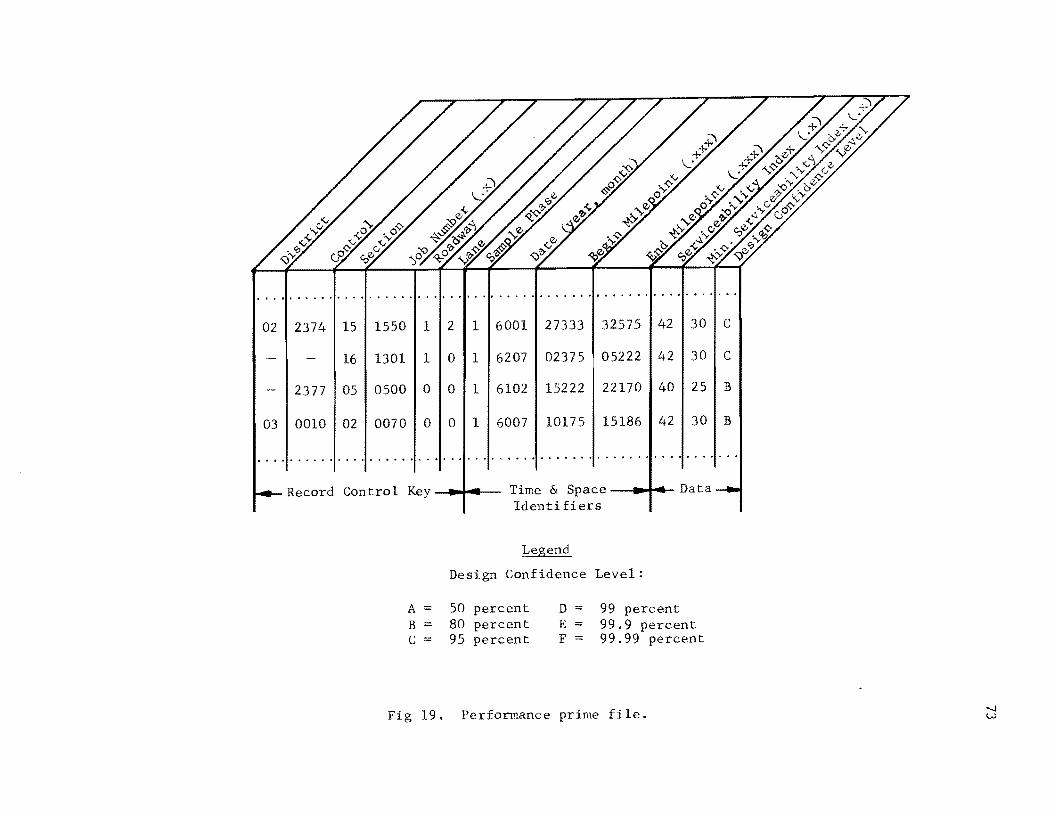
.... . ... .. . .. ... . . . . .. . .. . . . . . . . .. . . . .. . . .. . ....... . . . .. ~ .. . ...... .. .. .. . . . .
02 2374 15 1550 1 2 1 6001 27333 32575 42 30 C
16 1301 1 0 1 6207 02375 05222 42 30 C
2377 05 0500 0 0 1 6102 15222 22170 40 25 B
03 0010 02 0070 0 0 1 6007 10175 15186 42 30 B
. . . . .. .. ... .. .. . . .. . . . . .. . . . . . . . . . .. .. 4 ....... ........... .. ......... .. .. . .. .. . ~ " . ..
Record Control Key Time & Space Data Identi Hers
Design Confidence Level:
A = 50 percent D == 99 percent B == 80 percent E == 99.9 percent C == 95 percent F == 99.99 percent
Fig 19. Performance prime file.
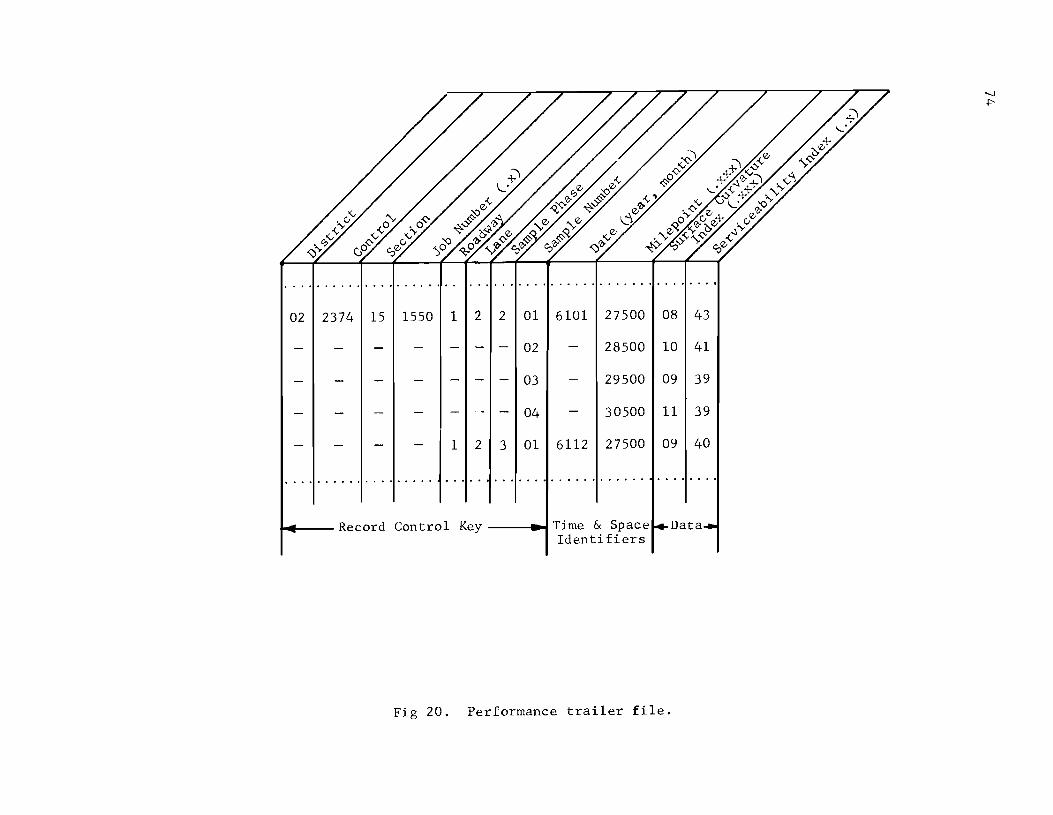
.... . . . . . . . . . . . . . . . . . . . . . . . . . . . . . . . . . . . . .. . . . . . . . . ...
02 2374 15 1550 1 2 2 01 6101 27500 08 43
02 28500 10 41
03 29500 09 39
04 30500 11 39
1 2 3 01 6112 27500 09 40
. . . . . . . . .. . . . . .. . . . . . . . . . . .. . . . . ..... . . . . . . .... . . ..
~ __ Record Control Key --_ .. Time & Space Data Identifiers
Fig 20. Performance trailer file.
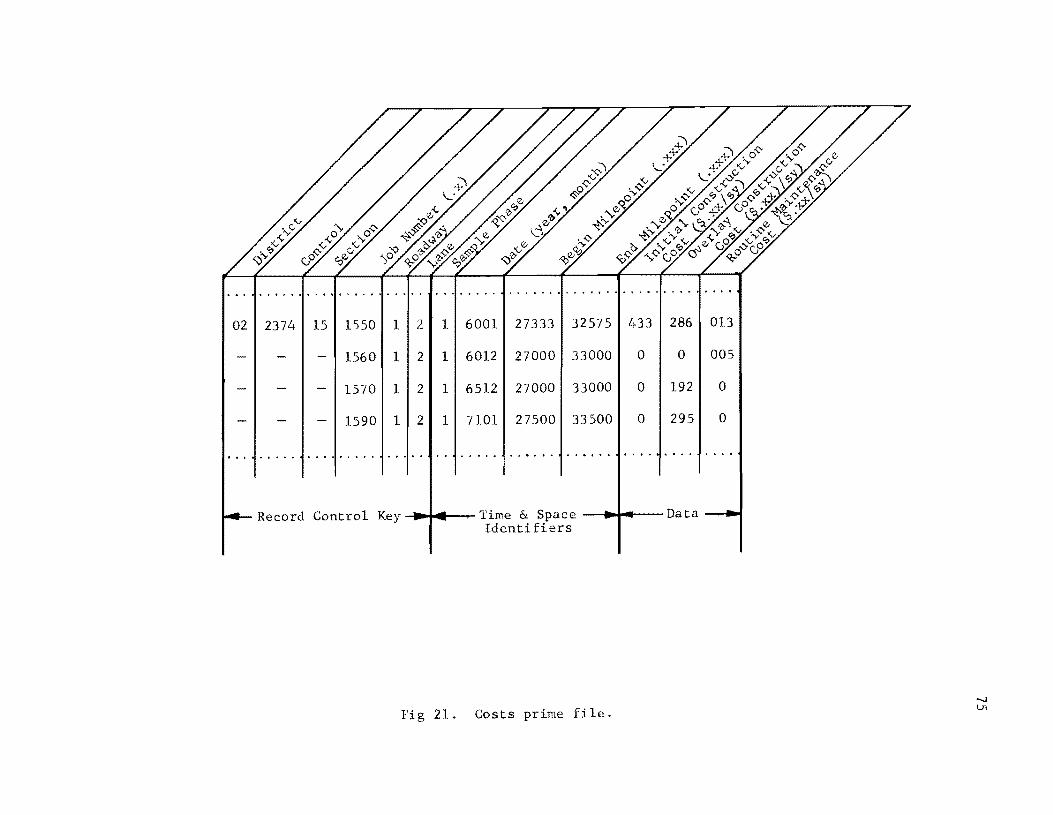
• " f * " • . . ~ . , . . ~ . . .. ~ ~ . . ~ 9 9 9 .. .. ~ • . .. . . . ~ . .. . . . . . ~ . .. .. .. ~ f •
02 2374 15 1550 1 2 1 6001 27333 32575 433 286 013
1560 1 2 1 6012 27000 33000 0 0 005
1570 1 2 1 6512 27000 33000 0 192 0
1590 1 2 1 7101 27500 33500 0 295 0
.. , . . . .. . . . , . .. • • 9 ~ .. . . . . . . . . ... .. .. .. .. .. . . . ~ . - . " , . . ... .4' •
Record Control Key Time & Space - ........ '--- Data Identi Hers
Fig 21. Costs prime file.
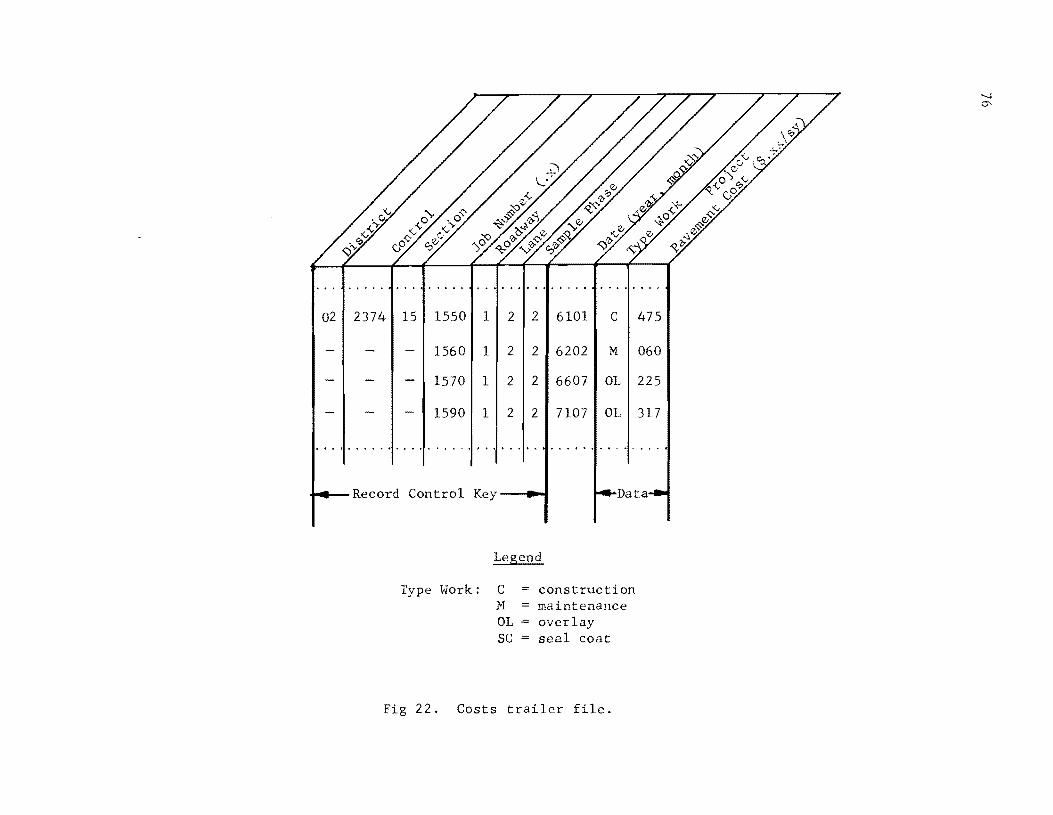
02
......
. . . . . . . . . . . . . . ..... .. ...
2374 15 1550 1 2 2 6101 C 475
1560 1 2 2 6202 M 060
1570 1 2 2 6607 OL 225
1590 1 2 2 7107 OL 317
. . . . . .. . . . . . .... . . . . . . . . ~ * • .. .. .. ...... . .. . . ..
Record Control Key--~~ Data
Legend
Type Work: C M OL SC
construction maintenance overlay seal coat
22. Costs trailer file.
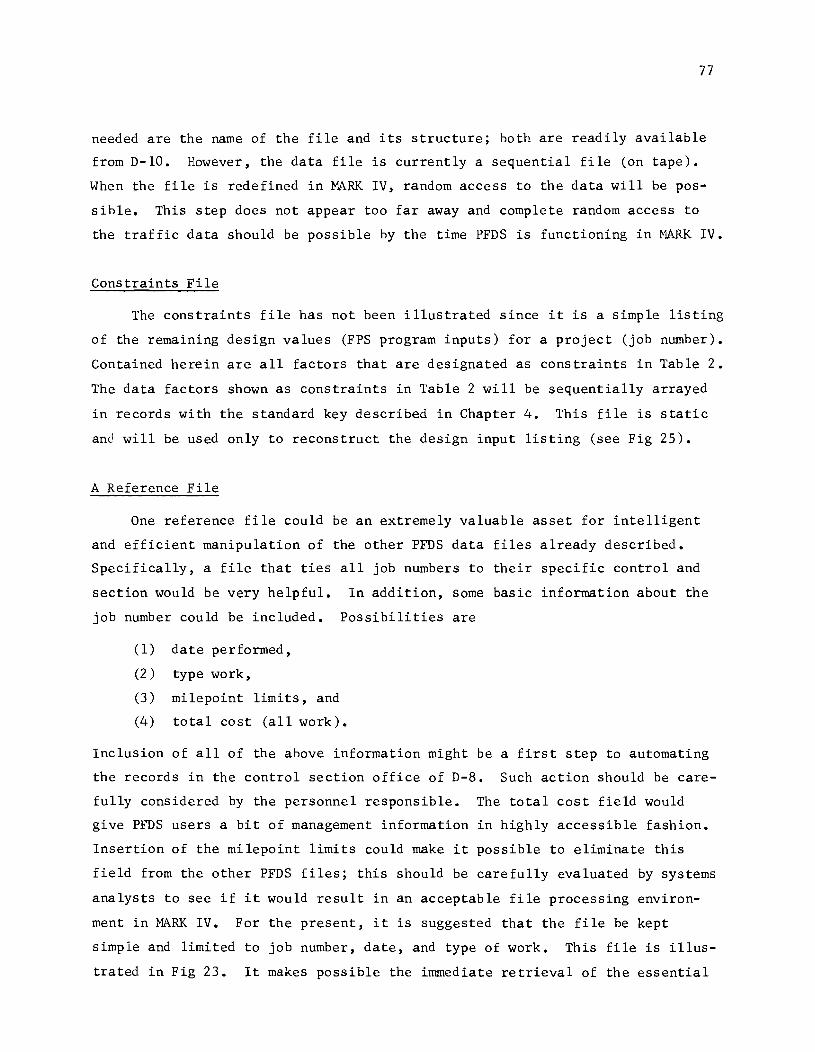
77
needed are the name of the file and its structure; both are readily available
from D-10. However, the data file is currently a sequential file (on tape).
When the file is redefined in MARK IV, random access to the data will be pos
sible. This step does not appear too far away and complete random access to
the traffic data should be possible by the time PFDS is functioning in MARK IV.
Constraints File
The constraints file has not been illustrated since it is a simple listing
of the remaining design values (FPS program inputs) for a project (job number).
Contained herein are all factors that are designated as constraints in Table 2.
The data factors shown as constraints in Table 2 will be sequentially arrayed
in records with the standard key described in Chapter 4. This file is static
and will be used only to reconstruct the design input listing (see Fig 25).
A Reference File
One reference file could be an extremely valuable asset for intelligent
and efficient manipulation of the other PFDS data files already described.
Specifically, a file that ties all job numbers to their specific control and
section would be very helpful. In addition, some basic information about the
job number could be included. Possibilities are
(1) date performed,
(2 ) type work,
(3 ) milepoint limits, and
(4) total cost (all work).
Inclusion of all of the above information might be a first step to automating
the records in the control section office of D-S. Such action should be care
fully considered by the personnel responsible. The total cost field would
give PFDS users a bit of management information in highly accessible fashion.
Insertion of the milepoint limits could make it possible to eliminate this
field from the other PFDS files; this should be carefully evaluated by systems
analysts to see if it would result in an acceptable file processing environ
ment in MARK IV. For the present, it is suggested that the file be kept
simple and limited to job number, date, and type of work. This file is illus
trated in Fig 23. It makes possible the immediate retrieval of the essential
02 2374 15 0010 2906 C 0020 3007 M 0030 3112 M 0040 3201
02 2374 16 0010 3107 C 0030 3212 M 0070 3511 OL 0080 3606
........................................................ ' . .... ~ ... ~ ....... ~ .......... ~ .... ~ ..... .
03 2100 02 0010 3212 C 0020 3306 M ••...•.•...•...•...•.••.••••••••••• • .......•
.. .. . .. .. .. . . .. .. .. ' .. .. .. .. .. . . .. . .. .. .. .. .. .. . . .. .. .. .. . .. .. .. .. .. . .. .. .. .. .. .. . .. .. .. .. .. .. .. .. .. .. .. .. . .. .. . .. .. . .. .. .. .. .. " .. ~ .. .. .. .. . .. .. .. . .. .. .. .. .. .. .. ..
21 0071 10 0010 2912 C 0020 3012 M 0040 3106 SC 0050............. . ....... .
Record Job Numbers Applicable to Pavement Contro1~-+~------------- Work - As Long As Needed ------------------~
Key ~----~~
Note: In programming, insert count field before first series of job number fields.
Fig 23. A reference file.

79
information needed for interaction with the other PFDS data files. Only job
numbers back to and including the last reconstruction of the entire control
section need be entered for an adequate reference file.
File Combinations
Inclusion of the milepoints in the reference file, as discussed above,
should be carefully evaluated in light of the increased file processing made
necessary by such data deletion in other files. Perhaps such an action would
conserve storage space at an unreasonable expense of retrieval and/or update
time. The systems analyst must weigh this in an operational environment and
make a judgment.
However, some reduction in media storage can be realized by judicious
combinations of certain files having the same basic characteristics. Two
such combinations appear reasonable:
(1) the environment, performance, and cost prime files (Figs 17, 19, and 21 respectively), and
(2) the structure and cost trailer files (Figs 16 and 22).
In each of the above cases, the data fields are comparatively short and
could be stacked behind each other in each record to allow use of the same
record control key field and time and space identification field. It is
strongly suggested, however, that this computer programming action be accom
plished without complicating the file use for the engineer. In other words,
while the files may actually be combined as far as the programmer is concerned,
the engineer should be able to interact with the system as though they were
separate files.
Another programming aid might be mentioned here. As noted on Figs 15,
16, and 23, a count field is necessary in advance of repeated fields of data
in records of variable length. This entry designates the number of times the
data series is repeated in the file, i.e., the number of layers, job numbers,
or events.
Prospects with MARK IV
When existing D-IO files are redefined in MARK IV, the files and fields
will be given names that are needed to access the data. This will be true
for PFDS as well. Ten standard forms are available to define and manipulate
80
the data base in :HARK IV and the instructions on use of them is a separate
volume of its own (Ref 44). However, the action required by the average user
should not be difficult to learn. D-10 and D-19 are currently studying this
phase of the system. One especially powerful asset is the ability to change
file structures with little effort. This is a very desirable feature in any
system and especially attractive with a new data base.
Data analysiS with MARK IV is somewhat limited although the operations
possible are very easily invoked by terse entries on the standard form (see
F 28). The following data manipulations are available:
(1) Sorting of values in sequence, ascending, or descending.
(2) Provision of summaries as follows:
(a) total value of items,
(b) cumulative value of items,
(c) count number of items,
(d) select maximum value,
(e) select minimum value, and
(f) compute average value.
Custom-Written Analysis Programs
There are some mathematical analyses necessary for PFDS that are not
possible or practical with MARK IV. However, it is possible to access the
MARK IV files with a custom-written analysis routine or module and perform
the desired computations. The analYSis module can be written in a high level
language such as FORTRAN or PL/l.
Some rather elaborate analysis routines can easily be envisioned as de
sirable management tools. Event-triggered reports, for example, would be a
great aid and might be typified by a serviceability loss prediction that is
automatically triggered when the design life performance curve projects to a
service life less than 85 percent of design life (or some other percentage).
Such a computation could be automatically invoked each time a serviceability
index, traffic, or surface curvature index value is input to PFDS. An i1-
lustration of this is given in F 24 where the as-built serviceability index
was well below the design value of 4.2. The moment the as-built value of 3.9
is input to PFDS, the performance curve projection is computed by the analysis
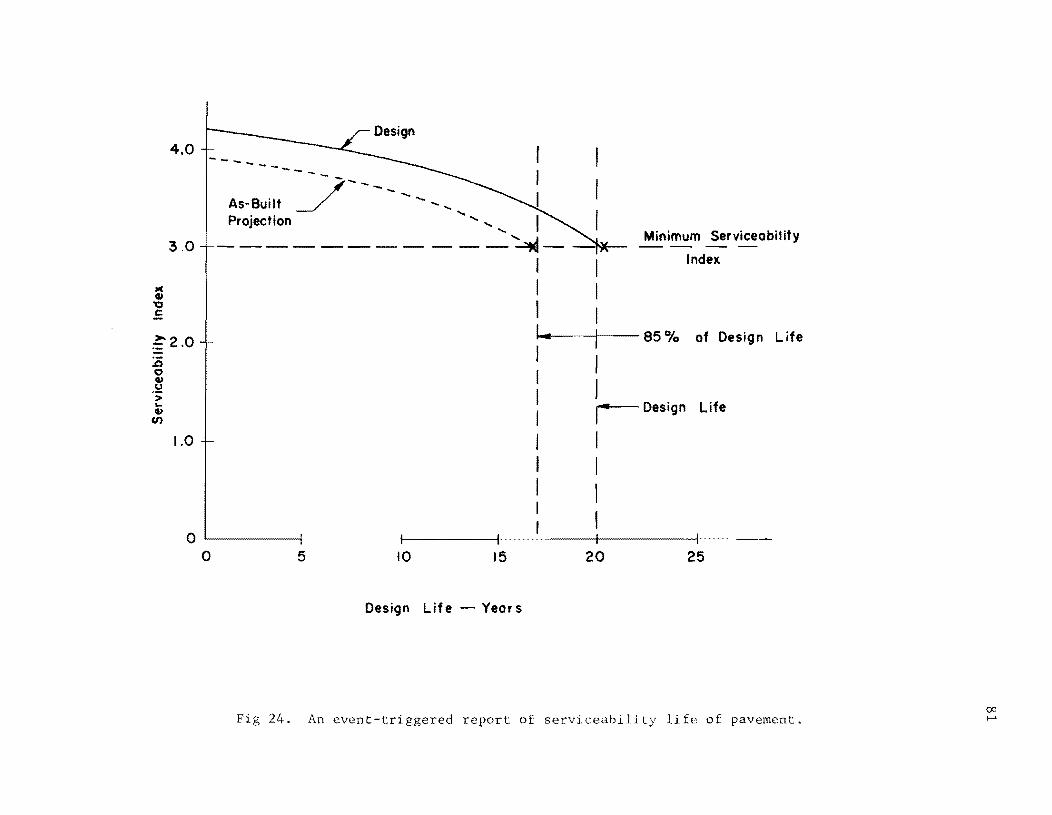
4.0
3.0
~2.0 .t:l o Q1 CJ
> ... Q1
(f)
1.0
--_ I --- ----?-_ I As-Built J -- - -........ I Projection ..... ..... ..... ..... I I
- -- - - -- - - - - -~ - --Minimum Serviceobility
I I Index
I I I I l... ..... --+1--85% of Design Life
I I I I I ...... 1---- Design Life I I I I I I I 1
: I o L-----+---------~----_+------~~----4_----o 5 10 15 20 25
Design Life - Year s
Fig 24. An event-triggered report of serviceability life of pavement.

82
module and intersects the minimum serviceability index level just before the
17th year of service. The pavement engineer may then expect a higher cost of
maintenance or plan an earlier overlay to prevent accelerated damage due to
dynamic loads.
A good deal of imperfection in the existing models may make such analyses
as described above somewhat premature. Perhaps, a better feeling for the dis
tribution of data values is needed first. It is therefore suggested that the
initial analysis routines be limited to the following:
(1) A program to re-create the FPS-ll design inputs in the conventional order, as illustrated in Fig 25. This will involve extracting the design values from each of the PFDS prime files and combining them with the constraints file. This will permit a complete reevaluation of the design decision at a later date and allow direct comparison of design estimates versus actual performance.
(2) A routine containing the following performance model (Ref 6S):
where
N
N lS-kip single axles
Q = ,J 5 - P ,J 5 - P 1
Pl = initial serviceability index
P = present serviceability index
::: district temperature constant
S = surface curvature index
K = regression coefficient
(3) A routine with the swelling clay model (Ref 53):
P =
where
P = present serviceability index
Pl
= initial serviceability index
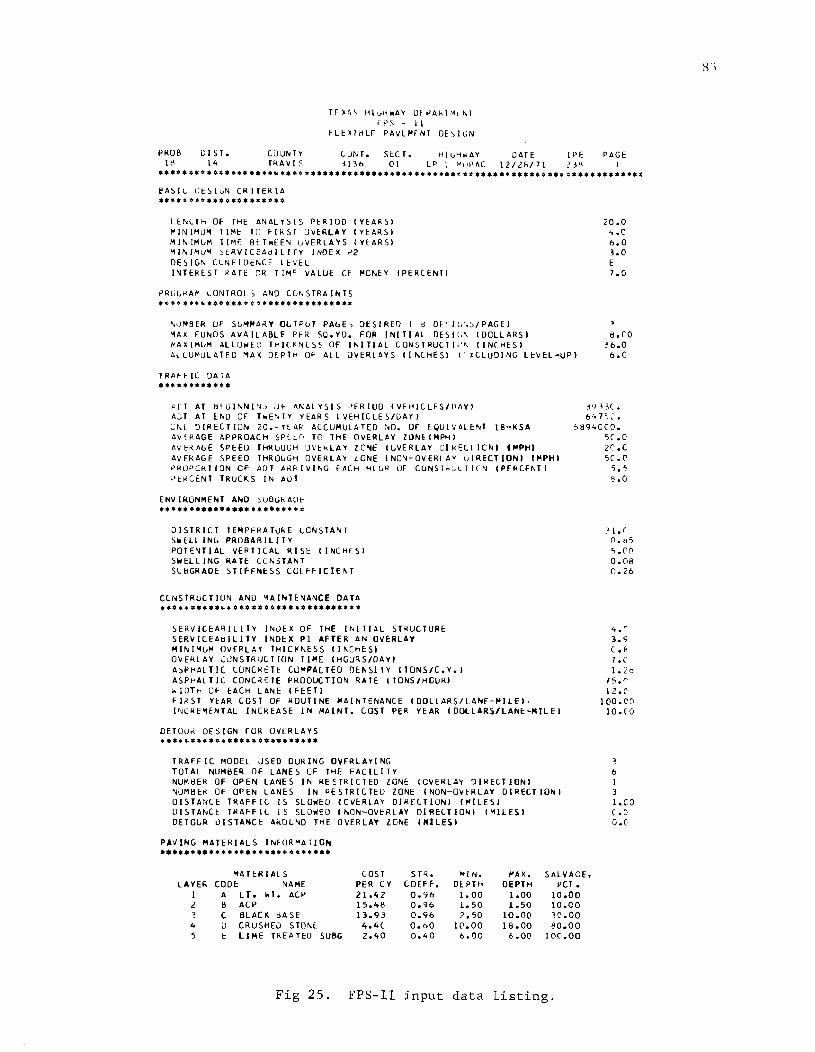
TElA' HI~H~AY DfVAM'Mt~1
F P S - II FLE~IHLE PAVtMENT DESIGN
PROB DIST. COUNTY C~NT. StCT. HIGH~AY OATE IPE PAGE lB 14 TMAVIS j136 01 LP I "l,PAC 12/28/7\ )3~ I
••••• *** •• * •••••••• ~ ••• * ••••••••••••••••••••••••• ~~~ •••••••••• * •••• ~ •••••••••••• EASll ~tSIGN CRITERIA •• *.*.* •••• * •••• ~ ••••
LtNUM Of THE ANALYSIS PERIOD (YEARS) ~INIMUM TI~E Tn F(KST OvERLAY (YEARS) MINIMUM TIME BtT~EE~ uVERLAYS (YtARS) MINIMUM ;ERVICEA~ILlTY INDEX P2 DESIGN CuNFIDENCE LtVEL INTEREST RATE OR TIW VALUE CF MONEY (PERCENT)
PRGGMA~ cONTROLS AND CG~STRAINTS .~ •••• *~.** ••• **~ •••••••••••••••
~UMBER UF SUMMARY OLTPLT PAGE, 3€SIRED ( ti DtCIG~~/PAGE)
~AX FUNDS AVAILABLE PfR SQ.YD. FOR INITIAL DESIG~ (DOLLARSI
20.0 4.C 6.0 3.0 E 7.0
~AIIMUM ALLOWED TI-1IC~N[S~ OF INITIAL CONSTRUCTI,:" (INCHES) ACCUMULATED MAX DEPTH Of ALL OVERLAYS (I NCHES) I' ICLUDING LtVEL-UPI
B.(O ~6.0 6.C
TRAFFIC DATA ••••••••••••
~CT AT ~EGINNI~~ Jf ANALYSIS PERIOD (VEHICLES/DAY) ACT AT tND OF hEI>oTY YEARS I VEHICLES/DAVI GNt-DIRECTION 20.-YEAR ACCUMULATED ~O. OF EQUIVALENT lB-KSA AVERAGE APPROACH SPttO TO lHE OvERLAY lON~(MPH)
AVERAGE SPEED THRGUGH UVEhLAY lC~E (OVERLAY CIHELTICNI I~PHI
AVEKAGE SPEED THROUGH OVERLAY LONE (NON-OVERLAY LIRECTIONI (MPHI PROPCRTION OF ADT ARRIVING EACH HIUN OF CUNST~UlTICN (PERCENT) PtKCtNT TRUCKS IN AOl
ENVIRONMENT AND SuB~RADt
•••••••••••••••••••••••• DISTRICT lEMPERATURE CONSTANT ,WtLLING PROBABILITY POTENTIAL VE~TICAL RISE (INCHESI SWELLING RATE CC~STANl
SU~GRADE STIFFNESS COtFFICIE~T
CCNSTRUCTION AND ~AINTENANCE DATA •••• * ••••• ~*.* •••• ~ ••••••••••••••
SERVICEA81LITY INuEX OF THE INITIAL STRUCTURE SERVICEA~ILITY INDEX PI AFTER AN OVERLAY MIN IMUM OVERLAY THICKNESS (I ~CI-1ESI OVERLAY CuNSTRUCTIUN TIME (HG~RS/DAY)
ASPHALTIC LUNCRETE COMPACTED OtNSIIY (TONS/C.Y.) ASPI-1ALTIC CONC~ETE PRODUCTION qATE (TONS/HGURI ~IDTh OF EACH LANE (FEET) FIRST YEAR COST OF ROUTINE MAINTENANCE (DOLLARS/LANE-MILE), I~CREMENTAL INCREASE IN MAINI. COST PER YEAR (DOlLARS/LANE-MILE)
DETOu~ DESIGN FOR OVERLAYS •••• * •••• * ••••••••••••••••
TRAFFIC MODEL USED DURING OVERLAYING TOTAL NUMBER OF LANES OF THE FACILITY NUMtlER OF OPEN LANES IN RE~TRICTED lGNE (OVERLAY DIIHCTHlNI NUMBEK OF OPEN LANES IN RESTRICTED ZONE (NON-OVERLAY DIRECT ION) DISTANCE TRAFFIC IS SLOWED CCVtRLAY DIRECTION) (MILES) DISTANCt TRAFFIC IS SLOWED (NON-OVERLAY DIRECTIONI (MILES) DETOUR DISTANCE AKOLND THE D\lERLAY LONE (NILES)
PAVING MATERIALS INFORP'ATION •••••••••••••••••••• * •••••••
3Y 13C • 647,2.
,,8940(0. 5(.0 2(,.C 5(.(1 5.~ g.o
.' I. ( (1.~5
5.(10 0.08 0.26
4.( 3.9 C.B 7.C 1. ,0
75.r 12.e
100.C0 10.CO
6 I 3 I.CO C'.c 0.('
MAHRIALS COS T STR. MIN. /lAX. SALVAGE, LAYER CODE NAME PER CY COEFF. DHTI-1 DEPTH per •
1 A LT. ~T. ACP 21.42 0.96 1.00 1.00 10.00 2 B ACP 15.108 0.96 1.50 1.50 10.CO
C BLACK tlA SE n.93 0.96 2.50 10.00 30.00 4 U CRUSHEO S TONt 4.4( 0.00 1('.00 18.00 80.00 5 E: LIME TREATED SU8G 2.40 0.40 b.OO 6.00 10Co.00
Fig 25. FPS-ll input data listing.
SI
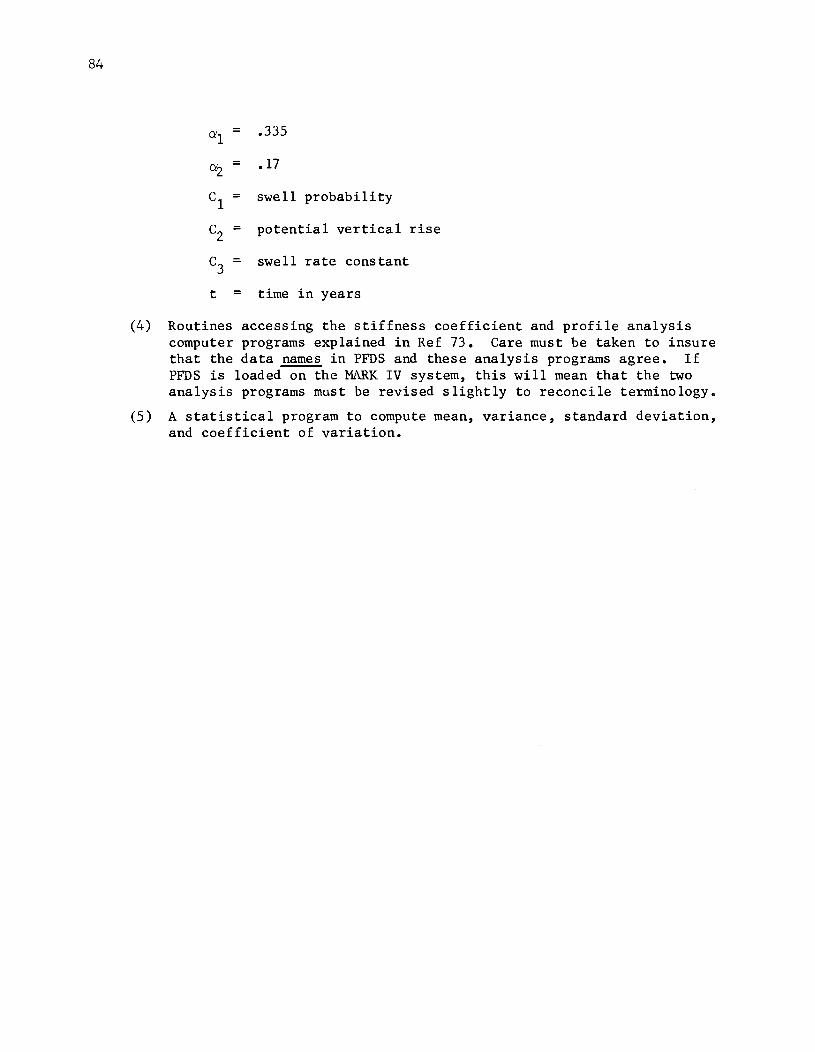
84
0'1 = .335
0'2 = .17
C = swell probability 1
C = potential vertical rise 2
C3 = swell rate constant
t = time in years
(4) Routines accessing the stiffness coefficient and profile analysis computer programs explained in Ref 73. Care must be taken to insure that the data names in PFDS and these analysis programs agree. If PFDS is loaded on the MARK IV system, this will mean that the two analysis programs must be revised slightly to reconcile terminology.
(5) A statistical program to compute mean, variance, standard deviation, and coefficient of variation.

CHAPTER 9. PFDS INFORMATION POTENTIAL
PFDS Equals Information
The fundamental purpose of PFDS is to provide the engineer manager with
"information," not just "data." Charles Kriebel of Carnegie-Mellon University
emphasizes the importance of distinguishing the difference (Ref 51). While
data are simply various forms of facts, information is the intelligence of
retrieved data when put to use in context. This important distinction is that
the information system (PFDS) should require focusing on the management func
tions in addition to the pure data processing activities. It is the purpose
of this chapter to illustrate how PFDS addresses the information needs of the
highway engineer users. In some respects, it could be considered the most
important part of this report.
It is appropriate to recognize three distinct groups of potential PFDS
users:
(1) the District Engineer and his staff,
(2) the administrative headquarters and divisions, and
(3) researchers.
Each of these groups will have a different type of information need. This was
also discussed briefly in Chapter 7, Data Sampling, wherein the impact of data
use upon sampling was considered. Throughout this report, an attempt has been
made to emphasize the end use of data and the importance of building a data
system responsive to the users.
Illustration of the potential use of PFDS by each of the above groups is
given in the following sections. These illustrations are typical inquiries
that might come from the engineer or manager and a typical response output
from PFDS. It must be emphasized that the inquiry examples presented are not
coded in any particular system except Figs 28 and 29; these two figures il
lustrate the MARK IV system. Emphasis has been placed on clarity rather than
programming and coding accuracy.
85

86
Information for District Management
This user group is considered first for a very good reason. In most
respects, the highway engineering job is being done by these field personnel
and PFDS must therefore answer their needs first. As is pointed out in Chap
ter 10, the districts should be consulted early in the pilot implementation
phase to insure that their needs will be satisfied.
The District Engineer is constantly faced with the judicious allocation
of his men, money, and material resources to maintain the best possible high
way system for the traveling public. PFDS can help him do this.
Serviceability index (SI) and skid resistance coefficient are two of the
most important parameters to indicate how well a highway pavement serves the
public. Therefore, when either or both of these factors begin exhibiting
minimum values, it is time to perform some kind of maintenance or reconstruc
tion. If this condition is further complicated by a relatively high use (high
traffic) of the highway, the need for corrective action may become urgent.
Assuming data for these three parameters have been taken on the district
highway network, the retrieval of the roughest, (low SI), or most slippery
(low skid resistance coefficient) or high traffic (AADT) highway sections would
be a relatively time consuming task if the records are in manual form. Com
pound this situation by requesting the retrieval of all pavement sections
satisfying a specified constraint for each of the three parameters and the
task becomes significantly large.
PFDS meets this need head-on. Figure 26 illustrates the instructions
the District Engineer, for example, District 19, might give and the answers
he would get from PFDS. He has specified that he wants a listing of all his
pavements with an SI of 2.5 or below, a skid resistance coefficient of .35 or
lower, and a traffic volume (AADT) greater than 500 vehicles per day. The
computer output shows 14 sections that meet these conditions. This is a sim
ple retrieval of the pavement sections identified by the record control key
discussed in Chapter 4. Variation of the output format is achieved simply by
adding the desired specifications to the request. For example, the District
Engineer may have wanted the milepoint limits instead of or in addition to
job number; a simple instruction to that effect would yield the desired infor
mation. The only constraint is that the requested parameter must be in at
least one of the PFDS, skid resistance, or D-IO files.
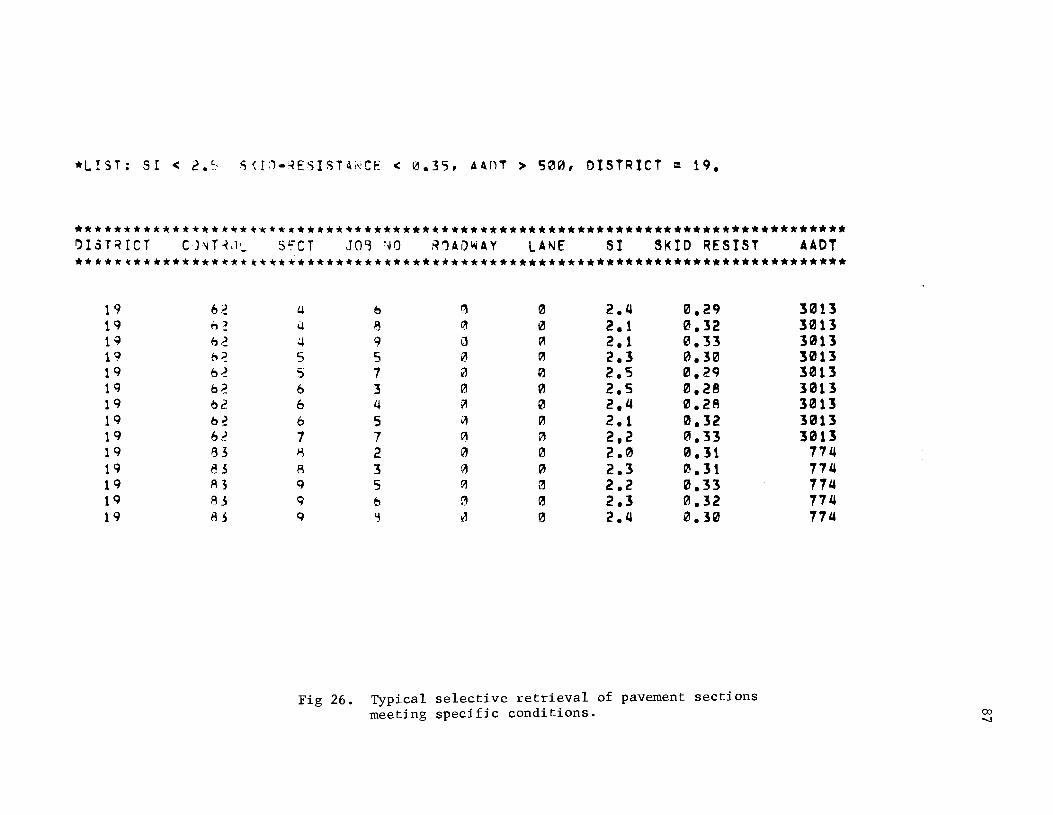
* L ! S T; S I < 2. t, S < ! ;') - ~ E 8 1ST 4 ;,! C E < 0. 3 5, A A D T > '500, 0 1ST RIC T = 1 9 •
********k******.**~*********************************** ************************** OI3TRrCT C')'JT~,l!.. S~CT JO'3 \10 K'1AD~AY LANE SI SKID RESIST A40T ****k~************~*********************************** **************************
19 62 1q h~
1~ 62 19 n~
19 6~ 19 b~
19 02 19 b~ 19 62 19 83 1q 83 19 83 19 83 19 8)
4 b '1 0 2.4 QJ.2q <J 8 ~ 13 2.1 0.32 .:,j 9 a ~ 2.1 0.33 5 5 0 t'l 2.3 0.321 5 7 it1 0 2.5 0.2C} 6 3 " 0 2.5 0.28 6 4 VI 0 2.4 e.2A 6 5 ~ " 2.1 21.32 7 7 0 3 2,2 121.33 ~ 2 " eJ 2.0 0.11 R 3 f~ " 2.3 0.31 q 5 ~ 3 2.2 21.33 q tI ~ 0 2.3 0.32 q OJ 111 " 2.4 0.3121
Fig 26. Typical selective retrieval of pavement sections meeting specific conditions.
312113 3013 3011 312113 3013 3013 3013 312113 3013
174 174 114 174 174

88
Information for Administration
Hithin the administrative user group are the Highway Commission, State
Highway Engineer, and the headquarters divisions. Their needs for various
kinds of information are often related to vital policy or programming actions
and are therefore important in support of district efforts.
One relatively common activity is the review of pavement and highway
designs accomplished by the districts. By combining their experience with all
districts, the headquarters design review staff can help to preclude potential
problems; they serve as a background upon which individual district problems
can be projected to secure new, more reliable perspectives.
An example of the use of PFDS by the headquarters design review staff
is illustrated in Fig 27. A district has submitted a set of plans specifying
an asphalt-treated base, and the review staff wants to examine performance
and location data on all pavements constructed with asphalt-treated bases in
the past ten years. The constraints placed on the retrieval operation are
those dictated by the particular design being reviewed. For the sake of sim
plicity, some important factors in pavement performance may not be explicitly
shown and are assumed to be constant or not an influence in this case. Note
that the PFDS output includes a computed value of serviceability loss per year.
This type of data manipulation can be specified as desired. Once such analysis
routines are written and used, they are catalogued and are available for uSe
later simply by calling them by name.
The numbers reflected in this figure do not necessarily allow any con
clusions about asphalt-treated base design. The real point of the illustra
tion is that a tremendous amount of data has been screened to yield the desired
information. If done manually, such an effort would entail months of effort;
with PFDS, answers are available in minutes. Furthermore, no data are over
looked or forgotten as is frequently true with manual systems. The engineer
is truly provided with the best possible feedback information to help him in
his decision process.
Figures 28 and 29 illustrate the same retrieval operation in the MARK IV
system. The initial complexity of the tabular format is quickly moderated
after some brief study of the form. Training and experience with the system
is needed to fully appreciate the simplicity and all of the advantages de
picted here. For example, note that the four entries of the numeral one in
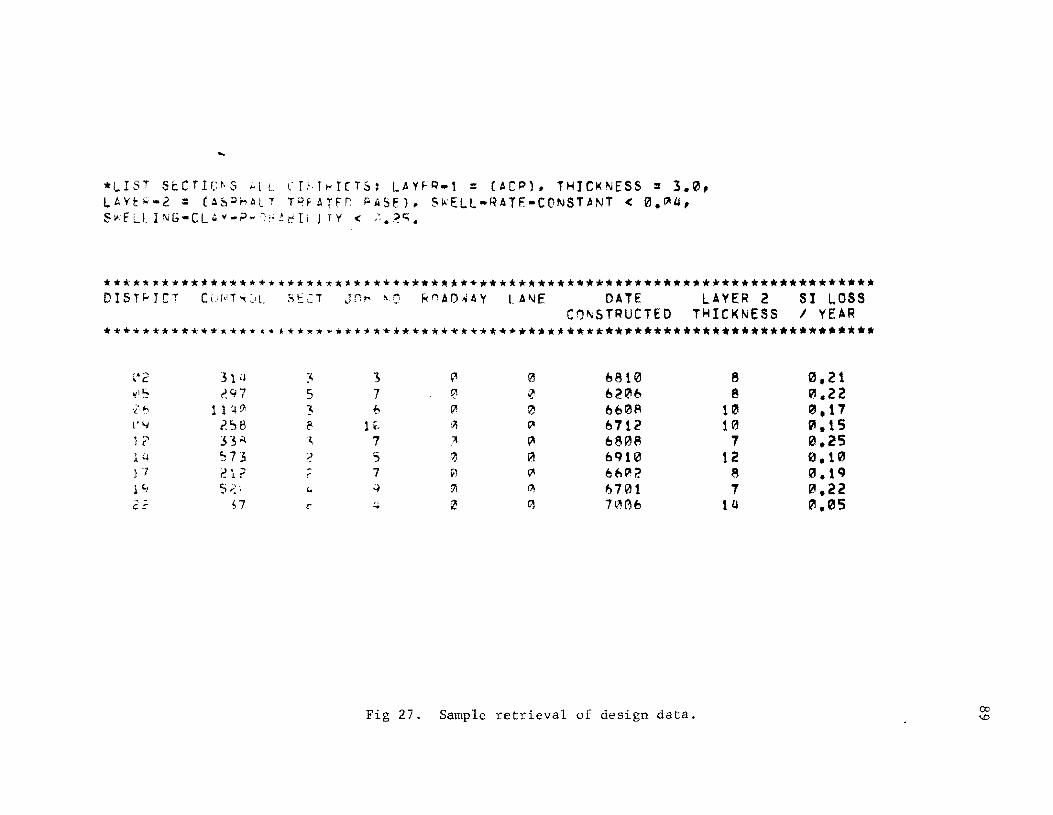
* L r S T S t c r Jr.;~':3 .:. l L I: I .c.r ~ rc T S: L A H P - t = (~ C P). T I-i I C K N E S 5 = 3 • 121 , LAYt R-2 = (ASPhALT TPFATFn ~ASE). 5~ELl-RATE-CONSTANT < 0.~", S \l<J f L I. 1 N G .. C L ..... - p .. '>; ;~ t:'ll ) r Y < ,;. 2 C; •
***********************~*j************+******************************~********** DIS T ~ r ere (Ii-! T '<J LSI:': .:: T J n '"' /'." RnA D .oi 4 Y L A "I E 0 ATE LAY E R 2 S I LOS S
C~~STRUCTED TI-iICKNESS I YEAR ************~** •• *~***~?******.*************************************************
{42 31 ~J :1, , '"
0 6810 8 O,21 I!l~ ,J,97 5 7 0 0- 62~b e "'.22 ·z~ 1140 3 /:, (i! ~ 661218 10 121,17
"" ?'~8 8 lL fi\ (;' ~712 10 "',15 1 ? :.n'" .~ 7 ~ ~ 6808 7 0,25 14 ':,73 2 5 r;, 0 6<)1121 12 " .10 1 ., 21? r 7 Vl (i! 6 b(::A 2 8 ((1.1<) 1 () 5;':: '"
q 91 I?\ b701 7 0.22 C:~ $7 c- " QI ~ 7~~b 11.1 121,05 ...
Fig 27. Sample retrieval of design data.
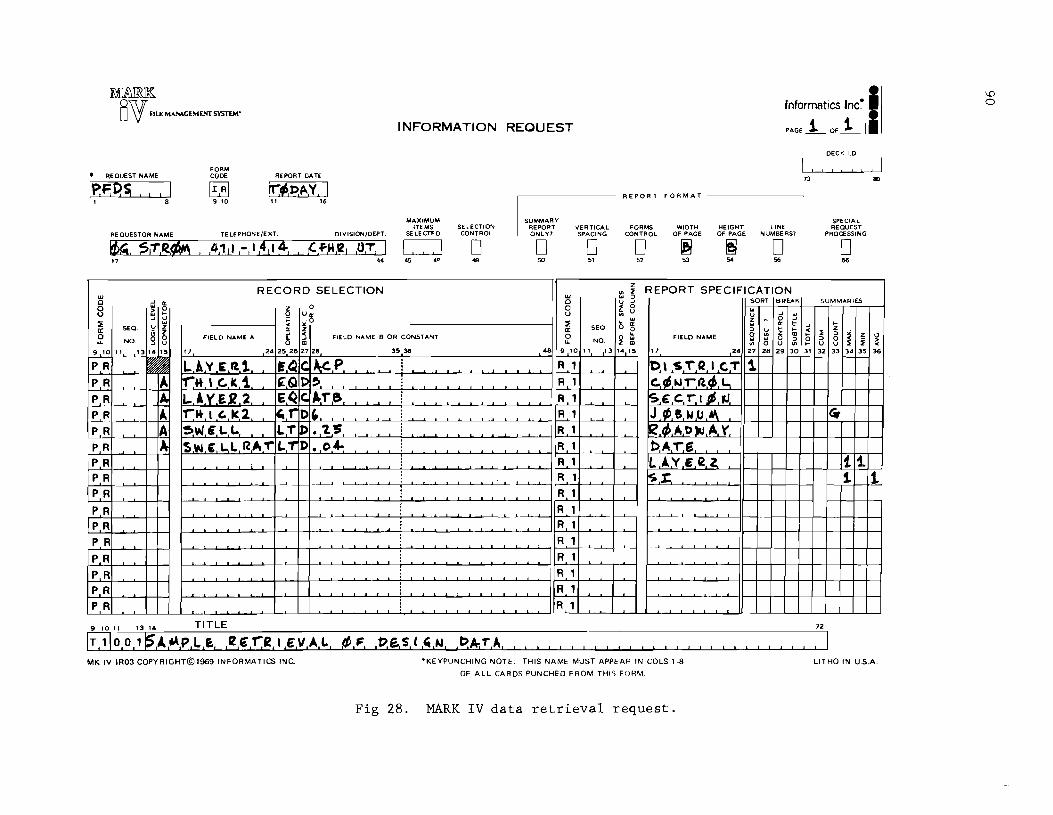
INFORMATION REQUEST
• RE QUEST NAME
[p;F,Q$ , , 1
FORM CODE
M 9 10
REPORT DATE
ft~~A!Y, I 11 16
MAXIMUM ITEMS SELECTION
REQUESTOR NAME TELEPHONE/EXT. DIVISION/DEPT, SELECTEO CONTROL
~! s,T!g,~ ,4,1d ,-!I~,I~! ,C,f-,M,I2, !O~ I c=J 0 17 44 45 4P 49
RECORD SELECTION
9 1011 13 14 TITLE
SUMMARY REPORT QNLY7
D 50
VERTICAL SPACING
0 51
REPORT FORMAT
FORMS WIOTH HEIGHT CONTROL OF PAGE OF PAGE
D ~ ~ 52 53 54
• Informatics Inc~ •
P"GE~OF~ I DECK 1.0
I, !!!!! I 73 III
SPECIAL LINE
I REQUEST
NUMBERS7 PROCESSING
0 0 56 56
REPORT SPECIFICA SORT I BREAK SUMMARIES
I" '''~~" .. " lil!l! lJ ~. :'I! It>, , ,S ,T,Q, I ,<:. ,T (-=11t-+-t-+-I-+-I-+-l-l
~,SIS,~T,I1,¢~L, S,FZ,C,r,I ~,rJ, J~,w,u,,, rz.,¢,A,D )II ,A, y, Ib~,T'.s,
It 1. 11 '1
72
, I MK IV 'R03 COPYRIGHT@I969 INFORMATICS INC. ·KEYPUNCHING NOTE, THIS NAME MUST APPEAR IN COlS 1-8 LITHO IN U.s.A.
OF All CARDS PUNCHED FROM THIS FORM.
Fig 28. MARK IV data retrieval request.
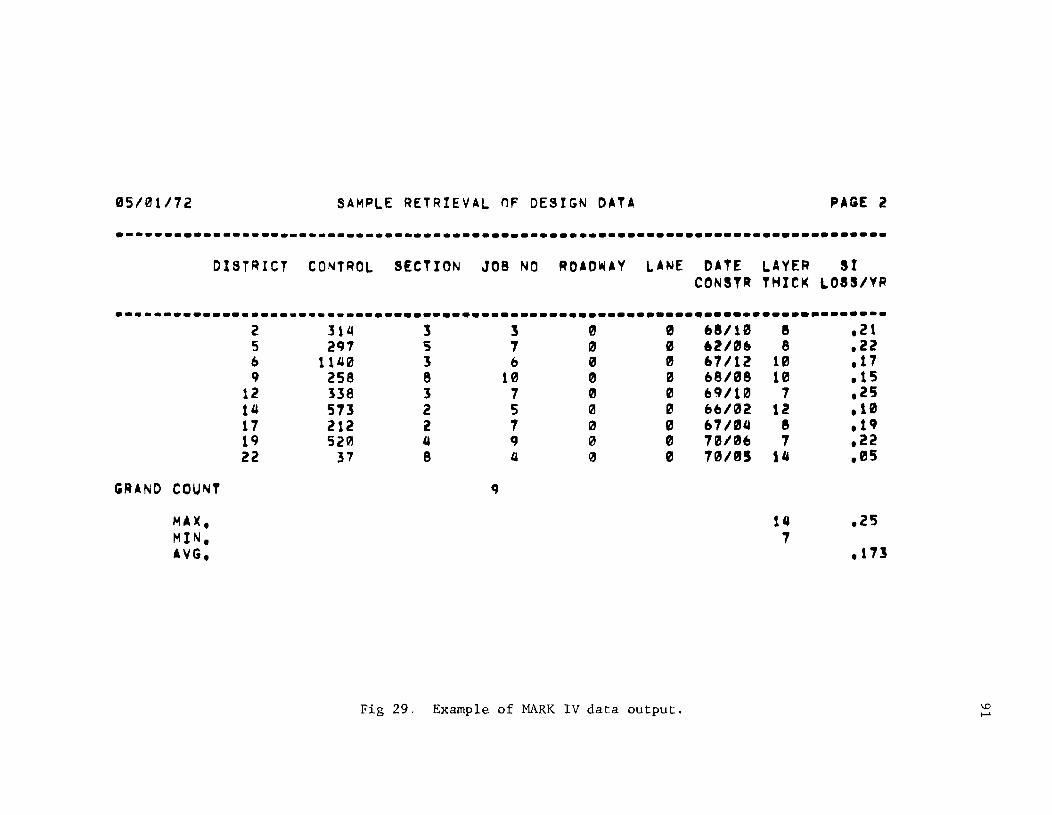
05/01/72 SAMPLE RETRIEVAL OF DESIGN DATA PAGE Z
.--........ ---...... _---_ ................ _--.........................•...•..•... DISTRICT CONTROL SECTION JOB NO ROAOIliAV LANE DATE LAVER 51
CONSTR THICI( LOS5/VR
•....... -... -.•. -....... _--.--.. -...... -........... -.........•....... _-....... ---2 314 3 3 '" 0 6a/10 a .21 5 2q7 S 1 121 0 61106 8 .22 6 114121 3 b 0 0 61/12 10 .17 9 258 8 10 0 0 68/08 10 ,15
12 338 3 7 '" 121 69/1121 7 .25 14 513 2 5 121 " 66/02 12 .10 17 212 l 1 121 " 61104 a .19 19 520 4 q 0 " 10/06 1 .22 22 37 8 4 111 " 10/05 14 ,05
GRAND COUNT q
MAX. 14 .25 tolIN, 1 AVG, ,113
Fig 29. Example of MARK IV data output.
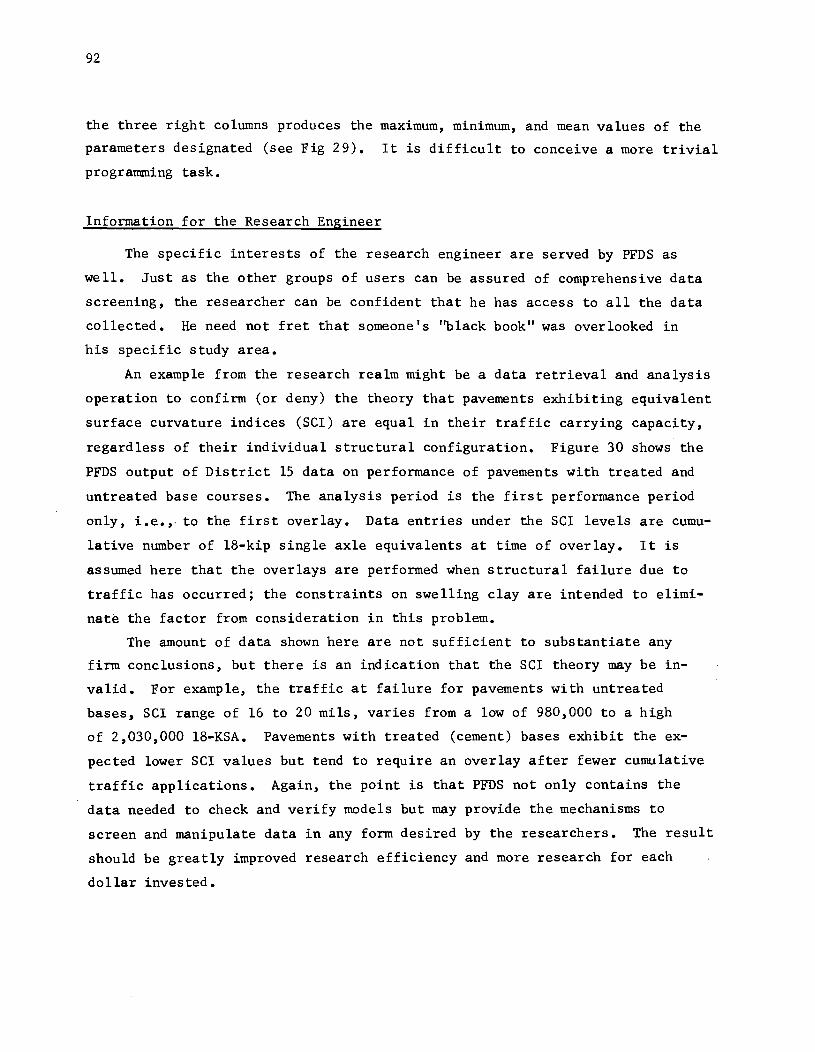
92
the three right columns produces the maximum, minimum, and mean values of the
parameters designated (see Fig 29). It is difficult to conceive a more trivial
programming task.
Information for the Research Engineer
The specific interests of the research engineer are served by PFDS as
well. Just as the other groups of users can be assured of comprehensive data
screening, the researcher can be confident that he has access to all the data
collected. He need not fret that someone's "black book" was overlooked in
his specific study area.
An example from the research realm might be a data retrieval and analysis
operation to confirm (or deny) the theory that pavements exhibiting equivalent
surface curvature indices (SCI) are equal in their traffic carrying capacity,
regardless of their individual structural configuration. Figure 30 shows the
PFDS output of District 15 data on performance of pavements with treated and
untreated base courses. The analysis period is the first performance period
only, i.e. ,. to the first overlay. Data entries under the SCI levels are cumu
lative number of 18-kip single axle equivalents at time of overlay. It is
assumed here that the overlays are performed when structural failure due to
traffic has occurred; the constraints on swelling clay are intended to elimi
nate the factor from consideration in this problem.
The amount of data shown here are not sufficient to substantiate any
firm conclusions, but there is an indication that the SCI theory may be in
valid. For example, the traffic at failure for pavements with untreated
bases, SCI range of 16 to 20 mils, varies from a low of 980,000 to a high
of 2,030,000 18-KSA. Pavements with treated (cement) bases exhibit the ex
pected lower SCI values but tend to require an overlay after fewer cumulative
traffic applications. Again, the point is that PFDS not only contains the
data needed to check and verify models but may provide the mechanisms to
screen and manipulate data in any form desired by the researchers. The result
should be greatly improved research efficiency and more research for each
dollar invested.
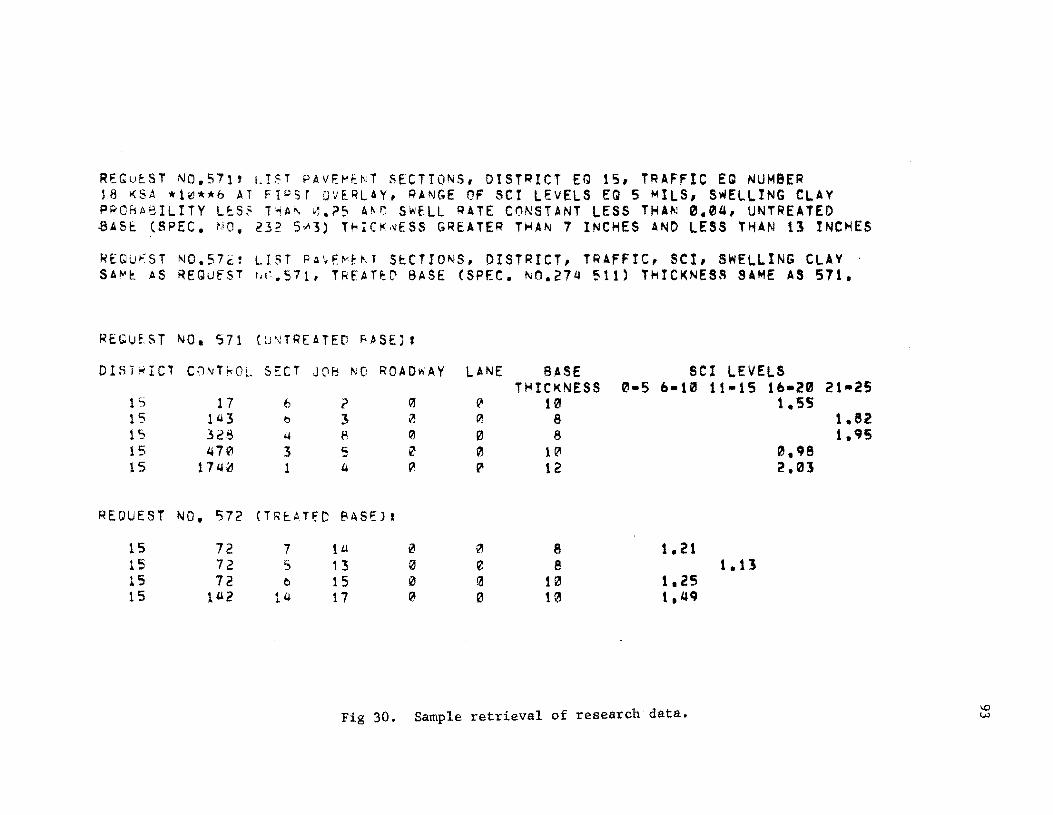
REGu~ST NO.571' I.IST PAVE~ENT SECTIONS, DISTRICT EQ 15, TRAFFIC EQ NUMBER '8 KSA *l~**b AT FIPST OVERLAY, QANGE OF SCI LEVELS EQ 5 MILS, S~ELLING CLAY ~RO~AeILITY L~S~ T~A~ 0.?~ A~O SWELL QATE CONSTANT LESS THAN 0.e~, UNTREATED 8ASE (SPEC. NO, 232 503) T~IC~NESS GREATER THAN 7 INCHES AND LESS THAN 13 INCHES
HEQU~ST NO.S7i: LIST PA~~~~~J S~CTIONS, DISTRICT, TRAFFIC, SCI, SWELLING CLAY . SA,..l: AS REQUfST r"~.511, TREATI":C' BASE (SPEC. "'0.214 511) THICKNES~ SAME AS 571.
REGuf.ST NO. 571 C .. H·.;rREATED F<~SU I
OI5ikICi C\I\lTkOL. 5::CT JClh NO ROADWAY LANE BASE SCI LEVELS THICKNESS 21-5 6-10 11-15 16-20 21-25
15 1 7 b ? ~ ~ 121 1.55 15 1'-13 0 3 ~ e 8 1.82 1'; 32·" ~ 8 III 0 8 1.'J§ 15 '170 3 c;; 0 0 1 et 0.'Je -' 15 17"~ 1 Li P. ~ 12 2.213
REQUEST NO. 572 (TRE:.AT~[; 81\50 I
15 72 7 1Ll ill 0 8 1.21 15 72 5 13 0 0 e 1.13 15 72 e 15 0 rd 121 1.25 15 1"2 1" 17 c;\ 21 10 1,~'J
Fig 30. Sample retrieval of research data.

This page replaces an intentionally blank page in the original --- CTR Library Digitization Team
CHAPTER 10. PFDS IMPLEMENTATION STRATEGY
The three major phases or stages of PFDS implementation are defined as
(1) administrative decisions and actions,
(2) pilot implementation, and
(3) revision and extended implementation.
Each of these stages is composed of several distinct steps or sub-stages, and
these are discussed in detail in the appropriate following sections.
Administrative Decisions and Actions
This grouping of specific steps should be considered priority actions
generally in the order discussed.
(1) Take immediate action to interface the skid resistance, maintenance, and proposed pavement feedback data systems. At the present time, D-SR has an operating skid resistance data system for Districts 14 and 19; D-1S is formulating a maintenance data system in Districts 19 and 21. Interaction of the responsible sections is imperative to insure that development efforts finally yield compatible but non-duplicative data systems.
(2) In coordination with D-S, D-lO, D-lS, and D-19, administratively designate the record control key to be used in all automated highway system data files. In addition to the three systems mentioned above, the D-IO data files RL-l, Traffic Log and RI-2 must be standardized with the same record control key.
(3) Proceed with implementation of the MARK IV data handling system as quickly as possible. This action should include:
(a) Training of D-S, D-lO, D-lS, and selected district personnel.
(b) Definition in MARK IV of PFDS files as now conceived.
(c) Redefinition in MARK IV of D-SR skid resistance files.
(d) Redefinition in MARK IV of RL-l, Traffic Log, and RI-2.
(e) Pilot runs of selected data file manipulations to check file and field compatibility.
(4) Procure the additional MARK IV features
(a) Indexed Coordinated Files, to permit random access to the data base, and
95
96
(b) Extended File Processing, to allow increased multiple file processing.
(5) Accomplish initial coordination between D-8 and D-IO with the objectives of
(a) eliminating isolated problems with existing milepoint designations,
(b) beginning the inclusion of milepoints in RL-l, and
(c) revising design procedures to simplify later posting of pavement projects to RL-l records.
(6) Select one or more districts to effect a pilot implementation of PFDS. This action should be guided by the trial implementation experience with FPS, the skid resistance data files and the maintenance data system now being formulated. Specifically, the districts to test PFDS should be selected from the following summary of the districts now working with the indicated design or data system:
FPS-ll
1
2
5
8
11
14
15
17
19
21
Skid Resistance
9
14
19
Maintenance
19
21
The selection of district(s) should also consider availability of special
equipment such as a Mays Road Meter. While no single district may be ini-
tially capable or desirous of pilot implementation of all PFDS fi les, enough
districts should be selected to permi t tota 1 coverage of the PFDS files (each
file being pilot implemented by at least one district).
Pilot Implementation
This phase should consist of the following specific steps:
(1) Conduct initial PFDS orientation session for selected districts. This should include an overview of PFDS concepts and its intended
interaction with the applicable D-lO data files, skid resistance data system, and maintenance data system.
(2) Immediate ly incorporate the essentia 1 factors specified by the selected districts and define/redefine the PFDS data files in
97
MARK IV accordingly. Selected districts(s) should review the Traffic Log, RL-l, and RI-2 with a view to evaluating acceptability of current data and/or pinpointing additional changes.
(3) Districts D-8 and D-10 should collaborate in development of some basic draft sampling plans to acquire the PFDS data on their respective interstate system. One or both of the research institutions should probably render assistance. This step should also include
(4 )
an inventory of existing district data acquisition procedures to
(a) evaluate suitability of existing data,
(b) effect necessary changes to existing data acquisition procedures,
(c) isolate new data collection requirements, and
(d) identify the logical district activity to carry out each PFDS data acquisition and reporting function.
Begin data collection state highway system. designed with FPS-II.
and insertion in MARK IV files for the interPriority should be given to those sections
(5) Perform some basic data file manipulations to test interactive characteristics of all PFDS and related files (RL-I, RI-2, etc.)
(6) Convene a workshop to include pilot districts and D-8, D-IO, D-18, and D-19, to evaluate the results of pilot implementation.
Revision and Extended Implementation
The preceding pilot implementation of PFDS should yield some very valuable
experience, thus making possible a first major revision to PFDS and associated
procedures, and permitting a markedly increased implementation participation.
Steps in this next phase are:
(1) Development and publication of PFDS instruction manuals. This must be a joint activity of the pilot districts, D-8, D-IO, D-18, and D-19. Again, the Texas Transportation Institute and/or Center for Highway Research could provide assistance in writing these manuals.
(2) Select additional districts to implement the full-scale PFDS. These districts should probably be those remaining on the FPS list shown previously. Conduct an orientation and training session for the new districts using manuals derived from the first step above.
(3) After a three-month trial period by the new districts, convene a feedback workshop to review findings. From this collection of experience, revise PFDS files and procedures as appropriate. Some
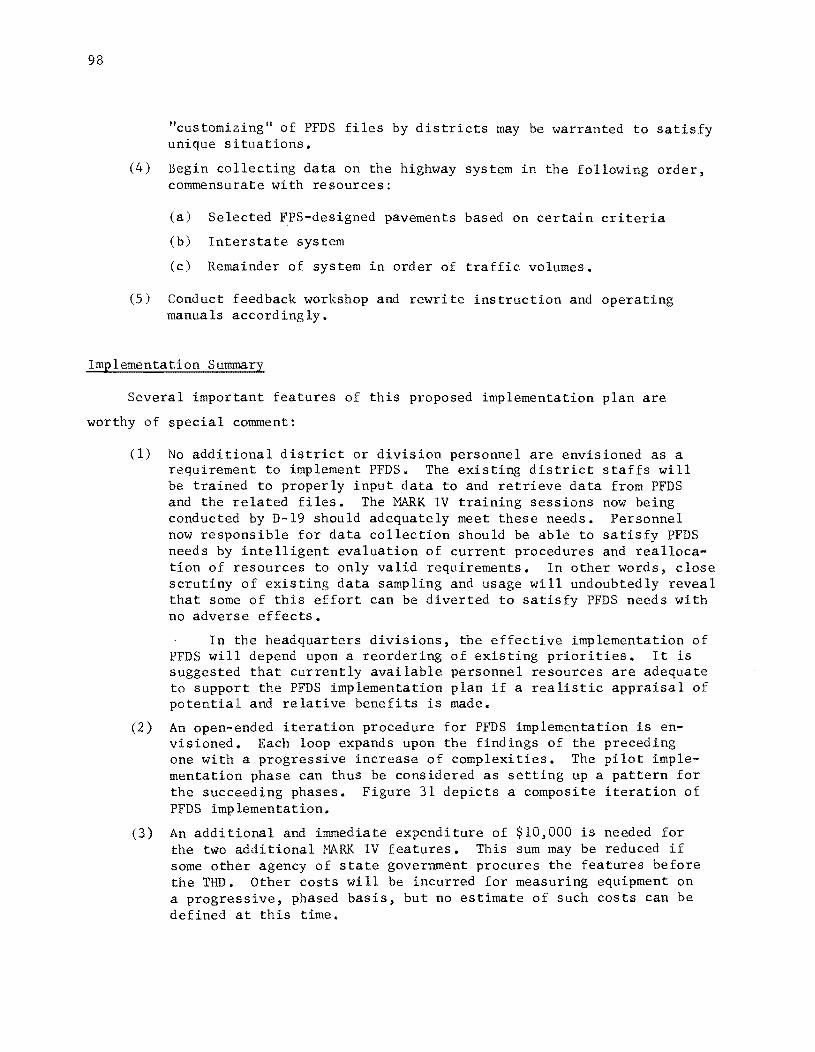
98
"customizing" of PFDS files by districts may be warranted to satisfy unique situations.
(4) Begin collecting data on the highway system in the following order, commensurate with resources:
(a) Selected FPS-designed pavements based on certain criteria
(b) Interstate system
(c) Remainder of system in order of traffic volumes.
(5) Conduct feedback workshop and rewrite instruction and operating manuals accordingly.
Implementation Summary
Several important features of this proposed implementation plan are
worthy of special comment:
(1) No additional district or division personnel are envisioned as a requirement to implement PFDS. The existing district staffs will be trained to properly input data to and retrieve data from PFDS and the related files. The MARK IV training sessions now being conducted by D-19 should adequately meet these needs. Personnel now responsible for data collection should be able to satisfy PFDS needs by intelligent evaluation of current procedures and reallocation of resources to only valid requirements. In other words, close scrutiny of existing data sampling and usage will undoubtedly reveal that some of this effort can be diverted to satisfy PFDS needs with no adverse effects.
In the headquarters divisions, the effective implementation of PFDS will depend upon a reordering of existing priorities. It is suggested that currently available personnel resources are adequate to support the PFDS implementation plan if a realistic appraisal of potential and relative benefits is made.
(2) An open-ended iteration procedure for PFDS implementation is envisioned. Each loop expands upon the findings of the preceding one with a progressive increase of complexities. The pilot implementation phase can thus be considered as setting up a pattern for the succeeding phases. Figure 31 depicts a composite iteration of PFDS implementation.
(3) An additional and immediate expenditure of $10,000 is needed for the two additional ~~RK IV features. This sum may be reduced if some other agency of state government procures the features before the THD. Other costs will be incurred for measuring equipment on a progressive, phased basis, but no estimate of such costs can be defined at this time.
t: o
'''';
4.J "'"' 4.J1lI...-I o 4.J
...-I t: p.
.,..; Q,l 0 p.. S 0
Q,l....:! ...-I '-"
~ H
N
Orientation for Selected Districts
Revision of D-lO Data
Develop Sampling Plan
Collect Sample Data
MARK IV Manipulation
Document Findings
Evaluation
Workshop
Orientation for More Districts
Additional Activities (Ana lys is)
p. Workshop o o
....:1
i{
----
Time
Fig 31. Composite iteration of PFDS implementation.

This page replaces an intentionally blank page in the original --- CTR Library Digitization Team
CHAPTER 11. CONCLUSIONS AND RECOMMENDATIONS
Conclusions
An operational PFDS for flexible pavement systems is dependent upon the
enthusiastic support and action of some user districts. The selection of one
or more districts to pilot test the system will serve as excellent implementa
tion and allow further refinement based on a wealth of experience and a variety
of viewpoints. However, care must be taken to prevent potential data pollution
discussed many times throughout this report.
The MARK IV file handling system provides THD with a powerful tool that
should generate benefits for all divisions and districts. This common file
handling environment may encourage a wider dissemination of vital highway
information that may generate interest in more record automation thus in
creasing the information potential in the Department. The pay-off should be
a more informed Department and a continually improving highway system.
Recommendations
(1) Begin immediately with PFDS implementation generally as outlined in Chapter 10.
(2) Perform appropriate research needed to define essential factors of maintenance; insert appropriately in PFDS as a special research file until verified by performance feedback.
(3) Begin identification of essential factors for rigid pavement design and management.
(4) Consider automation of the control section records in D-S.
(5) Evaluate need for a data files committee in THD to meet regularly to exchange information and eliminate data duplication.
(6) Using NWS temperature records, perform some within-district computations for temperature constant to ascertain whether localized values of this parameter would contribute to improvement in reliability of the FPS design procedure.
101

!!!!!!!!!!!!!!!!!!!"#$%!&'()!*)&+',)%!'-!$-.)-.$/-'++0!1+'-2!&'()!$-!.#)!/*$($-'+3!
44!5"6!7$1*'*0!8$($.$9'.$/-!")':!

REFERENCES
1. MSHO Committee on Design, "MSHO Interim Guide for Design of Flexible Pavement Structures," Highway Research Board, April 1962.
2. Altman, James W., et aI, ''Handbook of Hethods for Information Systems Analysts and Designers - Volume I," The Synectics Corporation, February 1971, NTIS* Document No. AD 725782.
3. American Association of State Highway Officials, "Proceedings, Committee on Computer Technology, National Conference," Albany, N. Y., Hay 1970, NTIS Document No. PB 204511.
4. Blessing, William E., "Coordinated Data System for Highway Planning," Highway Planning Technical Report No.7, Hay 1968.
5. Brown, James L., and Hugo E. Orellana, "An Asphaltic Concrete Overlay Design Subsystem," Texas Highway Department Research Report No. 101-lF, December 1970.
6. Bureau of Program Planning, HNDI System Planning Hanual, Wisconsin Department of Transportation, December 1, 1970.
7. Byrnes, Carolyn J., and Donald B. Steig, '~ile Hanagement Systems: A Current Sunnnary," Datamation, November 1969, pp 138-142.
8. Carey, W. N., Jr., and P. E. Irick, "The Pavement ServiceabilityPerformance Concept," Bulletin 250, Highway Research Board, January 1960.
9. Clapp, Lewis, "Interactive Programming Sys terns and Languages," Computer Rese.rch Corporation, July 1971, NTIS Document No. AD 728224.
10. Cochran, William G., Sampling Techniques, John Wiley and Sons, Inc., New York, 1963.
11. Committee on Theory of Pavement Design, '~eview of Existing Theories and Hethods of Pavement Design," Highway Research Circular No. 112, October 1970.
12. Corbato, F. J., "Sensitive Issues in the Design of Hulti-Use Systems," Hassachusetts Institute of Technology, December 12, 1968, NTIS Document No. AD 688560.
NTIS - National Technical Information Service, U. S. Department of Commerce.
103
104
l3. Darter, Michael I., "Applying Reliability Concepts to Pavement Design Systems," PhD Dissertation, The University of Texas at Austin, in progress.
14. Darter, Michael 1., B. Frank McCullough, and James 1. Brown, "Reliability Concepts Applied to the Texas Flexible Pavement System-FPS," a paper presented at 51st Annual Meeting of the Highway Research Board, January 1972.
15. Darter, Michae 1 I., and James L. Brown, "Probabilistic Design Concepts Input for FPS-7,1I Technical Memo 123-18, Center for Highway Research, The University of Texas at Austin, June 17, 1971.
16. Dearden, John, F. Harren McFarlan, and William M. Zani, Managing ComputerBased Information Systems, Richard D. Irwin, Inc., Homewood, Illinois, 1971.
17. Delaney, William A., "Predicting the Costs of Computer Programs," Data Processing Magazine, October 1966, pp 32-34.
18. Dinnerstein, Lawrence 1., "Compatibility plus Enhancement - The IBM System 370," Auerbach Info Inc., Data Processing Magazine, October 1970, pp 37-42.
19. Durbin, E. P., "Information System Design in Large Scale Logistic Systems," The RAND Corporation, September 1970, NTIS Document No. AD 712693.
20. Fetter, Robert B., and James H. Carlisle, I~an-Computer Interaction in a Decision-Making Environment," Yale University, March 1971 (Report No.1), NTIS Document No. 722336.
21. Fry, J. P., et aI, ''Data Ivlanagement Systems Survey," The MITRE Corporation, January 1969, NTIS Document No. 684707.
22. Fry, J., and J. Gosden, IISurvey of Management Information Systems and Their Languages," The MITRE Corporation, May 1968, NTIS Document No. AD 684706.
23. Gallo, Joseph C., and Donald J. Schilling, "Computer Programs to Detect Collusive Bidding on Public Contracts," Missouri Cooperative Highway Research Program Report 69-12, in cooperation with the U. S. Department of Transportation, NTIS Document No. PB 189322.
24. Glore, John B., I~ajor Problems of Generalized Data Management System Development," The MITRE Corporation, February 1970, M70-56.
25. Gosden, J., and E. Raichelson, "The New Role of Nanagement Information Systems," The MITRE Corporation, April 1969, NTIS Document No. AD 691834.
26. Granley, Edwin C., I!Quality Assurance in Highway Construction," Public Roads, Vol 35, No.9, August 1969~

105
27. l Greer, D. C., ''Research - 112 Percent Funds," Interoffice Memorandum to Mr. Dingwall, Texas Highway Department, October 23, 1962.
28. Haas, R. C. G., ''Developing a Pavement Feedback Data System," Research Report No. 123-4, published jointly by the Texas Highway Department; Center for Highway Research, The University of Texas at Austin; and Texas Transportation Institute, Texas A&M University, February 1971.
290 Haas, R. C. G., "Some Introductory Concepts for a Pavement Feedback Data System," Technical Memo 123-06, Project 123, Center for Highway Research, The University of Texas at Austin, June 8, 1970.
30. Haas, R. C. G., W. Ronald Hudson, B. F. McCullough, and James L. Brown, ''Developing a Pavement Feedback Data System," a paper presented to the annual meeting of Highway Research Board, Washington D. C., January 1972.
31. Haas, R. C. G., and W. R. Hudson, "The Importance of Rational and Compatible Pavement Performance Evaluation," prepared for presentation at the Highway Research Board Western Summer Meeting, Sacramento, California, August 17-19, 1970.
32. Head, Robert V., ''Management Information Systems: A Critical Appraisal," Datamation, May 1967, pp 22-27.
33. Ilead, Robert V., "The Elusive M.I.S.," Datamation, September 1, 1970, pp 22-27.
34. Highway Network Data and Information (HNDI) Section, "System Continuance Report," Wisconsin Department of Transportation, Madison, Wisconsin.
35. Highway Research Board, ''Development of Wisconsin's Integrated Operation System," Highway Research Record No. 326, 1970.
36. Highway Research Board, "Quality Assurance and Acceptance Procedures," Highway Research Board Special Report 118, 1971, pp 17-22.
37. Highway Research Board, '~tructural Design of Asphalt Concrete Pavement Systems," Proceedings of Workshop held December 7-10, 1970, Austin, Texas, (Preliminary Draft).
38. Hudson, W. R., F. N. Finn, B. F. McCullough, K. Nair, and B. A. Vallerga, "Systems Approach to Pavement Design," Interim Report NCHRP Project 1-10, submitted to National Cooperative Highway Research Program, Highway Research Board, March 1968.
39. Hudson, W. R., B. F. HcCullough, and Fred N. Finn, ''Factors Affecting Performance of Pavement Systems," Transportation Engineering Journal, Vol 95, No. TE3, American Society of Civil Engineering, August 1969, pp 505-519.

106
40. Hudson, W. Ronald, B. Frank McCullough, F. H. Scrivner, and James L. Brown, "A Systems Approach Applied to Pavement Design and Research, II Research Report 123-1, published jointly by the Texas Highway Department; Center for Highway Research, The University of Texas at Austin; and Texas Transportation Institute, Texas A&M University, March 1970 e
41. Hutchinson, B. G., and R. C. G. Haas, "A System Analysis of the Pavement Design Process," Highway Research Record No. 239, Highway Research Board, 1968.
42. IBM Corporation, "Data File Handbook, I, GC 20-1638-2 Third Edition, September 1969.
43. Informatics, Inc., '~RK IV File Management System - Can You Afford Not to Have It?," Sales Brochure, 1971.
44. Informatics, Inc., "MARK IV File Management System User's Guide," Document No. SP-69-8l0-3, July 1969.
45. Jain, Surendra Prakash, B. Frank McCullough, and W. Ronald Hudson, '~lexible Pavement System - Second Generation, Incorporating Fatigue and Stochastic Concepts," Report No. 123-10, published jointly by the Texas Highway Department; Center for Highway Research, The University of Texas at Austin; and Texas Transportation Institute, Texas A&M University, December 1971.
46. Jones, M. V., "Computerizing a Government Data System: A Management Overview of the Steps Required and the Time Needed," The MITRE Corporation, July 1969, NTIS Document No. AD 692784.
47. Kher, Ramesh.K., B. Frank McCullough, andW. Ronald Hudson, "A Sensitivity Analysis of Flexible Pavement System FPS 2," Research Report 123-8, published jointly by the Texas Highway Department; Center for Highway Research, The University of Texas at Austin; and Texas Transportation Institute, Texas A&M University, August 1971.
48. Konder, Robert L., and Raymond J. Krizek, "Factors Influencing Flexible Pavement Performance," NCHRP Report 22, Highway Research Board, 1966.
49. Kreger, Alan, and Janet Nathanson, "The Tribulations and Triumphs of GIS," Datamation, October 15, 1971, pp 20-25.
50. Kriebel, Charles H., "The Evaluation of Management Information Systems," Carnegie-Mellon University, September 1970, NTIS Document No. AD 723083.
51. Kriebel, Charles H., "Perspectives on Information Processing in Management Information Systems," Carnegie-Mellon University, August 1969, NTIS Document No. AD 695767.
52. Lemer, A. C., and Fred Moavenzadeh, '~n Integrated Approach to Analysis and Design of Pavement Structure," Highway Research Record No. 291, Highway Research Board, 1969, pp 173-185.

107
53. Lytton, R. L., "Prediction of Pavement Roughness Using Expansive Clay Theory," unpublished notes of study at Texas Transportation Institute, June 1971.
54. MacGowan, Roger A., "Computers and Data Processing - Expert Opinion Survey," Department of Defense Computer Institute, June 1968, NTIS Document No. AD 851541.
55. Madill, J. Po, and J. Kuss, "Study and Recommendations for Acquisition of Generalized Data Nanagement Systems," Report No.3, Simon-Fraser University, British Columbia, February 1971.
56. McCullough, B. Frank, James L. Brown, \.J. Ronald Hudson, and F. H. Scrivner, "Annual Report on Important 1970-71 Pavement Research Needs," Re-port No. 123-7, published jointly by the Texas Highway Department; Center for Highway Research, The University of Texas at Austin; and Texas Transportation Institute, Texas A&M University, April 1971.
57. McCullough, B. F., Ramesh Kher, and Phil Smith, "Identification of Pavement Distress Manifestations and Methods of Treatment," Study No. 3 - 8/18-72, Research Study Proposal to Texas Highway Department from the Center for Highway Research, The University of Texas at Austin, March 9, 1972.
58. MRI Systems Corporation, "System 2000," general information manual, Austin, Texas, 1971.
59. Peebles, Richard, '~esign Considerations for a Large Computing System with a Geographically Dispersed Demand," The Moore School of Electrical Engineering, March 1970, NTIS Document No. AD 702759.
60. Peterson, Dale E., W. Ronald Delis, and Dennis L. Mangrum, I~ System for Planning Roadway Improvements," Materials and Test Division, Utah State Department of Highways.
61. Pister, Karl S., "Some Remarks on Research for Structural Design of Asphalt Concrete Pavement Systems," a paper presented at Workshop on Structural Design of Asphalt Concrete Pavement Systems, Highway Research Board, Austin, Texas, December 1970.
62. "Placing Milepost Markers," letter from State Highway Engineer to District Engineers, Texas Highway Department, May 6, 1968.
63. Schlessinger, Bernard S., "Proceedings of the Scientific and Technical Information Seminar (5th) Held at Southern Connecticut State College, New Haven, Connecticut on April 9, 1970, II March 8, 1971, NTIS Document No. AD 722463.
64. Schwartz, J. 1., "Advanced Development Prototype - Final Report (Part I) to the Director, Advanced Research Projects Agency for the Period July 30, 1968 to January 30, 1969, II Systems Development Corporation, January 30, 1969, NTIS Document No. AD 683670.
108
65. Scrivner, F. H., and Chester H. Hichalak, "Flexible Pavement Performance R(·lated to Dc r lections, Axle Applications, Temperature, and Foundation t-lovcmcnts," Research Report 32-13, Texas Transporation Institute, Texas A&M University, College Station, Texas, 1969.
66. Scrivner, F. H., C. H. Michalak, and W. M. Moore, "Calculation of the Elastic Moduli of a Two Layer Pavement System from Measured Surface Deflections," Report No. 123-6, pub lished jointly by the Texas Highway Department; Center for Highway Research, The University of Texas at Austin; and Texas Transportation Institute, Texas A&M University, March 1971.
67. Scrivner, F. H., and W. H. Moore, "An Empirical Equation for Predicting Pavement Deflections," Research Report 32-12, Texas Transportation Institute, Texas A&M University, College Station, Texas, 1968.
68. Scrivner, F. H., W. M. Moore, W. F. McFarland, and G. R. Carey, "A Systems Approach to the Flexible Pavement Design Problem," Research Report 32-11, Texas Transportation Institute, Texas A&M University, College Station, Texas, 1968.
69. Scrivner, F. H., and W. M. Moore, "Some Recent Findings in Flexible Pavement De ctions," Research Report 32-9, Texas Transportation Institute, Texas A&M University, College Station, Texas, 1967.
70. Shahin, Mohammed Y., "Prediction of Low Temperature and Thermal Fatigue Cracking in Flexible Pavements," PhD Dissertation, The University of Texas at Austin, in progress.
71. Sundeen, Donald H., "General Purpose Software, II ===.;;...;;;;.,;;;.;;;.;; pp 22-27.
January 1968,
72. Texas Highway Department, Construction Manual, Construction Division, October 1966, Revised January 1971.
73. Texas Highway Department, Flexible Pavement Designer's Manual. Part I, March 1970.
74. Texas Highway Department, Highway Design Division Operating and Procedures Manual, 1970 Edition.
75. Texas Highway Department, Maintenance Manual, Maintenance Operations Division.
76. Texas Highway Department, "Plan Preparation Book I," a manual prepared by Instructor's School, Texas Highway Department by the Road Design Division, December 1952.
77. Texas Highway Department, "Roadway Code Chart, Road Life Studies,1J Planning Survey Division, January 1970.
109
78. Texas Highway Department, "Systems Analysis of the Planning Survey Division," Vols 1 and 2, Staff report prepared in cooperation with the U. So Department of Transportation, June 1, 1968.
79. Texas Water Development Board, "Conunittee Review of The University of Texas's Remote File Management System (RFMS)," Elect,ronic Data Processing Division.
80. The Austin American, "$200 Million Highway Skimp," Austin, Texas, July 31, 1970, p 4.
81. Utah State Highway Department, "Evaluation of Pavement Serviceability on Utah Highways," Interim Report 1969, Utah Project HPR 1 (8).
82. Vance, John A., ''Geographical Data Coding Grid," Proceedings, Canadian Good Roads Association, 1966, pp 265-278.
83. Vesic, Aleksander S., William H. Perloff, and Carl L. Monismith, editors, "Review of Existing Theories and Methods of Pavement Design," Circular Number 112, Highway Research Board, October 1970.
84. Walker, Roger S., Freddy L. Roberts, and H. Ronald Hudson, "A Profile Measuring, Recording, and Processing System," Research Report No. 73-2, Center for Highway Research, The University of Texas at Austin, April 1970.
85. Walker, Roger S., "Tentative Texas Highway Department Procedures for the Calibration, Operation and Control of the Mays Road Meter," Research Project 3-8-71-156, Center for Highway Research, The University of Texas at Austin, February 1972.
86. Wisconsin Department of Transportation, ''Data Needs Analysis," attachment to departmental correspondence, September 2, 1971.
87. Wisconsin Department of Transportation, "Highway Network Data and Information (HNDI) Report," a report of HNDI data retrieval examples.
88. Wisconsin Department of Transportation, flHNDI System Narrative," description of the Highway Network Data and Information (HNDI) System.
89. Wisconsin Department of Transportation, '~equirements and Specifications for the Defense Bridge Reports," System Continuance Report, May 13, 1971.
90. Witt, Arthur W., III, and B. Frank McCullough, "Characterization of the Swe lling Clay Parameter Used in the Pavement Design System," Research Report No. 123-3, published jointly by the Texas Highway Department; Center for Highway Research, The University of Texas at Austin; and the Texas Transportation Institute, Texas A&M University, August 1970.
llO
91. Wright, J. Eo, ''Developing a State-Wide Data Base in Texas," a paper presented at the Highway Research Board Symposium on Automation Systems for Highway Organizations, held at The University of Texas at Austin, August 16-18, 1971.
92. Yu, Francis C. F., "An Alternate Key for a Statewide Highway Information Retrieval System for the State of Texas," unpublished course paper at The University of Texas at Austin, December 1971.
93. Yu, Francis C. F., ''Design of a Computer-Based Information Retrieval System for Highway Planning," Master of Science Thesis, Montana State University, December 1970.
94. Yu, Francis C. F., "MARK IV," Technical Memo 123-25, Center for Highway Research, The University of Texas at Austin, March 29, 1972.

APPENDIX A
ABBREVIATIONS

!!!!!!!!!!!!!!!!!!!"#$%!&'()!*)&+',)%!'-!$-.)-.$/-'++0!1+'-2!&'()!$-!.#)!/*$($-'+3!
44!5"6!7$1*'*0!8$($.$9'.$/-!")':!
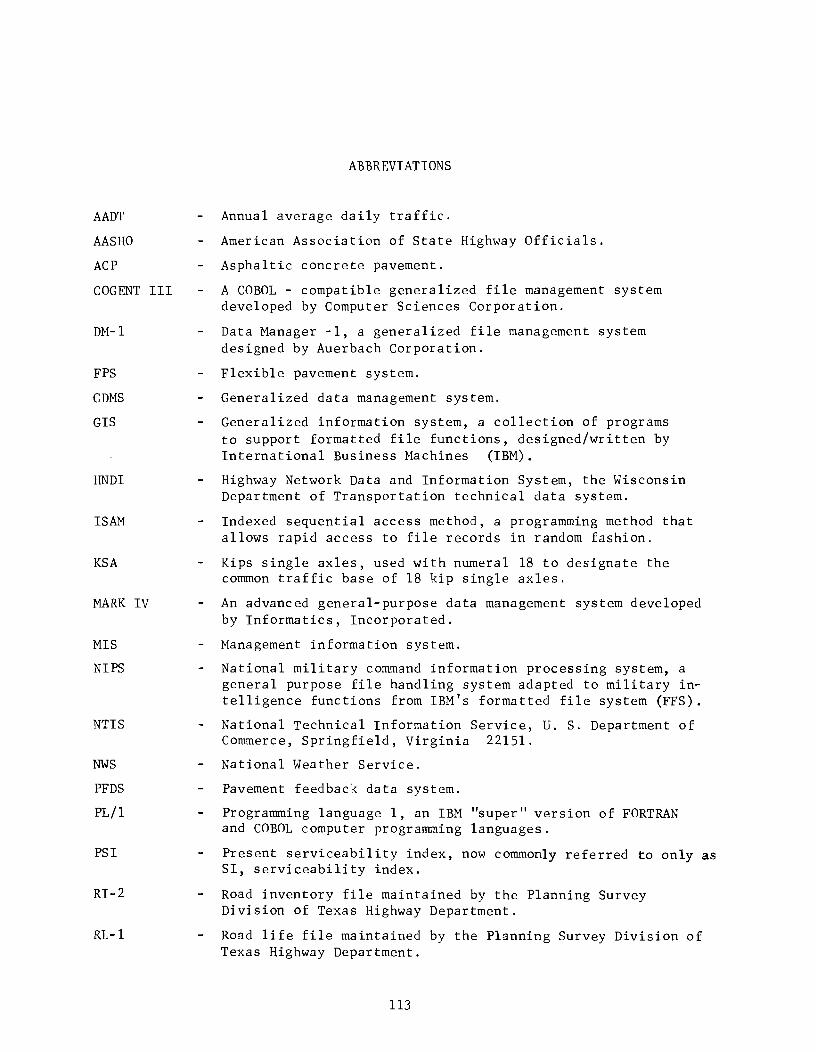
AADl'
AASHO
ACP
COGENT
DM-l
FPS
GDMS
GIS
HNDI
ISAM
KSA
MARK IV
MIS
NIPS
NTIS
NWS
PFDS
PL/l
PSI
RI-2
RL-l
III
ABBREVIATIONS
Annual average daily traffic.
American Association of State Highway Officials.
Asphaltic concrete pavement.
A COBOL - compatible generalized file management system developed by Computer Sciences Corporation.
Data Manager -1, a generalized file management system designed by Auerbach Corporation.
Flexible pavement system.
Generalized data management system.
Generalized information system, a collection of programs to support formatted file functions, designed/written by International Business Machines (IBM).
Highway Network Data and Information System, the Wisconsin Department of Transportation technical data system.
Indexed sequential access method, a programming method that allows rapid access to file records in random fashion.
Kips single axles, used with numeral 18 to designate the common traffic base of 18 kip single axles.
An advanced general-purpose data management system developed by Informatics, Incorporated.
Management information system.
National military command information processing system, a general purpose file handling system adapted to military intelligence functions from IBM's formatted file system (FFS).
National Technical Information Service, U. S. Department of Commerce, Springfield, Virginia 22151.
National Weather Service.
Pavement feedback data system.
Programming language 1, an IBM "super" version of FORTRAN and COBOL computer programming languages.
Present serviceability index, now commonly referred to only as SI, serviceability index.
Road inventory file maintained by the Planning Survey Division of Texas Highway Department.
Road life file maintained by the Planning Survey Division of Texas Highway Department.
113

114
SCI
SI
THD
HTSDOT
Surf~ce curvature index.
Serviceability index, synonomous with PSI:
Texas Highway Department.
Headquarters Divisions:
D-3 Finance
D-4 Equipment and Procurement
D- 5 Bridge
D-6 Construction
D-8 Highway Design
D-9 Materials and Tests
D-lO - Planning Survey
D-18 - Maintenance Operations
D-19 - Automation
Wisconsin Department of Transportation.

APPENDIX B
PFDS SPECIFICATIONS AND MACRO COMPARISON OF GDMS

!!!!!!!!!!!!!!!!!!!"#$%!&'()!*)&+',)%!'-!$-.)-.$/-'++0!1+'-2!&'()!$-!.#)!/*$($-'+3!
44!5"6!7$1*'*0!8$($.$9'.$/-!")':!
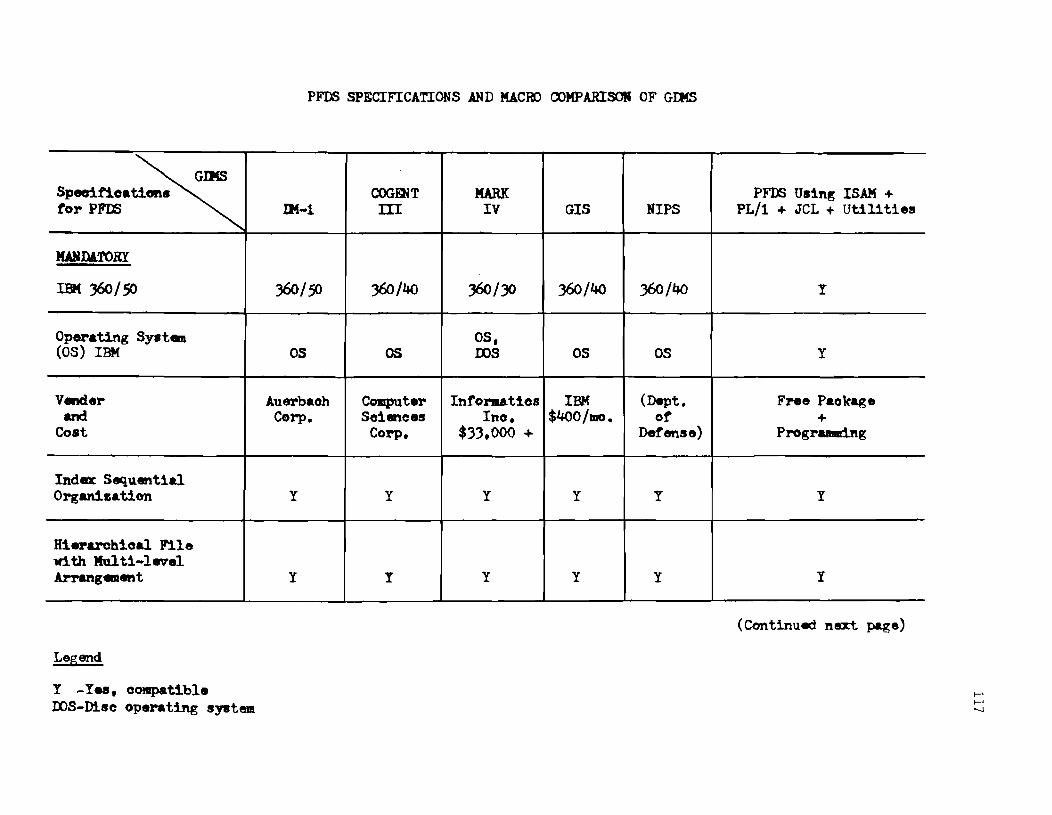
~ SpecificatiOfts tor PFOO
MANDATORY
IBM J60/~
Operating System (OS) IBM
V..mer and
Cost
Ind_ Sequential o rg&JdBation
Hierarchical File with Multi-level Arrang_ent
Legend
Y -Yes, compatible ooS-Disc operating syatem
PFOO SPECIFICATIONS AND MACRO OOMPARISOH OF GLMS
COG~T MARK PFDS Using ISAM + IIf-l In IV GIS NIPS PL/l + JCL + Utilities
360/!JJ )60/40 J60/30 360/4{J J60/4O y
OS, OS OS 005 OS OS Y
Auerbaoh Computer Inrol'!Utic8 IBM (Dept. FHe Paokage Corp. Sciences Ino. $4{)O/mo. or +
Corp. $J3.ooo + Defense) ProgrUlldng
y y y y y y
Y Y Y Y Y Y
(Continued next pa.ge)
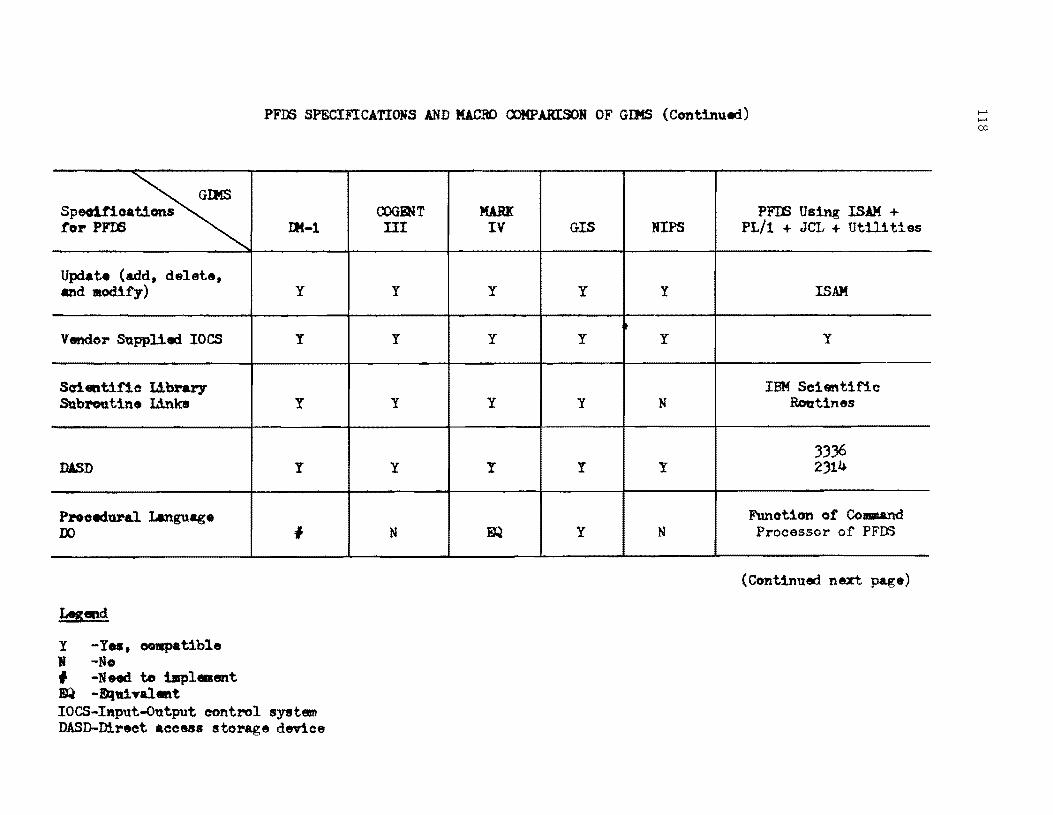
PFDS SPECIFICATIONS AND 'MACHO OOHP.A.RISOR OF GIJfS (Continued)
~ Speo11"ioatic:ms tOI" PP'IS
Update (add, delete, and aodify)
Vender Supp1l4ld IOes
Sciet11"1c Libnry Subroutine Links
DASD
Pl'Ocedval Language IX)
Y -Yes, oeapatible I -No f -Need to illpl_8I1t ~ -&l1I1"9'al_t
rM-l
Y
y
Y
Y
I
IOCS-Input-output control system DASD-Direct access storage devioe
OOGENT III
Y
y
Y
Y
N
M.A.RK PFDS Using ISJM + IV GIS NIPS PL/1 + JCL + Utilities
Y Y Y !SAM
y y y y
IBM Scientific Y Y N Routines
33J6 Y Y Y 2314
Funotion of Co-.and ~ Y N Processor of PFDS
(Continued next page)
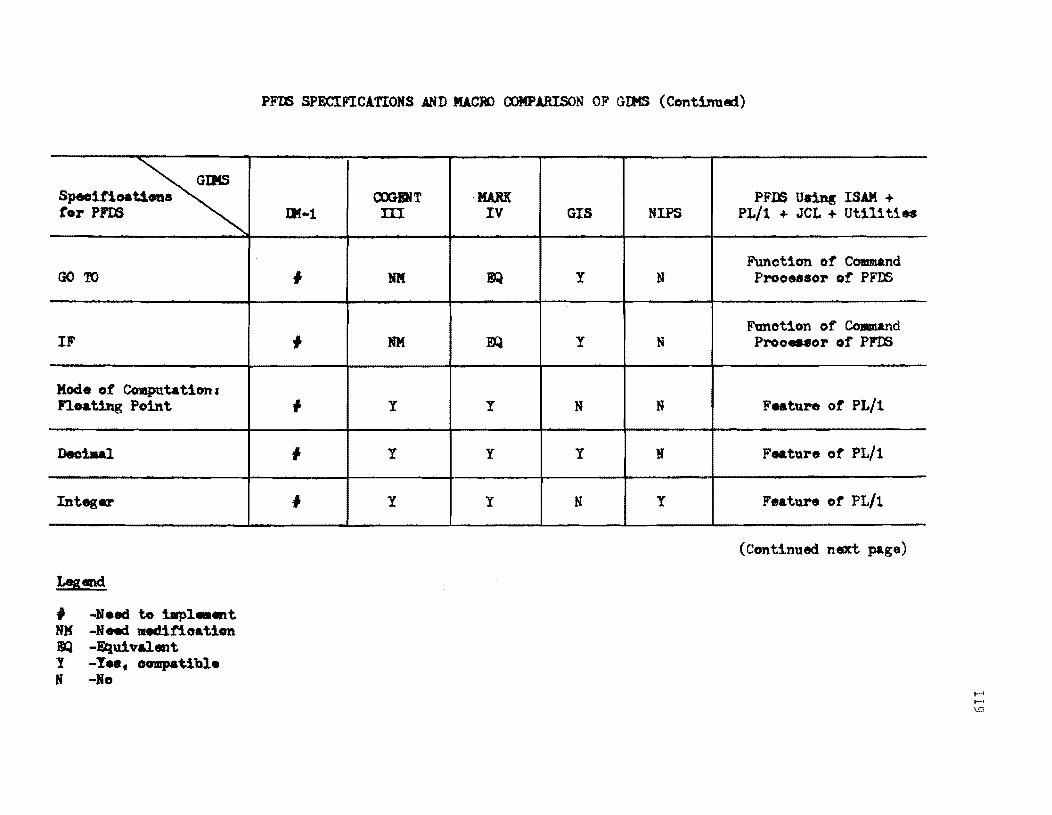
Speoilloat.1 •• ~ tor PFm
GO'ro
IF
Mode of Computation I n. .. t1ng Point
Deoiaal
Integ ..
LSIlfld
I -Need to impl_et NH -Need medifioation ~ -Equivalent y -Yes. oompatible N -No
PFIlS SPECIFICATIONS AND JQCRO OOMPJ.RlSON OF GIMS (Continue)
OOGBliT ·1WlK PFIS UaiD« ISAM + ))( ... 1 ill IV GIS NIPS PL/t + JCL + Utilities
Function of Command ., 11M 1R Y N Prooe •• or of PFDS
Funotion or Coamand ., 1M ~ Y N Prooeuor of PP'OO
., Y Y N N Feature of PL/t
., Y Y Y N Feature ot PL/t
I y y N Y Feature ot FL/1
(Continued next page)
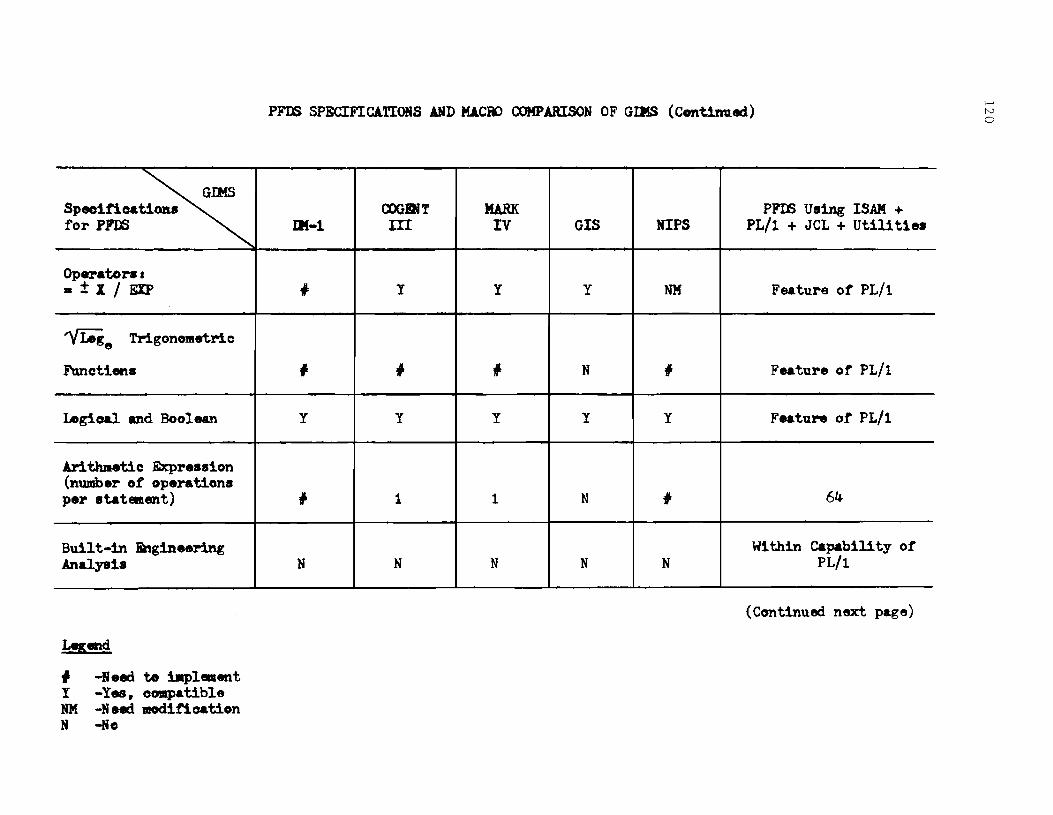
~ Speo11'icat1oa8 for P1m
Operators. • ± X I E'J:P
'YlAge TrigonOJlletrio
Ftmotions
Legioal and Boolean
Ar1 thmetio Expression (number of operations pel" statEllltmt)
Built-in Engineering Analysis
Legcd
f -N eed te iIlplement y -Yes, compatible NM -N eed modification N -No
PFIS SPECIFICATIONS ABD MACirJ COMPARISON OF GIIJS (Continued)
COGBNT MARK PP'I6 Using ISAM + IM-1 m IV GIS lfIPS PL/l + JCL + Util1tiea
# y y y NM Feature ot PL/1
I # I N I Feature ot PL/l
Y Y Y Y Y Feature ot PL/l
I 1 1 N # 64
Wi thin Capabil1 ty ot N N N N N PL/l
(Continued next page)
f-' N o
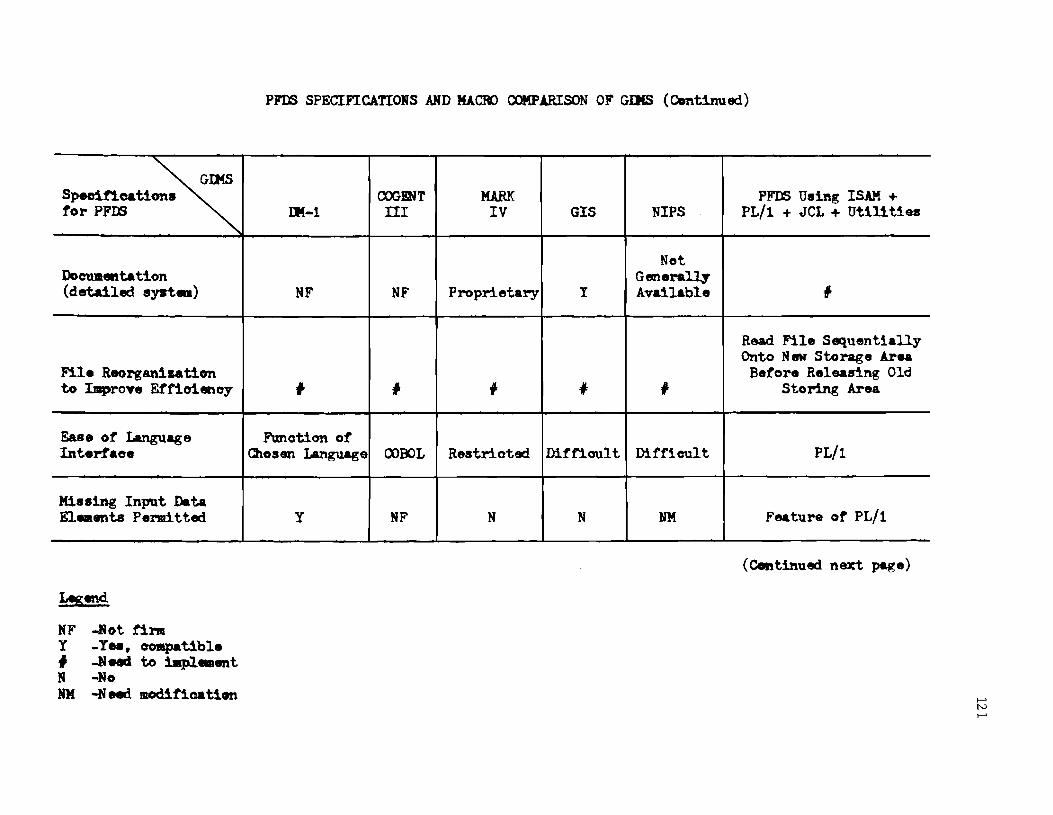
Specif'1cationa ~ tor PFOS
DoCWHfttation (detailed syst_)
File Reorganisation to Impro'Ye Effio1ency
Eas8 ot Language Interlace
Missing Input Data El_ent8 Permitted
lAgend
NF -Rot firm Y -Yea, COIIpatible f -N eed to t.pl._ent N -No 1M -N eed modification
PFDS SPECIFICATIONS AND MACBJ OOMPARISON OF GIllS (Continued)
COGl!NT MARK PFm Using ISAM + IM-l TIl IV GIS NIPS PL/l + JeL + Utilities
Not Generall.y
NF NF Proprietary Y Available ,. Read File Sequentially Onto N 8W Storage Area Betore Releasing Old
f # , # I Storing Area
Fanction ot Chosen Language OOBOL Restricted Ditfioult Difficult PL/l
Y NF N N NM Feature e>t PL/l
(CoIlt1llued next page)
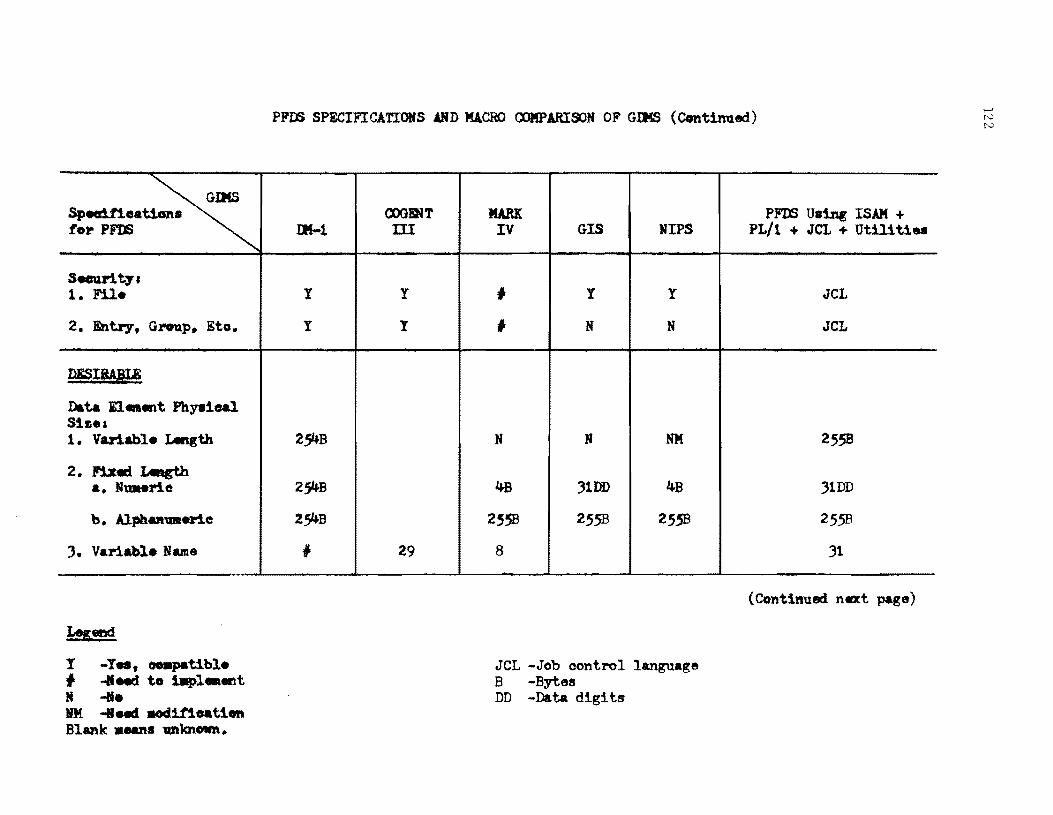
~ SpM1t1eat1cms to.,. PFnS
Seeurit.,'1 1. Fil.
2. Entry, Gl"OllP. Eto.
DlSI!AiI!
Data n .. ent Phy8ieal Siz., 1. Vuiabl. IMlgth
2. F1xed x..gth a. Nu:aeJ"ic
b. Alphauae1"ie
J. Vanabl. Name
Y -y .. , ooapat1bl. , ..If Md to illpl_lIlt N -If. 1M ...... aod1t1oat1Oft Blank .Nl'lS 1UllmOWft.
PP't6 SPECIFICATIONS ARD MACRO COMPARISON OF GJl(S (Contimud)
CX>GBNT IJ!-1 ill
1 Y
1 Y
2S4B
2S4B
2S4B , 29
MARK IV GIS NIPS
f y y
f N N
N N NM
4B 3100 4B
2S.5B 255B 2558
8
JCL -Job control language B -Bytes DD -Data digits
PFOO Us1n« ISAM + PL/1 + JCL + Utilities
JCL
JCL
2558
31DD
255B
31
(Continued nut page)
I-' N N
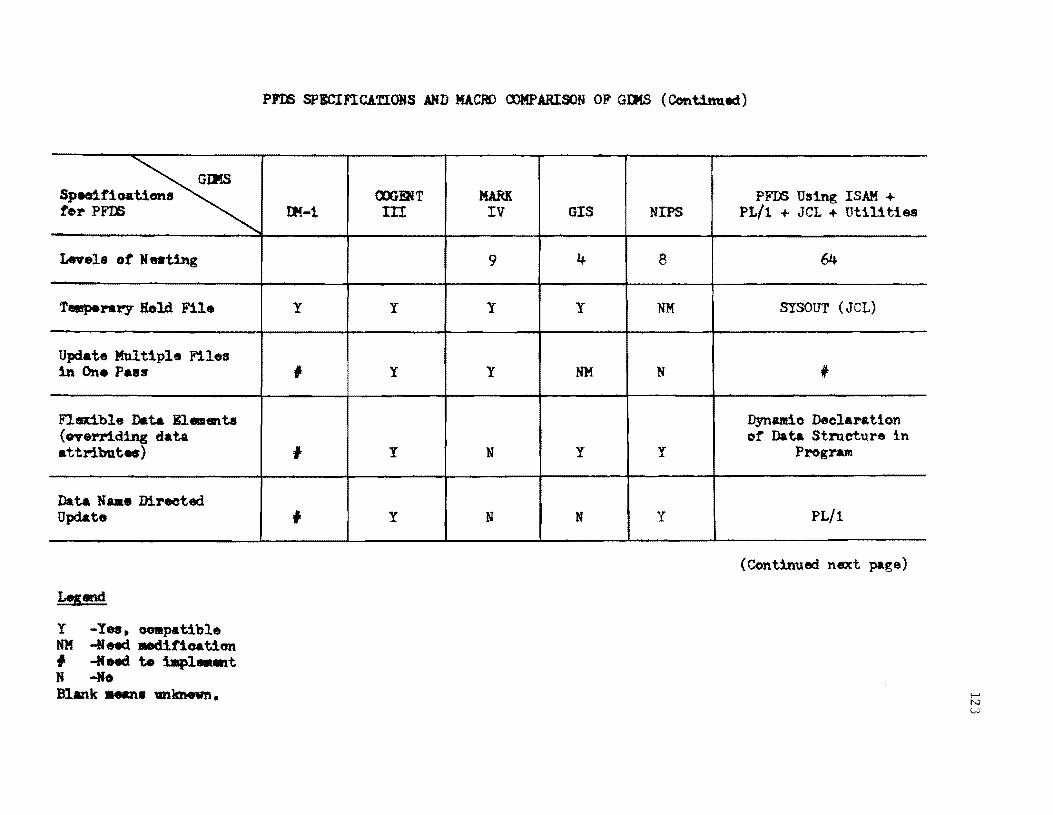
~ Spea1.tioations tor PFDS
Levels ot N nting
TempenpY Hold Fil_
Update Multiple Files in One Pass
Flerlble Data n_etU (ove!'1"1ding data attributw)
Data Naa. Directed Update
y -Yes, ooapatible NM -Need Mdit1oation I -Heed t. 1mpl __ t N -Ho Blank ...-nl unJ.m.ewn.
PFllS SPECIFICATIONS AND MACHO OOMPARISON OF GIIfS (Corrtirmed)
cxx;.DT MARK PFDS Using ISAM + 114:-1 m IV GIS NIPS PL/1 + Jct + Utilities
9 4 8 64
Y Y Y Y NM SYSOUT (JeL)
I y y NM N #
Dynamio Declantion or Data Structure in
I y N Y Y Program
I y N N Y PL/1
(Continued next page)
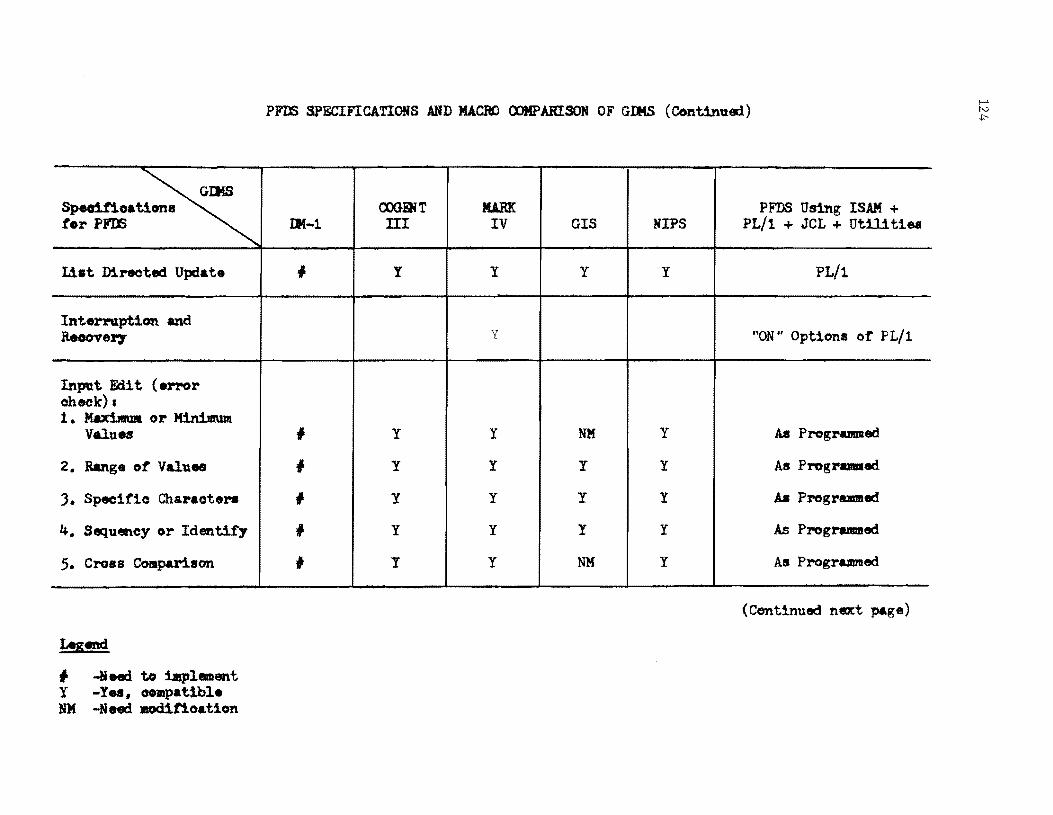
PFm SPECIFICATIONS AND MACflO OOMPARISON OF GlJotS (Continued)
~ Specifioations CXX}mT JU.RK PFDS Using ISAM + tor PFm lJI-l m IV GIS NIPS PL/1 + JCL + Utilities
U.t Directed Update # Y Y Y Y PL/l
Interrgpt10n and "ON" Options or PL/l Reoove17 y
Input F.d1t (eJ'l"Or check) I 1. Kt.ximulI or Minimum
Values I y y NH Y As ProgrUlllled
2. Rallg. ot ValuM I y y y y As ProgrUiled
3. Specific Charaotera I y y y y As Progrurmed
4. Sequen.cy or Identify f y y y y As Programmed
5. Cross Comparison # y y NM Y As Programmed
(Centinued next page)
Leg«td
I -Need to apl_ant Y -Yea, oompat1ble NM -Need BOdit1oat1on
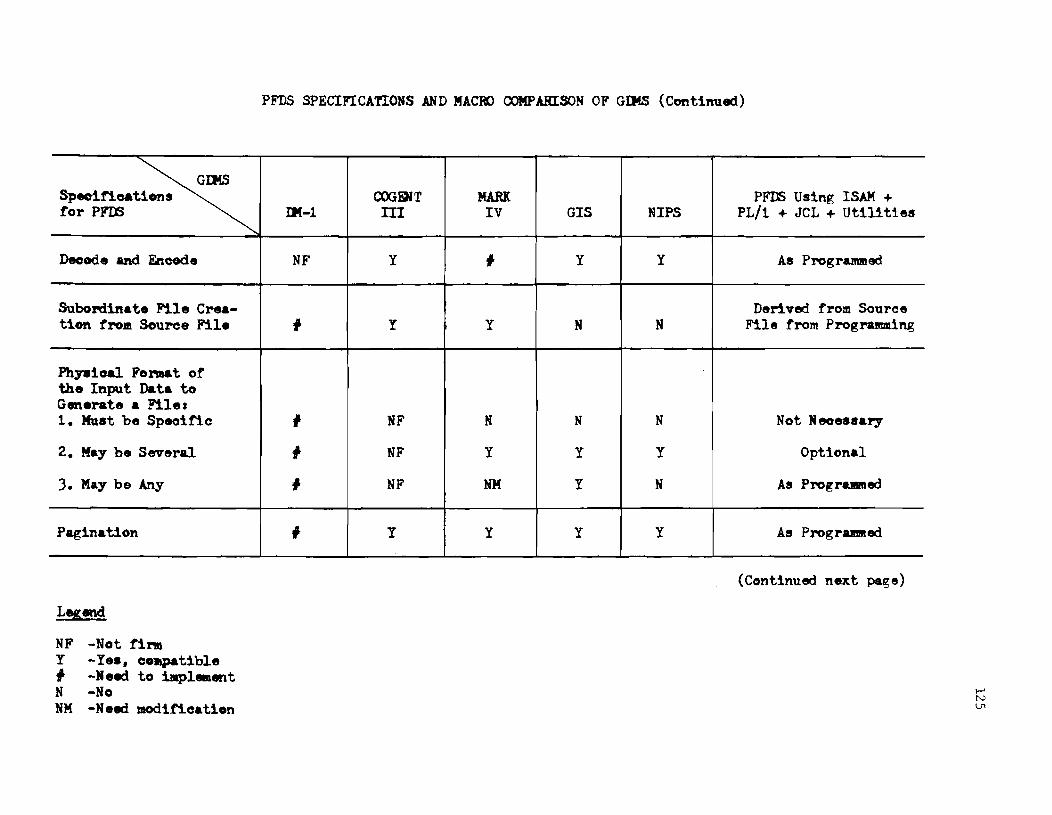
Specrl.fications ~ for PP'OO
Decode and Encode
Subordinate File Crea-t10n troll!. Source Fil.
Ph7Sioal Format of the Input Data to Generate a Files 1. Must be Specific
2. May b. Several
3. May be Any
Pagination
NF -Not fil"lll y -I •• , co~t1ble I -Need to iMplement N -No NM -Need modit1cation
PFDS SPECIFICATIONS AND MACRO OOMPARISON OF GrMS (Continued)
COOmlT MARK PFDS Using ISAM + IM-l TIl IV GIS NIPS PL/1 + JCL + Utilities
NF Y I y y As Programmed
Derived from Source I y y N N File from Progl"aJlmling
I NF N N N Not Ii eoesaary
I NF Y Y Y Optional
I NF NM Y N As Progr&lllllled
# y y y y As ProgrU!llleci
(Continued next page)
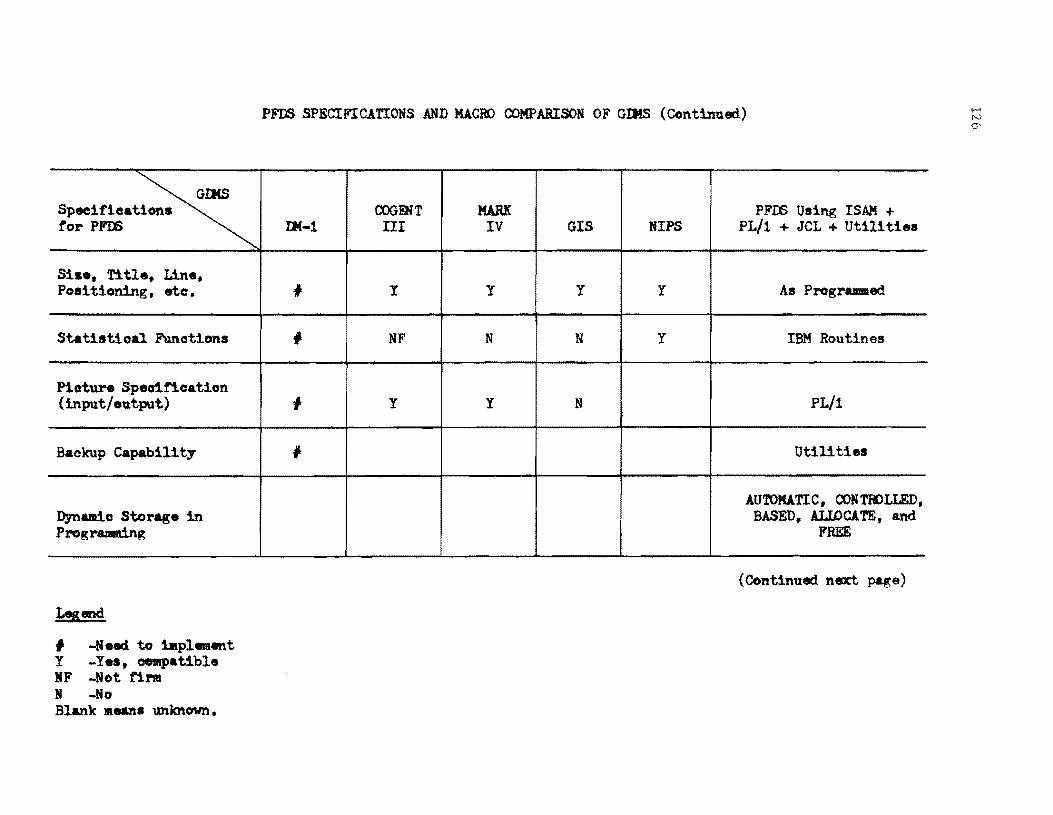
~ Specifioations for PP'DS
Sis., Title. Line. Positioning, etc.
Statistical Functions
Pioture Specification (input/output)
Baokup Capability
Dynamic Storage in Prograsing
Legend
# -N.eel to la.pl .. ent Y -Y •• , oempat1ble IF -Not fiN N -No Blank lIle&1'l8 unknown.
PFDS SPECIFICATIONS AND MACRO COMPARISON OF GIMS (Continued)
COGENT MARK PFDS Using ISAK + IJI-l TIl IV GIS NIPS PL/l + JeL + Utilities
* Y Y Y Y As Programm.ed
I NF N N Y IBM Routines
# y y N PL/l
I Utilities
AUroKlTIC, CONTROLLED, BASED. ALI.OCA TE, and
FREE
(Continued next page)
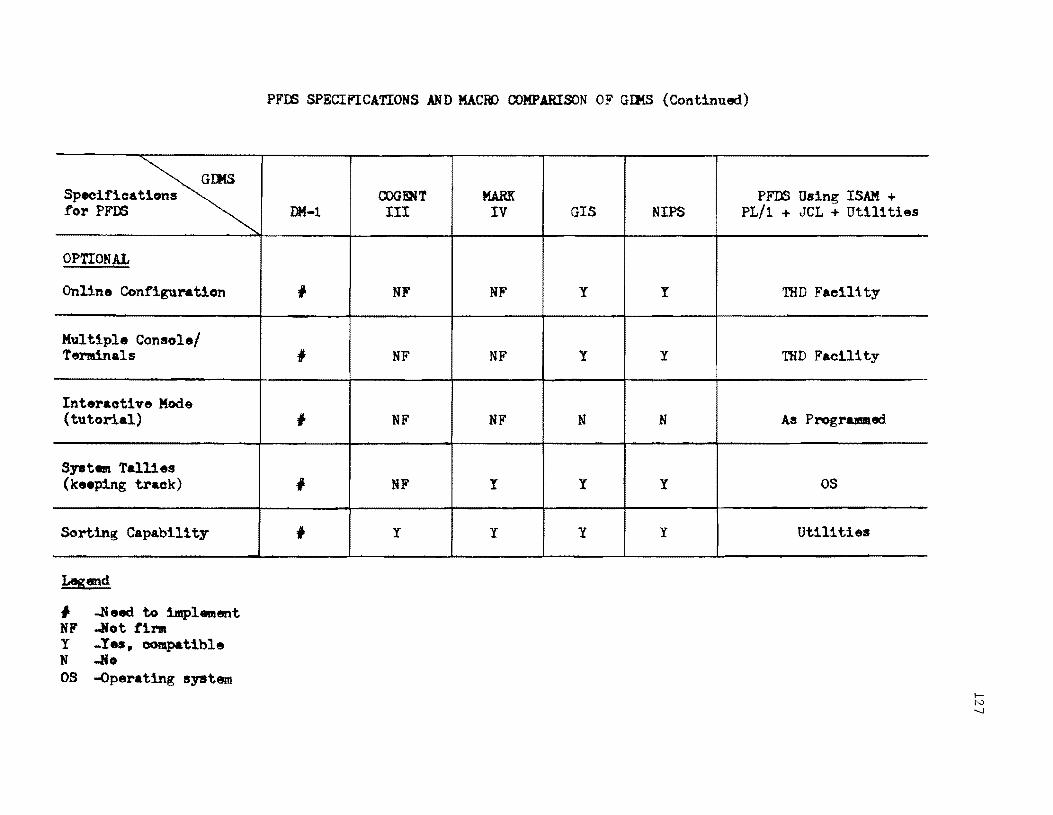
Specifications ~ for PFrB
OPTIONAL
Onlil'ut Configuration
Multiple Consolel Tendnals
Interactive Mode (tutorial)
Syetem Tallies (keeping track)
Sorting Capabill ty
Legend
I -N ead to 11Ilplement NF .Jlot 11", Y _Yes, compatible N ...He OS -operat.ing syst.em
PFrB SPECIFICATIONS AND MACRO OOKPARISON OF GJJlS (Continued)
OOGHNT MARK PFDS Using ISAM + ~-t III IV GIS NIPS PL/t + JCL + utilities
I NF NF Y Y THD Facility
I NF NF Y Y THD Faoility
I NF NF N N As ProgrUllll.ed
I NF I Y Y OS
I y y y y Utilities

This page replaces an intentionally blank page in the original --- CTR Library Digitization Team

APPENDIX C
TRAFFIC LOG CODING FORM AND SAMPLE FILE OUTPUT

!!!!!!!!!!!!!!!!!!!"#$%!&'()!*)&+',)%!'-!$-.)-.$/-'++0!1+'-2!&'()!$-!.#)!/*$($-'+3!
44!5"6!7$1*'*0!8$($.$9'.$/-!")':!
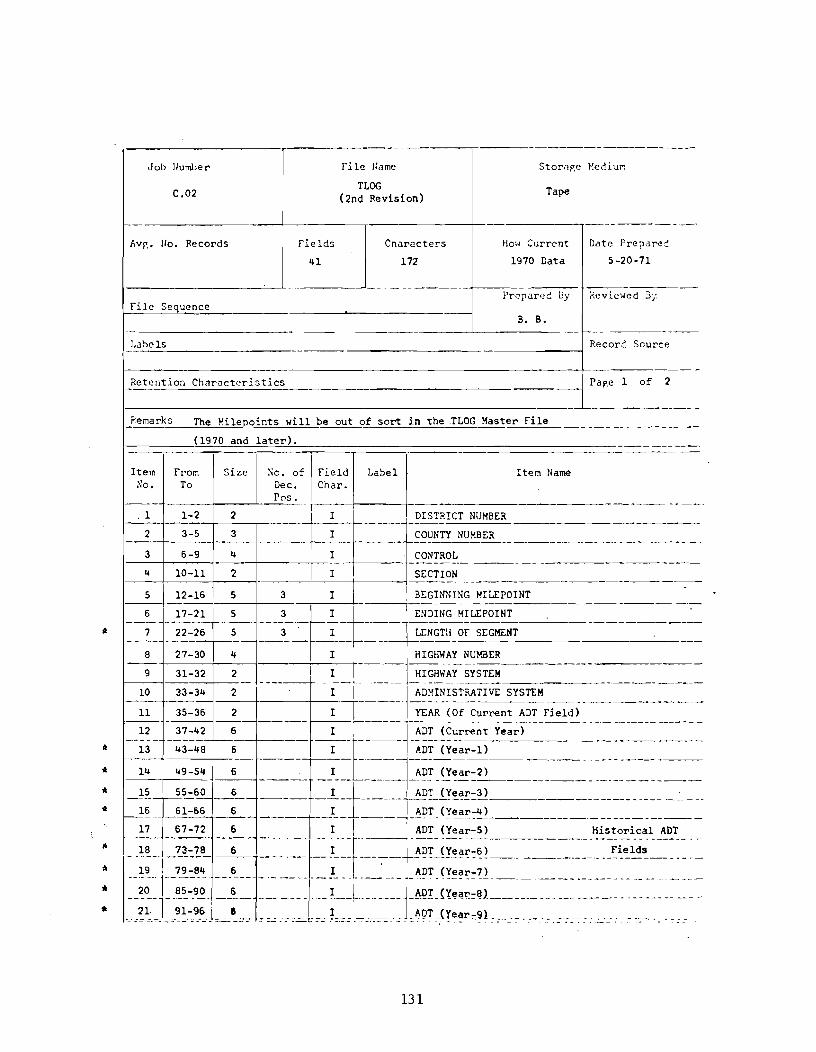
*
* * * *
* *
~il;-LOG-l;a-~e~--------;------- St~r-<1-p,-e ~e-d-i-u-l'l---- - ----
I (2nd Revision) Tape
Job liumber
C.02
--------------+-------,------_._-+----------.-------------Avr,. 110. Records
rile Sequence
fields
41
Characters
172
Ho" Current Date Prepa~~
1970 Data 5-20-71
B. B. r-----------------~---------J-------~--r_----------
LabelS Recor~ Source r-------------------------------------------j
Retention Ch~racteristics ~ -----'-'---'--'----'-'-~-'-"------~~~
Pap'e 1 of 2
_R_,e_m_a_r_k_s_~T~he~M,~.l~·l~e~p~o~i~n~t~s_w~l~·l~l~b~e~o~u~t_o~f~~s~o~rt~~in~t~h~e~T~L_O~G,_M_a~s~t~e~r_r~i~le _____________ _
(1970 and later).
Item rrom Size No. of I rield Label Item Name No. To Dec.
I
Char. Pos.
~----------------.-------------
1 1-2 2 I DISTRICT NUMBER ------~-----------------------------2 3-5 3 I COUNTY NUMBER -------------------3 6-9 II I CONTROL --~--------,---.------------4 10-11 2 I SECTION
I----~---+--~----+--~---~·---·--------------------~--------
131
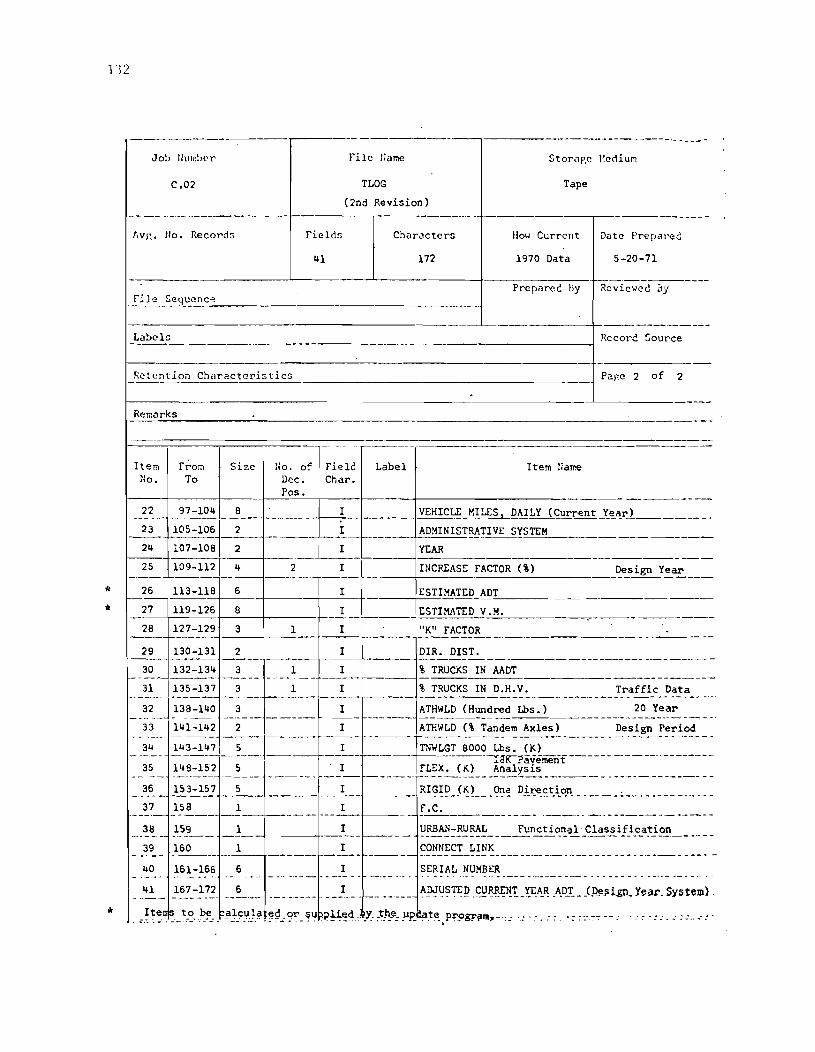
132
*
*
-------------- ------~--- ---------------------- -- .--
Job Ilumbl'r rilc Hame
C.02 TLOG Tape
(2nd Revision) ~-------------------4---------__,------------~--------------~--------------
flvf',. 110. Records Fields Char.Jctcrs Ilow Current llate Prepare:::
~1 172 1970 Data 5-20-71
---------------------~----------~-----------_4----------------~----------------Prcp.Jrc~ by Revic'.Ied 3y
file Se~u_c_n_c:'_'~ ____ , _______________________ __I
----------------------------------------------------~------------4_-------------~L~.J~~'_c~l'_s __________________________________________________________ ~ Rccore Source
Retention Characteristics
Remarks
Item No.
From To
Size 1'0. of Dec.
-----------------------------~ Parc 2 of 2
Field Label Item liame Char.
~----+_-----~----4_~Pos. ~----+--------------------------------------~_~7-10~ ~__ _ I _____ VEHICL!:=_M~~..LDAILY (Current lea~L) ________ _
23 _105-1.o~ _2 __ t-------t--}-e----- AD:-IINIST~'I'IVE SrS'::-TE=M:--_____________ _
2~ 107-108 2 I YEAR f-----+-------I-------i-------+----t------ ------------------------------ -----
25 109-112 ~ 2 I INCREASE FACTOR (%) I-----j------- -----1-------t---+--------+--------
~-2-6- 113-118 6 I ESTIMATED ~A~D_T=--__________________ _
27 119-126 8 I -f----- =E=-ST:...:I:.:.MA=TE=D=--:V_-=.-:;M-=.-. _________ ~--_-_____ _
28 127-129 3 1 I ' "K" FACTOR ----4------ ---- ----f-------~~-~~~~----------------------
29 _1_30-131 2 I _____ DIR. DIS~ _______________________ _
30 132-13~ 3 1 I % TRUCKS IN AADT f------------ ---- --------- ---- -----------
~_;~_~l;::~~~ =_;--=-_~ _ _=~-~-=_ :=~;~~:K~H;~::~ _____ ~=~~r~a::i~~~~!~--~~ 33 1~1-1~2 2 I ATHWLD (% Tandem Axles) Design Period
- --- -----r------- ------- --------------------------- ---------- ------3~ ~~~-1~2J_5 _______ ---~-f_--- ~GT 800~~~P~~~menf------ _______________ _
35 1~8-152 5 I FLEX. (K) Analysis -- --- ------- ---- ------- --- -------1---------------------------- --- ------------_l~ _15_~ __ 5 _______ ~I--- ____ RIGID __ E~! __ Ql2~_~r.:e_c_tion ______ ~ _______ .. __ _
___ :7 __ 1_5!__ 1 I __ !"~ ___________________________________ _
__ ~~ __ 1_5~___ 1 I ___ f----__ U~~:_~~~!_ ____ ~~ti~r:9~_C_1as~iLi_c_a~~E ______ _
39 160 1 I CONNECT LINK ----- ---- ---- ------ ------ ----------- -----------------------------------~O ~61_-~~? 6 ___________ ~ _ _ SERIAL_~~~~~ ________________________ . _____ ._
~1 167-172 6 I
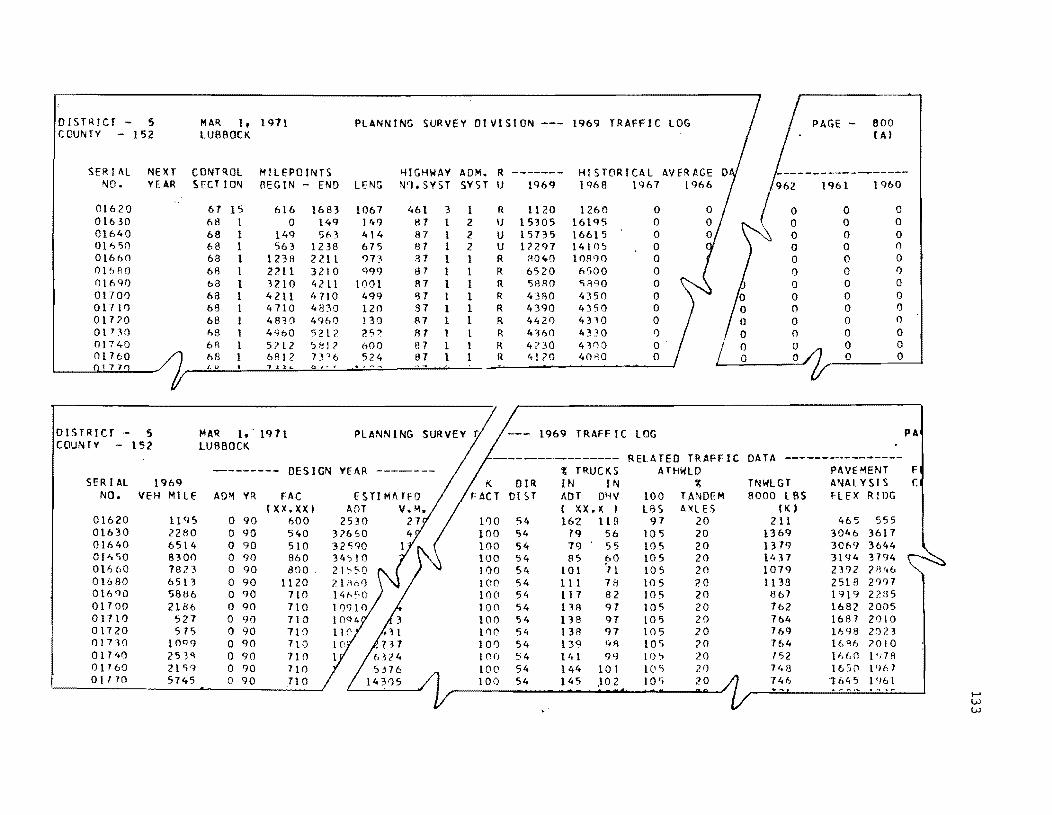
DISTRICT - 5 MAR 1. 1911 PLANNING SURVEY DIVISION --- 1969 TRAfF I CLOG PAGE - 800 COUNTY - 152 LUBBOCK (AI
SERIAL NEXT CONTROL MILEPOINTS HIGHWAV ADM. R -~----- HI STORfCAL AV ER AGE NO. YEAR S[=CTIO~ BEGIN - END LENG WI. SVST SYS T U 1<)6<) 1968 1967 1'>66 1961 1960
01620 67 15 616 1683 1067 461 3 1 R 1120 1260 0 0 0 0 o 16 ~O 68 1 0 14c) 149 1:17 1 2 U 15305 16195 0 0 0 0 01640 68 1 14<) 5b3 414 87 1 2 U 15735 16615 0 0 0 0 01" 50 b8 1 563 1238 615 87 1 2 U 17297 14105 0 0 0 0 01660 68 1 1238 2211 '173 '37 1 1 R 11040 10IF}C) 0 0 0 0 01" 1'.0 6f! 1 2211 3210 q<)<) 87 1 1 R 6520 6500 0 0 0 I)
01690 b8 1 3210 4211 1001 87 1 1 R S8RO 5B90 0 0 0 0 01700 63 1 4211 4110 4<)9 lJ7 1 1 R 43RO 4350 0 0 0 0 01710 68 1 4710 4830 120 87 1 1 R 43<)0 4350 0 0 0 0 01770 68 1 4830 4960 130 ll7 1 1 R 4420 4310 0 0 0 0 01 no 68 1 4960 521? 25' iH 1 1 R 4360 4~30 I) 0 0 0
61'. 1 5?L 2 '3 B 1 ? 600 87 1 R 4730 4V)O 0' 0 0 0 68 1 61H2 1336 524 87 1 R 4120 40,,0 0 0 0 0 I, " 7 l"l "- 0';' f
DISTRICT - 5 fo4AR I. 1911 PLANNING --- 1969 TRAFF IC LOG PA COUNTY - 152 LUBBOCK
-------~ .. -------- RELATED TRAFFIC DATA --------------------- DESIGN YEAR ------- 'Jl TRUCKS ATHWLD PAVEMENT F
SER I AL 1969 DIR IN IN 1: TNWLGT ANALYSI S C NO. VEH MILE AD~ VR FAC ESTI MA TFD DIST I\DT DHV 100 TANDEM 8000 L SS HEX R lOG
IXX.XXI AOT I Xx.x I LBS AXLES I K , 01620 11 q5 0 90 bOO 2530 FlO 54 16'2 11 R 97 20 211 465 555 01630 2280 0 90 540 32660 100 54 79 56 105 20 136C) 3046 3617 01640 6514 0 90 510 32<;<)0 100 54 79 55 105 20 13 79 3069 3644 Of" SO 8300 0 90 860 34510 100 54 85 pO 105 20 1437 3194 3794 01660 7823 0 90 800 . 21550 100 54 101 71 105 20 1079 23')2 7fl t,6 01680 6513 0 90 1120 100 54 1 1 1 78 105 20 1138 2518 2'FH 016<)Q 58U6 0 90 710 100 54 117 82 105 20 867 1919 VB5 017 00 2186 0 90 710 100 54 138 97 105 20 762 1682 2005 01710 527 0 90 710 100 54 138 97 105 20 764 1687 2010 01120 575 0 90 710 100 54 138 97 105 20 16C) 1698 2023 01730 IOQ9 0 90 110 101) 54 139 9>1 lOS 70 764 16 'l6 7010 01140 253"1 0 90 710 100 54 I'd 99 10') 20 '52 1 f'(JO 1 '178 01760 21S'} 0 90 110 100 54 144 101 1 (I ') 20 1 It 8 1(;.50 1 'If> 1 01' 10 5745 0 90 710 100 54 145 ,102 10') 20 '74 " '1645 1 '16 1
l-' l;J l;J

This page replaces an intentionally blank page in the original --- CTR Library Digitization Team

APPENDIX D
ROAD LIFE (RL-l) CODING FORM

!!!!!!!!!!!!!!!!!!!"#$%!&'()!*)&+',)%!'-!$-.)-.$/-'++0!1+'-2!&'()!$-!.#)!/*$($-'+3!
44!5"6!7$1*'*0!8$($.$9'.$/-!")':!
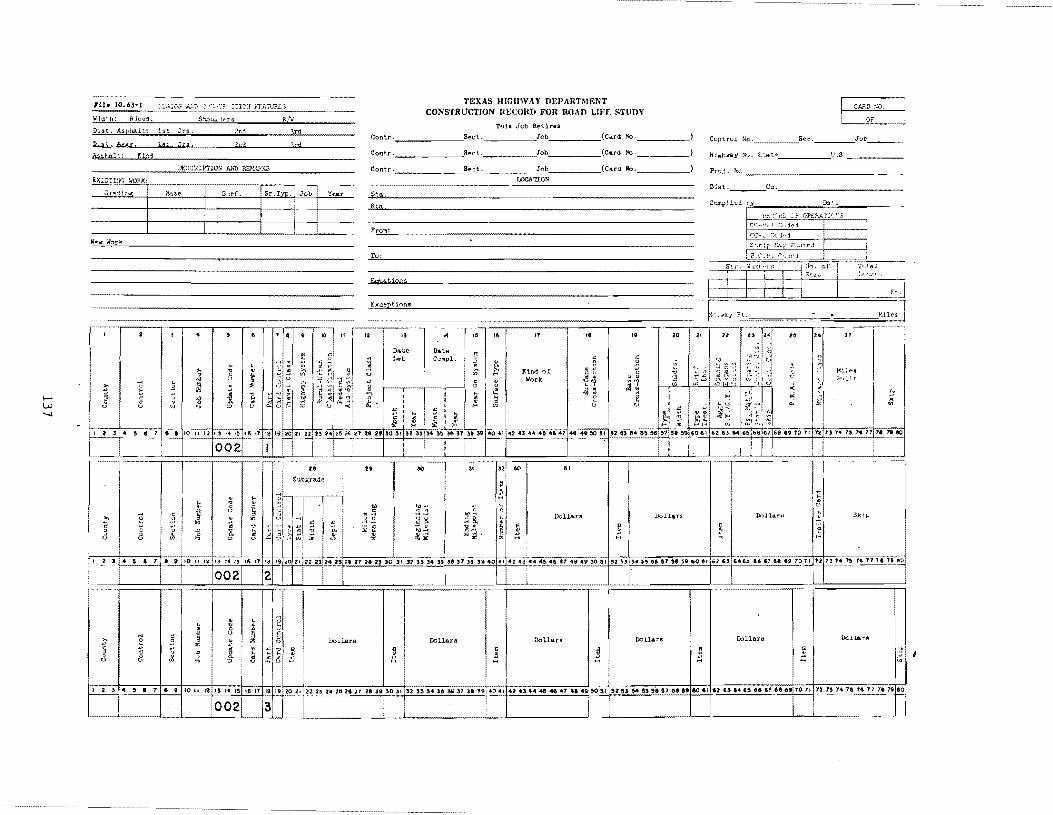
~ Wr. 1.'; :dril, 1rd
AsphD.!+;: Kip1
Sr.T' , Job 'tear
I
I I
J
l I
I ~
... " ~ ~ 2 '" .,
Q "' 0 < 0 u VI ..,
TBXAS HIGHWAY DEPARTMENT CONS'fRUCTION HECOHD FOR ROAD LIFE STUDY
This Job Retlru
Sect. Contr '_------ ._Job (Card lio,
Sect. Contr ' ______ -' Job (Cud No,
Sect. C'ontr . ______ -' Job (Card flo.
UlCA'nON
Sta.
From:
To:
Eqw..tions
E)(ceptions
o. I
~I
OF
Control No ___ Sec ____ Joo ___ _
Proj, No _______________ _
Dtst. ____ Co, ___________ _
Compiled >y D.",
F':;C';l'.il .;, OI'1:?.AT:c::3 I
P.C.P Colcj
- .
Dollars J>ij laru
I • ] • ¥ 10 II Ii ~, ,. I' i 16 t7 1$ 192021 '22 21 l42"5 l' ,., tI 29 30 31 3l 33 34 3~ 38,7 n '940 ""'H 43:".4546.148 49' ~O,' 52 ~3 &.,'" ,7 '" 51' 600 $1 &1 ~1 '.6~···'~a 11 U It 1011 12''t) ,. 7$ 7. 77 71 7, ~
I 002 2 I
~ ,.. ... c § j ~ " '" .,
" J! c <.> .,

This page replaces an intentionally blank page in the original --- CTR Library Digitization Team

APPENDIX E
ROAD INVENTORY (RI-2) CODING FORM

!!!!!!!!!!!!!!!!!!!"#$%!&'()!*)&+',)%!'-!$-.)-.$/-'++0!1+'-2!&'()!$-!.#)!/*$($-'+3!
44!5"6!7$1*'*0!8$($.$9'.$/-!")':!
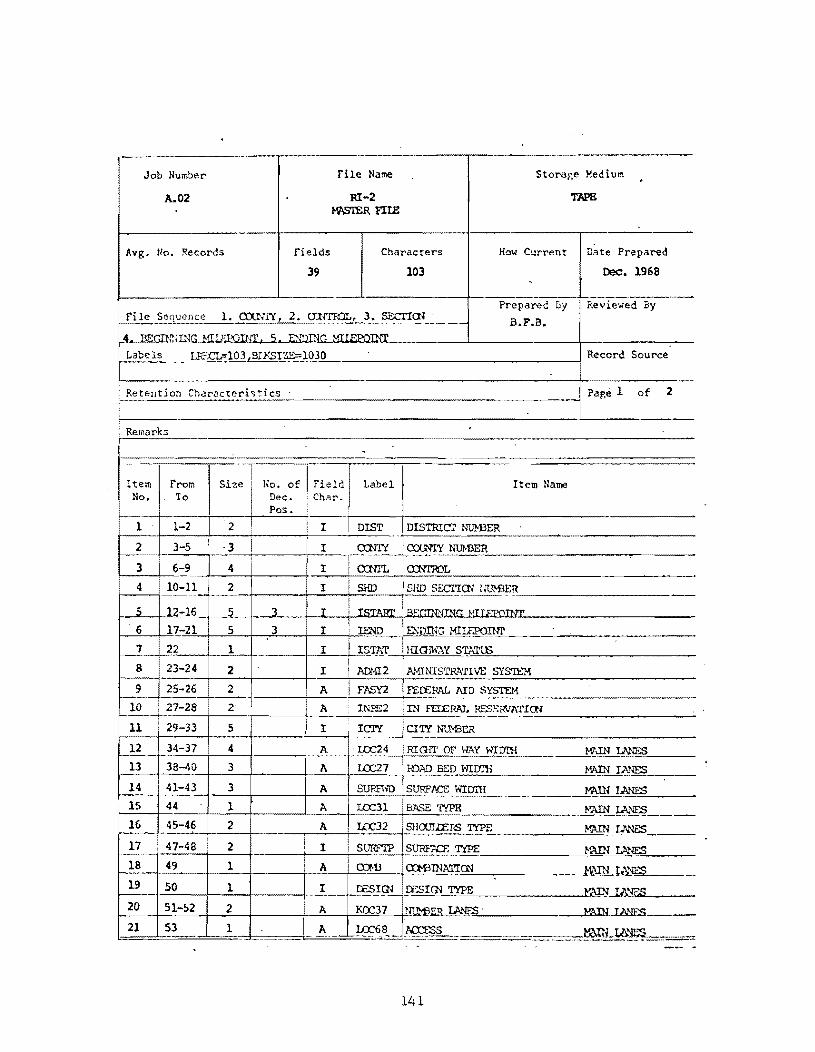
Job Number rile Name Storap,e I-!ediur.! . A.02 1U-2 TAPE
~RFIU::
Avg. lto. Records rields Characters How Current Date Prepared
39 103 Dec. 1968 -
Preparec Dy Reviewed By ri Ie St!Cjuence 1. a::U"T"{, 2. CXlITroL, 3. SECrICN - B.F.B. ~j!l1;N_1LMUF~~G MIIEPOlNl'
Labels h~Xlrl03lBLKSI~1030 Record Source
Retention Charccteri~tics - Pap,e 1 of 2
> Remarks
. 1----
I
Fi'ld] Item rrom Size I 1'0. of Label Item llame
No. '1'0 Dec. POSt
Char.
1 1-2 2 I I DIST DISTRIcr NUH3ER
2 3-5 ·3 I I cn,)'TY I COlNI'Y NU!--DER >--3 6-9 4 I cam. I \..Uyiffir.
4 10-11 2 I SHD SlID SECI'ICN titJH3ER ---- -
5 12-16 5 ---L.. I T!::'T'al7r IR):, !.IT r F.P0TN'1'
'6 17-21 5 3 T IEND ENDrnG MILI:":FOINl'
1 22 1 I IST)l,T' Iluan,';w STAl'lS
8 23-24 2 I J\D.'1l2 A'1lNISTRl\TIVE SYS'IEM
9 25-26 2 A FAS'i2 FE[ERAL AID $YS1cH r--- ' - -10 27-28 2 A INF£2 • IN FEr:ERAI.. ~, ""'~u.
11 29-33 5 I ICI'Y CIT'{ Nm2ER - --12 34-37 I 4 A - IJX24 RIalT OF WNf wrr::trn Ml'.IN I.A. '-mS
13 36-40 3 - A UX27 IDl>D BED WIIJJ'H Hi\IN IlINES
14 41-43 3 A SU'Im,n I :::'UKJ:"'}'O:; WIr::1ru Ml'UN I.Mm3 15 44 1 A IJX31 Rl\SE T'iPB l~~~ ___ 16 45-46 2
,. A r.o:::32 SlIOOI1:ERS TYPE M\IN U>NES ._ ...
17 47-48 2 I StJRPl'P SURF'.i'CE T'iPE HUN ~l>.lES ----j----_ .. _ ...
18 49 1 A mD • CCMHNATIOO ..MID! I'\"~ 19 50 1 I resICN I D~ICN TYPE ~-Ib'rr.S
--~"j~, ---20 51-52 2 A I ROC37 ~IDM3EIL!h~' ~rnI~
21 53 1 A Jw:~~ ~-l_LA're'.i - - - -
141
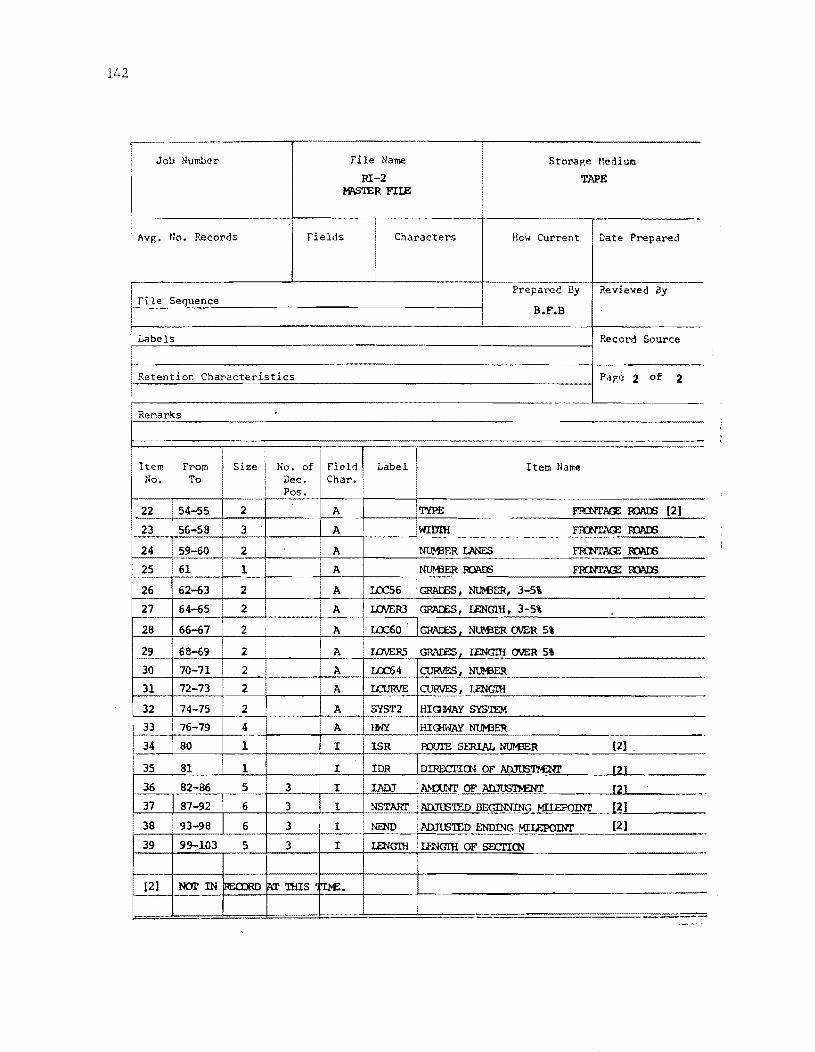
142
Job Number
Avg. 110. Records
File Sequence
File Name
RI-2 MilSTER FIlE
Fields Characters
Storap,e ~ledi urn
TAPE
How Current Date Prepared
Preparec By Reviewed ay
B.F.B
Record Source
Retention Character::.:is::..:t:.::i.::.c=-s_~ ________________ --I Pap;e 2 of 2
Remarks
Item From Size I No. of Field Label Item !lame No. To Dec. Char.
Pos.
22 54-55 2 A T'iPE FIDfI'lICE roru::s [2]
~ 3 A WII1lH ~ R.':lAI::S
24 2 A NtJMjER IJ\NES tM..l'f.L:t\I..Ji.'J ~
25 61 1 A NlMlER roru::s ~ R.').\\ll;
26 62-63 2 A u:x::56 I GAAIES, m_l"D 3-5\
27 64-65 2 A LOVER3 GAArES, u:NGIH, 3-5%
28 66-67 2 A I.OC60 GAAIES, NtJt.BER OIlER 5%
29 68-69 I 2 I
A IJJVER5 . GRADES.l LENGJ!I OVER 5\ 30 70-71 2 --- I A I.OC64 I CURVES, NtJt.BER 31 72-73 2 A I.aJlM: ~, LENGIH
32 74-75 2 A SYST2 HIGMAY SYS'IEM
33 76-79 4 A .HWY' NtJt.BER
34 80 1 I ISR RJUI'E SERIAL N1.J!.tiER [2] .
35 81 1 I !DR DIRECI'ICN OF l\llJtE'lMNl' [Z]
36 i 82-86 5 3 I IADJ A~am OF .1\IlJtJS'Jl.f' [in -
. NSTART I AIlJtS'IED BEGlIDi'ING MIIEPOINl' 37 87-92 6 3 I (2)
38 93-98 6 3 I NEND ~ ENDING MILEPOINl' [2]
39 9~103 5 3 I LENG'ffi G'ffi OF SI:X:rICN
[2] NOr IN ~ fa'THIS ' rrM::. I ... _.
.
-
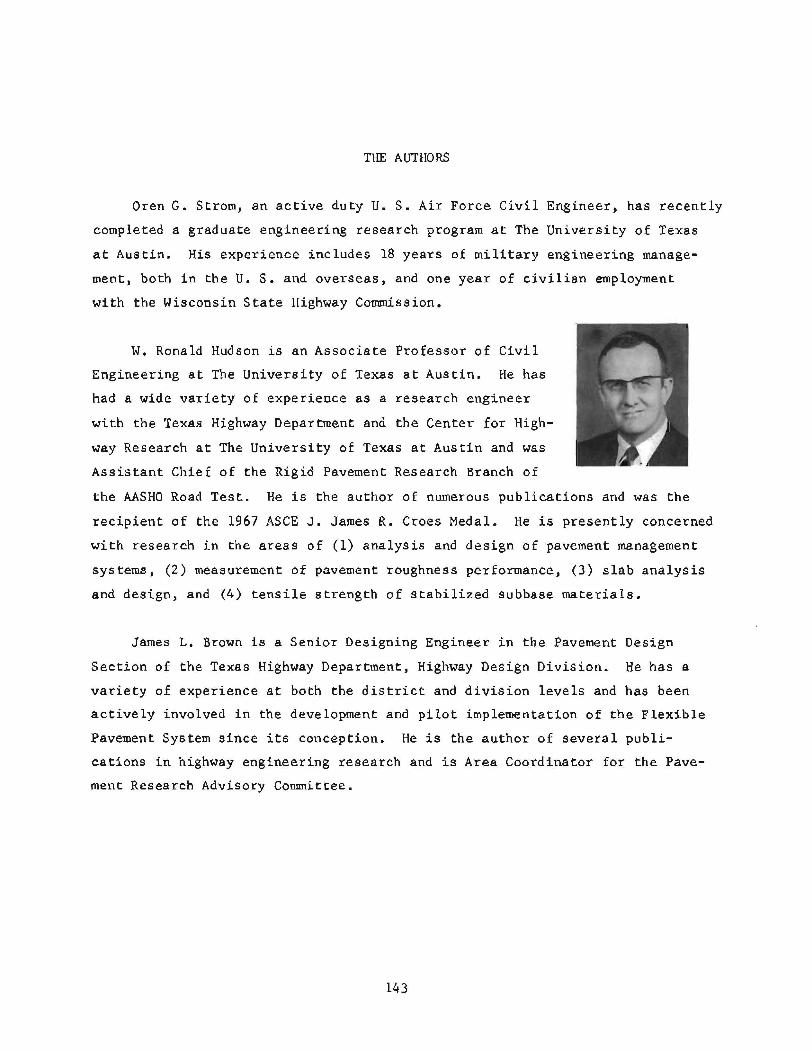
THE AUTHORS
Oren G. Strom, an active duty U. S. Air Force Civil Engineer, has recently
completed a graduate engineering research program at The University of Texas
at Austin. His experience includes 18 years of military engineering manage
ment, both in the U. S. and overseas, and one year of civilian employment
with the Wisconsin State Highway Commission.
W. Ronald Hudson is an Associate Professor of Civil
Engineering at The University of Texas at Austin. He has
had a wide variety of experience as a research engineer
with the Texas Highway Department and the Center for High
way Research at The University of Texas at Austin and was
Assistant Chief of the Rigid Pavement Research Branch of
the AASHO Road Test. He is the author of numerous publications and was the
recipient of the 1967 AseE J. James R. Croes Medal. He is presently concerned
with research in the areas of (1) analysis and design of pavement management
systems, (2) measurement of pavement roughness performance, (3) slab analysis
and design, and (4) tensile strength of stabilized subbase materials.
James L. Brown is a Senior Designing Engineer in the Pavement Design
Section of the Texas Highway Department, Highway Design Division. He has a
variety of experience at both the district and division levels and has been
actively involved in the development and pilot implementation of the Flexible
Pavement System since its conception. He is the author of several publi
cations in highway engineering research and is Area Coordinator for the Pave
ment Research Advisory Committee.
143