Embed Size (px)
Citation preview
1
A Paradigm for Evaluation of theFederal-State VocationalRehabilitation Program
David H. Dean, Robert C. Dolan, Robert M.Schmidt, Paul Wehman, John Kregel, andGrant Revell
In recent years, the unemployment level of people with disabilities has received increased attention. A numberof federal agencies, public policy makers, consumer groups, and professionals have focused significant attention onwhy the unemployment rate for persons with disabilities remains so high. This unemployment rate has hovered in the70% range for decades. Additionally, Hunt, Habeck, Owens and Vandergoot (1996) suggest that the real economiccost of disability, the lost production from individuals not at work, has been growing rapidly in recent years. Chelius,Galvin, & Owens (1992) also report that employers have been paying 8% of payroll for disability related expenses.Unfortunately, advances such as assistive technology (Flippo, Inge, & Barcus, 1995), health interventions, (Becker,Drake, et al., 1997), job coaches (Wehman, Gibson, Brooke, & Johnson, 1998; Wehman, Revell, & Kregel, 1998),natural supports (e.g., Test & Wood, 1996), new training techniques (Moon, Inge, Wehman, et al., 1990), and progres-sive legislation (e.g., ADA-PL 101-336), all of which were designed to ease the entry of people with disabilities into thecompetitive workplace, have not resulted in a significant improvement in employment rates for people with disabilities.
A recent national survey of adults with disabilities conducted by the National Organization on Disability (NOD)in collaboration with the Louis Harris & Associates has presented new and challenging data on the current employmentpicture for persons with disabilities. The NOD/Harris survey of 1,000 adults with disabilities was conducted in theSpring of 1998. They found that only 29% of working-age persons with disabilities were employed (full- or part-time), ascompared to 79% of non-disabled persons. The NOD/Harris 1998 survey is the third of a series, begun in 1986 andrepeated again in 1994. This series of surveys captures the evolving employment experiences of persons with disabili-ties over time. Strikingly, despite the passage of four years since the complete implementation of the Americans withDisabilities Act (ADA), the aim of which was to remove barriers to full participation in society, respondents to the 1998survey reported lower employment rates (29%, down from 34% in 1986), less engaging jobs (46% used “full talents,”down from 66% in 1994), and lower life satisfaction (33% reported “very satisfied,” down from 39% in 1986) than therespondents of previous surveys (NOD/Harris, 1998).
Moreover, when the experiences of the respondents to the 1986, 1994, and 1998 surveys are compared tothose of their non-disabled contemporaries, the gap in their experiences becomes clear. The respondents with disabili-ties have suffered from consistently lower relative income levels (22% more disabled in very low income levels) andlower levels of education (11-12% fewer high school graduates). Additionally, persons with disabilities continue to havegreater transportation and accessibility concerns than their non-disabled peers, although these appear to be lesspressing than in previous years.
It is not surprising, therefore, that the number of working age people with disabilities who receive DisabilityInsurance (DI) and Supplemental Security Income (SSI) benefits from the Social Security Administration increased from
2
4 million in 1985 to 6.3 million in 1994 (General Accounting Office, June 1996). These figures are alarming because ofthe enormous expenditures associated with long term receipt of Social Security cash benefits. This figure has nowrisen to 8 million Americans receiving 89 billion dollars in FY 1997 (U.S. Bureau of Labor Census, 1997).
In order to combat this rising social problem of disability and unemployment, there has been the developmentof greatly improved employer accommodations, rehabilitation interventions, and medical treatments, all of which playan increasingly large role in the implementation of work supports for workers with disabilities (e.g., Wehman & Kregel,1998). There has been in the past decade a significant amount of time, money, and thought devoted toward studyinghow these types of accommodations can be utilized to support persons with disabilities and their employers (Barbour,1999; Wehman, Targett, Eltzeroth, Green, Brooke, & Barcus, 1999). The common link between accommodation,intervention, and treatment is the idea of support as opposed to cure or remediate. Over the years, a key philosophicalchange has been the substantial paradigm shift from a clinic or center-based approach of “curing” persons with disabili-ties to instead that of supporting them with a customized array of resources designed by the employer, worker, andoften times the rehabilitation provider (Brown, Farrington, Suomi, Ziegler, & Knight, 1999).
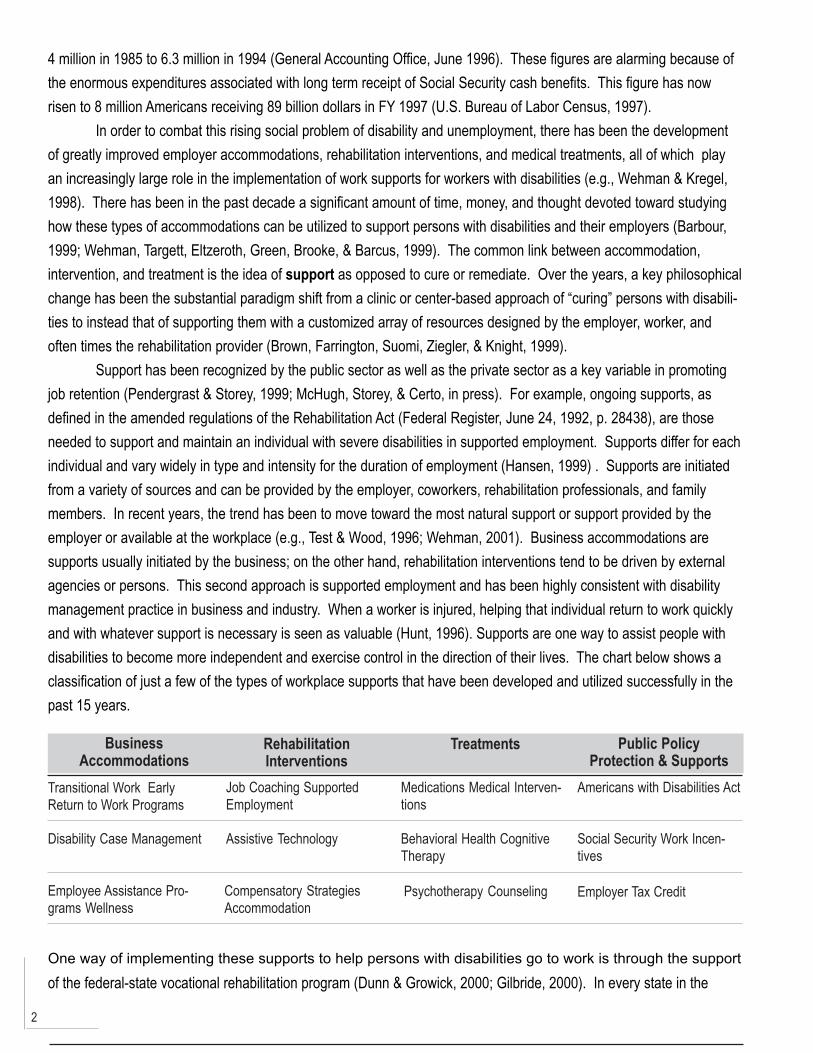
Support has been recognized by the public sector as well as the private sector as a key variable in promotingjob retention (Pendergrast & Storey, 1999; McHugh, Storey, & Certo, in press). For example, ongoing supports, asdefined in the amended regulations of the Rehabilitation Act (Federal Register, June 24, 1992, p. 28438), are thoseneeded to support and maintain an individual with severe disabilities in supported employment. Supports differ for eachindividual and vary widely in type and intensity for the duration of employment (Hansen, 1999) . Supports are initiatedfrom a variety of sources and can be provided by the employer, coworkers, rehabilitation professionals, and familymembers. In recent years, the trend has been to move toward the most natural support or support provided by theemployer or available at the workplace (e.g., Test & Wood, 1996; Wehman, 2001). Business accommodations aresupports usually initiated by the business; on the other hand, rehabilitation interventions tend to be driven by externalagencies or persons. This second approach is supported employment and has been highly consistent with disabilitymanagement practice in business and industry. When a worker is injured, helping that individual return to work quicklyand with whatever support is necessary is seen as valuable (Hunt, 1996). Supports are one way to assist people withdisabilities to become more independent and exercise control in the direction of their lives. The chart below shows aclassification of just a few of the types of workplace supports that have been developed and utilized successfully in thepast 15 years.
One way of implementing these supports to help persons with disabilities go to work is through the supportof the federal-state vocational rehabilitation program (Dunn & Growick, 2000; Gilbride, 2000). In every state in the
BusinessAccommodations
RehabilitationInterventions
Treatments Public PolicyProtection & Supports
Transitional Work EarlyReturn to Work Programs
Job Coaching SupportedEmployment
Medications Medical Interven-tions
Americans with Disabilities Act
Disability Case Management Assistive Technology Behavioral Health CognitiveTherapy
Social Security Work Incen-tives
Employee Assistance Pro-grams Wellness
Compensatory StrategiesAccommodation
Psychotherapy Counseling Employer Tax Credit
3
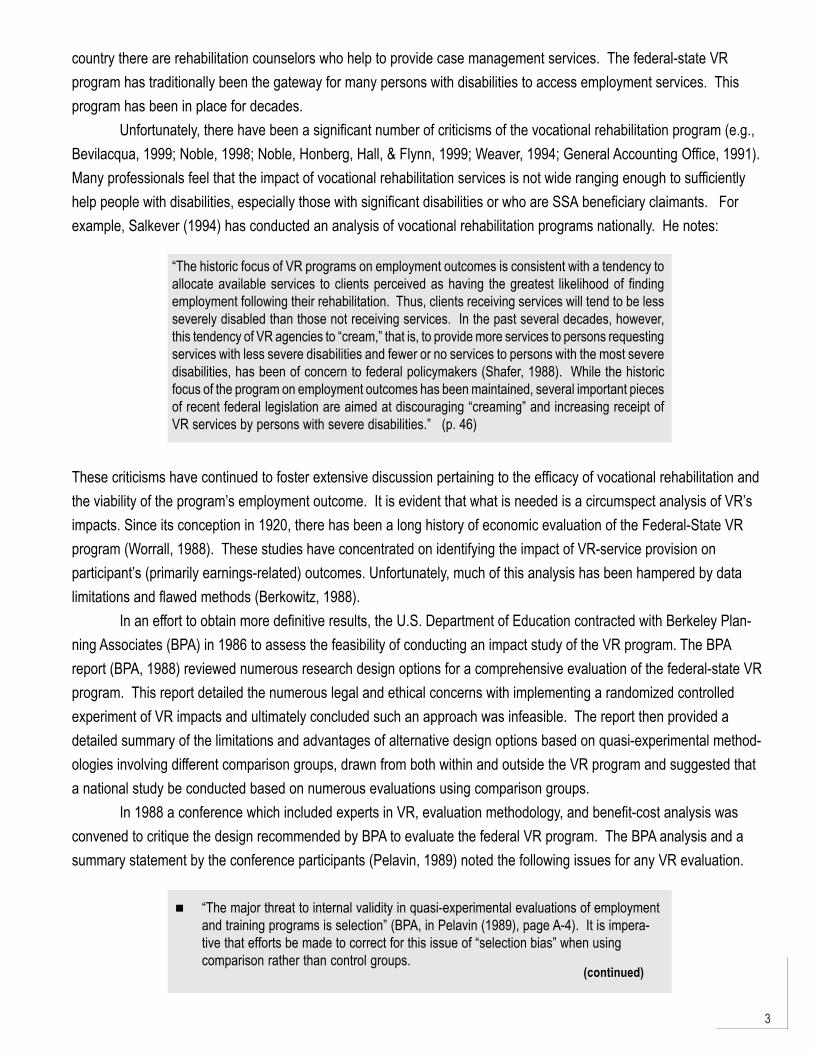
“The historic focus of VR programs on employment outcomes is consistent with a tendency toallocate available services to clients perceived as having the greatest likelihood of findingemployment following their rehabilitation. Thus, clients receiving services will tend to be lessseverely disabled than those not receiving services. In the past several decades, however,this tendency of VR agencies to “cream,” that is, to provide more services to persons requestingservices with less severe disabilities and fewer or no services to persons with the most severedisabilities, has been of concern to federal policymakers (Shafer, 1988). While the historicfocus of the program on employment outcomes has been maintained, several important piecesof recent federal legislation are aimed at discouraging “creaming” and increasing receipt ofVR services by persons with severe disabilities.” (p. 46)
These criticisms have continued to foster extensive discussion pertaining to the efficacy of vocational rehabilitation andthe viability of the program’s employment outcome. It is evident that what is needed is a circumspect analysis of VR’simpacts. Since its conception in 1920, there has been a long history of economic evaluation of the Federal-State VRprogram (Worrall, 1988). These studies have concentrated on identifying the impact of VR-service provision onparticipant’s (primarily earnings-related) outcomes. Unfortunately, much of this analysis has been hampered by datalimitations and flawed methods (Berkowitz, 1988).
In an effort to obtain more definitive results, the U.S. Department of Education contracted with Berkeley Plan-ning Associates (BPA) in 1986 to assess the feasibility of conducting an impact study of the VR program. The BPAreport (BPA, 1988) reviewed numerous research design options for a comprehensive evaluation of the federal-state VRprogram. This report detailed the numerous legal and ethical concerns with implementing a randomized controlledexperiment of VR impacts and ultimately concluded such an approach was infeasible. The report then provided adetailed summary of the limitations and advantages of alternative design options based on quasi-experimental method-ologies involving different comparison groups, drawn from both within and outside the VR program and suggested thata national study be conducted based on numerous evaluations using comparison groups.
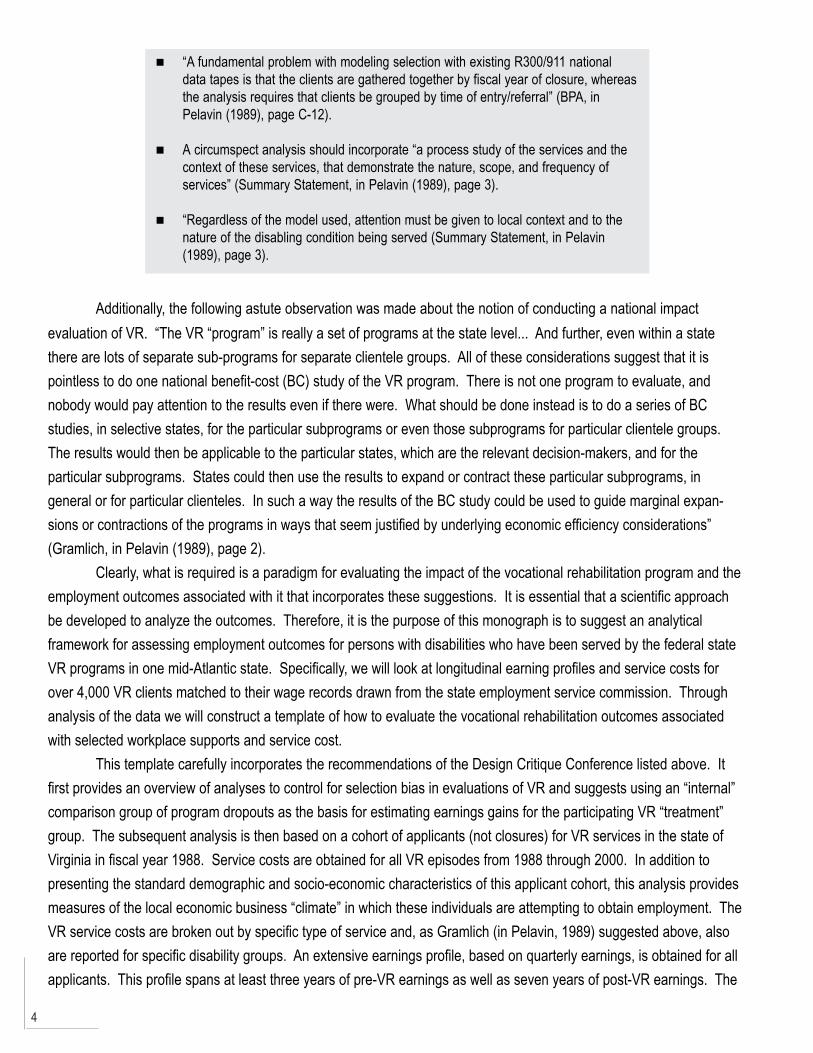
In 1988 a conference which included experts in VR, evaluation methodology, and benefit-cost analysis wasconvened to critique the design recommended by BPA to evaluate the federal VR program. The BPA analysis and asummary statement by the conference participants (Pelavin, 1989) noted the following issues for any VR evaluation.
country there are rehabilitation counselors who help to provide case management services. The federal-state VRprogram has traditionally been the gateway for many persons with disabilities to access employment services. Thisprogram has been in place for decades.
Unfortunately, there have been a significant number of criticisms of the vocational rehabilitation program (e.g.,Bevilacqua, 1999; Noble, 1998; Noble, Honberg, Hall, & Flynn, 1999; Weaver, 1994; General Accounting Office, 1991).Many professionals feel that the impact of vocational rehabilitation services is not wide ranging enough to sufficientlyhelp people with disabilities, especially those with significant disabilities or who are SSA beneficiary claimants. Forexample, Salkever (1994) has conducted an analysis of vocational rehabilitation programs nationally. He notes:
“The major threat to internal validity in quasi-experimental evaluations of employmentand training programs is selection” (BPA, in Pelavin (1989), page A-4). It is impera-tive that efforts be made to correct for this issue of “selection bias” when usingcomparison rather than control groups.
(continued)
4
Additionally, the following astute observation was made about the notion of conducting a national impactevaluation of VR. “The VR “program” is really a set of programs at the state level... And further, even within a statethere are lots of separate sub-programs for separate clientele groups. All of these considerations suggest that it ispointless to do one national benefit-cost (BC) study of the VR program. There is not one program to evaluate, andnobody would pay attention to the results even if there were. What should be done instead is to do a series of BCstudies, in selective states, for the particular subprograms or even those subprograms for particular clientele groups.The results would then be applicable to the particular states, which are the relevant decision-makers, and for theparticular subprograms. States could then use the results to expand or contract these particular subprograms, ingeneral or for particular clienteles. In such a way the results of the BC study could be used to guide marginal expan-sions or contractions of the programs in ways that seem justified by underlying economic efficiency considerations”(Gramlich, in Pelavin (1989), page 2).
Clearly, what is required is a paradigm for evaluating the impact of the vocational rehabilitation program and theemployment outcomes associated with it that incorporates these suggestions. It is essential that a scientific approachbe developed to analyze the outcomes. Therefore, it is the purpose of this monograph is to suggest an analyticalframework for assessing employment outcomes for persons with disabilities who have been served by the federal stateVR programs in one mid-Atlantic state. Specifically, we will look at longitudinal earning profiles and service costs forover 4,000 VR clients matched to their wage records drawn from the state employment service commission. Throughanalysis of the data we will construct a template of how to evaluate the vocational rehabilitation outcomes associatedwith selected workplace supports and service cost.
This template carefully incorporates the recommendations of the Design Critique Conference listed above. Itfirst provides an overview of analyses to control for selection bias in evaluations of VR and suggests using an “internal”comparison group of program dropouts as the basis for estimating earnings gains for the participating VR “treatment”group. The subsequent analysis is then based on a cohort of applicants (not closures) for VR services in the state ofVirginia in fiscal year 1988. Service costs are obtained for all VR episodes from 1988 through 2000. In addition topresenting the standard demographic and socio-economic characteristics of this applicant cohort, this analysis providesmeasures of the local economic business “climate” in which these individuals are attempting to obtain employment. TheVR service costs are broken out by specific type of service and, as Gramlich (in Pelavin, 1989) suggested above, alsoare reported for specific disability groups. An extensive earnings profile, based on quarterly earnings, is obtained for allapplicants. This profile spans at least three years of pre-VR earnings as well as seven years of post-VR earnings. The
“A fundamental problem with modeling selection with existing R300/911 nationaldata tapes is that the clients are gathered together by fiscal year of closure, whereasthe analysis requires that clients be grouped by time of entry/referral” (BPA, inPelavin (1989), page C-12).
A circumspect analysis should incorporate “a process study of the services and thecontext of these services, that demonstrate the nature, scope, and frequency ofservices” (Summary Statement, in Pelavin (1989), page 3).
“Regardless of the model used, attention must be given to local context and to thenature of the disabling condition being served (Summary Statement, in Pelavin(1989), page 3).
5
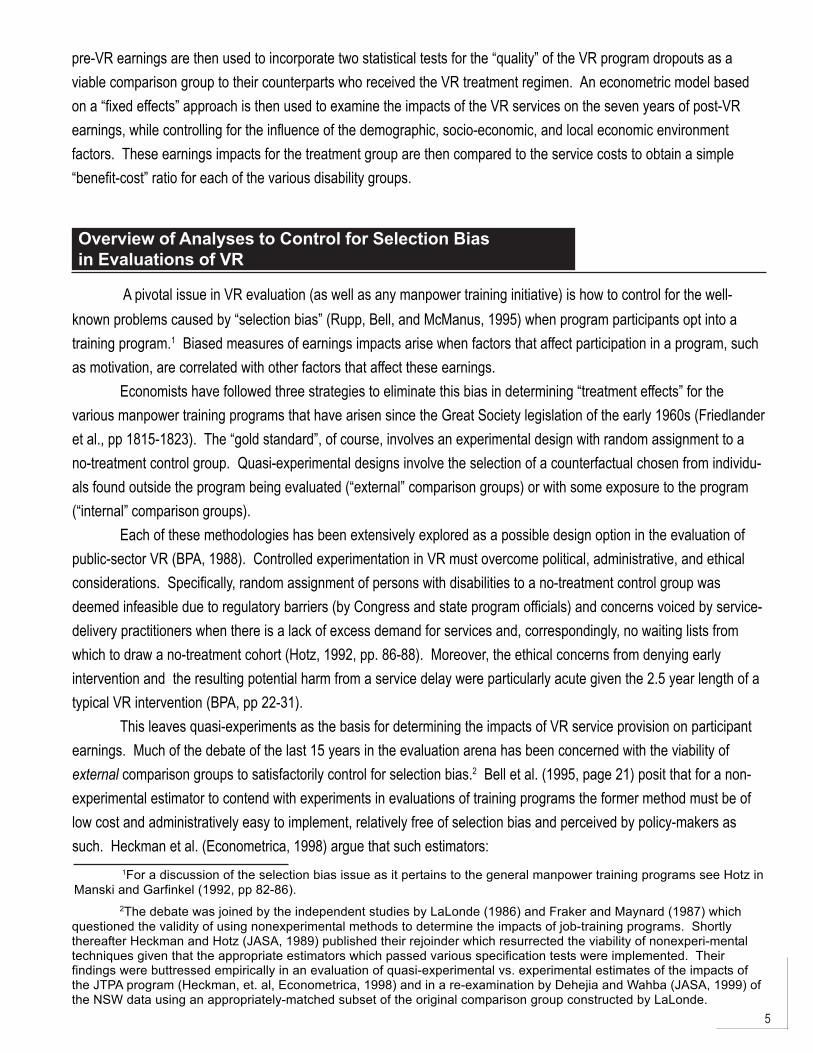
pre-VR earnings are then used to incorporate two statistical tests for the “quality” of the VR program dropouts as aviable comparison group to their counterparts who received the VR treatment regimen. An econometric model basedon a “fixed effects” approach is then used to examine the impacts of the VR services on the seven years of post-VRearnings, while controlling for the influence of the demographic, socio-economic, and local economic environmentfactors. These earnings impacts for the treatment group are then compared to the service costs to obtain a simple“benefit-cost” ratio for each of the various disability groups.
Overview of Analyses to Control for Selection Biasin Evaluations of VR
A pivotal issue in VR evaluation (as well as any manpower training initiative) is how to control for the well-known problems caused by “selection bias” (Rupp, Bell, and McManus, 1995) when program participants opt into atraining program.1 Biased measures of earnings impacts arise when factors that affect participation in a program, suchas motivation, are correlated with other factors that affect these earnings.
Economists have followed three strategies to eliminate this bias in determining “treatment effects” for thevarious manpower training programs that have arisen since the Great Society legislation of the early 1960s (Friedlanderet al., pp 1815-1823). The “gold standard”, of course, involves an experimental design with random assignment to ano-treatment control group. Quasi-experimental designs involve the selection of a counterfactual chosen from individu-als found outside the program being evaluated (“external” comparison groups) or with some exposure to the program(“internal” comparison groups).
Each of these methodologies has been extensively explored as a possible design option in the evaluation ofpublic-sector VR (BPA, 1988). Controlled experimentation in VR must overcome political, administrative, and ethicalconsiderations. Specifically, random assignment of persons with disabilities to a no-treatment control group wasdeemed infeasible due to regulatory barriers (by Congress and state program officials) and concerns voiced by service-delivery practitioners when there is a lack of excess demand for services and, correspondingly, no waiting lists fromwhich to draw a no-treatment cohort (Hotz, 1992, pp. 86-88). Moreover, the ethical concerns from denying earlyintervention and the resulting potential harm from a service delay were particularly acute given the 2.5 year length of atypical VR intervention (BPA, pp 22-31).
This leaves quasi-experiments as the basis for determining the impacts of VR service provision on participantearnings. Much of the debate of the last 15 years in the evaluation arena has been concerned with the viability ofexternal comparison groups to satisfactorily control for selection bias.2 Bell et al. (1995, page 21) posit that for a non-experimental estimator to contend with experiments in evaluations of training programs the former method must be oflow cost and administratively easy to implement, relatively free of selection bias and perceived by policy-makers assuch. Heckman et al. (Econometrica, 1998) argue that such estimators:
1For a discussion of the selection bias issue as it pertains to the general manpower training programs see Hotz inManski and Garfinkel (1992, pp 82-86).
2The debate was joined by the independent studies by LaLonde (1986) and Fraker and Maynard (1987) whichquestioned the validity of using nonexperimental methods to determine the impacts of job-training programs. Shortlythereafter Heckman and Hotz (JASA, 1989) published their rejoinder which resurrected the viability of nonexperi-mentaltechniques given that the appropriate estimators which passed various specification tests were implemented. Theirfindings were buttressed empirically in an evaluation of quasi-experimental vs. experimental estimates of the impacts ofthe JTPA program (Heckman, et. al, Econometrica, 1998) and in a re-examination by Dehejia and Wahba (JASA, 1999) ofthe NSW data using an appropriately-matched subset of the original comparison group constructed by LaLonde.
6
3One exception is the Survey of Income and Program Participation (SIPP), which collects detailed informationabout a person’s functional capabilities. Issues of non-comparability still exist in matching on the VR system’s conditionclassification and the “maturation” of the disability.
The conditions (i) and (iii) above make implementing external comparison groups in evaluations of VR efficacyparticularly problematic. Specifically, difficulties arise because of issues related to the onset, severity, and duration ofthe disabling condition for the person receiving services. Few data sources have information pertaining to animpairment comparable to that collected for persons receiving public-sector VR.3 The BPA study (1988, pages 39-44)examined numerous external comparison groups persons with disabilities and determined that there were too manynon-comparability issues to make them feasible. Perhaps most disconcerting is the lack of data on the “maturation” ofthe disability. As BPA notes (1988, Appendix page C-6), “there may be a natural maturation process in the progressand resolution of medical problems such that for some VR clients, they only come into VR when finally ready toconsider entry or re-entry into the labor market.” It is evident that the deterioration, stability, or improvement in aperson’s functional capabilities play a crucial role in the “participation decision” to apply for VR services. An externally-drawn comparison group of eligible non-applicants not having such data is suspect.
Given these weaknesses in gauging VR impacts with non-experimental “external” comparison groups, anothertack is to follow the approach of Bell et al. (1995). They have re-visited and provided further support for the use of non-participating program applicants as a valid “internal” comparison group for evaluating program efficacy. They argue that“three groups of later attriters from the intake process - withdrawals, screen-outs, and no-shows - may correspondmuch more closely to participants, on both observed and unobserved characteristics, than the more commonly usedcomparison group of eligible non-applicants.” In addition to being better matched on such factors as labor marketstatus and motivation, these groups are more likely to demonstrate similar time paths of earnings just prior toapplication as well as permanent vs. transitory aspects of pre-program dip (Bell, et. al., 1995).
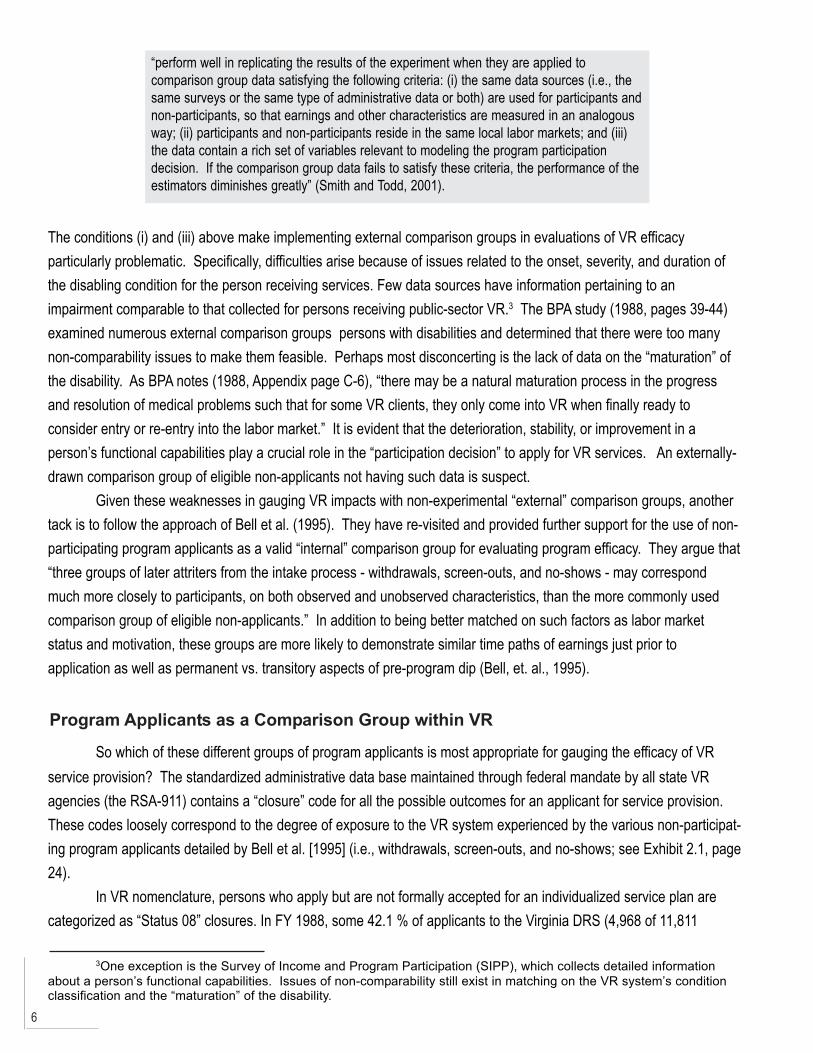
“perform well in replicating the results of the experiment when they are applied tocomparison group data satisfying the following criteria: (i) the same data sources (i.e., thesame surveys or the same type of administrative data or both) are used for participants andnon-participants, so that earnings and other characteristics are measured in an analogousway; (ii) participants and non-participants reside in the same local labor markets; and (iii)the data contain a rich set of variables relevant to modeling the program participationdecision. If the comparison group data fails to satisfy these criteria, the performance of theestimators diminishes greatly” (Smith and Todd, 2001).
Program Applicants as a Comparison Group within VR
So which of these different groups of program applicants is most appropriate for gauging the efficacy of VRservice provision? The standardized administrative data base maintained through federal mandate by all state VRagencies (the RSA-911) contains a “closure” code for all the possible outcomes for an applicant for service provision.These codes loosely correspond to the degree of exposure to the VR system experienced by the various non-participat-ing program applicants detailed by Bell et al. [1995] (i.e., withdrawals, screen-outs, and no-shows; see Exhibit 2.1, page24).
In VR nomenclature, persons who apply but are not formally accepted for an individualized service plan arecategorized as “Status 08” closures. In FY 1988, some 42.1 % of applicants to the Virginia DRS (4,968 of 11,811
7
people) had this closure status. A subsequent “reason not accepted” code serves to designate whether a person is awithdrawal or a screen-out. Roughly three-fourths of the people closed in this status are withdrawals (3,739 people).Withdrawals from VR are likely to be more similar with respect to demographic, socioeconomic, and disability severityand maturation variables than an external comparison group which has not applied for services. On the other hand,withdrawals can differ from VR participants in terms of motivation or perceived benefits from a treatment regimen andmay differ with respect to the eligibility criteria used for intake. Additionally, there is some degree of uncertainty aboutthe nature of an individual’s impairment if they are administratively “closed - not accepted”. While applicants formallyaccepted for VR services must have a medically-certified disabling condition the information about “condition classifica-tion” for those persons not accepted may be self-reported or based on out-dated material from a medical file.
Screen-outs comprise the remaining quarter of the Status 08 closures in FY 1988. As Bell et al. (1995, page27) note, some of the screen-outs may have opted to withdraw even if they had initially been accepted for VR serviceprovision. These individuals certainly differ from VR participants in terms of the eligibility criteria. VR eligibility criteriarequire that the applicant has a medically certified disabling condition and that VR service will then result in reasonableprospects of achieving a vocational outcome. Moreover, VR screen-outs can be further sorted into two distinct groupsaccording to the nature/maturation of their disabling condition: 1) those too severely disabled to benefit from VR ser-vices (556 people, or 45% of all screen-outs); and 2) those not severely enough disabled to be eligible for VR (673people, or 55%).
The BPA (1989, page A-51) evaluation design proposed using these two groups as part of a “triangulation”approach to gauging VR impacts on participants. In this framework, the earnings paths for those persons judged “tooseverely disabled” are used as a lower-bound estimate of VR impacts. Conversely, the earnings stream for the not-severely-enough-disabled cohort would then serve as an upper-bound. VR impacts would then be “bracketed” by thesetwo groups of screen-outs. However, as Bell et al. (1995, page 31) note “the tightness of these bounds is not consid-ered.” They note the lack of an experimental control to serve as a benchmark for testing the viability of these screen-outs as a comparison group. The VR Design Evaluation conferees ultimately rejected the triangulation approachbecause the direction of the bias was ultimately judged to be unclear. (See “Design Critiques for Evaluating VocationalRehabilitation: Final Report,” Summary Statement Chapter 6, Pelavin Associates, Inc., September 29, 1989, pages 1-5.) In the same report, Rossi (Pelavin, page 3) argues for placing all such “border-line ineligibles” into an experimentalpool to be randomly assigned to treatment and control groups.
This leaves VR program no-shows/dropouts, classified as “Status 30” closures as a possible internal compari-son group. As Dean and Dolan (1991, pages 571-574) discuss at length elsewhere, dropouts are the most appropriatecomparison group with respect to the paramount consideration of minimizing pre-enrollment differences. Acceptanceinto VR would seem to infer that participants and subsequent dropouts are well-matched on the crucial issue of disabil-ity maturation. Having the motivation to apply along with the observed and unobserved characteristics to pass theeligibility screens obviates the need to model the application and acceptance decision (Cooley et al., 1979). Onceaccepted for services, Status 30 closures then dropout prior to receipt of significant service provision – with the onlypurchased service being a diagnostic evaluation. This is unlikely to augment the person’s human capital and subse-quent employment prospects to a significant degree (BPA, 1988).
Of course, the issue of the person dropping out suggests unobserved differences from VR participants that canintroduce bias. Moreover, the direction of the bias is most likely unknown. This is because the RSA-911 administrativedata base uses the same responses for the reason why the person dropped out of VR as it provides for the reason why
8
4The inability of the latter group to secure employment (an outcome) does not lessen the fact that they stillreceived treatment. Indeed, the average service provision is higher for the not rehabilitated (Status 28) versusrehabilitated (Status 26) cohorts - cite figures.
a person is not accepted, with three exceptions. VR counselors are not permitted to use the “no disabling condition”,“no vocational handicap”, or “not meet priority” screen-out reasons. As Dean and Dolan (1991) and Bell et al. (1995)note, on the one hand, program drop-outs may be more motivated/less severely impaired and are able to secureemployment on their own - which leads to their dropping out of VR. An earlier study of VR impacts by Abt Associates(1974) found that the Status 30 cohort had characteristics that made them better candidates for competitive employ-ment than the “successfully rehabilitated” (Status 26) cohort. However, the BPA (1988) study of more recent VR datadid not support this finding and found no evidence that the dropouts are more likely to succeed than the “closed-successfully rehabilitated” cohort. On the other hand, they may be less motivated, or have a deteriorating healthcondition that precludes them from completing a prescribed service regimen.
The seriousness of the problem resulting from this deteriorating “health effect” could be examined by investigat-ing any impairment-related reasons that might cause the Status 30 cohort to dropout. A possible remedy then, impliedfrom a suggestion by an anonymous referee, would be to exclude thesepeople from the comparison group. However, in the approach taken by the authors, the treatment group includes bothcohorts deemed “successfully rehabilitated” (3,637 persons closed “Status 26” who attained their employment objectivefor at least 60 days) and “not rehabilitated” (2,291 persons closed “Status 28” who did not achieve their vocationalobjective after the receipt of significant service provision).4 Listed explanations for the latter cohort’s lack of employabil-ity are the same as those provided for the dropout cohort. “Handicap too severe” is the reason provided by almost one-fifth (18.6%) of the not rehabilitated persons, even a greater proportion than provided for the dropout cohort. Excludingindividuals with such reasons for dropping out from the comparison group, while comparable individuals remain in thetreatment group would clearly lead to biased treatment impacts. On balance, then, the entire (Status 30) dropout cohortwould seem to be the best comparison group available. Statistical tests of the “quality” of this comparison group arepresented in a later section.
Using Applicants Rather than Closures forEvaluative Purposes
Historically, the typical economist’s evaluation of public-sector VR efficacy (see Conley [1969], Bellante [1972],Worrall [1978], and Dean, Dolan and Schmidt [1999]) has used data provided on an annual basis by the state VRagencies. Information on a person’s demographic, socio-economic, disabling condition, and VR service provision iscollected in a standardized format by the federal Rehabilitation Services Administration (RSA). This reporting system,called the RSA-911, is maintained on a nationwide basis for all cases “closed” from the state VR agency during a givenfiscal year.
There are however, some problematic issues encountered in using a data file based on an administrative caseclosure date to demonstrate VR program efficacy. One problem is that an individual may be closed several times in agiven fiscal year, resulting in multiple cases. For example, there were a total of 230 instances where an individual was“closed” more than once by the Virginia VR agency during the FY 1988 reporting period. This figure amounts to two
9
percent of all the applicants whose cases were closed by 1997. “Double-counting” issues arise since cases are notlinked to an individual identifier on the R-911. This results in difficulties in measuring both how such persons withmultiple VR episodes benefit in terms of a vocational outcome as well as the total value of VR services received.
A more serious problem emerges due to the varying outcomes and subsequent duration of a VR case. ManyVR cases involve “quick closures” where a person may: 1) be ineligible for services; 2) leave after a short while uponmaking the determination that VR services are not appropriate; or 3) be “placed” in a vocational outcome after a briefVR intervention. Such cases are often closed from the VR rolls in the same year the person applies for services. At theother end of the spectrum are cases lasting several years. In such instances an individual may have embarked on ajob-training or education regimen. Alternatively, the person may be unable to secure employment after completing theprescribed VR service package. The “case” languishes until the VR agency terminates the person from its rolls as “notsuccessfully rehabilitated”.
The upshot is that a cohort of closed cases in a given fiscal year includes people who apply for VR over a spanof several different years. This introduces a host of mostly unobserved variables potentially impacting outcomes whichcause problems in the resulting evaluation. First, there may be changes in the eligibility requirements (e.g., establishingan “order of selection”) from year to year that are unobserved to the researcher. Secondly, there may be differentbudgetary considerations not transparent to the researcher that affect the VR service package offered from applicantsin one fiscal year versus another. Finally, people may be enrolling in the program in widely divergent economic condi-tions. People “successfully rehabilitated” who apply and are subsequently closed in the same year may be benefittingfrom a robust economy — not the VR service package. The unobservable motivation of such persons may differdramatically from those persons who applied for VR several years prior, perhaps during a downturn in the economy, toimprove their skills through a longer-term job-training program.
These problems, however, can be avoided by examining cohorts according to the year of enrollment into VRand then tracking their subsequent progression through the VR process. As the BPA study (1988, pages C-12, and 52)notes “In order to control for external events that take place during the treatment it is important that the treatment andcontrol groups experience the same history.” It is critical that there be a “comparison over the same calendar timeperiod (thus keeping constant the local economic conditions, community service environments, and Federal policyconditions) of employment and nonemployment situations between matched clients served and not served by VR.”This procedure allows for examining a more homogeneous group in that they are applying under the same conditionswith respect to eligibility, budgetary, and “business cycle” considerations. Thus, an evaluation based on applicants in agiven fiscal year allows for more of an “apples to apples” comparison of persons who receive VR services with thosewho apply but ultimately do not get services.
Another advantage to this approach is that it acknowledges that vocational rehabilitation takes time andenables a more explicit accounting of the longitudinal nature of VR service provision. While ostensibly a “time-limited”service regimen, many VR plans may be several years in duration. Tracking a cohort according to year of applicationallows for a more logical enumeration of the flow of both vocational outcomes and VR service dollars. In essence, onecan think of an applicant “class of ...” for a given fiscal year, with different years of “graduation”, and varying serviceregimens and vocational outcomes.
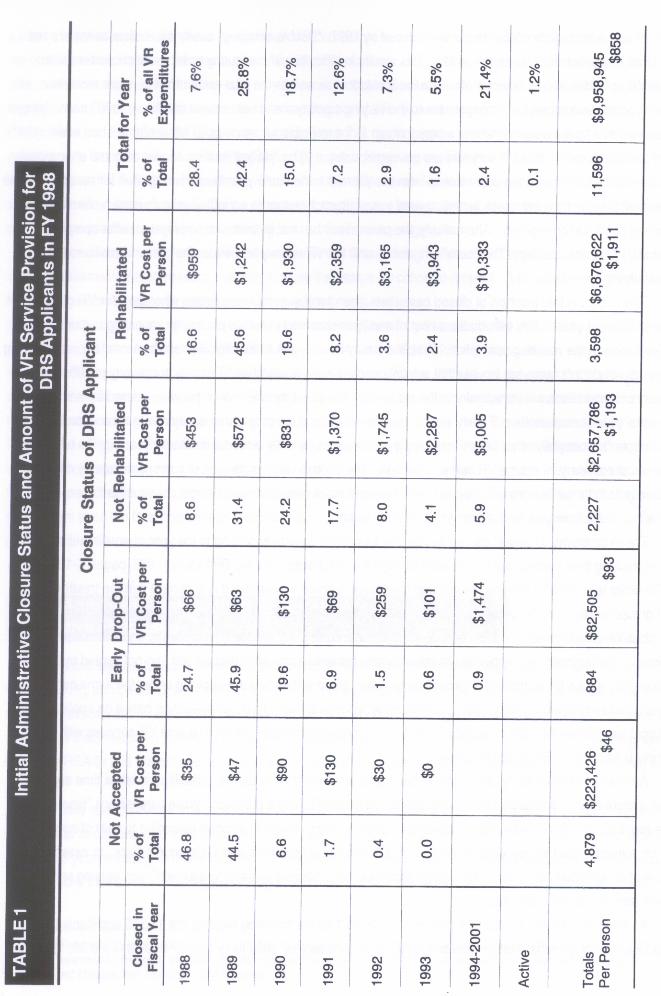
An illustration of this approach is presented in Table 1 on the following page for the 11,596 applicants to theVirginia Department of Rehabilitative Services (DRS) in state fiscal year 1988 (July 1, 1987 through June 30, 1988). In
11
this rendering the percentage of the column total and average cost of VR purchased services per person are presentedaccording to the year of closure. Note that this information is provided for the differing VR closure statuses as well asfor the total sample. The entry in the last column represents the share of the cumulative purchased VR servicesexpended on clients closed in the given fiscal year.
Several interesting patterns emerge from this longitudinal approach to examining the VR process. Note therelatively large share of all VR applicants who are closed early on due to being ineligible or having determined that VRis inappropriate (i.e., early dropouts). Indeed, more than 90% of all persons who are ineligible for VR services (or donot accept) are terminated from VR within two years. Similarly, more than 90% of the program drop-outs are terminatedwithin three years of application. At the same time, these persons received very little in the way of purchased services,averaging $46 and $93 for ineligibles and dropouts (from the total number in each group at the bottom of the respectivecolumns), respectively.
In contrast, relatively few persons are closed in a rehabilitated (16.6%) or not-rehabilitated status (8.6%) in thesame year as they applied (1988). Rather, a greater share is terminated in subsequent years, peaking in 1989. Note,that 60% of the not rehabilitated cohort and 38% of the rehabilitated cohort is closed more than two years after the yearof application. Concomitantly, the average cost of purchased VR services increases the longer a person enrolled in aVR program, regardless of whether the person was closed rehabilitated or not rehabilitated. In each of these closurecohorts there is a more than ten-fold increase in average service receipt from the first to last year of closure. The 8.6%of the not-rehabilitated cohort which closed in the year of application received only $453 in purchased services. Thevalue of purchased services averages over $5,000 for the 5.9% of this cohort closing in the years 1994-2001. A similarstory emerges for the rehabilitated cohort, albeit at twice the service cost. One-sixth of this cohort is closed in the yearof application and receive $959 in VR services. While only four percent of successful rehabilitations occur in theinterval from 1994-2001 the value of VR service provision exceeds $10,000. Not surprisingly, the overall cost of serviceprovision, irrespective of closure year, is highest for the 3,598 individuals in the group closed rehabilitated — anaverage of $1,911. In contrast, the not rehabilitated cohort received $1,193 in services purchased by the DRS.
The overall yearly distribution of closures and VR service provision can be gleaned from the “Total for Year”entries in the last two columns. The overall share of the 11,596 VR closures is largest in the year after application (42.4% in 1989) and steadily declines in subsequent periods. Note that some 2.4% of closures occurred more than fiveyears after the year of application (1994-2001) and there are even a few cases still active at this time.
The value of VR purchased services through December, 2000 for the entire “class of 1988” totals almost $10million. (This includes the expenditure for those cases still open at this time.) The largest percentage of total VRexpenditure, more than one-quarter, occurs in 1989. The bulk of purchased services are given to persons who closefrom VR in much later periods. Observe that while more than 70% of closures occur in the first two years, they onlyaccount for one-third of the share of total cost incurred. Conversely, the expenditure in the periods 1990 and beyondaccounts for almost two-thirds of the value of all VR services purchased for this 1988 applicant cohort. Indeed, the2.4% of total closures occurring in 1994-2001 accounted for over one-fifth (21.4%) of the overall VR expenditure.Overall, the average expenditure for the entire cohort for this initial VR service regimen averages $858.
A different glimpse of this total expenditure can be provided by examining the share received by each closurecohort. The totals figure at the bottom of each column report the number of persons in each cohort and the total valueof these purchased VR services. From this perspective it is apparent that each cohort’s exposure to VR is significantly
12
different. The 4,879 people in the cohort who applied and were not accepted (or who chose not to receive VR)comprise 42% of all applicants and yet receive less than two percent of service provision (invariably a general medicalexamination). The dropout cohort of 884, who makeup eight percent of the applicants, receive only one percent of VRservices. Thus, half of the applicants receive only three percent of the purchased services. The bulk of services —69% of the total are given to the rehabilitated cohort, who comprise less than one-third of the applicant population.Finally, the not rehabilitated cohort receive more than one-quarter of the purchased services and yet represent lessthan 20% of all applicants.
Additional Service Provision Beyond Initial Closurefrom VR
While VR has always been a provider of “time-limited” services, the notion of “workplace supports” connotesservice provision of a more ongoing nature. Indeed, when evaluating VR service impacts it seems somewhat short-sighted to focus on only a single episode of an intervention when more services may be required by the individual atsome point in the not-too-distant future. Fortunately, the longitudinal data base maintained by the Virginia VR agencyallows for tracking of services not only on a “case-basis”, but for the individual consumer as well. Specifically, a file ismaintained of all purchased services provided to consumers of VR from 1988 through the present. As a result, serviceprovision can be tracked for all VR episodes occurring during this interval.
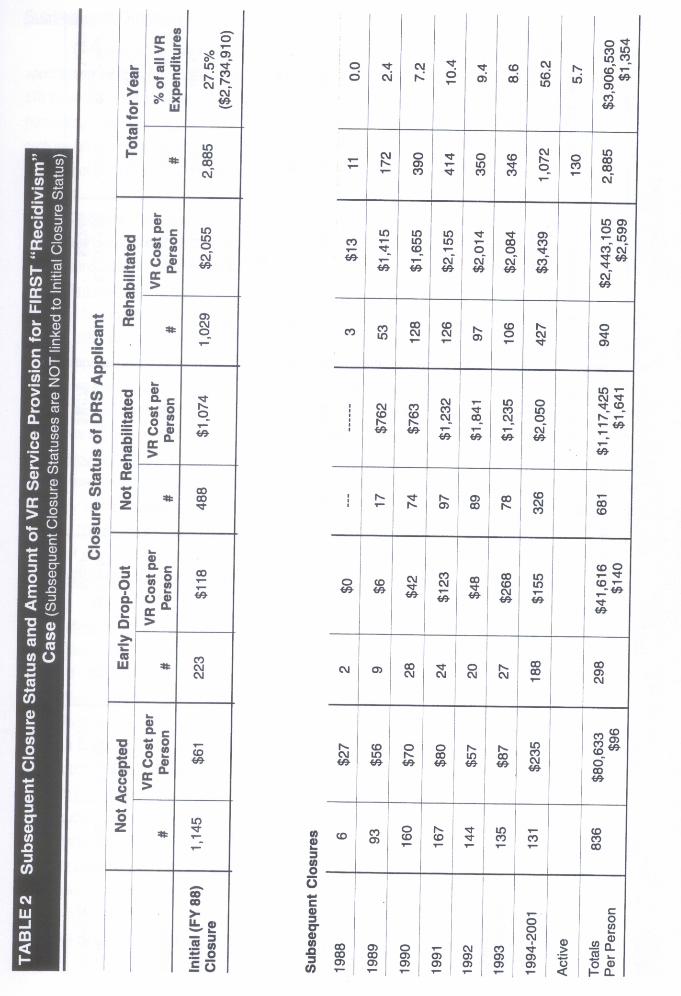
Recall that the almost-$10 million in service expenditure reported in Table 1 is for the initial administrative caseclosure year for the cohort of 11,596 applicants during FY1988. As Table 2 on the following page reveals, it turns outthat almost one-quarter (2,885 persons) of this cohort has some subsequent contact with the Virginia VR agency. Thiscontact could range from merely applying for more services all the way up to being accepted for significant serviceprovision and being deemed successfully rehabilitated. Almost 40% of the population with more than one VR episode,or 1,145 cases, had not been initially accepted for VR. These people can be viewed as re-applicants. At the otherextreme are the 1,029 people, or 36% of the multiple-episode cohort, who were initially rehabilitated and who thencame back for more. These people can be considered “recidivists”. In between are the early drop-outs (223 individu-als, or 7.7% of all persons with multiple VR episodes) and those persons not employed after receiving significantservices (488, or 16.9%). The latter two cohorts can be viewed as trying to complete a (perhaps altered) VR employ-ment plan, given that the first attempt did not “pan” out.
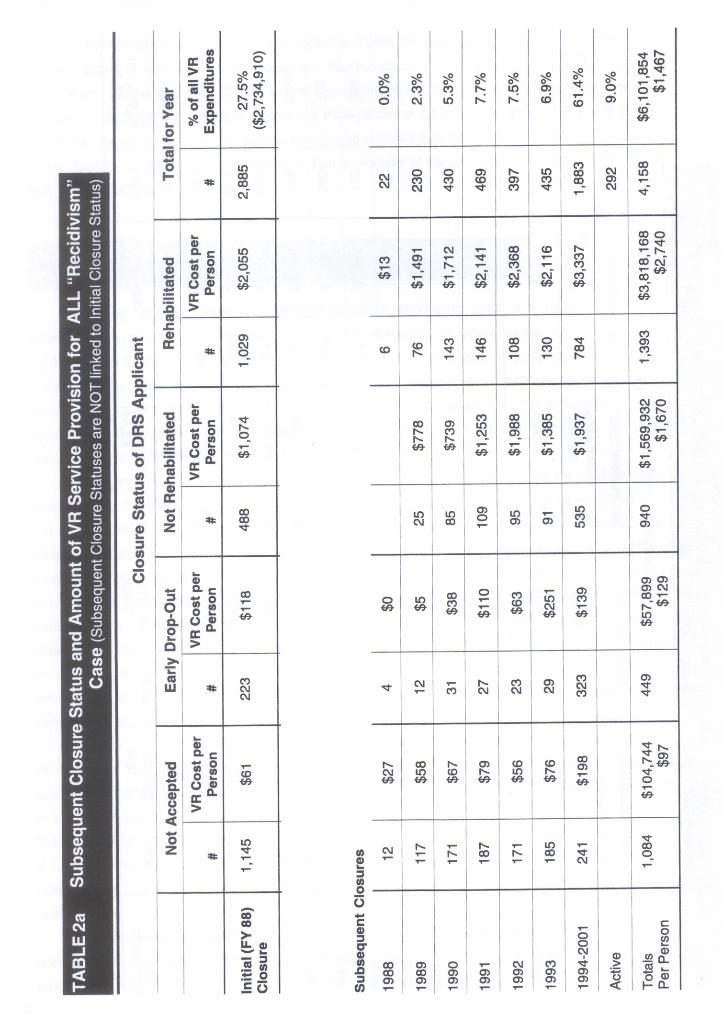
So how big an issue is subsequent VR episodes? To put its magnitude in context consider that the VR serviceexpenditure for this cohort was initially some $2.7 million for their first intervention. The cost for this cohort’s second VRepisode, as reported in the bottom right corner of Table 2, is almost 50% greater, at $3.9 million. Moreover, there arean additional 1,273 cases of a third (or even more) VR episode from 1988 through 2000 that cost another $2.2 million.All told, Table 2a on the following page reveals that one-quarter of the initial applicant cohort in 1988 has 4,158 casesof subsequent VR contact, receiving another $6.1 million in VR service provision. This extra spending results in morethan $16 million in total VR service expenditure for the “Class of 1988”, or 60% more than what was reported for theirinitial episode.
To some extent, the outcome of subsequent VR service episodes depends on the initial outcome. Conse-quently, the subsequent closure status, number of cases, average VR service expenditure, and year of closure isreported for each of the initial closure statuses of the 1988 applicant cohort.
15
Subsequent Outcomes and Costs for Persons Initially Not Accepted
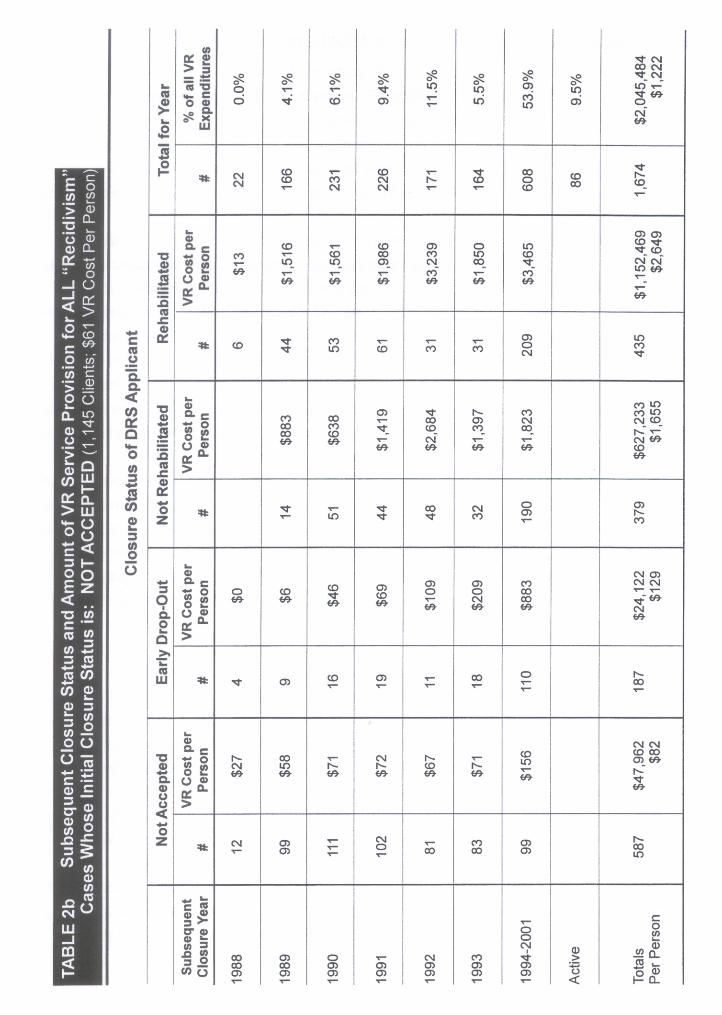
Consider first, in Table 2b on the following page, the cohort of 1,145 individuals who did not make it beyond theapplicant status (i.e., not accepted) when they applied for VR services in FY 1988. This cohort received a total of only$70 thousand in VR services during this initial episode, or an average of $61 per person. These costs were solely forpurchasing a medical diagnosis and/or evaluation to determine eligibility for services, or perhaps for transportation tosuch an appointment. The bottom right-hand corner of Table 2b reveals that these people had 1,674 subsequentepisodes of VR through 2000 at an average VR cost of $1,222, resulting in an additional VR expenditure of more than$2 million.
Of course this average expenditure masks widely divergent service receipt, depending on the outcome ofsubsequent VR episodes. Should a person not be accepted again upon further application, as occurred in 587 cases,the additional costs to VR are quite small ($82 on average, for a total of $47,962). Note that the year in which thesubsequent closure(s) took place are reported individually for the year of application (1988) and the five following years,as well as for the interval 1994 through 2001. There are 86 cases reported in the last row that are still active as ofJanuary, 2001 and thus do not have a closure date or status. The total cost of these cases is substantial – $193,698 –which comprises almost 10% of the total cost of subsequent VR services for this not-accepted cohort. The averagecost for these cases is $2,252, which is almost twice the overall average of $1,222. The number of cases and averagecost are fairly stable for the five years after application. The numbers drop significantly in the later years interval (only99 persons not accepted in 1994-2001) but the average service cost more than doubles to $156.
Roughly 2/3 of the cases (1087/1674, or 64.9%) who applied but weren’t initially entering a VR service regimenare accepted for VR services on their second “go-round”. This group can be perceived as a potential comparison groupsince they form a “staggered cohort”. A small portion, 187 cases (or 11.2% of the total), choose to drop out prior to whatVR terms “significant service provision”. The costs to VR of such cases are trivial – less than $25 thousand. Thenumber of closures per year for these drop-outs seems to be fairly stable, at between 10-20 cases annually for theinterval 1990-2001. One interesting point is the fairly high cost per case, at $883, for the cohort closing in the 1994-2001.
More than twice as many cases, 379 — or 22.6% of the initial withdrawal/screen-outs, are not rehabilitatedafter a subsequent (second or more) VR episode. The cost to VR are substantial, more than $627 thousand, andaverage $1,655 per case. The distribution of number of closures per year is fairly uniform, ranging from 32-51 closuresper year from 1989 through 1994 and about 25 cases annualized for the period 1994-2001. In general, the costs perclosure increase the later the year of closure, emphasizing the importance of tracking on-going VR assistance.
A similar number of cases, 435 — more than one-fourth of all subsequent VR episodes, end up being success-fully rehabilitated after initially withdrawing or being screened out. These cases cost some $1.15 million, for an averageof $2,649 in additional VR services. There are more closures in the period 1989-1991 (between 44 and 61 per year)than in subsequent years, when only about 30 cases per year close. However, the notion of time-limited VR services isfurther disabused as the cost per case is more than twice as much for the latter closures. Further evidence of thenecessity of viewing VR service provision on an ongoing basis is provided in the last column, which reports the share oftotal amount expended according to year of closure. Subsequent closures occurring in the interval 1994-2001, alongwith the significant number of cases that are still active, accounted for almost two-thirds of the more than $2 millionexpended on all persons who chose to re-visit VR after not being initially accepted in FY 1988.
17
Subsequent Outcomes and Costs for Persons Who Initially Drop-Out
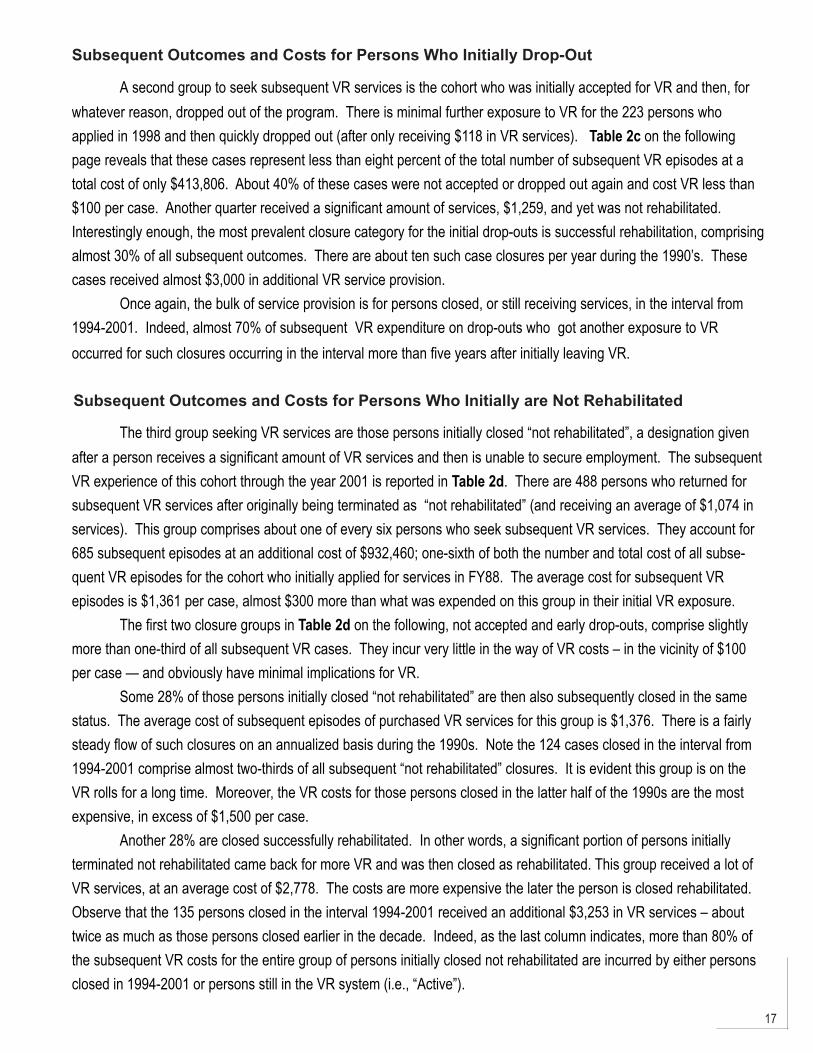
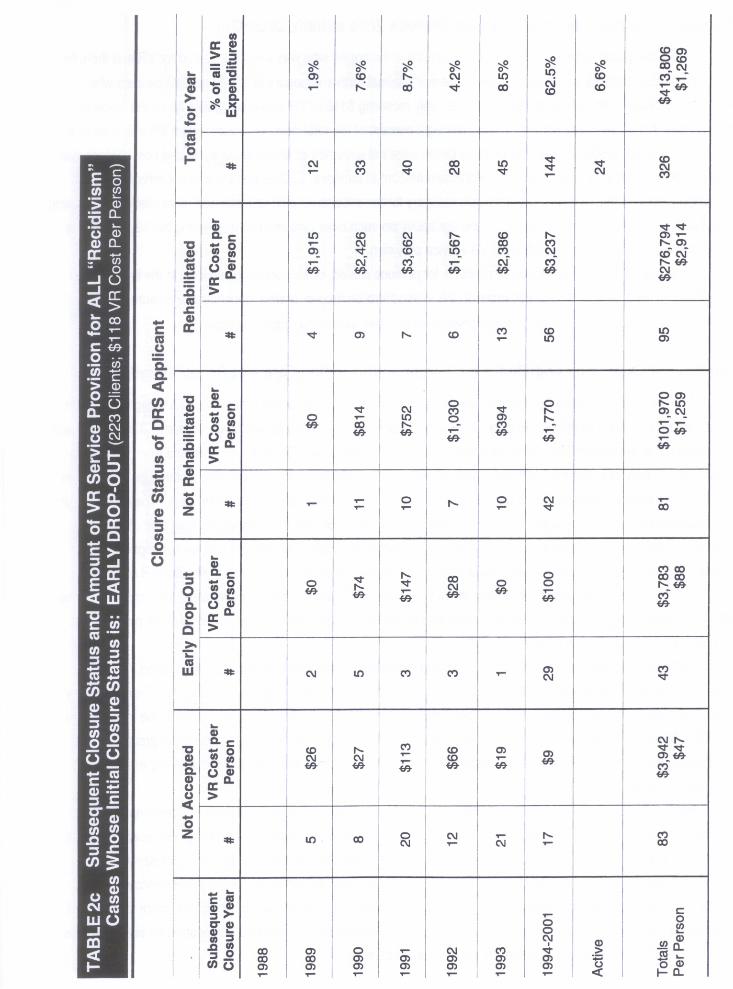
A second group to seek subsequent VR services is the cohort who was initially accepted for VR and then, forwhatever reason, dropped out of the program. There is minimal further exposure to VR for the 223 persons whoapplied in 1998 and then quickly dropped out (after only receiving $118 in VR services). Table 2c on the followingpage reveals that these cases represent less than eight percent of the total number of subsequent VR episodes at atotal cost of only $413,806. About 40% of these cases were not accepted or dropped out again and cost VR less than$100 per case. Another quarter received a significant amount of services, $1,259, and yet was not rehabilitated.Interestingly enough, the most prevalent closure category for the initial drop-outs is successful rehabilitation, comprisingalmost 30% of all subsequent outcomes. There are about ten such case closures per year during the 1990’s. Thesecases received almost $3,000 in additional VR service provision.
Once again, the bulk of service provision is for persons closed, or still receiving services, in the interval from1994-2001. Indeed, almost 70% of subsequent VR expenditure on drop-outs who got another exposure to VRoccurred for such closures occurring in the interval more than five years after initially leaving VR.
Subsequent Outcomes and Costs for Persons Who Initially are Not Rehabilitated
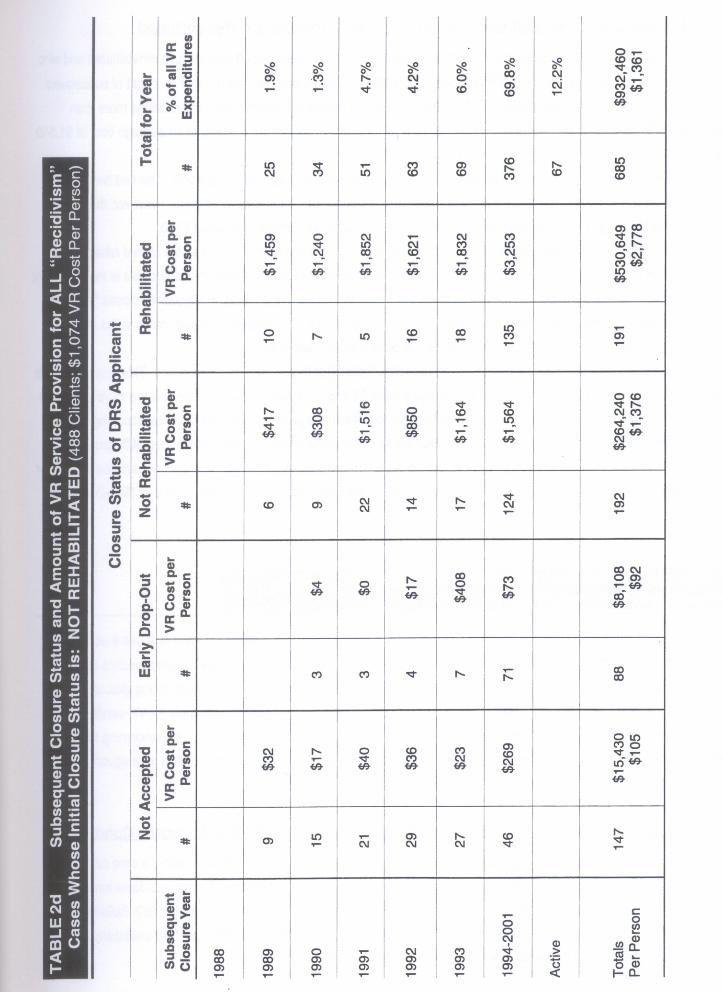
The third group seeking VR services are those persons initially closed “not rehabilitated”, a designation givenafter a person receives a significant amount of VR services and then is unable to secure employment. The subsequentVR experience of this cohort through the year 2001 is reported in Table 2d. There are 488 persons who returned forsubsequent VR services after originally being terminated as “not rehabilitated” (and receiving an average of $1,074 inservices). This group comprises about one of every six persons who seek subsequent VR services. They account for685 subsequent episodes at an additional cost of $932,460; one-sixth of both the number and total cost of all subse-quent VR episodes for the cohort who initially applied for services in FY88. The average cost for subsequent VRepisodes is $1,361 per case, almost $300 more than what was expended on this group in their initial VR exposure.
The first two closure groups in Table 2d on the following, not accepted and early drop-outs, comprise slightlymore than one-third of all subsequent VR cases. They incur very little in the way of VR costs – in the vicinity of $100per case — and obviously have minimal implications for VR.
Some 28% of those persons initially closed “not rehabilitated” are then also subsequently closed in the samestatus. The average cost of subsequent episodes of purchased VR services for this group is $1,376. There is a fairlysteady flow of such closures on an annualized basis during the 1990s. Note the 124 cases closed in the interval from1994-2001 comprise almost two-thirds of all subsequent “not rehabilitated” closures. It is evident this group is on theVR rolls for a long time. Moreover, the VR costs for those persons closed in the latter half of the 1990s are the mostexpensive, in excess of $1,500 per case.
Another 28% are closed successfully rehabilitated. In other words, a significant portion of persons initiallyterminated not rehabilitated came back for more VR and was then closed as rehabilitated. This group received a lot ofVR services, at an average cost of $2,778. The costs are more expensive the later the person is closed rehabilitated.Observe that the 135 persons closed in the interval 1994-2001 received an additional $3,253 in VR services – abouttwice as much as those persons closed earlier in the decade. Indeed, as the last column indicates, more than 80% ofthe subsequent VR costs for the entire group of persons initially closed not rehabilitated are incurred by either personsclosed in 1994-2001 or persons still in the VR system (i.e., “Active”).
20
Subsequent Outcomes and Costs for Persons Who Initially are Rehabilitated
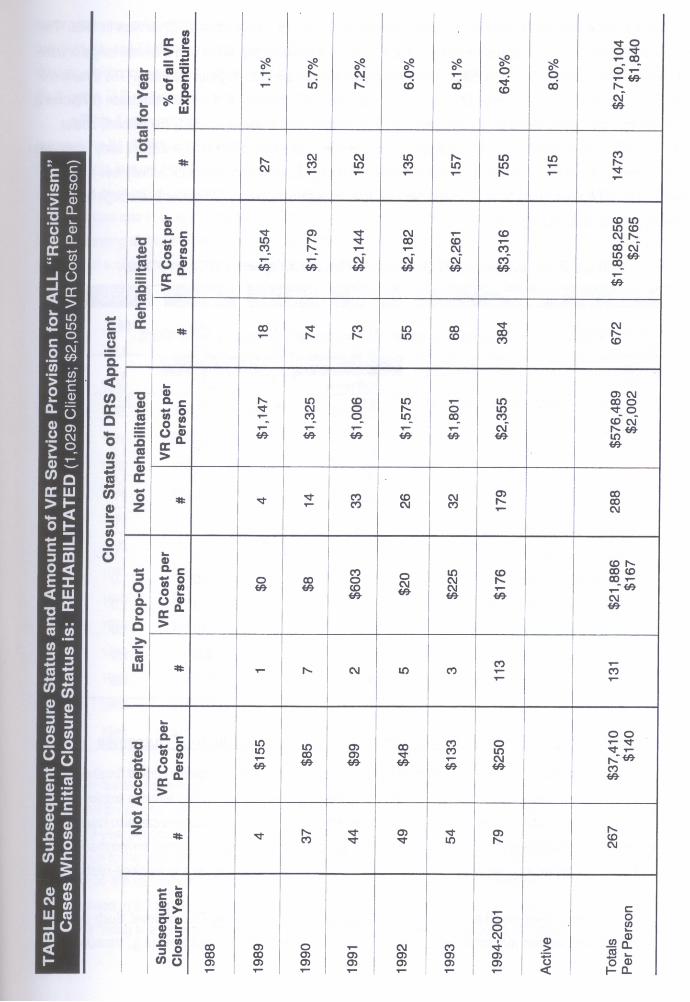
The last group to examine are the true “recidivists” - persons initially closed successfully rehabilitated and whothen subsequently re-apply for more VR services. Table 2e on page 21 provides the number and cost of subsequentVR episodes for the 1,029 applicants in FY1988 who are initially closed as rehabilitated (and received more than$2,000 in VR services in the process). This group had 1,473 subsequent VR encounters, at an average cost of $1,840per case.
The cost per case varies dramatically with the outcome of the subsequent VR episode. The first two groups,not accepted and early drop-outs, account for more than one-quarter of all cases of recidivism. However, the totalexpenditure for this group is less than $60 thousand, with a per case average of only about $150.
Some 20% of the initially rehabilitated cases ended up with a subsequent closure status of “not rehabilitated”.These cases are fairly costly, averaging just over $2,000 per closure. A recurring theme in this analysis is the significantinterval of time during which persons are involved in VR. More than 60% of the cases subsequently closed “not reha-bilitated” occurred in the latter portion of the decade. Once again, these 179 cases with closure dates in the interval1994-2001 are also the most expensive — at $2,355 in purchased VR services.
The last group of interest is the cohort closed rehabilitated (for the second, or more, time). This group accountsfor 46% of all cases of subsequent VR, at an average cost of $2,765. The later the year of closure the more expensivethe VR cost, continuing with the pattern noted earlier. Indeed, the average cost of the 384 closures occurring in theinterval 1994-2001 (57% of all the successfully rehabilitated closures) is $3,316, which is more than 50% greater thanthe highest cost for closures occurring earlier in the decade. This pattern of greater costs in subsequent years is furtherbuttressed in the last column, which reports 72% of the VR expenditure occurring for cases closed in 1994-2001 or stillactive.
Data Elements Required for Developing a LongitudinalEvaluation Framework for VR
Having established that the appropriate framework for the longitudinal evaluation of VR requires a cohort of VRapplicants, the next stage in the analysis is to collect and describe the variables necessary to operationalize such an“outcome-based” assessment. There are four distinct types of data needed, with each “module” being gleaned from adifferent administrative database. These modules include attributes of the individuals who apply for VR services,measures of the vitality of the local economy in which the person is seeking employment, details concerning the VRservice package the person receives, and earnings streams for these individuals both prior to and subsequent to theVR intervention. The elements in each of these modules are discussed in turn.
Demographic and Socio-Economic Characteristics of the 1988 DRS Applicant Cohort
Being a state-federal training program, state VR agencies are federally mandated to collect a core set ofdemographic and socio-economic variables for all individuals at the time of application. Economists have long-estab-lished that a sub-set of an individual’s “human capital” attributes influence VR outcomes (Conley, 1969; Bellante, 1972;Worrall, 1983). These factors include the person’s disabling condition, gender, race, and age. The availability of othersources of income also will influence a person’s employment decisions.
22
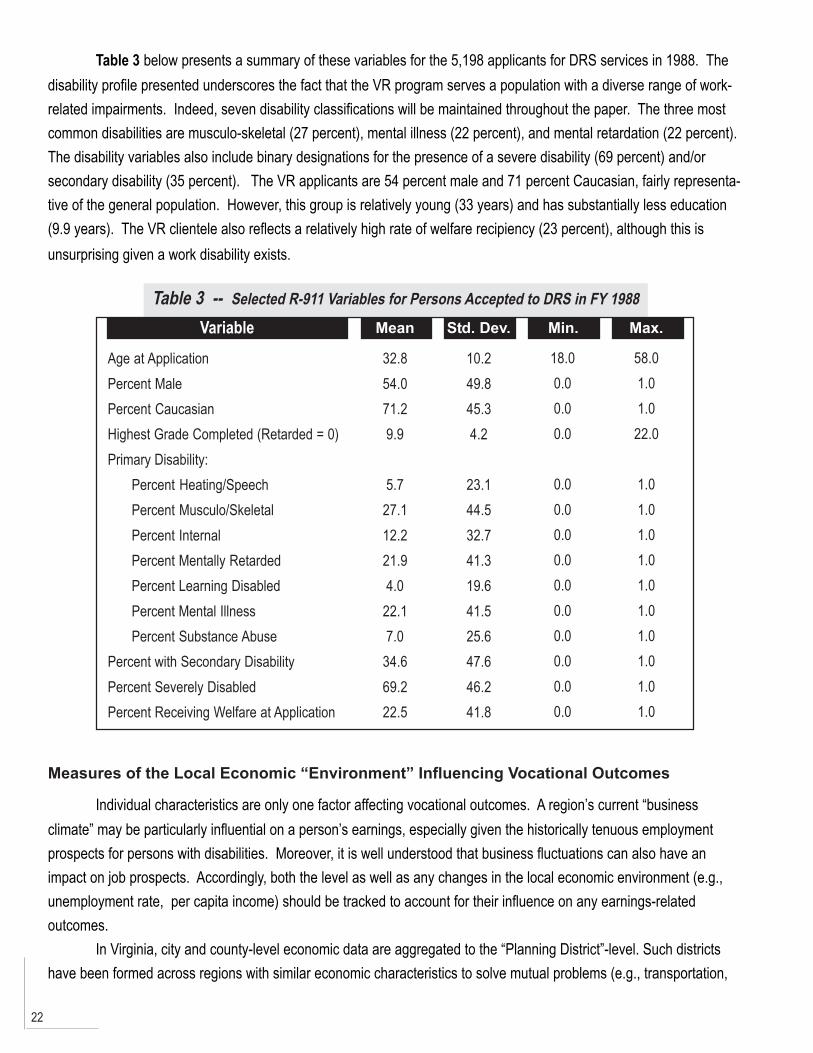
Table 3 below presents a summary of these variables for the 5,198 applicants for DRS services in 1988. Thedisability profile presented underscores the fact that the VR program serves a population with a diverse range of work-related impairments. Indeed, seven disability classifications will be maintained throughout the paper. The three mostcommon disabilities are musculo-skeletal (27 percent), mental illness (22 percent), and mental retardation (22 percent).The disability variables also include binary designations for the presence of a severe disability (69 percent) and/orsecondary disability (35 percent). The VR applicants are 54 percent male and 71 percent Caucasian, fairly representa-tive of the general population. However, this group is relatively young (33 years) and has substantially less education(9.9 years). The VR clientele also reflects a relatively high rate of welfare recipiency (23 percent), although this isunsurprising given a work disability exists.
Table 3 -- Selected R-911 Variables for Persons Accepted to DRS in FY 1988
Variable Mean
Age at ApplicationPercent MalePercent CaucasianHighest Grade Completed (Retarded = 0)Primary Disability:
Percent Heating/SpeechPercent Musculo/SkeletalPercent InternalPercent Mentally RetardedPercent Learning DisabledPercent Mental IllnessPercent Substance Abuse
Percent with Secondary DisabilityPercent Severely DisabledPercent Receiving Welfare at Application
32.854.071.29.9
5.727.112.221.94.0
22.17.0
34.669.222.5
10.249.845.34.2
23.144.532.741.319.641.525.647.646.241.8
18.00.00.00.0
0.00.00.00.00.00.00.00.00.00.0
58.01.01.0
22.0
1.01.01.01.01.01.01.01.01.01.0
Std. Dev. Min. Max.
Measures of the Local Economic “Environment” Influencing Vocational Outcomes
Individual characteristics are only one factor affecting vocational outcomes. A region’s current “businessclimate” may be particularly influential on a person’s earnings, especially given the historically tenuous employmentprospects for persons with disabilities. Moreover, it is well understood that business fluctuations can also have animpact on job prospects. Accordingly, both the level as well as any changes in the local economic environment (e.g.,unemployment rate, per capita income) should be tracked to account for their influence on any earnings-relatedoutcomes.
In Virginia, city and county-level economic data are aggregated to the “Planning District”-level. Such districtshave been formed across regions with similar economic characteristics to solve mutual problems (e.g., transportation,
23
water resources, solid waste planning) which cross political boundary lines. The planning districts reflect the aggrega-tion of 41 city and 54 county regions into 21 districts. There is tremendous heterogeneity among these planningdistricts, which include the poorer coal-mining localities in southwestern Virginia as well as the affluent suburbs ofWashington, D.C. in the northeastern part of the state.
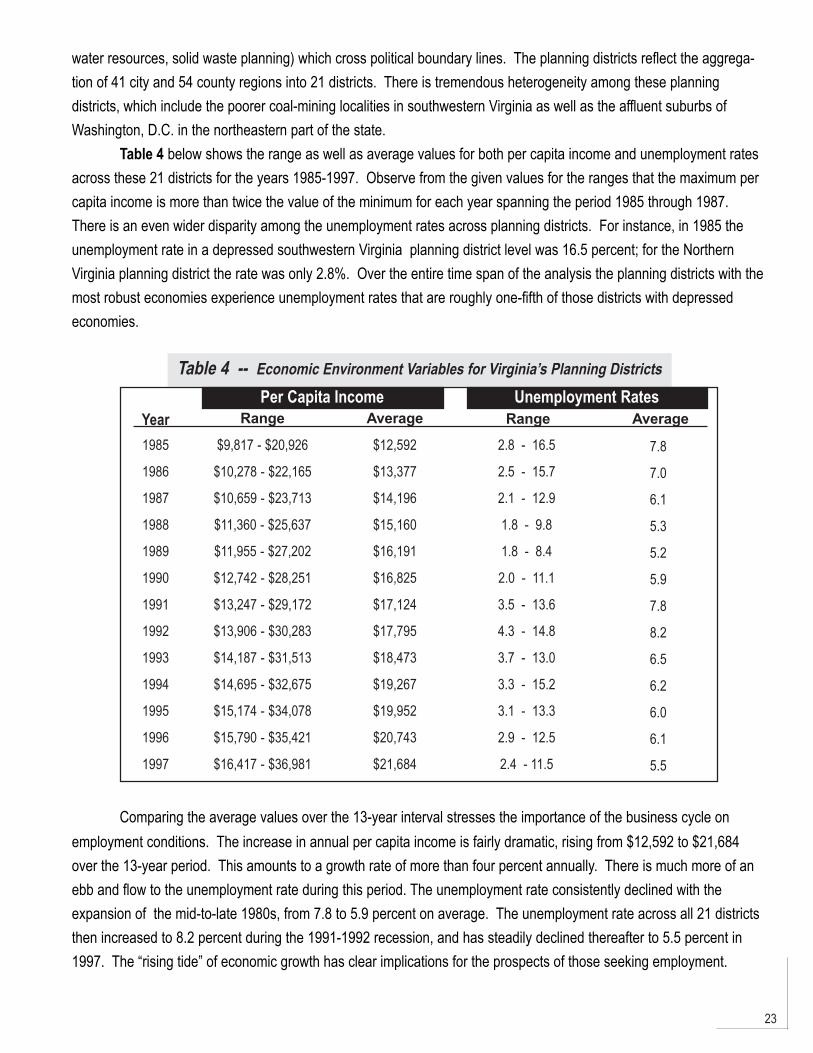
Table 4 below shows the range as well as average values for both per capita income and unemployment ratesacross these 21 districts for the years 1985-1997. Observe from the given values for the ranges that the maximum percapita income is more than twice the value of the minimum for each year spanning the period 1985 through 1987.There is an even wider disparity among the unemployment rates across planning districts. For instance, in 1985 theunemployment rate in a depressed southwestern Virginia planning district level was 16.5 percent; for the NorthernVirginia planning district the rate was only 2.8%. Over the entire time span of the analysis the planning districts with themost robust economies experience unemployment rates that are roughly one-fifth of those districts with depressedeconomies.
Table 4 -- Economic Environment Variables for Virginia’s Planning Districts
Year Range Average
1985
1986
1987
1988
1989
1990
1991
1992
1993
1994
1995
1996
1997
$9,817 - $20,926
$10,278 - $22,165
$10,659 - $23,713
$11,360 - $25,637
$11,955 - $27,202
$12,742 - $28,251
$13,247 - $29,172
$13,906 - $30,283
$14,187 - $31,513
$14,695 - $32,675
$15,174 - $34,078
$15,790 - $35,421
$16,417 - $36,981
$12,592
$13,377
$14,196
$15,160
$16,191
$16,825
$17,124
$17,795
$18,473
$19,267
$19,952
$20,743
$21,684
2.8 - 16.5
2.5 - 15.7
2.1 - 12.9
1.8 - 9.8
1.8 - 8.4
2.0 - 11.1
3.5 - 13.6
4.3 - 14.8
3.7 - 13.0
3.3 - 15.2
3.1 - 13.3
2.9 - 12.5
2.4 - 11.5
7.8
7.0
6.1
5.3
5.2
5.9
7.8
8.2
6.5
6.2
6.0
6.1
5.5
Per Capita Income Unemployment RatesRange Average
Comparing the average values over the 13-year interval stresses the importance of the business cycle onemployment conditions. The increase in annual per capita income is fairly dramatic, rising from $12,592 to $21,684over the 13-year period. This amounts to a growth rate of more than four percent annually. There is much more of anebb and flow to the unemployment rate during this period. The unemployment rate consistently declined with theexpansion of the mid-to-late 1980s, from 7.8 to 5.9 percent on average. The unemployment rate across all 21 districtsthen increased to 8.2 percent during the 1991-1992 recession, and has steadily declined thereafter to 5.5 percent in1997. The “rising tide” of economic growth has clear implications for the prospects of those seeking employment.
24
VR Services Received by the 1988 DRS Applicant Cohort
A circumspect description of the socioeconomic attributes for a VR applicant cohort and the local economicconditions in which they seek employment has now been presented. The next step in the analytical framework is toaccurately capture the “treatment” variable — the mix of services that VR provides. Clearly, the character of therehabilitation program will vary systematically with the nature of the disabling condition. However, the RSA-911 reportsonly the total value of services purchased for each person, along with binary designations as to which of a dozen or sogeneral types of services is being provided (e.g., counseling, restorative services, job training). This specification doesnot provide a meaningful measure of the intensity of the service regimen.
Alternatively, the Virginia DRS maintains a purchased-service file which records service-specific invoices for 62types of rehabilitative services. The specificity of this accounting data requires some subjective aggregation forpurposes of this analysis. Following the logical flow of VR, six broader service categories can be defined: 1) diagnosisand evaluation; 2) restoration; 3) education; 4) training; 5) a maintenance stipend; and 6) employment-related supportservices.
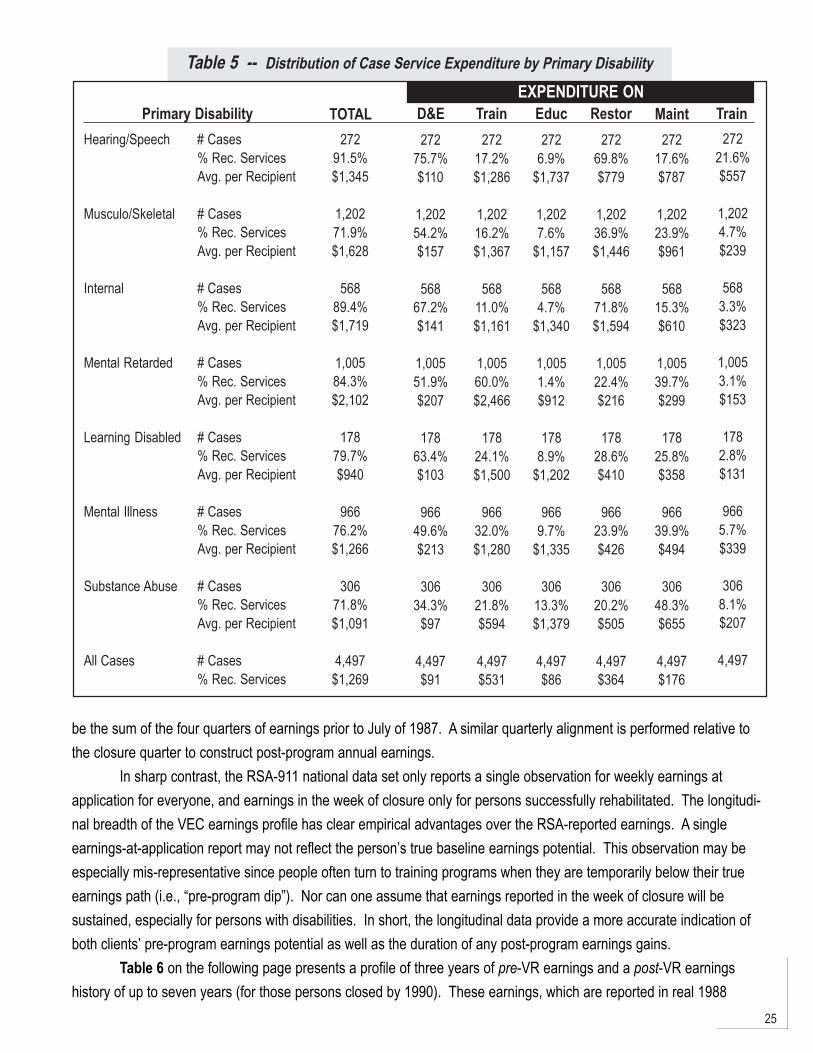
Table 5 on the following page presents an overview of these categories of service expenditure for those VRapplicants who are subsequently accepted for “significant” service receipt (i.e., ineligibles and early program dropoutsare excluded). This “treatment group” subset of VR applicants is then stratified by the seven disability classifications.Each cell of the table presents three descriptive statistics: 1) the number of cases; 2) the percent of the cohort receivingthe service; and 3) the cost per recipient. These three summary statistics reveal that the value and frequency ofservices can vary widely by service type and disabling condition. Educational services for persons with hearing and/orspeech impairments is a prime example. Although only a small fraction receives educational services (6.9%), the costper recipient is quite high ($1,737). This cost phenomenon for educational services is consistent across all sevendisability categories. In contrast, the frequency of restorative services more closely tracks the disabling condition.Roughly 70 percent of persons with internal and hearing/speech impairments receive restorative services, as comparedto only 20-37 percent across the other disability groups. In a similar vein, training services are concentrated on personswith mental retardation — 60 percent of this cohort receives training at a cost per recipient of almost $2,500.
The bottom portion of the information found on the chart on the previous page presents summary statistics forthe entire treatment group. The average cost of VR-purchased services for all clients is $1,269. Roughly two-thirds ofthis total reflects training ($531) and restorative ($364) services. However, the overall average cost for the treatmentgroup masks substantial variation by disability type, which ranges from a low of $750 for persons with learning disabili-ties to a high of $1,773 for persons with mental retardation.
Earnings for the 1998 DRS Applicant Cohort
To this point, we have asserted that an analysis of VR impacts on vocational outcomes is most accuratelydepicted using a cohort of applicants in a given period (in our case, Fiscal Year 1988). What vocational outcomes areto be used and how are these obtained? This analysis compares levels of earnings on an annualized basis. Theseearnings come from a data file, provided by the Virginia Employment Commission (VEC), of quarterly earnings from theperiod 1985-1997. These quarterly earnings are “aligned” around the dates of VR application and closure and thensummed to obtain annual earnings. In other words, annual earnings are not calendar-year earnings. For a person whoapplies to DRS during the first quarter of FY 1988 (July-September 1987), the first year of pre-program earnings would
25
Table 5 -- Distribution of Case Service Expenditure by Primary Disability
EXPENDITURE ONPrimary Disability
Hearing/Speech # Cases% Rec. ServicesAvg. per Recipient
Musculo/Skeletal # Cases% Rec. ServicesAvg. per Recipient
Internal # Cases% Rec. ServicesAvg. per Recipient
Mental Retarded # Cases% Rec. ServicesAvg. per Recipient
Learning Disabled # Cases% Rec. ServicesAvg. per Recipient
Mental Illness # Cases% Rec. ServicesAvg. per Recipient
Substance Abuse # Cases% Rec. ServicesAvg. per Recipient
All Cases # Cases% Rec. Services
TOTAL272
91.5%$1,345
1,20271.9%$1,628
56889.4%$1,719
1,00584.3%$2,102
17879.7%$940
96676.2%$1,266
30671.8%$1,091
4,497$1,269
D&E272
75.7%$110
1,20254.2%$157
56867.2%$141
1,00551.9%$207
17863.4%$103
96649.6%$213
30634.3%
$97
4,497$91
Train272
17.2%$1,286
1,20216.2%$1,367
56811.0%$1,161
1,00560.0%$2,466
17824.1%$1,500
96632.0%$1,280
30621.8%$594
4,497$531
2726.9%
$1,737
1,2027.6%
$1,157
5684.7%
$1,340
1,0051.4%$912
1788.9%
$1,202
9669.7%
$1,335
30613.3%$1,379
4,497$86
Educ272
69.8%$779
1,20236.9%$1,446
56871.8%$1,594
1,00522.4%$216
17828.6%$410
96623.9%$426
30620.2%$505
4,497$364
Restor272
17.6%$787
1,20223.9%$961
56815.3%$610
1,00539.7%$299
17825.8%$358
96639.9%$494
30648.3%$655
4,497$176
Maint272
21.6%$557
1,2024.7%$239
5683.3%$323
1,0053.1%$153
1782.8%$131
9665.7%$339
3068.1%$207
4,497
Train
be the sum of the four quarters of earnings prior to July of 1987. A similar quarterly alignment is performed relative tothe closure quarter to construct post-program annual earnings.
In sharp contrast, the RSA-911 national data set only reports a single observation for weekly earnings atapplication for everyone, and earnings in the week of closure only for persons successfully rehabilitated. The longitudi-nal breadth of the VEC earnings profile has clear empirical advantages over the RSA-reported earnings. A singleearnings-at-application report may not reflect the person’s true baseline earnings potential. This observation may beespecially mis-representative since people often turn to training programs when they are temporarily below their trueearnings path (i.e., “pre-program dip”). Nor can one assume that earnings reported in the week of closure will besustained, especially for persons with disabilities. In short, the longitudinal data provide a more accurate indication ofboth clients’ pre-program earnings potential as well as the duration of any post-program earnings gains.
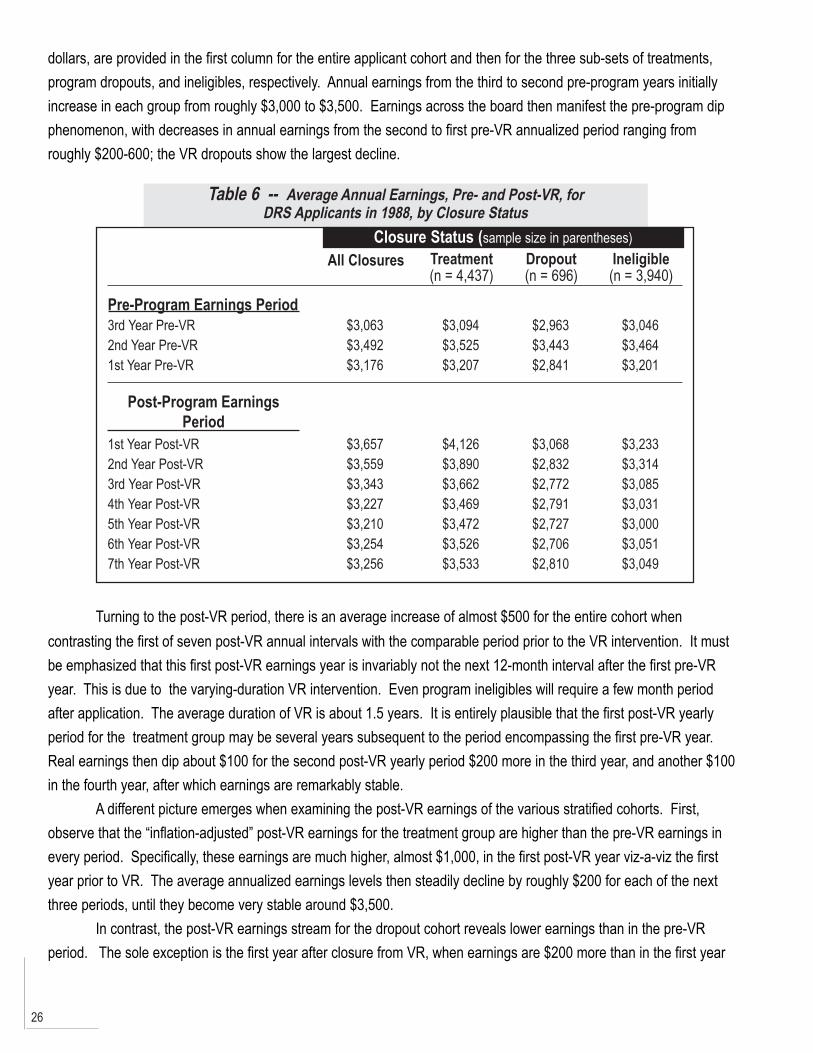
Table 6 on the following page presents a profile of three years of pre-VR earnings and a post-VR earningshistory of up to seven years (for those persons closed by 1990). These earnings, which are reported in real 1988
26
dollars, are provided in the first column for the entire applicant cohort and then for the three sub-sets of treatments,program dropouts, and ineligibles, respectively. Annual earnings from the third to second pre-program years initiallyincrease in each group from roughly $3,000 to $3,500. Earnings across the board then manifest the pre-program dipphenomenon, with decreases in annual earnings from the second to first pre-VR annualized period ranging fromroughly $200-600; the VR dropouts show the largest decline.
Table 6 -- Average Annual Earnings, Pre- and Post-VR, forDRS Applicants in 1988, by Closure Status
Closure Status (sample size in parentheses)
Pre-Program Earnings Period
All Closures Treatment(n = 4,437)
Dropout(n = 696)
Ineligible(n = 3,940)
3rd Year Pre-VR2nd Year Pre-VR1st Year Pre-VR
$3,063$3,492$3,176
$3,094$3,525$3,207
$2,963$3,443$2,841
$3,046$3,464$3,201
Post-Program EarningsPeriod
1st Year Post-VR2nd Year Post-VR3rd Year Post-VR4th Year Post-VR5th Year Post-VR6th Year Post-VR7th Year Post-VR
$3,657$3,559$3,343$3,227$3,210$3,254$3,256
$4,126$3,890$3,662$3,469$3,472$3,526$3,533
$3,068$2,832$2,772$2,791$2,727$2,706$2,810
$3,233$3,314$3,085$3,031$3,000$3,051$3,049
Turning to the post-VR period, there is an average increase of almost $500 for the entire cohort whencontrasting the first of seven post-VR annual intervals with the comparable period prior to the VR intervention. It mustbe emphasized that this first post-VR earnings year is invariably not the next 12-month interval after the first pre-VRyear. This is due to the varying-duration VR intervention. Even program ineligibles will require a few month periodafter application. The average duration of VR is about 1.5 years. It is entirely plausible that the first post-VR yearlyperiod for the treatment group may be several years subsequent to the period encompassing the first pre-VR year.Real earnings then dip about $100 for the second post-VR yearly period $200 more in the third year, and another $100in the fourth year, after which earnings are remarkably stable.
A different picture emerges when examining the post-VR earnings of the various stratified cohorts. First,observe that the “inflation-adjusted” post-VR earnings for the treatment group are higher than the pre-VR earnings inevery period. Specifically, these earnings are much higher, almost $1,000, in the first post-VR year viz-a-viz the firstyear prior to VR. The average annualized earnings levels then steadily decline by roughly $200 for each of the nextthree periods, until they become very stable around $3,500.
In contrast, the post-VR earnings stream for the dropout cohort reveals lower earnings than in the pre-VRperiod. The sole exception is the first year after closure from VR, when earnings are $200 more than in the first year
27
prior to VR. Real earnings then decline more than $200 in the subsequent six year intervals, with very little variationaround $2,800.
Finally, the earnings for the program ineligibles differ little from the first pre- and post-VR annual periods.Earnings increase very slightly in the second post-VR annual period. However this is not sustained as annualizedearnings decline by more than $200 in the third post-VR year and diverge very little from this amount in next four years.
Estimating Earnings Impacts in a Quasi-ExperimentalMethodology
The best method for gauging VR impacts on earnings is an experimental framework using a randomly-assignedtreatment group versus control group of participants who are denied services (Burtless, 1995). However, experimentalevaluations of VR are virtually unprecedented due to the ethical and legal obstacles of denying the services of a publicprogram to otherwise eligible persons. A second-best solution uses a “comparison” group in a “quasi-experimental”setting.
A substantial literature has explored the reliability of evaluations using a quasi-experimental framework. Thismethod relies on identifying a valid “comparison” group against which effects on the treatment group can be measured.The major pitfall to this approach is the potential for “selection bias”. Heckman and Hotz (1989) emphasize theimportance of appropriate statistical procedures that test the quality of candidate comparison groups using longitudinalearnings. They argue that such tests, when passed, significantly improve the reliability of estimates based oncomparison group methodology.
Technically, this evaluation adopts what is called an “internal” comparison group. This term connotes a sub-group that has some exposure to the program but does not receive substantial treatment. By definition, “Status 30”closures or dropouts are persons who apply and are accepted to VR, but never begin a prescribed service regimen.The appeal of this group is that the potential problems of selection bias are diminished since members of this grouphave passed through the same self-selection and programmatic screens as the treatment group. This brand of internalcomparison group, also referred to as “no shows”, received recent empirical support in an evaluation by Bell et al.(1995). The longitudinal employment data available using VEC quarterly earnings provide an ideal venue for testing theuse of an internal comparison group in the context of the VR program. The discussion below describes a sequence ofthree sets of statistical tests performed on pre-program longitudinal earnings. These tests are designed to identifyincreasingly serious forms of selection bias (Bassi; 1983, 1984).
The first set of tests is straightforward, positing that the treatment and comparison groups do not differ at themeans for observable characteristics which influence earnings (e.g., age, education, disability, race, and gender).However, for the VR cohorts under study, statistically significant differences do exist with respect to these variables.Therefore, measuring treatment impacts must go beyond a simple difference-in-means analysis based on post-programearnings of treatment and comparison groups. At a minimum, regressions including these characteristics and atreatment binary must be run on post-treatment earnings levels.
A second set of tests applies “Hausman” and “Chow” tests performed on the level of pre-program earnings.These tests are necessary to detect a more subtle source of selection bias. Plausibly, the treatment and comparisongroups might differ in attributes which are not so easily measured yet which influence earnings. Such “unobservable”
28
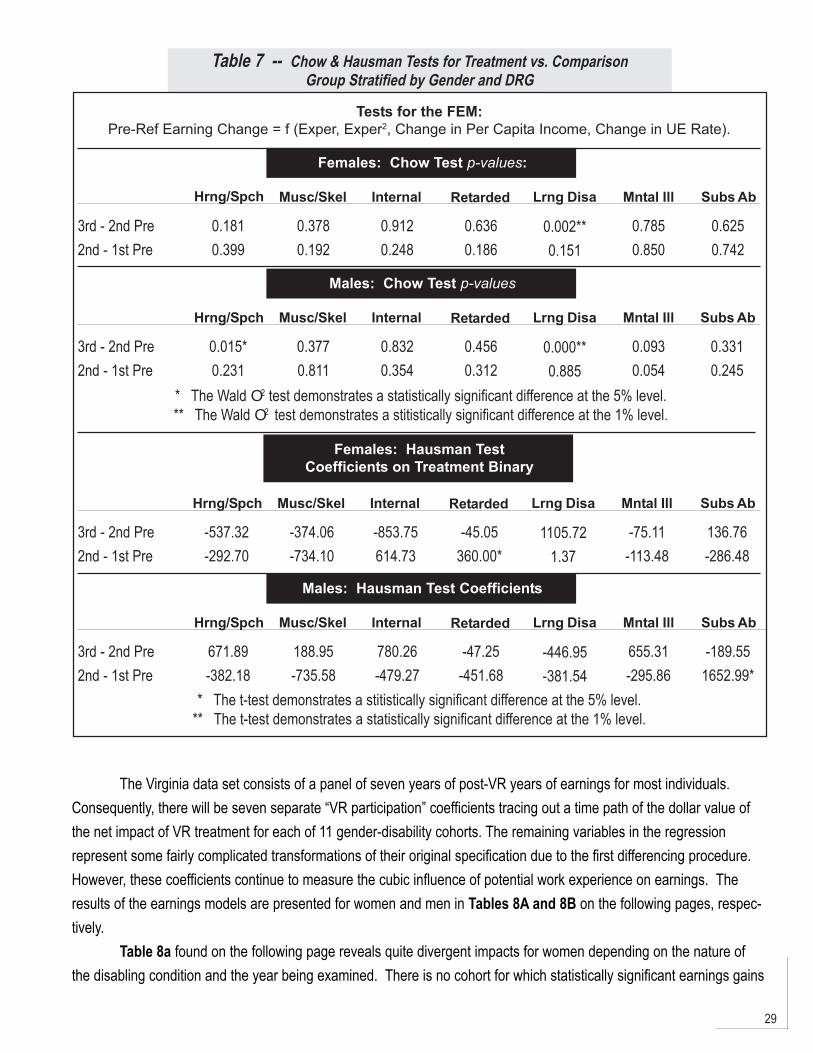
characteristics would include, for example, motivation and work discipline. The existence of unobservable differencesbetween the groups could distort any or all of the regression coefficients, including that of the treatment impact. If suchdifferences exist, however, they would also exist before the onset of disability and subsequent treatment. A test forunobservable differences, therefore, entails running an earnings regression for a period preceding the date ofapplication for VR services.1 A Chow test on that earnings regression asks whether the impact of any demographiccharacteristic, including membership in the treatment group, differs between the treatment and comparison group. Incontrast, a Hausman test focuses entirely on the treatment binary. Both the Chow and Hausman tests indicate thepresence of unobservable differences within the specific disability groups and both genders. As a result, regressions onpost-program earnings would provide biased estimates of the treatment impact.
However, if the influence of the unobservable differences remains constant over time, then a simple extensionof regression analysis — fixed effects modeling (FEM) — can provide unbiased estimates of the treatment impact.FEM acknowledges that there are certain observable and unobservable characteristics which differ between individualsbut remain relatively constant over time. As such, those influences are embedded in both pre-disability and post-treatment earning levels. By differencing earnings between any two years, the influences of time-invariantcharacteristics are eliminated. Although more detail is provided on FEM in the next section, the influence of VRtreatment would be estimated by differencing earnings in a post-treatment year and a pre-disability year. To testwhether FEM provides unbiased estimates (alternatively, whether the influence of unobservable differences remainsconstant over time), earnings are differenced between the third and second years prior to application. Another set ofChow and Hausman tests are then performed on the resulting change-in-earnings regressions. Separate regressionsare run for 14 stratifications of the current cohort — seven disability classifications for both genders. The relevant testresults are reported in Table 7 on the following page. The Hausman test is insignificant for each of these stratificationsat the five-percent significance level. The Chow test, however, identifies a change in the influence of unobservablecharacteristics at the one-percent level for three strata: hearing/speech for men and learning disabilities for both menand women. Consequently, FEM estimates of treatment effects would be suspect for these three strata and are notpresented below. For the remaining eleven cohorts, FEM estimates appear to adequately correct for selection bias.
“Fixed Effects” Estimates of VREarnings Impacts
Equipped with these 11 valid comparison groups, VR earnings impacts are estimated using the FEM frameworkon the difference between pre- and post-program earnings. The earnings model is an application which follows Bassi(1983, 1984). Specifically, the FEM model now represents the result of differencing earnings between a given post-VRyear and the second year prior to referral (the designated base year prior to the onset of pre-program dip). Conspicu-ously absent from the resulting earnings difference equation will be two common “human capital” variables (race andeducation) and all other terms that do not vary with time. Their absence is suggestive of the intuition behind the term“fixed effects” model. Despite the general importance of these attributes on earnings levels, recognize that they are“fixed” (i.e., the attributes do not change between any two time periods) and that their influence on post-VR earnings isalready accounted for in pre-VR earnings.
29
Table 7 -- Chow & Hausman Tests for Treatment vs. ComparisonGroup Stratified by Gender and DRG
Tests for the FEM:Pre-Ref Earning Change = f (Exper, Exper2, Change in Per Capita Income, Change in UE Rate).
Females: Chow Test p-values:
Hrng/Spch Musc/Skel Internal Retarded Lrng Disa Mntal Ill Subs Ab
3rd - 2nd Pre2nd - 1st Pre
0.1810.399
0.3780.192
0.9120.248
0.6360.186
0.002**0.151
0.7850.850
0.6250.742
Males: Chow Test p-values
Hrng/Spch Musc/Skel Internal Retarded Lrng Disa Mntal Ill Subs Ab
3rd - 2nd Pre2nd - 1st Pre
0.015*0.231
0.3770.811
0.8320.354
0.4560.312
0.000**0.885
0.0930.054
0.3310.245
* The Wald O2 test demonstrates a statistically significant difference at the 5% level.** The Wald O2 test demonstrates a stitistically significant difference at the 1% level.
Females: Hausman TestCoefficients on Treatment Binary
Hrng/Spch Musc/Skel Internal Retarded Lrng Disa Mntal Ill Subs Ab
3rd - 2nd Pre2nd - 1st Pre
-537.32-292.70
-374.06-734.10
-853.75614.73
-45.05360.00*
1105.721.37
-75.11-113.48
136.76-286.48
Males: Hausman Test Coefficients
Hrng/Spch Musc/Skel Internal Retarded Lrng Disa Mntal Ill Subs Ab
3rd - 2nd Pre2nd - 1st Pre
671.89-382.18
188.95-735.58
780.26-479.27
-47.25-451.68
-446.95-381.54
655.31-295.86
-189.551652.99*
* The t-test demonstrates a stitistically significant difference at the 5% level.** The t-test demonstrates a statistically significant difference at the 1% level.
The Virginia data set consists of a panel of seven years of post-VR years of earnings for most individuals.Consequently, there will be seven separate “VR participation” coefficients tracing out a time path of the dollar value ofthe net impact of VR treatment for each of 11 gender-disability cohorts. The remaining variables in the regressionrepresent some fairly complicated transformations of their original specification due to the first differencing procedure.However, these coefficients continue to measure the cubic influence of potential work experience on earnings. Theresults of the earnings models are presented for women and men in Tables 8A and 8B on the following pages, respec-tively.
Table 8a found on the following page reveals quite divergent impacts for women depending on the nature ofthe disabling condition and the year being examined. There is no cohort for which statistically significant earnings gains
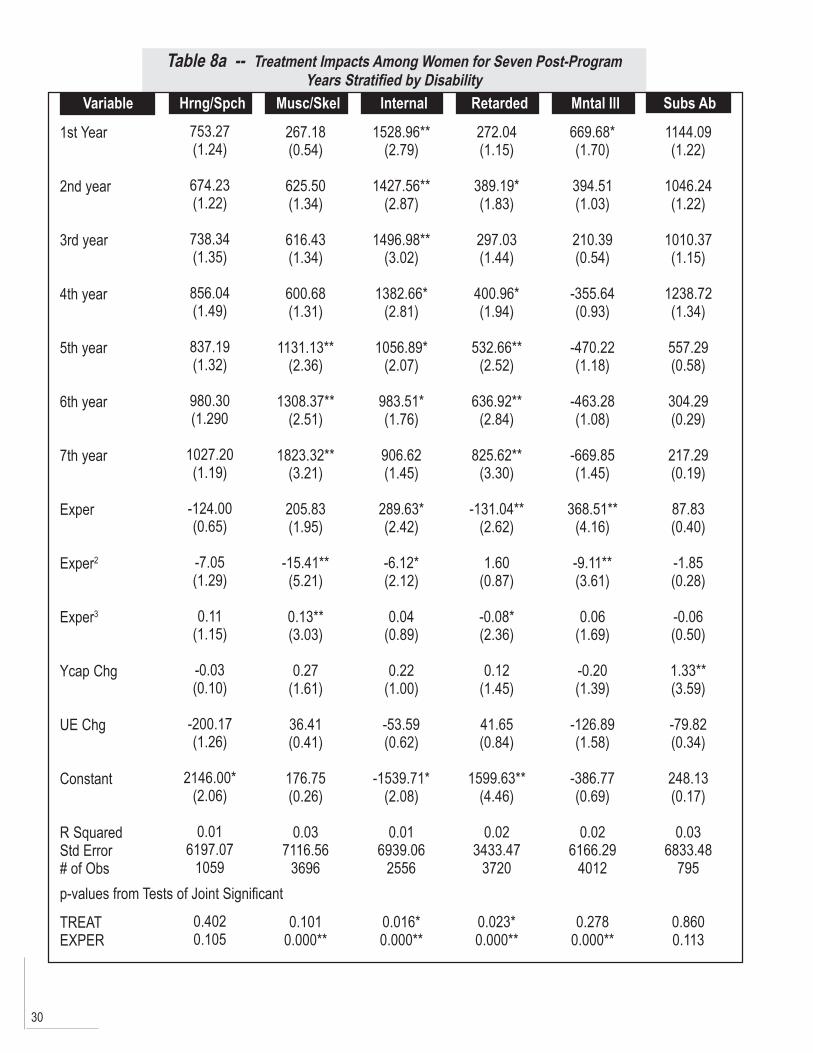
30
Table 8a -- Treatment Impacts Among Women for Seven Post-ProgramYears Stratified by Disability
Variable
1st Year
2nd year
3rd year
4th year
5th year
6th year
7th year
Exper
Exper2
Exper3
Ycap Chg
UE Chg
Constant
R SquaredStd Error# of Obs
TREATEXPER
Hrng/Spch Musc/Skel Internal Retarded Mntal Ill Subs Ab753.27(1.24)
674.23(1.22)
738.34(1.35)
856.04(1.49)
837.19(1.32)
980.30(1.290
1027.20(1.19)
-124.00(0.65)
-7.05(1.29)
0.11(1.15)
-0.03(0.10)
-200.17(1.26)
2146.00*(2.06)
0.016197.07
1059
0.4020.105
267.18(0.54)
625.50(1.34)
616.43(1.34)
600.68(1.31)
1131.13**(2.36)
1308.37**(2.51)
1823.32**(3.21)
205.83(1.95)
-15.41**(5.21)
0.13**(3.03)
0.27(1.61)
36.41(0.41)
176.75(0.26)
0.037116.56
3696
0.1010.000**
1528.96**(2.79)
1427.56**(2.87)
1496.98**(3.02)
1382.66*(2.81)
1056.89*(2.07)
983.51*(1.76)
906.62(1.45)
289.63*(2.42)
-6.12*(2.12)
0.04(0.89)
0.22(1.00)
-53.59(0.62)
-1539.71*(2.08)
0.016939.06
2556
0.016*0.000**
272.04(1.15)
389.19*(1.83)
297.03(1.44)
400.96*(1.94)
532.66**(2.52)
636.92**(2.84)
825.62**(3.30)
-131.04**(2.62)
1.60(0.87)
-0.08*(2.36)
0.12(1.45)
41.65(0.84)
1599.63**(4.46)
0.023433.47
3720
0.023*0.000**
669.68*(1.70)
394.51(1.03)
210.39(0.54)
-355.64(0.93)
-470.22(1.18)
-463.28(1.08)
-669.85(1.45)
368.51**(4.16)
-9.11**(3.61)
0.06(1.69)
-0.20(1.39)
-126.89(1.58)
-386.77(0.69)
0.026166.29
4012
0.2780.000**
1144.09(1.22)
1046.24(1.22)
1010.37(1.15)
1238.72(1.34)
557.29(0.58)
304.29(0.29)
217.29(0.19)
87.83(0.40)
-1.85(0.28)
-0.06(0.50)
1.33**(3.59)
-79.82(0.34)
248.13(0.17)
0.036833.48
795
0.8600.113
p-values from Tests of Joint Significant
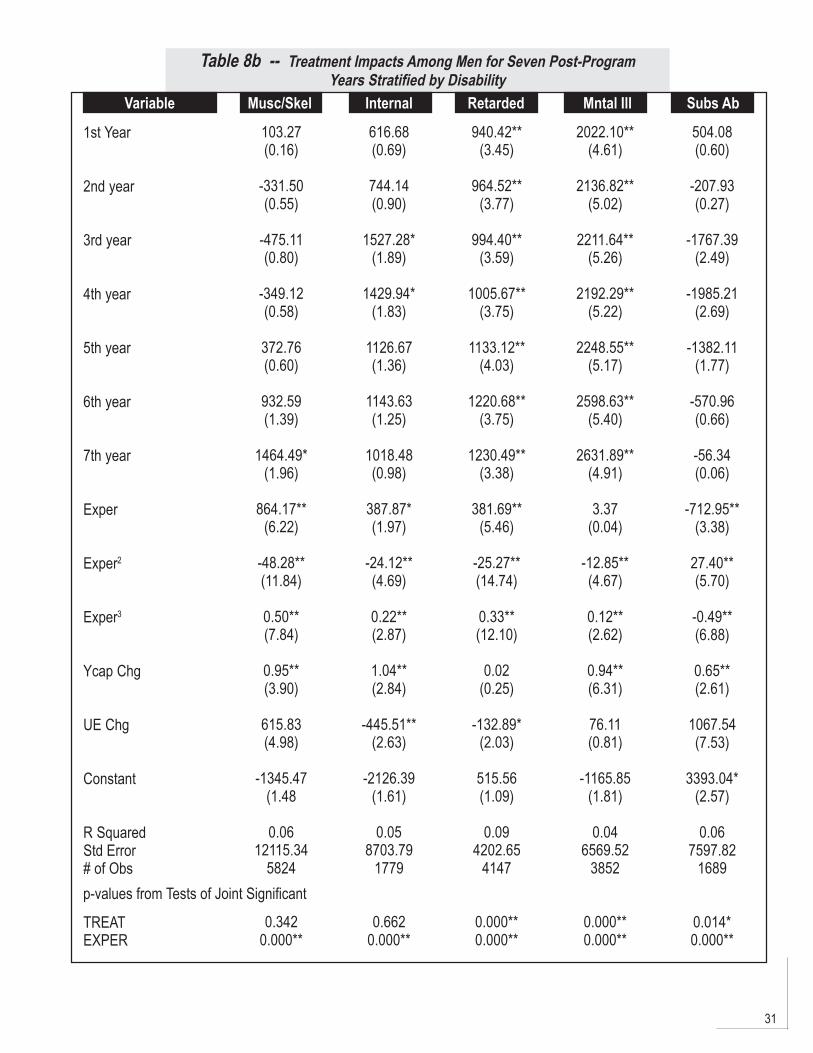
31
Table 8b -- Treatment Impacts Among Men for Seven Post-ProgramYears Stratified by Disability
Variable
1st Year
2nd year
3rd year
4th year
5th year
6th year
7th year
Exper
Exper2
Exper3
Ycap Chg
UE Chg
Constant
R SquaredStd Error# of Obs
TREATEXPER
Musc/Skel Internal Retarded Mntal Ill Subs Ab
p-values from Tests of Joint Significant
103.27(0.16)
-331.50(0.55)
-475.11(0.80)
-349.12(0.58)
372.76(0.60)
932.59(1.39)
1464.49*(1.96)
864.17**(6.22)
-48.28**(11.84)
0.50**(7.84)
0.95**(3.90)
615.83(4.98)
-1345.47(1.48
0.0612115.34
5824
0.3420.000**
616.68(0.69)
744.14(0.90)
1527.28*(1.89)
1429.94*(1.83)
1126.67(1.36)
1143.63(1.25)
1018.48(0.98)
387.87*(1.97)
-24.12**(4.69)
0.22**(2.87)
1.04**(2.84)
-445.51**(2.63)
-2126.39(1.61)
0.058703.79
1779
0.6620.000**
940.42**(3.45)
964.52**(3.77)
994.40**(3.59)
1005.67**(3.75)
1133.12**(4.03)
1220.68**(3.75)
1230.49**(3.38)
381.69**(5.46)
-25.27**(14.74)
0.33**(12.10)
0.02(0.25)
-132.89*(2.03)
515.56(1.09)
0.094202.65
4147
0.000**0.000**
2022.10**(4.61)
2136.82**(5.02)
2211.64**(5.26)
2192.29**(5.22)
2248.55**(5.17)
2598.63**(5.40)
2631.89**(4.91)
3.37(0.04)
-12.85**(4.67)
0.12**(2.62)
0.94**(6.31)
76.11(0.81)
-1165.85(1.81)
0.046569.52
3852
0.000**0.000**
504.08(0.60)
-207.93(0.27)
-1767.39(2.49)
-1985.21(2.69)
-1382.11(1.77)
-570.96(0.66)
-56.34(0.06)
-712.95**(3.38)
27.40**(5.70)
-0.49**(6.88)
0.65**(2.61)
1067.54(7.53)
3393.04*(2.57)
0.067597.82
1689
0.014*0.000**
32
are found in every post-VR period. For instance, in the third column, the magnitude of the earnings gains for womenwith “internal” impairments (e.g, cardiovascular, respiratory impairments) is quite large, ranging from $900 to more than$1,500. The interpretation of the “1st Year” coefficient is that the treatment group of Status 26 and Status 28 closureswill, on average, have $1,529 more in earnings than their comparison group of program dropouts (Status 30 closures)in the first year after closure from VR, other variables held constant. This earnings gain is the second largest treatmenteffect overall for women. However, the treatment effects are only statistically significant in the first six post-VR closureyears and are not sustained over time. By the seventh post-VR year the earnings gains have dropped to under $1,000,and are no longer statistically significantly different from zero. There are two cohorts — women with hearing/speechimpairments and substance abusers — for whom there are no statistically significant earnings gains in any post-VRperiod. Although there are positive impacts for women with mental illness in the first post-VR years, these becomenegative in the fourth through seventh post-VR yearly periods. The exact opposite pattern is observed for women witheither musculo-skeletal impairments or mental retardation. Although the first year earnings gains are relatively smalland statistically insignificant, the treatment impacts jump in both magnitude and statistical significance in most succes-sive years. The statistically significant earnings gains are quite large for both cohorts in later post-VR years, rising from$1,131 to $1,823 for women with musculo-skeletal impairments, and from $401 to $826 for mentally retarded women.
The results found in Table 8b on the previous page indicates that the earnings gains among men also varyrather strikingly with disability. For two of the disability cohorts — mental retardation and mental illness — the earningsgains are both statistically significant and remarkably stable over the five-year period. These earnings gains hoveraround $1,100 and $2,300, respectively. For the remaining male disability cohorts the treatment effects of VR servicesare statistically insignificant, with only rare exceptions.
The influence of the local economic environment is mixed. As expected, the change in per capita income (YcapChg) in a planning district is, with one exception, positively correlated with earnings gains. The coefficient is statisticallysignificant in only six of the eleven stratifications, but the magnitude of the coefficients is interesting. Among men thesignificant income coefficients are roughly unity — ranging from $0.78 to $1.08 — implying that local income changeshave a comparable impact in increasing the earnings of male VR participants. The impact of changing locality income isless significant among women, although there is a widely disparate impact in two significant instances — $0.27 forwomen with musculo/skeletal impairments versus $1.34 in cases of the learning disabled. Surprisingly, changes in thelocal employment conditions (UE Chg) have little, indeed, a confounding effect on the earnings gains of personsreceiving VR services. Among women, changing unemployment levels have no significant impact. Moreover, in thecase of men with musculo/skeletal and substance abuse, the influence of changing unemployment levels is perverselypositive. Only among men with internal impairments, mentally retarded, and learning disabled does one observe astatistically significant coefficient with the anticipated negative sign. Note, however, the magnitude of the effect issubstantial — earnings are $133 and $639 lower, ceteris paribus.
Finally, note the generally significant impacts of the change in work experience (approximated by change-in-age) across gender and disability groups. The signs on the three terms in this cubic specification confirm typical humancapital findings concerning a person’s age-earnings profiles. Specifically, earnings increase, but at a decreasing rate,as an individual ages (and acquires more potential work experience).
To lend an efficiency perspective to the estimated earnings impacts, the information found in Table 9 onfollowing page constructs benefit-cost ratios for each of the 11 gender/disability cohorts. Total benefits for each cohortare obtained by summing the present value of each period’s earnings using a four percent discount rate. These
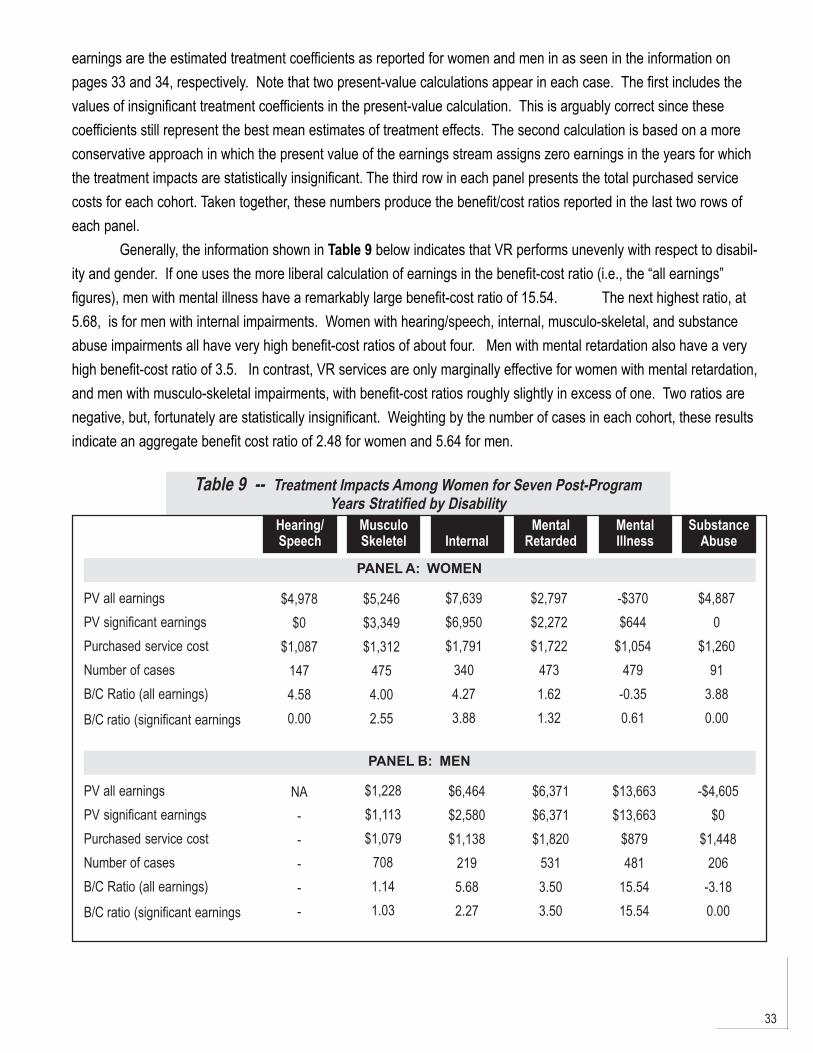
33
earnings are the estimated treatment coefficients as reported for women and men in as seen in the information onpages 33 and 34, respectively. Note that two present-value calculations appear in each case. The first includes thevalues of insignificant treatment coefficients in the present-value calculation. This is arguably correct since thesecoefficients still represent the best mean estimates of treatment effects. The second calculation is based on a moreconservative approach in which the present value of the earnings stream assigns zero earnings in the years for whichthe treatment impacts are statistically insignificant. The third row in each panel presents the total purchased servicecosts for each cohort. Taken together, these numbers produce the benefit/cost ratios reported in the last two rows ofeach panel.
Generally, the information shown in Table 9 below indicates that VR performs unevenly with respect to disabil-ity and gender. If one uses the more liberal calculation of earnings in the benefit-cost ratio (i.e., the “all earnings”figures), men with mental illness have a remarkably large benefit-cost ratio of 15.54. The next highest ratio, at5.68, is for men with internal impairments. Women with hearing/speech, internal, musculo-skeletal, and substanceabuse impairments all have very high benefit-cost ratios of about four. Men with mental retardation also have a veryhigh benefit-cost ratio of 3.5. In contrast, VR services are only marginally effective for women with mental retardation,and men with musculo-skeletal impairments, with benefit-cost ratios roughly slightly in excess of one. Two ratios arenegative, but, fortunately are statistically insignificant. Weighting by the number of cases in each cohort, these resultsindicate an aggregate benefit cost ratio of 2.48 for women and 5.64 for men.
Table 9 -- Treatment Impacts Among Women for Seven Post-ProgramYears Stratified by Disability
SubstanceAbuse
MentalIllness
MentalRetardedInternal
MusculoSkeletel
Hearing/Speech
PV all earningsPV significant earningsPurchased service costNumber of casesB/C Ratio (all earnings)
B/C ratio (significant earnings
PANEL A: WOMEN
$4,978$0
$1,0871474.580.00
$7,639$6,950$1,791
3404.273.88
$2,797$2,272$1,722
4731.621.32
-$370$644
$1,054479
-0.350.61
$4,8870
$1,26091
3.880.00
$5,246$3,349$1,312
4754.002.55
PV all earningsPV significant earningsPurchased service costNumber of casesB/C Ratio (all earnings)
B/C ratio (significant earnings
NA-----
$6,464$2,580$1,138
2195.682.27
$6,371$6,371$1,820
5313.503.50
$13,663$13,663
$879481
15.5415.54
-$4,605$0
$1,448206
-3.180.00
PANEL B: MEN
$1,228$1,113$1,079
7081.141.03
34
As expected, using the conservatively estimated earnings stream with only statistically significant earningsresults in lower benefit-cost ratios. In five of the 11 cohorts – men and women with internal impairments, women withmusculo-skeletal impairments, and men with mental retardation or mental illness — the benefit-cost ratio still exceedstwo. The impacts are still marginal, slightly exceeding unity, for women with mental retardation and men with musculo-skeletal impairments. In three instances, for men and women substance abusers and women with hearing/speechimpairments, the benefit-cost ratios are now zero. This implies, of course, that there are no statistically significantearnings gains (or losses) to be included in the benefits computation. Using the more conservative earnings estima-tions lowers the aggregate benefit-cost ratio very slightly for men, down to 5.57, and more dramatically for women, to1.72.
Given the preliminary nature of this report, there are three caveats to the template which must be recognizedwhen interpreting the benefit-cost ratios. The first consideration is methodological in nature and concerns theestimation procedure for determining the earnings impacts attributed to the VR program. Critics of applications of thefixed effects model in the case for persons with disabilities note that one of the necessary assumptions is thatindividual-specific characteristics do not vary with time. Some of the persons applying for VR services, particularlyprogram dropouts, may have disabling conditions that deteriorate with the passage of time which are independent ofVR service provision, . Others who remain in the program may experience improvement in their functioning that issimilarly un-related to the VR service regimen. The concern is that a portion of the earnings gain that the model isattributing to VR “treatment effects” may in fact be due to a “health effect”. If persons are in fact dropping out from VRdue to a worsening health condition, such as substance abusers, this will introduce an upward bias in the earningsimpacts that will overstate the effect of VR service provision. In a related vein, the choice of the appropriate pre-program baseline period for gauging earnings impacts may be dependent upon the disability.
In order to foster greater confidence in the results it is necessary to undertake a specification of one or moredifferent methodologies for the selection of a comparison group and econometric technique, and then conduct asystematic sensitivity analysis. Tests of choice of base year and various “internal” comparison groups (e.g., screen-outs,withdrawals, as well as drop-outs) have been conducted (and are available from the authors upon request). The resultssupport using the second pre-program year as a base year and program drop-outs (i.e., the VR Status 30 cohort) as thecomparison group. The results from using different econometric modeling techniques are currently being conducted.
The second caveat is concerned with sample size considerations that result when stratifying the VR applicantsinto treatment and comparison groups. Recall, the intent of the paradigm introduced here is to examine the VRprogram as a series of sub-programs for persons with varying disabilities. While the overall sample sizes presented inthe previous tables appear to be large enough, it should be noted that the program dropout comparison group is onlyabout one-seventh of the size of the VR treatment group. The size of three of the comparison groups are quite smallafter further stratifying these cohorts by gender and disability. Specifically, while there are ample numbers of applicantsin FY1988 for persons who dropped out having impairments of musculo-skeletal, internal (cardio-vascular, respiratoryillness), mental illness or retardation, there are few dropouts with substance abuse, sensory, or learning disabilities.Earnings impacts and service costs for the latter three cohorts may not be representative. Obtaining consistent benefit-cost ratios for these groups will require possibly combining cohorts across different application years, or perhaps,across different state VR agencies.
35
The final caveat is that these benefit-cost ratios are based only on the costs of the first VR episode. Recallfrom the earlier discussion of additional service provision beyond initial closure that more than 1,500 persons — roughlyone-third of the treatment group – returned for subsequent VR services. These costs are presented in the aggregate; itstill remains to examine such costs at the individual level. In other words, these additional costs have yet to be addedin to obtain a total VR service expenditure for each person that includes both the initial and any subsequent VRepisodes. Subsequent presentations of the benefit-cost ratios will include the full accounting of purchased VR services.
Conclusion
This paper develops a new paradigm for measuring the efficacy of the VR program by drawing upon readily-available state agency data bases. The analytical framework compares the costs of “workplace support” servicesprovided by the state VR agency with the net earnings impacts for a treatment cohort of participants with variousdisabling conditions. This model incorporates several innovative techniques into the evaluative framework. Theseinclude collecting longitudinal service cost, economic “environment” measures, and earnings for a cohort of VRapplicants in a given annual period. The longitudinal earnings data are important in two respects. The pre-programearnings accommodate statistical tests of comparison group validity and thus substantively improves the evaluationframework for gauging VR treatment effects. Further, the seven-year span of post-program earnings affords a measureof the sustainability of the program’s impacts. We offer this Virginia analysis as a template for conducting state-levelevaluations of VR earnings impacts that is methodologically sound and practical to replicate on a state-by-state basis.
The benefit-cost ratios presented, while preliminary in nature, provide encouraging news about VR efficacy forseveral different groups of persons with varying disabilities, when contrasted with the employment prospects of a cohortwho chose to dropout from the VR program. A subsequent version of the paper will test the sensitivity of these resultsto the choice of comparison group and econometric model used to estimate earnings impacts, as well as including VR“recidivism” in the cost accounting. These refinements should lend further support to this paradigm for conductingevaluations of the VR program.
The emphasis in this study upon systematic state-level analysis is particularly timely given the current milieu of“new federalism”. Recent trends suggest that federal dollars flowing to the states may come increasingly in the form ofblock grants. This may be especially pressing for state VR initiatives, since these programs currently receive roughly 80percent of their funding from federal coffers. Since block grants place greater discretion with state government, it will beincreasingly important for legislatures to have state-focused indicators of agency performance in making appropriationdecisions.

36
37
References
Americans With Disabilities Act (ADA) of 1990, PL 101-336, 42 U.S.C. d 12101 et seq.
Bassi, L., The Effect of CETA on the Postprogram Earnings of Participants. The Journal of Human Resources, 18:1983,539_556.
Bassi, L., Estimating the Effect of Training with Non Random Selection. The Review of Economics and Statistics,66:1984, 36-43.
Becker, D. R. & Drake, R. E. (1997, December). Integrating vocational services and mental health treatment throughIndividual Placement and Support: A successful model of supported employment. Paper presented at the Florida Mental HealthInstitute Conference on Behavioral Healthcare Evaluation, Orlando, Fl.
Bell, S., L. Orr, J. Blomquist, and G. Cain, Program Applicants as a Comparison Group in Evaluating Training Programs,Upjohn Institute for Employment Research, 1995.
Bellante, D., A Multivariate Analysis of a Vocational Rehabilitation Program. The Journal of Human Resources, 7:1972,226_241.
Berkeley Planning Associates, Evaluation of Alternative Design Options for Assessing the Impact of the Federal-StateVocational Rehabilitation Program, U.S. Dept. of Education, 1988.
Berkowitz, E., “The Cost-Benefit Tradition in Vocational Rehabilitation,” in Measuring the Efficiency of Public Programs:Costs and Benefits in Vocational Rehabilitation, edited by Berkowitz, M., Temple University Press, 1988, 10-27.
Brown, L., Farrington, K., Suomi, J., et al. (1999). Work - wage relationships and individuals with disabilities. Journal ofVocational Rehabilitation, 13(1), 5-13.
Conley, R., A Benefit-Cost Analysis of the Vocational Rehabilitation Program. Journal of Human Resources, 4:1969,226_252.
Cooley, T., T. McGuire, E. Prescott, Earnings and Employment Dynamics of Manpower Trainees: An ExploratoryEconometric Analysis, in Evaluating Manpower Training Programs, ed. F. Bloch, JAI Press, 1979.
Dean, D. and R. Dolan, Assessing the Role of Vocational Rehabilitation in Disability Policy. Journal of Policy Analysisand Management, 10:1991a, 568-587.
Dean, D. and R. Dolan, Fixed-Effects Estimates of Earnings Impacts for the Vocational Rehabilitation Program. Journalof Human Resources, 26:1991b, 380-391.
Dean, D., R. Dolan, and R. Schmidt, Evaluating the Vocational Rehabilitation Program Using Longitudinal Data:Evidence for a Quasiexperimental Research Design. Evaluation Review, 23:1999, 162-189.
Dehejia, R. and S. Wahba, Causal Effects in Non-Experimental Studies: Re-evaluating the Evaluation of TrainingPrograms. Journal of the American Statistical Association, 94:1999, 1053-1062.
Dunn, P. L., & Growick, B. S. (2000). Transferable skills analysis in vocational rehabilitation: Historical foundations,current status, and future trends. Journal of Vocational Rehabilitation, 14(2), 79-87.
Federal Register, (1992, June 24). 57 (122), 28432-28442. Washington, D.C.: U.S. Government Printing Office.
38
Flippo, K., Inge, K., & Barcus, M. (1995). Assistive technology: A resource for school, work, and community. Baltimore:Paul H. Brookes Publishing Co.
Fraker, T. and R. Maynard, The Adequacy of Comparison Group Designs for Evaluations of Employment-RelatedPrograms. Journal of Human Resources, 22(2):1987, 194-227.
Friedlander, D. and P. Robins, Evaluating Program Evaluations: New Evidence on Commonly Used NonexperimentalMethods. American Economic Review, 85:1995, 923-937.
General Accounting Office (June 5, 1996). Social Security Disability Program lag in promoting return to work: statementof Jane l. Ross, director. Gaithersburg, MD, author.
Gilbride, D. (2000). Going to work: Placement trends in public rehabilitation. Journal of Vocational Rehabilitation,14(2), 89-94.
Heckman, J., H. Ichimura, J. Smith, and P. Todd, Characterizing Selection Bias Using Experimental Data.Econometrica, 66:1998, 1017-1098.
Heckman, J. and V. J. Hotz, Choosing Among Alternative Non-experimental Methods for Estimating the Impact of SocialPrograms: The Case of Manpower Training. Journal of the American Statistical Association, 84:1989, 862-74.
Hotz, V. J., Designing an Evaluation of the Job Training Partnership Act, in Evaluating Welfare and Training Programs,edited by Manski, C. and Garfinkel, I., Harvard University Press, 1992, 76-114.
Hunt, H., Habeck, R., Owens, P., Vandergoot, D. (1996). Disability and work: Lessons from the provider sector. In J. L.Mashaw, V., Reno, & R. V. Burkhauser (Eds.), Disability, work, cash benefits (pp. 47-74). Kalamazoo MI: W.E. Upjohn Institute.
LaLonde, R., Evaluating the Econometric Evaluations of Training Programs with Experimental Data. AmericanEconomic Review, 76:1986, 604-620.
Louis Harris & Associates (1998). The N.O.D./Harris survey program on participation and attitudes. Survey ofAmericans with Disabilities. NY: Author.
Moon, M.S., Inge, K.J., Wehman, P., Brooke, V, & Barcus, J. M. (1990). Helping persons with severe mental retardationget and keep employment: Supported employment issues and strategies. Baltimore: Paul H. Brookes Publishing Co.
Noble, J. (1998). Natural history of Down’s syndrome: a brief Review for those involved in antenatal screening.Journal of Medical Screening, 5(9804).
Noble, J. H., Honberg, R. S., Hall, L. L., & Flynn, L. M. (1999). A legacy of failure: The inability of the federal-statevocational rehabilitation system to serve people with severe mental illness. Arlington, VA: National Alliance for the Mentally Ill.
Pelavin and Associates, Summary Statement. Design Critiques for Evaluating Vocational Rehabilitation: Final Report,1989, 1-5
Rupp, K., S. Bell and L. McManus, Design of the Project NetWork Return-to-Work Experiment for Persons withDisabilities. Social Security Bulletin, 57:2, 1994, 3-20.
Smith, J. and P. Todd, “Reconciling Conflicting Evidence on the Performance of Propensity-Score Matching Methods,”AEA Papers and Proceedings, 91:2001, 112-118.
Test, D. W., & Wood, W. M. (1996). Natural supports in the workplace: The jury is still out. Journal of The Associationfor Persons with Severe Handicaps, 24(4), 155-173.
39
U.S. General Accounting Office, Vocational Rehabilitation: Evidence of Federal Program Effectiveness is Mixed, Reportto the Subcommittee on Select Education, House of Representatives, 1993.
Weaver, C. L. (1994). Privatizing vocational rehabilitation: Options for increasing individual choice and enhancingcompetition. Journal of Disability Policy Studies, 5(1), 53-76.
Wehman, P. (2001). Supported employment in business: Expanding the capacity of workers with disabilities. St.Augustine, FL: Training Resource Network, Inc., Publisher.
Wehman, P., Gibson, K., Brooke, V., & Johnson, K. (1998). Transition from school to competitive employment:Illustrations of competence for two young women with severe mental retardation. Focus on Autism and Other DevelopmentalDisabilities, 13 (3), 130-143.
Wehman, P. & Kregel, J. (1998). More than a Job: Securing satisfying careers for people with disabilities. Baltimore:Paul Brookes Publishers.
Wehman, P., Revell, G. & Kregel. J. (1998). Supported employment: A decade of rapid growth and impact. AmericanRehabilitation, 24 (1), 31-43.
Wehman, P., Revell, W. G. & Kregel, J. (1998). Supported employment: A decade of rapid growth and impact.American Rehabilitation, 24 (1), 31-43.
Wehman, P., Targett, P., Eltzeroth, H., Green, H. Brooke, V., & Barcus, J. M. (1999). Development of business supportsfor persons with mental retardation in the workplace. Journal of Vocational Rehabilitation, 13 (1), 175-181.
White, H., A Heteroskedasticity-Consistent Covariance Matrix Estimator and a Direct Test for Heteroskedasticity.Econometrica, 48: 1980, 817_838.
Worrall, J., A Benefit-Cost Analysis of the Vocational Rehabilitation Program. Journal of Human Resources, 13: 1978,285-298.

40