Embed Size (px)
Citation preview
A numerical method to analyze the interaction between sea waves and rubble mound emerged breakwaters
Fabio Dentale1,2, Giovanna Donnarumma1, Eugenio Pugliese Carratelli1,2, Ferdinando Reale1,2
1 Maritime Engineering Division University of Salerno, Department of Civil Engineer University of Salerno
2 CUGRI (University Consortium for Research on Major Hazards) Via Giovanni Paolo II, 132 - 84084 Fisciano (SA)
ITALY [email protected] http://www.medus.unisa.it/
Abstract: - The paper provides some results of a new procedure, developed by MEDUS, to analyze the hydrodynamic aspects of the interactions between maritime emerged breakwaters and waves, by integrating CAD and CFD software. The filtration of the fluid within the interstices of a concrete blocks breakwater is evaluated by integrating the Reynolds Averaged Navier-Stokes equations (RANS) inside the voids rather than making use of the widespread “porous mediaˮ approach. The structure is thus modelled, very much like in the real world or in the physical laboratory testing, by overlapping individual three-dimensional elements (Armour in AccropodeTM, Core-locTM or Xbloc®, toe protection and filter layer in stones), and then the computational grid is fitted so as to provide enough computational nodes within the flow paths. This approach is meant to match closely the physical laboratory test procedure, and it is oriented at analyzing the hydrodynamic aspects of the phenomenon (overtopping, breaking, Run-up, reflection) as well as the stability of armour elements. Therefore, for the results' validation, the numerical Run-up and reflection effects on virtual breakwater were compared with some empirical formulas and some similar laboratory tests.
Key-Words: - CFD, Breakwater, Armour, Rubble Mound, Virtual Structures, Wave Run-Up, Wave Reflection, Wave Overtopping. 1 Introduction The MEDUS is developing an innovative procedure that, by using CAD and CFD software, gives the possibility to study with a more detailed approach the hydrodynamic of the wave motion (overtopping, breaking, Run-up, reflection, transmission) over a rubble mound structure (emerged or submerged) as well as the hydraulic stability of the armour stones.
The currently used approach assumes that within the rubble mound the flow can be treated by using a classical “porous media” methodology, i.e. by using, within the rubble mound, the equations that treat the filtration motion (Darcy or Forchheimer, if the head loss is linear or quadratic respectively).
In practice, an additional term is added to the equations to reproduce the interactions between the fluid and the inner flow paths using homogeneous coefficients for the entire filtration domain.
Such an approach was reported in Hsu et al. [1], later implemented in the COBRAS numerical code and finally perfected by Lara et al.[2].
The results obtained through these types of modeling, while certainly more reliable compared to the waterproof block model, present a number of drawbacks. First of all, this approach overlooks the convective aspects of the flow and the structure of turbulence; it is heavily reliant on of the numerical parameters of the filtration equations and therefore it requires a careful empirical calibration.
In the innovative procedure developed by MEDUS and proposed in this work, the simulations are carried out so that the filtration of the fluid within the interstices of the blocks breakwater is evaluated by integrating the Reynolds Averaged Navier-Stokes equations (RANS) inside the voids rather than making use of the widespread “porous media approach. The structure is thus modeled, very much like in the real world or in the physical laboratory testing, by overlapping individual three-dimensional elements and then the computational grid is fitted so as to provide enough computational nodes within the flow paths.
WSEAS TRANSACTIONS on FLUID MECHANICSFabio Dentale, Giovanna Donnarumma
Eugenio Pugliese Carratelli, Ferdinando Reale
E-ISSN: 2224-347X 105 Volume 10, 2015
Pioneering work with full simulation of such flow within the armour units was carried out by using RANS-VOF [3], [4], [5], [6], [7]; SPH (Smoothed Particle Hydrodynamics) was applied to this problem by Altomare et al. [8], while a somewhat similar approach involving CFD techniques in the interstices and numerical solid mechanics in the block themselves, is being attempted by Xiang et al. [9].
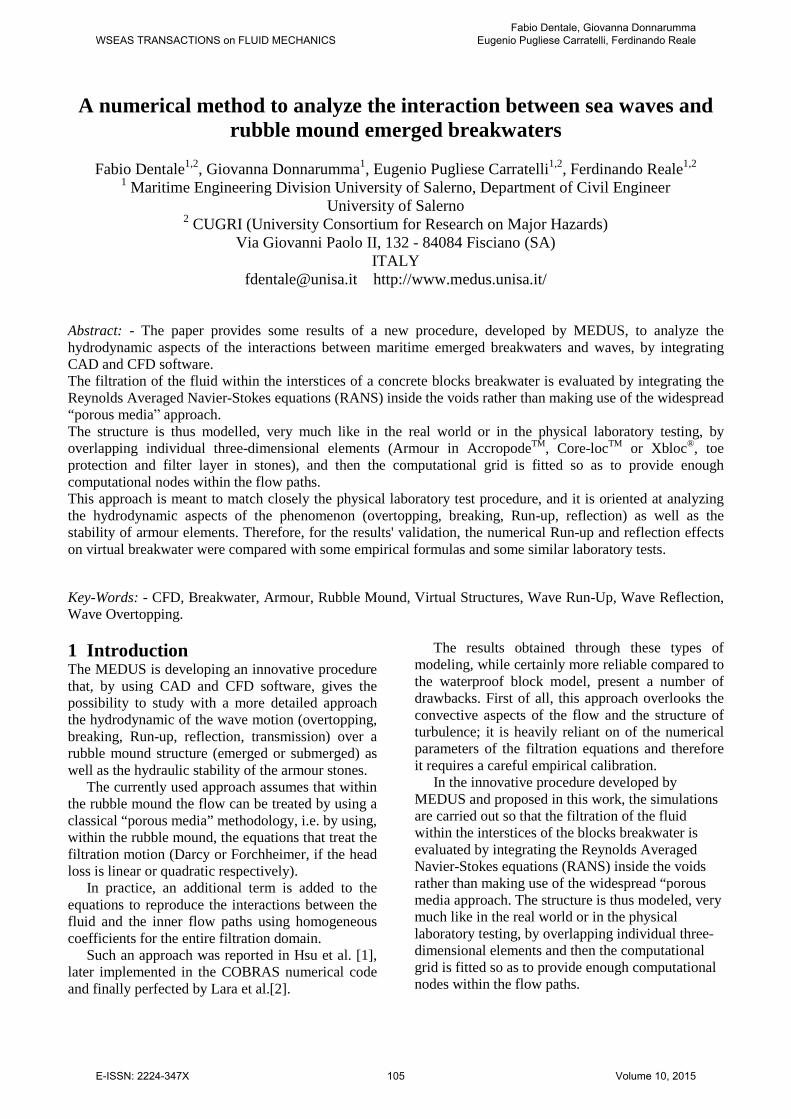
The final aim of the new computational procedure is to provide a design tool, and therefore a proper calibration should in principle involve a comparison between real and simulated fluid forces acting on the blocks within the mound and new material to build blocks [10]. 2 The new numerical approach Numerical reconstructions of the breakwater are thus produced by using a CAD software system for modeling 3D geometries; a data base of artificial blocks (Core-locTM, the AccropodeTM, Xbloc®), has preliminarily been produced, while also natural rocks can be reproduced either by using randomly shaped blocks (Fig.1).
Breakwaters (armour and filter layer, toe protection) are numerically reconstructed by overlapping individual blocks (Core-locTM, the AccropodeTM, Xbloc® and stones), one by one, under the conditions of gravity, collision and friction, according to the real geometry, very much like in the case of real constructions or laboratory test model.
Fig.1: Virtual 3D models of stones and armour
blocks
In this study are shown the results for three structures with armour layer in Core-locTM, AccropodeTM and Xbloc®(Fig.2).
Defined the virtual breakwater, the geometry implemented has been imported into numerical code FLOW-3D® (Flow Science Inc. 2009) to evaluate the hydrodynamics interaction wave-structure.
FLOW-3D® is based on the RANS (Reynolds Averaged Navier-Stokes) equations combined with the Volume of Fluid (VOF) method to track the location of the fluid surfaces and various turbulence techniques such as k-ε, RNG or LES [11]; The turbulence model associated to the RANS equations is Re-Normalization Group (RNG) for all simulations presented in this study.
It also has some distinguishing features such as the FAVOR™ (Fractional Area Volume Obstacle Representation) method, which is used to define complex geometric regions within rectangular grids and multi-block meshing.
Fig.2: Examples of virtual models of the breakwater
(Core-LocTM - left, AccropodeTM - right, Xbloc® - down)
It has been thoroughly tested for coastal hydrodynamics problems, as shown in [12], [4], [13], [14], [15].
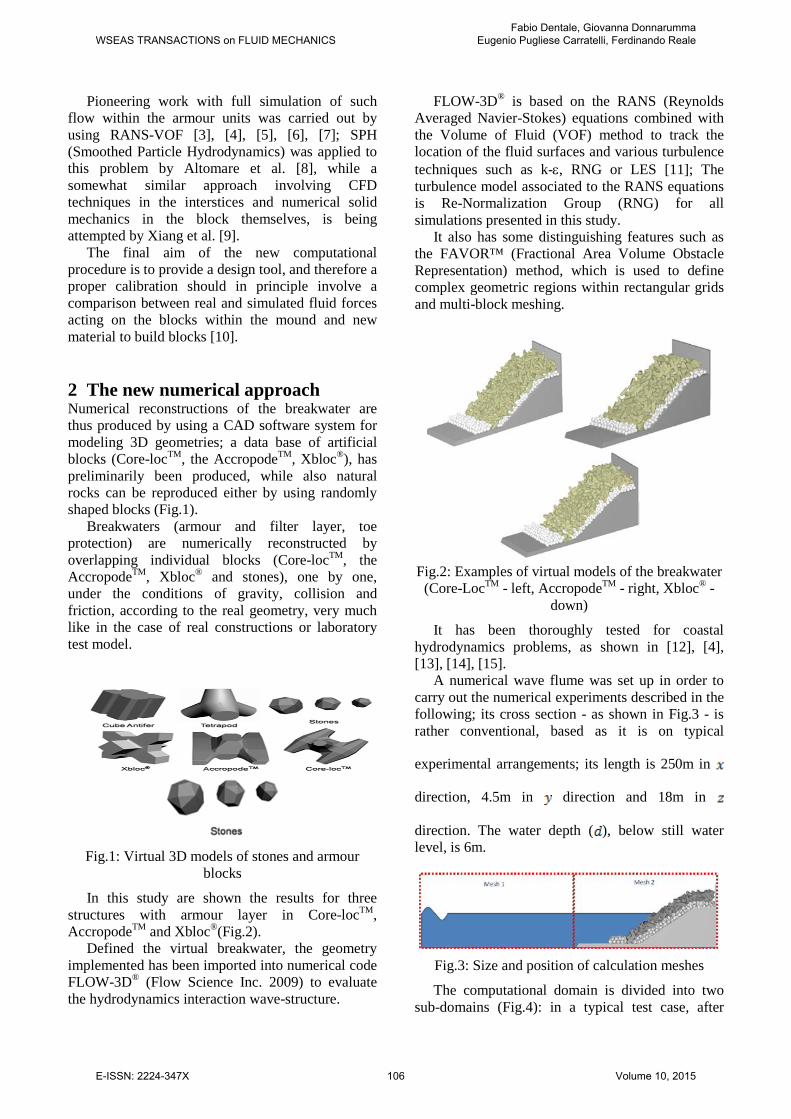
A numerical wave flume was set up in order to carry out the numerical experiments described in the following; its cross section - as shown in Fig.3 - is rather conventional, based as it is on typical
experimental arrangements; its length is 250m in
direction, 4.5m in direction and 18m in
direction. The water depth ( ), below still water level, is 6m.
Fig.3: Size and position of calculation meshes
The computational domain is divided into two sub-domains (Fig.4): in a typical test case, after
WSEAS TRANSACTIONS on FLUID MECHANICSFabio Dentale, Giovanna Donnarumma
Eugenio Pugliese Carratelli, Ferdinando Reale
E-ISSN: 2224-347X 106 Volume 10, 2015
appropriate convergence tests, the mesh 1 (general mesh) for all the computations was chosen to be made up of 243.000 cells, 0.50x0.50x0.20m, while the local one (mesh 2) was 3.240.000 cells, 0.10x0.10x0.10m.
Fig.4: Example of local mesh (Armour layer in
AccropodeTM)
The computational burden is naturally very heavy: the computational time required for a simulation of 300 seconds in real time is approximately 12 hours with a machine type Processor Intel(R) Core(TM) i7 CPU, 2.67GHz. Since the more complex hydrodynamic interactions within the breakwater (mesh 2) obviously require a higher number of computational nodes; also, in order to fully accommodate the 3D block mound model, the virtual geometrical set up is wider than the actual computational domain. Once the geometry of the structure, imported into the CFD, has been rebuilt and the size and the scope of the computing grids have been set, attacks wave were chosen.
2.1 Wave attacks The wavemaker generate wave's attacks according to JONSWAP spectrum and requires two input parameters: wind speed and fetch. It is important to consider, as already said above, that in numerical simulations - very much like in laboratory tests - a great deal of care should be taken in order to correctly evaluate the incident wave height (in the
following: ) by separating it from the reflected
wave (in the following: ). In this study the water height time series were analyzed by using the two probes method as proposed by Goda and Suzuki [16].
In the following Table 1 the values of fetch and wind speed that were used for the tests are shown.
Table 1: Wave characteristics at wave generator
ID SIMULATION
Fe U
(km) (m/s) NS1 5 30 NS2 5 40 NS3 5 50 NS4 20 15 NS5 20 20 NS6 20 25 NS7 20 30 NS8 20 40 NS9 100 6
NS10 100 9 NS11 100 12.5 NS12 100 16 NS13 100 20 NS14 250 5 NS15 250 8 NS16 250 12 NS17 500 3 NS18 500 5 NS19 500 7
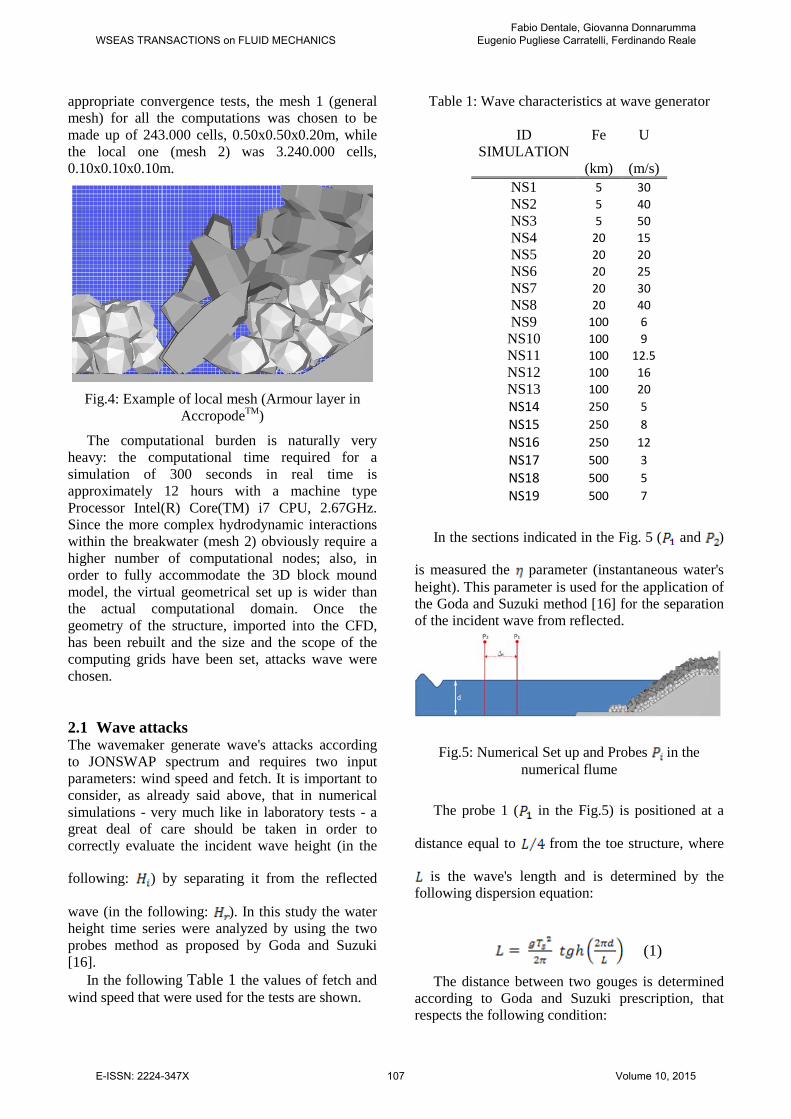
In the sections indicated in the Fig. 5 ( and )
is measured the parameter (instantaneous water's height). This parameter is used for the application of the Goda and Suzuki method [16] for the separation of the incident wave from reflected.
Fig.5: Numerical Set up and Probes in the numerical flume
The probe 1 ( in the Fig.5) is positioned at a
distance equal to from the toe structure, where
is the wave's length and is determined by the following dispersion equation:
(1)
The distance between two gouges is determined according to Goda and Suzuki prescription, that respects the following condition:
WSEAS TRANSACTIONS on FLUID MECHANICSFabio Dentale, Giovanna Donnarumma
Eugenio Pugliese Carratelli, Ferdinando Reale
E-ISSN: 2224-347X 107 Volume 10, 2015
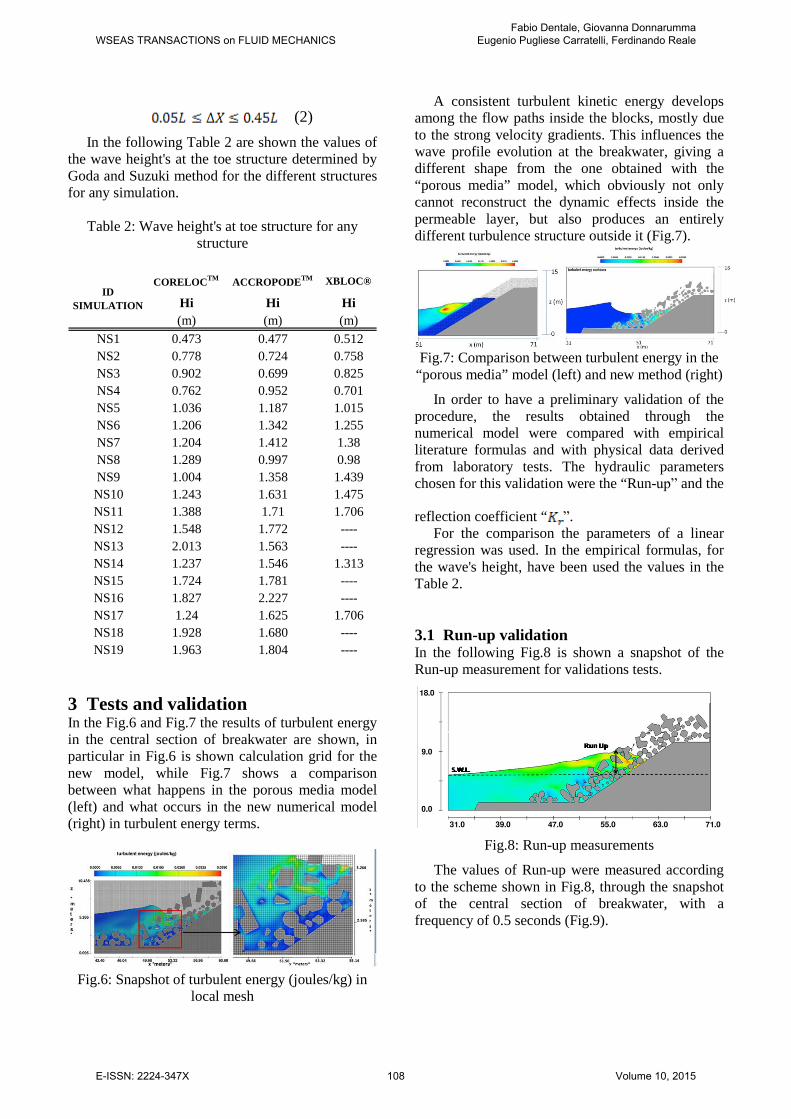
(2) In the following Table 2 are shown the values of
the wave height's at the toe structure determined by Goda and Suzuki method for the different structures for any simulation.
Table 2: Wave height's at toe structure for any
structure
Hi Hi Hi(m) (m) (m)
NS1 0.473 0.477 0.512NS2 0.778 0.724 0.758NS3 0.902 0.699 0.825NS4 0.762 0.952 0.701NS5 1.036 1.187 1.015NS6 1.206 1.342 1.255NS7 1.204 1.412 1.38NS8 1.289 0.997 0.98NS9 1.004 1.358 1.439NS10 1.243 1.631 1.475NS11 1.388 1.71 1.706NS12 1.548 1.772 ----NS13 2.013 1.563 ----NS14 1.237 1.546 1.313NS15 1.724 1.781 ----NS16 1.827 2.227 ----NS17 1.24 1.625 1.706NS18 1.928 1.680 ----NS19 1.963 1.804 ----
ID SIMULATION
CORELOCTM ACCROPODETM XBLOC®
3 Tests and validation In the Fig.6 and Fig.7 the results of turbulent energy in the central section of breakwater are shown, in particular in Fig.6 is shown calculation grid for the new model, while Fig.7 shows a comparison between what happens in the porous media model (left) and what occurs in the new numerical model (right) in turbulent energy terms.
Fig.6: Snapshot of turbulent energy (joules/kg) in local mesh
A consistent turbulent kinetic energy develops among the flow paths inside the blocks, mostly due to the strong velocity gradients. This influences the wave profile evolution at the breakwater, giving a different shape from the one obtained with the “porous media” model, which obviously not only cannot reconstruct the dynamic effects inside the permeable layer, but also produces an entirely different turbulence structure outside it (Fig.7).
Fig.7: Comparison between turbulent energy in the
“porous media” model (left) and new method (right)
In order to have a preliminary validation of the procedure, the results obtained through the numerical model were compared with empirical literature formulas and with physical data derived from laboratory tests. The hydraulic parameters chosen for this validation were the “Run-upˮ and the
reflection coefficient “ ˮ. For the comparison the parameters of a linear
regression was used. In the empirical formulas, for the wave's height, have been used the values in the Table 2. 3.1 Run-up validation In the following Fig.8 is shown a snapshot of the Run-up measurement for validations tests.
Fig.8: Run-up measurements
The values of Run-up were measured according to the scheme shown in Fig.8, through the snapshot of the central section of breakwater, with a frequency of 0.5 seconds (Fig.9).
WSEAS TRANSACTIONS on FLUID MECHANICSFabio Dentale, Giovanna Donnarumma
Eugenio Pugliese Carratelli, Ferdinando Reale
E-ISSN: 2224-347X 108 Volume 10, 2015
-1.00
-0.50
0.00
0.50
1.00
1.50
0.00 50.00 100.00 150.00 200.00 250.00 300.00
Run
up (m
)
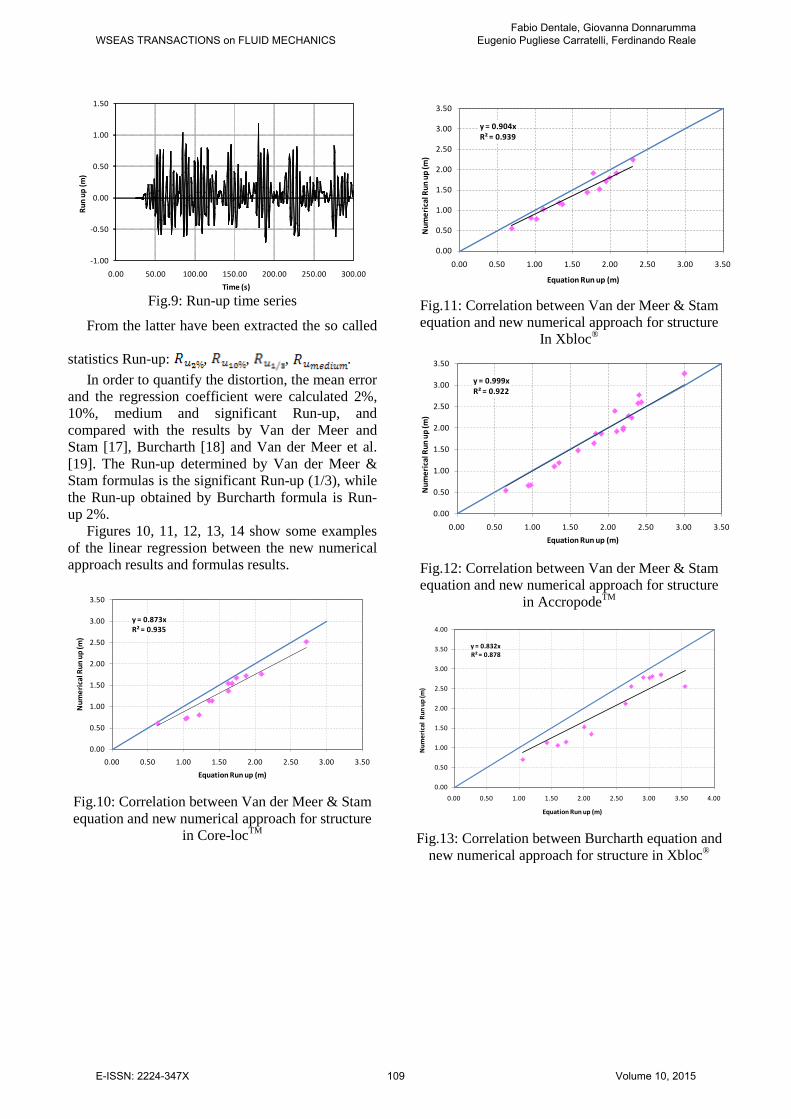
Time (s) Fig.9: Run-up time series
From the latter have been extracted the so called
statistics Run-up: , , , . In order to quantify the distortion, the mean error
and the regression coefficient were calculated 2%, 10%, medium and significant Run-up, and compared with the results by Van der Meer and Stam [17], Burcharth [18] and Van der Meer et al. [19]. The Run-up determined by Van der Meer & Stam formulas is the significant Run-up (1/3), while the Run-up obtained by Burcharth formula is Run-up 2%.
Figures 10, 11, 12, 13, 14 show some examples of the linear regression between the new numerical approach results and formulas results.
y = 0.873xR² = 0.935
0.00
0.50
1.00
1.50
2.00
2.50
3.00
3.50
0.00 0.50 1.00 1.50 2.00 2.50 3.00 3.50
Num
eric
al R
un u
p (m
)
Equation Run up (m) Fig.10: Correlation between Van der Meer & Stam equation and new numerical approach for structure
in Core-locTM
y = 0.904xR² = 0.939
0.00
0.50
1.00
1.50
2.00
2.50
3.00
3.50
0.00 0.50 1.00 1.50 2.00 2.50 3.00 3.50
Num
eric
al R
un u
p (m
)
Equation Run up (m) Fig.11: Correlation between Van der Meer & Stam equation and new numerical approach for structure
In Xbloc®
y = 0.999xR² = 0.922
0.00
0.50
1.00
1.50
2.00
2.50
3.00
3.50
0.00 0.50 1.00 1.50 2.00 2.50 3.00 3.50
Num
eric
al R
un u
p (m
)
Equation Run up (m) Fig.12: Correlation between Van der Meer & Stam equation and new numerical approach for structure
in AccropodeTM
y = 0.832xR² = 0.878
0.00
0.50
1.00
1.50
2.00
2.50
3.00
3.50
4.00
0.00 0.50 1.00 1.50 2.00 2.50 3.00 3.50 4.00
Num
eric
al R
un u
p (m
)
Equation Run up (m) Fig.13: Correlation between Burcharth equation and
new numerical approach for structure in Xbloc®
WSEAS TRANSACTIONS on FLUID MECHANICSFabio Dentale, Giovanna Donnarumma
Eugenio Pugliese Carratelli, Ferdinando Reale
E-ISSN: 2224-347X 109 Volume 10, 2015
y = 0.847xR² = 0.788
0.00
0.50
1.00
1.50
2.00
2.50
3.00
3.50
4.00
4.50
5.00
0.00 0.50 1.00 1.50 2.00 2.50 3.00 3.50 4.00 4.50 5.00
Num
eric
al R
un u
p (m
)
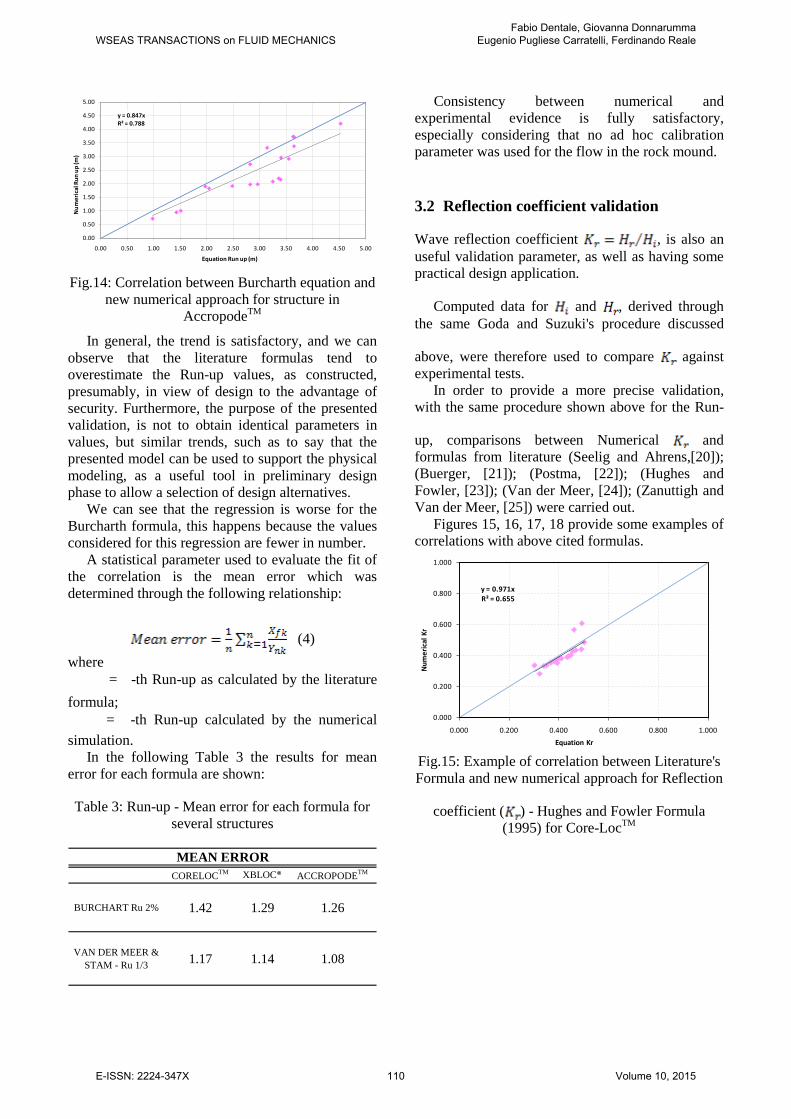
Equation Run up (m) Fig.14: Correlation between Burcharth equation and
new numerical approach for structure in AccropodeTM
In general, the trend is satisfactory, and we can observe that the literature formulas tend to overestimate the Run-up values, as constructed, presumably, in view of design to the advantage of security. Furthermore, the purpose of the presented validation, is not to obtain identical parameters in values, but similar trends, such as to say that the presented model can be used to support the physical modeling, as a useful tool in preliminary design phase to allow a selection of design alternatives.
We can see that the regression is worse for the Burcharth formula, this happens because the values considered for this regression are fewer in number.
A statistical parameter used to evaluate the fit of the correlation is the mean error which was determined through the following relationship:
(4) where
= -th Run-up as calculated by the literature formula;
= -th Run-up calculated by the numerical simulation.
In the following Table 3 the results for mean error for each formula are shown:
Table 3: Run-up - Mean error for each formula for several structures
CORELOCTM XBLOC® ACCROPODETM
BURCHART Ru 2% 1.42 1.29 1.26
VAN DER MEER & STAM - Ru 1/3 1.17 1.14 1.08
MEAN ERROR
Consistency between numerical and experimental evidence is fully satisfactory, especially considering that no ad hoc calibration parameter was used for the flow in the rock mound.
3.2 Reflection coefficient validation
Wave reflection coefficient , is also an useful validation parameter, as well as having some practical design application.
Computed data for and , derived through the same Goda and Suzuki's procedure discussed
above, were therefore used to compare against experimental tests.
In order to provide a more precise validation, with the same procedure shown above for the Run-
up, comparisons between Numerical and formulas from literature (Seelig and Ahrens,[20]); (Buerger, [21]); (Postma, [22]); (Hughes and Fowler, [23]); (Van der Meer, [24]); (Zanuttigh and Van der Meer, [25]) were carried out.
Figures 15, 16, 17, 18 provide some examples of correlations with above cited formulas.
y = 0.971xR² = 0.655
0.000
0.200
0.400
0.600
0.800
1.000
0.000 0.200 0.400 0.600 0.800 1.000
Num
eric
al K
r
Equation Kr Fig.15: Example of correlation between Literature's Formula and new numerical approach for Reflection
coefficient ( ) - Hughes and Fowler Formula (1995) for Core-LocTM
WSEAS TRANSACTIONS on FLUID MECHANICSFabio Dentale, Giovanna Donnarumma
Eugenio Pugliese Carratelli, Ferdinando Reale
E-ISSN: 2224-347X 110 Volume 10, 2015
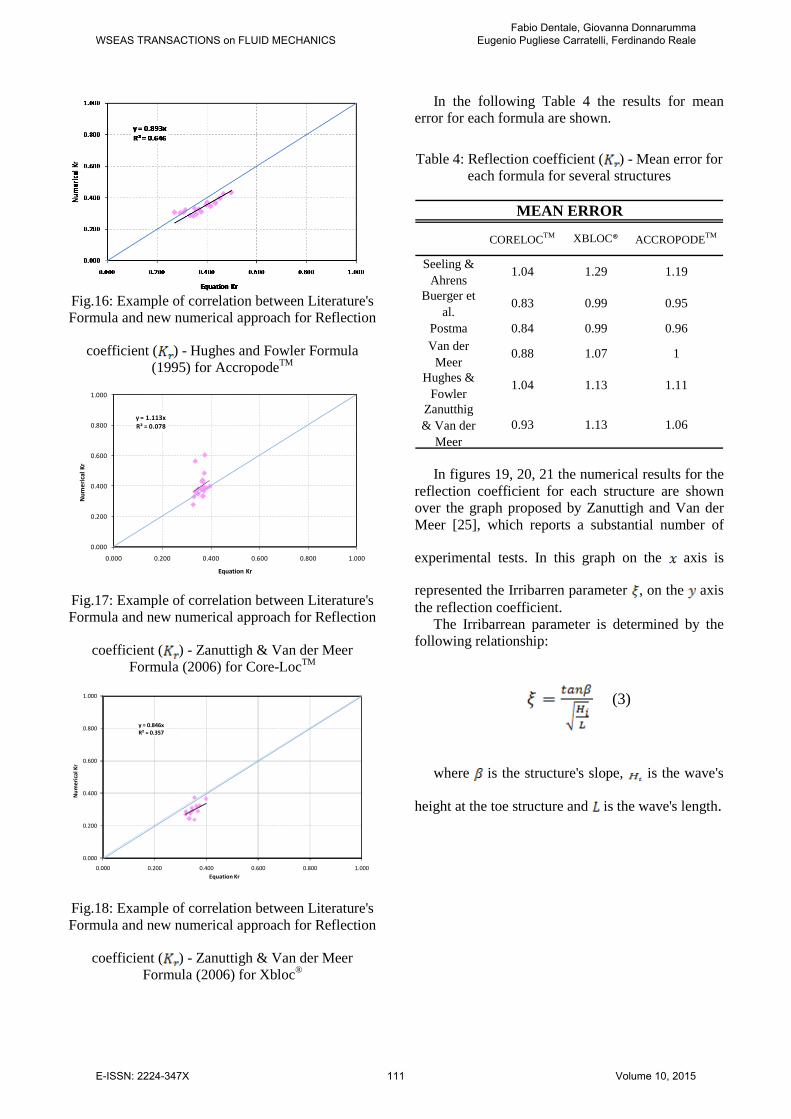
Fig.16: Example of correlation between Literature's Formula and new numerical approach for Reflection
coefficient ( ) - Hughes and Fowler Formula (1995) for AccropodeTM
y = 1.113xR² = 0.078
0.000
0.200
0.400
0.600
0.800
1.000
0.000 0.200 0.400 0.600 0.800 1.000
Num
eric
al K
r
Equation Kr
Fig.17: Example of correlation between Literature's Formula and new numerical approach for Reflection
coefficient ( ) - Zanuttigh & Van der Meer Formula (2006) for Core-LocTM
y = 0.846xR² = 0.357
0.000
0.200
0.400
0.600
0.800
1.000
0.000 0.200 0.400 0.600 0.800 1.000
Num
eric
al K
r
Equation Kr Fig.18: Example of correlation between Literature's Formula and new numerical approach for Reflection
coefficient ( ) - Zanuttigh & Van der Meer Formula (2006) for Xbloc®
In the following Table 4 the results for mean error for each formula are shown.
Table 4: Reflection coefficient ( ) - Mean error for each formula for several structures
CORELOCTM XBLOC® ACCROPODETM
Seeling & Ahrens
1.04 1.29 1.19
Buerger et al.
0.83 0.99 0.95
Postma 0.84 0.99 0.96Van der
Meer0.88 1.07 1
Hughes & Fowler
1.04 1.13 1.11
Zanutthig & Van der
Meer0.93 1.13 1.06
MEAN ERROR
In figures 19, 20, 21 the numerical results for the
reflection coefficient for each structure are shown over the graph proposed by Zanuttigh and Van der Meer [25], which reports a substantial number of
experimental tests. In this graph on the axis is
represented the Irribarren parameter , on the axis the reflection coefficient.
The Irribarrean parameter is determined by the following relationship:
(3)
where is the structure's slope, is the wave's
height at the toe structure and is the wave's length.
WSEAS TRANSACTIONS on FLUID MECHANICSFabio Dentale, Giovanna Donnarumma
Eugenio Pugliese Carratelli, Ferdinando Reale
E-ISSN: 2224-347X 111 Volume 10, 2015
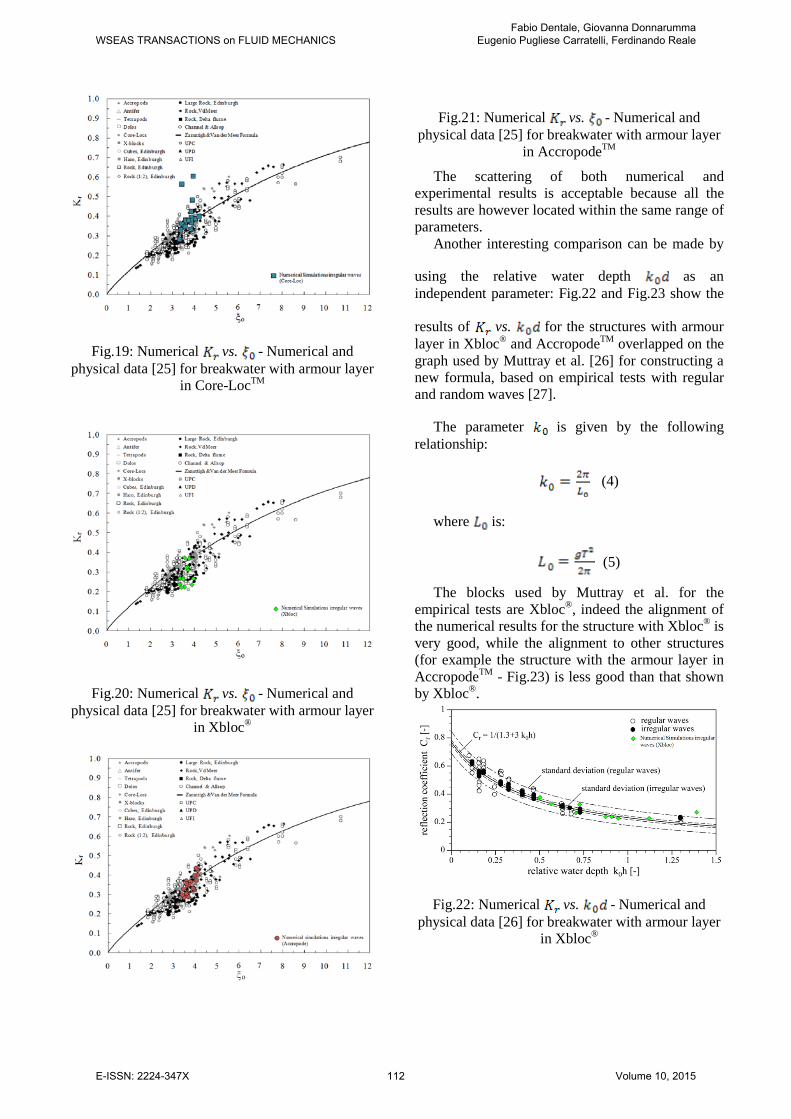
Fig.19: Numerical vs. - Numerical and physical data [25] for breakwater with armour layer
in Core-LocTM
Fig.20: Numerical vs. - Numerical and physical data [25] for breakwater with armour layer
in Xbloc®
Fig.21: Numerical vs. - Numerical and physical data [25] for breakwater with armour layer
in AccropodeTM
The scattering of both numerical and experimental results is acceptable because all the results are however located within the same range of parameters.
Another interesting comparison can be made by
using the relative water depth as an independent parameter: Fig.22 and Fig.23 show the
results of vs. for the structures with armour layer in Xbloc® and AccropodeTM overlapped on the graph used by Muttray et al. [26] for constructing a new formula, based on empirical tests with regular and random waves [27].
The parameter is given by the following relationship:
(4)
where is:
(5)
The blocks used by Muttray et al. for the empirical tests are Xbloc®, indeed the alignment of the numerical results for the structure with Xbloc® is very good, while the alignment to other structures (for example the structure with the armour layer in AccropodeTM - Fig.23) is less good than that shown by Xbloc®.
Fig.22: Numerical vs. - Numerical and physical data [26] for breakwater with armour layer
in Xbloc®
WSEAS TRANSACTIONS on FLUID MECHANICSFabio Dentale, Giovanna Donnarumma
Eugenio Pugliese Carratelli, Ferdinando Reale
E-ISSN: 2224-347X 112 Volume 10, 2015
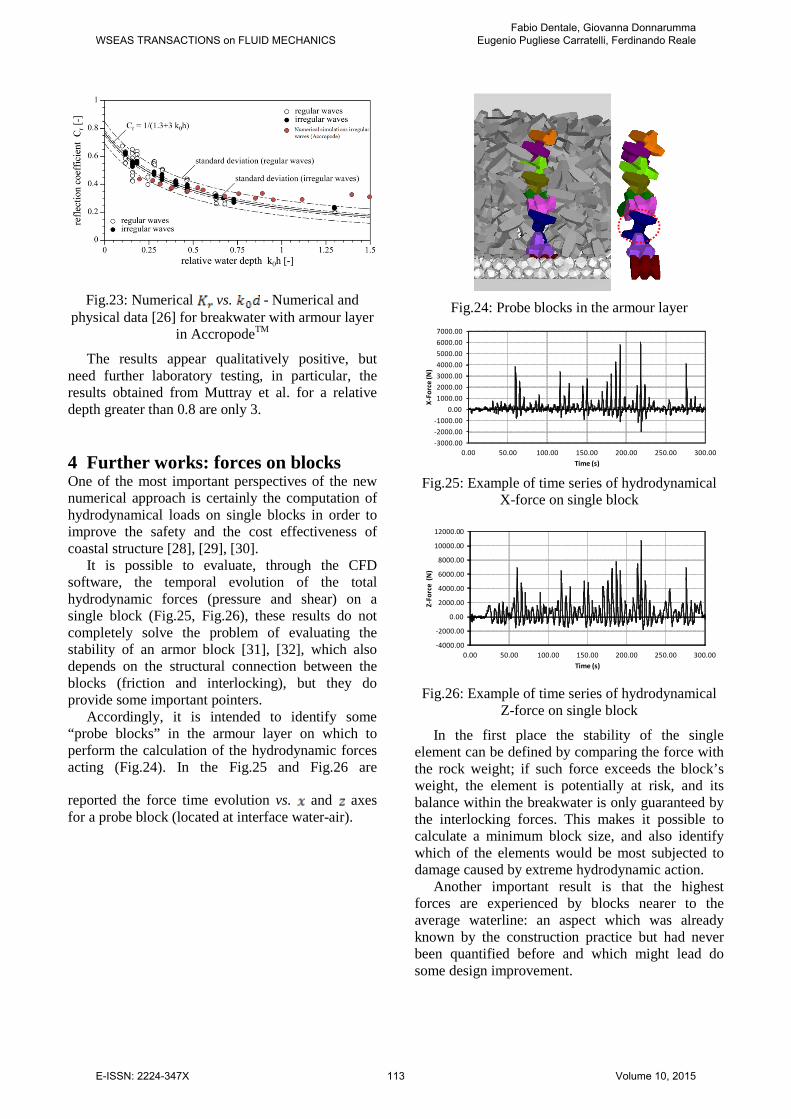
Fig.23: Numerical vs. - Numerical and physical data [26] for breakwater with armour layer
in AccropodeTM
The results appear qualitatively positive, but need further laboratory testing, in particular, the results obtained from Muttray et al. for a relative depth greater than 0.8 are only 3.
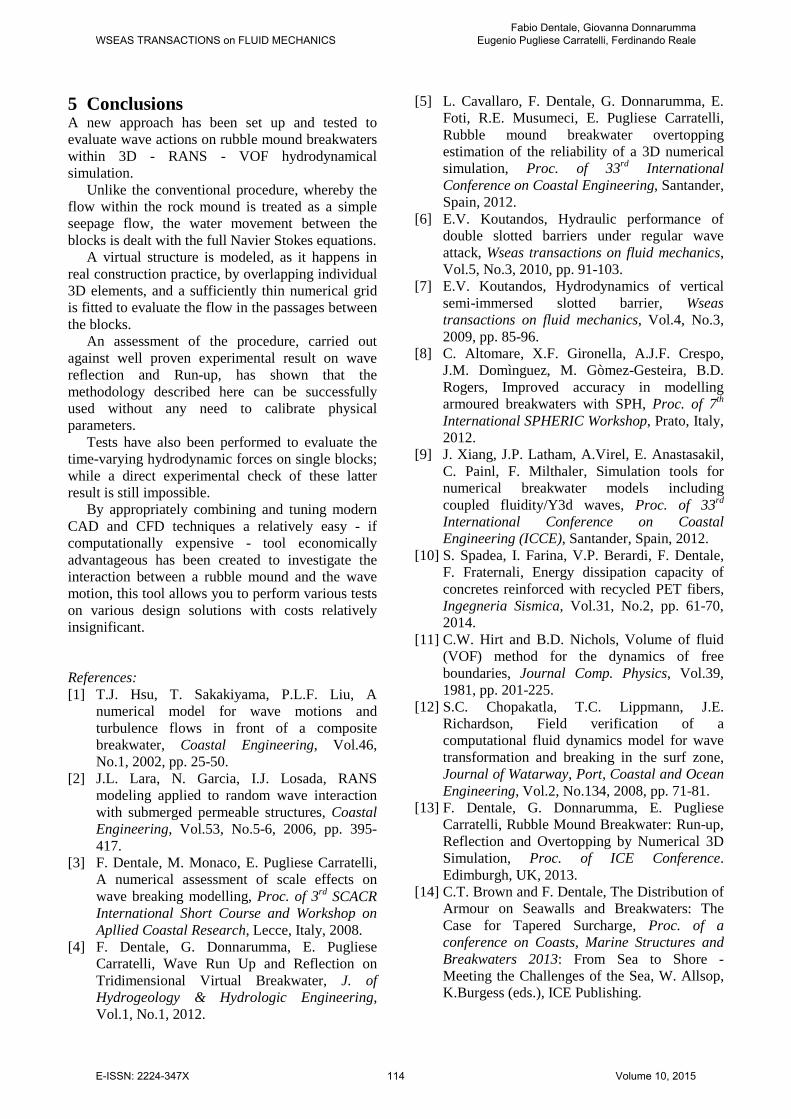
4 Further works: forces on blocks One of the most important perspectives of the new numerical approach is certainly the computation of hydrodynamical loads on single blocks in order to improve the safety and the cost effectiveness of coastal structure [28], [29], [30].
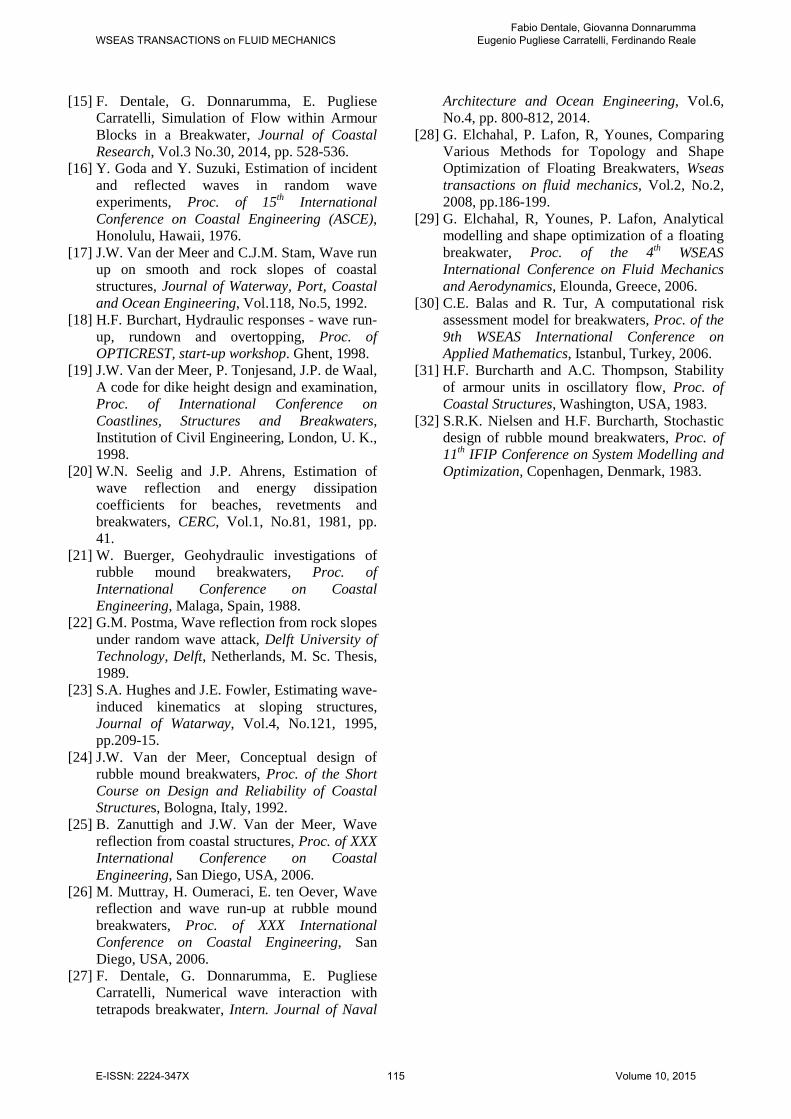
It is possible to evaluate, through the CFD software, the temporal evolution of the total hydrodynamic forces (pressure and shear) on a single block (Fig.25, Fig.26), these results do not completely solve the problem of evaluating the stability of an armor block [31], [32], which also depends on the structural connection between the blocks (friction and interlocking), but they do provide some important pointers.
Accordingly, it is intended to identify some “probe blocks” in the armour layer on which to perform the calculation of the hydrodynamic forces acting (Fig.24). In the Fig.25 and Fig.26 are
reported the force time evolution vs. and axes for a probe block (located at interface water-air).
Fig.24: Probe blocks in the armour layer
-3000.00-2000.00-1000.00
0.001000.002000.003000.004000.005000.006000.007000.00
0.00 50.00 100.00 150.00 200.00 250.00 300.00
X-Fo
rce
(N)
Time (s) Fig.25: Example of time series of hydrodynamical
X-force on single block
-4000.00
-2000.00
0.00
2000.00
4000.00
6000.00
8000.00
10000.00
12000.00
0.00 50.00 100.00 150.00 200.00 250.00 300.00
Z-Fo
rce
(N)
Time (s) Fig.26: Example of time series of hydrodynamical
Z-force on single block
In the first place the stability of the single element can be defined by comparing the force with the rock weight; if such force exceeds the block’s weight, the element is potentially at risk, and its balance within the breakwater is only guaranteed by the interlocking forces. This makes it possible to calculate a minimum block size, and also identify which of the elements would be most subjected to damage caused by extreme hydrodynamic action.
Another important result is that the highest forces are experienced by blocks nearer to the average waterline: an aspect which was already known by the construction practice but had never been quantified before and which might lead do some design improvement.
WSEAS TRANSACTIONS on FLUID MECHANICSFabio Dentale, Giovanna Donnarumma
Eugenio Pugliese Carratelli, Ferdinando Reale
E-ISSN: 2224-347X 113 Volume 10, 2015
5 Conclusions A new approach has been set up and tested to evaluate wave actions on rubble mound breakwaters within 3D - RANS - VOF hydrodynamical simulation.
Unlike the conventional procedure, whereby the flow within the rock mound is treated as a simple seepage flow, the water movement between the blocks is dealt with the full Navier Stokes equations.
A virtual structure is modeled, as it happens in real construction practice, by overlapping individual 3D elements, and a sufficiently thin numerical grid is fitted to evaluate the flow in the passages between the blocks.
An assessment of the procedure, carried out against well proven experimental result on wave reflection and Run-up, has shown that the methodology described here can be successfully used without any need to calibrate physical parameters.
Tests have also been performed to evaluate the time-varying hydrodynamic forces on single blocks; while a direct experimental check of these latter result is still impossible.
By appropriately combining and tuning modern CAD and CFD techniques a relatively easy - if computationally expensive - tool economically advantageous has been created to investigate the interaction between a rubble mound and the wave motion, this tool allows you to perform various tests on various design solutions with costs relatively insignificant. References: [1] T.J. Hsu, T. Sakakiyama, P.L.F. Liu, A
numerical model for wave motions and turbulence flows in front of a composite breakwater, Coastal Engineering, Vol.46, No.1, 2002, pp. 25-50.
[2] J.L. Lara, N. Garcia, I.J. Losada, RANS modeling applied to random wave interaction with submerged permeable structures, Coastal Engineering, Vol.53, No.5-6, 2006, pp. 395-417.
[3] F. Dentale, M. Monaco, E. Pugliese Carratelli, A numerical assessment of scale effects on wave breaking modelling, Proc. of 3rd SCACR International Short Course and Workshop on Apllied Coastal Research, Lecce, Italy, 2008.
[4] F. Dentale, G. Donnarumma, E. Pugliese Carratelli, Wave Run Up and Reflection on Tridimensional Virtual Breakwater, J. of Hydrogeology & Hydrologic Engineering, Vol.1, No.1, 2012.
[5] L. Cavallaro, F. Dentale, G. Donnarumma, E. Foti, R.E. Musumeci, E. Pugliese Carratelli, Rubble mound breakwater overtopping estimation of the reliability of a 3D numerical simulation, Proc. of 33rd International Conference on Coastal Engineering, Santander, Spain, 2012.
[6] E.V. Koutandos, Hydraulic performance of double slotted barriers under regular wave attack, Wseas transactions on fluid mechanics, Vol.5, No.3, 2010, pp. 91-103.
[7] E.V. Koutandos, Hydrodynamics of vertical semi-immersed slotted barrier, Wseas transactions on fluid mechanics, Vol.4, No.3, 2009, pp. 85-96.
[8] C. Altomare, X.F. Gironella, A.J.F. Crespo, J.M. Domìnguez, M. Gòmez-Gesteira, B.D. Rogers, Improved accuracy in modelling armoured breakwaters with SPH, Proc. of 7th International SPHERIC Workshop, Prato, Italy, 2012.
[9] J. Xiang, J.P. Latham, A.Virel, E. Anastasakil, C. Painl, F. Milthaler, Simulation tools for numerical breakwater models including coupled fluidity/Y3d waves, Proc. of 33rd International Conference on Coastal Engineering (ICCE), Santander, Spain, 2012.
[10] S. Spadea, I. Farina, V.P. Berardi, F. Dentale, F. Fraternali, Energy dissipation capacity of concretes reinforced with recycled PET fibers, Ingegneria Sismica, Vol.31, No.2, pp. 61-70, 2014.
[11] C.W. Hirt and B.D. Nichols, Volume of fluid (VOF) method for the dynamics of free boundaries, Journal Comp. Physics, Vol.39, 1981, pp. 201-225.
[12] S.C. Chopakatla, T.C. Lippmann, J.E. Richardson, Field verification of a computational fluid dynamics model for wave transformation and breaking in the surf zone, Journal of Watarway, Port, Coastal and Ocean Engineering, Vol.2, No.134, 2008, pp. 71-81.
[13] F. Dentale, G. Donnarumma, E. Pugliese Carratelli, Rubble Mound Breakwater: Run-up, Reflection and Overtopping by Numerical 3D Simulation, Proc. of ICE Conference. Edimburgh, UK, 2013.
[14] C.T. Brown and F. Dentale, The Distribution of Armour on Seawalls and Breakwaters: The Case for Tapered Surcharge, Proc. of a conference on Coasts, Marine Structures and Breakwaters 2013: From Sea to Shore - Meeting the Challenges of the Sea, W. Allsop, K.Burgess (eds.), ICE Publishing.
WSEAS TRANSACTIONS on FLUID MECHANICSFabio Dentale, Giovanna Donnarumma
Eugenio Pugliese Carratelli, Ferdinando Reale
E-ISSN: 2224-347X 114 Volume 10, 2015
[15] F. Dentale, G. Donnarumma, E. Pugliese Carratelli, Simulation of Flow within Armour Blocks in a Breakwater, Journal of Coastal Research, Vol.3 No.30, 2014, pp. 528-536.
[16] Y. Goda and Y. Suzuki, Estimation of incident and reflected waves in random wave experiments, Proc. of 15th International Conference on Coastal Engineering (ASCE), Honolulu, Hawaii, 1976.
[17] J.W. Van der Meer and C.J.M. Stam, Wave run up on smooth and rock slopes of coastal structures, Journal of Waterway, Port, Coastal and Ocean Engineering, Vol.118, No.5, 1992.
[18] H.F. Burchart, Hydraulic responses - wave run-up, rundown and overtopping, Proc. of OPTICREST, start-up workshop. Ghent, 1998.
[19] J.W. Van der Meer, P. Tonjesand, J.P. de Waal, A code for dike height design and examination, Proc. of International Conference on Coastlines, Structures and Breakwaters, Institution of Civil Engineering, London, U. K., 1998.
[20] W.N. Seelig and J.P. Ahrens, Estimation of wave reflection and energy dissipation coefficients for beaches, revetments and breakwaters, CERC, Vol.1, No.81, 1981, pp. 41.
[21] W. Buerger, Geohydraulic investigations of rubble mound breakwaters, Proc. of International Conference on Coastal Engineering, Malaga, Spain, 1988.
[22] G.M. Postma, Wave reflection from rock slopes under random wave attack, Delft University of Technology, Delft, Netherlands, M. Sc. Thesis, 1989.
[23] S.A. Hughes and J.E. Fowler, Estimating wave-induced kinematics at sloping structures, Journal of Watarway, Vol.4, No.121, 1995, pp.209-15.
[24] J.W. Van der Meer, Conceptual design of rubble mound breakwaters, Proc. of the Short Course on Design and Reliability of Coastal Structures, Bologna, Italy, 1992.
[25] B. Zanuttigh and J.W. Van der Meer, Wave reflection from coastal structures, Proc. of XXX International Conference on Coastal Engineering, San Diego, USA, 2006.
[26] M. Muttray, H. Oumeraci, E. ten Oever, Wave reflection and wave run-up at rubble mound breakwaters, Proc. of XXX International Conference on Coastal Engineering, San Diego, USA, 2006.
[27] F. Dentale, G. Donnarumma, E. Pugliese Carratelli, Numerical wave interaction with tetrapods breakwater, Intern. Journal of Naval
Architecture and Ocean Engineering, Vol.6, No.4, pp. 800-812, 2014.
[28] G. Elchahal, P. Lafon, R, Younes, Comparing Various Methods for Topology and Shape Optimization of Floating Breakwaters, Wseas transactions on fluid mechanics, Vol.2, No.2, 2008, pp.186-199.
[29] G. Elchahal, R, Younes, P. Lafon, Analytical modelling and shape optimization of a floating breakwater, Proc. of the 4th WSEAS International Conference on Fluid Mechanics and Aerodynamics, Elounda, Greece, 2006.
[30] C.E. Balas and R. Tur, A computational risk assessment model for breakwaters, Proc. of the 9th WSEAS International Conference on Applied Mathematics, Istanbul, Turkey, 2006.
[31] H.F. Burcharth and A.C. Thompson, Stability of armour units in oscillatory flow, Proc. of Coastal Structures, Washington, USA, 1983.
[32] S.R.K. Nielsen and H.F. Burcharth, Stochastic design of rubble mound breakwaters, Proc. of 11th IFIP Conference on System Modelling and Optimization, Copenhagen, Denmark, 1983.
WSEAS TRANSACTIONS on FLUID MECHANICSFabio Dentale, Giovanna Donnarumma
Eugenio Pugliese Carratelli, Ferdinando Reale
E-ISSN: 2224-347X 115 Volume 10, 2015