Embed Size (px)
Citation preview

Hindawi Publishing CorporationInternational Journal of Distributed Sensor NetworksVolume 2013, Article ID 546708, 14 pageshttp://dx.doi.org/10.1155/2013/546708
Research ArticleA Novel Data Classification and Scheduling Scheme inthe Virtualization of Wireless Sensor Networks
Md. Motaharul Islam and Eui-Nam Huh
Department of Computer Engineering, Kyung Hee University, Yongin-si, Gyeonggi-do 446-701, Republic of Korea
Correspondence should be addressed to Eui-Nam Huh; [email protected]
Received 25 February 2013; Revised 27 June 2013; Accepted 1 July 2013
Academic Editor: Al-Sakib Khan Pathan
Copyright © 2013 Md. M. Islam and E.-N. Huh.This is an open access article distributed under the Creative Commons AttributionLicense, which permits unrestricted use, distribution, and reproduction in anymedium, provided the originalwork is properly cited.
Most of the nodes in a wireless sensor network (WSN) remain idle for the maximum period of their lifetime resulting inunderutilization of their resources. There are many ongoing research studies to utilize the resources of sensor nodes in an efficientway. Virtualization of sensor network (VSN) is one of the novel approaches to utilize the physical infrastructure of a WSN. VSNcan be simply defined as the virtual version of a WSN over the physical sensor infrastructure. By allowing sensor nodes to coexiston a shared physical substrate, VSNmay provide flexibility, cost effectiveness, and manageability.This paper proposes a QoS-awaredata classification and scheduling framework for VSN in the health care sector. We develop a tiny virtual machine called VSNwarefor health care applications, which facilitates QoS-aware forwarding of data packets, maintaining the reliability, delay guarantee,and speed. The simulation results also show that the proposed scheme outperforms the conventional WSN approaches.
1. Introduction
Recent advances in electronics have enabled the developmentof multifunctional smart sensor nodes that are small insize and communicate in an untethered manner over shortdistances. A sensor network consists of a large number oftiny sensor nodes that are densely deployed over a specifictarget area [1–4].There is a robust deployment ofWSNs in thehealth care sector because of their small size. Today’s smartsensor node can efficiently monitor different vital signs suchas the cardiac data, temperature, blood pressure, pulse rate,and saturation of peripheral oxygen (SPO
2) of a patient. In
the health care scenario, applications demand different typesof QoS requirements such as reliability, end-to-end delay,speed, and timeliness. There are many ongoing efforts toenhance the QoS issues of WSNs in the existing literature[5–7]. In this age of recession, providing QoS affordably inthe WSN-based health care system is a big challenge for theincreasing worldwide elderly population, which is the largestdemographic group in the developed countries. For this veryreason, researchers are searching for cost-effective ways tosupport QoS in WSNs for the health care sector.
Very recently, network virtualization has created a reso-nance among the network research community. The concept
of sensor virtualization has also attracted a great deal ofattention from industry and academia [8–10]. Virtualizationof sensor network (VSN) can be defined as the separation offunctions for the traditional wireless sensor network (WSN)service provider into two parts: the sensor infrastructureprovider (SInP), which manages the physical sensor infras-tructure, and the VSN service provider (VSNSP), whichdevelops VSN by aggregating the resources from multi-ple SInPs and offers services to the application-level users(ALUs).
The WSN virtualization renaissance has originatedmainly from the realization that most of the sensor nodesremain idle for most of the time in a WSN. Virtualization isone of the best ways to utilize the physical sensor infrastruc-ture. VSN can provide a platform upon which novel sensornetwork architectures can be built, experimentally tested, andevaluated. In addition, virtualization in WSNs is expected toprovide a clean separation of services and infrastructure andto facilitate new ways of doing business with sensor networkresources among multiple service providers and application-level users [8].
In this paper, we propose QoS-aware data classificationand a scheduling framework for the health care system inVSN.The sensor node senses parallel data and forwards it to a

2 International Journal of Distributed Sensor Networks
nearby node or gateway node.The gateway node classifies thedata as urgent, suspicious,moderate, or normal.The classifieddata are passed through the decodingmodule and are queuedup in the VSN queue. Finally, the scheduling module sendsdata to a specific path based on the priority, reliability, anddelay requirements of the data packets.
The main contributions of this paper are as follows.
(a) A business model of the virtualization of sensornetwork is proposed.
(b) A tiny virtualmachine called VSNware for health careapplications has been developed for QoS-aware datapacket forwarding.
(c) Packet classification and scheduling mechanisms aresuggested.
(d) A detailed probabilistic analytical model of the relia-bility and delay for different traffics is proposed.
(e) Finally, the simulation results of the proposed schemeare presented with respect to other approaches.
The remainder of the paper is organized as follows.Section 2 reviews the background related to the conventionalWSN, virtual sensor network, VSN, and related works. InSection 3, we discuss the detailed architecture of the sensornodes and the sensor gateway router. Section 4 describes theVSN network model. Section 5 states the classification andscheduling of data packets. Sections 6 and 7 discuss a detailedmathematical model of the delay and reliability for differentdata traffics. Section 8 presents the performance evaluationsand simulation results. Finally Section 9 concludes the paper.
2. Backgrounds
VSN is a brand-new research approach in the field ofWSN. Before proceeding further, we need to clarify fewbasic concepts and the difference between traditional WSN,virtual sensor network, and VSN. In this paper, VSN meansvirtualization of a WSN as defined in the Introduction andin Section 2.3. The term VSN in this paper is synonymouslyused for the process of virtualization of a sensor network andfor the network that supports virtualization.
2.1. Traditional WSN Approach. Traditional wireless sensornetwork consists of a large number of sensor nodes that aredensely deployed either inside the phenomenon of interestor very close to it [1]. A sensor node senses its surroundingenvironment, performs necessary computation and process-ing, and sends the sensory data through multihop or directlyto the coordinator node. The coordinator node may be afixed node or a mobile node capable of connecting thesensor network to an existing communication infrastructurewhere a user can access the reported data. By integratingsensing, signal processing, and communication functions, atraditional sensor network provides a natural platform forhierarchical information processing [2–4]. The traditionalWSN is dedicated for the monitoring of a particular event.But in VSN environment, the same infrastructure can be usedby multiple stack holders.
2.2. Virtual Sensor Network. The virtual sensor networkconsists of a collaborative wireless sensor network. It isformed by a subset of sensor nodes of a wireless sensornetwork, with the subset being dedicated to a certain taskor an application at a given time [11, 12]. In contrast, thesubset of nodes belonging to the virtual sensor networkcollaborates to carry out a given application at a specific time.A virtual sensor network can be formed by providing logicalconnectivity among collaborative sensor nodes. Nodes can begrouped into different virtual sensor networks based on thephenomenon they track or the task they perform.The virtualsensor network protocol should provide the functionality fornetwork formation, usage, adaptation, and maintenance of asubset of sensors collaborating on a specific task [13].
2.3. VSN and Its Business Model. Unlike the conventionalWSN, the VSN environment has a collection of multipleheterogeneous sensor nodes that coexist in the same physicalspace. VSN is a type of network that creates a virtual topologyon top of the physical topology of a traditional WSN. SInPin Figure 1 deploys different sensor nodes. In the traditionalWSN infrastructure, the provider and the service provider arethe same entity. VSNdifferentiates between the infrastructureprovider and the service provider, thus providing a businessmodel of true virtualization.
SInP deploys sensor network resources. It offers resourcesthrough programmable interfaces to different VSNSPs. Dif-ferent interest groups can deploy sensor nodes and can makeindividual infrastructures, which can be used by the VSNSPto run individual applications. The VSNSP gets resourcesfrom multiple SInPs to deploy VSNs by sharing the allocatedvirtualized network resources to offer end-to-end applicationuser services.The VSNSP can obtain resources frommultipleSInPs. ALUs in the VSN model are similar to those of theexisting WSN, except that the existence of multiple VSNSPsfrom competing SInPs provides a wide range of choices. Anyend user can connect to multiple VSNSPs from differentSInPs to use multiple applications.
2.4. Related Works. Currently there are few approaches inthe WSN [5, 11–16] that focus on the virtual and overlaysensor network rather than the purist view of the VSNapproach introduced in this paper. Table 1 summarizes afew of the research projects that act as the backgroundof the proposed research approach. It demonstrates thecontemporary research direction in the field of virtualizationof sensor networks in general.
Recently, the Federated Secure Sensor Network Labo-ratory (FRESnel) has aimed to build a large-scale sensorframework.The goal of this project is to offer an environmentthat can support multiple applications running on eachsensor node [14–16]. It provides an execution environmentthat hides the system details from the running applications.The system operates in a shared environment. The keycharacteristics of this approach are a virtualization layer thatis running on each sensor node and provides abstracts accessto sensor resources, which allows the management of theseresources through policies expressed by the infrastructure

International Journal of Distributed Sensor Networks 3
Care giver Govt. office Doctors PatientsALU
VSGRVSGR
VSGR
VSGR
VSGR
VSGRVSGR
VSGR
VSGRVSGR
VSGRVSGR
VSGR VSGR
VSGRVSGR
VSNSP-2
VSNSP-1
SGR
SGR
SGR
SGR SGR
SInP
Figure 1: Business model for VSN.
Table 1: VSN research-related projects.
Projects Research area URL
FRESnelTo build a large-scale federated sensor network
framework with multiple applications sharing the sameresources
http://www.cl.cam.ac.uk/research/srg/netos/fresnel/index.html
VSNs Random routing, virtual coordinates, and VSN supportfunctions http://www.cnrl.colostate.edu/Projects/VSNs/vsns.html
Sensor PlanetNokia-initiated cooperation, a global researchframework, on mobile device-centric large-scale
wireless sensor networkshttp://research.nokia.com/page/232
ViSE Virtualization of sensor/actuator system, creatingcustomized virtual sensor network test beds http://groups.geni.net/geni/wiki/ViSE
DVMTo build a system that supports software
reconfiguration in embedded sensor networks atmultiple levels
http://nesl.ee.ucla.edu/project/show/51
SensEye Multitier multimodal sensor networks http://sensors.cs.umass.edu/projects/senseye/
SenQ Complex virtual sensors and user-created streams canbe dynamically discovered and shared http://www.cs.virginia.edu/wsn/sensornets.html
WebDust Multiple, heterogeneous, wireless sensor networks canbe controlled as a single, unified, virtual sensor network http://ru1.cti.gr/projects/webdust/

4 International Journal of Distributed Sensor Networks
owner. A runtime environment on each node allows multipleapplications to run inside the sensor node. It also providespolicy-based application deployment that enables multipleapplications to be deployed over the shared infrastructure. InMMSPEED [5], a novel packet delivery mechanism for QoSprovisioning was proposed. It provides QoS differentiationin terms of two qualities, such as timeliness and reliability.This approach is based on multiple logical speed layers overa physical sensor network that is based on the conventionalvirtual sensor network. Based on the speed, it considersdifferent virtual overlays. For virtual layering, it employsvirtual isolation among the speed layers.This is accomplishedby classifying the incoming packets according to their speedclasses and then placing them into the appropriate priorityqueues. SenShare [15] is another platform that attempts toaddress the technical challenge of supportingmultiple corun-ning applications in the sensor node. Here each applicationoperates in an isolated environment consisting of an in-node hardware abstraction layer and a dedicated overlaysensor network. Instead of using a virtual machine, SenShareuses a hardware abstraction layer. It is a set of routinesin software that emulates some platform-specific details,thereby giving programs direct access to the hardware. TheMate [17] and Melete [18] systems are based on the virtualmachine approach that provides reliable storage and enablesthe execution of concurrent applications on a single sensornode. The VSN approach proposed in this paper is basedon the Mate and Melete systems. This modified version ofvirtual machine is called VSNware. VSNware provides anenvironment to support different applications for health caresystems such as cardiac data, blood pressure, blood sugar, andtemperature sensing. VSNware helps to provide the puristview of the virtualization concept. It does so by separatingthe SInP and VSNSP as discussed in the previous sections. Byapplying the purist view of virtualization in VSN, this schemecan be efficiently used in the health care system, which is themain contribution of this paper. To the best of our knowledge,no previous research article has explored the VSN approachto design a ubiquitous health care system for the QoS-basedvital data classifications and scheduling scheme.
3. Architecture of VSN
In this section we are going to introduce the detail archi-tectural design of the proposed VSN approach and thedescription of its individual components elaborately.
3.1. SystemArchitecture. Here we briefly describe the detailedsystem architecture and the software architecture of the sen-sor node and sensor gateway router (SGR). In the followingsections we will explain the architecture in detail. The systemarchitecture consists of three layers: the SInP, VSNSP, andALU.The software architecture describes the virtualization ofthe individual sensor nodes and gateway router.
3.1.1. SInP. SInP consists of different sensor nodes. Thesesensor nodes sense different vital signs of the patient, suchas the temperature, heart rate, blood pressure, and blood
VSN2
VSN1
SInP
Applications
VSN16
Figure 2: VSN architecture.
sugar. To sense the patient body in the VSN environment,we consider two types of sensor node: the fully functionaldevice (FFD) and the reduced functional device (RFD)sensor nodes. SInP deploys sensor nodes in the hospital ina distributed manner. Each group of sensor nodes is dividedinto different logical areas, which are identified by circles toindicate the SGR domain. Each SGR domain may consistof one or more SGRs, which is an FFD sensor node. EachSGR supports sensor virtualization. In each domain there aremany RFD sensor nodes that sense vital signs. The RFD ismore resource-constrained than the SGR/FFD.
3.1.2. VSNSP. The VSNSP consists of many virtual SGRs(VSGRs), which are the virtual representations of the pro-cessing, storage, and other resources of the SGRs. The linksbetween the VSGRs are the dynamically allocated channelsbetween the SGRs. Since the VSN scheme is based on theIEEE 802.15.4 radio specification, it has 16 channels. Eachchannel is considered to be an individual path that consistsof multiple links between SGRs. Each VSN provides a specificapplication service to the users. In Figure 2, we depict up toa maximum of 16 VSNs provided by a specific VSNSP as theunderlying SInPs can support.
3.1.3. ALU. This layer consists of different application levelusers such as doctors, nurses, patients, or any other spe-cialized users. Based on the application requirements, theALU sends a request to the VSNSP. The VSNSP then mapsthe particular VSN according to the request of the specificapplication. Individual applications may use multiple VSNSP

International Journal of Distributed Sensor Networks 5
Sensor node
Temperature Cardiac Bloodpressure
Bloodsugar
VSNwareInput/output Application management
Embedded linux
CPU USB RF Storage
Figure 3: Architecture of sensor node.
VSN gateway
Urgentdata
Suspiciousdata
Moderatedata
Normaldata
VSNware
Virtual routing Input/output Application management
Embedded linux
CPU 802.15.4 channel Storage
Figure 4: Architecture of SGR.
resources.The user may be amachine in the case of machine-to-machine communication, which can involve individualcomputers and any other smart device.
3.2. Software Architecture for Sensor Node and SGR. Figure 3depicts the software architecture of a sensor node. It sensesvital signs from patients in a health care system. A single sen-sor node performs multiple sensing tasks by using physicalinfrastructure virtualization as a service. The typical sensornode architecture consists of a physical layer, an operatingsystem (OS) layer, a virtualization layer, and multiple sensingservice layers. The lower layer consists of the physical sensorresources such as a central processing unit (CPU), USBmodule, RF module, and storage module. Layer 2 consistsof a typical multitasking sensor network operating system.We use Embedded Linux in this case. Embedded Linuxprovides the environment to host the virtualization layer.Thevirtualization layer supports concurrent service execution.The virtualization layer includes the input/output and appli-cation management modules. Finally, the application layerruns multiple services over the virtualization layer, such asthe sensing of temperature, cardiac data, blood pressure, andblood sugar.
Figure 4 depicts the detailed architecture of the SGR.The SGR is one of the key components in the overallVSN architecture for the health care system. An SGR is a
fully functional sensor node that supports the concurrentprocessing of multiple applications. It also consists of a phys-ical layer, sensor network operating system layer, VSNwarelayer, and application layer. The lower layer consists of thephysical sensor resources, such as the central processingunit (CPU), RF module, and storage module. The sensoroperating system layer consists of a typical multitaskingsensor network operating system. In this model we useEmbedded Linux as it is used in the individual sensor nodes.It provides the environment to run the VSNware. VSNwaresupports concurrent execution of the applications. VSNwareconsists of different modules such as forwarding/routing inVSN, input/output, and applicationmanagement. Finally, theapplication layer provides the classified data, such as urgent,suspicious, moderate, and normal, over different VSNs basedon the reliability and delay requirements.
4. Network Model of VSN
In this section we propose the network model of VSN basedon graph theory. We consider a densely deployed large-scale and heterogeneous wireless sensor network in which𝑁sensor nodes and 𝑀 sensor gateway routers are uniformlydistributed. The nodes and SGRs may determine their geo-graphical locations. In fact, networking in such a WSN isvery dynamic and differs from a traditional wired network. Anode in aWSN is very tiny and consists of a small processingand storage unit. Since VSN is based on the existing SInP, itinherits most of the properties of a WSN. A link in VSN isthe different channels used in a WSN. We use IEEE 802.15.4,which has 16 channels. We describe the network model of aWSN by using the graph theory that follows the procedurediscussed in [19, 20]. We also discuss the VSN node andVSN link embedding. Virtual node embedding in VSN is likethe conventional network embedding, but link embeddingis quite different from the conventional approach. In thiscase, link embedding is done by dynamically using differentchannels that consist of multiple links.
4.1. SInP. We model the 𝑆 network as a weighted undirectedgraph and denote it by 𝐺SInP
= (𝑁SInP
, 𝐿SInP
), where 𝑁SInP
is the set of physical sensor nodes and 𝐿SInP is the associated
links. SInP sensor nodes are divided into two functionalitiesbased on their processing capability and storage space, that is,common widely deployed sensor nodes and a sensor gatewayrouter. Each sensor gateway router in the SInP is associatedwith the CPU capacity weight value 𝐶(𝑁
SInP) and its GPS
location loc(𝑁SInP) on a globally understood coordinate
system. Each substrate link 𝑙SInP
(𝑖, 𝑗) ∈ 𝐿SInP between two
substrate gateway router nodes 𝑖 and 𝑗 is associated with thebandwidth capacity weight value 𝑏(𝑙SInP) denoting the totalamount of bandwidth.We denote the set of all substrate pathsby 𝑃𝑠 and the set of substrate paths from the source node
𝑠 to the destination node 𝑑 by 𝑃𝑠(𝑠, 𝑑). Figure 1 shows the
substrate SInP network, where the sensing node is indicatedby small circles of different colors and the sensor gatewayrouters are indicated by a node with a wireless antenna.

6 International Journal of Distributed Sensor Networks
4.2. VSN Request by ALU. As we discuss the graph-baseddescription of SInP, we also model the VSN request asweighted undirected graphs and denote a VN request interms of the service request as 𝐺vsn
(𝑁vsn
, 𝐿vsn
). We mentionthe requirement on virtual nodes and links of the substratephysical sensor network. Each VN request has an associatednonnegative value𝐷V expressing how far a virtual node 𝑛vsn ∈
𝑁vsn can be embedded from its preferred location loc(𝑛vsn).
𝐷V is expressed naturally as a link delay or round-trip time
from the loc(𝑛vsn).
4.3. SInP Network Resources Measurement. To measure thedifferent types of resource usage of the SInP, we use thenotion of utility. The substrate SInP node utility 𝑈SInP
𝑛(𝑛
SInP)
is defined as the total amount of processing power allocatedto different virtual sensor nodes hosted on the substrate SInPnode 𝑛SInP ∈ 𝑁
SInP:
𝑈𝑛SInP (𝑛
SInP) = ∑𝑐 (𝑛
vsn) . (1)
The substrate SInP link utility 𝑈SInP𝑙
(𝑙SInP
) is defined asthe total amount of link usage by different virtual sensornodes hosted on the substrate SInP node 𝑛SInP ∈ 𝑁
SInP. It isactually the dedicated channel utilization to a specific virtualsensor node:
𝑈𝑙SInP = ∑𝑏 (𝑙
vsn) . (2)
The substrate SInP storage or memory utility𝑈
SInP𝑚
(𝑚SInP
) is defined as the total amount of storageusage by different virtual sensor nodes hosted on thesubstrate SInP node 𝑛SInP ∈ 𝑁
SInP. It is actually the memoryutilization of different virtual sensor nodes:
𝑈𝑚
SInP = ∑𝑠 (𝑚vsn
) . (3)
The total utility of the processing power, link, and storagecan be calculated by summing up (1), (2), and (3). Here 𝛼, 𝛽,and 𝛾 are the weighted values to express the node, link, andstorage capacity, respectively, by a single utility:
𝑈𝑇SInP = 𝛼∑𝑐 (𝑛
vsn) + 𝛽∑𝑏 (𝑙
vsn) + 𝛾∑𝑠 (𝑚
vsn) . (4)
4.4. Residual ResourceMeasurement. Residual resourceman-agement is performed by measuring the available resourcesremaining after utilization. In this section we have giventhe mathematical formulation of the remaining resources ofthe SInP sensor node, corresponding link, and storage only.The residual capacity of the SInP sensor nodes is defined asthe total processing capacity of the sensor nodes, which isexplained in (5):
𝑅𝑛SInP (𝑛
SInP) = ∑
𝑛∈𝑁
𝑐 (𝑛SInP
) − 𝑈𝑛SInP (𝑛
SInP) . (5)
In a wireless sensor network, the communication isperformed bywireless links. By a link, wemean awireless link
between different SGR nodes. We allocate different channelsof a particular wireless link to particular applications in thevirtualization of the sensor network. Equation (6) representsthe residual channel capacity in the underlying SInP:
𝑅𝑙SInP (𝑙
SInP) = ∑
𝑙∈𝐿
𝑏 (𝑙SInP
) − 𝑈𝑙SInP (𝑙
SInP) . (6)
There are two types of storage in the underlying SInPnode: flash memory and SDRAM. In this mathematicalmodel we only consider the SDRAM, which is only physicalmemory shared by different applications in the VSN applica-tions. Equation (7) shows the total remaining residual storagefor further applications:
𝑅𝑠SInP (𝑠
SInP) = ∑
𝑚∈𝑀
𝑠 (𝑚vsn
) − 𝑈𝑚
SInP (𝑚SInP
) . (7)
4.5. VSN Node and Link Embedding. In this work, theVSN node and link embedding are very much restrictedto the SGR and the wireless link between different SGRs.Different VSNSP nodes share the same or different SGRsof the SInP. The typical sharing depends on the storagelimit of the SGR. For wireless link embedding, we considerthe efficient channel utilization. Individual VSNSPs provideparticular services. For example, VSN-1 may provide urgentdata services and use channel-1, while VSN-2 may providesuspicious data services and use channel-2 of the specificVSNSP. In this way, the same SInP can be used by differentVSNSPs.
5. Packets Classification and Schedulingin VSN
This section discusses the packet classification and schedulinginVSN. Figure 5 depicts the packet classification and schedul-ing module of the SGR in a VSN environment. It consists ofdifferent components such as the traffic classifier, scheduling,channel allocation, and link estimator. Brief descriptions ofthe mechanisms are given below.
(i) The data packet is received by the IEEE 802.15.4 inter-face. Then the data is sent to the MAC receptionmodule.
(ii) All of the data from the MAC reception passesthrough the traffic classifier module. Based on theinformation provided in the data packet, such asreliability, delay deadline, and priority informationfrom the application layer, the data are classified asurgent, suspicious, moderate, and normal.
(iii) The classified data are passed through the 4-to-16decoder module. Based on the availability of the VSNqueues, the data are queued up.
(iv) The scheduling module sends the data to a specificpath based on the priority and other requirements ofthe data packet and VSN queue.
(v) The channel allocation is based on the link estimatorinformation and scheduling requirements.

International Journal of Distributed Sensor Networks 7
To and fromapplications
Trafficclassifier
MACreception
802.15.4
Incomingtraffic
Urgent data
Suspicious
Moderate
Normal data
CH1CH2
CH16
4to
16
deco
ders VSN1
VSN2
VSN16
802.15.4
Sche
dulin
g
Outgoingtraffic
CH allocation
Link estimatorPRR RSSI LQI
· · ·
......
...
Figure 5: Protocol architecture of SGR.
(vi) The link estimatormodule depends on the PRR, RSSI,and LQI for link quality measurements.
(vii) Finally, the data packets are transmitted to the nextVSN gateway.
In the following sections we describe the individual com-ponents in detail.
5.1. Traffic Classifier. The traffic classifier receives differenttypes of data packets from the MAC reception module. Aspecific VSN may carry particular types of data packetsor a combination of different types of data based on theapplication requirement.The data packets consist of differentvital signs of the patient, such as the cardiac data, glucoselevel, blood pressure, pulse rate, and temperature.The packetreceived from the sensor nodes includes the data type,deadline, delay, and reliability requirements. Based on theinformation in the packet, the data are classified as urgent,suspicious, moderate, or normal. The traffic classification iscontext dependent.
Urgent Data. This includes emergency traffic or other datatypes specified by the applications. These types of trafficrequire approximately 100% reliability and a hard delayguarantee. It is usually event-triggered traffic and is generatedwhenever a life-threatening situation appears. For instance,when the heart rate and blood pressure of a patient exceed thedanger limit, an emergency action is needed, which requiresurgent transmission with the highest reliability and lowestdelay.
Suspicious Data. This type of data requires a strict reliabilityrequirement (>90%) but can tolerate a delay up to a certainlimit, such as a medical image like an X-ray or ultrasonog-raphy. On the other hand, some data, such as a telemedicine
video transmission, must meet a strict delay deadline but cantolerate some packet loss.
Moderate Data. Both delay and reliability guarantees arerequired. However, moderate data requires soft QoS ratherthanhardQoS. In this case, the reliability requirement ismorethan 80%. Different types of medical applications, such asheart rate and SPO
2continuously generate data that must be
delivered with moderate reliability and delay requirements.
Normal Data. This type of traffic does not require any strictdelay or reliability constraints. It consists of the regulardata for patients such as the temperature, blood pressure,and glucose level. For normal data, less than 70% percentreliability is maintained during transmission.
The classified data are transmitted over different VSNsaccording to their priority, reliability, and delay requirements.Data over different VSNs are forwarded to different users andapplications through the dynamically allocated channels.
5.2. VSNs. From a technical point of view, all of the VSNsare the logical combination of the CPU resources, storage,and the link of the SInP. A VSN is formed dynamically basedon the requirement of the application level requests providedby different users. However, a typical VSNSP consists of 16VSNs, due to the dedicated and available channels in thephysical layer. These 16 channels of the particular VSNSPcan be allocated based on the priority, reliability, and end-to-end delay requirements of the traffic. A particular applicationmay use more than one VSN to ensure guaranteed service. Ina specific VSN, there are multiple communication paths bywhich the data may be transmitted.
5.3. Scheduling. The data scheduling is performed based onthe information provided by different components, such asthe traffic classifier, VSN priority, and channel allocation

8 International Journal of Distributed Sensor Networks
module. The goal of this module is to ensure application-specific reliability and end-to-end delay. Different applica-tions have different reliability and end-to-end delay require-ments.
5.4. Link Estimator. Link estimation is based on three param-eters: the packet reception rate (PRR), received signalstrength indicator (RSSI), and link quality indicator (LQI).Based on these parameters, the link estimator provides qual-ity information regarding the particular link. The detailedmathematical derivations of these parameters are givenbelow.
We estimate the current path state by using the linkquality information, including the link quality indicator(LQI) and the received signal strength indicator (RSSI) [20,21]. The RSSI is a function of the distance between two nodesand can be computed as follows:
RSSI (𝑑) = RSSI (𝑑0) − 10𝑛 log( 𝑑
𝑑0
) . (8)
In (8), RSSI(𝑑) is the received signal strength in 𝑑𝑏 ata distance 𝑑 from the source node. RSSI(𝑑
0) is the received
signal strength at a distance 𝑑0from the source and 𝑛 is the
attenuation exponent.The IEEE 802.15.4 specification ensures that each incom-
ing frame contains a link quality indicator (LQI) value. TheLQI indicates the quality of the link at the time of the framereception. According to the standard, the LQI value mustbe an integer that is uniformly distributed between 0 and255, with 255 indicating the highest signal quality. The LQIis measured as follows:
LQI = 255 + 3 × 𝑃𝑟×dBm. (9)
Here, 𝑃𝑟×dBm is the power of a received frame expressed
in decibel-milliwatts. If the computed value is a fraction,then a rounding operation is performed to obtain an integer.𝑅𝑎𝑏
represents the link quality and received signal strengthbetween two nodes. RSSI from node 𝑎 to node 𝑏 is rep-resented by RSSI
𝑎𝑏, and RSSI from node 𝑏 to node 𝑎 is
represented by RSSI𝑏𝑎. In this case, we consider symmetric
transmission.TheLQI values of nodes 𝑎 and 𝑏 are representedas LQI
𝑎and LQI
𝑏. Thus 𝑅
𝑎𝑏can be calculated as follows:
𝑅𝑎𝑏
= RSSI𝑎𝑏× RSSI
𝑏𝑎× LQI
𝑎× LQI
𝑏. (10)
To calculate the packet reception rate (PRR), each nodeestimates the link loss rate for every outgoing link using theweighted average loss intervalmethod discussed in [6]. It usesthe interval between loss events to estimate the loss rate ofa link. We denote the interval between the 𝑚th and (𝑚 +
1)th loss for the outgoing link of the 𝑖th path as 𝑙𝑖,1(𝑚). Then
for the recent 1 ≤ 𝑚 ≤ 𝑛 losses, the average loss interval, 𝑙𝑖,1,
is
𝑙𝑖,1(𝑖, 𝑛) =
∑𝑛
𝑚=1𝑙𝑖,1(𝑚)𝑤
𝑚
∑𝑛
𝑚=1𝑤𝑚
, (11a)
𝑙𝑖,1(0, 𝑛 − 1) =
∑𝑛−1
𝑚=0𝑙𝑖,1(𝑚)𝑤
𝑚
∑𝑛
𝑚=1𝑤𝑚
, (11b)
𝑙𝑖,1
= max (𝑙𝑖,1(𝑖,𝑛)
, 𝑙𝑖(0,𝑛−1)
) , (11c)
where 𝑙𝑖,1(0) is the interval since themost recent loss and𝑤
𝑚is
theweight given to each loss interval.We compute the averagePRR of the first hop of the 𝑖th path, 𝑝
𝑖,1, using the average loss
rate, 𝑝𝑐𝑖,1
= 1/𝑙𝑖,1, as
𝑝𝑖,1
= 1 − 𝑝𝑐
𝑖,1. (11d)
The communication nature of VSN enables the measure-ment of the success rate of a path by using passive informationexchange. When a node forwards a packet in a path, itincludes the success rate of the path in the packet.The successrate of the 𝑖th path of a node, 𝑃
𝑖(ℎ𝑖), is given by
𝑃𝑖(ℎ𝑖) =
ℎ𝑖
∏
𝐽=1
𝑝𝑖,𝑗= 𝑝𝑖,1
ℎ𝑖
∏
𝐽=2
𝑝𝑖,𝑗, (12)
where 𝑝𝑖,𝑗
is the success rate of the 𝑗th hop and 𝑝𝑖,1
is thesuccess rate of the first hop of the node.∏ℎ𝑖
𝐽=2𝑝𝑖,𝑗is the success
rate of the path from the downstream node, and the nodeoverhears this from the forwarded packets of the downstreamnode.
5.5. Channel Allocation. Channel allocation is a dynamicprocess by which the system allocates a particular channel tothe specific VSN. There are 16 channels in the 802.15.4 PHYlayer specification, starting at 2.4GHz. Based on the linkstatus from the link estimator, this module allocates thechannels. The channel quality is computed by the followingequation:
𝑅Channel =∑𝑛
𝑖=1𝑅𝑖
𝑎𝑏
𝑛, (13)
where 𝑅𝑎𝑏
is the quality of the link and 𝑛 is the number oflinks on the channel.
With the help of the channel quality computation, thechannel allocator selects the channel as follows.
Step 1. Periodically measure the channel quality with the𝑅Channel and PRR values.
Step 2. Define the scheduling probability 𝑃(𝑎), which is theprobability that traffic is assigned to channel 𝐼, representingthe normalized value of 𝑅
𝐶hannel relative to other channelvalues as shown:
𝑃𝑖(𝑎) =
𝑅Channel
∑𝑖
𝑘𝑅Channel
. (14)
International Journal of Distributed Sensor Networks 9
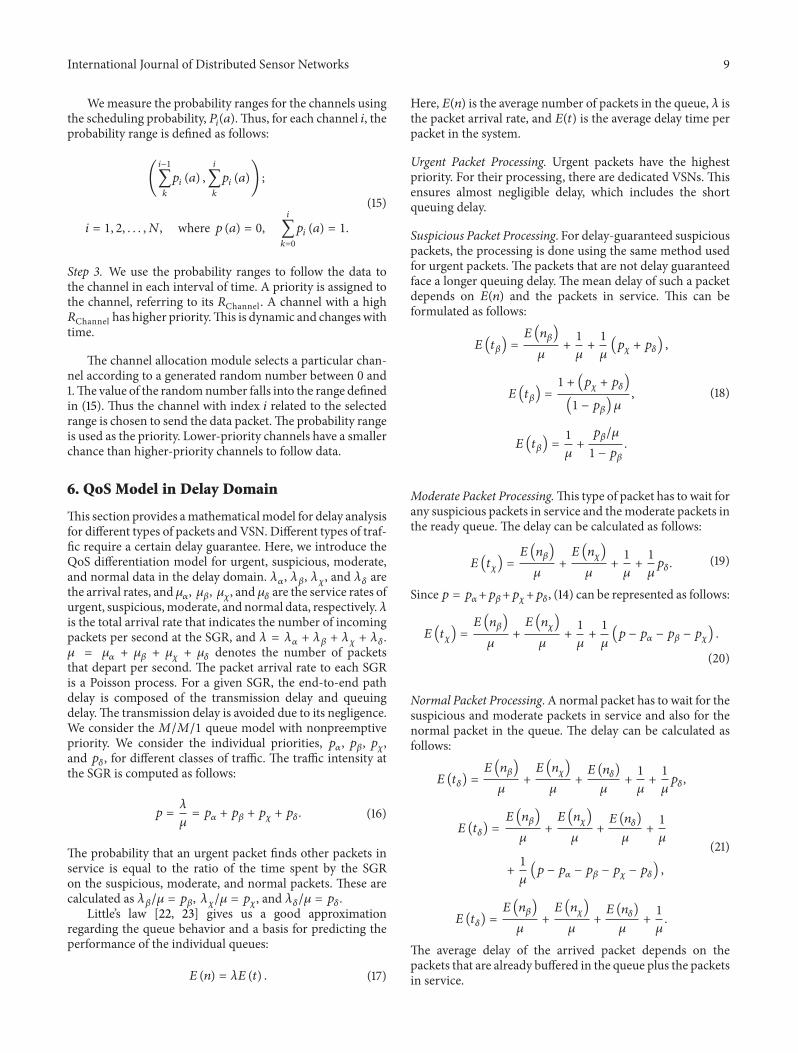
Wemeasure the probability ranges for the channels usingthe scheduling probability, 𝑃
𝑖(𝑎).Thus, for each channel 𝑖, the
probability range is defined as follows:
(
𝑖−1
∑
𝑘
𝑝𝑖(𝑎) ,
𝑖
∑
𝑘
𝑝𝑖(𝑎)) ;
𝑖 = 1, 2, . . . , 𝑁, where 𝑝 (𝑎) = 0,
𝑖
∑
𝑘=0
𝑝𝑖(𝑎) = 1.
(15)
Step 3. We use the probability ranges to follow the data tothe channel in each interval of time. A priority is assigned tothe channel, referring to its 𝑅Channel. A channel with a high𝑅Channel has higher priority.This is dynamic and changeswithtime.
The channel allocation module selects a particular chan-nel according to a generated random number between 0 and1.The value of the randomnumber falls into the range definedin (15). Thus the channel with index 𝑖 related to the selectedrange is chosen to send the data packet.The probability rangeis used as the priority. Lower-priority channels have a smallerchance than higher-priority channels to follow data.
6. QoS Model in Delay Domain
This section provides amathematicalmodel for delay analysisfor different types of packets and VSN. Different types of traf-fic require a certain delay guarantee. Here, we introduce theQoS differentiation model for urgent, suspicious, moderate,and normal data in the delay domain. 𝜆
𝛼, 𝜆𝛽, 𝜆𝜒, and 𝜆
𝛿are
the arrival rates, and 𝜇𝛼, 𝜇𝛽, 𝜇𝜒, and 𝜇
𝛿are the service rates of
urgent, suspicious,moderate, and normal data, respectively.𝜆is the total arrival rate that indicates the number of incomingpackets per second at the SGR, and 𝜆 = 𝜆
𝛼+ 𝜆𝛽+ 𝜆𝜒+ 𝜆𝛿.
𝜇 = 𝜇𝛼+ 𝜇𝛽+ 𝜇𝜒+ 𝜇𝛿denotes the number of packets
that depart per second. The packet arrival rate to each SGRis a Poisson process. For a given SGR, the end-to-end pathdelay is composed of the transmission delay and queuingdelay.The transmission delay is avoided due to its negligence.We consider the 𝑀/𝑀/1 queue model with nonpreemptivepriority. We consider the individual priorities, 𝑝
𝛼, 𝑝𝛽, 𝑝𝜒,
and 𝑝𝛿, for different classes of traffic. The traffic intensity at
the SGR is computed as follows:
𝑝 =𝜆
𝜇= 𝑝𝛼+ 𝑝𝛽+ 𝑝𝜒+ 𝑝𝛿. (16)
The probability that an urgent packet finds other packets inservice is equal to the ratio of the time spent by the SGRon the suspicious, moderate, and normal packets. These arecalculated as 𝜆
𝛽/𝜇 = 𝑝
𝛽, 𝜆𝜒/𝜇 = 𝑝
𝜒, and 𝜆
𝛿/𝜇 = 𝑝
𝛿.
Little’s law [22, 23] gives us a good approximationregarding the queue behavior and a basis for predicting theperformance of the individual queues:
𝐸 (𝑛) = 𝜆𝐸 (𝑡) . (17)
Here, 𝐸(𝑛) is the average number of packets in the queue, 𝜆 isthe packet arrival rate, and 𝐸(𝑡) is the average delay time perpacket in the system.
Urgent Packet Processing. Urgent packets have the highestpriority. For their processing, there are dedicated VSNs. Thisensures almost negligible delay, which includes the shortqueuing delay.
Suspicious Packet Processing. For delay-guaranteed suspiciouspackets, the processing is done using the same method usedfor urgent packets. The packets that are not delay guaranteedface a longer queuing delay. The mean delay of such a packetdepends on 𝐸(𝑛) and the packets in service. This can beformulated as follows:
𝐸 (𝑡𝛽) =
𝐸 (𝑛𝛽)
𝜇+1
𝜇+1
𝜇(𝑝𝜒+ 𝑝𝛿) ,
𝐸 (𝑡𝛽) =
1 + (𝑝𝜒+ 𝑝𝛿)
(1 − 𝑝𝛽) 𝜇
,
𝐸 (𝑡𝛽) =
1
𝜇+
𝑝𝛽/𝜇
1 − 𝑝𝛽
.
(18)
Moderate Packet Processing.This type of packet has to wait forany suspicious packets in service and themoderate packets inthe ready queue. The delay can be calculated as follows:
𝐸 (𝑡𝜒) =
𝐸 (𝑛𝛽)
𝜇+
𝐸 (𝑛𝜒)
𝜇+1
𝜇+1
𝜇𝑝𝛿. (19)
Since 𝑝 = 𝑝𝛼+𝑝𝛽+𝑝𝜒+𝑝𝛿, (14) can be represented as follows:
𝐸 (𝑡𝜒) =
𝐸 (𝑛𝛽)
𝜇+
𝐸 (𝑛𝜒)
𝜇+1
𝜇+1
𝜇(𝑝 − 𝑝
𝛼− 𝑝𝛽− 𝑝𝜒) .
(20)
Normal Packet Processing. A normal packet has to wait for thesuspicious and moderate packets in service and also for thenormal packet in the queue. The delay can be calculated asfollows:
𝐸 (𝑡𝛿) =
𝐸 (𝑛𝛽)
𝜇+
𝐸 (𝑛𝜒)
𝜇+𝐸 (𝑛𝛿)
𝜇+1
𝜇+1
𝜇𝑝𝛿,
𝐸 (𝑡𝛿) =
𝐸 (𝑛𝛽)
𝜇+
𝐸 (𝑛𝜒)
𝜇+𝐸 (𝑛𝛿)
𝜇+1
𝜇
+1
𝜇(𝑝 − 𝑝
𝛼− 𝑝𝛽− 𝑝𝜒− 𝑝𝛿) ,
𝐸 (𝑡𝛿) =
𝐸 (𝑛𝛽)
𝜇+
𝐸 (𝑛𝜒)
𝜇+𝐸 (𝑛𝛿)
𝜇+1
𝜇.
(21)
The average delay of the arrived packet depends on thepackets that are already buffered in the queue plus the packetsin service.
10 International Journal of Distributed Sensor Networks
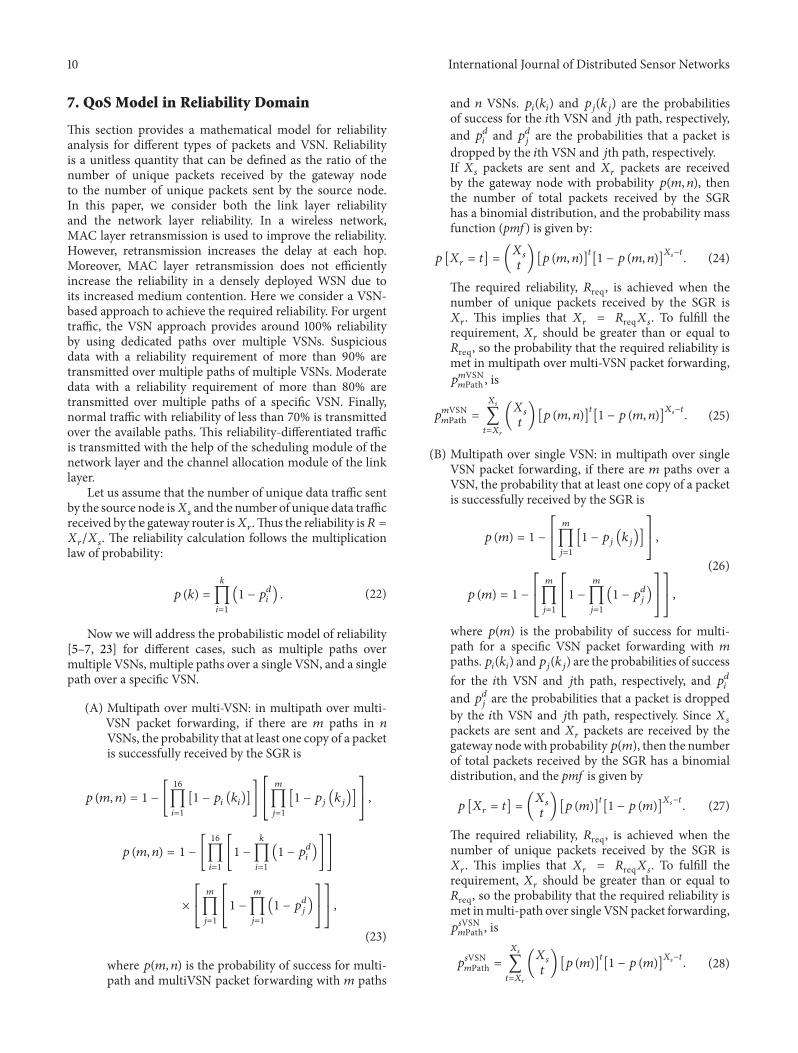
7. QoS Model in Reliability Domain
This section provides a mathematical model for reliabilityanalysis for different types of packets and VSN. Reliabilityis a unitless quantity that can be defined as the ratio of thenumber of unique packets received by the gateway nodeto the number of unique packets sent by the source node.In this paper, we consider both the link layer reliabilityand the network layer reliability. In a wireless network,MAC layer retransmission is used to improve the reliability.However, retransmission increases the delay at each hop.Moreover, MAC layer retransmission does not efficientlyincrease the reliability in a densely deployed WSN due toits increased medium contention. Here we consider a VSN-based approach to achieve the required reliability. For urgenttraffic, the VSN approach provides around 100% reliabilityby using dedicated paths over multiple VSNs. Suspiciousdata with a reliability requirement of more than 90% aretransmitted over multiple paths of multiple VSNs. Moderatedata with a reliability requirement of more than 80% aretransmitted over multiple paths of a specific VSN. Finally,normal traffic with reliability of less than 70% is transmittedover the available paths. This reliability-differentiated trafficis transmitted with the help of the scheduling module of thenetwork layer and the channel allocation module of the linklayer.
Let us assume that the number of unique data traffic sentby the source node is𝑋
𝑠and the number of unique data traffic
received by the gateway router is𝑋𝑟.Thus the reliability is𝑅 =
𝑋𝑟/𝑋𝑠. The reliability calculation follows the multiplication
law of probability:
𝑝 (𝑘) =
𝑘
∏
𝑖=1
(1 − 𝑝𝑑
𝑖) . (22)
Now we will address the probabilistic model of reliability[5–7, 23] for different cases, such as multiple paths overmultiple VSNs, multiple paths over a single VSN, and a singlepath over a specific VSN.
(A) Multipath over multi-VSN: in multipath over multi-VSN packet forwarding, if there are 𝑚 paths in 𝑛
VSNs, the probability that at least one copy of a packetis successfully received by the SGR is
𝑝 (𝑚, 𝑛) = 1 − [
16
∏
𝑖=1
[1 − 𝑝𝑖(𝑘𝑖)]][
[
𝑚
∏
𝑗=1
[1 − 𝑝𝑗(𝑘𝑗)]]
]
,
𝑝 (𝑚, 𝑛) = 1 − [
16
∏
𝑖=1
[1 −
𝑘
∏
𝑖=1
(1 − 𝑝𝑑
𝑖)]]
× [
[
𝑚
∏
𝑗=1
[
[
1 −
𝑚
∏
𝑗=1
(1 − 𝑝𝑑
𝑗)]
]
]
]
,
(23)
where 𝑝(𝑚, 𝑛) is the probability of success for multi-path and multiVSN packet forwarding with 𝑚 paths
and 𝑛 VSNs. 𝑝𝑖(𝑘𝑖) and 𝑝
𝑗(𝑘𝑗) are the probabilities
of success for the 𝑖th VSN and 𝑗th path, respectively,and 𝑝
𝑑
𝑖and 𝑝
𝑑
𝑗are the probabilities that a packet is
dropped by the 𝑖th VSN and 𝑗th path, respectively.If 𝑋𝑠packets are sent and 𝑋
𝑟packets are received
by the gateway node with probability 𝑝(𝑚, 𝑛), thenthe number of total packets received by the SGRhas a binomial distribution, and the probability massfunction (pmf ) is given by:
𝑝 [𝑋𝑟= 𝑡] = (
𝑋𝑠
𝑡) [𝑝 (𝑚, 𝑛)]
𝑡
[1 − 𝑝 (𝑚, 𝑛)]𝑋𝑠−𝑡
. (24)
The required reliability, 𝑅req, is achieved when thenumber of unique packets received by the SGR is𝑋𝑟. This implies that 𝑋
𝑟= 𝑅req𝑋𝑠. To fulfill the
requirement, 𝑋𝑟should be greater than or equal to
𝑅req, so the probability that the required reliability ismet in multipath over multi-VSN packet forwarding,𝑝𝑚VSN𝑚Path , is
𝑝𝑚VSN𝑚Path =
𝑋𝑠
∑
𝑡=𝑋𝑟
(𝑋𝑠
𝑡) [𝑝 (𝑚, 𝑛)]
𝑡
[1 − 𝑝 (𝑚, 𝑛)]𝑋𝑠−𝑡
. (25)
(B) Multipath over single VSN: in multipath over singleVSN packet forwarding, if there are 𝑚 paths over aVSN, the probability that at least one copy of a packetis successfully received by the SGR is
𝑝 (𝑚) = 1 − [
[
𝑚
∏
𝑗=1
[1 − 𝑝𝑗(𝑘𝑗)]]
]
,
𝑝 (𝑚) = 1 − [
[
𝑚
∏
𝑗=1
[
[
1 −
𝑚
∏
𝑗=1
(1 − 𝑝𝑑
𝑗)]
]
]
]
,
(26)
where 𝑝(𝑚) is the probability of success for multi-path for a specific VSN packet forwarding with 𝑚
paths.𝑝𝑖(𝑘𝑖) and𝑝
𝑗(𝑘𝑗) are the probabilities of success
for the 𝑖th VSN and 𝑗th path, respectively, and 𝑝𝑑
𝑖
and 𝑝𝑑
𝑗are the probabilities that a packet is dropped
by the 𝑖th VSN and 𝑗th path, respectively. Since 𝑋𝑠
packets are sent and 𝑋𝑟packets are received by the
gateway nodewith probability𝑝(𝑚), then the numberof total packets received by the SGR has a binomialdistribution, and the pmf is given by
𝑝 [𝑋𝑟= 𝑡] = (
𝑋𝑠
𝑡) [𝑝 (𝑚)]
𝑡
[1 − 𝑝 (𝑚)]𝑋𝑠−𝑡
. (27)
The required reliability, 𝑅req, is achieved when thenumber of unique packets received by the SGR is𝑋𝑟. This implies that 𝑋
𝑟= 𝑅req𝑋𝑠. To fulfill the
requirement, 𝑋𝑟should be greater than or equal to
𝑅req, so the probability that the required reliability ismet inmulti-path over single VSNpacket forwarding,𝑝𝑠VSN𝑚Path, is
𝑝𝑠VSN𝑚Path =
𝑋𝑠
∑
𝑡=𝑋𝑟
(𝑋𝑠
𝑡) [𝑝 (𝑚)]
𝑡
[1 − 𝑝 (𝑚)]𝑋𝑠−𝑡
. (28)

International Journal of Distributed Sensor Networks 11
(C) Single path over single VSN: in a single path oversingleVSNpacket forwarding, to get the required reli-ability level, packets must be retransmitted since thefailure probability is high. The probability denoted as𝑝𝑗(𝑟) indicates that the 𝑗th hop successfully forwards
a packet within 𝑟 retransmission attempts. In such ascenario, if there is a path in a VSN, the probabilitythat at least one copy of a packet is successfullyreceived by the SGR is
𝑝𝑗(𝑟) = 1 − (𝑝
𝑗)𝑟
. (29)
The probability that a data packet is successfullyreceived by the SGR in a single path over a specificVSN with a hop count 𝑠 is
𝑝 (𝑠) =
𝑆
∏
𝑗=1
[𝑝𝑗(𝑟)] =
𝑆
∏
𝑗=1
[1 − (𝑝𝑗)𝑟
] . (30)
Here, 𝑝(𝑠) is the probability of success for a singlepath for single VSN packet forwarding. The requiredreliability, 𝑅req, is achieved when the number ofunique packets received by the SGR is 𝑋
𝑟. This
implies that 𝑋𝑟= 𝑅req𝑋𝑠. To fulfill the requirement,
𝑋𝑟should be greater than or equal to 𝑅req, so the
probability that the required reliability is met withsingle path over single VSNpacket forwarding,𝑝𝑠VSN
𝑠Path ,is
𝑝𝑠VSN𝑠Path =
𝑋𝑠
∑
𝑡=𝑋𝑟
(𝑋𝑠
𝑡) [𝑝 (𝑠)]
𝑡
[1 − 𝑝 (𝑠)]𝑋𝑠−𝑡
. (31)
8. Performance Evaluations
In this section, we discuss the simulation environment andevaluation results. We have implemented and evaluated theVSNware on the Imote2 sensor node.The Imote2 sensor nodehas a Marvel PXA27x ARM processor with 400MHz clockspeed, 32MB Flash, and 32MB SDRAM. We have selectedImote2 as the sensor node for its advanced features suchas its memory size and CPU speed. In this evaluation, thesensor node runs Embedded Linux as its operating system.The detailed system specifications are given in Table 2.
We develop a virtual machine for wireless sensor networkcalled “VSNware.” It is based on Embedded Linux. TheVSNware environment restricts access to all of the physicalresources on the node, thus ensuring that applications areonly allowed to access the hardware through the VSNware.VSNware is available in all SGR nodes. VSNware supportsconcurrent application execution and dynamic applicationdeployment. The VSNware supports applications imple-mented in high-level language, thereby enabling differentapplications from health care scenarios to be executed andrun in the VSN environment. We compare the proposedVSN approach with MMSPEED [5] and the traditional WSNapproach. MMSPEED provides a virtual network of multiplespeed layers for a network-wide speed guarantee in terms ofthe reliability and timeliness. The traditional WSN approach
Table 2: System specifications.
Type SpecificationsSensor node Imote2CPU Marvel PXA27x ARMCPU speed 400MHzOperating system Embedded LinuxOS version 2.6.29VM VSNwareFlash size 32MBSDRAM size 32MBInterface USBBandwidth 250KbpsRadio IEEE 802.15.4
in this performance evaluation process is used to emulate theexact scenario in the conventional method that is providedby the proposed VSN approach. In the following scenarios,utilization of VSNware is the technical point of a VSN-basedsystem evaluation. Here, we focus on different issues suchas the memory utilization, CPU utilization, and executiontimes of individual applications. Efficient memory and CPUutilization are the main concern of the VSN approach. Theexecution time and CPU utilization are related to each other.We have compared the memory and CPU utilization ofour proposed VSN scheme to those of the MMSPEED andtraditional approaches.
In Figure 6, we plot the memory usage of the traditional,MMSPEED, and VSN approaches. The sensor virtualizationversion includes the overhead of the applications due to theadditional memory usage of a single sensor node. However,the overhead is linear and increases slowly based on thenumber of applications being deployed. In comparison to theMMSPEED and traditional approaches, the proposed VSNapproach provides better performance. The performanceevaluation shows that the proposed VSN approach reducesthe average memory utilization by 53% and 56% as comparedto the MMSPEED and traditional approaches, respectively.
In Figure 7, we plot the execution times of different appli-cations for different numbers of virtualized sensor nodes.Thefigure shows the execution times of 3, 5, and 7 vital sign-sensing applications based on the virtualization of sensornetwork methodology. The execution time increases linearlybased on the number of applications in a sensor node.
In Figure 8, we plot the CPU utilization versus the num-ber of applications in the traditional approach, MMSPEEDapproach, and in the virtualization of sensor network sce-nario. The CPU utilization increases linearly in all of thecases. In this scenario, the VSN approach uses CPU resourcesefficiently, since it executes different applications on the samesensor node. The performance evaluation result shows thatthe proposed VSN approach has average CPU utilizationthat is 56% and 60% lower than that of the MMSPEED andtraditional approaches, respectively.
In Figure 9, we depict the memory usage of differenttypical applications, such as medical imaging, cardiac, blood

12 International Journal of Distributed Sensor Networks
VSN approachMMSPEEDTraditional approach
Number of applications
Mem
ory
usag
e (KB
)
10000
9000
8000
7000
6000
5000
4000
3000
2000
1000
1 2 3 4 5 6 7
Figure 6: Comparative memory usage in VSN approach.
Number of nodes5 10 15 20 25 30 35 40 45 50
0
1
2
3
4
5
6
7
8
Exec
utio
n tim
e (s)
Sensing 3 vital signsSensing 5 vital signsSensing 7 vital signs
Figure 7: Execution time versus number of nodes.
sugar, blood pressure, and temperature. Medical image appli-cations use more memory than other applications. Sincethe total memory in the Imote2 sensor node is 32MB, itcan provide the environment for the execution and runningof the typical applications. The figure also demonstratesthe memory usage of different applications in terms of theMMSPEED scheme and the traditional WSN and proposedVSN approaches.
In Figure 10, we have presented the end-to-end delaysof different data flows. It shows that the average delay forthe four classes of data packets increases with the increasing
VSN approachMMSPEEDTraditional approach
CPU
usa
ge (%
)
Number of applications
60
50
40
30
20
10
1 2 3 4 5 6 7
Figure 8: Comparative CPU usage in VSN approach.M
emor
y us
age (
KB)
10000
9000
8000
7000
6000
5000
4000
3000
2000
1000
0
Applications
VSN approachMMSPEEDTraditional approach
Medical image Cardiacdata
Bloodsugar
Bloodpressure
Temperature
Figure 9: Comparative memory usage by applications.
number of sensor nodes. It clearly shows that the average end-to-end delay of an urgent packet is significantly lower thanthat of the suspicious, moderate, and normal data packets.
In Figure 11, we have presented the end-to-end delays ofdifferent data flows with respect to the data rate. The datarate varies according to the priorities assigned to differentdata flows. Since the highest priority is assigned to the urgentclass, it experiences the lowest delay with respect to the otherclasses of data packets. Suspicious and moderate data alsoexperience minimum delay due to their priority and the VSNapproach used in this scheme.

International Journal of Distributed Sensor Networks 13
UrgentSuspicious
ModerateNormal
0.0008
0.0007
0.0006
0.0005
0.0004
0.0003
0.0002
0.0001
0.0000
Number of nodes
E2E
delay
(s)
5040 4530 3520 2515105
Figure 10: End-to-end delay versus number of nodes.
UrgentSuspicious
ModerateNormal
0.000650.000600.000550.000500.000450.000400.000350.000300.000250.000200.000150.000100.000050.00000
10050 150 200 250
Del
ays (
s)
Data rate (Kbps)
Figure 11: Delay versus data rate.
Figure 12 shows the reliability of different data pack-ets with respect to the number of nodes. We focused ondesigning our scheme to ensure 100% percent reliability,but, practically, it ensures an average of approximately 98%reliability.The reliability levels of the suspicious andmoderatedata are also significantly higher than that of the normal data.
In Figure 13, we demonstrate the packet dropping proba-bility versus the arrival rate. Packet dropping depends on thepacket arrival rate at the queues. The figure shows that theurgent data has the lowest loss, followed by the suspicious,moderate, and normal traffic.
UrgentSuspicious
ModerateNormal
Number of nodes
Relia
bilit
y
1.0
0.9
0.8
0.7
0.6
0.5
0.4
0.3
0.2
0.15 10 15 20 25 30
Figure 12: Reliability versus number of nodes.
UrgentSuspicious
ModerateNormal
0.0035
0.0030
0.0025
0.0020
0.0015
0.0010
0.0005
0.0000
Arrival rate20 40 60 80 100 120 140 160 180 200
Prob
abili
ty o
f pac
ket d
rop
Figure 13: Packet dropping probability versus arrival rate.
9. Conclusions
In this paper, we propose a novel approach of a VSN-basedpacket delivery mechanism to provide service differentiationand probabilistic QoS assurance in the delay and reliabilitydomains. It also explores QoS-based data classification andscheduling schemes for health care applications in a VSNenvironment. For the delay domain, we use multiple layersbased on VSN so that different data packets can dynamicallychoose the appropriate layers according to the delay require-ments of individual data traffic. For the reliability domain, weuse multiple virtual layers as well as different paths within
14 International Journal of Distributed Sensor Networks
the corresponding VSN. The performance evaluations showthat the VSN scheme provides low end-to-end delay and highreliability for the urgent data. It also significantly increasesthe performance for the other data classifications. Our futureinterest is to emphasize the large-scale and federated sensornetwork platformwithmultiple applications sharing the samephysical resources that will facilitate the rapid deployment ofthe ubiquitous health care system.
Acknowledgments
This research was supported by the MSIP (Ministry ofScience, ICT and Future Planning), Republic of Korea, underthe ITRC (InformationTechnologyResearchCenter) supportprogram supervised by the NIPA (National IT IndustryPromotion Agency) (NIPA-2013-(H0301-13-2001)).
References
[1] I. F. Akyildiz, W. Su, Y. Sankarasubramaniam, and E. Cayirci, “Asurvey on sensor networks,” IEEE Communications Magazine,vol. 40, no. 8, pp. 102–105, 2002.
[2] K. Akkaya and M. Younis, “A survey on routing protocols forwireless sensor networks,” Ad Hoc Networks, vol. 3, no. 3, pp.325–349, 2005.
[3] M. M. Islam and E.-N. Huh, “Sensor proxy mobile IPv6(SPMIPv6)-a novel scheme for mobility supported IP-WSNs,”Sensors, vol. 11, no. 2, pp. 1865–1887, 2011.
[4] M. M. Islam and E.-N. Huh, “A novel addressing scheme forPMIPv6 based global IP-WSNs,” Sensors, vol. 11, no. 9, pp. 8430–8455, 2011.
[5] E. Felemban, C.-G. Lee, and E. Ekici, “MMSPEED: MultipathMulti-SPEED Protocol for QoS guarantee of reliability andtimeliness in wireless sensor networks,” IEEE Transactions onMobile Computing, vol. 5, no. 6, pp. 738–753, 2006.
[6] M. M. Alam, M. A. Razzaque, M. Mamun-Or-rashid, and C.S. Hong, “Energy-aware QoS provisioning for wireless sensornetworks: analysis and protocol,” Journal of Communicationsand Networks, vol. 11, no. 4, pp. 390–405, 2009.
[7] M. A. Razzaque, M. M. Alam, M. Mamun-Or-rashid, andC. S. Hong, “Multi-constrained QoS geographic routing forheterogeneous traffic in sensor networks,” IEICE Transactionson Communications, vol. E91-B, no. 8, pp. 2589–2601, 2008.
[8] M.M. Islam,M.M.Hassan,G.-W. Lee, andE.-N.Huh, “A surveyon virtualization of wireless sensor networks,” Sensors, vol. 12,no. 2, pp. 2175–2207, 2012.
[9] M. M. Islam, J. H. Lee, and E. N. Huh, “An efficient model forsmart home by the virtualization of wireless sensor network,”International Journal of Distributed Sensor Networks, vol. 2013,Article ID 168735, 10 pages, 2013.
[10] M. M. Islam, M. M. Hassan, and E.-N. Huh, “Virtualizationin wireless sensor network: challenges and opportunities,” inProceedings of the 13th International Conference on Computerand Information Technology (ICCIT ’10), December 2010.
[11] S. Kabadayi, A. Pridgen, and C. Julien, “Virtual sensors:abstracting data from physical sensors,” in Proceedings of theInternational Symposium on a World of Wireless, Mobile andMultimedia Networks (WoWMoM ’06), pp. 587–592, Buffalo-Niagara Falls, NY, USA, June 2006.
[12] J.-H. Shin and D. Park, “A virtual infrastructure for large-scalewireless sensor networks,” Computer Communications, vol. 30,no. 14-15, pp. 2853–2866, 2007.
[13] A. P. Jayasumana, H. Qi, and T. H. Illangasekare, “Virtualsensor networks—a resource efficient approach for concurrentapplications,” in Proceedings of the 4th International Conferenceon Information Technology (ITNG ’07), pp. 111–115, April 2007.
[14] S. Waharte, J. Xiao, and R. Boutaba, “Overlay wireless sensornetworks for application-adaptive scheduling in WLAN,” inProceedings of the 7th IEEE International Conference on HighSpeed Networks and Multimedia Communications (HSNMC’04), vol. 3079 of Lecture Notes in Computer Science, pp. 676–684, Toulouse, France, 2004.
[15] I. Leontiadis, C. Efstratiou, C. Mascolo, and J. Crowcroft, “Sen-share: transforming sensor networks into multi-applicationsensing infrastructures,” in Proceedings of the 9th EuropeanConference on Wireless Sensor Networks, February 2012.
[16] C. Efstratiou, I. Leontiadis, C. Mascolo, and J. Crowcroft,“Demoabstract: a shared sensor network infrastructure,” inPro-ceedings of the 8th ACM International Conference on EmbeddedNetworked Sensor Systems (SenSys ’10), pp. 367–368, Zurich,Switzerland, November 2010.
[17] P. Levis and D. Culler, “Mate: a tiny virtual machine for sensornetworks,” in Proceedings of the 10th International Conferenceon Architectural Support for Programming Languages and Oper-ating Systems (ASPLOS ’02), pp. 85–95, New York, NY, USA,October 2002.
[18] Y. Yu, L. J. Rittle, V. Bhandari, and J. B. LeBrun, “Supporting con-current applications inwireless sensor networks,” inProceedingsof the 4th International Conference on Embedded NetworkedSensor Systems (SenSys ’06), pp. 139–152, November 2006.
[19] N. M. Mosharaf, K. Chowdhury, M. R. Rahman, and R.Boutaba, “Virtual network embedding with coordinated nodeand link mapping,” in Proceedings of the IEEE 28th Conferenceon Computer Communications (INFOCOM ’09), pp. 783–791,April 2009.
[20] M. Chowdhury, M. R. Rahman, and R. Boutaba, “ViNEYard:virtual network embedding algorithms with coordinated nodeand linkmapping,” IEEE/ACMTransactions on Networking, vol.20, no. 1, pp. 206–219, 2012.
[21] A. H. Shuaib and A. H. Aghvami, “A routing scheme forthe IEEE-802.15.4-enabled wireless sensor networks,” IEEETransactions on Vehicular Technology, vol. 58, no. 9, pp. 5135–5151, 2009.
[22] J. D. C. Little and S. C. Graves, “‘Little’s Law’ , MassachusettsInstitute of Technology,” in Building Intuition: Insights FromBasic Operations Management Models and Principles, D. Chha-jed and T. J. Lowe, Eds., Springer Science, Business Media, LLC,2008.
[23] A. Papoulis and S. U. Pillai, Probability, Random Variables andStochastic Processes, McGraw-Hill, 4th edition, 2002.

Submit your manuscripts athttp://www.hindawi.com
VLSI Design
Hindawi Publishing Corporationhttp://www.hindawi.com Volume 2014
International Journal of
RotatingMachinery
Hindawi Publishing Corporationhttp://www.hindawi.com Volume 2014
Hindawi Publishing Corporation http://www.hindawi.com
Journal ofEngineeringVolume 2014
Hindawi Publishing Corporationhttp://www.hindawi.com Volume 2014
Shock and Vibration
Hindawi Publishing Corporationhttp://www.hindawi.com Volume 2014
Mechanical Engineering
Advances in
Hindawi Publishing Corporationhttp://www.hindawi.com Volume 2014
Civil EngineeringAdvances in
Advances inAcoustics &Vibration
Hindawi Publishing Corporationhttp://www.hindawi.com Volume 2014
Hindawi Publishing Corporationhttp://www.hindawi.com Volume 2014
Electrical and Computer Engineering
Journal of
Hindawi Publishing Corporationhttp://www.hindawi.com Volume 2014
DistributedSensor Networks
International Journal of
The Scientific World JournalHindawi Publishing Corporation http://www.hindawi.com Volume 2014
Hindawi Publishing Corporationhttp://www.hindawi.com Volume 2014
Journal of
Sensors
Modelling & Simulation in EngineeringHindawi Publishing Corporation http://www.hindawi.com Volume 2014
Hindawi Publishing Corporationhttp://www.hindawi.com Volume 2014
Active and Passive Electronic Components
Advances inOptoElectronics
Hindawi Publishing Corporation http://www.hindawi.com
Volume 2014
RoboticsJournal of
Hindawi Publishing Corporationhttp://www.hindawi.com Volume 2014
Chemical EngineeringInternational Journal of
Hindawi Publishing Corporationhttp://www.hindawi.com Volume 2014
Control Scienceand Engineering
Journal of
Hindawi Publishing Corporationhttp://www.hindawi.com Volume 2014
International Journal of
Antennas andPropagation
Hindawi Publishing Corporation http://www.hindawi.com Volume 2014
Hindawi Publishing Corporationhttp://www.hindawi.com Volume 2014
Navigation and Observation
International Journal of