Embed Size (px)
Citation preview
Novel Classification and Comparison of Mild and Severe Rheumatoid Arthritis
by
Reena Yaman
A thesis submitted in conformity with the requirements for the degree of Master of Science
Institute of Medical Science University of Toronto
© Copyright by Reena Yaman 2017
ii
Novel Classification and Comparison of Mild and Severe
Rheumatoid Arthritis
Reena Yaman
Master of Science
Institute of Medical Science University of Toronto
2017
Abstract
Rheumatoid arthritis (RA) presents in a highly variable fashion, with some patients not
responding to currently-available therapy and suffering from regularly active disease. Few
available markers currently exist to identify patients destined for severe disease, though there is
evidence of a genetic basis for these differences. The goal of this study is therefore to
investigate genetic RA risk loci and gene expression differences in patients presenting with mild
versus severe disease. Disease severity was defined based on number of biologic drug failures to
capture disease severity in a clinically relevant manner. Our findings suggest that these two
groups do in fact harbor genetic differences at RA risk loci, though these seem to depend on
serology as well. The Ly9-CD244 gene region presented with the most significant difference
between patient groups. These groups also demonstrated significantly different gene expression
profiles, though our findings are preliminary and require further investigation.

iii
Acknowledgments
I could not have reached the end of this rewarding journey on my own, and owe the following
individuals my deepest thanks for helping me get this far.
Firstly, I would like to thank my parents, for providing me with unwavering support, in all its
forms, and instilling in me a drive to constantly challenge myself and work hard to succeed. I
could not have accomplished this without you.
I would also like to thank my supervisor, Dr. Katherine Siminovitch, for believing in me and
providing me with numerous opportunities to expand my skills and knowledge base. I am
grateful for having had the great opportunity to study under your mentorship.
I would like to extend my sincere gratitude to my committee members, Dr. Keystone and Dr.
Branch, for their feedback, patience and support, without which this project would not have
been possible.
I would also like to thank my siblings, for always being there to help me work through the little
things and the constant motivation, support, and encouragement they continue to provide me
with. Additionally, I am deeply grateful for my friends, especially Soha and Pavit, for their
unwavering confidence in my abilities and their emotional support. I am also grateful for David,
for his constant encouragement, feedback, and guidance along the way.
I would like to acknowledge all of the members of the Siminovitch lab, for creating a
welcoming environment and always serving as valuable resources over the course of my degree.
I would like to express a warm thank you to all of the patients who took the time to participate
in the current study and for their vital contributions.
Finally, I further extend my thanks to the generous donors of the Eliot A Phillipson Department
of Medicine Studentship at Mount Sinai Hospital Eliot A Philipson and the Queen Elizabeth II
Graduate Scholarship in Science and Technology for their financial support of my graduate
work.
iv
Contributions
I would like to thank Gang Xie for developing the genotyping panel used in the current study
and his feedback on our results.
I would like to thank the Clinical Genomics Centre, specifically Swan Cot and Roger Shi, for
the genotyping and gene expression analyses, respectively.
I would also like to thank Ramanandan Prabhakaran for handling the bioinformatic analyses of
our gene expression data and creating Figures 3-3 to 3-5.
I would like to acknowledge the work of Robyn Chen Sang and Ilana Sutherland, our clinical
coordinators, for managing patient enrolment and blood draws, as well as assisting in obtaining
patient data.
I would like to express my thanks to Dr. Christopher Amos and his group, specifically David
Qian, for performing the PLINK analysis of our genotyping data.
Finally, I would like to thank Dr. Cynthia Guidos and her group for their assistance in
developing the mass cytometry panel that I hope will be utilized very soon as a future direction
for the current study.
v
Table of Contents
Acknowledgments................................................................................................................iii
Contributions........................................................................................................................iv
TableofContents..................................................................................................................v
ListofAbbreviations...........................................................................................................viii
ListofTables........................................................................................................................xiii
ListofFigures......................................................................................................................xv
ListofAppendices................................................................................................................xvi
Chapter1Introduction..........................................................................................................1
Introduction.....................................................................................................................11
1.1 RheumatoidArthritisOverview.............................................................................................1
1.2 Epidemiology........................................................................................................................1
1.3 ClinicalPresentation.............................................................................................................2
1.4 Diagnosis..............................................................................................................................2
1.5 EtiologyandPathogenesis.....................................................................................................4
1.5.1 GeneticRiskFactorsforRheumatoidArthritis......................................................................4
1.5.2 ImmuneSystemDysregulationinRheumatoidArthritis.....................................................11
1.6 TreatmentandTreatmentRecommendations.....................................................................13
1.6.1 Corticosteroids.....................................................................................................................14
1.6.2 Nonsteroidalanti-inflammatorydrugs................................................................................14
1.6.3 DiseaseModifyingAnti-RheumaticDrugs...........................................................................15
1.6.4 TreatmentRecommendations.............................................................................................20
1.7 PrognosticMarkersinRheumatoidArthritis........................................................................24
1.7.1 Biomarkers...........................................................................................................................24
1.7.2 DefiningSevereDiseaseinRheumatoidArthritis................................................................25
1.7.3 CurrentlyIdentifiedPrognosticMarkers.............................................................................27
1.8 Summary............................................................................................................................34
1.9 ResearchAimsAndHypotheses..........................................................................................35
vi
Chapter2MaterialsandMethods........................................................................................37
MaterialsandMethods..................................................................................................372
2.1 PatientRecruitmentandSampleCollection........................................................................37
2.2 ChartReviews.....................................................................................................................38
2.2.1 Self-reportedMeasuresofDiseaseActivityandDisability..................................................41
2.2.2 Physician’sMeasuresofDiseaseActivity.............................................................................41
2.2.3 SerologicalTestsforAcutePhaseReactants.......................................................................42
2.2.4 Treatment............................................................................................................................43
2.3 GroupAssignment..............................................................................................................45
2.4 Genotyping.........................................................................................................................46
2.5 RNA-sequencing..................................................................................................................48
2.6 StatisticalAnalysis...............................................................................................................49
2.6.1 Demographic&ClinicalData...............................................................................................49
2.6.2 GenotypingData..................................................................................................................49
2.6.3 RNA-seqData.......................................................................................................................49
Chapter3Results.................................................................................................................51
Results...........................................................................................................................513
3.1 ClinicalandDemographicData............................................................................................51
3.2 GenotypingData.................................................................................................................54
3.3 RNA-sequencingData..........................................................................................................61
Chapter4DiscussionandConclusions..................................................................................68
DiscussionandConclusions............................................................................................684
4.1 GeneralDiscussion..............................................................................................................68
4.1.1 ClinicalandDemographicFindings......................................................................................69
4.1.2 GeneticFindings...................................................................................................................71
4.1.3 GeneExpressionFindings....................................................................................................74
4.2 Conclusions.........................................................................................................................77
Chapter5FutureDirections.................................................................................................79
FutureDirections...........................................................................................................795
5.1 GeneralFutureDirections...................................................................................................79

vii
5.2 ImmunophenotypingbyMassCytometry............................................................................81
References...........................................................................................................................86
Appendices........................................................................................................................105
viii
List of Abbreviations
ACPA: anti-citrullinated peptide antibody
ACR: American College of Rheumatology
ADS: Assay Design Suite
ANCA: anti-neutrophil cytoplasmic antibody
APC: antigen presenting cell
Arg: arginine
AZA: azathioprine
bDMARD: biologic disease-modifying anti-rheumatic drug
CarP: carbamylated protein
CCP: circular citrullinated peptide
CCR6: C-C chemokine receptor 6
CD: cluster of differentiation
cDMARD: conventional disease-modifying antirheumatic drug
cDNA: complementary DNA
COBRA: Combinatietherapie Bij Reumatoide Artritis
COPD: chronic obstructive pulmonary disease
CRP: C-reactive protein
CTLA-4: cytotoxic T lymphocyte associated protein 4
CTX-II: Type II collagen c-telopeptide
ix
DAS28: disease activity score using the 28-joint count assessment method
ddNTP: dideoxynucleotide
DGE: differential gene expression
DMARD: disease-modifying antirheumatic drug
DNA: deoxyribonucleic acid
dNTP: deoxynucleotide
EDTA: ethylenediaminetetraacetic acid
ELISA: enzyme-linked immunosorbent assay
eQTL: expression quantitative trait loci
ESR: erythrocyte sedimentation rate
EULAR: European League Against Rheumatism
FDR: false discovery rate
FPKM: fragments per kilobase of transcript per million mapped reads
GC: glucocorticoid
GM-CSF: granulocyte macrophage colony-stimulating factor
GPA: granulomatosis with polyangiitis
GWAS: genome wide association study
HAQ: health assessment questionnaire
HAQ-DI: health assessment questionnaire disability index
HCQ: hydroxychloroquine
x
HLA: human leukocyte antigen
Ig: immunoglobulin
IL: interleukin
JAK: janus kinase
JIA: juvenile idiopathic arthritis
LD: linkage disequilibrium
LEF: leflunomide
Ly9: lymphocyte antigen 9
MALDI-TOF: matrix-assisted laser desorption/ionization time-of-flight
MD global: physician’s global assessment
MHCII: major histocompatibility complex class II
MMP: matrix metalloproteinase
MRI: magnetic resonance imaging
mRNA: messenger RNA
MTX: methotrexate
NF-κΒ: nuclear factor kappa beta
NSAID: nonsteroidal anti-inflammatory drug
OPG: osteoprotegrin
OR: odds ratio
PAD: peptidylarginine deiminase
xi
PADI4: peptidyl deaminases citrullinating enzyme 4
PCR: polymerase chain reaction
PTPN22: protein tyrosine phosphatase non-receptor type 22
qPCR: quantitative polymerase chain reaction
RA: rheumatoid arthritis
RANKL: ligand to receptor activator of nuclear factor-κB
RF: rheumatoid factor
RIN: RNA integrity number
SBE: single base extension
SE: shared epitope
SHS: Sharp/van der Heijde score
SJC: swollen joint count
SLAM: signaling lymphocytic activation molecule
SNP: single nucleotide polymorphism
SSZ: sulfasalazine
T2T: treat to target
TCR: T cell receptor
Th1: type 1 T helper
Th17: type 17 T helper
Th2: type 2 T helper
xii
TJC: tender joint count
TLR: toll-like receptor
TNF: tumor necrosis factor
TNFi: tumor necrosis factor inhibitors
TNFα: tumor necrosis factor α
Treg: regulatory T cell
Trp: tryptophan
USS: ultrasound scanning
VAS: visual analogue scale
xiii
List of Tables TABLE1-12010ACR/EULARRHEUMATOIDARTHRITISCLASSIFICATIONCRITERIA......................................................................3TABLE1-21987ACRRHEUMATOIDARTHRITISCLASSIFICATIONCRITERIA..................................................................................4TABLE1-3MOSTREPRODUCIBLERHEUMATOIDARTHRITISGENESANDGENETICRISKLOCI...............................................................8TABLE1-4RHEUMATOIDARTHRITISGENETICRISKLOCITHATHAVEBEENINVESTIGATEDFORFUNCTIONALINFLUENCEONTHEDISEASE.....9TABLE1-5MOSTCOMMONLYUSEDCONVENTIONALDMARDSINTHETREATMENTOFRHEUMATOIDARTHRITIS,THEIRMECHANISMSOF
ACTIONANDREPORTEDSIDEEFFECTS........................................................................................................................16TABLE1-6MOSTCOMMONLYUSEDBIOLOGICDMARDSINTHETREATMENTOFRHEUMATOIDARTHRITIS,THEIRMECHANISMSOFACTION
ANDREPORTEDSIDEEFFECTS...................................................................................................................................18TABLE1-7COMMONLYUSEDMEASURESFORTHECLASSIFICATIONOFSEVERERHEUMATOIDARTHRITISISPROGNOSTICSTUDIES...........26TABLE1-8BIOMARKERSIDENTIFIEDATBASELINE,DEFINEDASEARLYRA,TOASSOCIATEWITHRADIOLOGICALOUTCOMESINRHEUMATOID
ARTHRITIS............................................................................................................................................................29TABLE1-9GENETICBIOMARKERSFOUNDTOBEASSOCIATEDWITHPOORPROGNOSISINRHEUMATOIDARTHRITIS..............................32TABLE2-1CLINICALANDDEMOGRAPHICDATACOLLECTEDFORALLENROLLEDPATIENTS...............................................................39TABLE2-2COLLECTEDDRUGINFORMATIONCATEGORIESANDMOSTCOMMONLYPRESCRIBEDDRUGSINEACHGROUP.......................44TABLE2-3INCLUSIONCRITERIAFORMILDANDSEVEREGROUPS...............................................................................................45TABLE2-4RNA-SEQUENCINGCOMPARISONSPERFORMEDLISTINGGROUPSANDCOMPAREDSUBGROUPS,INCLUDINGNUMBEROF
PATIENTSINEACHGROUP.......................................................................................................................................50TABLE3-1CLINICALANDDEMOGRAPHICDATARESULTSSHOWINGAVERAGEAGEANDDISEASEDURATION,ASWELLASPERCENTOF
FEMALES,EVERSMOKERS,PATIENTSWITHFAMILYHISTORYOFRA,ANDPATIENTRF,ANTI-CCP,ANDEROSIONSTATUSINMILD
ANDSEVEREGROUPS(*P<0.05;**P<0.01)............................................................................................................53TABLE3-2ALLSIGNIFICANTSNPANALYSISRESULTSFORCOMPARISONOFTHEMILD(N=55)ANDSEVERE(N=34)GROUPS,INCLUDINGALL
ELIGIBLEPARTICIPANTS(P<0.05).............................................................................................................................55TABLE3-3ALLSIGNIFICANTSNPANALYSISRESULTSFORCOMPARISONOFMILD(N=42)ANDSEVERE(N=32)GROUPS,INCLUDINGONLY
RHEUMATOIDFACTORPOSITIVEELIGIBLEPARTICIPANTS(P<0.05)...................................................................................56TABLE3-4ALLSIGNIFICANTSNPANALYSISRESULTSFORCOMPARISONOFMILD(N=13)ANDSEVERE(N=2)GROUPS,INCLUDINGONLY
RHEUMATOIDFACTORNEGATIVEELIGIBLEPARTICIPANTS(P<0.05).................................................................................57TABLE3-5ALLSIGNIFICANTSNPANALYSISRESULTSFORCOMPARISONOFMILD(N=30)ANDSEVERE(N=24)GROUPS,INCLUDINGONLY
ANTI-CCPPOSITIVEELIGIBLEPARTICIPANTS(P<0.05)..................................................................................................58TABLE3-6ALLSIGNIFICANTSNPANALYSISRESULTSFORCOMPARISONOFMILD(N=22)ANDSEVERE(N=7)GROUPS,INCLUDINGONLY
ANTI-CCPNEGATIVEELIGIBLEPARTICIPANTS(P<0.05).................................................................................................59TABLE3-7ALLSIGNIFICANTSNPANALYSISRESULTSFORCOMPARISONOFMILD(N=37)ANDSEVERE(N=31)GROUPS,INCLUDINGONLY
ELIGIBLEPARTICIPANTSWITHEROSIVEDISEASE(P<0.05)..............................................................................................60TABLE3-8ALLSIGNIFICANTSNPANALYSISRESULTSFORCOMPARISONOFMILD(N=16)ANDSEVERE(N=2)GROUPS,INCLUDINGONLY
ELIGIBLEPARTICIPANTSWITHNON-EROSIVEDISEASE(P<0.05).......................................................................................61
xiv
TABLE3-9OVERVIEWOFFINDINGSFROMCOMPARISONOFACTIVEANDINACTIVESUBGROUPSOFMILDANDSEVEREPATIENT
POPULATIONS.......................................................................................................................................................66TABLE3-10OVERVIEWOFFINDINGSFROMCOMPARISONOFMILDANDSEVERESUBGROUPSOFACTIVEANDINACTIVEPATIENT
POPULATIONSATTIMEOFBLOODDRAW....................................................................................................................66TABLE5-1MASSCYTOMETRYPANELCONSISTINGOF35ANTIBODIES(27TARGETINGSURFACEANTIGENSAND8TARGETING
INTRACELLULARCYTOKINES)USEDFORTHEANALYSISOFDENSITYGRADIENT-SEPARATEDHUMANPBMCS..............................83TABLE5-2MASSCYTOMETRYCONSISTINGOF18ANTIBODIESTARGETINGSURFACEANTIGENS,INCLUDINGSURFACEMARKERSOF
NEUTROPHILACTIVATION,USEDFORTHEANALYSISOFLYSEDWHOLEBLOOD.....................................................................84
xv
List of Figures FIGURE1-1FLOWCHARTILLUSTRATINGTHESEQUENCEINWHICHRHEUMATOIDARTHRITISDMARDTHERAPYISESCALATEDIN
ACCORDANCEWITHTHE2015AMERICANCOLLEGEOFRHEUMATOLOGYMANAGEMENTGUIDELINES....................................22FIGURE2-1STUDYOVERVIEWOUTLININGGENERALSTUDYCOMPONENTSANDSTEPSEQUENCE.....................................................37FIGURE2-2DIAGRAMILLUSTRATINGTHESINGLEBASEEXTENSIONSTEPINSNPGENOTYPINGUSINGTHEAGENABIOSCIENCETMIPLEX®
ASSAYANDMASSARRAY®SYSTEMPCRAMPLIFICATIONPRODUCTSARECOMBINEDWITHMASS-MODIFIEDDIDEOXYNUCLEOTIDES,
WITHEACHNUCLEOTIDEHAVINGAUNIQUEANDDETECTABLEMASS.THEAMPLIFIEDGENOMICSEGMENTOFINTERESTISEXTENDED
BYASINGLEMASS-MODIFIEDDDNTPCORRESPONDINGTOTHEBASEPRESENTATTHESNPOFINTEREST.THERESULTINGSINGLE
BASEEXTENSIONPRODUCTSARETHENANALYZEDBYMALDI-TOFMASSSPECTROMETRYTODETERMINETHEALLELESCARRIEDAT
EACHSITEOFPOLYMORPHISM.................................................................................................................................47FIGURE3-1NUMBEROFPATIENTSINTHEMILDGROUPWITHLESSTHAN5,5-9,10-14,15-19,AND20ORMOREYEARSDISEASE
DURATION(ASOF2016)........................................................................................................................................52FIGURE3-2PERCENTOFPATIENTSINMILDANDSEVEREGROUPSTHATPRESENTEDWITHRFPOSITIVE,ANTI-CCPPOSITIVEANDEROSIVE
DISEASE(*P<0.05;**P<0.01)..............................................................................................................................54FIGURE3-3HEATMAPILLUSTRATING37SIGNIFICANTDIFFERENTIALLYEXPRESSEDGENESSHOWING≥3FOLDDIFFERENCEFROM
COMPARISONOFGENEEXPRESSIONDATAFROMACTIVEANDINACTIVEPATIENTSINTHEMILDGROUP(Q<0.05)......................63FIGURE3-4HEATMAPILLUSTRATING35SIGNIFICANTDIFFERENTIALLYEXPRESSEDGENESFROMCOMPARISONOFGENEEXPRESSIONDATA
FROMACTIVEANDINACTIVEPATIENTSINTHESEVEREGROUP(Q<0.05)...........................................................................64FIGURE3-5HEATMAPILLUSTRATING54SIGNIFICANTDIFFERENTIALLYEXPRESSEDGENESFROMCOMPARISONOFGENEEXPRESSIONDATA
FROMMILDANDSEVEREPATIENTSWITHINACTIVEDISEASEATTIMEOFBLOODDRAW(Q<0.05)...........................................65

xvi
List of Appendices APPENDIXTABLE1GENETICTARGETSINVESTIGATEDUSINGGENOTYPEDUSINGIPLEX®ASSAYANDMASSARRAY®SYSTEM.COLUMNS
OUTLINECHROMOSOME(CHR),SINGLENUCLEOTIDEPOLYMORPHISMOFINTEREST(SNP),WHETHERTHESNPISAPEAKSNPORA
LINKAGEDISEQUILIBRIUM(LD)SNP,R2VALUEFORLD,PREVIOUSLYIDENTIFIEDRARISKALLELE,GENEANDTHETARGETEDDNA
SEQUENCE.........................................................................................................................................................105
1
Chapter 1 Introduction
Introduction 1
1.1 Rheumatoid Arthritis Overview
Rheumatoid arthritis (RA) is a chronic systemic autoimmune disease that primarily affects the
joints, but can involve other organs as well (CentresforDiseaseControlandPrevention
2016). It is a form of autoimmune polyarthritis that affects joints symmetrically (Arnettetal.
1988) and is characterized by synovial membrane and systemic inflammation, as well as
synovial hyperplasia (Scott,Wolfe&Huizinga2010,Lee,Weinblatt2001). The presence of
autoantibodies, mainly rheumatoid factor (RF) and anti-citrullinated peptide antibodies
(ACPAs), is observed in many RA patients (Bax, Huizinga & Toes 2014). Patients typically
present with joint pain, redness and swelling (CentresforDiseaseControlandPrevention
2016). RA can affect any diarthrodial joint, but most commonly involves the small joints of the
hands and feet (Imboden2009). The joint autoimmune reaction leads to damage of articular
cartilage and bone (Scott,Wolfe&Huizinga2010), which can accumulate over time if
untreated (Wolfe,Sharp1998) leading to irreversible joint destruction and disability (Scott,
Wolfe&Huizinga2010,Lee,Weinblatt2001).
RA is associated with premature death as patient lifespan can be decreased by 3 to 10 years,
based on disease severity (Brooks2006,Alamanos,Drosos2005). Moreover, RA is associated
with disability and diminished quality of life (Brooks2006).
1.2 Epidemiology
The prevalence of RA in industrialized countries is 0.5-1 % with a mean incidence rate of 20-50
per 100,000 people per year. These statistics have been found to vary by ethnicity and
geographical location with lower prevalence in Southern European (0.3-0.7%) and developing
countries (0.1-0.5%) (Alamanos,Voulgari&Drosos2006). Furthermore, RA
2
disproportionately affects females and is seen 2 to 3 times more commonly in women than in
men (Alamanos,Drosos2005,SilmanAJ2001).
1.3 Clinical Presentation
RA can present at any age, but according to a review by Alamanos and Drosos, peak age of
onset is between 40 and 50 years of age (Alamanos, Drosos 2005).
Patients with RA commonly present with comorbidities with cardiovascular disease being the
most prevalent (Symmons,Gabriel2011,Dougadosetal.2014). Infections, mental health
conditions, and malignancies are additional comorbidities posing significant risks for RA
patients. As reviewed by Dougados et al., many of these conditions can result from treatment,
shared risk factors, or the chronic inflammation characteristic of RA (Symmons,Gabriel2011,
Dougadosetal.2014).
1.4 Diagnosis
RA is currently diagnosed based on the 2010 American College of Rheumatology (ACR)/
European League Against Rheumatism (EULAR) classification criteria, which take into
consideration the number of active joints, symptom duration, as well as serological and acute-
phase reactant factors. Patients’ disease is scored on these four domains, and a cumulative score
of 6/10 or above is required for classification and diagnosis of RA. Prior to 2010 ACR/ EULAR
classification criteria, the 1987 ACR criteria were used for RA diagnosis, however they lacked
the sensitivity to identify early RA and thus early intervention to prevent permanent damage
(Aletahaetal.2010,Arnettetal.1988,Neogietal.2010). Both the 2010 and 1987
classification criteria measures are outlined in Tables 1-1 and 1-2 below for comparison.
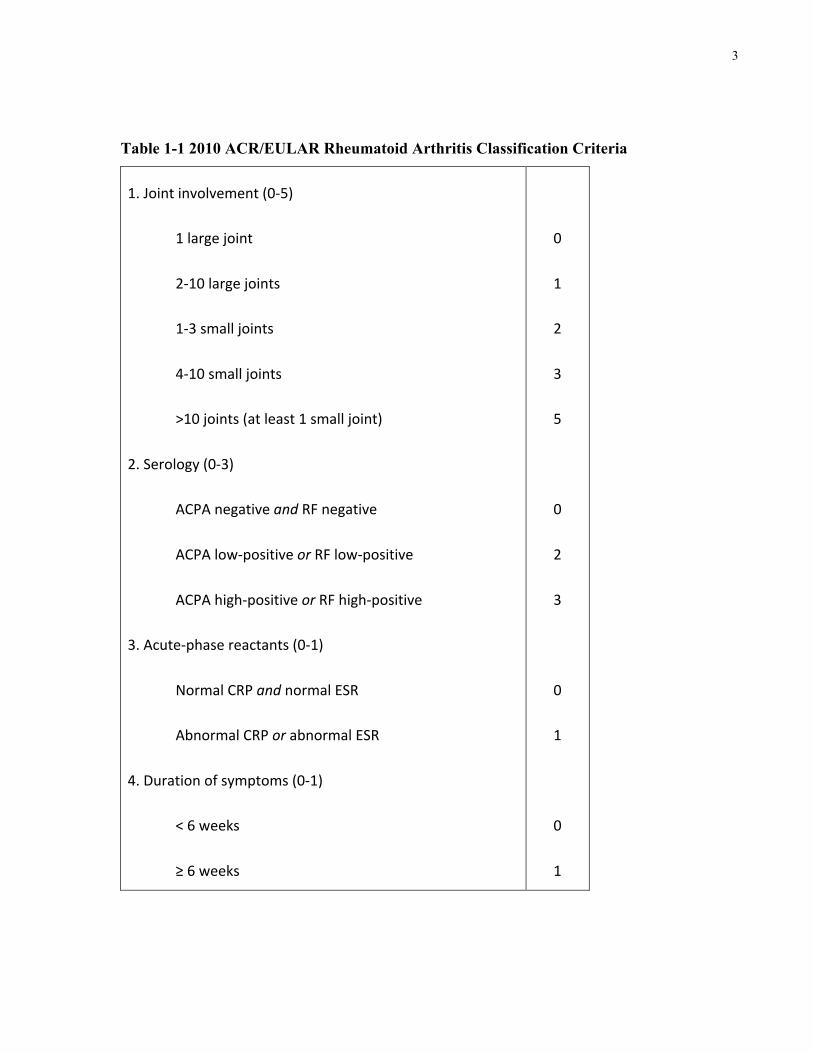
According to the 2010 ACR/EULAR Classification Criteria, patients who have at least 1 joint
with definite swelling that cannot be attributed to another disease and score ≥6 out of 10 on the
criteria shown in Table 1-1 are classified as having RA. Each criterion is further described in
the original 1988 article (Aletahaetal.2010).
3
Table 1-1 2010 ACR/EULAR Rheumatoid Arthritis Classification Criteria
1.Jointinvolvement(0-5)
1largejoint
2-10largejoints
1-3smalljoints
4-10smalljoints
>10joints(atleast1smalljoint)
2.Serology(0-3)
ACPAnegativeandRFnegative
ACPAlow-positiveorRFlow-positive
ACPAhigh-positiveorRFhigh-positive
3.Acute-phasereactants(0-1)
NormalCRPandnormalESR
AbnormalCRPorabnormalESR
4.Durationofsymptoms(0-1)
<6weeks
≥6weeks
0
1
2
3
5
0
2
3
0
1
0
1
4
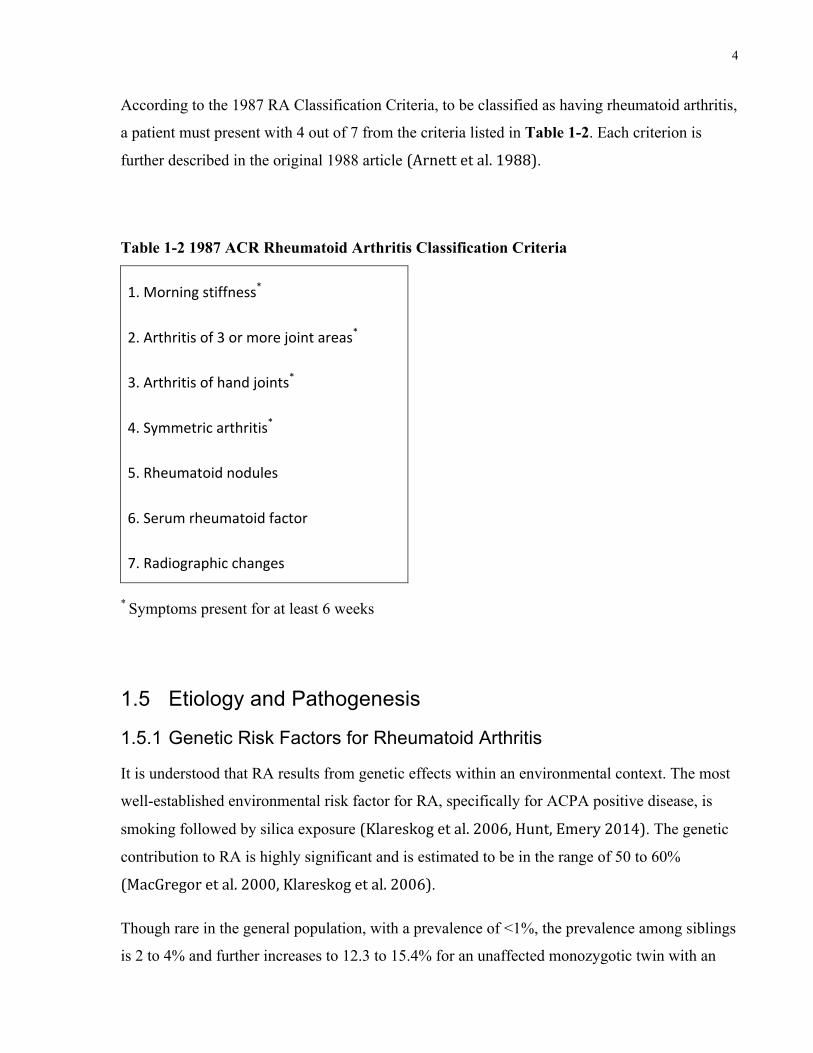
According to the 1987 RA Classification Criteria, to be classified as having rheumatoid arthritis,
a patient must present with 4 out of 7 from the criteria listed in Table 1-2. Each criterion is
further described in the original 1988 article (Arnettetal.1988).
Table 1-2 1987 ACR Rheumatoid Arthritis Classification Criteria
1.Morningstiffness*
2.Arthritisof3ormorejointareas*
3.Arthritisofhandjoints*
4.Symmetricarthritis*
5.Rheumatoidnodules
6.Serumrheumatoidfactor
7.Radiographicchanges
* Symptoms present for at least 6 weeks
1.5 Etiology and Pathogenesis
1.5.1 Genetic Risk Factors for Rheumatoid Arthritis
It is understood that RA results from genetic effects within an environmental context. The most
well-established environmental risk factor for RA, specifically for ACPA positive disease, is
smoking followed by silica exposure (Klareskogetal.2006,Hunt,Emery2014). The genetic
contribution to RA is highly significant and is estimated to be in the range of 50 to 60%
(MacGregoretal.2000,Klareskogetal.2006).
Though rare in the general population, with a prevalence of <1%, the prevalence among siblings
is 2 to 4% and further increases to 12.3 to 15.4% for an unaffected monozygotic twin with an
5
affected twin, although smaller studies have reported higher twin concordance (Seldinetal.
1999). Concordance rates are dependent on disease prevalence, however, with rates being lower
for diseases of lower prevalence, and can therefore underestimate actual genetic contribution to
the disease. To address this limitation, MacGregor et al. conducted a study aimed at identifying
RA heritability estimates (measures of genetic contribution that are independent of population
prevalence) using twin data from nationwide Finnish and United Kingdom studies. This study
reported a genetic contribution of ~60%, emphasizing the significant role of genetics in RA
(MacGregor et al. 2000).
The most strongly associated genetic factors with the development of RA (accounting for 30 to
50% of genetic risk) are located in the human leukocyte antigen (HLA) alleles (Bowes,Barton
2008,Imboden2009). The shared epitope (SE) hypothesis, which posits that a shared major
histocompatibility complex class II (MHCII) epitope contributes to RA pathogenesis, resulted
from the observation that several alleles of the HLA-DRB1 gene, which code for a specific
conserved 5 amino acid sequence around the peptide-binding groove served as RA risk alleles
(Gregersen,Silver&Winchester1987,Viatte,Plant&Raychaudhuri2013). HLA-DR
proteins are expressed on antigen presenting cells (APCs) and serve to present antigens to T
cells, which identify a portion of the HLA-DR molecule as well as the presented peptide. The
SE motif is located in the HLA-DR peptide-binding groove and therefore affects both peptide
binding and antigen presentation (Gregersen,Silver&Winchester1987,Huizingaetal.
2005). Though the SE hypothesis alone cannot explain the risk conferred by these alleles, HLA-
DRB1 is likely linked to pathogenesis through other mechanisms. As reviewed by Coenen et al.,
these associations are largely applicable to only anti-CCP positive subsets of RA patients
(Coenen,Gregersen2009).
Candidate gene studies later permitted the identification of additional susceptibility loci such as
PTPN22, PADI4, and CTLA-4 (Begovichetal.2004,Suzukietal.2003,Plengeetal.2005).
Genome wide association study (GWAS) technology, however, was crucial in identifying non-
HLA loci and novel genetic risk factors are discovered at an astounding rate (Coenen,
Gregersen2009). GWAS investigate the association of gene variants with the disease. As is
seen in other complex diseases, variant associations tend to have odds ratios (ORs) that are not
greater than 1.5, suggesting that each individual allele makes only a small contribution to overall
6
genetic disease risk (Stahletal.2010,Raychaudhurietal.2008). A single nucleotide
polymorphism (SNP) is a common variation in a single deoxyribonucleic acid (DNA) subunit,
called a nucleotide, at a specific genomic location. A GWAS compares cases (i.e. patients) to
controls (i.e. unaffected individuals) and genotypes approximately 1 million SNPs. The genome-
wide significance level α is usually set to 5 × 10⁻⁸ and rejection of the null hypothesis is
considered to indicate the presence of disease-associated variants at that genomic location
(Kochi,Suzuki&Yamamoto2014). Thus, a GWAS makes it possible to conclude that a single
nucleotide variation at a specific genomic location can increase the risk of developing a disease,
RA in this case, with a 0.000005% chance that a difference between the patient and control
groups does not in fact exist.
Though the majority of SNPs are considered to produce no functional change, mutations in
promoter, enhancer, or silencer regions can lead to altered gene transcription. Those in locus
control regions or those that affect messenger RNA (mRNA) stability can alter gene expression
(Chanock2007). Specific variants can cause disease by affecting genetic function through
various mechanisms. These are briefly described below:
• A silent mutation, also known as a synonymous mutation, is a mutation in which the
base pair change does not alter the coded amino acid and therefore does not change the
sequence of amino acids in the coded protein. These have been reported to alter mRNA
stability, however (Chanock2007).
• A nonsense mutation is one where the base pair change leads to the replacement of an
amino acid coding sequence with one coding a stop codon leading to the production of a
truncated protein.
• A frame-shift mutation results from the insertion, duplication, or deletion leading to a
shift in the reading frame resulting in a different amino acid sequence and commonly a
non-functional protein.
• A missense mutation is one where the base pair change leads to the replacement of an
amino acid with another in the protein coded by the gene.
• Alternative splicing mutations occur in regions coding for splicing patterns and can lead
to alternative splicing of the coded protein.
7
• Mutations altering the level of transcript expression occur in regions responsible for
regulating RNA expression and can alter these levels. Expression quantitative trait loci
(eQTL) are genomic regions containing variants that control levels of expression of one
or more genes. eQTLs can be located close to the genes whose expression they regulate
or at a different genomic location, referred to as local or cis and distant or trans eQTLs,
respectively.
As reviewed by Kochi et al. of the 100 known non-HLA risk loci, the majority affect splicing or
transcript expression, with only 16% being in linkage disequilibrium (LD) with missense SNPs
(Kochi,Suzuki&Yamamoto2014).
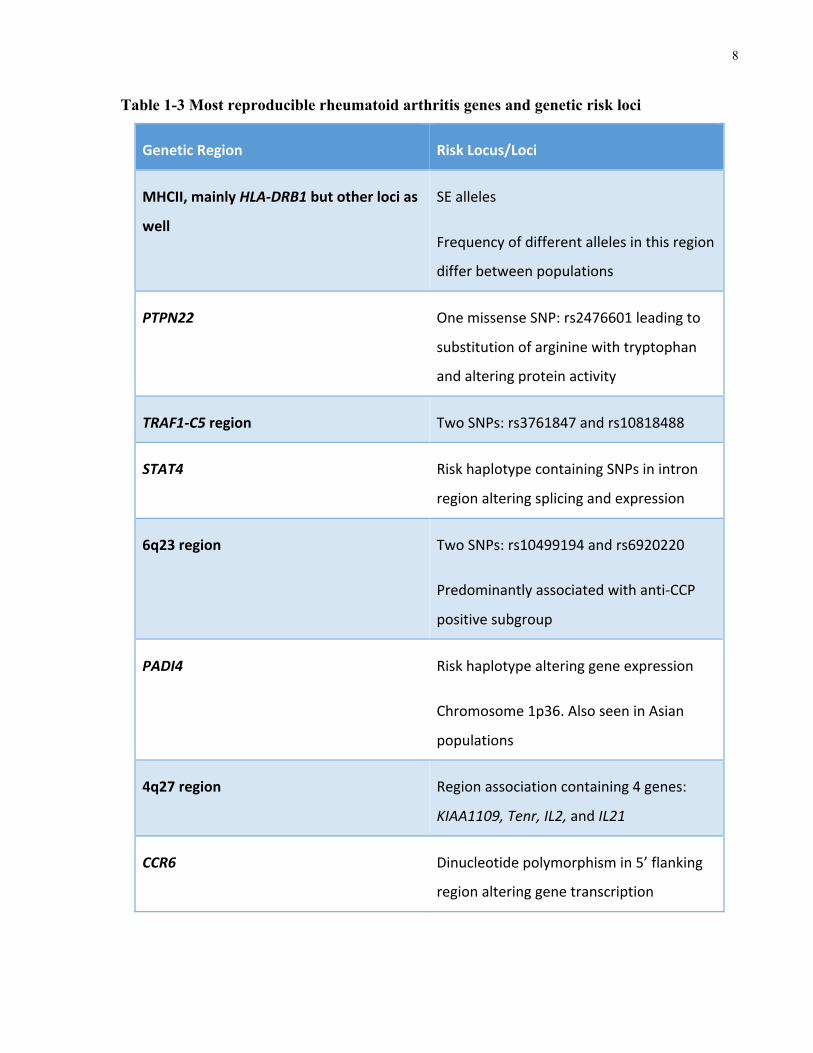
The most reproducible genetic associations with RA, as reviewed by Coenen et al. and Kochi et
al., are listed in Table 1-3 (Coenen,Gregersen2009,Kochi,Suzuki&Yamamoto2014).
After the MHCII loci, PTPN22 shows both the strongest and most reproducible association to
the disease (Coenen,Gregersen2009). SNP rs2476601 at amino acid 620 leads to the
replacement of arginine (Arg) with tryptophan (Trp)(Coenen,Gregersen2009). This risk
allele has been found to be associated with numerous other autoimmune diseases. Additionally,
the minor allele (A) is much more prevalent in European and North American populations. After
PTPN22, the TRAF1-C5 region of the genome seems to have considerable association with RA
and shows a greater association for the anti-CCP positive patient subgroup.
8
Table 1-3 Most reproducible rheumatoid arthritis genes and genetic risk loci
GeneticRegion RiskLocus/Loci
MHCII,mainlyHLA-DRB1butotherlocias
well
SEalleles
Frequencyofdifferentallelesinthisregion
differbetweenpopulations
PTPN22
OnemissenseSNP:rs2476601leadingto
substitutionofargininewithtryptophan
andalteringproteinactivity
TRAF1-C5region TwoSNPs:rs3761847andrs10818488
STAT4 RiskhaplotypecontainingSNPsinintron
regionalteringsplicingandexpression
6q23region TwoSNPs:rs10499194andrs6920220
Predominantlyassociatedwithanti-CCP
positivesubgroup
PADI4
Riskhaplotypealteringgeneexpression
Chromosome1p36.AlsoseeninAsian
populations
4q27region Regionassociationcontaining4genes:
KIAA1109,Tenr,IL2,andIL21
CCR6 Dinucleotidepolymorphismin5’flanking
regionalteringgenetranscription
9
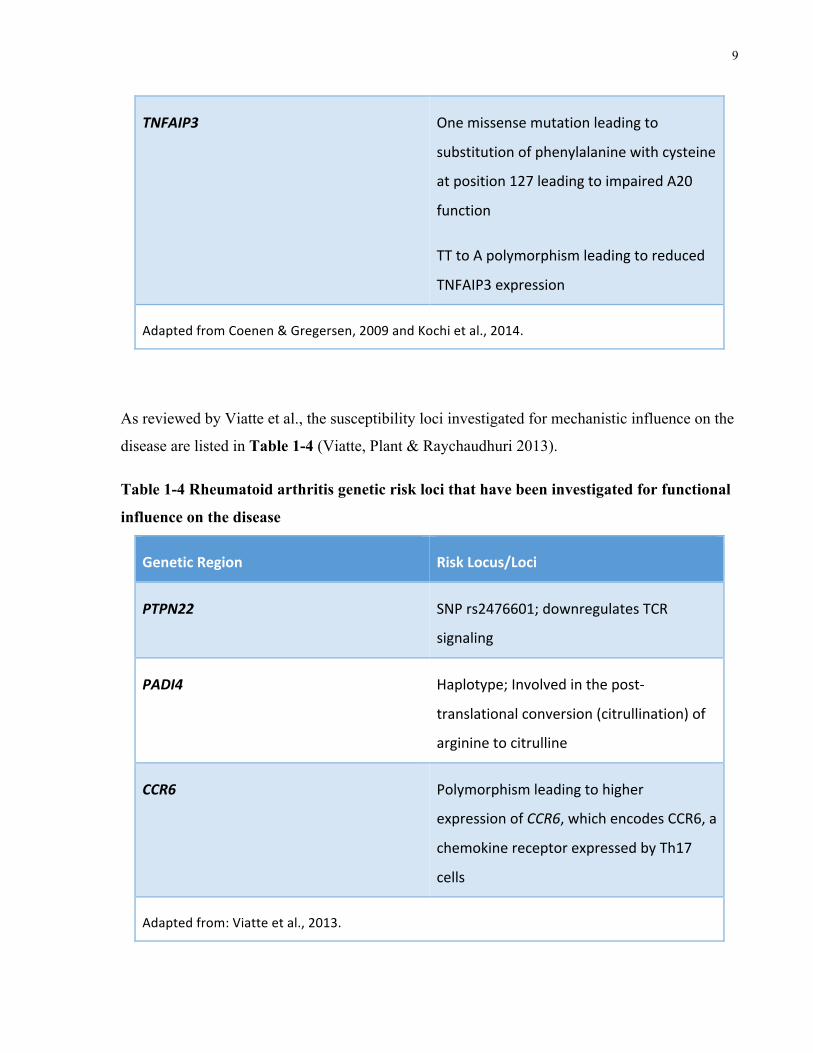
TNFAIP3 Onemissensemutationleadingto
substitutionofphenylalaninewithcysteine
atposition127leadingtoimpairedA20
function
TTtoApolymorphismleadingtoreduced
TNFAIP3expression
AdaptedfromCoenen&Gregersen,2009andKochietal.,2014.
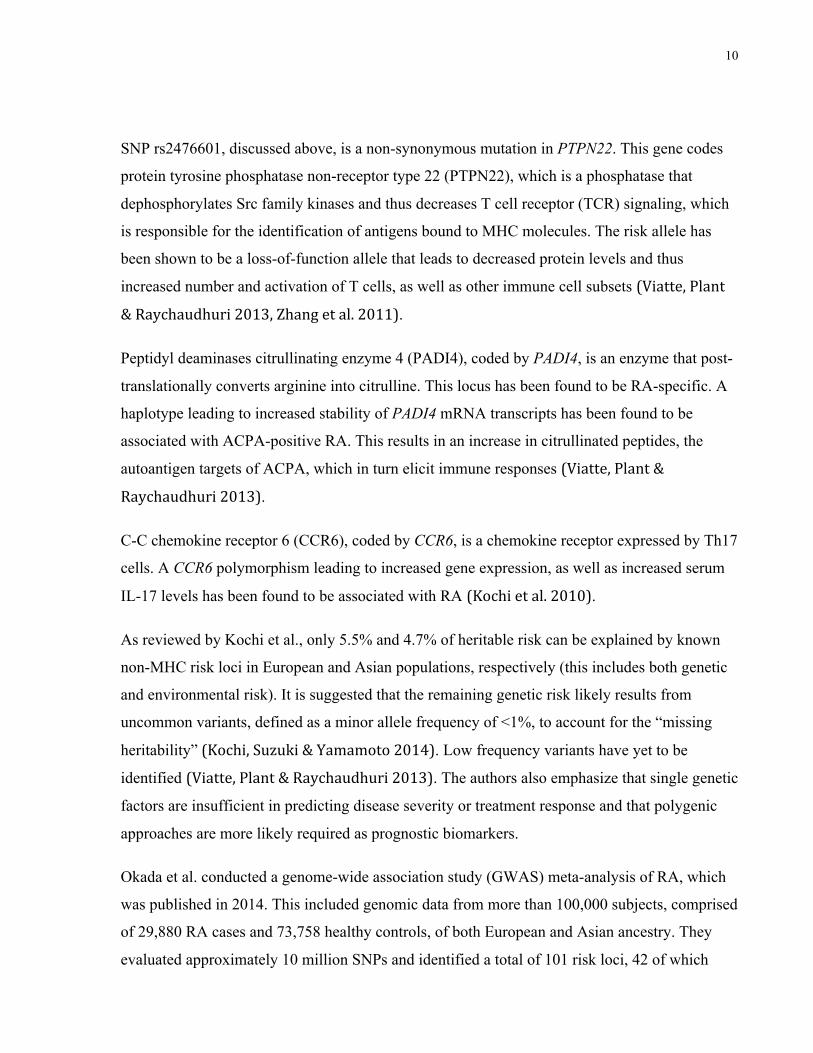
As reviewed by Viatte et al., the susceptibility loci investigated for mechanistic influence on the
disease are listed in Table 1-4 (Viatte, Plant & Raychaudhuri 2013).
Table 1-4 Rheumatoid arthritis genetic risk loci that have been investigated for functional
influence on the disease
GeneticRegion RiskLocus/Loci
PTPN22 SNPrs2476601;downregulatesTCR
signaling
PADI4 Haplotype;Involvedinthepost-
translationalconversion(citrullination)of
argininetocitrulline
CCR6 Polymorphismleadingtohigher
expressionofCCR6,whichencodesCCR6,a
chemokinereceptorexpressedbyTh17
cells
Adaptedfrom:Viatteetal.,2013.
10
SNP rs2476601, discussed above, is a non-synonymous mutation in PTPN22. This gene codes
protein tyrosine phosphatase non-receptor type 22 (PTPN22), which is a phosphatase that
dephosphorylates Src family kinases and thus decreases T cell receptor (TCR) signaling, which
is responsible for the identification of antigens bound to MHC molecules. The risk allele has
been shown to be a loss-of-function allele that leads to decreased protein levels and thus
increased number and activation of T cells, as well as other immune cell subsets (Viatte,Plant
&Raychaudhuri2013,Zhangetal.2011).
Peptidyl deaminases citrullinating enzyme 4 (PADI4), coded by PADI4, is an enzyme that post-
translationally converts arginine into citrulline. This locus has been found to be RA-specific. A
haplotype leading to increased stability of PADI4 mRNA transcripts has been found to be
associated with ACPA-positive RA. This results in an increase in citrullinated peptides, the
autoantigen targets of ACPA, which in turn elicit immune responses (Viatte,Plant&
Raychaudhuri2013).
C-C chemokine receptor 6 (CCR6), coded by CCR6, is a chemokine receptor expressed by Th17
cells. A CCR6 polymorphism leading to increased gene expression, as well as increased serum
IL-17 levels has been found to be associated with RA (Kochietal.2010).
As reviewed by Kochi et al., only 5.5% and 4.7% of heritable risk can be explained by known
non-MHC risk loci in European and Asian populations, respectively (this includes both genetic
and environmental risk). It is suggested that the remaining genetic risk likely results from
uncommon variants, defined as a minor allele frequency of <1%, to account for the “missing
heritability”(Kochi,Suzuki&Yamamoto2014). Low frequency variants have yet to be
identified (Viatte,Plant&Raychaudhuri2013). The authors also emphasize that single genetic
factors are insufficient in predicting disease severity or treatment response and that polygenic
approaches are more likely required as prognostic biomarkers.
Okada et al. conducted a genome-wide association study (GWAS) meta-analysis of RA, which
was published in 2014. This included genomic data from more than 100,000 subjects, comprised
of 29,880 RA cases and 73,758 healthy controls, of both European and Asian ancestry. They
evaluated approximately 10 million SNPs and identified a total of 101 risk loci, 42 of which
11
were novel associations with the disease. They further demonstrated that the genes identified are
targeted by currently approved RA treatments and that other genes may point to drugs used to
treat other diseases, such as cancer, which could potentially be repurposed for use in RA based
on these findings.
1.5.2 Immune System Dysregulation in Rheumatoid Arthritis
Though the exact mechanisms underlying the development of RA remain poorly understood,
both adaptive and innate immune responses have been implicated in disease pathogenesis
(McInnes,Leung&Liew2000,Behrensetal.2007,Edwardsetal.2004,Takemuraetal.
2001,Brennan,McInnes2008,McInnes,Schett2011). Immune cell subsets in combination
with non-immune cell subsets such as fibroblasts and endothelial cells have all been discovered
to play a role in disease etiology (Mohammed,Smookler&Khokha2003,Meyer,Franssen&
Pap2006,AngusMcQuibbanetal.2002). These different immune components and their links
to RA are briefly described below.
1.5.2.1 T cell Involvement
A shift toward a pro-inflammatory type 1 T helper (Th1) versus an anti-inflammatory type 2 T
helper (Th2) response, and the associated cytokines, has been observed in RA patients
(McInnes,Leung&Liew2000,Cañeteetal.2000,Schulze-Koops,Kalden2001).
Furthermore, Th17 cells are implicated in the production of inflammatory cytokines (IL-17 and
TNF-α) leading to the activation of other immune cell subtypes including neutrophils and
monocytes, as well as synovial fibroblasts (Weaveretal.2007,Miossec,Korn&Kuchroo
2009). Additionally, dysfunction in T regulatory cells (Tregs), which reduce inflammation, has
also been demonstrated in RA (Chabaudetal.1999,Ehrensteinetal.2004).
12
1.5.2.2 Antibody and B cell Involvement
Antibodies serve as defense molecules that target specific pathogenic antigens, neutralize
pathogens, and activate the immune response. The production of antibodies targeting self-
tissues, referred to as autoantibodies, is seen in certain autoimmune diseases and can lead to
tissue damage. The presence of autoantibodies in the serum of RA patients has been well
documented. RF, a group of autoantibodies targeting the Fc portion of human immunoglobulin
G (IgG), was the first to be described in 1957, and is observed at high serum levels in 80% of
RA patients (Franklinetal.1957,McArdleetal.2015).
ACPAs, which target epitopes resulting from the deimination of charged arginine residues to
produce neutral citrulline, were more recently discovered and show higher disease specificity.
Diagnostic tools developed to test patient serum for ACPA use a circular citrullinated peptide
(CCP)-2 enzyme-linked immunosorbent assay (ELISA), which allows for the detection of
antibodies directed against circular citrullinated peptide (anti-CCP). Both RF and anti-CCP tests
have been incorporated into clinical practice as well as current diagnostic criteria for RA(Bax,
Huizinga&Toes2014,Aletahaetal.2010). Importantly, ACPAs have been found to bind to
osteoclasts, inducing osteoclastgenesis and breakdown of bone leading to the observed joint
damage (Harreetal.2012). Furthermore, they can activate the immune system through
complement pathways and interaction with Fc-receptor expressing cells, further demonstrating
the pathogenic potential of these autoantibodies (Trouwetal.2009,Claveletal.2008,Bax,
Huizinga&Toes2014).
Several other autoantibodies with different target epitopes have since been identified. Anti-
carbamylated protein (CarP) antibodies, which target epitopes resulting from the carbamylation
of lysine residues to produce homocitrulline, have been discovered. These have also been shown
to be present in both ACPA-positive and a substantial (16-30%) proportion of ACPA-negative
patients (Shietal.2011). Additionally, anti-peptidylarginine deiminase (PAD) antibodies
targeting PAD enzymes, which are responsible for protein citrullination, have been identified
and demonstrated to activate their enzyme target as well (Darrahetal.2013).
Moreover, the pathogenic link to autoantibody production by plasmablasts and, more recently,
the observed treatment response to Rituximab, a B cell depletion therapy, further implicate B
cells in the etiology of RA (McInnes,Leung&Liew2000,Seyleretal.2005).
13
1.5.2.3 Cytokine and Other Immune Cell Involvement
Studies also demonstrate fibroblast invasion of cartilage (Müller-Ladneretal.1996) and
osteoclast activation leading to erosion of bone (Cohenetal.2008) in RA patients, suggesting a
role in disease development and progression. Toll-like receptor (TLR) responses in innate
immune cell subsets, including macrophages and dendritic cells, also appear to be involved.
Additionally, cytokine production by innate immune cell subsets leads to neovascularization,
hyperplasia and other inflammatory reactions resulting in cartilage and bone damage and
destruction (Woolley2003,Haringmanetal.2005,Cascãoetal.2010,Foell,Wittkowski&
Roth2007,Goh,Midwood2012,Nigrovic,Lee2007,Hueberetal.2010). Several cytokines
associated with disease pathogenesis have been identified over the years, some of which are
targets of currently-available treatments (discussed in more detail below). TNF, IL-1, and IL-6
and affiliated pathways form the main treatment targets for currently existing biologic drugs
approved for use in the treatment of RA. IL-12, IL-23, IL-15, GM-CSF, IL-17, and IL-18 have
also been investigated as potential targets for future therapies. A useful summary of cytokines
and their role in disease pathogenesis has been published by McInnes et al.(McInnes,Schett
2007).
RA is also thought to be a heterogeneous condition with a number of different
pathophysiologies with similar clinical presentations (vanderHelm-vanMil,Huizinga2008).
It is thus clearly evident that RA is a complex disease with multifactorial etiology and a
tremendous interplay of many components of the immune system contributing to disease
pathogenesis.
1.6 Treatment and Treatment Recommendations
RA patient outcomes have significantly improved in past years. Numerous developments have
aided in this, including an emphasis on early diagnosis and treatment, the development of
reliable assessment tools, and the understanding that treatment can serve to slow or stop disease
progression. The central role of methotrexate (MTX) in treating disease, and the advent of a new
14
class of biologic disease-modifying antirheumatic drugs (bDMARDs or biologics) have
significantly contributed to this medical breakthrough. The mainstay of current RA treatment is
therefore immunosuppression and involves the use of combinations of corticosteroids,
nonsteroidal anti-inflammatory drugs (NSAIDs) and disease-modifying antirheumatic drugs
(DMARDS) (Smolen et al. 2016, Negrei et al. 2016).
1.6.1 Corticosteroids
Corticosteroids, also referred to as glucocorticoids (GCs), are hormones that bind to GC
receptors and inhibit cytokine transcription and inflammatory responses through genomic and
non-genomic effects (Negrei et al. 2016). These lead to rapid symptom relief and, in
combination with DMARD therapy, have been shown to be effective in preventing joint damage
in early RA.
Corticosteroid use, however, has numerous side effects including weight gain, heart failure,
hypertension, diabetes, myopathy, peptic ulcers, infections, sleep and mood disturbances, as
well as osteoporosis. It is therefore recommended that corticosteroids be used sparingly and then
tapered and stopped to prevent adverse events associated with their long-term use.
1.6.2 Nonsteroidal anti-inflammatory drugs
Nonsteroidal anti-inflammatory drugs (NSAIDs) reduce prostaglandin production and inhibit
cyclooxygenases 1 and 2. These are very commonly used for symptom relief to control pain and
inflammation. They have been shown to be ineffective in preventing joint damage, however, and
are thus used in combination with other drug categories in the treatment of RA. NSAID use is
associated with mainly gastrointestinal side effects, including peptic ulcer disease. However
their long-term use can lead to adverse cardiovascular and renal outcomes, with higher patient
morbidity and mortality (Negrei et al. 2016, Harirforoosh, Jamali 2009).
15
1.6.3 Disease Modifying Anti-Rheumatic Drugs
Disease Modifying Anti-Rheumatic Drugs (DMARDs) act on the immune system to prevent or
slow disease progression, and thus protect joints from destruction. DMARDs can be placed into
one of two categories: conventional DMARDs (cDMARDs) and biologic DMARDs
(bDMARDs) (Arthritis Research UK 2016).
1.6.3.1 Conventional DMARDs
Conventional DMARDs, cDMARDs or DMARDs as they are referred to in ACR RA Treatment
Recommendations, are synthetic molecules that target and reduce inflammation in a general
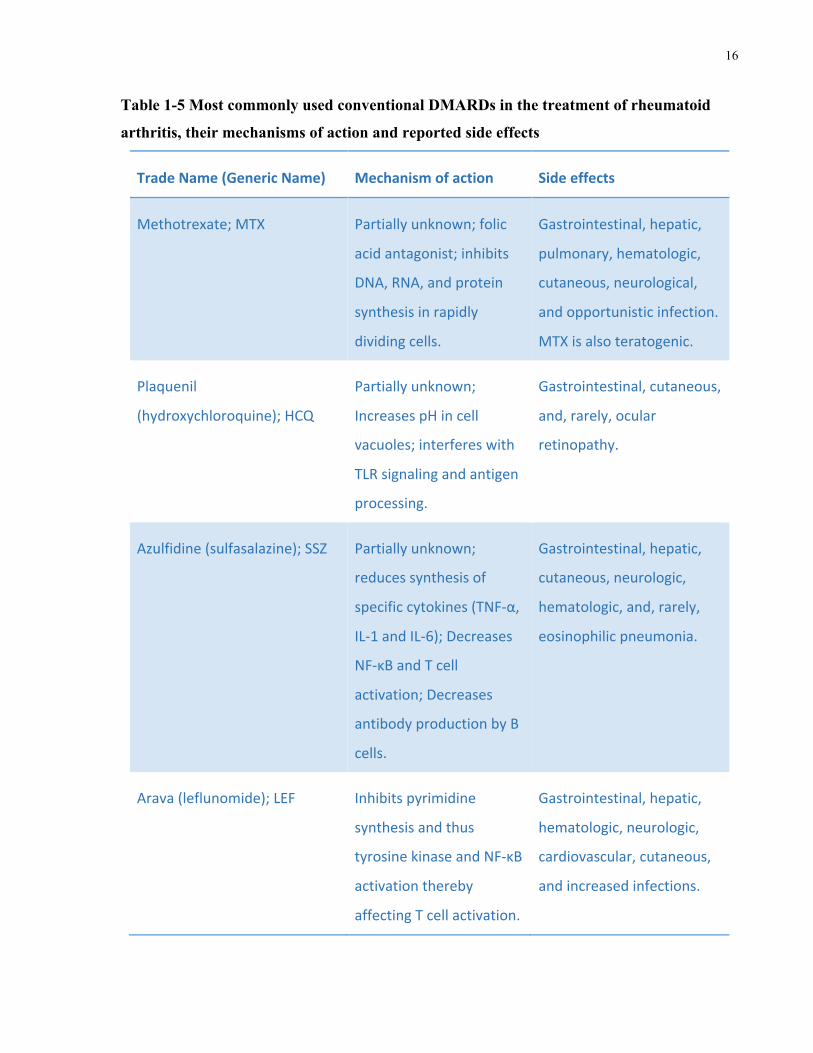
fashion (Vaz et al. 2009, Singh et al. 2016). Table 1-5 shows conventional DMARDs, their
mechanisms of action and their most common side effects.
16
Table 1-5 Most commonly used conventional DMARDs in the treatment of rheumatoid
arthritis, their mechanisms of action and reported side effects
TradeName(GenericName) Mechanismofaction Sideeffects
Methotrexate;MTX Partiallyunknown;folic
acidantagonist;inhibits
DNA,RNA,andprotein
synthesisinrapidly
dividingcells.
Gastrointestinal,hepatic,
pulmonary,hematologic,
cutaneous,neurological,
andopportunisticinfection.
MTXisalsoteratogenic.
Plaquenil
(hydroxychloroquine);HCQ
Partiallyunknown;
IncreasespHincell
vacuoles;interfereswith
TLRsignalingandantigen
processing.
Gastrointestinal,cutaneous,
and,rarely,ocular
retinopathy.
Azulfidine(sulfasalazine);SSZ Partiallyunknown;
reducessynthesisof
specificcytokines(TNF-α,
IL-1andIL-6);Decreases
NF-κΒandTcell
activation;Decreases
antibodyproductionbyB
cells.
Gastrointestinal,hepatic,
cutaneous,neurologic,
hematologic,and,rarely,
eosinophilicpneumonia.
Arava(leflunomide);LEF Inhibitspyrimidine
synthesisandthus
tyrosinekinaseandNF-κΒ
activationthereby
affectingTcellactivation.
Gastrointestinal,hepatic,
hematologic,neurologic,
cardiovascular,cutaneous,
andincreasedinfections.
17
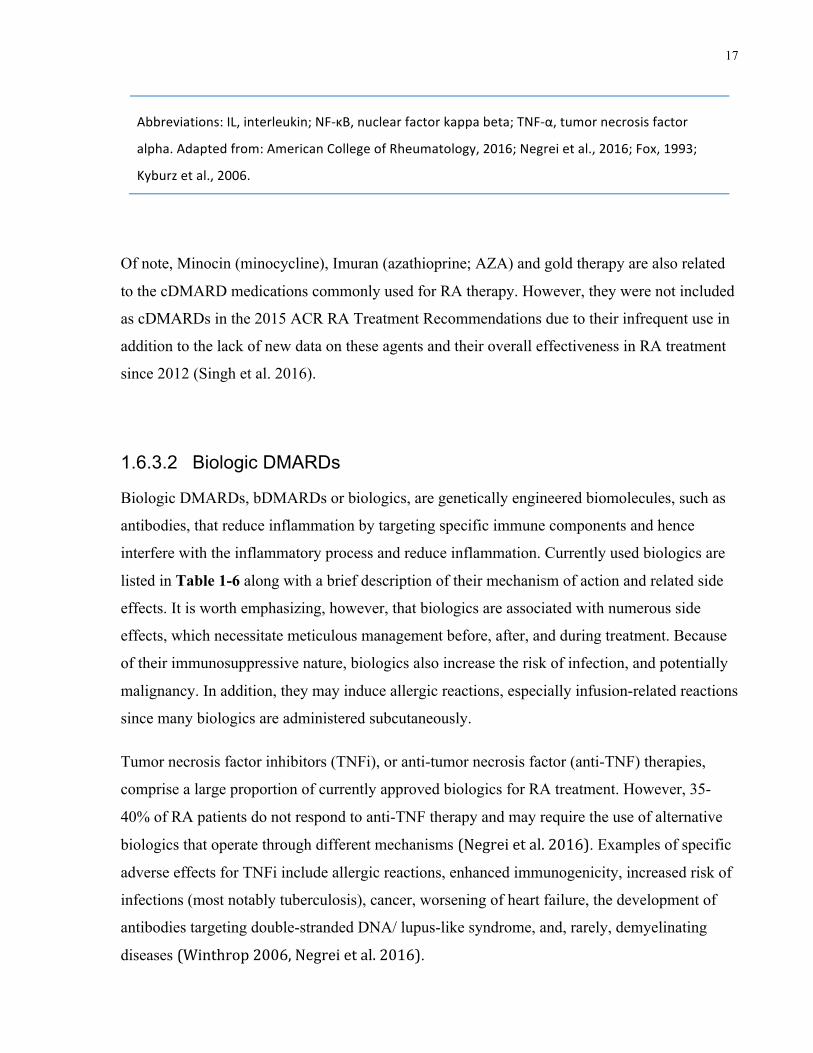
Abbreviations:IL,interleukin;NF-κΒ,nuclearfactorkappabeta;TNF-α,tumornecrosisfactor
alpha.Adaptedfrom:AmericanCollegeofRheumatology,2016;Negreietal.,2016;Fox,1993;
Kyburzetal.,2006.
Of note, Minocin (minocycline), Imuran (azathioprine; AZA) and gold therapy are also related
to the cDMARD medications commonly used for RA therapy. However, they were not included
as cDMARDs in the 2015 ACR RA Treatment Recommendations due to their infrequent use in
addition to the lack of new data on these agents and their overall effectiveness in RA treatment
since 2012 (Singh et al. 2016).
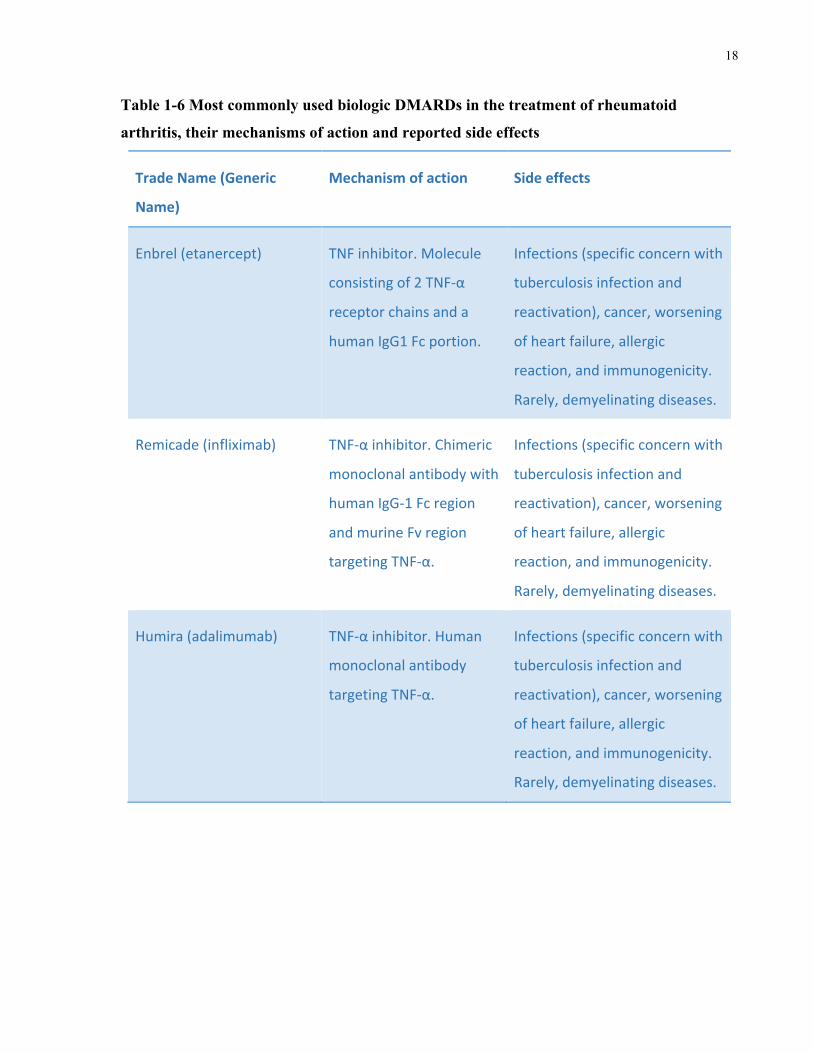
1.6.3.2 Biologic DMARDs
Biologic DMARDs, bDMARDs or biologics, are genetically engineered biomolecules, such as
antibodies, that reduce inflammation by targeting specific immune components and hence
interfere with the inflammatory process and reduce inflammation. Currently used biologics are
listed in Table 1-6 along with a brief description of their mechanism of action and related side
effects. It is worth emphasizing, however, that biologics are associated with numerous side
effects, which necessitate meticulous management before, after, and during treatment. Because
of their immunosuppressive nature, biologics also increase the risk of infection, and potentially
malignancy. In addition, they may induce allergic reactions, especially infusion-related reactions
since many biologics are administered subcutaneously.
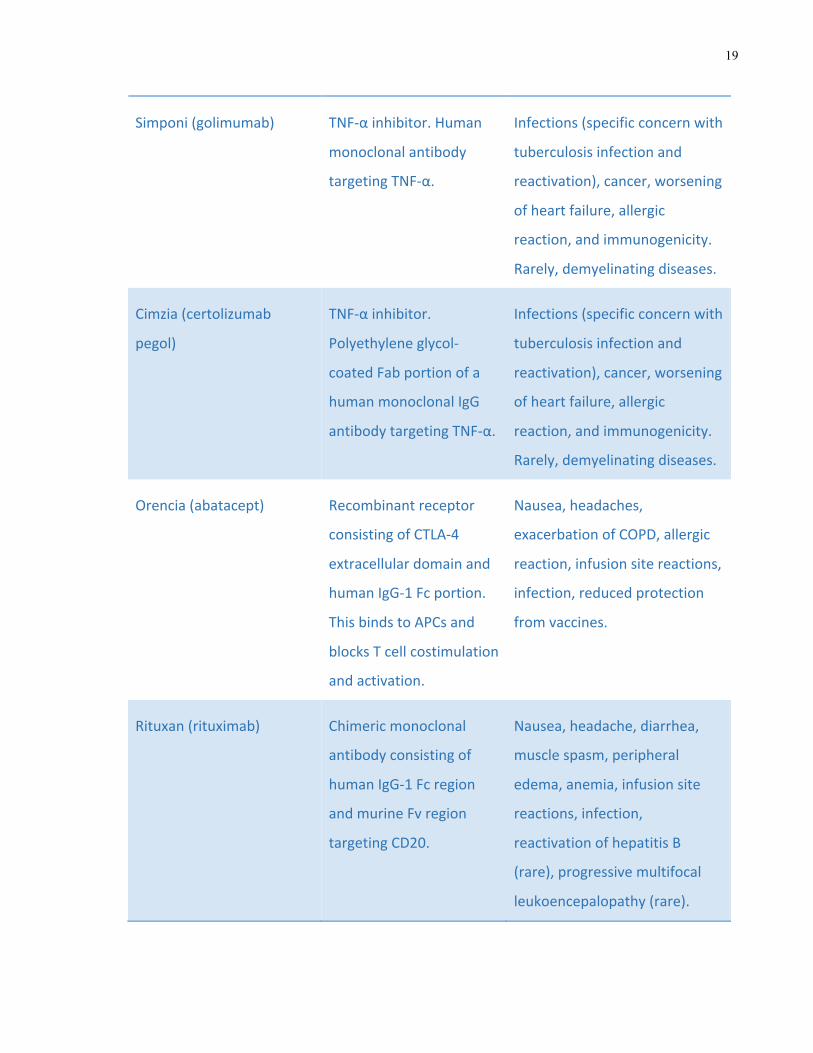
Tumor necrosis factor inhibitors (TNFi), or anti-tumor necrosis factor (anti-TNF) therapies,
comprise a large proportion of currently approved biologics for RA treatment. However, 35-
40% of RA patients do not respond to anti-TNF therapy and may require the use of alternative
biologics that operate through different mechanisms (Negreietal.2016). Examples of specific
adverse effects for TNFi include allergic reactions, enhanced immunogenicity, increased risk of
infections (most notably tuberculosis), cancer, worsening of heart failure, the development of
antibodies targeting double-stranded DNA/ lupus-like syndrome, and, rarely, demyelinating
diseases (Winthrop2006,Negreietal.2016).
18
Table 1-6 Most commonly used biologic DMARDs in the treatment of rheumatoid
arthritis, their mechanisms of action and reported side effects
TradeName(Generic
Name)
Mechanismofaction Sideeffects
Enbrel(etanercept) TNFinhibitor.Molecule
consistingof2TNF-α
receptorchainsanda
humanIgG1Fcportion.
Infections(specificconcernwith
tuberculosisinfectionand
reactivation),cancer,worsening
ofheartfailure,allergic
reaction,andimmunogenicity.
Rarely,demyelinatingdiseases.
Remicade(infliximab) TNF-αinhibitor.Chimeric
monoclonalantibodywith
humanIgG-1Fcregion
andmurineFvregion
targetingTNF-α.
Infections(specificconcernwith
tuberculosisinfectionand
reactivation),cancer,worsening
ofheartfailure,allergic
reaction,andimmunogenicity.
Rarely,demyelinatingdiseases.
Humira(adalimumab) TNF-αinhibitor.Human
monoclonalantibody
targetingTNF-α.
Infections(specificconcernwith
tuberculosisinfectionand
reactivation),cancer,worsening
ofheartfailure,allergic
reaction,andimmunogenicity.
Rarely,demyelinatingdiseases.
19
Simponi(golimumab) TNF-αinhibitor.Human
monoclonalantibody
targetingTNF-α.
Infections(specificconcernwith
tuberculosisinfectionand
reactivation),cancer,worsening
ofheartfailure,allergic
reaction,andimmunogenicity.
Rarely,demyelinatingdiseases.
Cimzia(certolizumab
pegol)
TNF-αinhibitor.
Polyethyleneglycol-
coatedFabportionofa
humanmonoclonalIgG
antibodytargetingTNF-α.
Infections(specificconcernwith
tuberculosisinfectionand
reactivation),cancer,worsening
ofheartfailure,allergic
reaction,andimmunogenicity.
Rarely,demyelinatingdiseases.
Orencia(abatacept) Recombinantreceptor
consistingofCTLA-4
extracellulardomainand
humanIgG-1Fcportion.
ThisbindstoAPCsand
blocksTcellcostimulation
andactivation.
Nausea,headaches,
exacerbationofCOPD,allergic
reaction,infusionsitereactions,
infection,reducedprotection
fromvaccines.
Rituxan(rituximab) Chimericmonoclonal
antibodyconsistingof
humanIgG-1Fcregion
andmurineFvregion
targetingCD20.
Nausea,headache,diarrhea,
musclespasm,peripheral
edema,anemia,infusionsite
reactions,infection,
reactivationofhepatitisB
(rare),progressivemultifocal
leukoencepalopathy(rare).
20
Actemra(tocilizumab) IgG-1monoclonal
antibodytargetingIL-6
receptor.
Headache,nasopharyngitis,
infusionsitereactions,
infection,hypertension,
increasedalanine
aminotransferase,diverticulitis,
dyslipidemia,hepaticenzyme
levelincrease.
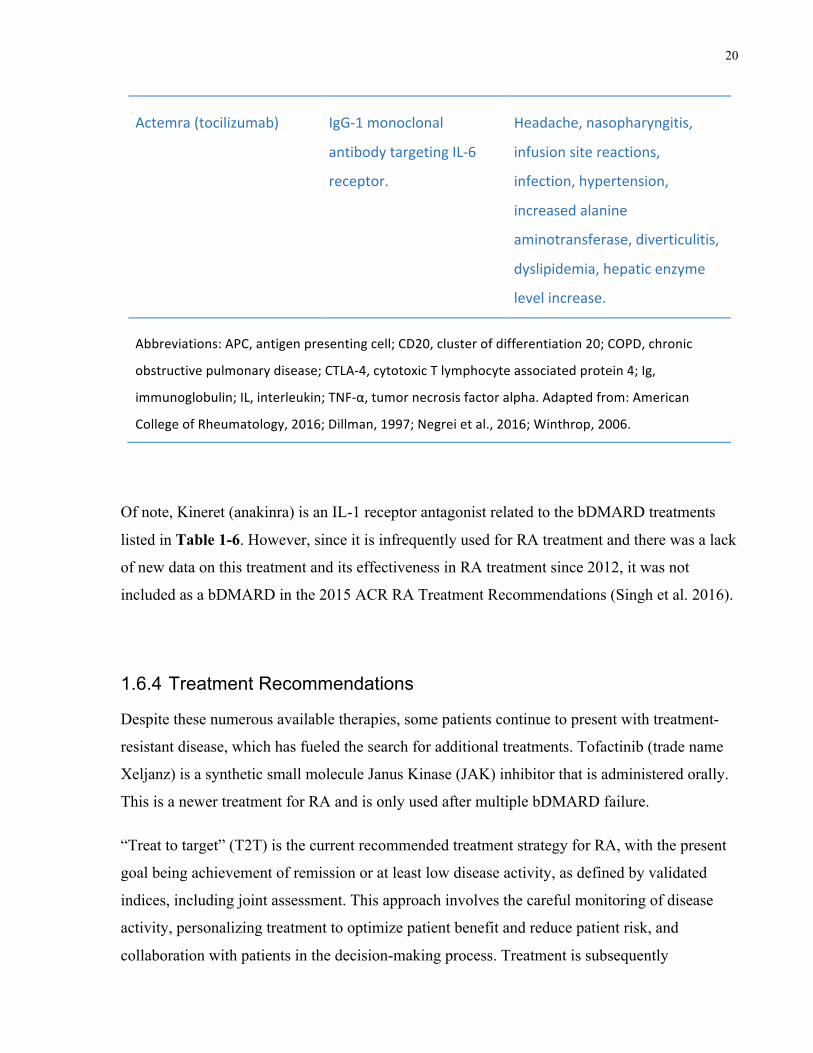
Abbreviations:APC,antigenpresentingcell;CD20,clusterofdifferentiation20;COPD,chronic
obstructivepulmonarydisease;CTLA-4,cytotoxicTlymphocyteassociatedprotein4;Ig,
immunoglobulin;IL,interleukin;TNF-α,tumornecrosisfactoralpha.Adaptedfrom:American
CollegeofRheumatology,2016;Dillman,1997;Negreietal.,2016;Winthrop,2006.
Of note, Kineret (anakinra) is an IL-1 receptor antagonist related to the bDMARD treatments
listed in Table 1-6. However, since it is infrequently used for RA treatment and there was a lack
of new data on this treatment and its effectiveness in RA treatment since 2012, it was not
included as a bDMARD in the 2015 ACR RA Treatment Recommendations (Singh et al. 2016).
1.6.4 Treatment Recommendations
Despite these numerous available therapies, some patients continue to present with treatment-
resistant disease, which has fueled the search for additional treatments. Tofactinib (trade name
Xeljanz) is a synthetic small molecule Janus Kinase (JAK) inhibitor that is administered orally.
This is a newer treatment for RA and is only used after multiple bDMARD failure.
“Treat to target” (T2T) is the current recommended treatment strategy for RA, with the present
goal being achievement of remission or at least low disease activity, as defined by validated
indices, including joint assessment. This approach involves the careful monitoring of disease
activity, personalizing treatment to optimize patient benefit and reduce patient risk, and
collaboration with patients in the decision-making process. Treatment is subsequently
21
reassessed and adjusted accordingly in order to achieve treatment goals and optimize patient
outcomes (Smolenetal.2016,Smolen2016).
In order to incorporate recent knowledge advances into patient treatment and care, the ACR
published the 2015 RA management guidelines, which were preceded by the 2012 guideline,
which in turn was preceded by the 2008 guideline (Singhetal.2016,Singhetal.2012,Saaget
al.2008). These guidelines were developed as a result of systematic reviews and the
collaboration of multidisciplinary teams of experts aimed at optimizing disease management and
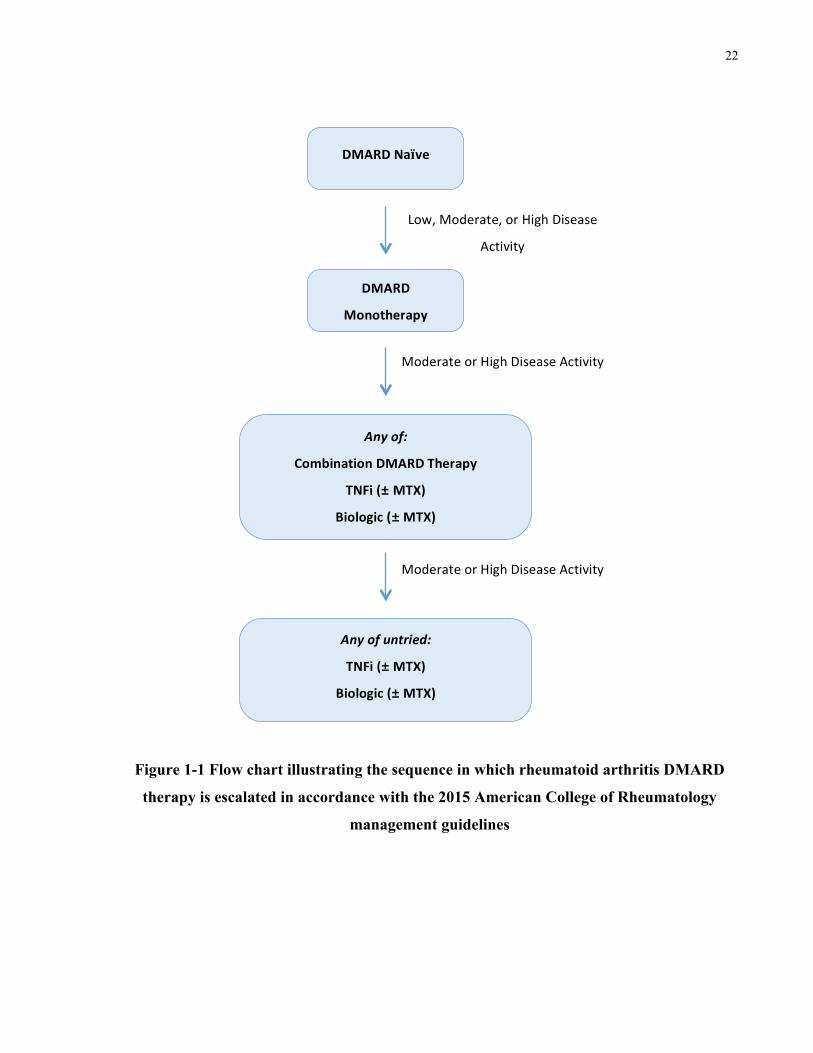
maximizing patient benefit. Figure 1-1 Provides a general overview of the sequence in which
treatments are escalated based on persistent moderate or high disease activity in accordance with
the 2015 ACR management guidelines.
22
Figure 1-1 Flow chart illustrating the sequence in which rheumatoid arthritis DMARD
therapy is escalated in accordance with the 2015 American College of Rheumatology
management guidelines
DMARDNaïve
DMARD
Monotherapy
Anyof:
CombinationDMARDTherapy
TNFi(±MTX)
Biologic(±MTX)
Anyofuntried:
TNFi(±MTX)
Biologic(±MTX)
Tofactinib(±MTX)
Low,Moderate,orHighDisease
Activity
ModerateorHighDiseaseActivity
ModerateorHighDiseaseActivity
23
The current treatment recommendations, based on the 2015 ACR management guidelines, are
summarized below.
• For patients naïve to DMARD therapy, cDMARD monotherapy (preferably MTX) is
recommended. Whereas, for patients who continue to experience moderate or high
disease activity despite cDMARD monotherapy, recommendations suggest any of the
following steps:
o Use of a combination of cDMARDs
o Addition of biologic or tofactinib, with or without MTX
• For those who fail to respond to treatment using a single TNFi, it is recommended they
continue onto another form of TNFi or be placed on a non-TNFi biologic, with or
without MTX
• For those who fail to respond to non-TNFi biologic treatment, it is recommended they be
placed on another non-TNFi biologic, with or without MTX
• For those who have failed TNFi and non-TNFi treatment, it is recommended they be
placed on another non-TNFi biologic or tofactinib, with or without MTX
• For those who have been placed on and failed multiple TNFi biologic treatments, it is
recommended they be switched to non-TNFi biologic therapy or tofactinib, with or
without MTX and then to another non-TNFi biologic or tofactinib, with or without
MTX, if their first switch does not lead to response to treatment
• For TNFi naïve patients who have failed multiple non-TNFi biologic therapies, it is
recommended they be placed on TNFi biologic treatment, with or without MTX.
• For those who are not TNFi naïve and have failed multiple non-TNFi biologic therapies,
it is recommended they be placed on tofactinib, with or without MTX
As described in Figure 1-1, for patients demonstrating resistance to cDMARD therapy,
biologics are usually prescribed either alone or in combination with cDMARDs in an attempt to
induce remission.
However it appears that compliance with guidelines is not universal. Garrood et al. conducted a
study in 2011 to investigate United Kingdom rheumatologists’ compliance with National
24
Institute for Health and Clinical Excellence treatment guidelines. They surveyed 258
rheumatologists and found that aggressive treatment was not used for newly diagnosed patients,
despite guideline suggestions. Rheumatologists indicated that the main reasons for not
prescribing aggressive treatment were patient acceptance, monitoring requirements, and
concerns about treatment side effects (Garrood,Shattles&Scott2011). Furthermore, a review
by Scott et al. suggests that economic, medical, and social costs need to be weighed against
effectiveness of treatment when considering treatment choices for patients with RA (Scott,
Wolfe&Huizinga2010). More importantly, there is an additional limitation to RA disease
management: the limited availability of biomarkers to enable prediction of a particular patient’s
disease course and hence the best-suited treatment strategy for their disease.
1.7 Prognostic Markers in Rheumatoid Arthritis
1.7.1 Biomarkers
Biomarkers are measurable biomolecules that can be used to indicate specific pathological
processes, such as disease activity, prognosis, and treatment response. Their role is very
important in RA, given the highly unpredictable nature of the disease itself, its variable response
to treatment, and the wide range of available treatment choices to induce remission. Optimal
treatment is of particular importance due to the high costs and potential toxicities of the
therapies used to manage the disease. More importantly, it is clearly established that early,
aggressive treatment can serve to prevent permanent joint damage, attenuate disability and
improve overall patient prognosis; hence the significance of selecting the correct agent and also
determining the appropriate timing for treatment initiation. It is therefore evident that
biomarkers can have great therapeutic value in allowing the provision of timely and
personalized treatment and care for RA patients (Eastmanetal.2012,Gibsonetal.2012).
Despite their significance, there are currently few available such biomarkers for prediction of
disease flares or the personalization of treatment. Furthermore, up to 40% of patients show
resistance to treatment and those who do respond may not experience complete reduction in
disease activity and symptoms. Finally, not all RA patients develop a severe form of the disease
that requires aggressive treatment (McArdleetal.2015,Plantetal.2011).
25
Importantly, there have been no clinically useful biomarkers identified that can predict patient
prognosis, and the nature of the disease does not lend itself to discovery of one single marker. A
panel consisting of various biomarkers therefore seems more feasible to aid in differentiating
patients destined to more aggressive disease courses with worse prognosis. The concepts of
actionable biomarkers that signify potential treatment target pathways, as well as mechanistic
biomarkers, which reflect disease pathogenesis, are interesting directions for future study (Mc
Ardleetal.2015,Eastmanetal.2012,Robinsonetal.2013,Gibsonetal.2012).
1.7.2 Defining Severe Disease in Rheumatoid Arthritis
As reviewed by Scott et al., severe RA is much more poorly defined than its counterpart, RA
remission. In their review, Scott et al. describe four criteria used to define severe RA, which
encompass radiological measures, physician assessment, and self-reported patient assessment
(Scottetal.2013).
The most commonly used measure of disease activity in RA is the Disease Activity Score using
the 28-joint count assessment method (DAS28). It is a measure of disease activity calculated
using number of swollen and tender joints (out of 28 joints), erythrocyte sedimentation rate
(ESR), and RA activity self-reported visual analogue scale (VAS) score. It is limited to
assessment at only one time point, however, and does not take into account erosions, extra-
articular manifestations, and disability. Furthermore, it requires a calculator or computer to tally
the score and assigns heavy weighting to ESR (Anderson et al. 2011).
The Health Assessment Questionnaire Disability Index (HAQ-DI) is another commonly used
measure. It is a self-reported measure of disability calculated based on functional assessment.
The main limitation of this scale is that it is an indirect measure of disease severity, which relies
on subjective patient reporting.
Radiological measures, on the other hand, focus on joint damage. The Sharp/van der Heijde
Score (SHS) is one such measure that evaluates erosions in 44 joints and joint-space narrowing
in 42 joints. The Scott Modification of the Larsen Method is another measure of radiological
damage that examines erosions and joint destruction in hands, wrists, and feet. Limitations of
such methods are their inability to consider factors other than joint damage and the reliance on
26
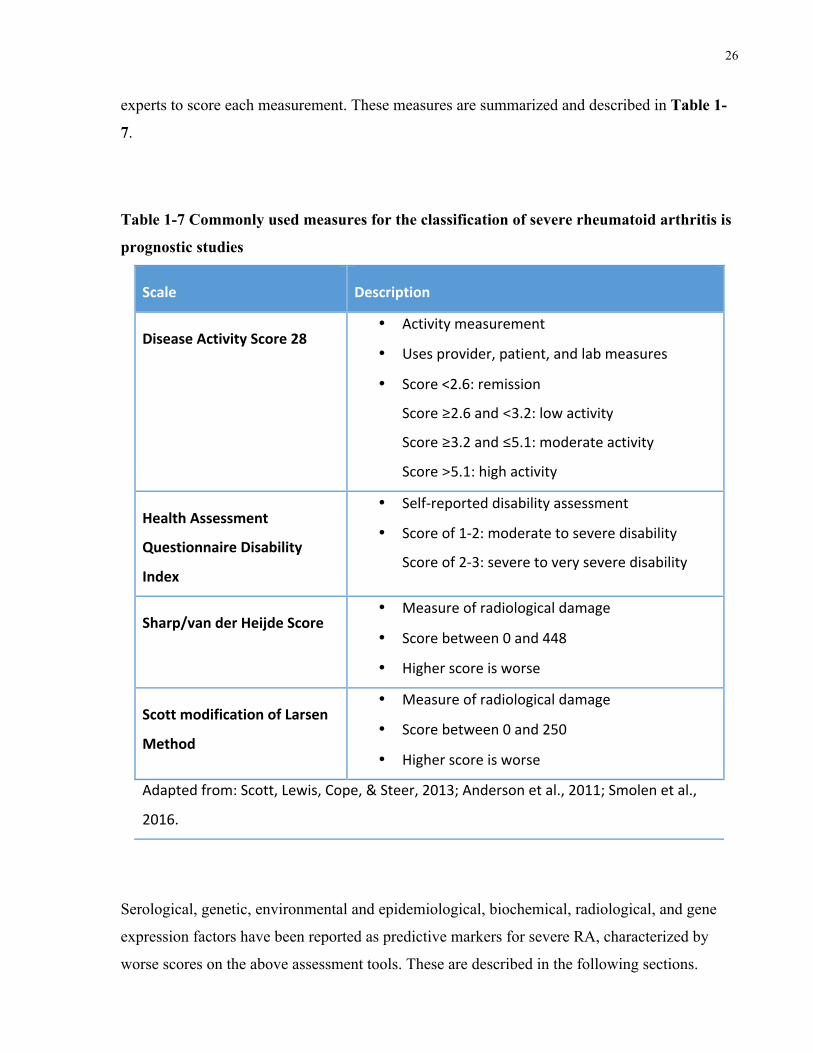
experts to score each measurement. These measures are summarized and described in Table 1-
7.
Table 1-7 Commonly used measures for the classification of severe rheumatoid arthritis is
prognostic studies
Scale Description
DiseaseActivityScore28• Activitymeasurement
• Usesprovider,patient,andlabmeasures
• Score<2.6:remission
Score≥2.6and<3.2:lowactivity
Score≥3.2and≤5.1:moderateactivity
Score>5.1:highactivity
HealthAssessment
QuestionnaireDisability
Index
• Self-reporteddisabilityassessment
• Scoreof1-2:moderatetoseveredisability
Scoreof2-3:severetoveryseveredisability
Sharp/vanderHeijdeScore• Measureofradiologicaldamage
• Scorebetween0and448
• Higherscoreisworse
ScottmodificationofLarsen
Method
• Measureofradiologicaldamage
• Scorebetween0and250
• Higherscoreisworse
Adaptedfrom:Scott,Lewis,Cope,&Steer,2013;Andersonetal.,2011;Smolenetal.,
2016.
Serological, genetic, environmental and epidemiological, biochemical, radiological, and gene
expression factors have been reported as predictive markers for severe RA, characterized by
worse scores on the above assessment tools. These are described in the following sections.
27
1.7.3 Currently Identified Prognostic Markers
1.7.3.1 Serological
Historically, RA patients could be differentiated based on presence of RF in their serum. Higher
rates of extra-articular manifestations and joint damage are associated with RF positive disease.
Furthermore the IgA isotype has been associated with worse outcomes than IgM and IgG RF
(Scottetal.2013).
However, the predictive power of RF for disease development is limited by its lack of
specificity to RA. Furthermore, the usefulness of RF as a prognostic marker is negatively
associated with disease progression (Syversenetal.2008,Nelletal.2005).
More recently, ACPA, a more specific autoantibody to RA, has been used to subcategorize RA
patients with those testing positive for anti-CCP having more aggressive disease (Robinsonet
al.2013). ACPA presence has been found to be a predictor of joint damage (Lindqvistetal.
2005) appears prior to disease onset, is stable over time, and has demonstrated prognostic value
(Forslindetal.2004,Kastbometal.2004,Rönnelidetal.2005).
1.7.3.2 Environmental and Epidemiological
In addition to being a risk factor for seropositive RA, smoking has been found to be associated
with worse prognosis, based on swollen joint count (SJC), nodules, and Sharp and HAQ scores.
As reviewed by Scott et al., in addition to smoking, social deprivation, female gender, and
periodontitis have also been found to be associated with poorer prognosis while alcohol
consumption and oral contraceptive use seem to provide protective effects and less severe
disease course (Scottetal.2013). Unfortunately, currently known environmental and
epidemiological risk factors for severe RA do not provide opportunity for intervention.
28
1.7.3.3 Imaging
Radiological imaging assessments using both magnetic resonance imaging (MRI) and
ultrasound scanning (USS) in early RA patients have been found to be predictive of radiological
outcomes. Power Doppler assessment of synovial inflammation using USS technology has also
been found to predict radiographic progression in both early RA and established RA patients
(Freestonetal.2010). The presence of bone marrow edema, detected through MRI at disease
onset (baseline) has been found to be associated with subsequent joint damage years into the
disease course (Hetlandetal.2009,Palosaarietal.2006,Haavardsholmetal.2008).
1.7.3.4 Biochemical
ESR and C-reactive protein (CRP) are currently used biochemical prognostic markers. These are
general markers of inflammation, however, and do not offer disease-specific value. As a result,
these do not present actionable biomarkers with therapeutic potential or pathophysiological
value. Molecules related to bone turnover and immune function have therefore been investigated
with the aim of finding a marker, which exhibits an association with RA disease severity and
prognosis. Some of these molecules are described below.
Matrix metalloproteinases (MMPs) are enzymes involved in the proteolysis of extracellular
proteins including immune signaling molecules such as cytokines (Scottetal.2013). They are
also involved in the breakdown of collagen (McArdleetal.2015). Elevated levels of both
MMP-1 and MMP-3 have been found to correlate with radiographic progression, yet these
findings have not been consistently replicated (McArdleetal.2015). Type II collagen c-
telopeptide (CTX-II) is a cross-linked peptide reflecting turnover and remodeling of bone.
Currently-available diagnostics exist aimed at targeting CTX-II in urine. It has been found that
urine CTX-II levels correlate with radiological progression at 4 years in early RA patients
(Garneroetal.2002). Ligand to receptor activator of nuclear factor-κB (RANKL) is a cytokine
necessary for osteoclastogenesis, the development of osteoclasts, which serve to break down
bone. Osteoprotegrin (OPG) is a soluble mediator of bone turnover and exerts its role by binding
to and inhibiting RANKL. This inhibits the binding of RANKL to its receptor and thus prevents
its function (Scottetal.2013). The Combinatietherapie Bij Reumatoide Artritis (COBRA)
29
study found that the ratio of RANKL to OPG predicted radiological damage in RA over the
course of 11 years (VanTuyletal.2010).
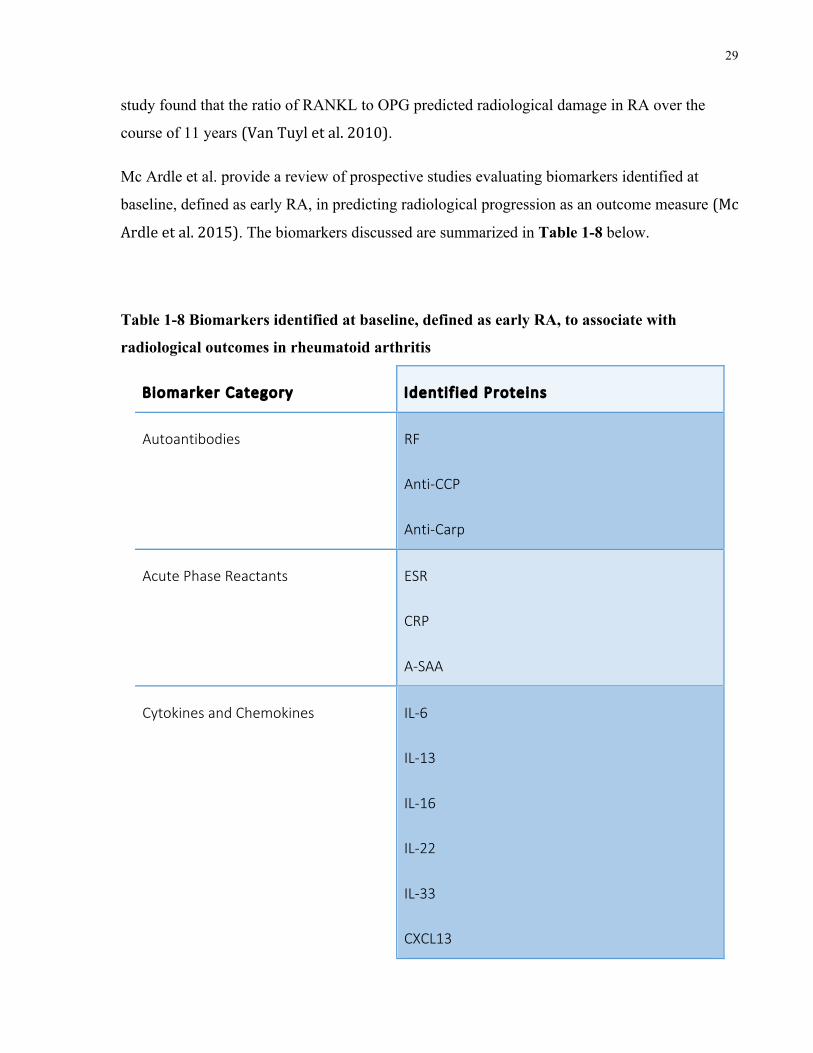
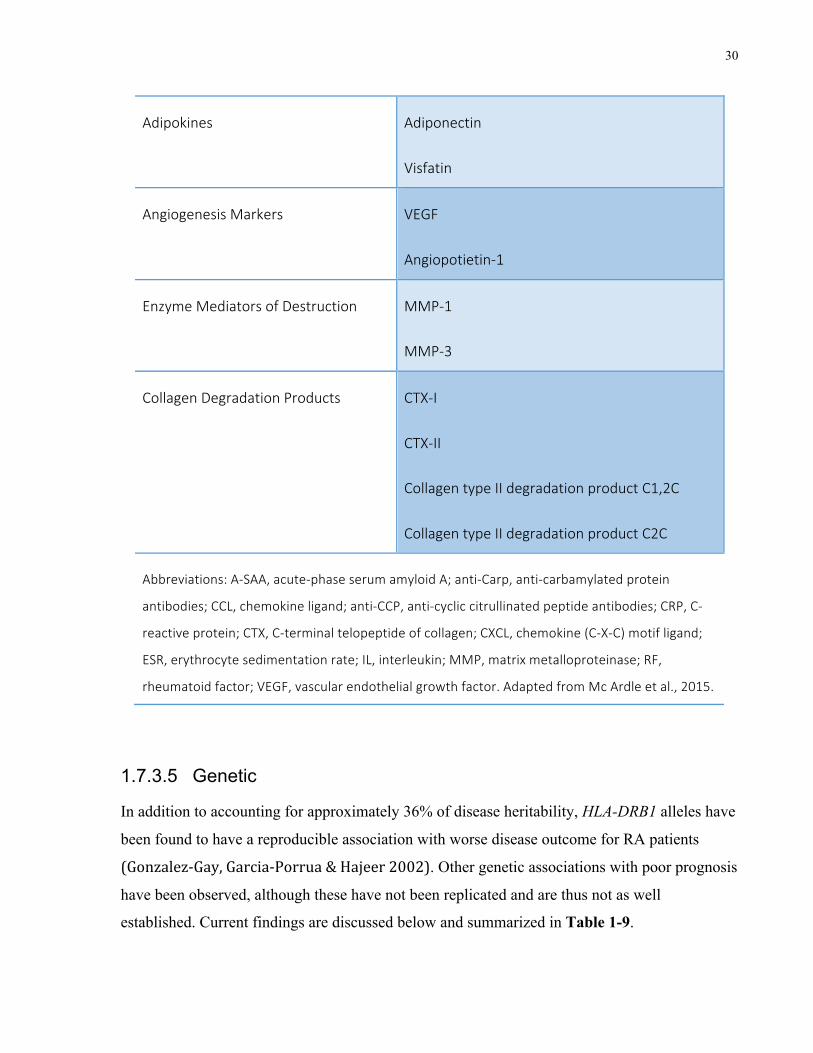
Mc Ardle et al. provide a review of prospective studies evaluating biomarkers identified at
baseline, defined as early RA, in predicting radiological progression as an outcome measure (Mc
Ardleetal.2015). The biomarkers discussed are summarized in Table 1-8 below.
Table 1-8 Biomarkers identified at baseline, defined as early RA, to associate with
radiological outcomes in rheumatoid arthritis
Biomarker Category Identif ied Proteins
Autoantibodies RF
Anti-CCP
Anti-Carp
Acute Phase Reactants ESR
CRP
A-SAA
Cytokines and Chemokines IL-6
IL-13
IL-16
IL-22
IL-33
CXCL13
30
Adipokines Adiponectin
Visfatin
Angiogenesis Markers VEGF
Angiopotietin-1
Enzyme Mediators of Destruction MMP-1
MMP-3
Collagen Degradation Products CTX-I
CTX-II
Collagen type II degradation product C1,2C
Collagen type II degradation product C2C
Abbreviations: A-SAA, acute-phase serum amyloid A; anti-Carp, anti-carbamylated protein
antibodies; CCL, chemokine ligand; anti-CCP, anti-cyclic citrullinated peptide antibodies; CRP, C-
reactive protein; CTX, C-terminal telopeptide of collagen; CXCL, chemokine (C-X-C) motif ligand;
ESR, erythrocyte sedimentation rate; IL, interleukin; MMP, matrix metalloproteinase; RF,
rheumatoid factor; VEGF, vascular endothelial growth factor. Adapted from Mc Ardle et al., 2015.
1.7.3.5 Genetic
In addition to accounting for approximately 36% of disease heritability, HLA-DRB1 alleles have
been found to have a reproducible association with worse disease outcome for RA patients
(Gonzalez-Gay,Garcia-Porrua&Hajeer2002). Other genetic associations with poor prognosis
have been observed, although these have not been replicated and are thus not as well
established. Current findings are discussed below and summarized in Table 1-9.
31
Marinou et al. conducted a cross-sectional study on a population of 964 RA patients. Their
outcome measure of disease severity was based on x-ray damage, assessed using Modified
Larsen scores. They found that the PTPN22 minor allele was associated with higher levels of
damage (Marinouetal.2007). This finding was of borderline significance, however, and other
studies have failed to replicate this finding (Karlsonetal.2008,VanNiesetal.2010).
Marinou et al. also reported that the IL6 promoter SNP rs1800795 was found to be associated
with higher levels of radiological damage in seropositive RA (Marinouetal.2007).
Additionally, the IL10 SNP rs1800872 was found to associate with erosive damage in ACPA-
negative RA. Another study by Huizinga et al. identified a second IL10 locus (1082)
polymorphism with the GG genotype associated with higher rates of disease progression, as
measured by radiological damage, versus the AA genotype (Huizingaetal.2000). Though
promising, other studies have failed to replicate these findings (Paradowska-Goryckaetal.
2010,Pawliketal.2005b,Nemecetal.2009).
Cantagrel et al. investigated the association of two polymorphisms in IL1B and one in IL1RN
with erosive damage in 108 early RA patients. They found that, in the presence of SE alleles, the
IL1B exon 5 allele 2 was associated with increased risk of erosive disease at two years
(Cantagreletal.1999). Buchs et al. also investigated the IL1 locus and found that the rare IL1B
(+3952) allele 2 was associated with erosive disease (Buchsetal.2001). Furthermore, it has
been demonstrated that the exon 5 (+3952) allele 2 is associated with higher disease activity,
characterized by higher ESR levels and DAS28 scores (Pawliketal.2005a). Despite this, other
studies have failed to replicate these findings (Harrisonetal.2008,Johnsenetal.2008).
A meta-analysis analyzing data on 1418 RA patients identified four SNPs at the IL15 locus that
had associations with disease severity, as measured by radiological damage. One was protective,
rs6821171, while the other three were associated with increased radiological damage rs7667746,
rs7665842, and rs4371699 (Kneveletal.2012b). This finding seems to support the preliminary
evidence that anti-IL-15 monoclonal antibody therapy may be effective in treating RA (Baslund
etal.2005).
Kurreeman et al. identified two SNPs in the TRAF1/C5 locus, rs2900180 and rs1070130, were
found to be associated with erosions at 5 years regardless of ACPA status (Kurreemanetal.
2007), yet a meta-analysis conducted in 2012 failed to replicate this (Kneveletal.2012a).
32
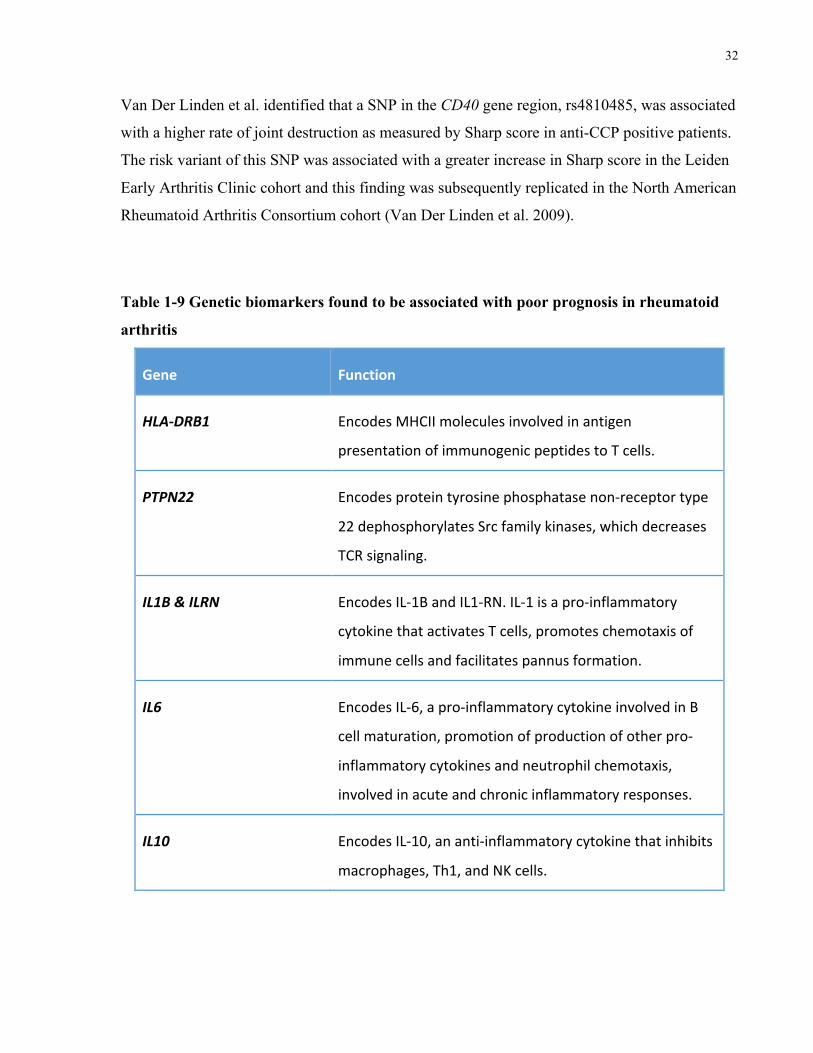
Van Der Linden et al. identified that a SNP in the CD40 gene region, rs4810485, was associated
with a higher rate of joint destruction as measured by Sharp score in anti-CCP positive patients.
The risk variant of this SNP was associated with a greater increase in Sharp score in the Leiden
Early Arthritis Clinic cohort and this finding was subsequently replicated in the North American
Rheumatoid Arthritis Consortium cohort (Van Der Linden et al. 2009).
Table 1-9 Genetic biomarkers found to be associated with poor prognosis in rheumatoid
arthritis
Gene Function
HLA-DRB1 EncodesMHCIImoleculesinvolvedinantigen
presentationofimmunogenicpeptidestoTcells.
PTPN22 Encodesproteintyrosinephosphatasenon-receptortype
22dephosphorylatesSrcfamilykinases,whichdecreases
TCRsignaling.
IL1B&ILRN EncodesIL-1ΒandIL1-RN.IL-1isapro-inflammatory
cytokinethatactivatesTcells,promoteschemotaxisof
immunecellsandfacilitatespannusformation.
IL6 EncodesIL-6,apro-inflammatorycytokineinvolvedinB
cellmaturation,promotionofproductionofotherpro-
inflammatorycytokinesandneutrophilchemotaxis,
involvedinacuteandchronicinflammatoryresponses.
IL10 EncodesIL-10,ananti-inflammatorycytokinethatinhibits
macrophages,Th1,andNKcells.
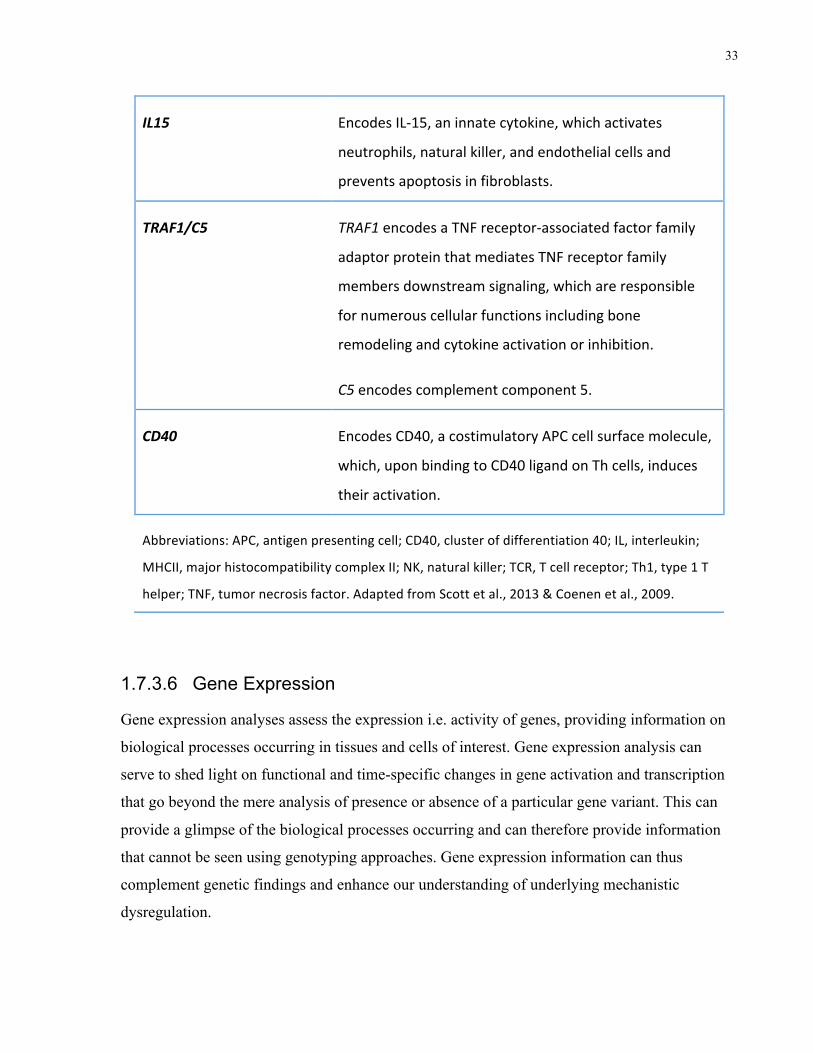
33
IL15 EncodesIL-15,aninnatecytokine,whichactivates
neutrophils,naturalkiller,andendothelialcellsand
preventsapoptosisinfibroblasts.
TRAF1/C5 TRAF1encodesaTNFreceptor-associatedfactorfamily
adaptorproteinthatmediatesTNFreceptorfamily
membersdownstreamsignaling,whichareresponsible
fornumerouscellularfunctionsincludingbone
remodelingandcytokineactivationorinhibition.
C5encodescomplementcomponent5.
CD40 EncodesCD40,acostimulatoryAPCcellsurfacemolecule,
which,uponbindingtoCD40ligandonThcells,induces
theiractivation.
Abbreviations:APC,antigenpresentingcell;CD40,clusterofdifferentiation40;IL,interleukin;
MHCII,majorhistocompatibilitycomplexII;NK,naturalkiller;TCR,Tcellreceptor;Th1,type1T
helper;TNF,tumornecrosisfactor.AdaptedfromScottetal.,2013&Coenenetal.,2009.
1.7.3.6 Gene Expression
Gene expression analyses assess the expression i.e. activity of genes, providing information on
biological processes occurring in tissues and cells of interest. Gene expression analysis can
serve to shed light on functional and time-specific changes in gene activation and transcription
that go beyond the mere analysis of presence or absence of a particular gene variant. This can
provide a glimpse of the biological processes occurring and can therefore provide information
that cannot be seen using genotyping approaches. Gene expression information can thus
complement genetic findings and enhance our understanding of underlying mechanistic
dysregulation.
34
Burska et al. produced a thorough review of the current information on the use of gene
expression analysis in RA diagnosis, prognosis, and treatment response. They discuss the merit
of these approaches in the personalization of cancer and transplant management, and
demonstrate the great potential for these approaches to be used for the management of RA as
well. Gene expression studies investigating disease pathogenesis show promise in their ability to
differentiate patients with RA from the patterns seen in patients with osteoarthritis or healthy
controls. Differential gene expression (DGE) signatures that differentiate early and established
RA have also been identified. Furthermore, numerous studies investigating response to specific
drugs have identified gene expression differences between responders and non-responders
(Burskaetal.2014).
Reynolds et al. investigated gene expression patterns correlating with severe RA, defined by
radiographic measures. They analyzed RNA obtained from peripheral blood mononuclear cells
(PBMCs) and its relation to total number of hand and foot erosions. They found that patients
with highly erosive disease (>10 erosions) could clearly be differentiated from those with mild
disease, characterized by no erosions, through the investigation of DGE (Reynoldsetal.2013).
Tang et al. further investigated these findings and observed a significant correlation between the
interferon-g receptor gene IFNGR2 and radiographic progression. Moreover, differences in
levels of expression of this gene were observed between patients and controls, as well as among
patients with erosions versus those without erosive disease (Tangetal.2015).
1.8 Summary
Despite these extensive research findings, presently available prognostic indicators have limited
value, many need replication, and very few have clinical application. However, the importance
of biomarkers is evident, not only for determining the disease course and prognosis but also for
personalizing treatment delivery, reducing morbidity, and minimizing treatment-associated
adverse events. Therefore, the discovery of useful biomarkers is needed to help determine
disease severity and prognosis in RA. It appears that there is a significant role of genetics in
both RA susceptibility as well as risk for severe disease. Given the significance of genetics in
disease susceptibility and progression, in addition to the vast research efforts in this field, this
35
study seeks to further explore gene and gene expression characteristics in patients with severe
RA, defined by our group in a novel, clinically-relevant manner.
1.9 Research Aims And Hypotheses
The goal of this study is to identify potential gene and expression biomarkers, which can help to
distinguish patients with severe, progressive disease who will require aggressive therapy from
those who will respond well to conventional treatment. A unique aspect of our study is our
characterization of clinically-relevant severe RA based on number of drug failures.
Hypothesis: Clinical differences between patients in the mild and severe groups will correlate
with genetic factors and gene expression differences in their peripheral blood.
This hypothesis will be addressed through the following specific aims.
Aim 1: To determine whether the proportion of patients with erosions differs between the mild
and severe groups.
This study utilizes number of drug failures as a marker of disease severity. It is known that
uncontrolled disease, and therefore continued inflammation, causes erosion of cartilage and
bone. Those unresponsive to drugs, by definition, have uncontrolled disease (characterized by
high DAS or other markers of disease activity). This, over time, will make the severe group
more likely to develop erosions over the course of their disease. Confirmation of Aim 1 supports
the premise that number of drug failures can be used as a marker of disease severity.
Aim 2: To determine whether RA risk alleles differentially associate with the mild and severe
groups.
Firstly, it is known that the disease has, at least in part, a genetic origin. Furthermore, thus far,
several of the observed genetic associations have been linked to disease pathogenesis.
Additionally, drugs used to treat RA, though all aiming to suppress the immune system and
reduce inflammation, have different targets and operate through different mechanisms. It is
therefore likely that patients presenting at opposite ends of the disease spectrum, and having
markedly different response to currently-available treatment, will have different genetic
36
predispositions underlying their disease. If this is the case, these genetic differences could
potentially be used (as biomarkers) to differentiate patients with severe, treatment–resistant
disease from those with mild, treatment-responsive disease.
Aim 3: To determine whether gene expression profiles differ between active and inactive
disease states within the mild and severe groups.
As gene expression profiles vary from one time point to another and reflect gene transcription at
each time point, it is likely that patients with active disease, who are mounting an inflammatory
response against their autoantigens, have different expression profiles from those who are in
remission. Though the differences may not be the same for each group, it is expected that these
variations will be observed within each group.
Aim 4: To determine whether gene regulation patterns differ between the mild and severe
groups.
Based on the assumption that varying mechanisms underlie different RA disease courses, we
predict that gene expression among patients with the same activity state within the same group
will show similar gene expression profiles.
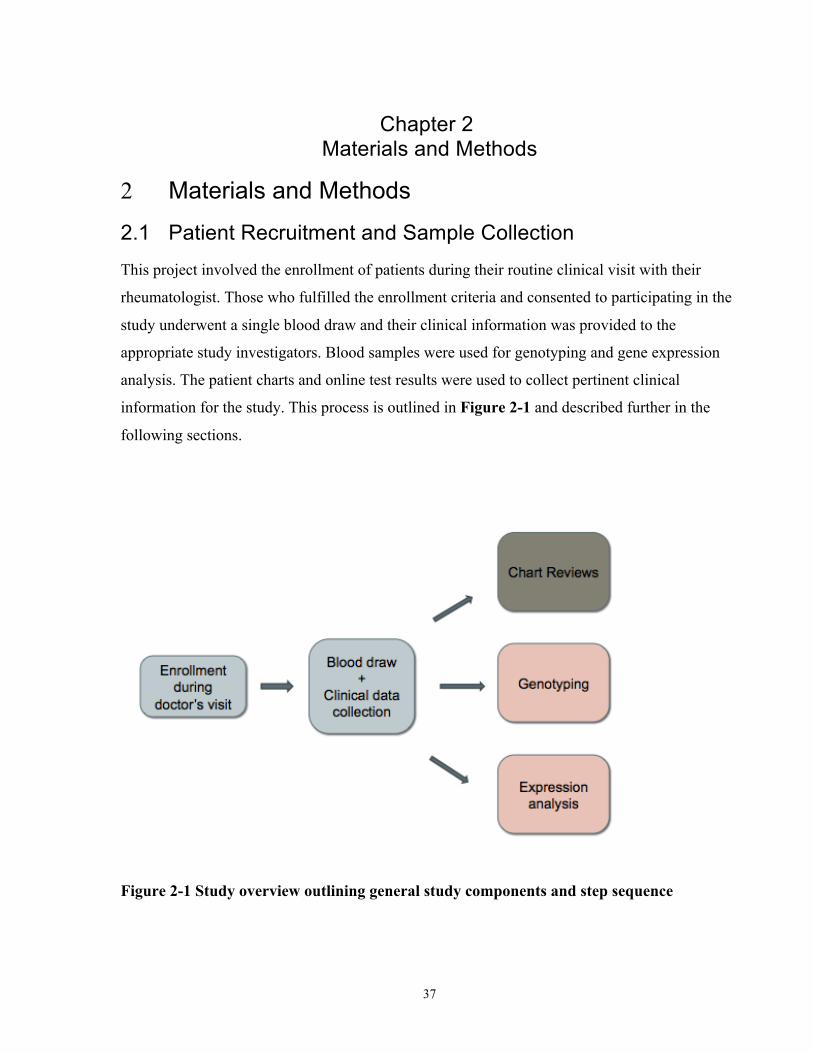
37
Chapter 2 Materials and Methods
Materials and Methods 2
2.1 Patient Recruitment and Sample Collection
This project involved the enrollment of patients during their routine clinical visit with their
rheumatologist. Those who fulfilled the enrollment criteria and consented to participating in the
study underwent a single blood draw and their clinical information was provided to the
appropriate study investigators. Blood samples were used for genotyping and gene expression
analysis. The patient charts and online test results were used to collect pertinent clinical
information for the study. This process is outlined in Figure 2-1 and described further in the
following sections.
Figure 2-1 Study overview outlining general study components and step sequence
38
This study was approved by the Mount Sinai Hospital Research Ethics Board (MSH REB) MSH
REB number: 04-0184-E. The MSH REB functions in accordance with PartC,Division5ofthe
FoodandDrugRegulationsofHealthCanada, the Tri-Council Policy Statement, and the
International Conference on Harmonization/ Good Clinical Practice Guidelines.
Patients fulfilling the enrolment criteria were asked if they would be willing to participate in the
current study during one of their visits with their rheumatologist. Informed consent was obtained
from eligible patients and whole blood samples were collected from each participant. A single
venous blood draw was conducted to obtain a total of four 10mL tubes of peripheral blood,
including one sodium heparin tube, one ethylenediaminetetraacetic acid (EDTA) tube, and one
PAXgene Blood RNA tube. Blood was drawn by certified phlebotomists, either through the
Study Coordinator or at a blood-testing lab via requisition form. The samples were immediately
transported to our facility where they were registered and stored. EDTA tubes for DNA
processing were stored at 4 oC and PAXgene Blood RNA tubes were stored at -20oC until
processing.
Enrolment criteria were as follows:
• At time of consent, participants must be at least 18 years of age, have a confirmed
diagnosis of RA (based on ACR 1987 or 2010 criteria), be willing to sign release of
information to allow access to medical records, and provide informed consent.
• Patients younger than 18 years or older than 80 years of age were excluded from the
current study. Patients who were unable to comprehend the study process and provide
informed consent were also excluded.
2.2 Chart Reviews
Thorough chart reviews were performed on each patient chart to extract study-relevant
information and characterize each patient’s disease course. Gender, date of birth, year of
diagnosis, smoking status during first visit, family history of RA, juvenile idiopathic arthritis
(JIA), RF, anti-CCP, and erosion status were also recorded.
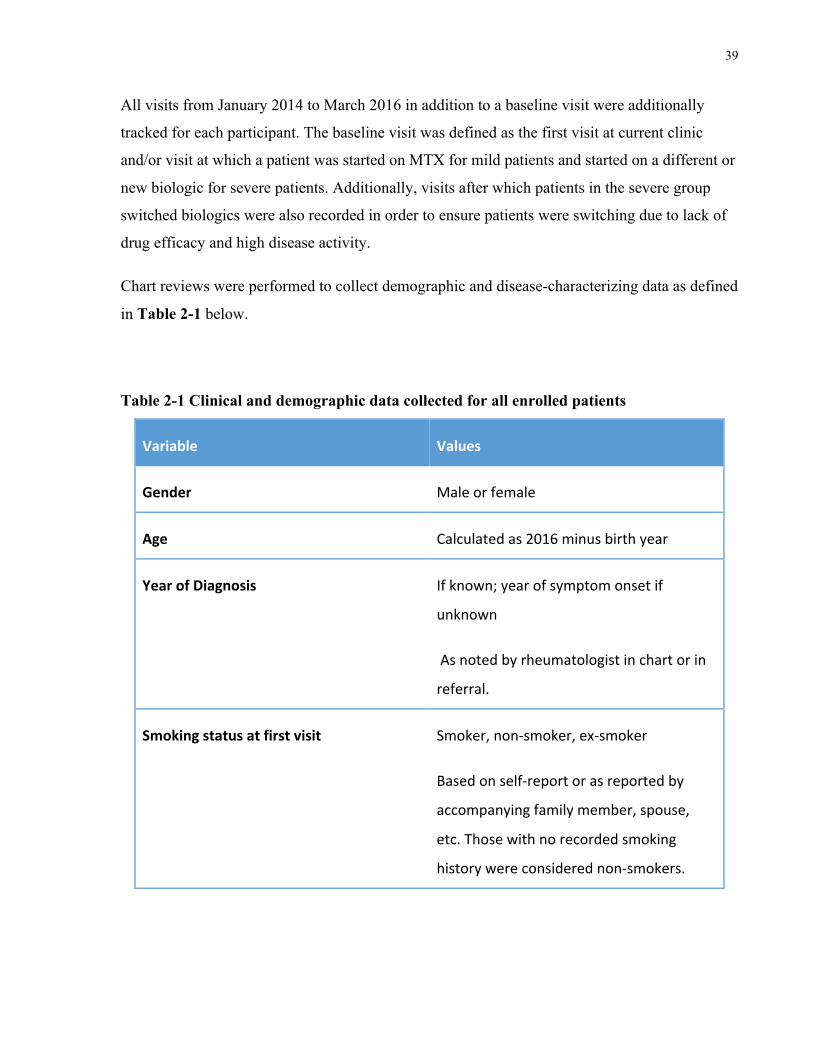
39
All visits from January 2014 to March 2016 in addition to a baseline visit were additionally
tracked for each participant. The baseline visit was defined as the first visit at current clinic
and/or visit at which a patient was started on MTX for mild patients and started on a different or
new biologic for severe patients. Additionally, visits after which patients in the severe group
switched biologics were also recorded in order to ensure patients were switching due to lack of
drug efficacy and high disease activity.
Chart reviews were performed to collect demographic and disease-characterizing data as defined
in Table 2-1 below.
Table 2-1 Clinical and demographic data collected for all enrolled patients
Variable Values
Gender Maleorfemale
Age Calculatedas2016minusbirthyear
YearofDiagnosis Ifknown;yearofsymptomonsetif
unknown
Asnotedbyrheumatologistinchartorin
referral.
Smokingstatusatfirstvisit Smoker,non-smoker,ex-smoker
Basedonself-reportorasreportedby
accompanyingfamilymember,spouse,
etc.Thosewithnorecordedsmoking
historywereconsiderednon-smokers.
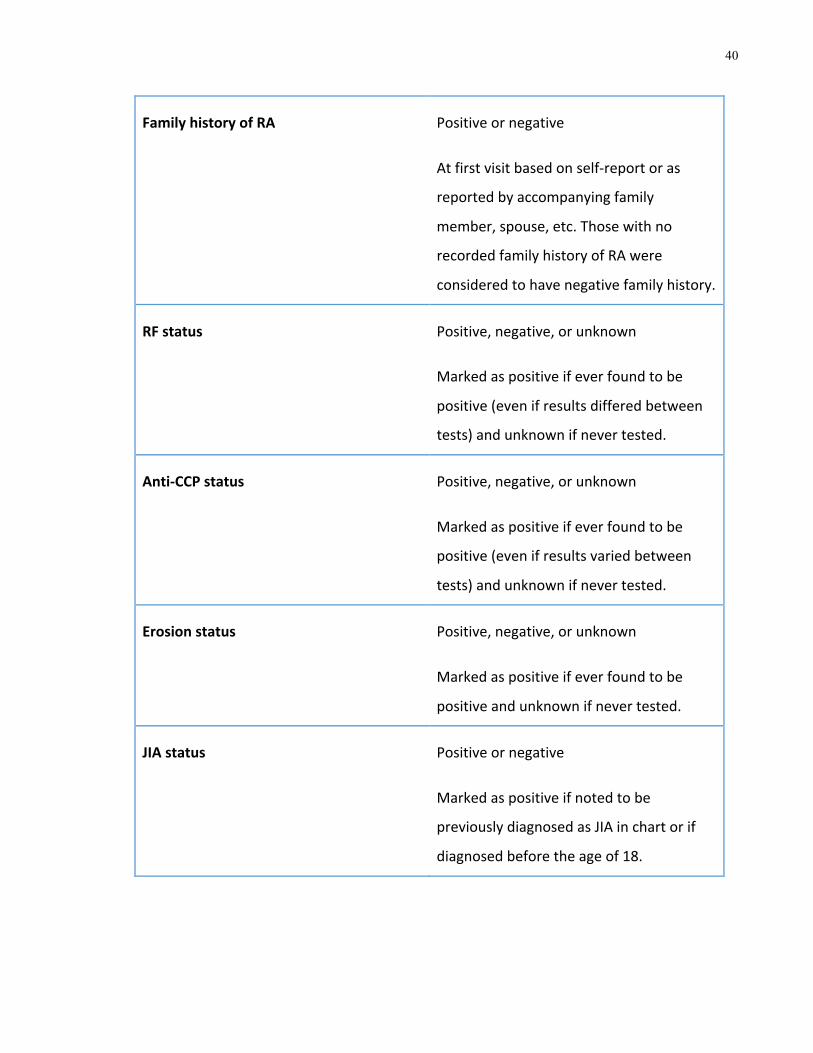
40
FamilyhistoryofRA Positiveornegative
Atfirstvisitbasedonself-reportoras
reportedbyaccompanyingfamily
member,spouse,etc.Thosewithno
recordedfamilyhistoryofRAwere
consideredtohavenegativefamilyhistory.
RFstatus Positive,negative,orunknown
Markedaspositiveifeverfoundtobe
positive(evenifresultsdifferedbetween
tests)andunknownifnevertested.
Anti-CCPstatus Positive,negative,orunknown
Markedaspositiveifeverfoundtobe
positive(evenifresultsvariedbetween
tests)andunknownifnevertested.
Erosionstatus Positive,negative,orunknown
Markedaspositiveifeverfoundtobe
positiveandunknownifnevertested.
JIAstatus Positiveornegative
Markedaspositiveifnotedtobe
previouslydiagnosedasJIAinchartorif
diagnosedbeforetheageof18.
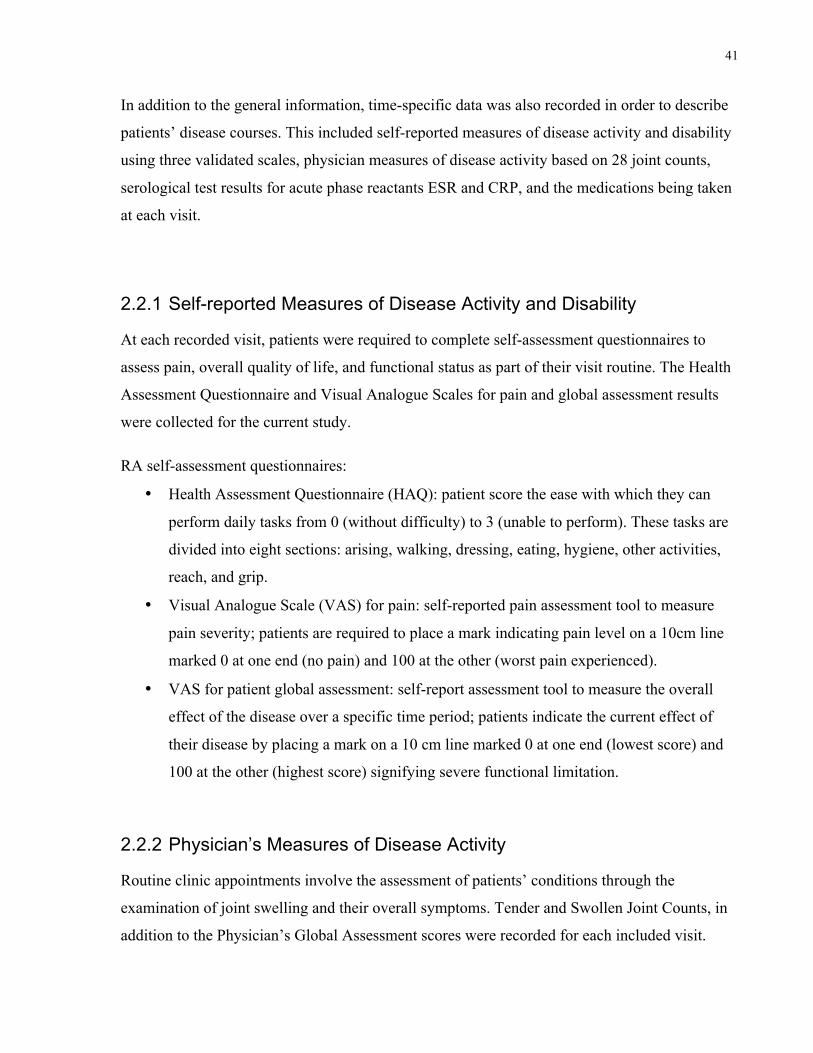
41
In addition to the general information, time-specific data was also recorded in order to describe
patients’ disease courses. This included self-reported measures of disease activity and disability
using three validated scales, physician measures of disease activity based on 28 joint counts,
serological test results for acute phase reactants ESR and CRP, and the medications being taken
at each visit.
2.2.1 Self-reported Measures of Disease Activity and Disability
At each recorded visit, patients were required to complete self-assessment questionnaires to
assess pain, overall quality of life, and functional status as part of their visit routine. The Health
Assessment Questionnaire and Visual Analogue Scales for pain and global assessment results
were collected for the current study.
RA self-assessment questionnaires:
• Health Assessment Questionnaire (HAQ): patient score the ease with which they can
perform daily tasks from 0 (without difficulty) to 3 (unable to perform). These tasks are
divided into eight sections: arising, walking, dressing, eating, hygiene, other activities,
reach, and grip.
• Visual Analogue Scale (VAS) for pain: self-reported pain assessment tool to measure
pain severity; patients are required to place a mark indicating pain level on a 10cm line
marked 0 at one end (no pain) and 100 at the other (worst pain experienced).
• VAS for patient global assessment: self-report assessment tool to measure the overall
effect of the disease over a specific time period; patients indicate the current effect of
their disease by placing a mark on a 10 cm line marked 0 at one end (lowest score) and
100 at the other (highest score) signifying severe functional limitation.
2.2.2 Physician’s Measures of Disease Activity
Routine clinic appointments involve the assessment of patients’ conditions through the
examination of joint swelling and their overall symptoms. Tender and Swollen Joint Counts, in
addition to the Physician’s Global Assessment scores were recorded for each included visit.
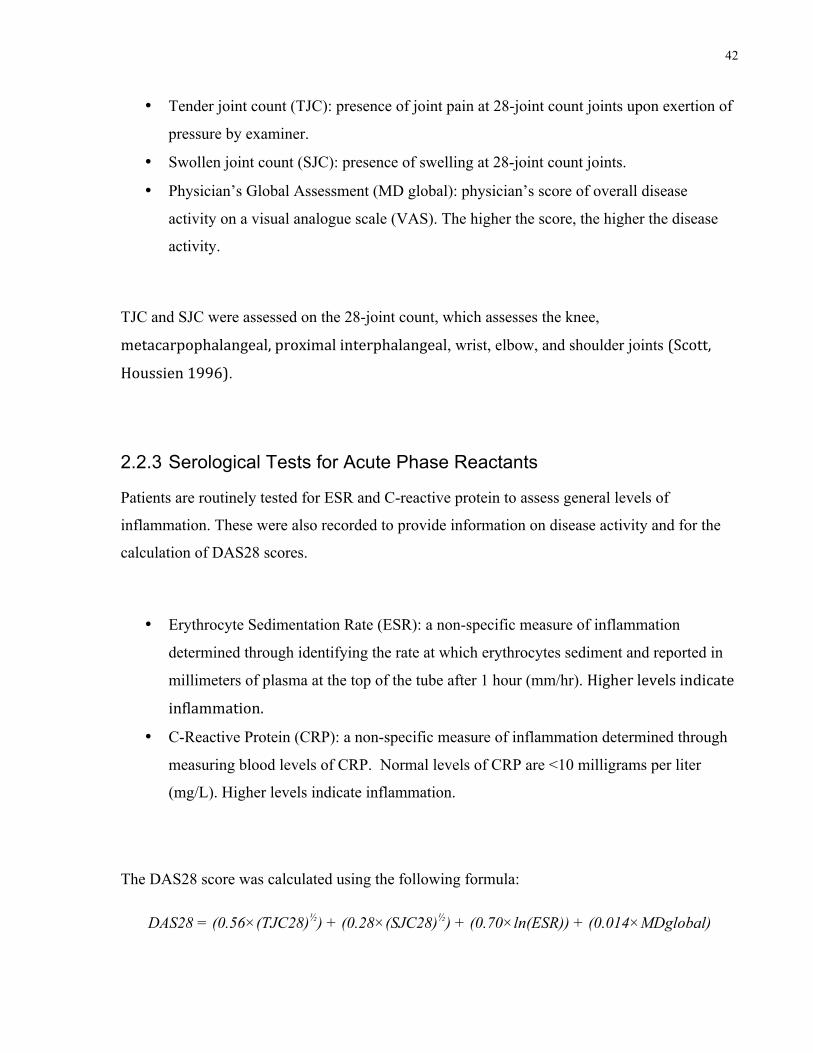
42
• Tender joint count (TJC): presence of joint pain at 28-joint count joints upon exertion of
pressure by examiner.
• Swollen joint count (SJC): presence of swelling at 28-joint count joints.
• Physician’s Global Assessment (MD global): physician’s score of overall disease
activity on a visual analogue scale (VAS). The higher the score, the higher the disease
activity.
TJC and SJC were assessed on the 28-joint count, which assesses the knee,
metacarpophalangeal,proximalinterphalangeal, wrist, elbow, and shoulder joints (Scott,
Houssien1996).
2.2.3 Serological Tests for Acute Phase Reactants
Patients are routinely tested for ESR and C-reactive protein to assess general levels of
inflammation. These were also recorded to provide information on disease activity and for the
calculation of DAS28 scores.
• Erythrocyte Sedimentation Rate (ESR): a non-specific measure of inflammation
determined through identifying the rate at which erythrocytes sediment and reported in
millimeters of plasma at the top of the tube after 1 hour (mm/hr). Higherlevelsindicate
inflammation.
• C-Reactive Protein (CRP): a non-specific measure of inflammation determined through
measuring blood levels of CRP. Normal levels of CRP are <10 milligrams per liter
(mg/L). Higher levels indicate inflammation.
The DAS28 score was calculated using the following formula:
DAS28 = (0.56×(TJC28)½) + (0.28×(SJC28)½) + (0.70×ln(ESR)) + (0.014×MDglobal)

43
2.2.4 Treatment
Treatment at each recorded visit was documented. Due to the wide array of medications with
which RA patients are treated, these are subdivided into five categories: cDMARDs, NSAIDs,
corticosteroids, biologics, and other drugs and supplements. These are listed in Table 2-2 along
with the most commonly used drugs in each category that are prescribed to RA patients.
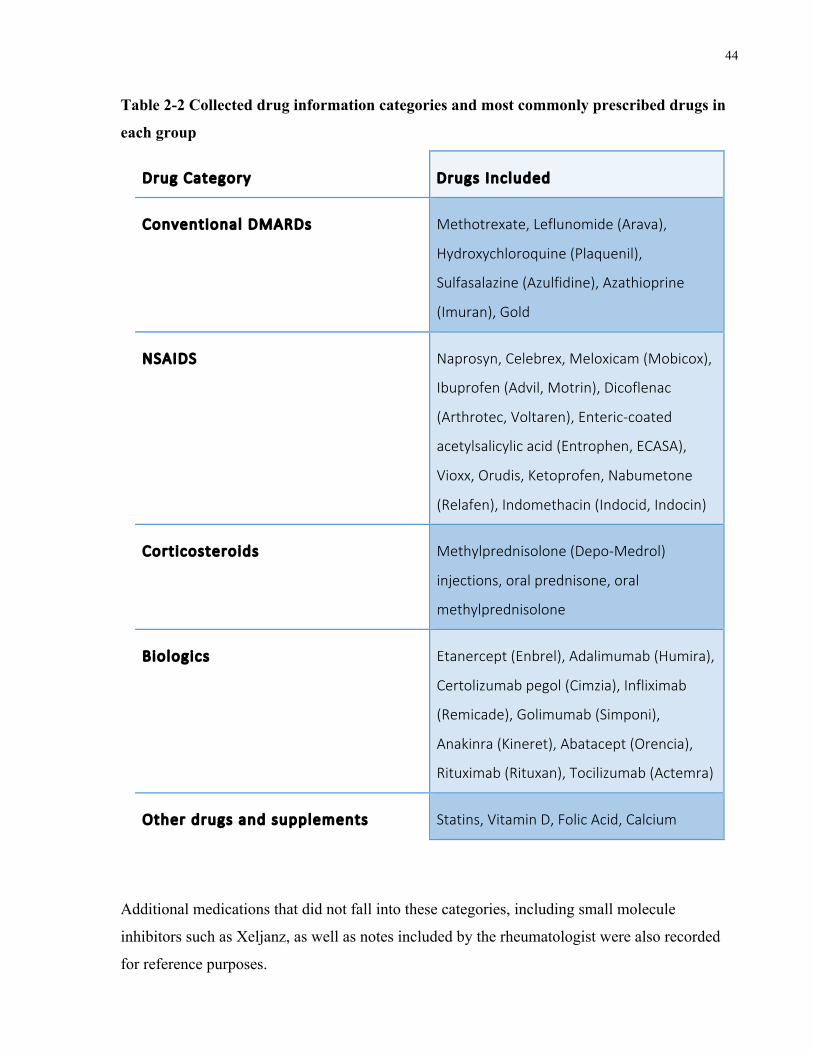
44
Table 2-2 Collected drug information categories and most commonly prescribed drugs in
each group
Drug Category Drugs Included
Conventional DMARDs Methotrexate, Leflunomide (Arava),
Hydroxychloroquine (Plaquenil),
Sulfasalazine (Azulfidine), Azathioprine
(Imuran), Gold
NSAIDS Naprosyn, Celebrex, Meloxicam (Mobicox),
Ibuprofen (Advil, Motrin), Dicoflenac
(Arthrotec, Voltaren), Enteric-coated
acetylsalicylic acid (Entrophen, ECASA),
Vioxx, Orudis, Ketoprofen, Nabumetone
(Relafen), Indomethacin (Indocid, Indocin)
Corticosteroids Methylprednisolone (Depo-Medrol)
injections, oral prednisone, oral
methylprednisolone
Biologics Etanercept (Enbrel), Adalimumab (Humira),
Certolizumab pegol (Cimzia), Infliximab
(Remicade), Golimumab (Simponi),
Anakinra (Kineret), Abatacept (Orencia),
Rituximab (Rituxan), Tocilizumab (Actemra)
Other drugs and supplements Statins, Vitamin D, Folic Acid, Calcium
Additional medications that did not fall into these categories, including small molecule
inhibitors such as Xeljanz, as well as notes included by the rheumatologist were also recorded
for reference purposes.
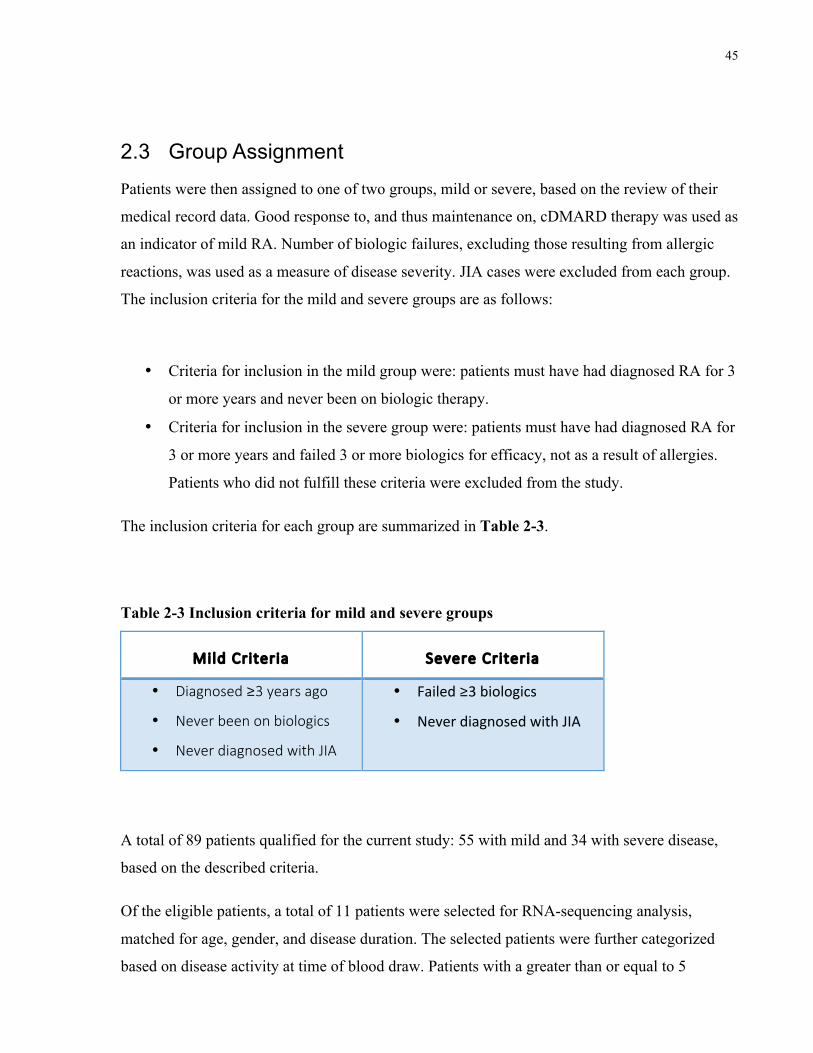
45
2.3 Group Assignment
Patients were then assigned to one of two groups, mild or severe, based on the review of their
medical record data. Good response to, and thus maintenance on, cDMARD therapy was used as
an indicator of mild RA. Number of biologic failures, excluding those resulting from allergic
reactions, was used as a measure of disease severity. JIA cases were excluded from each group.
The inclusion criteria for the mild and severe groups are as follows:
• Criteria for inclusion in the mild group were: patients must have had diagnosed RA for 3
or more years and never been on biologic therapy.
• Criteria for inclusion in the severe group were: patients must have had diagnosed RA for
3 or more years and failed 3 or more biologics for efficacy, not as a result of allergies.
Patients who did not fulfill these criteria were excluded from the study.
The inclusion criteria for each group are summarized in Table 2-3.
Table 2-3 Inclusion criteria for mild and severe groups
Mild Criteria Severe Criteria
• Diagnosed ≥3 years ago
• Never been on biologics
• Never diagnosed with JIA
• Failed≥3biologics
• NeverdiagnosedwithJIA
A total of 89 patients qualified for the current study: 55 with mild and 34 with severe disease,
based on the described criteria.
Of the eligible patients, a total of 11 patients were selected for RNA-sequencing analysis,
matched for age, gender, and disease duration. The selected patients were further categorized
based on disease activity at time of blood draw. Patients with a greater than or equal to 5
46
swollen joints (out of a 28 joint count) at time of blood draw were considered to have active
disease. Patients with less than 5 swollen joints at time of blood draw were considered to have
inactive disease.
2.4 Genotyping
All eligible patients were genotyped using a panel containing 206 SNPs, including 104 leading
SNPs and 102 LD SNPs. These spanned all 101 RA risk loci identified by Okada et al. (2014),
as well as 7 additional HLA-DRB1 SE loci. Appendix Table 1 lists and describes the targeted
SNPs. All 206 SNPs of interest were accommodated in a total of 7 reaction panels.
The Agena BioscienceTM iPLEX® Assay and MassARRAY® System was used for the genetic
analysis of whole blood samples obtained from patients. Patient samples were analyzed based
on the protocol described by Gabriel et al. A general overview of the technique follows.
This technology works by combining single base extension (SBE) technology with matrix-
assisted laser desorption/ionization time-of-flight (MALDI-TOF) mass spectrometry. It
specifically targets the region of interest as a result of locus-specific polymerase chain reaction
(PCR) and extension reactions. PCR and iPLEX extension primers were designed using the
Assay Design Suite (ADS) software.
Genomic DNA from the patient whole blood samples was isolated and quantified. PCR was
then used to amplify the genomic regions of interest through thermal cycling. PCR products
were then mixed with shrimp alkaline phosphatase to dephosphorylate unincorporated
deoxynucleotides (dNTPs). The iPLEX reaction involves combining the PCR products, SBE
primers, and mass-modified dideoxynucleotides (ddNTPs). SBE primers are then used to target
loci of interest. These are oligonucleotides i.e. short nucleotide sequences that anneal directly
upstream of the site of interest, permitting the genotyping of the polymorphic region on the
amplified genomic segments. An extension enzyme then adds complementary bases according
to the genetic sequence at each location. Each primer is thus extended by a single mass-modified
base, which corresponds to the polymorphism at the site of interest. The samples are then
desalted and dispensed to a SpectroCHIP® Array. They are then placed into the MassARRAY®
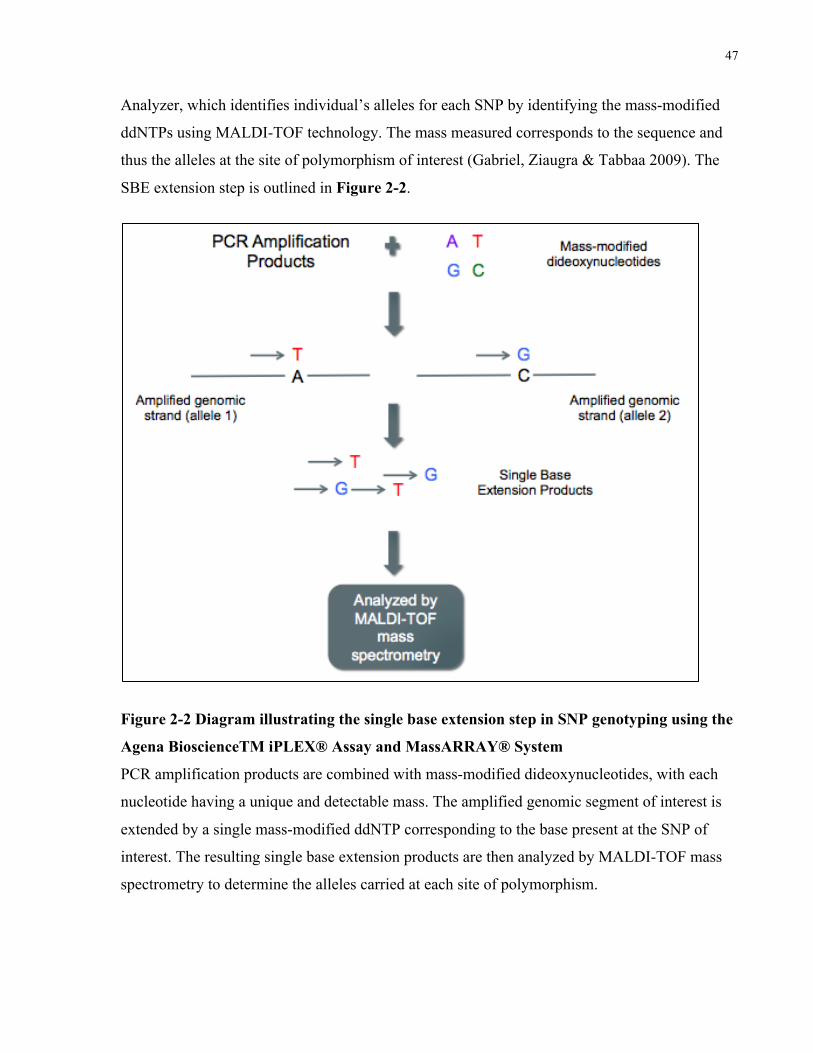
47
Analyzer, which identifies individual’s alleles for each SNP by identifying the mass-modified
ddNTPs using MALDI-TOF technology. The mass measured corresponds to the sequence and
thus the alleles at the site of polymorphism of interest (Gabriel, Ziaugra & Tabbaa 2009). The
SBE extension step is outlined in Figure 2-2.
Figure 2-2 Diagram illustrating the single base extension step in SNP genotyping using the
Agena BioscienceTM iPLEX® Assay and MassARRAY® System
PCR amplification products are combined with mass-modified dideoxynucleotides, with each
nucleotide having a unique and detectable mass. The amplified genomic segment of interest is
extended by a single mass-modified ddNTP corresponding to the base present at the SNP of
interest. The resulting single base extension products are then analyzed by MALDI-TOF mass
spectrometry to determine the alleles carried at each site of polymorphism.
48
2.5 RNA-sequencing
RNA-sequencing, or RNA-seq, is an analytical tool that permits the analysis of gene expression
across the transcriptome and the detection of both known and novel transcripts. RNA-seq was
used to identify DGE between the mild and severe patient groups. A total of 11 patient samples
were analyzed using this technology: four mild and seven severe patient samples. The chosen
samples were matched for gender, age, and disease duration. RNA-seq analysis consists of three
general steps: library preparation, sequencing, and data analysis.
RNA quality was tested using the Agilent® Bioanalyzer® and an RNA Integrity Number (RIN)
of >7 was considered to be good quality. The Illumina® Globin-Zero Gold rRNA Removal Kit,
designed specifically for use on human whole blood, was used to remove rRNA and globin
mRNA from the patient samples. A complementary DNA (cDNA) library was then created
through a reverse transcription reaction. The Illumina® TruSeq Stranded Total RNA Library
Preparation Kit was used for the library preparation step. The Illumina® HiSeq 2500 RNA
sequencer was used to perform RNA-sequencing. Sample preparation and sequencing were
performed as outlined in the provider’s manuals.
Following is a brief description of how this technology operates. Forward and reverse strands
are replicated using clonal amplification and then sequenced using sequencing primers and
fluorescently tagged nucleotides. The clusters on the flow cell are excited by a light source to
determine the color emitted representing the nucleotide that was added to each strand, thus
providing the sequence of the template. Identical strands are read at the same time. The emission
wavelength and signal intensity determine the base call. The more sequencing cycles performed,
the longer the length of the read.
Indices are used to separate reads with similar sequences. Similar reads cluster together and
forward and reverse strands are paired to produce contiguous sequences. Contiguous sequences
are then aligned with the reference genome in order to identify the genes being expressed and
identify DGE. The data analysis step is described in the Statistical Analysis section that follows.
49
2.6 Statistical Analysis
2.6.1 Demographic & Clinical Data
Comparisons of mean age and disease duration between the mild and severe groups were
undertaken using an unpaired two-tailed Student’s t-test with level of significance set at 0.05
indicating a statistically significant difference between groups. All other clinical and
demographic variable proportions were compared between the mild and severe groups using the
Chi-square test with level of significance set to 0.05. Missing data (e.g. unknown
erosion/RF/anti-CCP status) was excluded when performing the statistical comparisons.
2.6.2 Genotyping Data
To compare allele frequencies of the analyzed SNPs between the two groups, a case/control
association analysis was performed on PLINK (v1.07). Members of the severe group were
assigned as cases and those in the mild group were assigned as controls. From the resulting data,
genetic associations with a p-value of <0.05 were considered to be significant. The overall
groups were compared, followed by a comparison of the RF positive, RF negative, anti-CCP
positive, anti-CCP negative, erosive, and non-erosive subgroups.
2.6.3 RNA-seq Data
The first RNA-seq data analysis step consisted of a quality control step using FASTQC v.0.11.0
in order to determine overall read quality. The FASTQC reports provide basic statistics, as well
as graphical representations of quality metrics. RSeQC (v2.6.4), an RNA-seq specific module,
was used in order to perform RNA-seq quality control analysis. This program analyzes aligned
files and provides statistics and plots for each sample (Wang, Wang & Li 2012).
The BOWTIE2 (v2.2.5) – TOPHAT (2.1.0) pipeline was then used to align the raw sequencing
data, in the form of FASTQ files, to the human genome (hg38, iGenome GTF definition file)
(Langmead, Salzberg 2012, Kim et al. 2013). SAMTOOLS (v0.1.19) and TRIMMOMATIC
(v0.36) were also used in the alignment step as accessory programs (Li et al. 2009, Bolger,
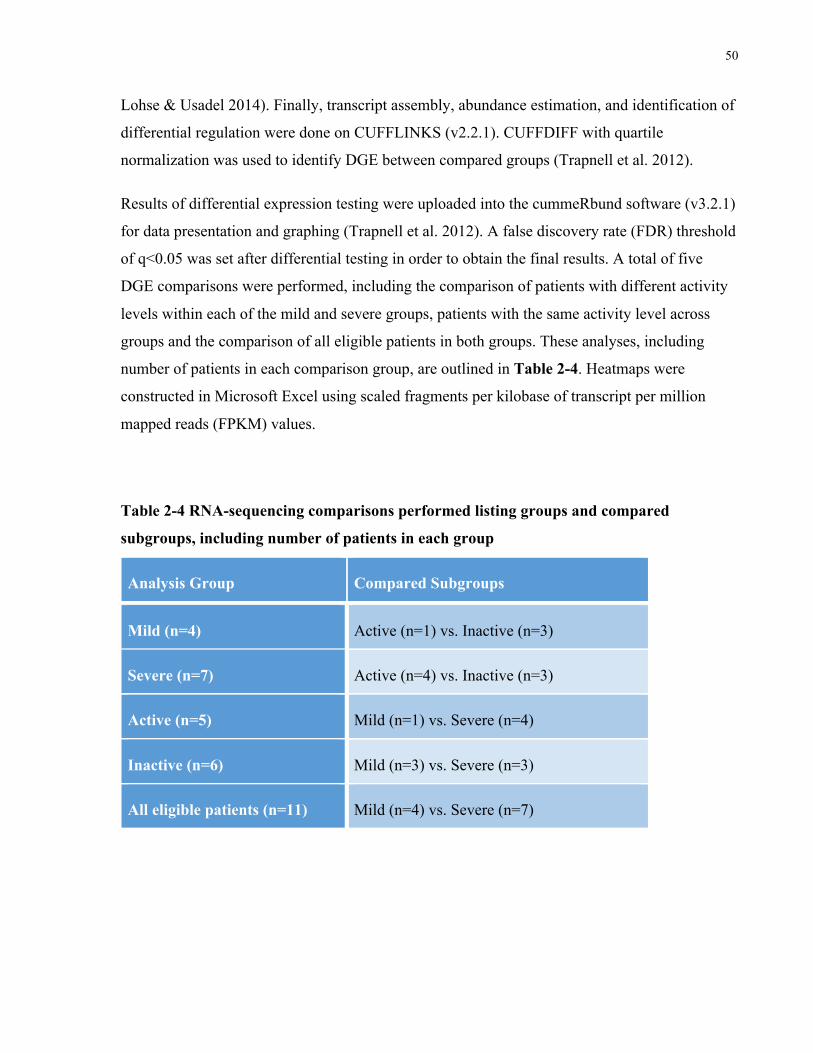
50
Lohse & Usadel 2014). Finally, transcript assembly, abundance estimation, and identification of
differential regulation were done on CUFFLINKS (v2.2.1). CUFFDIFF with quartile
normalization was used to identify DGE between compared groups (Trapnell et al. 2012).
Results of differential expression testing were uploaded into the cummeRbund software (v3.2.1)
for data presentation and graphing (Trapnell et al. 2012). A false discovery rate (FDR) threshold
of q<0.05 was set after differential testing in order to obtain the final results. A total of five
DGE comparisons were performed, including the comparison of patients with different activity
levels within each of the mild and severe groups, patients with the same activity level across
groups and the comparison of all eligible patients in both groups. These analyses, including
number of patients in each comparison group, are outlined in Table 2-4. Heatmaps were
constructed in Microsoft Excel using scaled fragments per kilobase of transcript per million
mapped reads (FPKM) values.
Table 2-4 RNA-sequencing comparisons performed listing groups and compared
subgroups, including number of patients in each group
Analysis Group Compared Subgroups
Mild (n=4) Active (n=1) vs. Inactive (n=3)
Severe (n=7) Active (n=4) vs. Inactive (n=3)
Active (n=5) Mild (n=1) vs. Severe (n=4)
Inactive (n=6) Mild (n=3) vs. Severe (n=3)
All eligible patients (n=11) Mild (n=4) vs. Severe (n=7)
51
Chapter 3 Results
Results 3
3.1 Clinical and Demographic Data
A total of 89 RA patients were eligible for the current study, 55 presenting with mild disease
and 34 presenting with severe disease, based on the developed criteria. As shown in Table 3-1,
the mean age of patients with mild disease was significantly higher at 64.2 ± 12.7 years
compared to the severe group with mean age of 57.7 ± 10.7 years (p<0.05). Disease duration
was 21.9 ± 12.1 years for the mild group and 22.5 ± 11.3 years for the severe group. There was
no significant difference (p>0.05) for this measure. In terms of the group classification criteria,
patients in the severe group failed an average of 5.4 ± 1.5 biologics by the time of the 2016 chart
reviews while those in the comparison group had been on none. DAS28 information was
available for one or more pre-biologic drug switches for 32 out of the 34 patients in the severe
group. Available scores were pooled and averaged for each patient, providing an average
DAS28 score prior to biologic drug switch over the course of their disease. The mean pre-drug
switch DAS28 score for patients in the biologic group was 4.2 ± 1.0 and the median was found
to be 4.1. Average biologic treatment duration was found to be 17.4 ± 13.9 months using a
random sample of 10 patients in the severe group with available treatment duration for at least 2
biologic therapies.
All patients in the mild group had disease durations of 5 or more years, with 28 out of 55
patients having disease durations of 20 or more years. This data is shown in Figure 3-1 below.
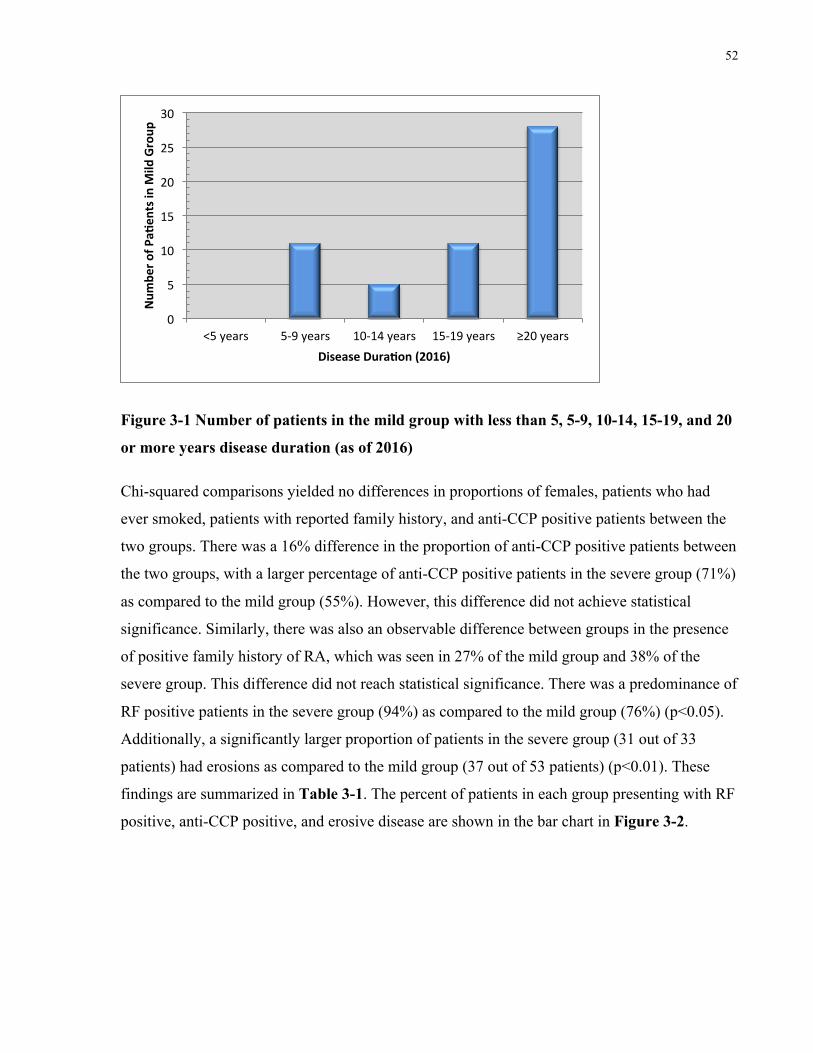
52
Figure 3-1 Number of patients in the mild group with less than 5, 5-9, 10-14, 15-19, and 20
or more years disease duration (as of 2016)
Chi-squared comparisons yielded no differences in proportions of females, patients who had
ever smoked, patients with reported family history, and anti-CCP positive patients between the
two groups. There was a 16% difference in the proportion of anti-CCP positive patients between
the two groups, with a larger percentage of anti-CCP positive patients in the severe group (71%)
as compared to the mild group (55%). However, this difference did not achieve statistical
significance. Similarly, there was also an observable difference between groups in the presence
of positive family history of RA, which was seen in 27% of the mild group and 38% of the
severe group. This difference did not reach statistical significance. There was a predominance of
RF positive patients in the severe group (94%) as compared to the mild group (76%) (p<0.05).
Additionally, a significantly larger proportion of patients in the severe group (31 out of 33
patients) had erosions as compared to the mild group (37 out of 53 patients) (p<0.01). These
findings are summarized in Table 3-1. The percent of patients in each group presenting with RF
positive, anti-CCP positive, and erosive disease are shown in the bar chart in Figure 3-2.
0
5
10
15
20
25
30
<5years 5-9years 10-14years 15-19years ≥20years
Num
bero
fPaa
entsinM
ildGroup
DiseaseDuraaon(2016)
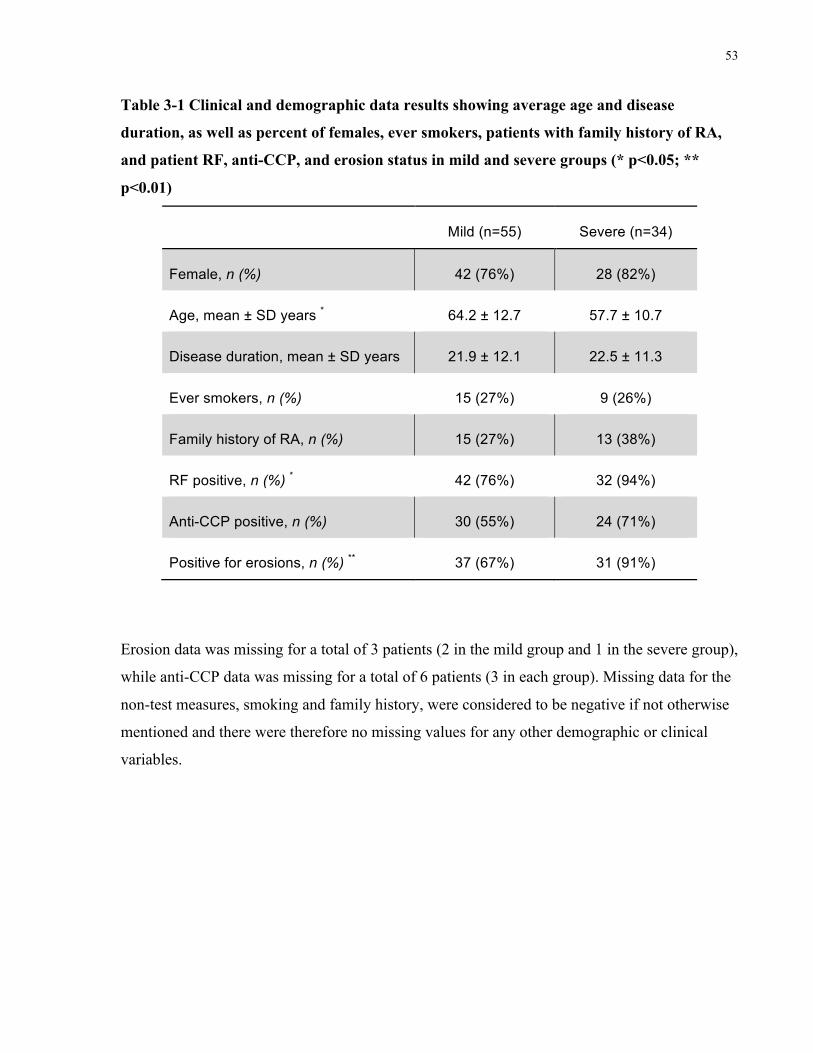
53
Table 3-1 Clinical and demographic data results showing average age and disease
duration, as well as percent of females, ever smokers, patients with family history of RA,
and patient RF, anti-CCP, and erosion status in mild and severe groups (* p<0.05; **
p<0.01)
Mild (n=55) Severe (n=34)
Female, n (%) 42 (76%) 28 (82%)
Age, mean ± SD years * 64.2 ± 12.7 57.7 ± 10.7
Disease duration, mean ± SD years 21.9 ± 12.1 22.5 ± 11.3
Ever smokers, n (%) 15 (27%) 9 (26%)
Family history of RA, n (%) 15 (27%) 13 (38%)
RF positive, n (%) * 42 (76%) 32 (94%)
Anti-CCP positive, n (%) 30 (55%) 24 (71%)
Positive for erosions, n (%) ** 37 (67%) 31 (91%)
Erosion data was missing for a total of 3 patients (2 in the mild group and 1 in the severe group),
while anti-CCP data was missing for a total of 6 patients (3 in each group). Missing data for the
non-test measures, smoking and family history, were considered to be negative if not otherwise
mentioned and there were therefore no missing values for any other demographic or clinical
variables.
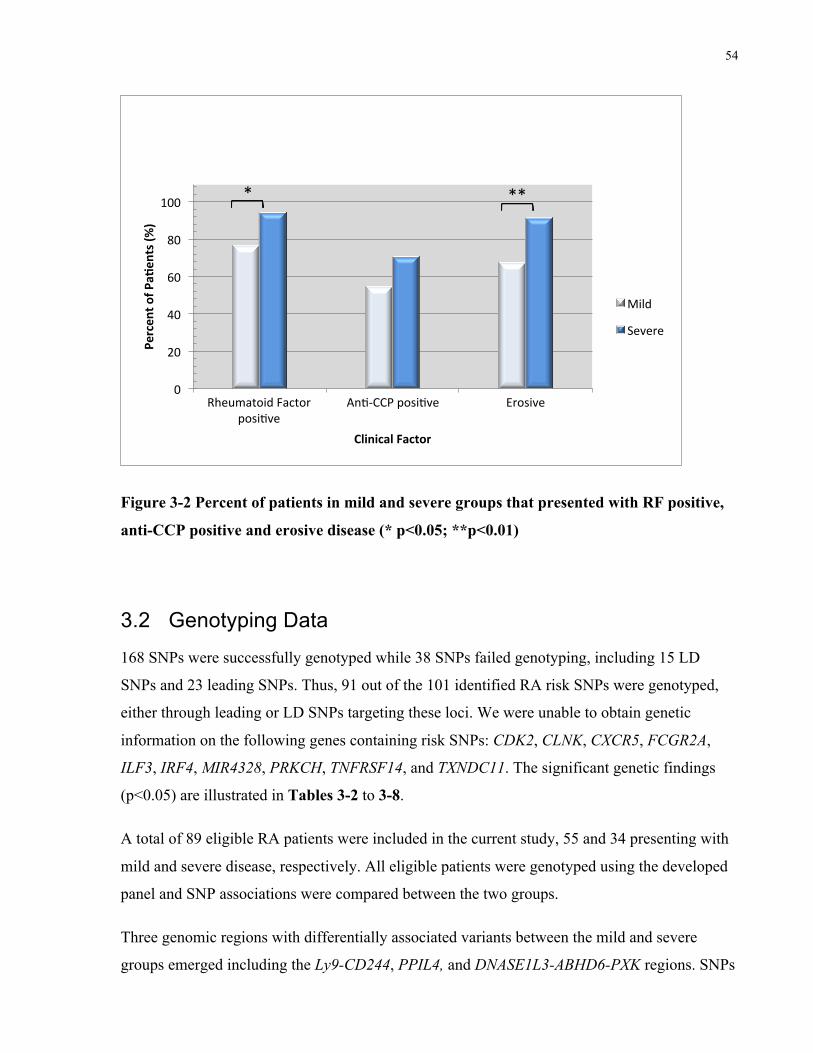
54
Figure 3-2 Percent of patients in mild and severe groups that presented with RF positive,
anti-CCP positive and erosive disease (* p<0.05; **p<0.01)
3.2 Genotyping Data
168 SNPs were successfully genotyped while 38 SNPs failed genotyping, including 15 LD
SNPs and 23 leading SNPs. Thus, 91 out of the 101 identified RA risk SNPs were genotyped,
either through leading or LD SNPs targeting these loci. We were unable to obtain genetic
information on the following genes containing risk SNPs: CDK2, CLNK, CXCR5, FCGR2A,
ILF3, IRF4, MIR4328, PRKCH, TNFRSF14, and TXNDC11. The significant genetic findings
(p<0.05) are illustrated in Tables 3-2 to 3-8.
A total of 89 eligible RA patients were included in the current study, 55 and 34 presenting with
mild and severe disease, respectively. All eligible patients were genotyped using the developed
panel and SNP associations were compared between the two groups.
Three genomic regions with differentially associated variants between the mild and severe
groups emerged including the Ly9-CD244, PPIL4, and DNASE1L3-ABHD6-PXK regions. SNPs
0
20
40
60
80
100
RheumatoidFactorposisve
Ans-CCPposisve Erosive
Percen
tofP
aaen
ts(%
)
ClinicalFactor
Mild
Severe
***
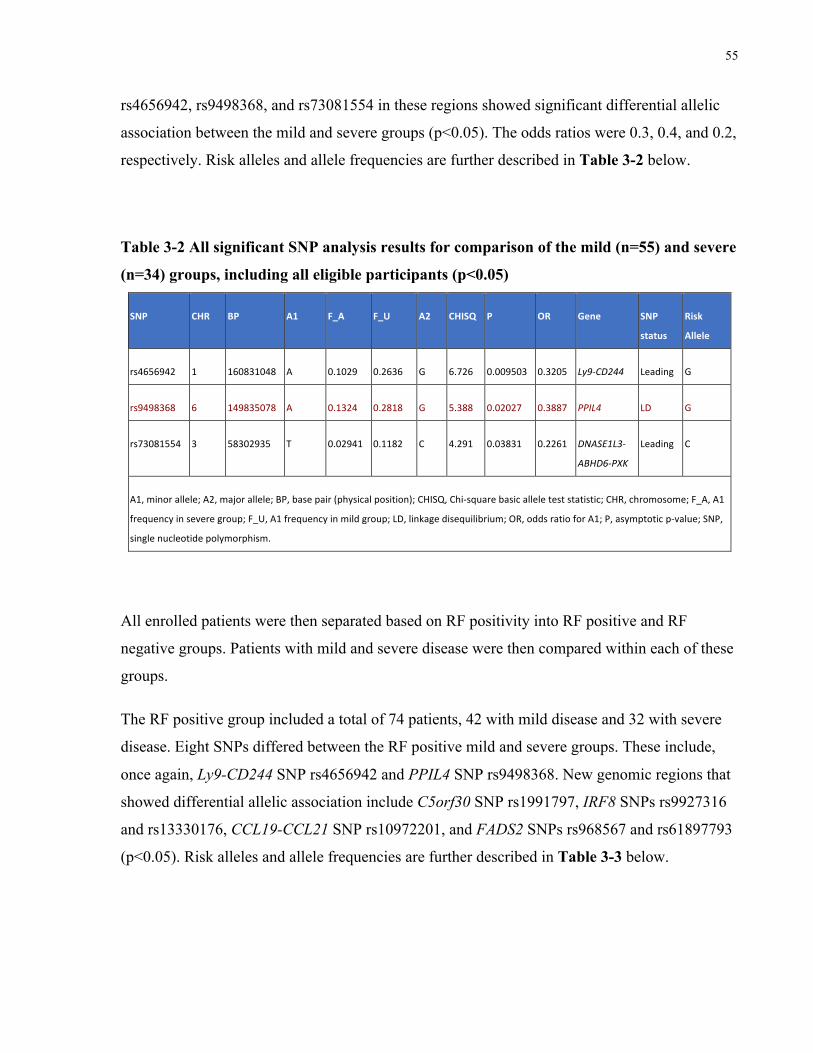
55
rs4656942, rs9498368, and rs73081554 in these regions showed significant differential allelic
association between the mild and severe groups (p<0.05). The odds ratios were 0.3, 0.4, and 0.2,
respectively. Risk alleles and allele frequencies are further described in Table 3-2 below.
Table 3-2 All significant SNP analysis results for comparison of the mild (n=55) and severe
(n=34) groups, including all eligible participants (p<0.05)
SNP CHR BP A1 F_A F_U A2 CHISQ P OR Gene SNP
status
Risk
Allele
rs4656942 1 160831048 A 0.1029 0.2636 G 6.726 0.009503 0.3205 Ly9-CD244 Leading G
rs9498368 6 149835078 A 0.1324 0.2818 G 5.388 0.02027 0.3887 PPIL4 LD G
rs73081554 3 58302935 T 0.02941 0.1182 C 4.291 0.03831 0.2261 DNASE1L3-
ABHD6-PXK
Leading C
A1,minorallele;A2,majorallele;BP,basepair(physicalposition);CHISQ,Chi-squarebasicalleleteststatistic;CHR,chromosome;F_A,A1
frequencyinseveregroup;F_U,A1frequencyinmildgroup;LD,linkagedisequilibrium;OR,oddsratioforA1;P,asymptoticp-value;SNP,
singlenucleotidepolymorphism.
All enrolled patients were then separated based on RF positivity into RF positive and RF
negative groups. Patients with mild and severe disease were then compared within each of these
groups.
The RF positive group included a total of 74 patients, 42 with mild disease and 32 with severe
disease. Eight SNPs differed between the RF positive mild and severe groups. These include,
once again, Ly9-CD244 SNP rs4656942 and PPIL4 SNP rs9498368. New genomic regions that
showed differential allelic association include C5orf30 SNP rs1991797, IRF8 SNPs rs9927316
and rs13330176, CCL19-CCL21 SNP rs10972201, and FADS2 SNPs rs968567 and rs61897793
(p<0.05). Risk alleles and allele frequencies are further described in Table 3-3 below.
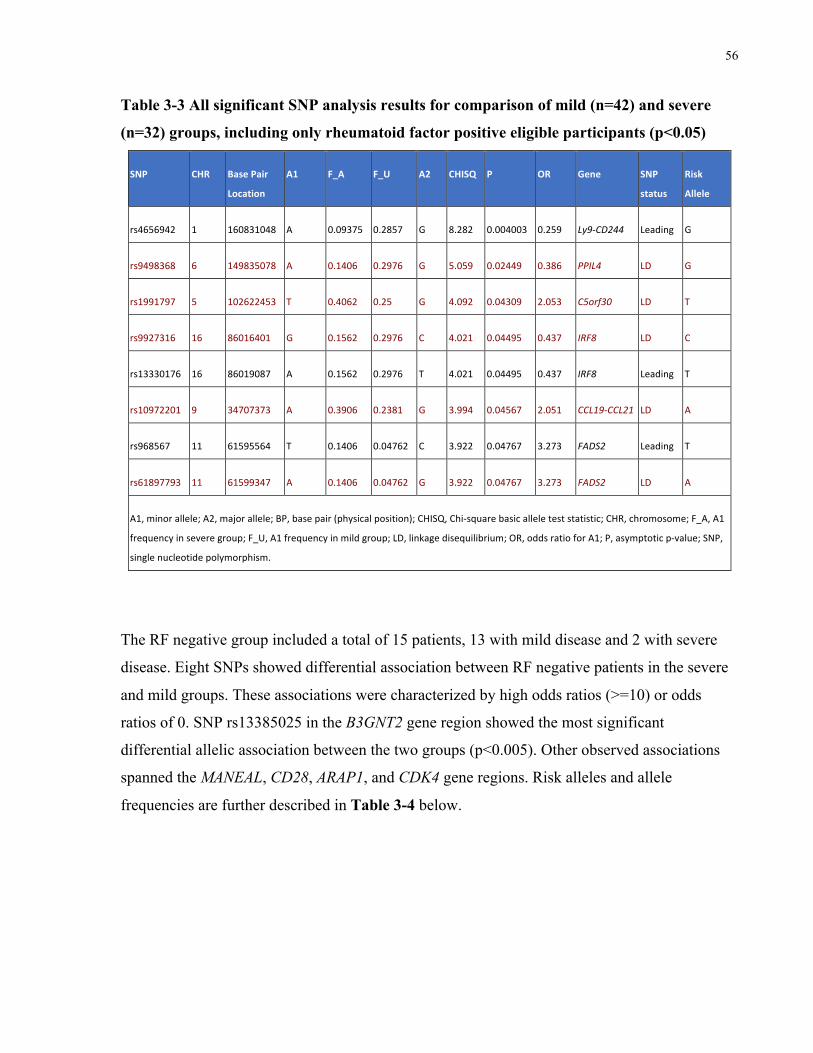
56
Table 3-3 All significant SNP analysis results for comparison of mild (n=42) and severe
(n=32) groups, including only rheumatoid factor positive eligible participants (p<0.05)
SNP CHR BasePair
Location
A1 F_A F_U A2 CHISQ P OR Gene SNP
status
Risk
Allele
rs4656942 1 160831048 A 0.09375 0.2857 G 8.282 0.004003 0.259 Ly9-CD244 Leading G
rs9498368 6 149835078 A 0.1406 0.2976 G 5.059 0.02449 0.386 PPIL4 LD G
rs1991797 5 102622453 T 0.4062 0.25 G 4.092 0.04309 2.053 C5orf30 LD T
rs9927316 16 86016401 G 0.1562 0.2976 C 4.021 0.04495 0.437 IRF8 LD C
rs13330176 16 86019087 A 0.1562 0.2976 T 4.021 0.04495 0.437 IRF8 Leading T
rs10972201 9 34707373 A 0.3906 0.2381 G 3.994 0.04567 2.051 CCL19-CCL21 LD A
rs968567 11 61595564 T 0.1406 0.04762 C 3.922 0.04767 3.273 FADS2 Leading T
rs61897793 11 61599347 A 0.1406 0.04762 G 3.922 0.04767 3.273 FADS2 LD A
A1,minorallele;A2,majorallele;BP,basepair(physicalposition);CHISQ,Chi-squarebasicalleleteststatistic;CHR,chromosome;F_A,A1
frequencyinseveregroup;F_U,A1frequencyinmildgroup;LD,linkagedisequilibrium;OR,oddsratioforA1;P,asymptoticp-value;SNP,
singlenucleotidepolymorphism.
The RF negative group included a total of 15 patients, 13 with mild disease and 2 with severe
disease. Eight SNPs showed differential association between RF negative patients in the severe
and mild groups. These associations were characterized by high odds ratios (>=10) or odds
ratios of 0. SNP rs13385025 in the B3GNT2 gene region showed the most significant
differential allelic association between the two groups (p<0.005). Other observed associations
spanned the MANEAL, CD28, ARAP1, and CDK4 gene regions. Risk alleles and allele
frequencies are further described in Table 3-4 below.
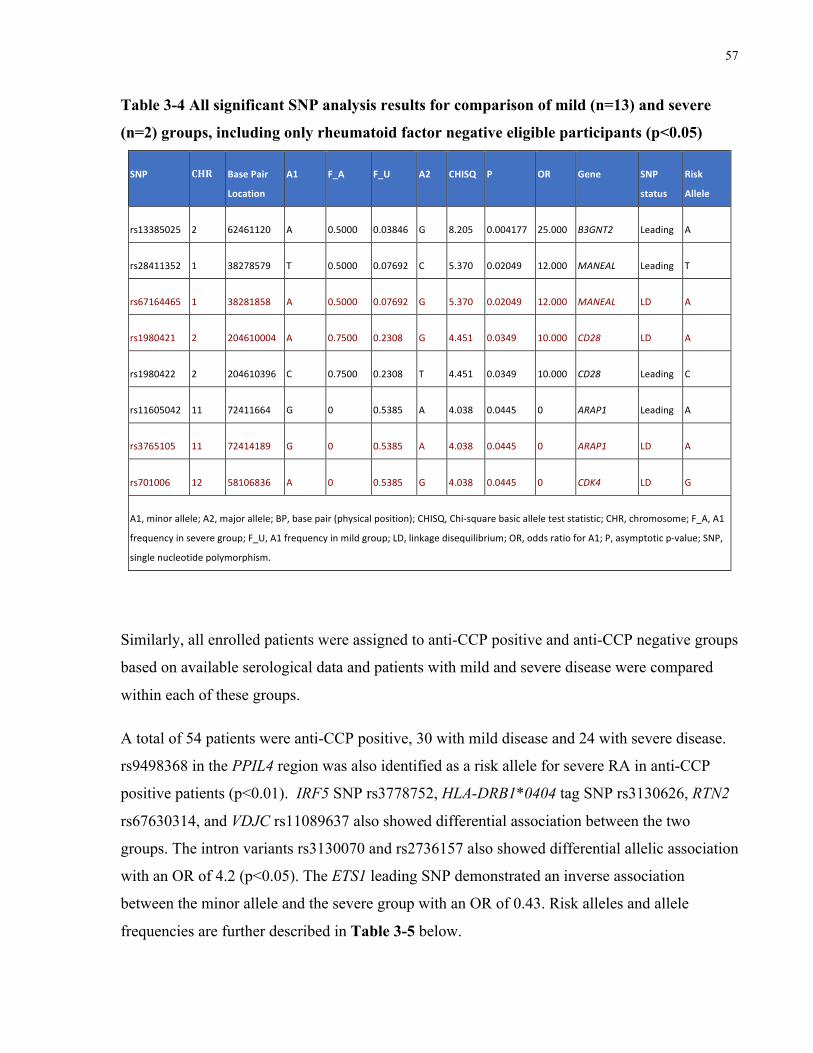
57
Table 3-4 All significant SNP analysis results for comparison of mild (n=13) and severe
(n=2) groups, including only rheumatoid factor negative eligible participants (p<0.05)
SNP CHR BasePair
Location
A1 F_A F_U A2 CHISQ P OR Gene SNP
status
Risk
Allele
rs13385025 2 62461120 A 0.5000 0.03846 G 8.205 0.004177 25.000 B3GNT2 Leading A
rs28411352 1 38278579 T 0.5000 0.07692 C 5.370 0.02049 12.000 MANEAL Leading T
rs67164465 1 38281858 A 0.5000 0.07692 G 5.370 0.02049 12.000 MANEAL LD A
rs1980421 2 204610004 A 0.7500 0.2308 G 4.451 0.0349 10.000 CD28 LD A
rs1980422 2 204610396 C 0.7500 0.2308 T 4.451 0.0349 10.000 CD28 Leading C
rs11605042 11 72411664 G 0 0.5385 A 4.038 0.0445 0 ARAP1 Leading A
rs3765105 11 72414189 G 0 0.5385 A 4.038 0.0445 0 ARAP1 LD A
rs701006 12 58106836 A 0 0.5385 G 4.038 0.0445 0 CDK4 LD G
A1,minorallele;A2,majorallele;BP,basepair(physicalposition);CHISQ,Chi-squarebasicalleleteststatistic;CHR,chromosome;F_A,A1
frequencyinseveregroup;F_U,A1frequencyinmildgroup;LD,linkagedisequilibrium;OR,oddsratioforA1;P,asymptoticp-value;SNP,
singlenucleotidepolymorphism.
Similarly, all enrolled patients were assigned to anti-CCP positive and anti-CCP negative groups
based on available serological data and patients with mild and severe disease were compared
within each of these groups.
A total of 54 patients were anti-CCP positive, 30 with mild disease and 24 with severe disease.
rs9498368 in the PPIL4 region was also identified as a risk allele for severe RA in anti-CCP
positive patients (p<0.01). IRF5 SNP rs3778752, HLA-DRB1*0404 tag SNP rs3130626, RTN2
rs67630314, and VDJC rs11089637 also showed differential association between the two
groups. The intron variants rs3130070 and rs2736157 also showed differential allelic association
with an OR of 4.2 (p<0.05). The ETS1 leading SNP demonstrated an inverse association
between the minor allele and the severe group with an OR of 0.43. Risk alleles and allele
frequencies are further described in Table 3-5 below.
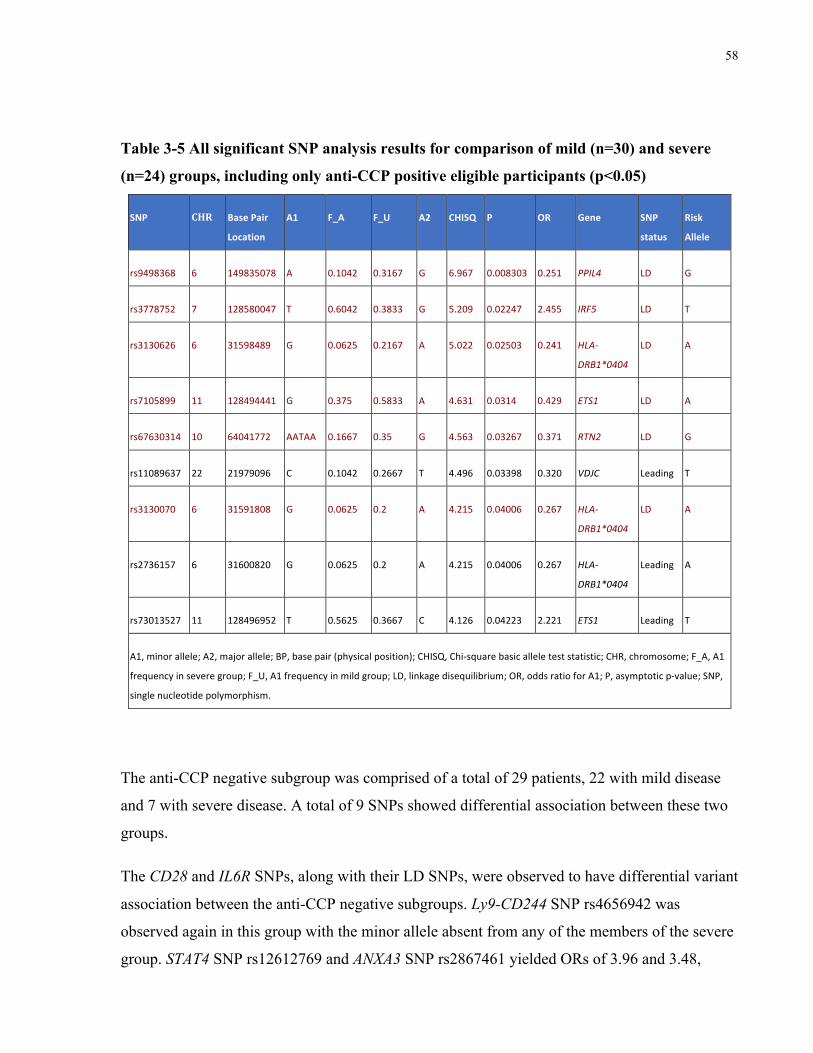
58
Table 3-5 All significant SNP analysis results for comparison of mild (n=30) and severe
(n=24) groups, including only anti-CCP positive eligible participants (p<0.05)
SNP CHR BasePair
Location
A1 F_A F_U A2 CHISQ P OR Gene SNP
status
Risk
Allele
rs9498368 6 149835078 A 0.1042 0.3167 G 6.967 0.008303 0.251 PPIL4 LD G
rs3778752 7 128580047 T 0.6042 0.3833 G 5.209 0.02247 2.455 IRF5 LD T
rs3130626 6 31598489 G 0.0625 0.2167 A 5.022 0.02503 0.241 HLA-
DRB1*0404
LD A
rs7105899 11 128494441 G 0.375 0.5833 A 4.631 0.0314 0.429 ETS1 LD A
rs67630314 10 64041772 AATAA 0.1667 0.35 G 4.563 0.03267 0.371 RTN2 LD G
rs11089637 22 21979096 C 0.1042 0.2667 T 4.496 0.03398 0.320 VDJC Leading T
rs3130070 6 31591808 G 0.0625 0.2 A 4.215 0.04006 0.267 HLA-
DRB1*0404
LD A
rs2736157 6 31600820 G 0.0625 0.2 A 4.215 0.04006 0.267 HLA-
DRB1*0404
Leading A
rs73013527 11 128496952 T 0.5625 0.3667 C 4.126 0.04223 2.221 ETS1 Leading T
A1,minorallele;A2,majorallele;BP,basepair(physicalposition);CHISQ,Chi-squarebasicalleleteststatistic;CHR,chromosome;F_A,A1
frequencyinseveregroup;F_U,A1frequencyinmildgroup;LD,linkagedisequilibrium;OR,oddsratioforA1;P,asymptoticp-value;SNP,
singlenucleotidepolymorphism.
The anti-CCP negative subgroup was comprised of a total of 29 patients, 22 with mild disease
and 7 with severe disease. A total of 9 SNPs showed differential association between these two
groups.
The CD28 and IL6R SNPs, along with their LD SNPs, were observed to have differential variant
association between the anti-CCP negative subgroups. Ly9-CD244 SNP rs4656942 was
observed again in this group with the minor allele absent from any of the members of the severe
group. STAT4 SNP rs12612769 and ANXA3 SNP rs2867461 yielded ORs of 3.96 and 3.48,
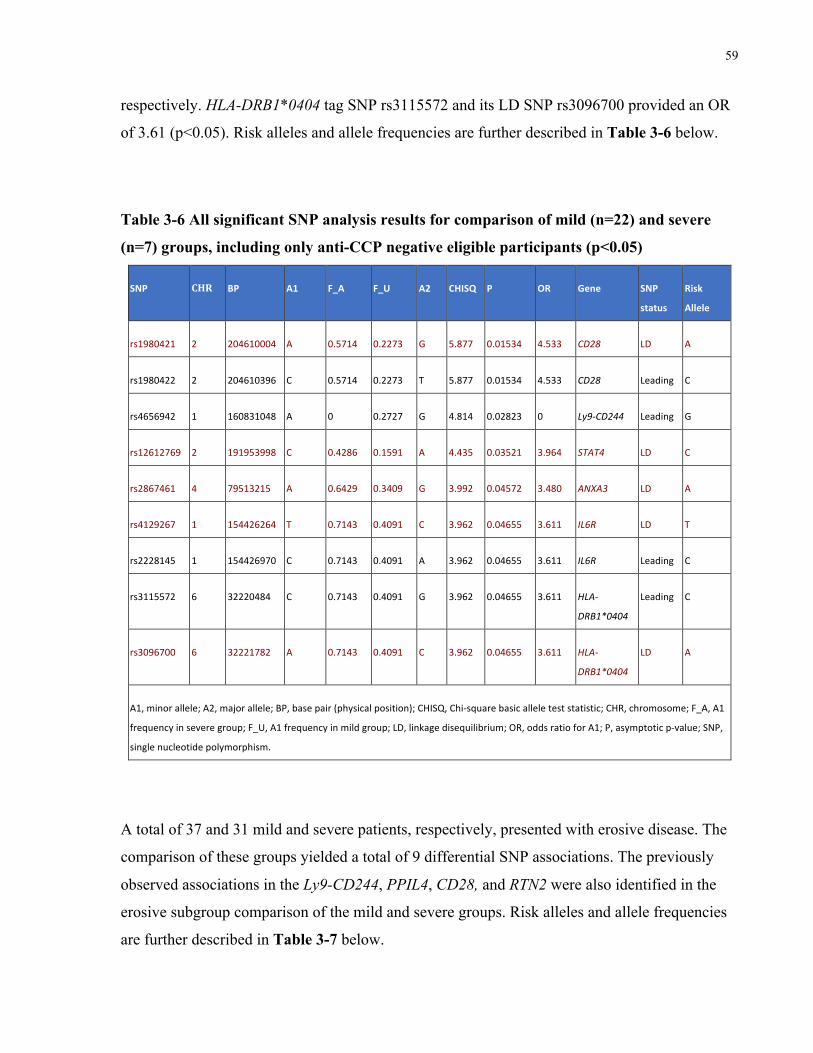
59
respectively. HLA-DRB1*0404 tag SNP rs3115572 and its LD SNP rs3096700 provided an OR
of 3.61 (p<0.05). Risk alleles and allele frequencies are further described in Table 3-6 below.
Table 3-6 All significant SNP analysis results for comparison of mild (n=22) and severe
(n=7) groups, including only anti-CCP negative eligible participants (p<0.05)
SNP CHR BP A1 F_A F_U A2 CHISQ P OR Gene SNP
status
Risk
Allele
rs1980421 2 204610004 A 0.5714 0.2273 G 5.877 0.01534 4.533 CD28 LD A
rs1980422 2 204610396 C 0.5714 0.2273 T 5.877 0.01534 4.533 CD28 Leading C
rs4656942 1 160831048 A 0 0.2727 G 4.814 0.02823 0 Ly9-CD244 Leading G
rs12612769 2 191953998 C 0.4286 0.1591 A 4.435 0.03521 3.964 STAT4 LD C
rs2867461 4 79513215 A 0.6429 0.3409 G 3.992 0.04572 3.480 ANXA3 LD A
rs4129267 1 154426264 T 0.7143 0.4091 C 3.962 0.04655 3.611 IL6R LD T
rs2228145 1 154426970 C 0.7143 0.4091 A 3.962 0.04655 3.611 IL6R Leading C
rs3115572 6 32220484 C 0.7143 0.4091 G 3.962 0.04655 3.611 HLA-
DRB1*0404
Leading C
rs3096700 6 32221782 A 0.7143 0.4091 C 3.962 0.04655 3.611 HLA-
DRB1*0404
LD A
A1,minorallele;A2,majorallele;BP,basepair(physicalposition);CHISQ,Chi-squarebasicalleleteststatistic;CHR,chromosome;F_A,A1
frequencyinseveregroup;F_U,A1frequencyinmildgroup;LD,linkagedisequilibrium;OR,oddsratioforA1;P,asymptoticp-value;SNP,
singlenucleotidepolymorphism.
A total of 37 and 31 mild and severe patients, respectively, presented with erosive disease. The
comparison of these groups yielded a total of 9 differential SNP associations. The previously
observed associations in the Ly9-CD244, PPIL4, CD28, and RTN2 were also identified in the
erosive subgroup comparison of the mild and severe groups. Risk alleles and allele frequencies
are further described in Table 3-7 below.
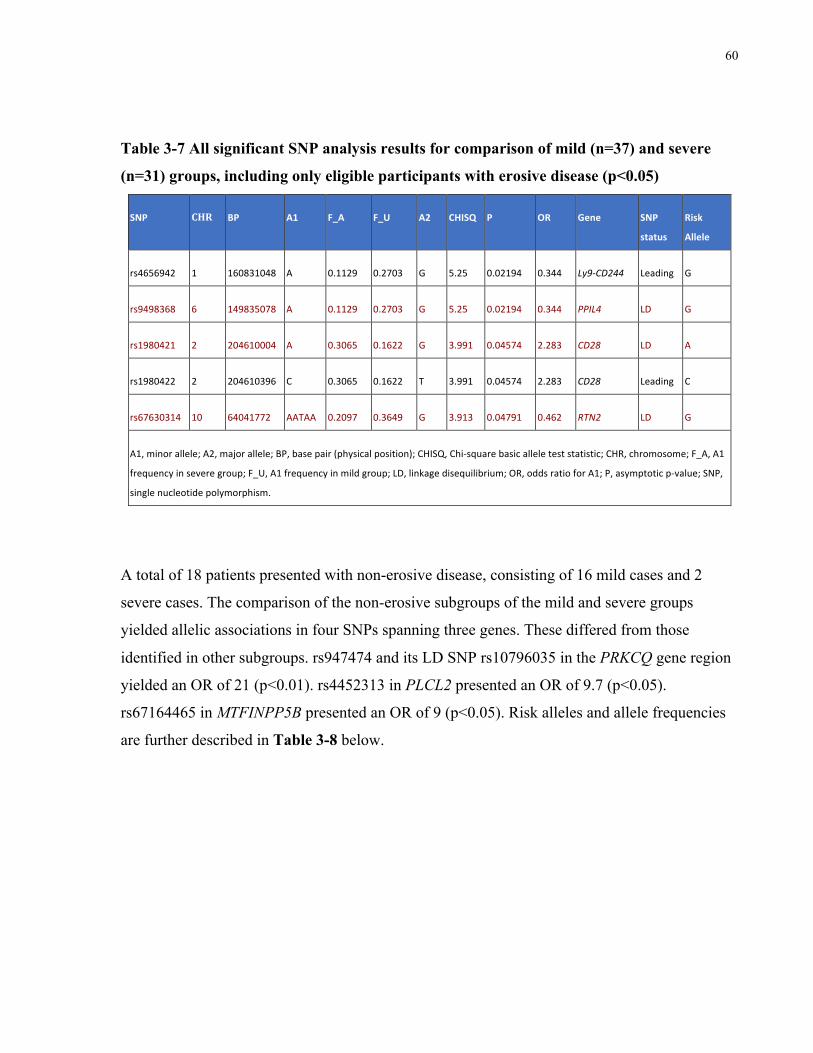
60
Table 3-7 All significant SNP analysis results for comparison of mild (n=37) and severe
(n=31) groups, including only eligible participants with erosive disease (p<0.05)
SNP CHR BP A1 F_A F_U A2 CHISQ P OR Gene SNP
status
Risk
Allele
rs4656942 1 160831048 A 0.1129 0.2703 G 5.25 0.02194 0.344 Ly9-CD244 Leading G
rs9498368 6 149835078 A 0.1129 0.2703 G 5.25 0.02194 0.344 PPIL4 LD G
rs1980421 2 204610004 A 0.3065 0.1622 G 3.991 0.04574 2.283 CD28 LD A
rs1980422 2 204610396 C 0.3065 0.1622 T 3.991 0.04574 2.283 CD28 Leading C
rs67630314 10 64041772 AATAA 0.2097 0.3649 G 3.913 0.04791 0.462 RTN2 LD G
A1,minorallele;A2,majorallele;BP,basepair(physicalposition);CHISQ,Chi-squarebasicalleleteststatistic;CHR,chromosome;F_A,A1
frequencyinseveregroup;F_U,A1frequencyinmildgroup;LD,linkagedisequilibrium;OR,oddsratioforA1;P,asymptoticp-value;SNP,
singlenucleotidepolymorphism.
A total of 18 patients presented with non-erosive disease, consisting of 16 mild cases and 2
severe cases. The comparison of the non-erosive subgroups of the mild and severe groups
yielded allelic associations in four SNPs spanning three genes. These differed from those
identified in other subgroups. rs947474 and its LD SNP rs10796035 in the PRKCQ gene region
yielded an OR of 21 (p<0.01). rs4452313 in PLCL2 presented an OR of 9.7 (p<0.05).
rs67164465 in MTFINPP5B presented an OR of 9 (p<0.05). Risk alleles and allele frequencies
are further described in Table 3-8 below.
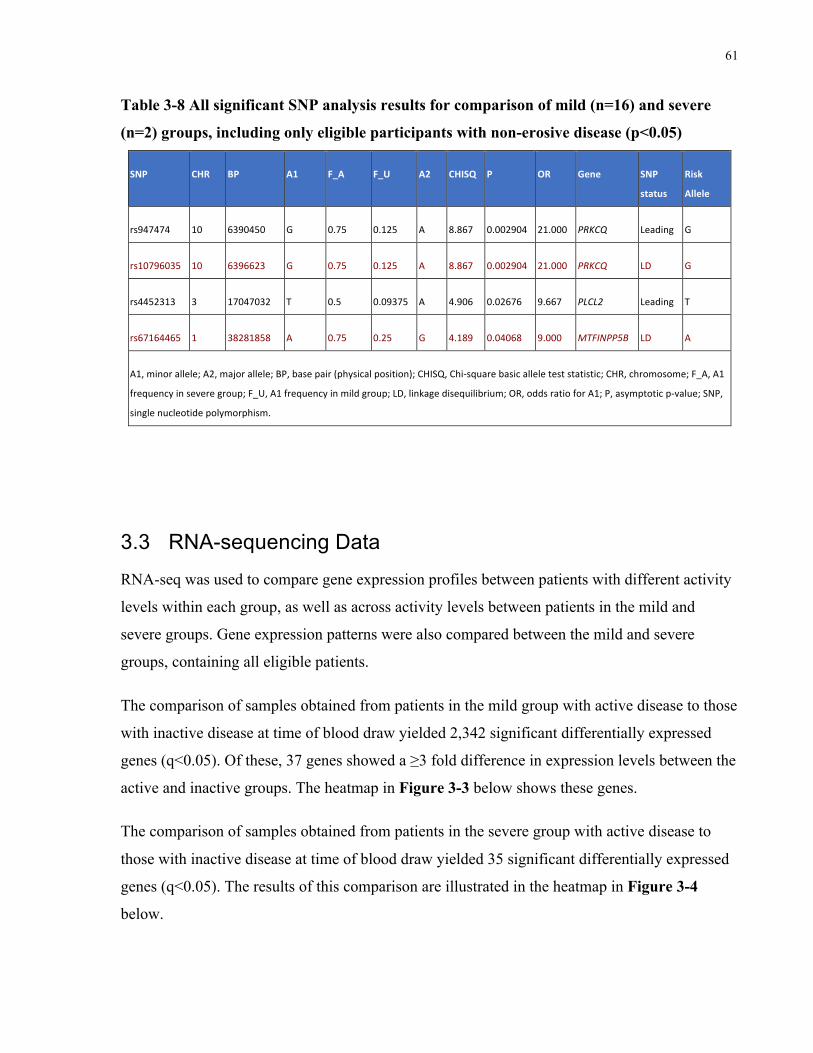
61
Table 3-8 All significant SNP analysis results for comparison of mild (n=16) and severe
(n=2) groups, including only eligible participants with non-erosive disease (p<0.05)
SNP CHR BP A1 F_A F_U A2 CHISQ P OR Gene SNP
status
Risk
Allele
rs947474 10 6390450 G 0.75 0.125 A 8.867 0.002904 21.000 PRKCQ Leading G
rs10796035 10 6396623 G 0.75 0.125 A 8.867 0.002904 21.000 PRKCQ LD G
rs4452313 3 17047032 T 0.5 0.09375 A 4.906 0.02676 9.667 PLCL2 Leading T
rs67164465 1 38281858 A 0.75 0.25 G 4.189 0.04068 9.000 MTFINPP5B LD A
A1,minorallele;A2,majorallele;BP,basepair(physicalposition);CHISQ,Chi-squarebasicalleleteststatistic;CHR,chromosome;F_A,A1
frequencyinseveregroup;F_U,A1frequencyinmildgroup;LD,linkagedisequilibrium;OR,oddsratioforA1;P,asymptoticp-value;SNP,
singlenucleotidepolymorphism.
3.3 RNA-sequencing Data
RNA-seq was used to compare gene expression profiles between patients with different activity
levels within each group, as well as across activity levels between patients in the mild and
severe groups. Gene expression patterns were also compared between the mild and severe
groups, containing all eligible patients.
The comparison of samples obtained from patients in the mild group with active disease to those
with inactive disease at time of blood draw yielded 2,342 significant differentially expressed
genes (q<0.05). Of these, 37 genes showed a ≥3 fold difference in expression levels between the
active and inactive groups. The heatmap in Figure 3-3 below shows these genes.
The comparison of samples obtained from patients in the severe group with active disease to
those with inactive disease at time of blood draw yielded 35 significant differentially expressed
genes (q<0.05). The results of this comparison are illustrated in the heatmap in Figure 3-4
below.
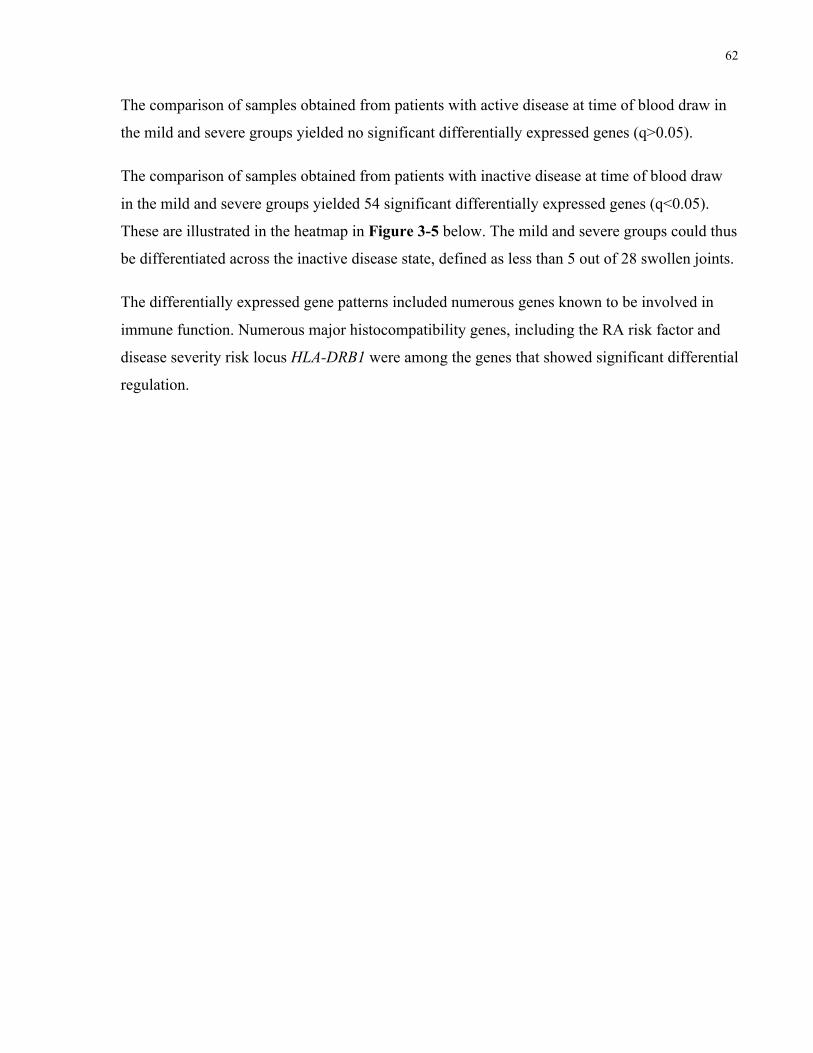
62
The comparison of samples obtained from patients with active disease at time of blood draw in
the mild and severe groups yielded no significant differentially expressed genes (q>0.05).
The comparison of samples obtained from patients with inactive disease at time of blood draw
in the mild and severe groups yielded 54 significant differentially expressed genes (q<0.05).
These are illustrated in the heatmap in Figure 3-5 below. The mild and severe groups could thus
be differentiated across the inactive disease state, defined as less than 5 out of 28 swollen joints.
The differentially expressed gene patterns included numerous genes known to be involved in
immune function. Numerous major histocompatibility genes, including the RA risk factor and
disease severity risk locus HLA-DRB1 were among the genes that showed significant differential
regulation.
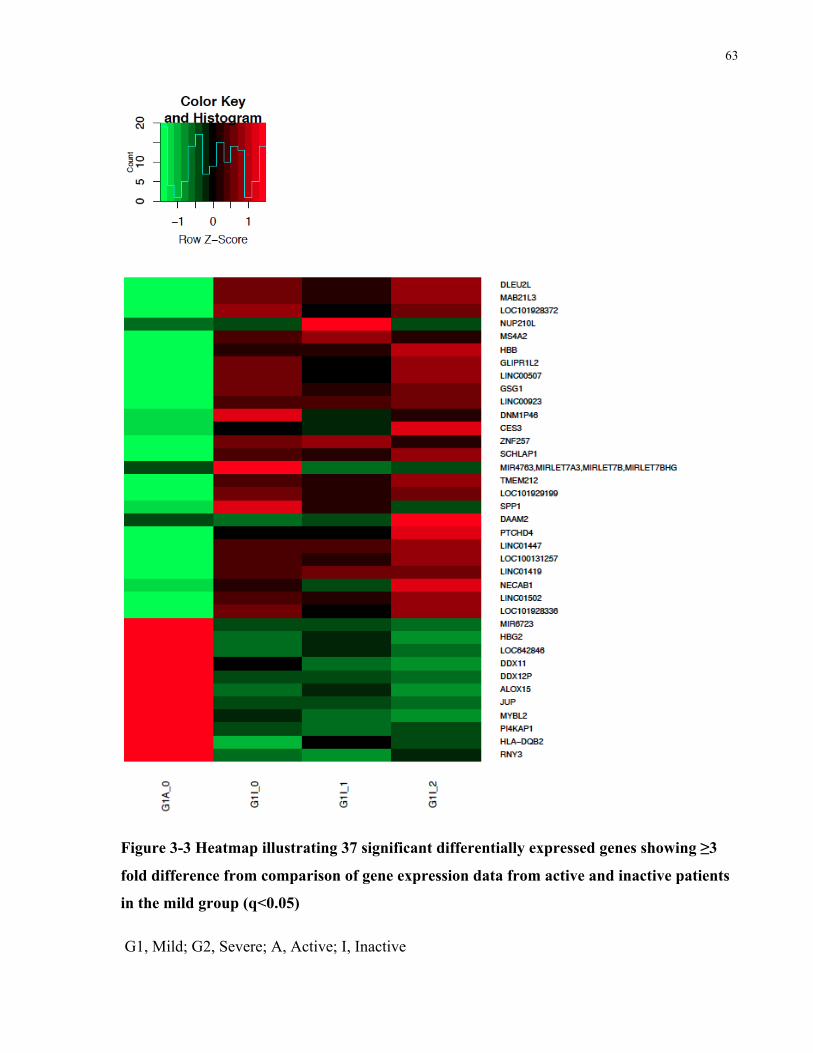
63
Figure 3-3 Heatmap illustrating 37 significant differentially expressed genes showing ≥3
fold difference from comparison of gene expression data from active and inactive patients
in the mild group (q<0.05)
G1, Mild; G2, Severe; A, Active; I, Inactive
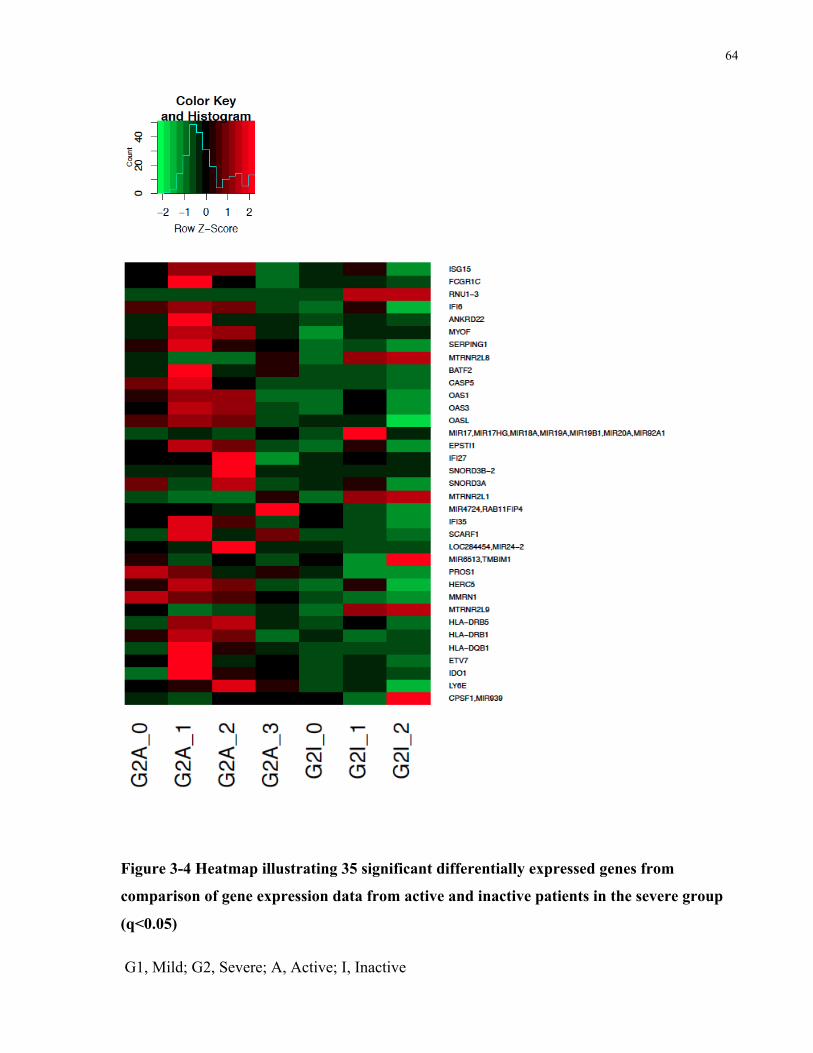
64
Figure 3-4 Heatmap illustrating 35 significant differentially expressed genes from
comparison of gene expression data from active and inactive patients in the severe group
(q<0.05)
G1, Mild; G2, Severe; A, Active; I, Inactive
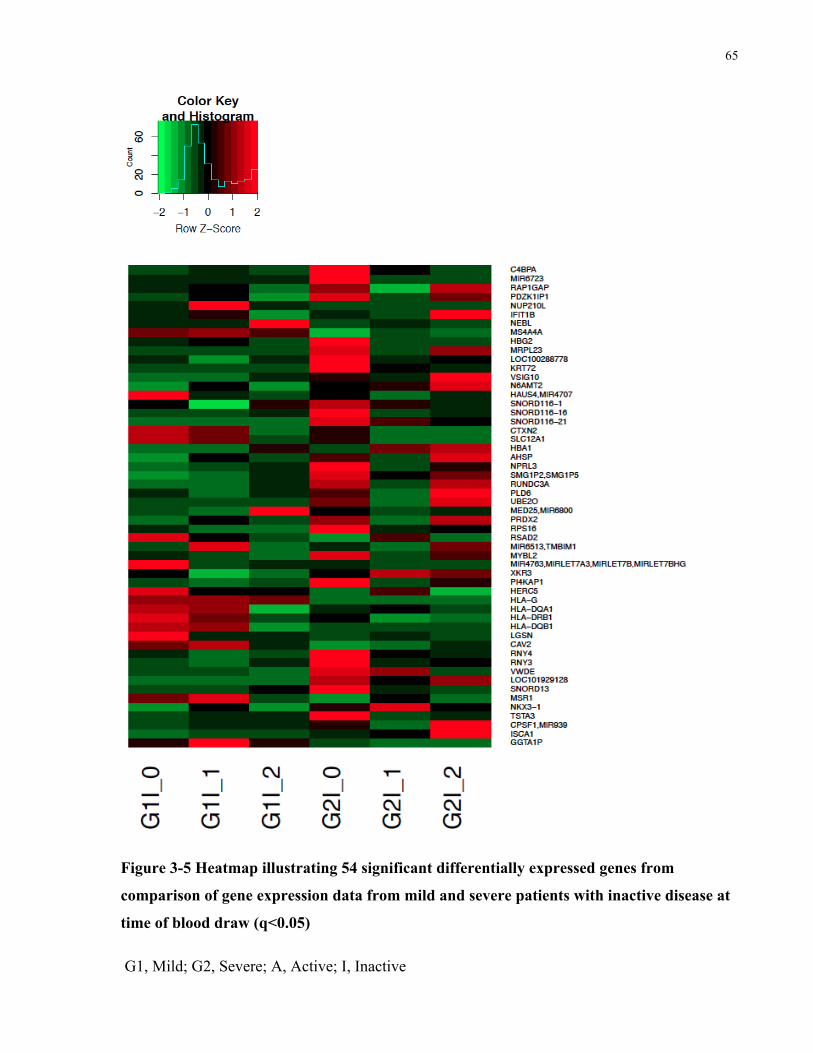
65
Figure 3-5 Heatmap illustrating 54 significant differentially expressed genes from
comparison of gene expression data from mild and severe patients with inactive disease at
time of blood draw (q<0.05)
G1, Mild; G2, Severe; A, Active; I, Inactive
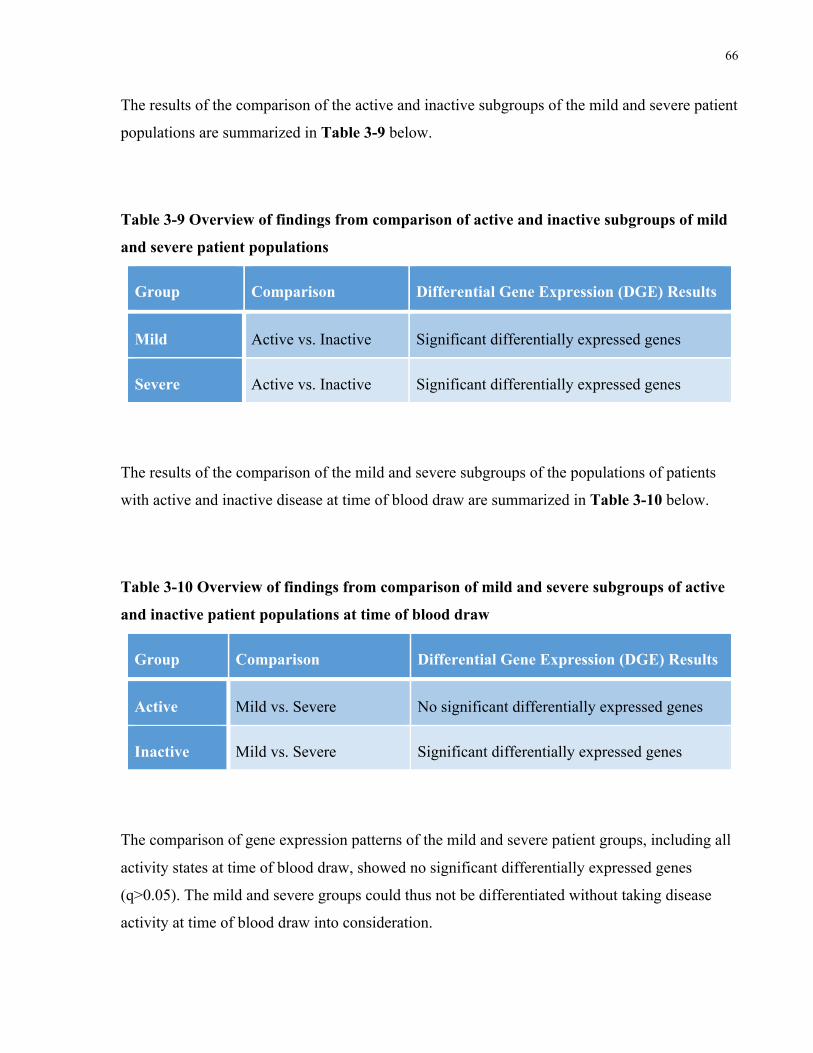
66
The results of the comparison of the active and inactive subgroups of the mild and severe patient
populations are summarized in Table 3-9 below.
Table 3-9 Overview of findings from comparison of active and inactive subgroups of mild
and severe patient populations
Group Comparison Differential Gene Expression (DGE) Results
Mild Active vs. Inactive Significant differentially expressed genes
Severe Active vs. Inactive Significant differentially expressed genes
The results of the comparison of the mild and severe subgroups of the populations of patients
with active and inactive disease at time of blood draw are summarized in Table 3-10 below.
Table 3-10 Overview of findings from comparison of mild and severe subgroups of active
and inactive patient populations at time of blood draw
Group Comparison Differential Gene Expression (DGE) Results
Active Mild vs. Severe No significant differentially expressed genes
Inactive Mild vs. Severe Significant differentially expressed genes
The comparison of gene expression patterns of the mild and severe patient groups, including all
activity states at time of blood draw, showed no significant differentially expressed genes
(q>0.05). The mild and severe groups could thus not be differentiated without taking disease
activity at time of blood draw into consideration.

67
It can be seen in each of the heatmaps in Figures 3-2 to 3-4 that there remains individual
variability within each group.
Fewer gene expression differences were observed between patients with active and inactive
disease in the severe group as compared to the mild group, with 35 and 2,342 differentially
expressed genes, respectively.
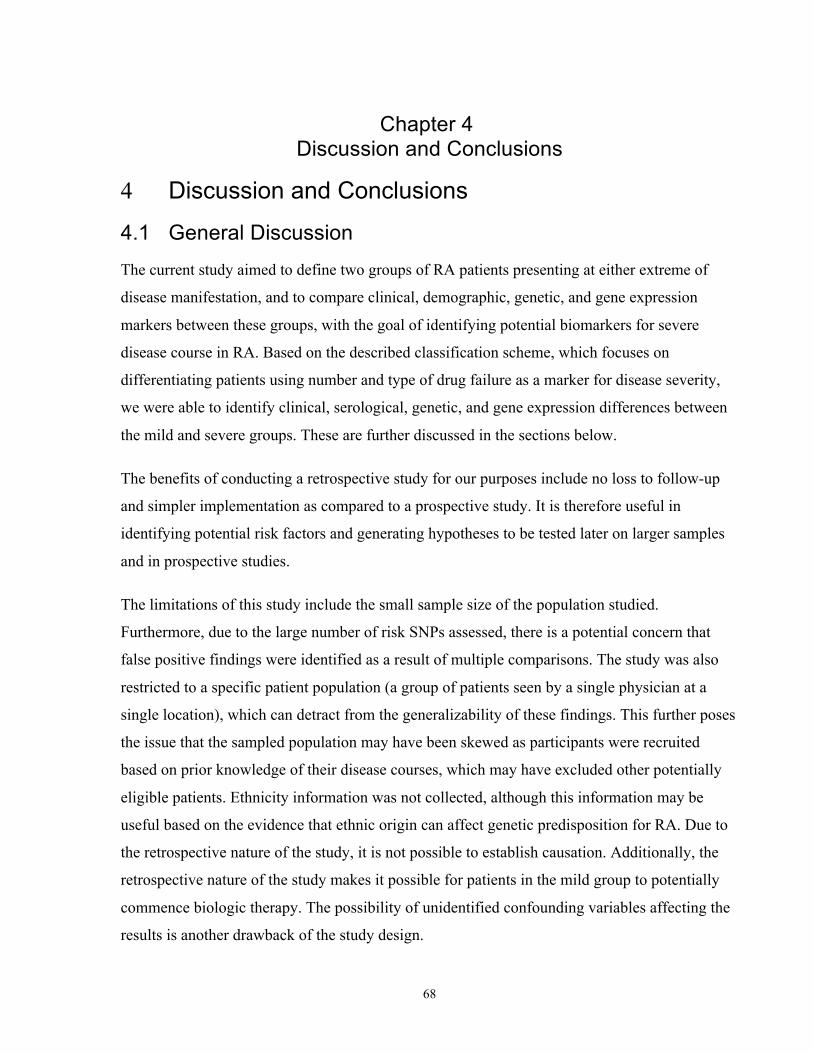
68
Chapter 4 Discussion and Conclusions
Discussion and Conclusions 4
4.1 General Discussion
The current study aimed to define two groups of RA patients presenting at either extreme of
disease manifestation, and to compare clinical, demographic, genetic, and gene expression
markers between these groups, with the goal of identifying potential biomarkers for severe
disease course in RA. Based on the described classification scheme, which focuses on
differentiating patients using number and type of drug failure as a marker for disease severity,
we were able to identify clinical, serological, genetic, and gene expression differences between
the mild and severe groups. These are further discussed in the sections below.
The benefits of conducting a retrospective study for our purposes include no loss to follow-up
and simpler implementation as compared to a prospective study. It is therefore useful in
identifying potential risk factors and generating hypotheses to be tested later on larger samples
and in prospective studies.
The limitations of this study include the small sample size of the population studied.
Furthermore, due to the large number of risk SNPs assessed, there is a potential concern that
false positive findings were identified as a result of multiple comparisons. The study was also
restricted to a specific patient population (a group of patients seen by a single physician at a
single location), which can detract from the generalizability of these findings. This further poses
the issue that the sampled population may have been skewed as participants were recruited
based on prior knowledge of their disease courses, which may have excluded other potentially
eligible patients. Ethnicity information was not collected, although this information may be
useful based on the evidence that ethnic origin can affect genetic predisposition for RA. Due to
the retrospective nature of the study, it is not possible to establish causation. Additionally, the
retrospective nature of the study makes it possible for patients in the mild group to potentially
commence biologic therapy. The possibility of unidentified confounding variables affecting the
results is another drawback of the study design.
69
Increasing sample size, replicating findings, and diversifying the patient population, as well as
considering its ethnic composition, can serve to eliminate these limitations. Additionally,
conducting a prospective study will aid in eliminating many of the other limitations discussed.
Although this study did not deconstruct biologics based on mechanism of action, we may learn
that this ultimately plays a role in the starkly contrasting disease courses of the patients in the
two groups. Further investigation may guide treatment recommendations, offering a more
precise sequence in which each drug is administered, or even point to novel pathways that can
be targeted for patients with treatment-resistant disease.
4.1.1 Clinical and Demographic Findings
The developed group classification criteria have shown clinical relevance, despite the exclusion
of previously-validated classification methods or measures. Our cutoff point of three years was
based on the understanding that patients are assessed every three to six months, therefore
providing sufficient time for any requisite biologic initiation, as well as assessment of treatment
failure. The average disease duration for the mild group was 21.9 ± 12.1 years with no required
treatment escalation for this group. Disease duration for all patients in this group was found to
be 5 or more years, further demonstrating that all patients in this group did in fact have well-
established mild RA. Similarly, the cutoff point of failure of three or more biologics to qualify
for the severe group was based on the recommended escalation of biologic treatment. The
average number of biologics that patients in the severe group had been treated with was 5.4 ±
1.5. A random sample of patients in the severe group showed average biologic treatment
duration to be 17.4 ± 13.9 months, confirming that biologic switches were only being prescribed
after a reasonable trial of each therapy. In designing these criteria, we attempted to capture
disease severity from a physician’s clinical standpoint, distinguishing cases that are difficult to
manage from those that are responsive to currently-available therapies and treatment guidelines.
The results of the current study present several interesting trends. No significant differences
between the two groups were identified for gender, disease duration, smoking status, family
history, and anti-CCP status. Differences were observed, however, in presence of erosions, RF
status, and average age between the two groups.
70
In the studied population of RA patients, the severe group was significantly younger, on
average, than the patients in the mild group. Patients in the mild group had an average age of
64.2 ± 12.7 years while the severe group had an average age of 57.7 ±10.7years. The groups
demonstrated comparable mean disease duration: 20.9 ± 12.1 years for the mild group and 21.5
± 11.3 years for the severe group. In a way, this increases the apparent severity of the severe
group’s disease. It creates the profile of an RA patient who is not only nonresponsive to
currently-available treatment regimens but also more likely to have joint damage at a younger
age than other patients in the RA population.
RF positive patients comprised 76% of the mild group as compared to 94% of the severe group,
yielding a significant difference (p<0.05). This once again corroborates well-established studies
that demonstrate that RF positivity is correlated with a worse prognosis (Scott et al. 2013).
Furthermore, 67% of the mild group was identified to be positive for erosions as compared to
91% of the severe group, a difference reaching statistical significance (p<0.05). This also
confirms our premise that number of drug failures can be used to classify patients’ disease
severity, of which one important hallmark is accumulation of more radiological damage over
time.
Both groups were consistent with RA gender trends, with 3.2 and 4.6 times more females than
males in the mild and severe groups, respectively. Furthermore, females comprised a greater
percentage of the severe group (95%) than the mild group (74%). Interestingly, contrary to the
findings of other studies investigating prognostic markers (Scott et al. 2013), a significantly
larger proportion of females affected by severe, treatment-resistant disease was not observed.
A similar proportion of patients in each group had smoked at one point in their lives (27% and
26% in the mild and severe groups, respectively). This suggests that, contrary to other studies on
disease severity (Manfredsdottir et al. 2006, Másdóttir et al. 2000), although smoking may be an
important risk factor for the development of RA, it may not necessarily have an impact on the
severity and treatment-resistance of the disease. These discrepancies may be attributed to inter-
study differences in defining disease severity and suggests that perhaps our definition pertains to
the classification of a patient group with a larger contribution from genetic, as opposed to
environmental, factors.
71
All other tested clinical and demographic variables showed no significant differences, however
there were several interesting trends. Of note, a larger proportion (16% more) of patients testing
positive for anti-CCP was seen in the severe group, as compared to the mild group, though this
finding was not found to be statistically significant (p>0.05). Similar to RF positivity, anti-CCP
positivity has been associated with worse disease outcomes in RA patients. Though the observed
trend in our data lends support to previous findings, the difference did not reach statistical
significance. This difference could be attributed to the small sample size, missing data, or the
limited data set.
Missing clinical data (i.e. unknown erosion, RF, anti-CCP status) was excluded when
performing the statistical comparisons. This exclusion of missing data assumes that samples
with known data are representative of the entire population, which may not necessarily be true.
Patients with no mention of personal and family history measures were considered to be
negative for these variables. Importantly, the results for these measures may be different from
those found in the current study should this assumption prove to be false.
Our approach differs from other studies investigating disease severity as the majority of these
studies use joint damage and/or disability to assess severity. Our results show, however, that a
larger proportion of patients in the severe group have erosions on radiologic imaging. This
suggests that our chosen disease severity categorization scheme overlaps with other schemes
based on joint damage. Furthermore, RF is one of the earliest biomarkers used to predict disease
severity in RA and positive testing for RF correlates with worse prognosis (Scott et al. 2013).
Our finding that the severe group contains a larger proportion of RF positive patients further
supports this correlation. Together, these findings lend crucial support to our premise that the
number of drug failures and the classification of patients based on our designed criteria yield
clinically relevant prognostic information.
4.1.2 Genetic Findings
The association of previously identified RA risk SNPs with each group was subsequently
investigated and revealed several interesting results. The mild and severe groups were
compared, including all eligible patients, followed by the comparison of RF, anti-CCP, and
72
erosion positive and negative subgroups, all demonstrating statistically significant differential
allelic associations. The comparison of both groups, prior to subgroup analysis, yielded
differential allelic association at three distinct genetic loci. The association of the Ly9-CD244
rs4656942 G allele with the severe group was by far the most significant (p<0.01). The OR for
this association was 0.32 for the minor non-risk allele, which translates to a 3.12 OR for the risk
allele. Patients in the severe group were therefore 3.12 times more likely to carry the G allele
than the A allele for this SNP. The Ly9-CD244 is part of the chromosome 1 region coding for
numerous stimulatory lymphocytic activation molecule (SLAM) family members. These
molecules are involved in both the innate and adaptive immune responses. Both Ly9 and CD244
are protein-coding genes, which code for lymphocytic antigen 9 and CD244, respectively
(Suzuki et al. 2008). The risk SNP in the Ly9-CD244 gene region was found when comparing
all members of both groups as well as in the RF positive and anti-CCP negative patient
populations. The odds ratio was even higher (3.86) for the comparison of mild versus severe RF
positive patients (p<0.05). This could indicate that using RF status in conjunction with
genotyping data could better differentiate mild from severe disease courses in RA patients.
The G allele of the PPIL4 SNP rs9498368 as well as the C allele of the DNASE1L3-ABHD6PXK
SNP rs73081554 also demonstrated significant association with the severe group. The risk SNP
association in the PPIL4 gene was seen for the entire population investigated but when the
population was further subdivided, the association only held true for the seropositive (RF and
anti-CCP) and erosive subgroups. The association of the G risk allele became especially
significant in the comparison of mild and severe anti-CCP positive patients and yielded a
slightly higher OR of 3.99 (p<0.01). PPIL4 encodes peptidylprolyl isomerase like 4, a member
of the cyclophilin family. Cyclophilins are enzymes that catalyze the isomerization of prolines
and are the targets of certain immunosuppressive therapies such as the use of cyclosporin for the
prevention of transplant rejection (Davis et al. 2010).
The comparison of the anti-CCP negative subgroup yielded differential allelic associations in
SNPs spanning the CD28, Ly9-CD244, IL6R, and HLA-DRB1 loci. The findings that IL6R and
HLA-DRB1 SNPs were found to offer discriminatory power between mild and severe patients
also relate to previous discoveries. Previous literature on RA disease severity has implicated
IL6R and HLA-DRB1 genes and pathways in identifying patients with severe disease (Gonzalez-
Gay, Garcia-Porrua & Hajeer 2002, Marinou et al. 2007). It is also interesting to note that
73
interference with the IL-6 pathway is the mechanism of action for tocilizumab (Actemra), a
currently-available RA treatment.
Similar to the anti-CCP negative subgroup comparison, the comparison of the RF negative
subgroup yielded differential allelic association in the CD28 gene region. However, due to the
small sizes of the compared groups, these results must be interpreted with caution.
These are promising findings as a smaller percentage of RA patients present with seronegative
disease and many studies do not include this group of patients. It lends support to previous
findings that seropositive and seronegative disease have different genetic bases. It also supports
the observed overlap between RF and anti-CCP positivity in RA patients. Further investigation
of these trends could serve to illuminate pathways underlying the development of seronegative
disease. These groups tend to be smaller, however, encompassing only 13 out of 55 (23.6%) and
2 out of 34 (5.9%) mild and severe RF negative patients, respectively. For anti-CCP negative
disease there were 22 out of 55 (40.0%) and 7 out of 34 (20.6%) mild and severe patients,
respectively.
The C5orf30 locus rs1991797 T allele showed association with the severe group in RF positive
patients. C5orf30 denotes the chromosome 5 open reading frame 30 locus. A separate variant,
rs26232, at this locus was recently described to both confer risk of RA development and play a
role in tissue damage severity (Muthanaetal.2015). The function of this gene is
undetermined, yet the study suggests that it serves as a negative regulator of tissue damage in
the disease.
The comparison of the non-erosive populations presented a new group of genes that were not
identified in the analyses of any other subgroups. PRKCQ was found to have an especially large
OR of 21 for the G risk allele for both the leading and LD SNPs (p<0.01). Significant allele
association differences in the PLCL2 and MTFINPP5B genes were also observed with high ORs
(p<0.05). As this analysis involved the comparison of 16 mild and 2 severe patients, these
results are likely false positives due to the small sample size, especially for the severe group.
We were thus able to demonstrate that patients in the two groups seem to carry different alleles
at risk loci. Moreover, it is worth noting that the alleles that appear to be associated with severe
disease are not necessarily the alleles that predispose individuals to developing RA.
74
The investigation of subgroups based on erosion status and seropositivity showed that allele
associations were different for the RF positive and RF negative groups, and for the anti-CCP
positive and anti-CCP negative groups. This could indicate, as has been previously reported, that
there may be different underlying mechanisms for seropositive and seronegative disease
(Padyukov et al. 2011). The subgroup comparison findings must be interpreted cautiously
because some of the groups are extremely small perhaps thus yielding false positive findings.
The risk alleles and loci were also found to differ based on subgroup membership, including RF
status, anti-CCP status, and erosion status. Analysis of the subgroups of the entire population
investigated (RF positive, RF negative, anti-CCP positive, anti-CCP negative, erosive, and non-
erosive populations) revealed more genetic differences identified between the mild and severe
groups. This could indicate real genetic differences between the groups, which, in addition to
other serological biomarkers such as RF and anti-CCP positivity, can provide better predictive
value. It is important to remain cautious, however, as subgrouping can lead to even smaller
sample populations, which are prone to more error and thus false positive results. Furthermore, a
p-value of less than 0.05 was considered to be statistically significant and no corrections for
multiple testing, such as the Bonferroni correction, were performed. This was due to the limited
power of the current study as a result of the small sample size, and the intention to replicate any
findings in an independent cohort. It is important, however, that future replication is performed
on a sample of adequate size and statistical analysis is appropriately corrected for multiple
testing.
Similar to other studies, we were unable to confirm previously reported genetic differences
between mild and severe RA patients. However, several findings possess some links to
previously identified risk genes and pathways. The observed odds ratios are much higher than
those observed for RA risk yet significance levels are low, likely owing to the small sample size
of the studied population.
4.1.3 Gene Expression Findings
The comparison of gene expression patterns within a subset of the two groups consisting of a
total of 11 patients also yielded numerous significant differences.
75
4.1.3.1 Comparison of Active versus Inactive Subgroups
The comparison of gene expression profiles of active mild patients to those of inactive mild
patients produced a multitude of differentially expressed genes, suggesting RNA-sequencing
data can be reflective of clinical status. Gene expression patterns of four mild patients were
compared, only one of which had active disease. Unfortunately, the small active comparison
group (a single sample) increases the risk of identifying false positive DGE patterns.
The comparison of mild patients with active disease to those with inactive disease yielded
considerable overlap in gene expression within the inactive group and differences in expression
patterns between the two groups. As the active mild group consisted of only one person, this
profile is likely not representative of other patients in the same group. The correlation of
individual gene expression patterns in the inactive mild group, however, suggests that real
differences do in fact exist. Further replication will be necessary.
Fewer significant DGE differences were observed for the comparison of active with inactive
disease states in the severe group, as compared to the mild group, which yielded 35 and 2,342
genes, respectively. However, the small sample size and observed heterogeneity within the
severe group, combined with the fact that the active mild comparison group consisted of only
one sample, make further investigation necessary in order to adequately interpret this finding.
Using validated measures of disease activity, instead of SJC exclusively, would give a more
comprehensive picture of disease activity, and therefore more clearly classify patients’ disease.
4.1.3.2 Comparison of Mild versus Severe Subgroups
No significant DGE was observed in the comparison of mild and severe patients with active
disease at time of blood draw. This demonstrates that disease activity contributes significantly to
gene expression patterns.
We further found that significant differences in gene regulation exist between the groups of
patients with mild and severe disease across the inactive disease state. This finding suggests that
a pattern of upregulation or downregulation in the expression of the identified genes can be used
76
to discriminate individuals with mild disease versus those with severe disease, even if they
present with inactive disease at the time of blood draw. This could indicate that their diseases
operate through different pathways. It is important to consider medication, especially those
exerting their effects by acting on biological pathways, in interpreting these findings. This was
not controlled for, due to both ethical constraints and the retrospective nature of the current
study. Prospective studies can therefore serve to shed light on these findings.
Gene expression differences between the two groups were only observed when comparing
inactive disease states. These groups therefore had similar gene expression profiles when
experiencing flares of active disease. This could perhaps illustrate the severe group’s elevated
baseline activity level, yet similar gene expression pattern during flares.
4.1.3.3 Gene Expression Limitations
Inconsistent gene expression patterns within groups are clearly visible. As the comparison of
gene expression is essentially the comparison of the average of normalized expression levels of
each gene between groups, individual profiles can thus skew group averages. This can therefore
create differences that do not in fact exist and may not be representative of the expression trends
of the entire group.
The heterogeneity within groups can contribute to the observed inconsistencies in gene
expression patterns in these groups. Therefore, further classification and categorization related
to these different disease states is necessary. Treatment effects can increase the group
heterogeneity, especially given the underlying pathways upon which disease-modifying drugs
act. Additionally, cell population effects may have played a role, as these were not controlled for
in the current study since RNA-sequencing was performed on the heterogeneous immune cell
populations that constitute whole blood.
Limitations of the gene expression data include an inability to discern whether the gene
expression pattern reflects general inflammation or an RA-specific trend. Furthermore, while
RNA-sequencing showed some value in differentiating the mild and severe groups, this
technique is highly sensitive and is affected by numerous factors that were neither accounted nor
controlled for during sample collection. These include medications, for which adequate control
77
measures are limited by ethical and design constraints. Additionally, the RNA sample originated
from whole blood, which consists of a heterogeneous cell population. Access to patient groups
is another important consideration, as it is difficult to find mild patients with active disease and
severe patients with inactive disease based on both disease nature and our categorization
scheme. Furthermore, no biological or technical replicates were included, which could help
control for additional noise. More data is therefore required in order to completely support or
refute the assumption that mild and severe patients can be differentiated based on gene
regulation profiles. Additionally, performing gene expression analyses on specific cell types,
instead of a heterogeneous whole blood population, preferably on treatment-naïve patients at a
controlled date and time of blood draw, could assist in eliminating confounding variables and
irrelevant background information. Due to these limitations, and the understanding that any
findings would require replication using optimized and targeted experimental design, DGE
results were not validated. Future findings will therefore require further validation by
quantitative PCR (qPCR).
4.2 Conclusions
This study approached the differentiation of mild and severe RA patients in a novel way. We
chose to classify patients with severe disease based on the number of biologic drug failures
experienced, and to classify mild patients as those who have been maintained on conventional
DMARD therapy for three or more years. Our findings support the premise that this
categorization scheme does differentiate patients in both a clinically relevant manner and one
that correlates with radiological damage. Furthermore, we were able to identify genetic
differences between these two defined groups. The differential allelic association of SNP
rs4656942 in the Ly9-CD244 genomic region was the most significant among these. Based on
our findings, we propose that specific genetic RA risk factors can serve as potential prognostic
biomarkers to aid in distinguishing RA patients with treatment-resistant disease. Through our
preliminary data, we were also able to demonstrate that gene expression across inactive, but not
active, disease activity states differed between the mild and severe patient groups.
We have identified and classified two groups of RA patients with markedly different disease
courses and prognoses, which can be distinguished genetically. This could explain the lack of
78
success in achieving remission in patients with severe disease using currently-available
therapies that act on specific biological mechanisms. Links to relevant underlying mechanistic
pathways may provide insight into the pathophysiology of the disease and help to explain the
observed variable disease courses and best-suited treatment options. Thus, the replication of
these findings, in addition to further investigation of the genetic, environmental, and functional
differences between these groups, can serve to further personalize treatment for RA patients and
even potentially develop or repurpose drugs that can aid a specific subgroup of patients.
79
Chapter 5 Future Directions
Future Directions 5
5.1 General Future Directions
The current study presents many interesting findings, which introduce numerous future
directions to further investigate the characteristics of the defined groups of RA patients.
An important first step would be the replication of the current findings. Preferably, this analysis
would also be conducted on a sample of larger size. Additionally, as joint damage is commonly
used to assess disease severity, future studies should more precisely address joint damage
differences in these patients. This could involve determining onset time and rate of joint damage
and quantifying erosions, as our study only focused on presence versus absence of erosions.
Furthermore, this study limited genetic investigation to known RA risk loci. Investigating non-
risk loci may hold greater prognostic value, and could lead to the discovery of novel disease-
associated variants.
Investigating and identifying other differences, in the form of genetic, cellular, and even
lifestyle factors, between these groups can serve to increase understanding of RA and its
subsets. This can also be used in conjunction with other identified markers to predict patient
disease course and prognosis. Replication and validation of the observed trends is needed to
develop the use of these factors for the prediction of RA disease course and prognosis.
Determination of the proportion of RA patients that have severe disease, as defined by our
study, is another important future consideration. The current study recruited patients whose
disease severity was characterized in either of our “extreme” categories. Therefore this study
design did not enable the comparison of these groups to the RA population as a whole nor to
other groups whose disease severity fell in between these two categories.
RNA-sequencing provides a large amount of information from any analyzed sample, and as a
result of this high throughput nature, further analysis of the raw data can be conducted. This
includes the identification of novel splice variants and variant association differences between
the mild and severe groups. It may also be possible to perform a DGE analysis comparing fewer
80
patients to control for medication at time of blood draw, or to match patients on other variables
to reduce confounding factors. It may also be useful to characterize disease activity at time of
blood draw using standardized measures, such as the DAS28, and to further subdivide disease
activity level into low, moderate, and high. Moreover, investigation of gene expression in a
specific cell subtype, such as T cells, as well as novel technologies, which have enabled
interrogation of the RNA expression profile within individual cells, could offer interesting
findings. These approaches can provide important mechanistic information, as well as identify
DGE that could be masked as a result of the heterogeneous origin of the RNA sample. Finally,
should these findings be replicated, it would still be important to determine if the observed
differential gene regulation corresponds to protein expression. Pathway analyses could elucidate
mechanistic links between these differential expression profiles and disease pathogenesis in
these two groups of patients. It may also be useful to compare seropositive and erosive groups
using RNA-sequencing.
Future experiments should also aim to address the limitations described in the discussion
section. Ideally, this would involve more stringent grouping, optimized matching on
demographic and clinical variables such as age and RF status, as well as treatment conditions;
patients with minimal or no treatment would be ideal for this comparison. Controlled blood
draw conditions, including time of blood draw, should also be as closely matched as possible, as
seasonal effects on human gene expression patterns have recently been observed (Dopico et al.
2015). Finally, as our study has demonstrated the significant effect of disease activity in
determining gene expression patterns, it would be necessary to use more comprehensive
validated disease activity scores, such as the DAS28, in order to better characterize disease
activity and its effect on gene expression patterns, as well as eliminate it as a confounding
variable if desired.
In addition to confirming these results and better characterizing these two populations,
mechanistic studies will enable a better understanding of the significance of these findings and
the identification of functional roles played by these genes in disease pathogenesis. This can be
achieved through analysis of both gene and protein expression, as well as other functional
studies.
81
5.2 Immunophenotyping by Mass Cytometry
One area of research that is already being explored by our group is the use of mass cytometry in
immunophenotyping peripheral blood immune cell populations. We have developed a mass
cytometry panel for the investigation of granulomatosis with polyangiitis (GPA) relapse and
remission, in order to provide information on protein- and cellular-level differences in these
patients’ disease. Immunophenotyping by mass cytometry can therefore, in a similar fashion,
serve to provide important mechanistic information on RA pathogenesis.
GPA, previously referred to as Wegener’s granulomatosis, is an autoimmune disorder
characterized by necrotizing granulomatosis of the small blood vessels leading to vessel
blockages and ischemia (Csernok, Gross 2013). Patients also present with the presence of anti-
neutrophil cytoplasmic antibodies (ANCAs), primarily targeting proteinase 3 (PR3), in 80-90%
of cases (McKinney et al. 2014, Csernok, Gross 2013). This autoimmune reaction can lead to
organ damage, most notably pulmonary and kidney damage, and is associated with high
morbidity and mortality (Jennette, Falk & Gasim 2011, Jayne 2009, Gómez-Puerta, Bosch
2009). Both genetic and environmental risk factors have been identified, however, similar to
RA, the pathogenesis of GPA remains unknown (Heckmann et al. 2008, Wieczorek, Holle &
Epplen 2010, Mahr et al. 2010, Csernok, Gross 2013, Xie et al. 2013). Additionally, studies
have demonstrated aberrancies in numerous immune cell subsets in GPA patients. These include
T cells, B cells, and dendritic cells, as well as neutrophils, which express the autoantigen for the
disease (Gómez-Puerta, Bosch 2009, Hewins et al. 2004, Wilde et al. 2009, Csernok et al.
2006).
Patient disease courses vary, with many demonstrating resistance to treatment, relapse, and
disease-related morbidity. Relapse rates have been estimated to be as high as 60% in 7 years,
emphasizing the great benefit molecular assays permitting the personalization of treatment can
provide for GPA patients (Guillevin et al. 2011, Kallenberg 2011). There is therefore a great
need for an assay to predict relapse and remission, as well as response to treatment for GPA
patients, making personalized treatment possible.
Our GPA project therefore aims to identify biomarkers for the prediction of relapse and
remission in GPA patients, minimizing overtreatment as well as undertreatment and thereby
reducing side effects and disease-associated damage, respectively. We have opted to utilize
82
mass cytometry, a single-cell resolution technology that allows the analysis of up to 40
parameters. Cells are stained with antibodies conjugated to rare earth metals and are analyzed by
time-of-flight mass spectrometry (Nair et al. 2015). This permits immunophenotyping, as well
as biomarker discovery and mechanistic investigation. The use of this technology, and the
developed panel, would therefore provide an interesting and feasible future direction for the
current study. In such a way, immunophenotyping can aid in illuminating underlying cellular
and mechanistic differences between these two groups of RA patients presenting with variable
disease courses.
Two panels were designed, one for the analysis of T cell, B cell, monocyte, and dendritic cell
populations on PBMCs, the other specifically designed to investigate neutrophils and their
activation status on leukocytes isolated from whole blood. The designed panels are shown in
Tables 4-1 and 4-2 below.
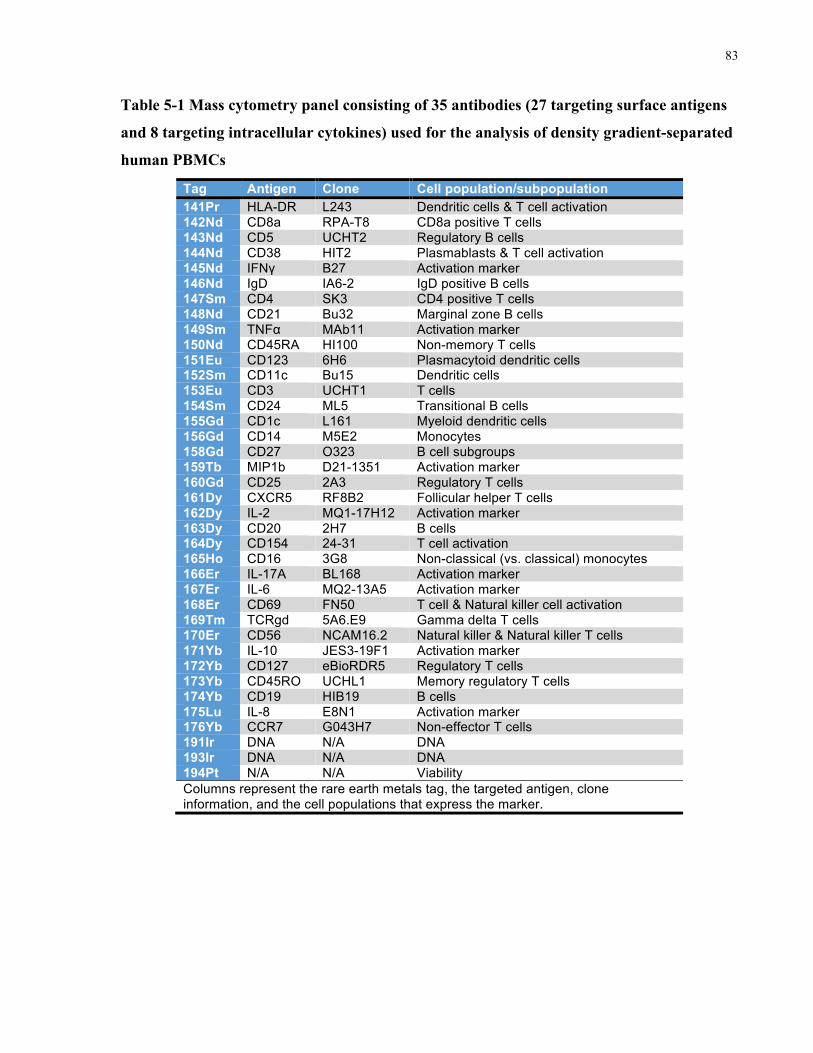
83
Table 5-1 Mass cytometry panel consisting of 35 antibodies (27 targeting surface antigens
and 8 targeting intracellular cytokines) used for the analysis of density gradient-separated
human PBMCs
Tag Antigen Clone Cell population/subpopulation 141Pr HLA-DR L243 Dendritic cells & T cell activation 142Nd CD8a RPA-T8 CD8a positive T cells 143Nd CD5 UCHT2 Regulatory B cells 144Nd CD38 HIT2 Plasmablasts & T cell activation 145Nd IFNγ B27 Activation marker 146Nd IgD IA6-2 IgD positive B cells 147Sm CD4 SK3 CD4 positive T cells 148Nd CD21 Bu32 Marginal zone B cells 149Sm TNFα MAb11 Activation marker 150Nd CD45RA HI100 Non-memory T cells 151Eu CD123 6H6 Plasmacytoid dendritic cells 152Sm CD11c Bu15 Dendritic cells 153Eu CD3 UCHT1 T cells 154Sm CD24 ML5 Transitional B cells 155Gd CD1c L161 Myeloid dendritic cells 156Gd CD14 M5E2 Monocytes 158Gd CD27 O323 B cell subgroups 159Tb MIP1b D21-1351 Activation marker 160Gd CD25 2A3 Regulatory T cells 161Dy CXCR5 RF8B2 Follicular helper T cells 162Dy IL-2 MQ1-17H12 Activation marker 163Dy CD20 2H7 B cells 164Dy CD154 24-31 T cell activation 165Ho CD16 3G8 Non-classical (vs. classical) monocytes 166Er IL-17A BL168 Activation marker 167Er IL-6 MQ2-13A5 Activation marker 168Er CD69 FN50 T cell & Natural killer cell activation 169Tm TCRgd 5A6.E9 Gamma delta T cells 170Er CD56 NCAM16.2 Natural killer & Natural killer T cells 171Yb IL-10 JES3-19F1 Activation marker 172Yb CD127 eBioRDR5 Regulatory T cells 173Yb CD45RO UCHL1 Memory regulatory T cells 174Yb CD19 HIB19 B cells 175Lu IL-8 E8N1 Activation marker 176Yb CCR7 G043H7 Non-effector T cells 191Ir DNA N/A DNA 193Ir DNA N/A DNA 194Pt N/A N/A Viability Columns represent the rare earth metals tag, the targeted antigen, clone information, and the cell populations that express the marker.
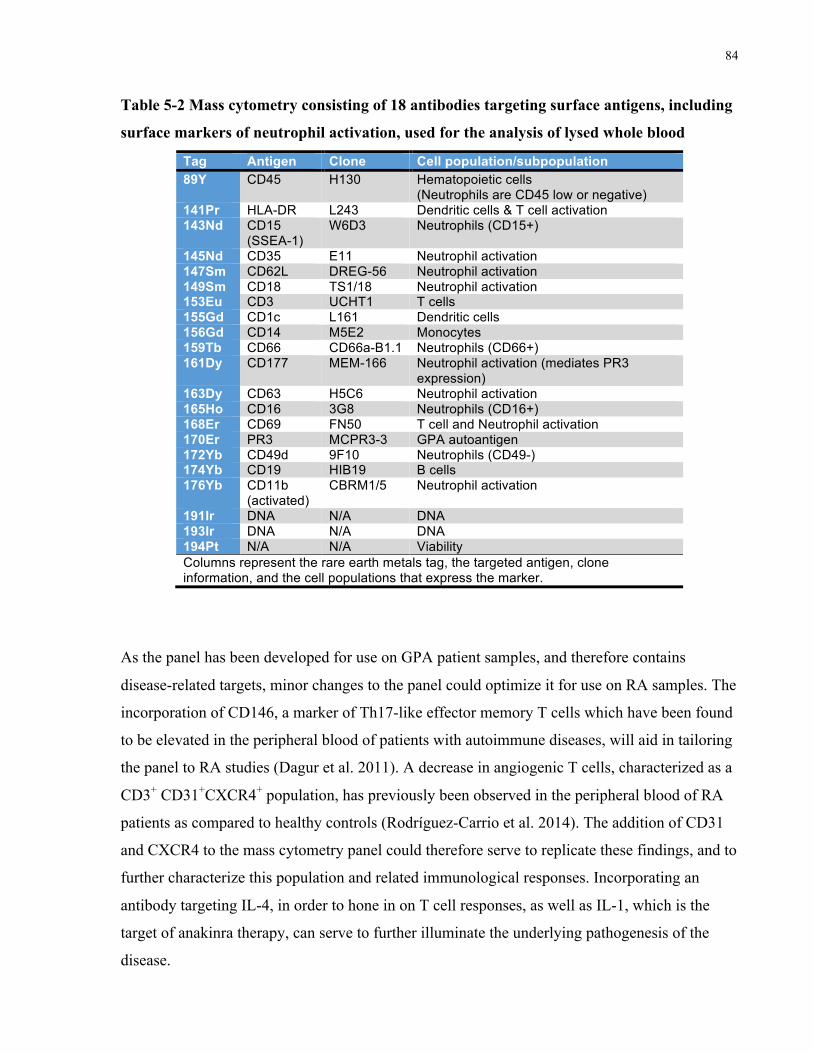
84
Table 5-2 Mass cytometry consisting of 18 antibodies targeting surface antigens, including
surface markers of neutrophil activation, used for the analysis of lysed whole blood
Tag Antigen Clone Cell population/subpopulation 89Y CD45 H130 Hematopoietic cells
(Neutrophils are CD45 low or negative) 141Pr HLA-DR L243 Dendritic cells & T cell activation 143Nd CD15
(SSEA-1) W6D3 Neutrophils (CD15+)
145Nd CD35 E11 Neutrophil activation 147Sm CD62L DREG-56 Neutrophil activation 149Sm CD18 TS1/18 Neutrophil activation 153Eu CD3 UCHT1 T cells 155Gd CD1c L161 Dendritic cells 156Gd CD14 M5E2 Monocytes 159Tb CD66 CD66a-B1.1 Neutrophils (CD66+) 161Dy CD177 MEM-166 Neutrophil activation (mediates PR3
expression) 163Dy CD63 H5C6 Neutrophil activation 165Ho CD16 3G8 Neutrophils (CD16+) 168Er CD69 FN50 T cell and Neutrophil activation 170Er PR3 MCPR3-3 GPA autoantigen 172Yb CD49d 9F10 Neutrophils (CD49-) 174Yb CD19 HIB19 B cells 176Yb CD11b
(activated) CBRM1/5 Neutrophil activation
191Ir DNA N/A DNA 193Ir DNA N/A DNA 194Pt N/A N/A Viability Columns represent the rare earth metals tag, the targeted antigen, clone information, and the cell populations that express the marker.
As the panel has been developed for use on GPA patient samples, and therefore contains
disease-related targets, minor changes to the panel could optimize it for use on RA samples. The
incorporation of CD146, a marker of Th17-like effector memory T cells which have been found
to be elevated in the peripheral blood of patients with autoimmune diseases, will aid in tailoring
the panel to RA studies (Dagur et al. 2011). A decrease in angiogenic T cells, characterized as a
CD3+ CD31+CXCR4+ population, has previously been observed in the peripheral blood of RA
patients as compared to healthy controls (Rodríguez-Carrio et al. 2014). The addition of CD31
and CXCR4 to the mass cytometry panel could therefore serve to replicate these findings, and to
further characterize this population and related immunological responses. Incorporating an
antibody targeting IL-4, in order to hone in on T cell responses, as well as IL-1, which is the
target of anakinra therapy, can serve to further illuminate the underlying pathogenesis of the
disease.
85
Kerkman et al. utilized biotinylated CCP-2, which is used to identify ACPA, in conjunction with
fluorophore-tagged streptavidin in order to identify autoantibody-producing B cells in RA
patients using flow cytometry (Kerkman et al. 2016). A similar technique using combinatorial
peptides was utilized by Newell et al. to identify T cells targeting specific epitopes by mass
cytometry. This was accomplished through the use of mutated streptavidin to enable metal
tagging (Newell et al. 2013). Alternatively, the use of a metal-tagged anti-biotin antibody
(Fluidigm catalog number 3150008B) in order to identify the biotin-tagged autoantigen and
visualization of it using mass cytometry can achieve similar results. Incorporating such an assay
will aid in the identification of autoantibody-producing B cells and in the comparison of this cell
population between mild and severe patient groups.
The inclusion of these markers would tailor the current panel to the investigation of RA
samples, based on currently known disease mechanisms, and potentially elucidate additional cell
subsets and mechanisms that contribute to severe disease.
The findings of the current study remain preliminary and much replication and optimization is
required for the development of clinically useful biomarkers. Despite these limitations, this
study and its findings show much promise and there are numerous exciting future investigations
to better define and further characterize the investigated RA populations.
86
References Alamanos, Y. & Drosos, A.A. 2005, "Epidemiology of adult rheumatoid arthritis", Autoimmunity
Reviews, vol. 4, no. 3, pp. 130-136.
Alamanos, Y., Voulgari, P.V. & Drosos, A.A. 2006, "Incidence and Prevalence of Rheumatoid Arthritis,
Based on the 1987 American College of Rheumatology Criteria: A Systematic Review", Seminars
in arthritis and rheumatism, vol. 36, no. 3, pp. 182-188.
Aletaha, D., Neogi, T., Silman, A.J., Funovits, J., Felson, D.T., Bingham III, C.O., Birnbaum, N.S.,
Burmester, G.R., Bykerk, V.P., Cohen, M.D., Combe, B., Costenbader, K.H., Dougados, M.,
Emery, P., Ferraccioli, G., Hazes, J.M.W., Hobbs, K., Huizinga, T.W.J., Kavanaugh, A., Kay, J.,
Kvien, T.K., Laing, T., Mease, P., Ménard, H.A., Moreland, L.W., Naden, R.L., Pincus, T., Smolen,
J.S., Stanislawska-Biernat, E., Symmons, D., Tak, P.P., Upchurch, K.S., Vencovský, J., Wolfe, F. &
Hawker, G. 2010, "2010 Rheumatoid arthritis classification criteria: An American College of
Rheumatology/European League Against Rheumatism collaborative initiative", Arthritis and
Rheumatism, vol. 62, no. 9, pp. 2569-2581.
Anderson, J.K., Zimmerman, L., Caplan, L. & Michaud, K. 2011, "Measures of rheumatoid arthritis
disease activity: Patient (PtGA) and Provider (PrGA) Global Assessment of Disease Activity,
Disease Activity Score (DAS) and Disease Activity Score with 28-Joint Counts (DAS28),
Simplified Disease Activity Index (SDAI), Clinical Disease Activity Index (CDAI), Patient Activity
Score (PAS) and Patient Activity Score-II (PASII), Routine Assessment of Patient Index", Arthritis
Care and Research, vol. 63, no. SUPPL. 11.
Angus McQuibban, G., Gong, J.-., Wong, J.P., Wallace, J.L., Clark-Lewis, I. & Overall, C.M. 2002,
"Matrix metalloproteinase processing of monocyte chemoattractant proteins generates CC
chemokine receptor antagonists with anti-inflammatory properties in vivo", Blood, vol. 100, no. 4,
pp. 1160-1167.
Arnett, F.C., Edworthy, S.M., Bloch, D.A., Mcshane, D.J., Fries, J.F., Cooper, N.S., Healey, L.A.,
Kaplan, S.R., Liang, M.H., Luthra, H.S., Medsger, T.A.,Jr, Mitchell, D.M., Neustadt, D.H., Pinals,
R.S., Schaller, J.G., Sharp, J.T., Wilder, R.L. & Hunder, G.G. 1988, "The american rheumatism
association 1987 revised criteria for the classification of rheumatoid arthritis", Arthritis &
Rheumatism, vol. 31, no. 3, pp. 315-324.
87
Arthritis Research UK 2016, Disease-modifying anti-rheumatic drugs (DMARDs). Available:
http://www.arthritisresearchuk.org/arthritis-information/drugs/dmards.aspx [2016, 09/14].
Baslund, B., Tvede, N., Danneskiold-Samsoe, B., Larsson, P., Panayi, G., Petersen, J., Petersen, L.J.,
Beurskens, F.J.M., Schuurman, J., Van De Winkel, J.G.J., Parren, P.W.H.I., Gracie, J.A.,
Jongbloed, S., Liew, F.Y. & McInnes, I.B. 2005, "Targeting interleukin-15 in patients with
rheumatoid arthritis: A proof-of-concept study", Arthritis and Rheumatism, vol. 52, no. 9, pp. 2686-
2692.
Bax, M., Huizinga, T.W.J. & Toes, R.E.M. 2014, "The pathogenic potential of autoreactive antibodies in
rheumatoid arthritis", Seminars in Immunopathology, vol. 36, no. 3, pp. 313-325.
Begovich, A.B., Carlton, V.E.H., Honigberg, L.A., Schrodi, S.J., Chokkalingam, A.P., Alexander, H.C.,
Ardlie, K.G., Huang, Q., Smith, A.M., Spoerke, J.M., Conn, M.T., Chang, M., Chang, S.-.P., Saiki,
R.K., Catanese, J.J., Leong, D.U., Garcia, V.E., McAllister, L.B., Jeffery, D.A., Lee, A.T.,
Batliwalla, F., Remmers, E., Criswell, L.A., Seldin, M.F., Kastner, D.L., Amos, C.I., Sninsky, J.J.
& Gregersen, P.K. 2004, "A missense single-nucleotide polymorphism in a gene encoding a protein
tyrosine phosphatase (PTPN22) is associated with rheumatoid arthritis", American Journal of
Human Genetics, vol. 75, no. 2, pp. 330-337.
Behrens, F., Himsel, A., Rehart, S., Stanczyk, J., Beutel, B., Zimmermann, S.Y., Koehl, U., Möller, B.,
Gay, S., Kaltwasser, J.P., Pfeilschifter, J.M. & Radeke, H.H. 2007, "Imbalance in distribution of
functional autologous regulatory T cells in rheumatoid arthritis", Annals of the Rheumatic Diseases,
vol. 66, no. 9, pp. 1151-1156.
Bolger, A.M., Lohse, M. & Usadel, B. 2014, "Trimmomatic: A flexible trimmer for Illumina sequence
data", Bioinformatics, vol. 30, no. 15, pp. 2114-2120.
Bowes, J. & Barton, A. 2008, "Recent advances in the genetics of RA susceptibility", Rheumatology, vol.
47, no. 4, pp. 399-402.
Brennan, F.M. & McInnes, I.B. 2008, "Evidence that cytokines play a role in rheumatoid arthritis",
Journal of Clinical Investigation, vol. 118, no. 11, pp. 3537-3545.
Brooks, P.M. 2006, "The burden of musculoskeletal disease - a global perspective", Clinical
rheumatology, vol. 25, no. 6, pp. 778-781.
88
Buchs, N., Di Giovine, F.S., Silvestri, T., Vannier, E., Duff, G.W. & Miossec, P. 2001, "IL-1B and IL-
1Ra gene polymorphisms and disease severity in rheumatoid arthritis: Interaction with their plasma
levels", Genes and immunity, vol. 2, no. 4, pp. 222-228.
Burska, A.N., Roget, K., Blits, M., Soto Gomez, L., Van De Loo, F., Hazelwood, L.D., Verweij, C.L.,
Rowe, A., Goulielmos, G.N., Van Baarsen, L.G.M. & Ponchel, F. 2014, "Gene expression analysis
in RA: Towards personalized medicine", Pharmacogenomics Journal, vol. 14, no. 2, pp. 93-106.
Cañete, J.D., Martínez, S.E., Farrés, J., Sanmartí, R., Blay, M., Gómez, A., Salvador, G. & Muñoz-
Gómez, J. 2000, "Differential Th1/Th2 cytokine patterns in chronic arthritis: Interferon γ is highly
expressed in synovium of rheumatoid arthritis compared with seronegative spondyloarthropathies",
Annals of the Rheumatic Diseases, vol. 59, no. 4, pp. 263-268.
Cantagrel, A., Navaux, F., Loubet-Lescoulié, P., Nourhashemi, F., Enault, G., Abbal, M., Constantin, A.,
Laroche, M. & Mazières, B. 1999, "Interleukin-1ß, interleukin-1 receptor antagonist, interleukin-4,
and interleukin-10 gene polymorphisms: Relationship to occurrence and severity of rheumatoid
arthritis", Arthritis and Rheumatism, vol. 42, no. 6, pp. 1093-1100.
Cascão, R., Rosário, H.S., Souto-Carneiro, M.M. & Fonseca, J.E. 2010, "Neutrophils in rheumatoid
arthritis: More than simple final effectors", Autoimmunity Reviews, vol. 9, no. 8, pp. 531-535.
Centres for Disease Control and Prevention 2016, Rheumatoid Arthritis (RA). Available:
http://www.cdc.gov/arthritis/basics/rheumatoid.htm [2016, 08/04].
Chabaud, M., Durand, J.M., Buchs, N., Fossiez, F., Page, G., Frappart, L. & Miossec, P. 1999, "Human
interleukin-17: A T cell-derived proinflammatory cytokine produced by the rheumatoid synovium",
Arthritis and Rheumatism, vol. 42, no. 5, pp. 963-970.
Chanock, S. 2007, , Technologic Issues in GWAS and Follow-up Studies. Available:
https://www.genome.gov/pages/about/od/opg/multi-ic_symposia/may2007/techissues.pdf [2016,
09/12].
Clavel, C., Nogueira, L., Laurent, L., Iobagiu, C., Vincent, C., Sebbag, M. & Serre, G. 2008, "Induction
of macrophage secretion of tumor necrosis factor α through Fcγ receptor IIa engagement by
rheumatoid arthritis-specific autoantibodies to citrullinated proteins complexed with fibrinogen",
Arthritis and Rheumatism, vol. 58, no. 3, pp. 678-688.
89
Coenen, M.J.H. & Gregersen, P.K. 2009, "Rheumatoid arthritis: a view of the current genetic landscape",
Genes and immunity, vol. 10, no. 2, pp. 101-111.
Cohen, S.B., Dore, R.K., Lane, N.E., Ory, P.A., Peterfy, C.G., Sharp, J.T., Van Der Heijde, D., Zhou, L.,
Tsuji, W. & Newmark, R. 2008, "Denosumab treatment effects on structural damage, bone mineral
density, and bone turnover in rheumatoid arthritis: A twelve-month, multicenter, randomized,
double-blind, placebo-controlled, phase II clinical trial", Arthritis and Rheumatism, vol. 58, no. 5,
pp. 1299-1309.
Csernok, E., Ai, M., Gross, W.L., Wicklein, D., Petersen, A., Lindner, B., Lamprecht, P., Holle, J.U. &
Hellmich, B. 2006, "Wegener autoantigen induces maturation of dendritic cells and licenses them
for Th1 priming via the protease-activated receptor-2 pathway", Blood, vol. 107, no. 11, pp. 4440-
4448.
Csernok, E. & Gross, W.L. 2013, "Current understanding of the pathogenesis of granulomatosis with
polyangiitis (Wegener's)", Expert Review of Clinical Immunology, vol. 9, no. 7, pp. 641-648.
Dagur, P.K., Biancotto, A., Wei, L., Nida Sen, H., Yao, M., Strober, W., Nussenblatt, R.B. & Philip
McCoy, J. 2011, "MCAM-expressing CD4 + T cells in peripheral blood secrete IL-17A and are
significantly elevated in inflammatory autoimmune diseases", Journal of Autoimmunity, vol. 37, no.
4, pp. 319-327.
Darrah, E., Giles, J.T., Ols, M.L., Bull, H.G., Andrade, F. & Rosen, A. 2013, "Erosive rheumatoid
arthritis is associated with antibodies that activate PAD4 by increasing calcium sensitivity", Science
Translational Medicine, vol. 5, no. 186.
Davis, T.L., Walker, J.R., Campagna-Slater, V., Finerty, P.J., Finerty Jr., P.J., Paramanathan, R.,
Bernstein, G., Mackenzie, F., Tempel, W., Ouyang, H., Lee, W.H., Eisenmesser, E.Z. & Dhe-
Paganon, S. 2010, "Structural and biochemical characterization of the human cyclophilin family of
peptidyl-prolyl isomerases", PLoS Biology, vol. 8, no. 7.
Dopico, X.C., Evangelou, M., Ferreira, R.C., Guo, H., Pekalski, M.L., Smyth, D.J., Cooper, N., Burren,
O.S., Fulford, A.J., Hennig, B.J., Prentice, A.M., Ziegler, A.-., Bonifacio, E., Wallace, C. & Todd,
J.A. 2015, "Widespread seasonal gene expression reveals annual differences in human immunity
and physiology", Nature Communications, vol. 6.
Dougados, M., Soubrier, M., Antunez, A., Balint, P., Balsa, A., Buch, M.H., Casado, G., Detert, J., El-
zorkany, B., Emery, P., Hajjaj-Hassouni, N., Harigai, M., Luo, S., Kurucz, R., Maciel, G., Martin
90
Mola, E., Montecucco, C.M., McInnes, I., Radner, H., Smolen, J.S., Song, Y., Vonkeman, H.E.,
Winthrop, K. & Kay, J. 2014, "Prevalence of comorbidities in rheumatoid arthritis and evaluation of
their monitoring: results of an international, cross-sectional study (COMORA)", Annals of the
Rheumatic Diseases, vol. 73, no. 1, pp. 62-68.
Eastman, P.S., Manning, W.C., Qureshi, F., Haney, D., Cavet, G., Alexander, C. & Hesterberg, L.K.
2012, "Characterization of a multiplex, 12-biomarker test for rheumatoid arthritis", Journal of
pharmaceutical and biomedical analysis, vol. 70, pp. 415-424.
Edwards, J.C.W., Szczepanski, L., Szechinski, J., Filipowicz-Sosnowska, A., Emery, P., Close, D.R.,
Stevens, R.M. & Shaw, T. 2004, "Efficacy of B-cell-targeted therapy with rituximab in patients
with rheumatoid arthritis", New England Journal of Medicine, vol. 350, no. 25, pp. 2572-2581.
Ehrenstein, M.R., Evans, J.G., Singh, A., Moore, S., Warnes, G., Isenberg, D.A. & Mauri, C. 2004,
"Compromised function of regulatory T cells in rheumatoid arthritis and reversal by anti-TNFa
therapy", Journal of Experimental Medicine, vol. 200, no. 3, pp. 277-285.
Foell, D., Wittkowski, H. & Roth, J. 2007, "Mechanisms of Disease: A 'DAMP' view of inflammatory
arthritis", Nature Clinical Practice Rheumatology, vol. 3, no. 7, pp. 382-390.
Forslind, K., Ahlmén, M., Eberhardt, K., Hafström, I. & Svensson, B. 2004, "Prediction of radiological
outcome in early rheumatoid arthritis in clinical practice: Role of antibodies to citrullinated peptides
(anti-CCP)", Annals of the Rheumatic Diseases, vol. 63, no. 9, pp. 1090-1095.
Fox, R.I. 1993, "Mechanism of action of hydroxychloroquine as an antirheumatic drug", Seminars in
arthritis and rheumatism, vol. 23, no. 2 SUPPL. 2, pp. 82-91.
Franklin, E.C., Holman, H.R., Muller-Eberhard, H.J. & Kunkel, H.G. 1957, "An unusual protein
component of high molecular weight in the serum of certain patients with rheumatoid arthritis.",
The Journal of experimental medicine, vol. 105, no. 5, pp. 425-438.
Freeston, J.E., Wakefield, R.J., Conaghan, P.G., Hensor, E.M.A., Stewart, S.P. & Emery, P. 2010, "A
diagnostic algorithm for persistence of very early inflammatory arthritis: The utility of power
Doppler ultrasound when added to conventional assessment tools", Annals of the Rheumatic
Diseases, vol. 69, no. 2, pp. 417-419.
Gabriel, S., Ziaugra, L. & Tabbaa, D. 2009, "SNP genotyping using the sequenom massARRAY iPLEX
Platform", Current Protocols in Human Genetics, , no. SUPPL. 60.
91
Garnero, P., Landewe, R., Boers, M., Verhoeven, A., Van Der Linden, S., Van Der Heijde, D., Boonen,
A. & Geusens, P. 2002, "Association of baseline levels of markers of bone and cartilage
degradation with long-term progression of joint damage in patients with early rheumatoid arthritis:
The COBRA study", Arthritis and Rheumatism, vol. 46, no. 11, pp. 2847.
Garrood, T., Shattles, W. & Scott, D.L. 2011, "Treating early rheumatoid arthritis intensively: Current
UK practice does not reflect guidelines", Clinical rheumatology, vol. 30, no. 1, pp. 103-106.
Gibson, D.S., Rooney, M.E., Finnegan, S., Qiu, J., Thompson, D.C., Labaer, J., Pennington, S.R. &
Duncan, M.W. 2012, "Biomarkers in rheumatology, Now and in the future", Rheumatology, vol. 51,
no. 3, pp. 423-433.
Goh, F.G. & Midwood, K.S. 2012, "Intrinsic danger: Activation of Toll-like receptors in rheumatoid
arthritis", Rheumatology, vol. 51, no. 1, pp. 7-23.
Gómez-Puerta, J. & Bosch, X. 2009, "Anti-neutrophil cytoplasmic antibody pathogenesis in small-vessel
vasculitis: an update.", American Journal of Pathology, vol. 175, no. 5, pp. 1790-1791, 1792, 1793,
1794, 1795, 1796, 1797, 1798.
Gonzalez-Gay, M.A., Garcia-Porrua, C. & Hajeer, A.H. 2002, "Influence of human leukocyte antigen-
DRB1 on the susceptibility and severity of rheumatoid arthritis", Seminars in arthritis and
rheumatism, vol. 31, no. 6, pp. 355-360.
Gregersen, P.K., Silver, J. & Winchester, R.J. 1987, "The shared epitope hypothesis. An approach to
understanding the molecular genetics of susceptibility to rheumatoid arthritis", Arthritis and
Rheumatism, vol. 30, no. 11, pp. 1205-1213.
Guillevin, L., Pagnoux, C., Seror, R., Mahr, A., Mouthon, L. & Toumelin, P.L. 2011, "The five-factor
score revisited: Assessment of prognoses of systemic necrotizing vasculitides based on the french
vasculitis study group (FVSG) cohort", Medicine, vol. 90, no. 1, pp. 19-27.
Haavardsholm, E.A., Bøyesen, P., Østergaard, M., Schildvold, A. & Kvien, T.K. 2008, "Magnetic
resonance imaging findings in 84 patients with early rheumatoid arthritis: Bone marrow oedema
predicts erosive progression", Annals of the Rheumatic Diseases, vol. 67, no. 6, pp. 794-800.
Haringman, J.J., Gerlag, D.M., Zwinderman, A.H., Smeets, T.J.M., Kraan, M.C., Baeten, D., McInnes,
I.B., Bresnihan, B. & Tak, P.P. 2005, "Synovial tissue macrophages: A sensitive biomarker for
92
response to treatment in patients with rheumatoid arthritis", Annals of the Rheumatic Diseases, vol.
64, no. 6, pp. 834-838.
Harirforoosh, S. & Jamali, F. 2009, "Renal adverse effects of nonsteroidal anti-inflammatory drugs",
Expert Opinion on Drug Safety, vol. 8, no. 6, pp. 669-681.
Harre, U., Georgess, D., Bang, H., Bozec, A., Axmann, R., Ossipova, E., Jakobsson, P.-., Baum, W.,
Nimmerjahn, F., Szarka, E., Sarmay, G., Krumbholz, G., Neumann, E., Toes, R., Scherer, H.-.,
Catrina, A.I., Klareskog, L., Jurdic, P. & Schett, G. 2012, "Induction of osteoclastogenesis and bone
loss by human autoantibodies against citrullinated vimentin", Journal of Clinical Investigation, vol.
122, no. 5, pp. 1791-1802.
Harrison, P., Pointon, J.J., Chapman, K., Roddam, A. & Wordsworth, B.P. 2008, "Interleukin-1 promoter
region polymorphism role in rheumatoid arthritis: A meta-analysis of IL-1B-511A/G variant reveals
association with rheumatoid arthritis", Rheumatology, vol. 47, no. 12, pp. 1768-1770.
Heckmann, M., Holle, J.U., Arning, L., Knaup, S., Hellmich, B., Nothnagel, M., Jagiello, P., Gross,
W.L., Epplen, J.T. & Wieczorek, S. 2008, "The Wegener's granulomatosis quantitative trait locus
on chromosome 6p21.3 as characterised by tagSNP genotyping", Annals of the Rheumatic Diseases,
vol. 67, no. 7, pp. 972-979.
Hetland, M.L., Ejbjerg, B., Hørslev-Petersen, K., Jacobsen, S., Vestergaard, A., Jurik, A.G., Stengaard-
Pedersen, K., Junker, P., Lottenburger, T., Hansen, I., Andersen, L.S., Tarp, U., Skjødt, H.,
Pedersen, J.K., Majgaard, O., Svendsen, A.J., Ellingsen, T., Lindegaard, H., Christensen, A.F.,
Vallø, J., Torfing, T., Narvestad, E., Thomsen, H.S. & Østergaard, M. 2009, "MRI bone oedema is
the strongest predictor of subsequent radiographic progression in early rheumatoid arthritis. Results
from a 2-year randomised controlled trial (CIMESTRA)", Annals of the Rheumatic Diseases, vol.
68, no. 3, pp. 384-390.
Hewins, P., Williams, J., Wakelam, M. & Savage, C. 2004, "Activation of Syk in neutrophils by
antineutrophil cytoplasm antibodies occurs via Fc gamma receptors and CD18", Journal of the
American Society of Nephrology, vol. 15, no. 3, pp. 796-808.
Hueber, A.J., Asquith, D.L., Miller, A.M., Reilly, J., Kerr, S., Leipe, J., Melendez, A.J. & McInnes, I.B.
2010, "Cutting edge: Mast cells express IL-17A in rheumatoid arthritis synovium", Journal of
Immunology, vol. 184, no. 7, pp. 3336-3340.
93
Huizinga, T.W.J., Amos, C.I., Van Der Helm-Van Mil, A.H.M., Chen, W., Van Gaalen, F.A., Jawaheer,
D., Schreuder, G.M.T., Wener, M., Breedveld, F.C., Ahmad, N., Lum, R.F., De Vries, R.R.P.,
Gregersen, P.K., Toes, R.E.M. & Criswell, L.A. 2005, "Refining the complex rheumatoid arthritis
phenotype based on specificity of the HLA-DRB1 shared epitope for antibodies to citrullinated
proteins", Arthritis and Rheumatism, vol. 52, no. 11, pp. 3433-3438.
Huizinga, T.W.J., Keijsers, V., Yanni, G., Hall, M., Ramage, W., Lanchbury, J., Pitzalis, C., Drossaers-
Bakker, W.K., Westendorp, R.G.J., Breedveld, F.C., Panayi, G. & Verweij, C.L. 2000, "Are
differences in interleukin 10 production associated with joint damage?", Rheumatology, vol. 39, no.
11, pp. 1180-1188.
Hunt, L. & Emery, P. 2014, "Defining populations at risk of rheumatoid arthritis: The first steps to
prevention", Nature Reviews Rheumatology, vol. 10, no. 9, pp. 521-530.
Imboden, J.B. 2009, The immunopathogenesis of rheumatoid arthritis.
Jayne, D. 2009, "Review article: Progress of treatment in ANCA-associated vasculitis", Nephrology, vol.
14, no. 1, pp. 42-48.
Jennette, J.C., Falk, R.J. & Gasim, A.H. 2011, "Pathogenesis of antineutrophil cytoplasmic autoantibody
vasculitis", Current opinion in nephrology and hypertension, vol. 20, no. 3, pp. 263-270.
Johnsen, A.K., Plenge, R.M., Butty, V., Campbell, C., Dieguez-Gonzalez, R., Gomez-Reino, J.J.,
Shadick, N., Weinblatt, M., Gonzalez, A., Gregersen, P.K., Benoist, C. & Mathis, D. 2008, "A
broad analysis of IL1 polymorphism and rheumatoid arthritis", Arthritis and Rheumatism, vol. 58,
no. 7, pp. 1947-1957.
Kallenberg, C.G.M. 2011, "Anti-neutrophil cytoplasmic antibody (ANCA)-associated vasculitis: Where
to go?", Clinical and experimental immunology, vol. 164, no. SUPPL. 1, pp. 1-3.
Karlson, E.W., Chibnik, L.B., Cui, J., Plenge, R.M., Glass, R.J., Maher, N.E., Parker, A., Roubenoff, R.,
Izmailova, E., Coblyn, J.S., Weinblatt, M.E. & Shadick, N.A. 2008, "Associations between Human
leukocyte antigen, PTPN22, CTLA4 genotypes and rheumatoid arthritis phenotypes of autoantibody
status, age at diagnosis and erosions in a large cohort study", Annals of the Rheumatic Diseases, vol.
67, no. 3, pp. 358-363.
94
Kastbom, A., Strandberg, G., Lindroos, A. & Skogh, T. 2004, "Anti-CCP antibody test predicts the
disease course during 3 years in early rheumatoid arthritis (the Swedish TIRA project)", Annals of
the Rheumatic Diseases, vol. 63, no. 9, pp. 1085-1089.
Kerkman, P.F., Fabre, E., Van Der Voort, E.I.H., Zaldumbide, A., Rombouts, Y., Rispens, T., Wolbink,
G., Hoeben, R.C., Spits, H., Baeten, D.L.P., Huizinga, T.W.J., Toes, R.E.M. & Scherer, H.U. 2016,
"Identification and characterisation of citrullinated antigen-specific B cells in peripheral blood of
patients with rheumatoid arthritis", Annals of the Rheumatic Diseases, vol. 75, no. 6, pp. 1170-1176.
Kim, D., Pertea, G., Trapnell, C., Pimentel, H., Kelley, R. & Salzberg, S.L. 2013, "TopHat2: Accurate
alignment of transcriptomes in the presence of insertions, deletions and gene fusions", Genome
biology, vol. 14, no. 4.
Klareskog, L., Padyukov, L., Lorentzen, J. & Alfredsson, L. 2006, "Mechanisms of disease: Genetic
susceptibility and environmental triggers in the development of rheumatoid arthritis", Nature
Clinical Practice Rheumatology, vol. 2, no. 8, pp. 425-433.
Knevel, R., De Rooy, D.P., Gregersen, P.K., Lindqvist, E., Wilson, A.G., Gröndal, G., Zhernakova, A.,
Van Nies, J.A., Toes, R.E., Tsonaka, R., Houwing-Duistermaat, J.J., Steinsson, K., Huizinga, T.W.,
Saxne, T. & Van Der Helm-van Mil, A.H. 2012a, "Studying associations between variants in
TRAF1-C5 and TNFAIP3-OLIG3 and the progression of joint destruction in rheumatoid arthritis in
multiple cohorts", Annals of the Rheumatic Diseases, vol. 71, no. 10, pp. 1753-1755.
Knevel, R., Krabben, A., Brouwer, E., Posthumus, M.D., Wilson, A.G., Lindqvist, E., Saxne, T., De
Rooy, D., Daha, N., Van Der Linden, M.P.M., Stoeken, G., Van Toorn, L., Koeleman, B., Tsonaka,
R., Zhernakoza, A., Houwing-Duistermaat, J.J., Toes, R., Huizinga, T.W.J. & Van Der Helm-van
Mil, A. 2012b, "Genetic variants in IL15 associate with progression of joint destruction in
rheumatoid arthritis: A multicohort study", Annals of the Rheumatic Diseases, vol. 71, no. 10, pp.
1651-1657.
Kochi, Y., Okada, Y., Suzuki, A., Ikari, K., Terao, C., Takahashi, A., Yamazaki, K., Hosono, N.,
Myouzen, K., Tsunoda, T., Kamatani, N., Furuichi, T., Ikegawa, S., Ohmura, K., Mimori, T.,
Matsuda, F., Iwamoto, T., Momohara, S., Yamanaka, H., Yamada, R., Kubo, M., Nakamura, Y. &
Yamamoto, K. 2010, "A regulatory variant in CCR6 is associated with rheumatoid arthritis
susceptibility", Nature genetics, vol. 42, no. 6, pp. 515-519.
95
Kochi, Y., Suzuki, A. & Yamamoto, K. 2014, "Genetic basis of rheumatoid arthritis: A current review",
Biochemical and biophysical research communications, vol. 452, no. 2, pp. 254-262.
Kurreeman, F.A.S., Padyukov, L., Marques, R.B., Schrodi, S.J., Seddighzadeh, M., Stoeken-Rijsbergen,
G., Van Der Helm-Van Mil, A.H.M., Allaart, C.F., Verduyn, W., Houwing-Duistermaat, J.,
Alfredsson, L., Begovich, A.B., Klareskog, L., Huizinga, T.W.J. & Toes, R.E.M. 2007, "A
candidate gene approach identifies the TRAF1/C5 region as a risk factor for rheumatoid arthritis",
PLoS Medicine, vol. 4, no. 9, pp. 1515-1524.
Kyburz, D., Brentano, F. & Gay, S. 2006, "Mode of action of hydroxychloroquine in RA - Evidence of
an inhibitory effect on toll-like receptor signaling", Nature Clinical Practice Rheumatology, vol. 2,
no. 9, pp. 458-459.
Langmead, B. & Salzberg, S.L. 2012, "Fast gapped-read alignment with Bowtie 2", Nature Methods, vol.
9, no. 4, pp. 357-359.
Lee, D.M. & Weinblatt, M.E. 2001, "Rheumatoid arthritis", Lancet, vol. 358, no. 9285, pp. 903-911.
Li, H., Handsaker, B., Wysoker, A., Fennell, T., Ruan, J., Homer, N., Marth, G., Abecasis, G. & Durbin,
R. 2009, "The Sequence Alignment/Map format and SAMtools", Bioinformatics, vol. 25, no. 16,
pp. 2078-2079.
Lindqvist, E., Eberhardt, K., Bendtzen, K., Heinegård, D. & Saxne, T. 2005, "Prognostic laboratory
markers of joint damage in rheumatoid arthritis", Annals of the Rheumatic Diseases, vol. 64, no. 2,
pp. 196-201.
MacGregor, A.J., Snieder, H., Rigby, A.S., Koskenvuo, M., Kaprio, J., Aho, K. & Silman, A.J. 2000,
"Characterizing the quantitative genetic contribution to rheumatoid arthritis using data from twins",
Arthritis and Rheumatism, vol. 43, no. 1, pp. 30-37.
Mahr, A.D., Edberg, J.C., Stone, J.H., Hoffman, G.S., St. Clair, E.W., Specks, U., Dellaripa, P.F., Seo,
P., Spiera, R.F., Rouhani, F.N., Brantly, M.L. & Merkel, P.A. 2010, "Alpha1-antitrypsin deficiency-
related alleles Z and S and the risk of Wegener's granulomatosis", Arthritis and Rheumatism, vol.
62, no. 12, pp. 3760-3767.
Manfredsdottir, V.F., Vikingsdottir, T., Jonsson, T., Geirsson, A.J., Kjartansson, O., Heimisdottir, M.,
Sigurdardottir, S.L., Valdimarsson, H. & Vikingsson, A. 2006, "The effects of tobacco smoking and
96
rheumatoid factor seropositivity on disease activity and joint damage in early rheumatoid arthritis",
Rheumatology, vol. 45, no. 6, pp. 734-740.
Marinou, I., Healy, J., Mewar, D., Moore, D.J., Dickson, M.C., Binks, M.H., Montgomery, D.S.,
Walters, K. & Wilson, A.G. 2007, "Association of interleukin-6 and interleukin-10 genotypes with
radiographic damage in rheumatoid arthritis is dependent on autoantibody status", Arthritis and
Rheumatism, vol. 56, no. 8, pp. 2549-2556.
Másdóttir, B., Jónsson, T., Manfreosdóttir, V., Víkingsson, A., Brekkan, Á & Valdimarsson, H. 2000,
"Smoking, rheumatoid factor isotypes and severity of rheumatoid arthritis", Rheumatology, vol. 39,
no. 11, pp. 1202-1205.
Mc Ardle, A., Flatley, B., Pennington, S.R. & FitzGerald, O. 2015, "Early biomarkers of joint damage in
rheumatoid and psoriatic arthritis", Arthritis Research and Therapy, vol. 17, no. 1.
McInnes, I.B., Leung, B.P. & Liew, F.Y. 2000, "Cell-cell interactions in synovitis. Interactions between
T lymphocytes and synovial cells", Arthritis Research, vol. 2, no. 5, pp. 374-378.
McInnes, I.B. & Schett, G. 2011, "The pathogenesis of rheumatoid arthritis.", The New England journal
of medicine, vol. 365, no. 23, pp. 2205-2219.
McInnes, I.B. & Schett, G. 2007, "Cytokines in the pathogenesis of rheumatoid arthritis", Nature
Reviews Immunology, vol. 7, no. 6, pp. 429-442.
McKinney, E.F., Willcocks, L.C., Broecker, V. & Smith, K.G.C. 2014, "The immunopathology of
ANCA-associated vasculitis", Seminars in Immunopathology, vol. 36, no. 4, pp. 461-478.
Meyer, L.-., Franssen, L. & Pap, T. 2006, "The role of mesenchymal cells in the pathophysiology of
inflammatory arthritis", Best Practice and Research: Clinical Rheumatology, vol. 20, no. 5, pp.
969-981.
Miossec, P., Korn, T. & Kuchroo, V.K. 2009, "Interleukin-17 and type 17 helper T cells", New England
Journal of Medicine, vol. 361, no. 9.
Mohammed, F.F., Smookler, D.S. & Khokha, R. 2003, "Metalloproteinases, inflammation, and
rheumatoid arthritis", Annals of the Rheumatic Diseases, vol. 62, no. SUPPL. 2, pp. 43-47.
Müller-Ladner, U., Kriegsmann, J., Franklin, B.N., Matsumoto, S., Geiler, T., Gay, R.E. & Gay, S. 1996,
"Synovial fibroblasts of patients with rheumatoid arthritis attach to and invade normal human
97
cartilage when engrafted into SCID mice", American Journal of Pathology, vol. 149, no. 5, pp.
1607-1615.
Muthana, M., Hawtree, S., Wilshaw, A., Linehan, E., Roberts, H., Khetan, S., Adeleke, G., Wright, F.,
Akil, M., Fearon, U., Veale, D., Ciani, B. & Wilsona, A.G. 2015, "C5orf30 is a negative regulator
of tissue damage in rheumatoid arthritis", Proceedings of the National Academy of Sciences of the
United States of America, vol. 112, no. 37, pp. 11618-11623.
Nair, N., Mei, H.E., Chen, S.-., Hale, M., Nolan, G.P., Maecker, H.T., Genovese, M., Fathman, C.G. &
Whiting, C.C. 2015, "Mass cytometry as a platform for the discovery of cellular biomarkers to
guide effective rheumatic disease therapy", Arthritis Research and Therapy, vol. 17, no. 1, pp. 127.
Negrei, C., Bojinca, V., Balanescu, A., Bojinca, M., Baconi, D., Spandidos, D.A., Tsatsakis, A.M. &
Stan, M. 2016, "Management of rheumatoid arthritis: Impact and risks of various therapeutic
approaches (Review)", Experimental and Therapeutic Medicine, vol. 11, no. 4, pp. 1177-1183.
Nell, V.P.K., Machold, K.P., Stamm, T.A., Eberl, G., Heinzl, H., Uffmann, M., Smolen, J.S. & Steiner,
G. 2005, "Autoantibody profiling as early diagnostic and prognostic tool for rheumatoid arthritis",
Annals of the Rheumatic Diseases, vol. 64, no. 12, pp. 1731-1736.
Nemec, P., Pavkova-Goldbergova, M., Gatterova, J., Fojtik, Z., Vasku, A. & Soucek, M. 2009,
"Association of the -1082 G/A promoter polymorphism of interleukin-10 gene with the
autoantibodies production in patients with rheumatoid arthritis", Clinical rheumatology, vol. 28, no.
8, pp. 899-905.
Neogi, T., Aletaha, D., Silman, A.J., Naden, R.L., Felson, D.T., Aggarwal, R., Bingham III, C.O.,
Birnbaum, N.S., Burmester, G.R., Bykerk, V.P., Cohen, M.D., Combe, B., Costenbader, K.H.,
Dougados, M., Emery, P., Ferraccioli, G., Hazes, J.M.W., Hobbs, K., Huizinga, T.W.J., Kavanaugh,
A., Kay, J., Khanna, D., Kvien, T.K., Laing, T., Liao, K., Mease, P., Ménard, H.A., Moreland,
L.W., Nair, R., Pincus, T., Ringold, S., Smolen, J.S., Stanislawska-Biernat, E., Symmons, D., Tak,
P.P., Upchurch, K.S., Vencovský, J., Wolfe, F. & Hawker, G. 2010, "The 2010 American College
of Rheumatology/European League Against Rheumatism classification criteria for rheumatoid
arthritis: Phase 2 methodological report", Arthritis and Rheumatism, vol. 62, no. 9, pp. 2582-2591.
Newell, E.W., Sigal, N., Nair, N., Kidd, B.A., Greenberg, H.B. & Davis, M.M. 2013, "Combinatorial
tetramer staining and mass cytometry analysis facilitate T-cell epitope mapping and
characterization", Nature biotechnology, vol. 31, no. 7, pp. 623-629.
98
Nigrovic, P.A. & Lee, D.M. 2007, "Synovial mast cells: Role in acute and chronic arthritis",
Immunological reviews, vol. 217, no. 1, pp. 19-37.
Padyukov, L., Seielstad, M., Ong, R.T.H., Ding, B., Rönnelid, J., Seddighzadeh, M., Alfredsson, L. &
Klareskog, L. 2011, "A genome-wide association study suggests contrasting associations in ACPA-
positive versus ACPA-negative rheumatoid arthritis", Annals of the Rheumatic Diseases, vol. 70,
no. 2, pp. 259-265.
Palosaari, K., Vuotila, J., Takalo, R., Jartti, A., Niemelä, R.K., Karjalainen, A., Haapea, M., Soini, I.,
Tervonen, O. & Hakala, M. 2006, "Bone oedema predicts erosive progression on wrist MRI in early
RA - A 2-yr observational MRI and NC scintigraphy study", Rheumatology, vol. 45, no. 12, pp.
1542-1548.
Paradowska-Gorycka, A., Trefler, J., Maciejewska-Stelmach, J. & Lacki, J.K. 2010, "Interleukin-10 gene
promoter polymorphism in Polish rheumatoid arthritis patients", International Journal of
Immunogenetics, vol. 37, no. 4, pp. 225-231.
Pawlik, A., Kurzawski, M., Florczak, M., Gawronska Szklarz, B. & Herczynska, M. 2005a, "ILIß+3953
exon 5 and IL-2-330 promoter polymorphisms in patients with rheumatoid arthritis", Clinical and
experimental rheumatology, vol. 23, no. 2, pp. 159-164.
Pawlik, A., Kurzawski, M., Szklarz, B.G., Herczynska, M. & Drozdzik, M. 2005b, "Interleukin-10
promoter polymorphism in patients with rheumatoid arthritis", Clinical rheumatology, vol. 24, no.
5, pp. 480-484.
Plant, D., Bowes, J., Potter, C., Hyrich, K.L., Morgan, A.W., Wilson, A.G., Isaacs, J.D. & Barton, A.
2011, "Genome-wide association study of genetic predictors of anti-tumor necrosis factor treatment
efficacy in rheumatoid arthritis identifies associations with polymorphisms at seven loci", Arthritis
and Rheumatism, vol. 63, no. 3, pp. 645-653.
Plenge, R.M., Padyukov, L., Remmers, E.F., Purcell, S., Lee, A.T., Karlson, E.W., Wolfe, F., Kastner,
D.L., Alfredsson, L., Altshuler, D., Gregersen, P.K., Klareskog, L. & Rioux, J.D. 2005,
"Replication of putative candidate-gene associations with rheumatoid arthritis in >4,000 samples
from North America and Sweden: Association of susceptibility with PTPN22, CTLA4, and
PADI4", American Journal of Human Genetics, vol. 77, no. 6, pp. 1044-1060.
Raychaudhuri, S., Remmers, E.F., Lee, A.T., Hackett, R., Guiducci, C., Burtt, N.P., Gianniny, L.,
Korman, B.D., Padyukov, L., Kurreeman, F.A.S., Chang, M., Catanese, J.J., Ding, B., Wong, S.,
99
Van Der Helm-Van Mil, A.H.M., Neale, B.M., Coblyn, J., Cui, J., Tak, P.P., Wolbink, G.J.,
Crusius, J.B.A., Horst-Bruinsma, I.E.V.D., Criswell, L.A., Amos, C.I., Seldin, M.F., Kastner, D.L.,
Ardlie, K.G., Alfredsson, L., Costenbader, K.H., Altshuler, D., Huizinga, T.W.J., Shadick, N.A.,
Weinblatt, M.E., De Vries, N., Worthington, J., Seielstad, M., Toes, R.E.M., Karlson, E.W.,
Begovich, A.B., Klareskog, L., Gregersen, P.K., Daly, M.J. & Plenge, R.M. 2008, "Common
variants at CD40 and other loci confer risk of rheumatoid arthritis", Nature genetics, vol. 40, no. 10,
pp. 1216-1223.
Reynolds, R.J., Cui, X., Vaughan, L.K., Redden, D.T., Causey, Z., Perkins, E., Shah, T., Hughes, L.B.,
Damle, A., Kern, M., Gregersen, P.K., Johnson, M.R. & Bridges Jr., S.L. 2013, "Gene expression
patterns in peripheral blood cells associated with radiographic severity in African Americans with
early rheumatoid arthritis", Rheumatology international, vol. 33, no. 1, pp. 129-137.
Robinson, W.H., Lindstrom, T.M., Cheung, R.K. & Sokolove, J. 2013, "Mechanistic biomarkers for
clinical decision making in rheumatic diseases", Nature Reviews Rheumatology, vol. 9, no. 5, pp.
267-276.
Rodríguez-Carrio, J., Alperi-López, M., López, P., Alonso-Castro, S., Ballina-García, F.J. & Suárez, A.
2014, "Angiogenic T cells are decreased in rheumatoid arthritis patients", Annals of the Rheumatic
Diseases, .
Rönnelid, J., Wick, M.C., Lampa, J., Lindblad, S., Nordmark, B., Klareskog, L. & Van Vollenhoven,
R.F. 2005, "Longitudinal analysis of citrullinated protein/peptide antibodies (anti-CP) during 5 year
follow up in early rheumatoid arthritis: Anti-CP status predicts worse disease activity and greater
radiological progression", Annals of the Rheumatic Diseases, vol. 64, no. 12, pp. 1744.
Saag, K.G., Gim, G.T., Patkar, N.M., Anuntiyo, J., Finney, C., Curtis, J.R., Paulus, H.E., Mudano, A.,
Pisu, M., Elkins-Melton, M., Outman, R., Allison, J.J., Almazor, M.S., Bridges Jr., S.L., Chatham,
W.W., Hochberg, M., Maclean, C., Mikuls, T., Moreland, L.W., O'Dell, J., Turkiewicz, A.M. &
Furst, D.E. 2008, "American College of Rheumatology 2008 recommendations for the use of
nonbiologic and biologic disease-modifying antirheumatic drugs in rheumatoid arthritis", Arthritis
Care and Research, vol. 59, no. 6, pp. 762-784.
Schulze-Koops, H. & Kalden, J.R. 2001, "The balance of Th1/Th2 cytokines in rheumatoid arthritis",
Best Practice and Research: Clinical Rheumatology, vol. 15, no. 5, pp. 677-691.
100
Scott, D.L. & Houssien, D.A. 1996, "Joint assessment in rheumatoid arthritis", British journal of
rheumatology, vol. 35, no. SUPPL. 2, pp. 14-18.
Scott, D.L., Wolfe, F. & Huizinga, T.W.J. 2010, "Rheumatoid arthritis", The Lancet, vol. 376, no. 9746,
pp. 1094-1108.
Scott, I.C., Lewis, C.M., Cope, A.P. & Steer, S. 2013, "Rheumatoid arthritis severity: Its underlying
prognostic factors and how they can be combined to inform treatment decisions", International
Journal of Clinical Rheumatology, vol. 8, no. 2, pp. 247-263.
Seldin, M.F., Amos, C.I., Ward, R. & Gregersen, P.K. 1999, "The genetics revolution and the assault on
rheumatoid arthritis", Arthritis and Rheumatism, vol. 42, no. 6, pp. 1071-1079.
Seyler, T.M., Park, Y.W., Takemura, S., Bram, R.J., Kurtin, P.J., Goronzy, J.J. & Weyand, C.M. 2005,
"BLyS and APRIL in rheumatoid arthritis", Journal of Clinical Investigation, vol. 115, no. 11, pp.
3083-3092.
Shi, J., Knevel, R., Suwannalai, P., Van Der Linden, M.P., Janssen, G.M.C., Van Veelen, P.A., Levarht,
N.E.W., Van Der Helm-van Mil, A.H.M., Cerami, A., Huizinga, T.W.J., Toes, R.E.M. & Trouw,
L.A. 2011, "Autoantibodies recognizing carbamylated proteins are present in sera of patients with
rheumatoid arthritis and predict joint damage", Proceedings of the National Academy of Sciences of
the United States of America, vol. 108, no. 42, pp. 17372-17377.
Silman AJ, H.M. (ed) 2001, Epidemiology of the rheumatic diseases, 2nd edn, Oxford University Press.
Singh, J.A., Furst, D.E., Bharat, A., Curtis, J.R., Kavanaugh, A.F., Kremer, J.M., Moreland, L.W.,
O'Dell, J., Winthrop, K.L., Beukelman, T., Bridges Jr., S.L., Chatham, W.W., Paulus, H.E., Suarez-
Almazor, M., Bombardier, C., Dougados, M., Khanna, D., King, C.M., Leong, A.L., Matteson,
E.L., Schousboe, J.T., Moynihan, E., Kolba, K.S., Jain, A., Volkmann, E.R., Agrawal, H., Bae, S.,
Mudano, A.S., Patkar, N.M. & Saag, K.G. 2012, "2012 update of the 2008 American College of
Rheumatology recommendations for the use of disease-modifying antirheumatic drugs and biologic
agents in the treatment of rheumatoid arthritis.", Arthritis care & research, vol. 64, no. 5, pp. 625-
639.
Singh, J.A., Saag, K.G., Bridges, S.L., Akl, E.A., Bannuru, R.R., Sullivan, M.C., Vaysbrot, E.,
McNaughton, C., Osani, M., Shmerling, R.H., Curtis, J.R., Furst, D.E., Parks, D., Kavanaugh, A.,
O'Dell, J., King, C., Leong, A., Matteson, E.L., Schousboe, J.T., Drevlow, B., Ginsberg, S., Grober,
J., St Clair, E.W., Tindall, E., Miller, A.S. & McAlindon, T. 2016, "2015 American College of
101
Rheumatology Guideline for the Treatment of Rheumatoid Arthritis", Arthritis care & research,
vol. 68, no. 1, pp. 1-25.
Smolen, J.S. 2016, "Treat-to-target as an approach in inflammatory arthritis", Current opinion in
rheumatology, vol. 28, no. 3, pp. 297-302.
Smolen, J.S., Breedveld, F.C., Burmester, G.R., Bykerk, V., Dougados, M., Emery, P., Kvien, T.K.,
Navarro-Compán, M.V., Oliver, S., Schoels, M., Scholte-Voshaar, M., Stamm, T., Stoffer, M.,
Takeuchi, T., Aletaha, D., Andreu, J.L., Aringer, M., Bergman, M., Betteridge, N., Bijlsma, H.,
Burkhardt, H., Cardiel, M., Combe, B., Durez, P., Fonseca, J.E., Gibofsky, A., Gomez-Reino, J.J.,
Graninger, W., Hannonen, P., Haraoui, B., Kouloumas, M., Landewe, R., Martin-Mola, E., Nash,
P., Ostergaard, M., Östör, A., Richards, P., Sokka-Isler, T., Thorne, C., Tzioufas, A.G., Van
Vollenhoven, R., De Wit, M. & Van Der Heijde, D. 2016, "Treating rheumatoid arthritis to target:
2014 update of the recommendations of an international task force", Annals of the Rheumatic
Diseases, vol. 75, no. 1, pp. 3-15.
Stahl, E.A., Raychaudhuri, S., Remmers, E.F., Xie, G., Eyre, S., Thomson, B.P., Li, Y., Kurreeman,
F.A.S., Zhernakova, A., Hinks, A., Guiducci, C., Chen, R., Alfredsson, L., Amos, C.I., Ardlie,
K.G., Barton, A., Bowes, J., Brouwer, E., Burtt, N.P., Catanese, J.J., Coblyn, J., Coenen, M.J.H.,
Costenbader, K.H., Criswell, L.A., Crusius, J.B.A., Cui, J., De Bakker, P.I.W., De Jager, P.L., Ding,
B., Emery, P., Flynn, E., Harrison, P., Hocking, L.J., Huizinga, T.W.J., Kastner, D.L., Ke, X., Lee,
A.T., Liu, X., Martin, P., Morgan, A.W., Padyukov, L., Posthumus, M.D., Radstake, T.R.D.J., Reid,
D.M., Seielstad, M., Seldin, M.F., Shadick, N.A., Steer, S., Tak, P.P., Thomson, W., Van Der
Helm-Van Mil, A.H.M., Van Der Horst-Bruinsma, I.E., Van Der Schoot, C.E., Van Riel, P.L.C.M.,
Weinblatt, M.E., Wilson, A.G., Wolbink, G.J., Wordsworth, B.P., Wijmenga, C., Karlson, E.W.,
Toes, R.E.M., De Vries, N., Begovich, A.B., Worthington, J., Siminovitch, K.A., Gregersen, P.K.,
Klareskog, L. & Plenge, R.M. 2010, "Genome-wide association study meta-analysis identifies
seven new rheumatoid arthritis risk loci", Nature genetics, vol. 42, no. 6, pp. 508-514.
Suzuki, A., Yamada, R., Chang, X., Tokuhiro, S., Sawada, T., Suzuki, M., Nagasaki, M., Nakayama-
Hamada, M., Kawaida, R., Ono, M., Ohtsuki, M., Furukawa, H., Yoshino, S., Yukioka, M., Tohma,
S., Matsubara, T., Wakitani, S., Teshima, R., Nishioka, Y., Sekine, A., Iida, A., Takahashi, A.,
Tsunoda, T., Nakamura, Y. & Yamamoto, K. 2003, "Functional haplotypes of PADI4, encoding
citrullinating enzyme peptidylarginine deiminase 4, are associated with rheumatoid arthritis",
Nature genetics, vol. 34, no. 4, pp. 395-402.
102
Suzuki, A., Yamada, R., Kochi, Y., Sawada, T., Okada, Y., Matsuda, K., Kamatani, Y., Mori, M.,
Shimane, K., Hirabayashi, Y., Takahashi, A., Tsunoda, T., Miyatake, A., Kubo, M., Kamatani, N.,
Nakamura, Y. & Yamamoto, K. 2008, "Functional SNPs in CD244 increase the risk of rheumatoid
arthritis in a Japanese population", Nature genetics, vol. 40, no. 10, pp. 1224-1229.
Symmons, D.P.M. & Gabriel, S.E. 2011, "Epidemiology of CVD in rheumatic disease, with a focus on
RA and SLE", Nature Reviews Rheumatology, vol. 7, no. 7, pp. 399-408.
Syversen, S.W., Gaarder, P.I., Goll, G.L., Ødegård, S., Haavardsholm, E.A., Mowinckel, P., Van Der
Heijde, D., Landewé, R. & Kvien, T.K. 2008, "High anti-cyclic citrullinated peptide levels and an
algorithm of four variables predict radiographic progression in patients with rheumatoid arthritis:
Results from a 10-year longitudinal study", Annals of the Rheumatic Diseases, vol. 67, no. 2, pp.
212-217.
Takemura, S., Klimiuk, P.A., Braun, A., Goronzy, J.J. & Weyand, C.M. 2001, "T cell activation in
rheumatoid synovium is B cell dependent", Journal of Immunology, vol. 167, no. 8, pp. 4710-4718.
Tang, Q., Danila, M.I., Cui, X., Parks, L., Baker, B.J., Reynolds, R.J., Raman, C., Wanseck, K.C.,
Redden, D.T., Johnson, M.R. & Louis Bridges, S. 2015, "Brief report: Expression of interferon-γ
receptor genes in peripheral blood mononuclear cells is associated with rheumatoid arthritis and its
radiographic severity in african americans", Arthritis and Rheumatology, vol. 67, no. 5, pp. 1165-
1170.
Trapnell, C., Roberts, A., Goff, L., Pertea, G., Kim, D., Kelley, D.R., Pimentel, H., Salzberg, S.L., Rinn,
J.L. & Pachter, L. 2012, "Differential gene and transcript expression analysis of RNA-seq
experiments with TopHat and Cufflinks", Nature Protocols, vol. 7, no. 3, pp. 562-578.
Trouw, L.A., Haisma, E.M., Levarht, E.W.N., Van Der Woude, D., Ioan-Facsinay, A., Daha, M.R.,
Huizinga, T.W.J. & Toes, R.E. 2009, "Anti-cyclic citrullinated peptide antibodies from rheumatoid
arthritis patients activate complement via both the classical and alternative pathways", Arthritis and
Rheumatism, vol. 60, no. 7, pp. 1923-1931.
van der Helm-van Mil, A.H.M. & Huizinga, T.W.J. 2008, "Advances in the genetics of rheumatoid
arthritis point to subclassification into distinct disease subsets", Arthritis Research and Therapy,
vol. 10, no. 2.
Van Der Linden, M.P.M., Feitsma, A.L., Le Cessie, S., Kern, M., Olsson, L.M., Raychaudhuri, S.,
Begovich, A.B., Chang, M., Catanese, J.J., Kurreeman, F.A.S., Van Nies, J., Van Der Heijde, D.M.,
103
Gregersen, P.K., Huizinga, T.W.J., Toes, R.E.M. & Van Der Helm-van Mil, A.H.M. 2009,
"Association of a single-nucleotide polymorphism in CD40 with the rate of joint destruction in
rheumatoid arthritis", Arthritis and Rheumatism, vol. 60, no. 8, pp. 2242-2247.
Van Nies, J.A.B., Knevel, R., Daha, N., Van Der Linden, M.P.M., Gregersen, P.K., Kern, M., Le Cessie,
S., Houwing-Duistermaat, J.J., Huizinga, T.W.J., Toes, R.E.M. & Van Der Helm-van Mil, A.H.M.
2010, "The PTPN22 susceptibility risk variant is not associated with the rate of joint destruction in
anti-citrullinated protein antibody-positive rheumatoid arthritis", Annals of the Rheumatic Diseases,
vol. 69, no. 9, pp. 1730-1731.
Van Tuyl, L.H.D., Voskuyl, A.E., Boers, M., Geusens, P., Landewé, R.B.M., Dijkmans, B.A.C. & Lems,
W.F. 2010, "Baseline RANKL:OPG ratio and markers of bone and cartilage degradation predict
annual radiological progression over 11 years in rheumatoid arthritis", Annals of the Rheumatic
Diseases, vol. 69, no. 9, pp. 1623-1628.
Vaz, A., Lisse, J., Rizzo, W. & Albani, S. 2009, "Discussion: DMARDs and biologic therapies in the
management of inflammatory joint diseases", Expert Review of Clinical Immunology, vol. 5, no. 3,
pp. 291-299.
Viatte, S., Plant, D. & Raychaudhuri, S. 2013, "Genetics and epigenetics of rheumatoid arthritis", Nature
Reviews Rheumatology, vol. 9, no. 3, pp. 141-153.
Wang, L., Wang, S. & Li, W. 2012, "RSeQC: Quality control of RNA-seq experiments", Bioinformatics,
vol. 28, no. 16, pp. 2184-2185.
Weaver, C.T., Hatton, R.D., Mangan, P.R. & Harrington, L.E. 2007, IL-17 family cytokines and the
expanding diversity of effector T cell lineages.
Wieczorek, S., Holle, J.U. & Epplen, J.T. 2010, "Recent progress in the genetics of Wegener's
granulomatosis and Churg-Strauss syndrome", Current opinion in rheumatology, vol. 22, no. 1, pp.
8-14.
Wilde, B., Van Paassen, P., Damoiseaux, J., Heerings-Rewinkel, P., Van Rie, H., Witzke, O. & Tervaert,
J.W.C. 2009, "Dendritic cells in renal biopsies of patients with ANCA-associated vasculitis",
Nephrology Dialysis Transplantation, vol. 24, no. 7, pp. 2151-2156.
104
Winthrop, K.L. 2006, "Risk and prevention of tuberculosis and other serious opportunistic infections
associated with the inhibition of tumor necrosis factor", Nature Clinical Practice Rheumatology,
vol. 2, no. 11, pp. 602-610.
Wolfe, F. & Sharp, J. 1998, "Radiographic outcome of recent-onset rheumatoid arthritis - A 19-year
study of radiographic progression", Arthritis and Rheumatism, vol. 41, no. 9, pp. 1571-1582.
Woolley, D.E. 2003, "The mast cell in inflammatory arthritis", New England Journal of Medicine, vol.
348, no. 17, pp. 1709-1711.
Xie, G., Roshandel, D., Sherva, R., Monach, P.A., Lu, E.Y., Kung, T., Carrington, K., Zhang, S.S., Pulit,
S.L., Ripke, S., Carette, S., Dellaripa, P.F., Edberg, J.C., Hoffman, G.S., Khalidi, N., Langford,
C.A., Mahr, A.D., St.clair, E.W., Seo, P., Specks, U., Spiera, R.F., Stone, J.H., Ytterberg, S.R.,
Raychaudhuri, S., De Bakker, P.I.W., Farrer, L.A., Amos, C.I., Merkel, P.A. & Siminovitch, K.A.
2013, "Association of granulomatosis with polyangiitis (Wegener's) with HLA-DPB1*04 and
SEMA6A gene variants: Evidence grom genome-wide analysis", Arthritis and Rheumatism, vol. 65,
no. 9, pp. 2457-2468.
Zhang, J., Zahir, N., Jiang, Q., Miliotis, H., Heyraud, S., Meng, X., Dong, B., Xie, G., Qiu, F., Hao, Z.,
McCulloch, C.A., Keystone, E.C., Peterson, A.C. & Siminovitch, K.A. 2011, "The autoimmune
disease-associated PTPN22 variant promotes calpain-mediated Lyp/Pep degradation associated with
lymphocyte and dendritic cell hyperresponsiveness", Nature genetics, vol. 43, no. 9, pp. 902-907.
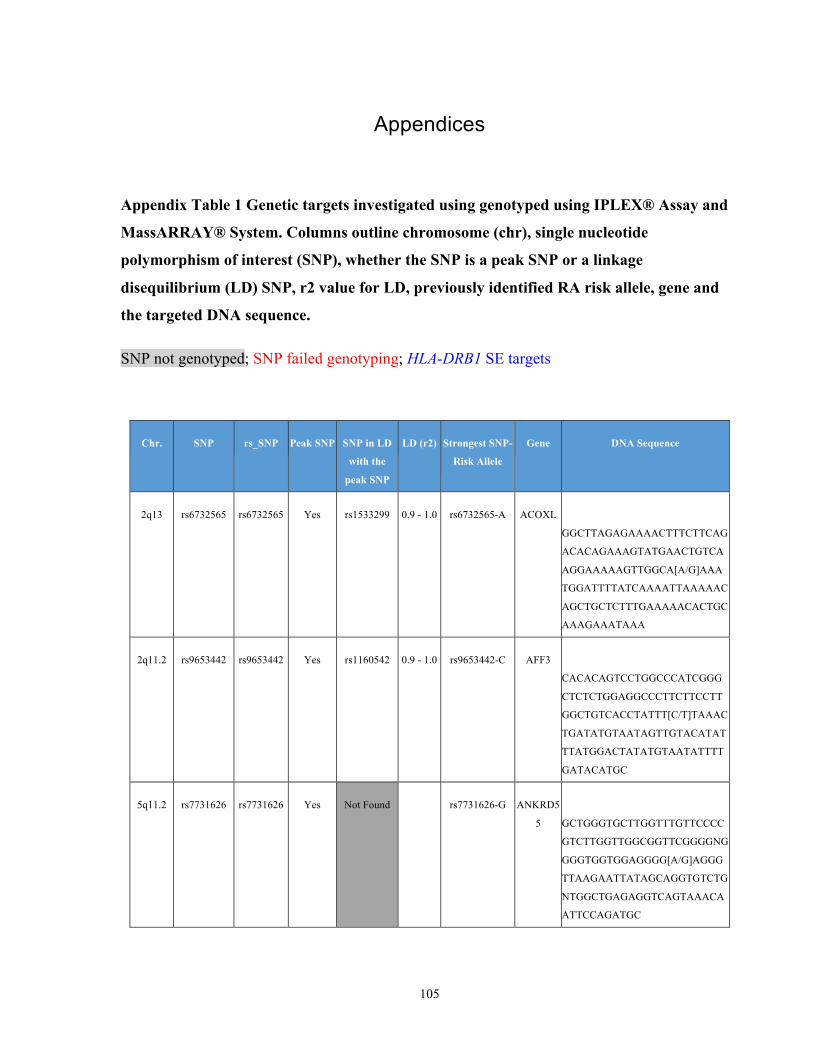
105
Appendices
Appendix Table 1 Genetic targets investigated using genotyped using IPLEX® Assay and
MassARRAY® System. Columns outline chromosome (chr), single nucleotide
polymorphism of interest (SNP), whether the SNP is a peak SNP or a linkage
disequilibrium (LD) SNP, r2 value for LD, previously identified RA risk allele, gene and
the targeted DNA sequence.
SNP not genotyped; SNP failed genotyping; HLA-DRB1 SE targets
Chr. SNP rs_SNP Peak SNP SNP in LD
with the
peak SNP
LD (r2) Strongest SNP-
Risk Allele
Gene DNA Sequence
2q13 rs6732565 rs6732565 Yes rs1533299 0.9 - 1.0 rs6732565-A ACOXL
GGCTTAGAGAAAACTTTCTTCAG
ACACAGAAAGTATGAACTGTCA
AGGAAAAAGTTGGCA[A/G]AAA
TGGATTTTATCAAAATTAAAAAC
AGCTGCTCTTTGAAAAACACTGC
AAAGAAATAAA
2q11.2 rs9653442 rs9653442 Yes rs1160542 0.9 - 1.0 rs9653442-C AFF3
CACACAGTCCTGGCCCATCGGG
CTCTCTGGAGGCCCTTCTTCCTT
GGCTGTCACCTATTT[C/T]TAAAC
TGATATGTAATAGTTGTACATAT
TTATGGACTATATGTAATATTTT
GATACATGC
5q11.2 rs7731626 rs7731626 Yes Not Found
rs7731626-G ANKRD5
5
GCTGGGTGCTTGGTTTGTTCCCC
GTCTTGGTTGGCGGTTCGGGGNG
GGGTGGTGGAGGGG[A/G]AGGG
TTAAGAATTATAGCAGGTGTCTG
NTGGCTGAGAGGTCAGTAAACA
ATTCCAGATGC

106
Chr. SNP rs_SNP Peak SNP SNP in LD
with the
peak SNP
LD (r2) Strongest SNP-
Risk Allele
Gene DNA Sequence
4q21 rs10028001 rs10028001 Yes rs2867461 0.9 - 1.0 rs10028001-T ANXA3
CCTTCCTCTTGGAGCTCTTTGGG
AGTTACTGAGAGGCAAGACACC
GAGGAAGAGAGCACC[A/T]CCCA
CTGAAGCTGGGCNTGAATTTATA
AGGGTTCCTCTTCCTCTTCCCTT
ACCCCAATCT
11q13 rs11605042 rs11605042 Yes rs3765105 0.9 - 1.0 rs11605042-G ARAP1
TGCCAAGTGCCCACTGTGTGCTA
GCCACTGTTCTAGGATCTGGGGG
CTACAGGCAGTGGT[A/G]GCCAA
AAGGAGTTTATGTCCCANTGGG
GTACAGAGAATCTATAGATAAG
TACATTAATGG
10q21.2 rs71508903 rs71508903 Yes rs35892992 0.8 - 0.9 rs71508903-T ARID5B
CCTAACTTTCTGGCGAGGAGTCT
TGAGTAGAAGGGAGGTGGAAAC
AAAAAAGGATGGGAA[C/T]ATGT
TTGAGTTTCCACAAAGCTACACT
TCCAAGCAAACTTTGAATTAATA
TGTCACTCCC
6q21 rs9372120 rs9372120 Yes rs9372121 0.9 - 1.0 rs9372120-G ATG5
GGGTATGCATAGGTTATATGCA
AATACTACACCATTTTATATCAG
ACTCTCAAACATCAG[G/T]AGAA
TTTGGTAACCCAGGGAGGTCCTG
GAACTAATCACCCAGAGGTATC
GACAGATGGCT
11q22 chr11:107967
350
rs13819388
7
Yes rs73000527 0.9 - 1.0 chr11:10796735
0-A
ATM
ACTTTTTTTTTTTTTTTTTTTTTTT
TTTTGAGACACTCTTGTCGCTCA
GGCTGGAGTGCA[A/G]TGGCGCA
ATCTCAGCTCACTGCAACCTCCG
CCTCCAGGGTTTAAGCGATTCTC
CTACCTC

107
Chr. SNP rs_SNP Peak SNP SNP in LD
with the
peak SNP
LD (r2) Strongest SNP-
Risk Allele
Gene DNA Sequence
2p15 rs13385025 rs13385025 Yes rs6707337 0.9 - 1.0 rs13385025-A B3GNT2
ATGGCTCACTGCACCCTTGACTT
CCTGGGCTTGTGTGATCCNACAG
GTGTATACCACCAC[A/G]CCCAG
CAAAGATNTCCACTTTCTGTTCC
CAGATGCTATTTAAGGCCCCACA
TGGCATTTG
8p23.1 rs2736337 rs2736337 Yes rs13277113 0.9 - 1.0 rs2736337-C BLK
AGGCTGCCATAACAAAATGCCA
CAAGACTGGGTGGCTTAAACAA
TAGAAGNTTATTGTCT[C/T]ACN
GTTCTGGAGGCTGGAANTCCAA
GATCAAAGTGCCTGCTGGTTTGG
TTTCTTCTGAGT
4p15.2 rs11933540 rs11933540 Yes rs36020664 0.9 - 1.0 rs11933540-C C4orf52
AGAATCTCTTTGGTTAAAAGAA
AAGTTCATCCTACAGCATTAATC
ATTCACCAGGTGAGG[C/T]ATGG
GTTATCAGTCCATCCNTGGTTTG
GTTATTCTCCAGCCAACTGTGGC
CAAACAGGTG
5q21.1 rs2561477 rs2561477 Yes rs1991797 0.9 - 1.0 rs2561477-G C5orf30
ATAGTGAATGTTTTGTCTACCTC
AGTAAAATATGGTAGATTTCATA
CACCAGACTGCCTG[A/G]TTGAA
ATTTCCAGAGCTCTTAAACCACA
TCTGTATCTTCTACTTAACAACC
TAGGTTAAA
9p13.3 rs11574914 rs11574914 Yes rs10972201 0.9 - 1.0 rs11574914-A CCL19
GTGAGGAGACAGTCATGGTGTT
CCAGGGGAGAGGCAGTGAGGCC
TGCATGAAAGCAGTAG[C/T]TGG
GAATAGAAGGAAGGCTCAGGCC
CAGACATATTCAACTAATGAGG
ACATAAAATTTGG

108
Chr. SNP rs_SNP Peak SNP SNP in LD
with the
peak SNP
LD (r2) Strongest SNP-
Risk Allele
Gene DNA Sequence
6q27 rs1571878 rs1571878 Yes rs10946216 0.9 - 1.0 rs1571878-C CCR6
TTCTGTGAGTGAGAAGGTTTGGG
AAATAGTGAGTTATTCCAGCAG
GGCTCTNAAGGGCCA[C/T]TGAT
AAACAANCTCTAATANGAATAA
ACTAGGGAAGGATGTAGTTAGC
ATCTTATTAATG
1p13.1 rs624988 rs624988 Yes rs771587 0.9 - 1.0 rs624988-T CD2
TTGTTTGCTGTCTTTCTCCCTCCA
CTAGAATGTAAGTTCCATGAAG
GCTGCCATCTGGTC[A/G]GGGTG
TTTCCACATGCCCCCACCACTTA
GTATGGTGGCTGTCACAGTGTGG
GGGTGCCAT
18q22.2 rs2469434 rs2469434 Yes rs4891376 0.9 - 1.0 rs2469434-C CD226
AAAAAAAAAAAAAAAGTTCTAG
AGGCCTGGACTTGCAATTGGTGT
CTGAANGGCAGGGTT[A/G]GCAA
TGGAGGAGNGGGTGAGATGTCT
TTGGGACTGAGCCCCCAGCCTGT
GGGATCTGATA
2q33.2 rs1980422 rs1980422 Yes rs1980421 0.9 - 1.0 rs1980422-C CD28
GAATGACTATCTTTCATTTGATA
AATATCCGCAAGCTATTTTGGTT
TTTGACAAATTAGA[C/T]GAAAC
AGGTATTATGAAAAGACTTGGG
AAAATTGAGGACAAATTAGTTA
ACTAGATACTA
20q13.12 rs4239702 rs4239702 Yes rs4810485 0.8 - 0.9 rs4239702-C CD40
GGAGCTAGAATAGAGTTAATGC
CTCTCAAAGGCTTGCTAATCCTT
CTTTTAAAACAAAAA[C/T]CAAG
AGCAGNCCTGGNAGGGCCTTCA
ACAAGCAAACAACCAGCTGGGT
TTTAATAACCTT
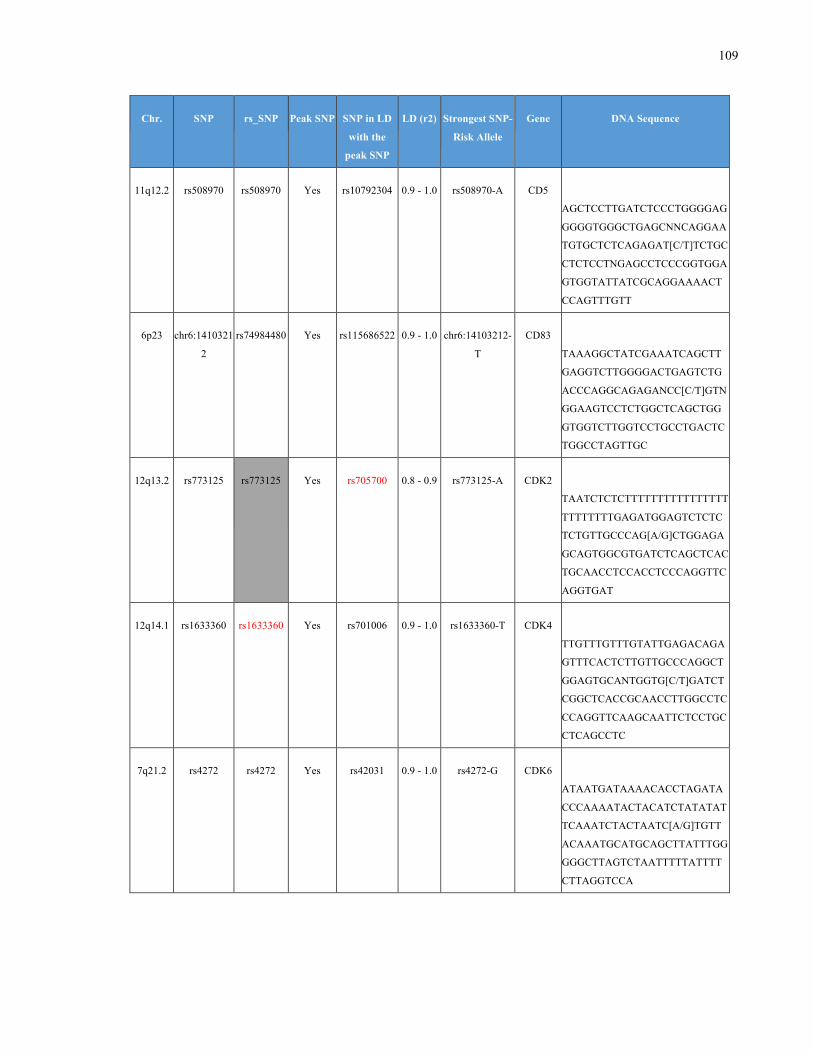
109
Chr. SNP rs_SNP Peak SNP SNP in LD
with the
peak SNP
LD (r2) Strongest SNP-
Risk Allele
Gene DNA Sequence
11q12.2 rs508970 rs508970 Yes rs10792304 0.9 - 1.0 rs508970-A CD5
AGCTCCTTGATCTCCCTGGGGAG
GGGGTGGGCTGAGCNNCAGGAA
TGTGCTCTCAGAGAT[C/T]TCTGC
CTCTCCTNGAGCCTCCCGGTGGA
GTGGTATTATCGCAGGAAAACT
CCAGTTTGTT
6p23 chr6:1410321
2
rs74984480 Yes rs115686522 0.9 - 1.0 chr6:14103212-
T
CD83
TAAAGGCTATCGAAATCAGCTT
GAGGTCTTGGGGACTGAGTCTG
ACCCAGGCAGAGANCC[C/T]GTN
GGAAGTCCTCTGGCTCAGCTGG
GTGGTCTTGGTCCTGCCTGACTC
TGGCCTAGTTGC
12q13.2 rs773125 rs773125
Yes rs705700 0.8 - 0.9 rs773125-A CDK2
TAATCTCTCTTTTTTTTTTTTTTTT
TTTTTTTTGAGATGGAGTCTCTC
TCTGTTGCCCAG[A/G]CTGGAGA
GCAGTGGCGTGATCTCAGCTCAC
TGCAACCTCCACCTCCCAGGTTC
AGGTGAT
12q14.1 rs1633360 rs1633360 Yes rs701006 0.9 - 1.0 rs1633360-T CDK4
TTGTTTGTTTGTATTGAGACAGA
GTTTCACTCTTGTTGCCCAGGCT
GGAGTGCANTGGTG[C/T]GATCT
CGGCTCACCGCAACCTTGGCCTC
CCAGGTTCAAGCAATTCTCCTGC
CTCAGCCTC
7q21.2 rs4272 rs4272 Yes rs42031 0.9 - 1.0 rs4272-G CDK6
ATAATGATAAAACACCTAGATA
CCCAAAATACTACATCTATATAT
TCAAATCTACTAATC[A/G]TGTT
ACAAATGCATGCAGCTTATTTGG
GGGCTTAGTCTAATTTTTATTTT
CTTAGGTCCA
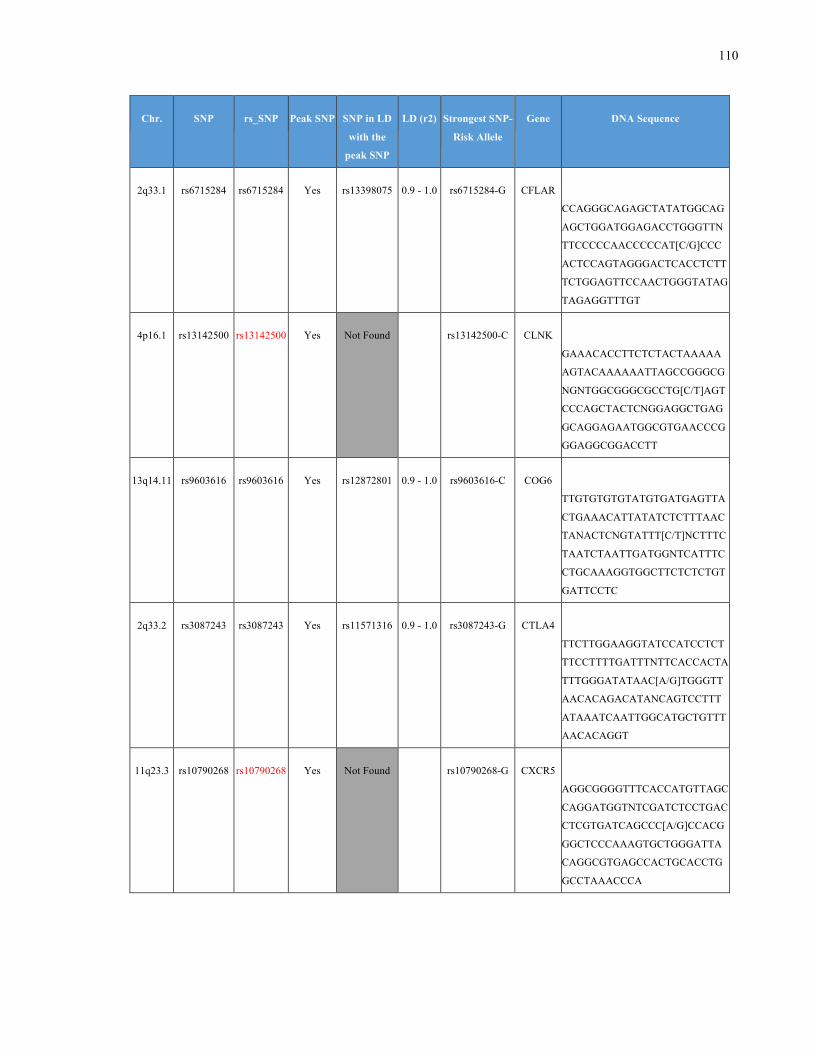
110
Chr. SNP rs_SNP Peak SNP SNP in LD
with the
peak SNP
LD (r2) Strongest SNP-
Risk Allele
Gene DNA Sequence
2q33.1 rs6715284 rs6715284 Yes rs13398075 0.9 - 1.0 rs6715284-G CFLAR
CCAGGGCAGAGCTATATGGCAG
AGCTGGATGGAGACCTGGGTTN
TTCCCCCAACCCCCAT[C/G]CCC
ACTCCAGTAGGGACTCACCTCTT
TCTGGAGTTCCAACTGGGTATAG
TAGAGGTTTGT
4p16.1 rs13142500 rs13142500 Yes Not Found
rs13142500-C CLNK
GAAACACCTTCTCTACTAAAAA
AGTACAAAAAATTAGCCGGGCG
NGNTGGCGGGCGCCTG[C/T]AGT
CCCAGCTACTCNGGAGGCTGAG
GCAGGAGAATGGCGTGAACCCG
GGAGGCGGACCTT
13q14.11 rs9603616 rs9603616 Yes rs12872801 0.9 - 1.0 rs9603616-C COG6
TTGTGTGTGTATGTGATGAGTTA
CTGAAACATTATATCTCTTTAAC
TANACTCNGTATTT[C/T]NCTTTC
TAATCTAATTGATGGNTCATTTC
CTGCAAAGGTGGCTTCTCTCTGT
GATTCCTC
2q33.2 rs3087243 rs3087243 Yes rs11571316 0.9 - 1.0 rs3087243-G CTLA4
TTCTTGGAAGGTATCCATCCTCT
TTCCTTTTGATTTNTTCACCACTA
TTTGGGATATAAC[A/G]TGGGTT
AACACAGACATANCAGTCCTTT
ATAAATCAATTGGCATGCTGTTT
AACACAGGT
11q23.3 rs10790268 rs10790268
Yes Not Found rs10790268-G CXCR5
AGGCGGGGTTTCACCATGTTAGC
CAGGATGGTNTCGATCTCCTGAC
CTCGTGATCAGCCC[A/G]CCACG
GGCTCCCAAAGTGCTGGGATTA
CAGGCGTGAGCCACTGCACCTG
GCCTAAACCCA
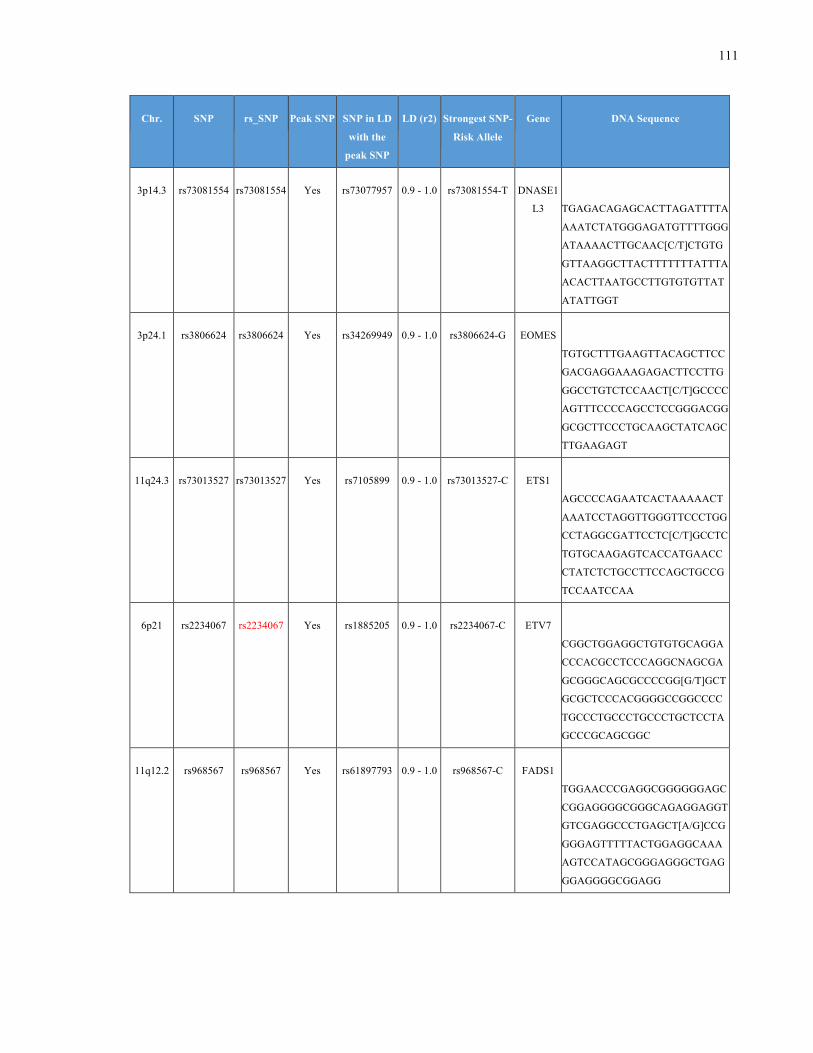
111
Chr. SNP rs_SNP Peak SNP SNP in LD
with the
peak SNP
LD (r2) Strongest SNP-
Risk Allele
Gene DNA Sequence
3p14.3 rs73081554 rs73081554 Yes rs73077957 0.9 - 1.0 rs73081554-T DNASE1
L3
TGAGACAGAGCACTTAGATTTTA
AAATCTATGGGAGATGTTTTGGG
ATAAAACTTGCAAC[C/T]CTGTG
GTTAAGGCTTACTTTTTTTATTTA
ACACTTAATGCCTTGTGTGTTAT
ATATTGGT
3p24.1 rs3806624 rs3806624 Yes rs34269949 0.9 - 1.0 rs3806624-G EOMES
TGTGCTTTGAAGTTACAGCTTCC
GACGAGGAAAGAGACTTCCTTG
GGCCTGTCTCCAACT[C/T]GCCCC
AGTTTCCCCAGCCTCCGGGACGG
GCGCTTCCCTGCAAGCTATCAGC
TTGAAGAGT
11q24.3 rs73013527 rs73013527 Yes rs7105899 0.9 - 1.0 rs73013527-C ETS1
AGCCCCAGAATCACTAAAAACT
AAATCCTAGGTTGGGTTCCCTGG
CCTAGGCGATTCCTC[C/T]GCCTC
TGTGCAAGAGTCACCATGAACC
CTATCTCTGCCTTCCAGCTGCCG
TCCAATCCAA
6p21 rs2234067 rs2234067 Yes rs1885205 0.9 - 1.0 rs2234067-C ETV7
CGGCTGGAGGCTGTGTGCAGGA
CCCACGCCTCCCAGGCNAGCGA
GCGGGCAGCGCCCCGG[G/T]GCT
GCGCTCCCACGGGGCCGGCCCC
TGCCCTGCCCTGCCCTGCTCCTA
GCCCGCAGCGGC
11q12.2 rs968567 rs968567 Yes rs61897793 0.9 - 1.0 rs968567-C FADS1
TGGAACCCGAGGCGGGGGGAGC
CGGAGGGGCGGGCAGAGGAGGT
GTCGAGGCCCTGAGCT[A/G]CCG
GGGAGTTTTTACTGGAGGCAAA
AGTCCATAGCGGGAGGGCTGAG
GGAGGGGCGGAGG
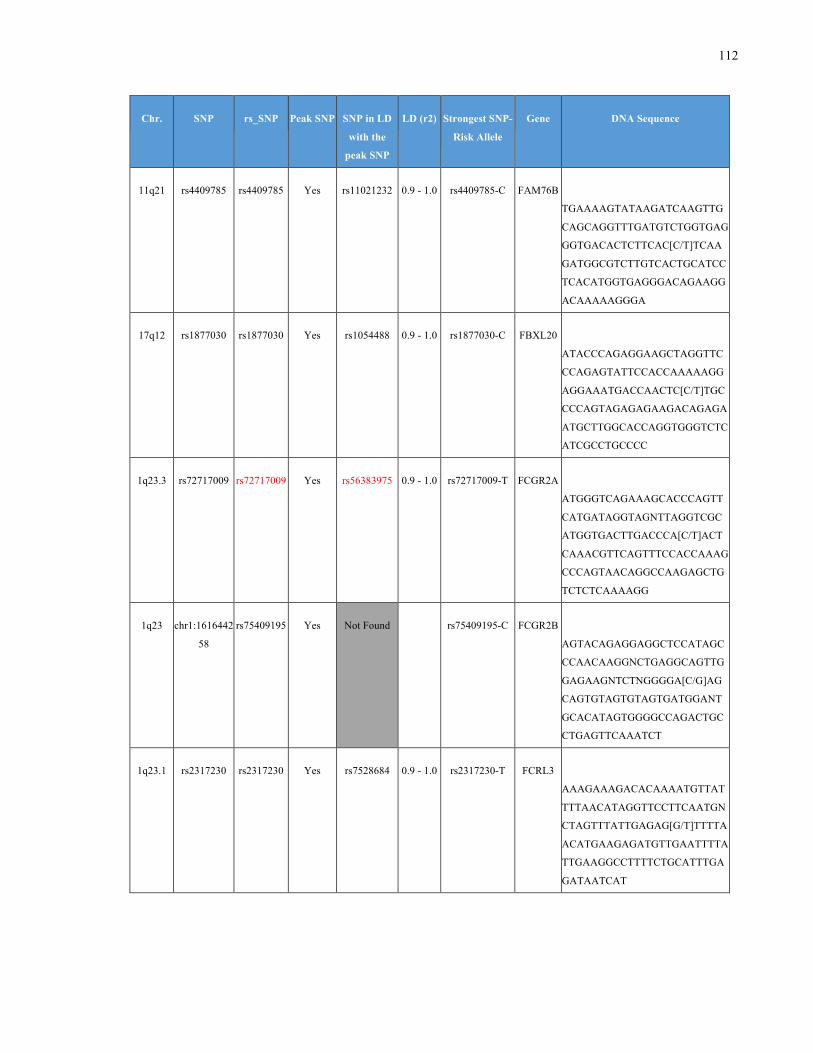
112
Chr. SNP rs_SNP Peak SNP SNP in LD
with the
peak SNP
LD (r2) Strongest SNP-
Risk Allele
Gene DNA Sequence
11q21 rs4409785 rs4409785 Yes rs11021232 0.9 - 1.0 rs4409785-C FAM76B
TGAAAAGTATAAGATCAAGTTG
CAGCAGGTTTGATGTCTGGTGAG
GGTGACACTCTTCAC[C/T]TCAA
GATGGCGTCTTGTCACTGCATCC
TCACATGGTGAGGGACAGAAGG
ACAAAAAGGGA
17q12 rs1877030 rs1877030 Yes rs1054488 0.9 - 1.0 rs1877030-C FBXL20
ATACCCAGAGGAAGCTAGGTTC
CCAGAGTATTCCACCAAAAAGG
AGGAAATGACCAACTC[C/T]TGC
CCCAGTAGAGAGAAGACAGAGA
ATGCTTGGCACCAGGTGGGTCTC
ATCGCCTGCCCC
1q23.3 rs72717009 rs72717009 Yes rs56383975 0.9 - 1.0 rs72717009-T FCGR2A
ATGGGTCAGAAAGCACCCAGTT
CATGATAGGTAGNTTAGGTCGC
ATGGTGACTTGACCCA[C/T]ACT
CAAACGTTCAGTTTCCACCAAAG
CCCAGTAACAGGCCAAGAGCTG
TCTCTCAAAAGG
1q23 chr1:1616442
58
rs75409195 Yes Not Found
rs75409195-C FCGR2B
AGTACAGAGGAGGCTCCATAGC
CCAACAAGGNCTGAGGCAGTTG
GAGAAGNTCTNGGGGA[C/G]AG
CAGTGTAGTGTAGTGATGGANT
GCACATAGTGGGGCCAGACTGC
CTGAGTTCAAATCT
1q23.1 rs2317230 rs2317230 Yes rs7528684 0.9 - 1.0 rs2317230-T FCRL3
AAAGAAAGACACAAAATGTTAT
TTTAACATAGGTTCCTTCAATGN
CTAGTTTATTGAGAG[G/T]TTTTA
ACATGAAGAGATGTTGAATTTTA
TTGAAGGCCTTTTCTGCATTTGA
GATAATCAT
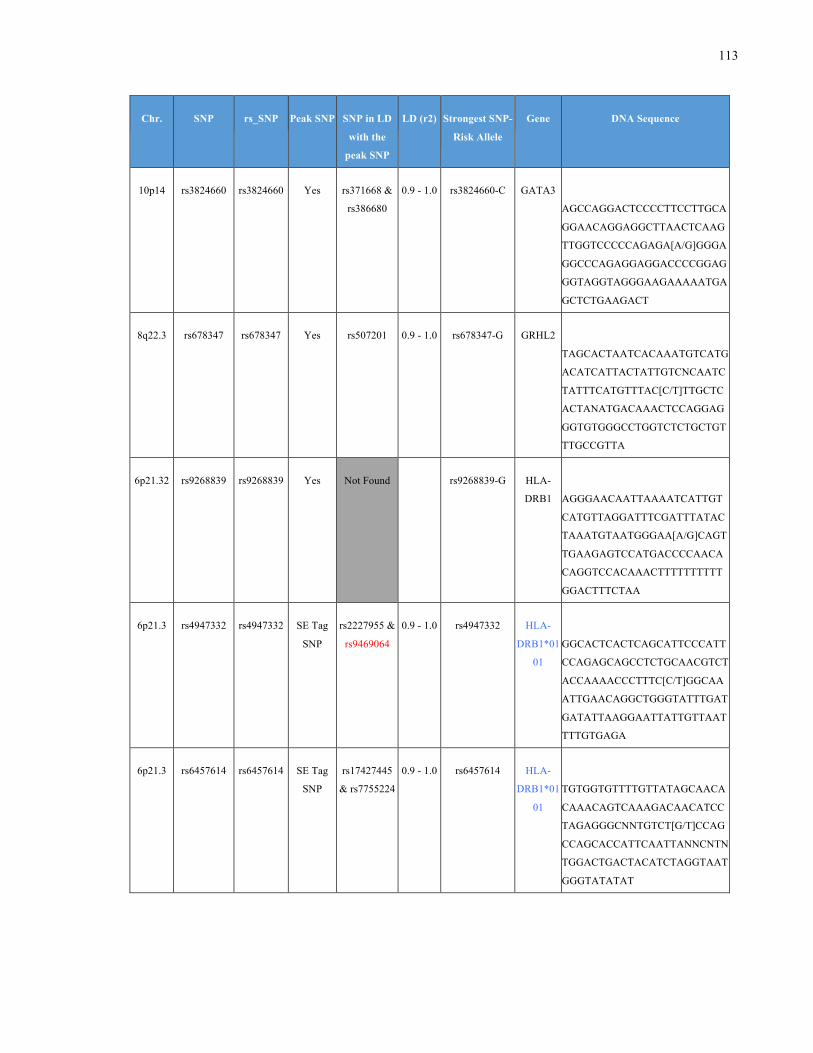
113
Chr. SNP rs_SNP Peak SNP SNP in LD
with the
peak SNP
LD (r2) Strongest SNP-
Risk Allele
Gene DNA Sequence
10p14 rs3824660 rs3824660 Yes rs371668 &
rs386680
0.9 - 1.0 rs3824660-C GATA3
AGCCAGGACTCCCCTTCCTTGCA
GGAACAGGAGGCTTAACTCAAG
TTGGTCCCCCAGAGA[A/G]GGGA
GGCCCAGAGGAGGACCCCGGAG
GGTAGGTAGGGAAGAAAAATGA
GCTCTGAAGACT
8q22.3 rs678347 rs678347 Yes rs507201 0.9 - 1.0 rs678347-G GRHL2
TAGCACTAATCACAAATGTCATG
ACATCATTACTATTGTCNCAATC
TATTTCATGTTTAC[C/T]TTGCTC
ACTANATGACAAACTCCAGGAG
GGTGTGGGCCTGGTCTCTGCTGT
TTGCCGTTA
6p21.32 rs9268839 rs9268839 Yes Not Found rs9268839-G HLA-
DRB1
AGGGAACAATTAAAATCATTGT
CATGTTAGGATTTCGATTTATAC
TAAATGTAATGGGAA[A/G]CAGT
TGAAGAGTCCATGACCCCAACA
CAGGTCCACAAACTTTTTTTTTT
GGACTTTCTAA
6p21.3 rs4947332 rs4947332 SE Tag
SNP
rs2227955 &
rs9469064
0.9 - 1.0 rs4947332 HLA-
DRB1*01
01
GGCACTCACTCAGCATTCCCATT
CCAGAGCAGCCTCTGCAACGTCT
ACCAAAACCCTTTC[C/T]GGCAA
ATTGAACAGGCTGGGTATTTGAT
GATATTAAGGAATTATTGTTAAT
TTTGTGAGA
6p21.3 rs6457614 rs6457614 SE Tag
SNP
rs17427445
& rs7755224
0.9 - 1.0 rs6457614 HLA-
DRB1*01
01
TGTGGTGTTTTGTTATAGCAACA
CAAACAGTCAAAGACAACATCC
TAGAGGGCNNTGTCT[G/T]CCAG
CCAGCACCATTCAATTANNCNTN
TGGACTGACTACATCTAGGTAAT
GGGTATATAT
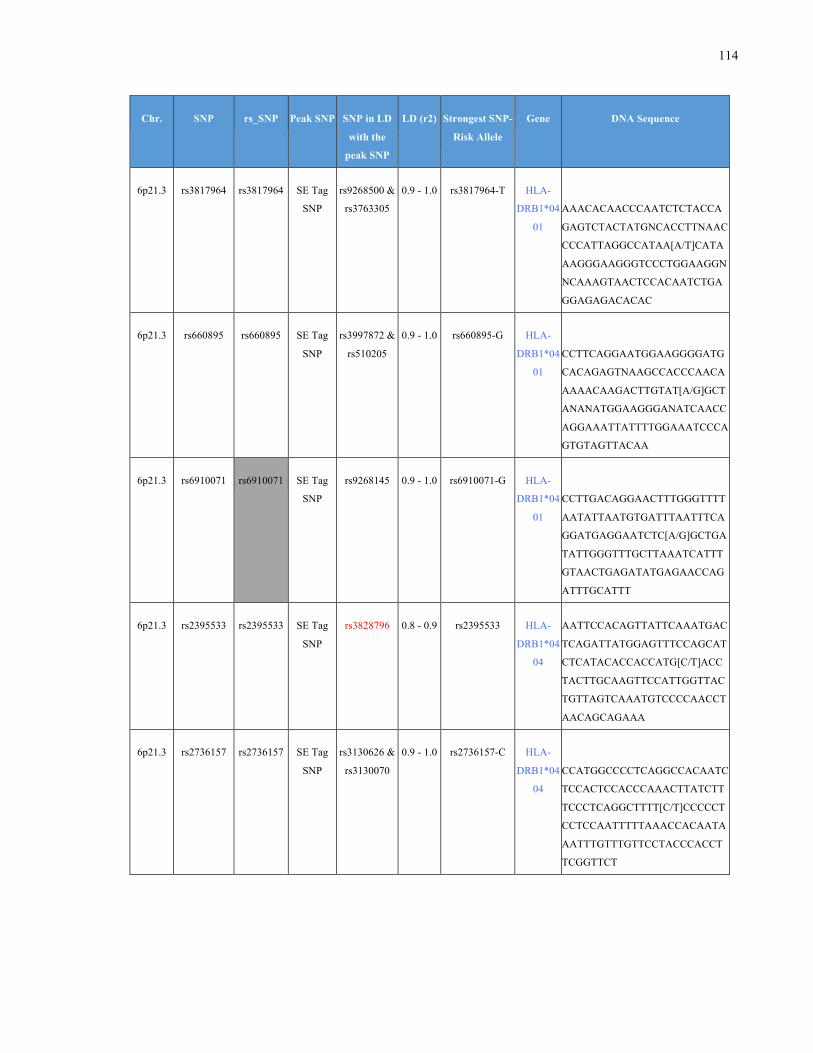
114
Chr. SNP rs_SNP Peak SNP SNP in LD
with the
peak SNP
LD (r2) Strongest SNP-
Risk Allele
Gene DNA Sequence
6p21.3 rs3817964 rs3817964 SE Tag
SNP
rs9268500 &
rs3763305
0.9 - 1.0 rs3817964-T HLA-
DRB1*04
01
AAACACAACCCAATCTCTACCA
GAGTCTACTATGNCACCTTNAAC
CCCATTAGGCCATAA[A/T]CATA
AAGGGAAGGGTCCCTGGAAGGN
NCAAAGTAACTCCACAATCTGA
GGAGAGACACAC
6p21.3 rs660895 rs660895 SE Tag
SNP
rs3997872 &
rs510205
0.9 - 1.0 rs660895-G HLA-
DRB1*04
01
CCTTCAGGAATGGAAGGGGATG
CACAGAGTNAAGCCACCCAACA
AAAACAAGACTTGTAT[A/G]GCT
ANANATGGAAGGGANATCAACC
AGGAAATTATTTTGGAAATCCCA
GTGTAGTTACAA
6p21.3 rs6910071
rs6910071 SE Tag
SNP
rs9268145 0.9 - 1.0 rs6910071-G HLA-
DRB1*04
01
CCTTGACAGGAACTTTGGGTTTT
AATATTAATGTGATTTAATTTCA
GGATGAGGAATCTC[A/G]GCTGA
TATTGGGTTTGCTTAAATCATTT
GTAACTGAGATATGAGAACCAG
ATTTGCATTT
6p21.3 rs2395533 rs2395533 SE Tag
SNP
rs3828796 0.8 - 0.9 rs2395533 HLA-
DRB1*04
04
AATTCCACAGTTATTCAAATGAC
TCAGATTATGGAGTTTCCAGCAT
CTCATACACCACCATG[C/T]ACC
TACTTGCAAGTTCCATTGGTTAC
TGTTAGTCAAATGTCCCCAACCT
AACAGCAGAAA
6p21.3 rs2736157 rs2736157 SE Tag
SNP
rs3130626 &
rs3130070
0.9 - 1.0 rs2736157-C HLA-
DRB1*04
04
CCATGGCCCCTCAGGCCACAATC
TCCACTCCACCCAAACTTATCTT
TCCCTCAGGCTTTT[C/T]CCCCCT
CCTCCAATTTTTAAACCACAATA
AATTTGTTTGTTCCTACCCACCT
TCGGTTCT
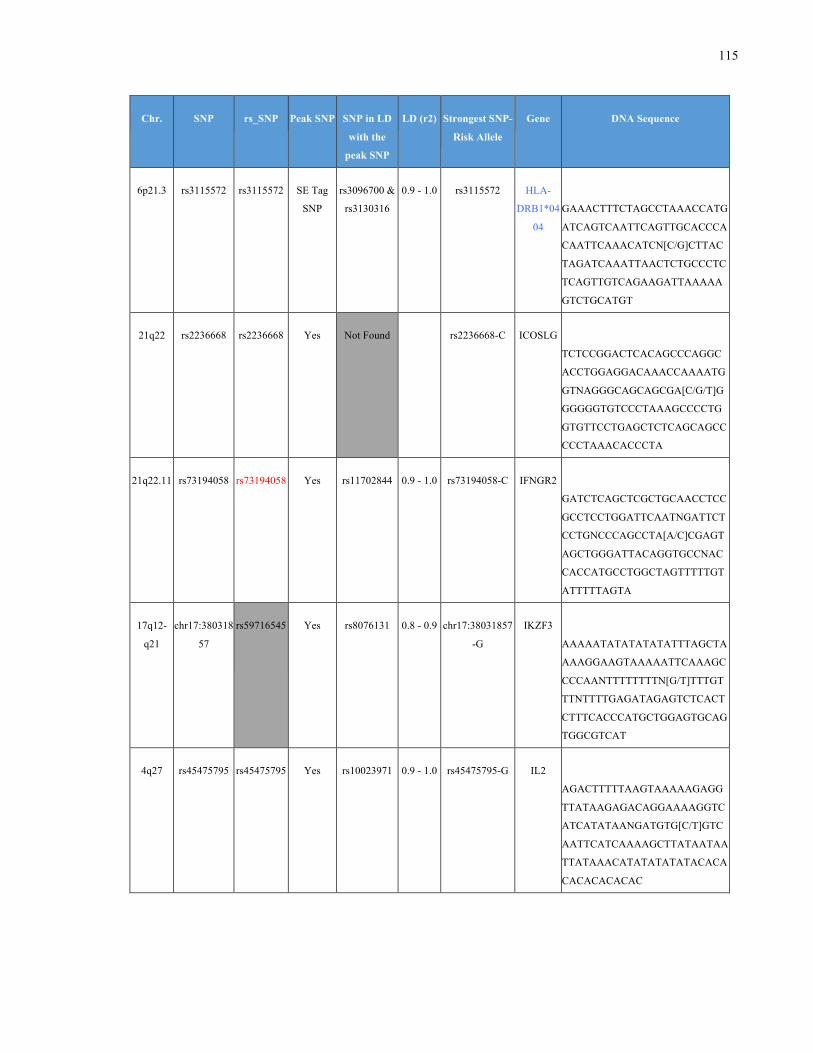
115
Chr. SNP rs_SNP Peak SNP SNP in LD
with the
peak SNP
LD (r2) Strongest SNP-
Risk Allele
Gene DNA Sequence
6p21.3 rs3115572 rs3115572 SE Tag
SNP
rs3096700 &
rs3130316
0.9 - 1.0 rs3115572 HLA-
DRB1*04
04
GAAACTTTCTAGCCTAAACCATG
ATCAGTCAATTCAGTTGCACCCA
CAATTCAAACATCN[C/G]CTTAC
TAGATCAAATTAACTCTGCCCTC
TCAGTTGTCAGAAGATTAAAAA
GTCTGCATGT
21q22 rs2236668 rs2236668 Yes Not Found
rs2236668-C ICOSLG
TCTCCGGACTCACAGCCCAGGC
ACCTGGAGGACAAACCAAAATG
GTNAGGGCAGCAGCGA[C/G/T]G
GGGGGTGTCCCTAAAGCCCCTG
GTGTTCCTGAGCTCTCAGCAGCC
CCCTAAACACCCTA
21q22.11 rs73194058 rs73194058 Yes rs11702844 0.9 - 1.0 rs73194058-C IFNGR2
GATCTCAGCTCGCTGCAACCTCC
GCCTCCTGGATTCAATNGATTCT
CCTGNCCCAGCCTA[A/C]CGAGT
AGCTGGGATTACAGGTGCCNAC
CACCATGCCTGGCTAGTTTTTGT
ATTTTTAGTA
17q12-
q21
chr17:380318
57
rs59716545
Yes rs8076131 0.8 - 0.9 chr17:38031857
-G
IKZF3
AAAAATATATATATATTTAGCTA
AAAGGAAGTAAAAATTCAAAGC
CCCAANTTTTTTTTN[G/T]TTTGT
TTNTTTTGAGATAGAGTCTCACT
CTTTCACCCATGCTGGAGTGCAG
TGGCGTCAT
4q27 rs45475795 rs45475795 Yes rs10023971 0.9 - 1.0 rs45475795-G IL2
AGACTTTTTAAGTAAAAAGAGG
TTATAAGAGACAGGAAAAGGTC
ATCATATAANGATGTG[C/T]GTC
AATTCATCAAAAGCTTATAATAA
TTATAAACATATATATATACACA
CACACACACAC
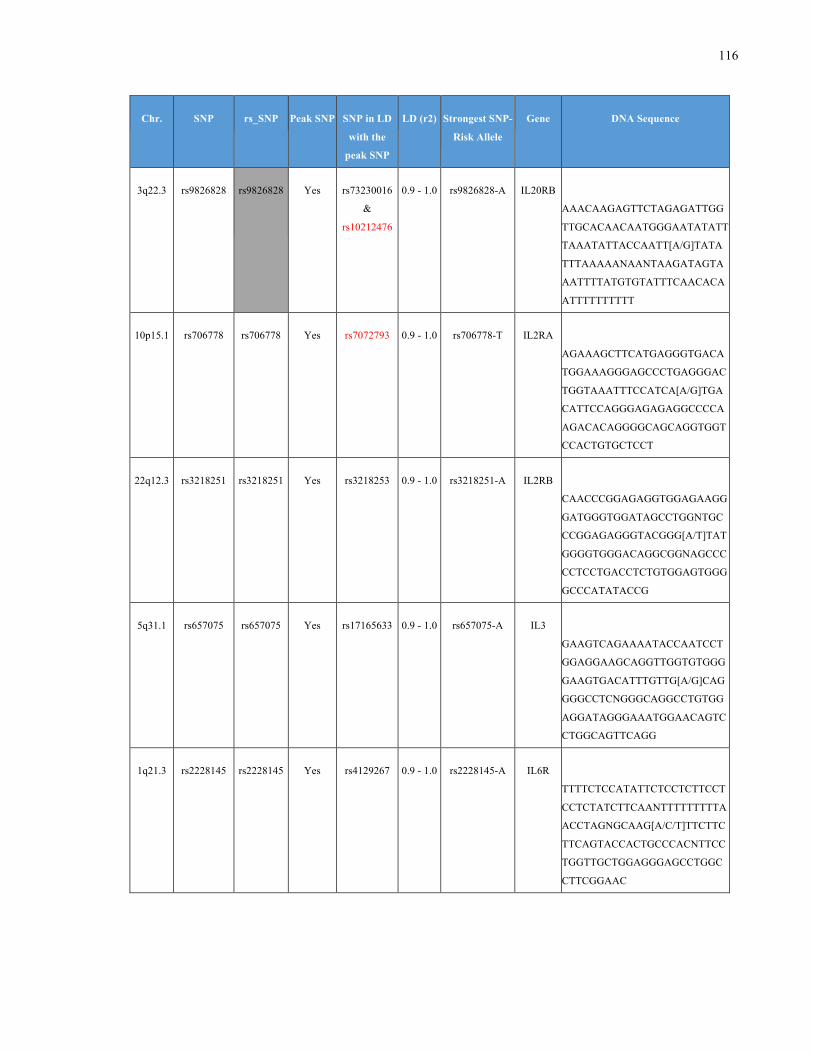
116
Chr. SNP rs_SNP Peak SNP SNP in LD
with the
peak SNP
LD (r2) Strongest SNP-
Risk Allele
Gene DNA Sequence
3q22.3 rs9826828 rs9826828
Yes rs73230016
&
rs10212476
0.9 - 1.0 rs9826828-A IL20RB
AAACAAGAGTTCTAGAGATTGG
TTGCACAACAATGGGAATATATT
TAAATATTACCAATT[A/G]TATA
TTTAAAAANAANTAAGATAGTA
AATTTTATGTGTATTTCAACACA
ATTTTTTTTTT
10p15.1 rs706778 rs706778 Yes rs7072793 0.9 - 1.0 rs706778-T IL2RA
AGAAAGCTTCATGAGGGTGACA
TGGAAAGGGAGCCCTGAGGGAC
TGGTAAATTTCCATCA[A/G]TGA
CATTCCAGGGAGAGAGGCCCCA
AGACACAGGGGCAGCAGGTGGT
CCACTGTGCTCCT
22q12.3 rs3218251 rs3218251 Yes rs3218253 0.9 - 1.0 rs3218251-A IL2RB
CAACCCGGAGAGGTGGAGAAGG
GATGGGTGGATAGCCTGGNTGC
CCGGAGAGGGTACGGG[A/T]TAT
GGGGTGGGACAGGCGGNAGCCC
CCTCCTGACCTCTGTGGAGTGGG
GCCCATATACCG
5q31.1 rs657075 rs657075 Yes rs17165633 0.9 - 1.0 rs657075-A IL3
GAAGTCAGAAAATACCAATCCT
GGAGGAAGCAGGTTGGTGTGGG
GAAGTGACATTTGTTG[A/G]CAG
GGGCCTCNGGGCAGGCCTGTGG
AGGATAGGGAAATGGAACAGTC
CTGGCAGTTCAGG
1q21.3 rs2228145 rs2228145 Yes rs4129267 0.9 - 1.0 rs2228145-A IL6R
TTTTCTCCATATTCTCCTCTTCCT
CCTCTATCTTCAANTTTTTTTTTA
ACCTAGNGCAAG[A/C/T]TTCTTC
TTCAGTACCACTGCCCACNTTCC
TGGTTGCTGGAGGGAGCCTGGC
CTTCGGAAC
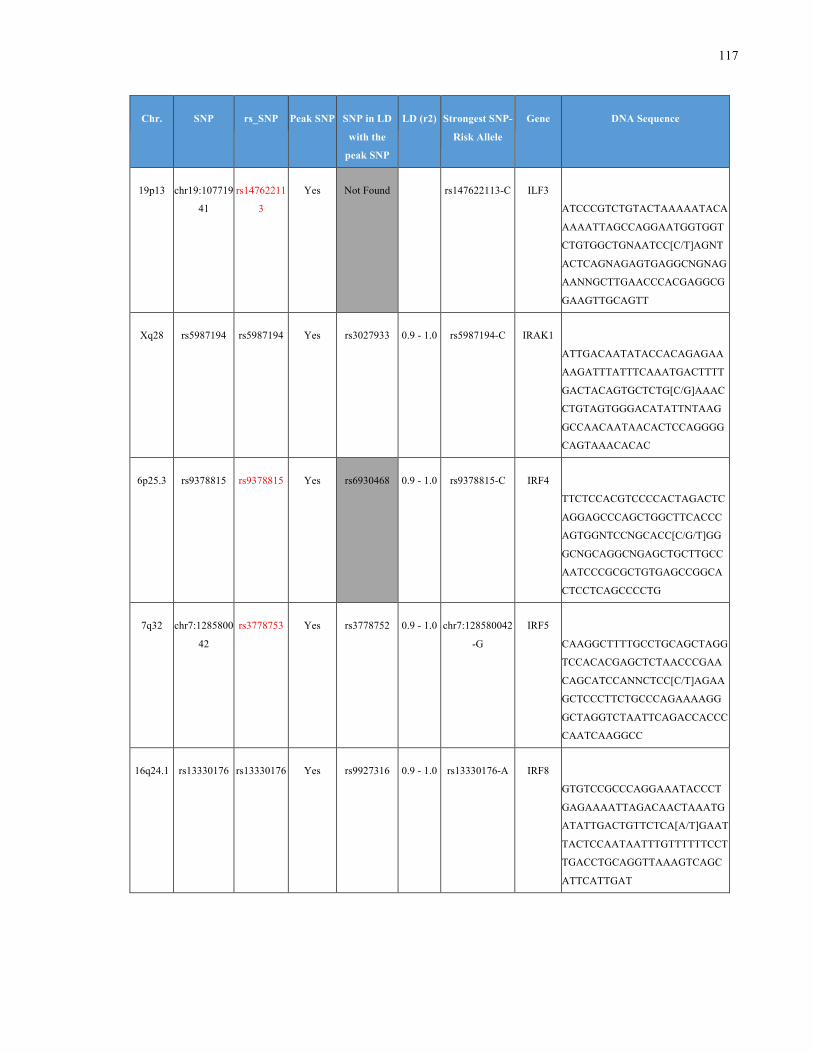
117
Chr. SNP rs_SNP Peak SNP SNP in LD
with the
peak SNP
LD (r2) Strongest SNP-
Risk Allele
Gene DNA Sequence
19p13 chr19:107719
41
rs14762211
3
Yes Not Found
rs147622113-C ILF3
ATCCCGTCTGTACTAAAAATACA
AAAATTAGCCAGGAATGGTGGT
CTGTGGCTGNAATCC[C/T]AGNT
ACTCAGNAGAGTGAGGCNGNAG
AANNGCTTGAACCCACGAGGCG
GAAGTTGCAGTT
Xq28 rs5987194 rs5987194 Yes rs3027933 0.9 - 1.0 rs5987194-C IRAK1
ATTGACAATATACCACAGAGAA
AAGATTTATTTCAAATGACTTTT
GACTACAGTGCTCTG[C/G]AAAC
CTGTAGTGGGACATATTNTAAG
GCCAACAATAACACTCCAGGGG
CAGTAAACACAC
6p25.3 rs9378815 rs9378815 Yes rs6930468 0.9 - 1.0 rs9378815-C IRF4
TTCTCCACGTCCCCACTAGACTC
AGGAGCCCAGCTGGCTTCACCC
AGTGGNTCCNGCACC[C/G/T]GG
GCNGCAGGCNGAGCTGCTTGCC
AATCCCGCGCTGTGAGCCGGCA
CTCCTCAGCCCCTG
7q32 chr7:1285800
42
rs3778753 Yes rs3778752 0.9 - 1.0 chr7:128580042
-G
IRF5
CAAGGCTTTTGCCTGCAGCTAGG
TCCACACGAGCTCTAACCCGAA
CAGCATCCANNCTCC[C/T]AGAA
GCTCCCTTCTGCCCAGAAAAGG
GCTAGGTCTAATTCAGACCACCC
CAATCAAGGCC
16q24.1 rs13330176 rs13330176 Yes rs9927316 0.9 - 1.0 rs13330176-A IRF8
GTGTCCGCCCAGGAAATACCCT
GAGAAAATTAGACAACTAAATG
ATATTGACTGTTCTCA[A/T]GAAT
TACTCCAATAATTTGTTTTTTCCT
TGACCTGCAGGTTAAAGTCAGC
ATTCATTGAT

118
Chr. SNP rs_SNP Peak SNP SNP in LD
with the
peak SNP
LD (r2) Strongest SNP-
Risk Allele
Gene DNA Sequence
7p15.1 rs67250450 rs67250450 Yes rs10951192 0.9 - 1.0 rs67250450-T JAZF1
TACCACAAACATTAACTAAAAG
GCAGATATGNGACAGAGCTTTC
ACCACGTAGCACTAAA[C/T]ATA
TTGTTTAATATGTAAGGGTTGCT
ACATGTTACTAGTTTTACAATTG
TTCTTATGTCA
2p23.1 rs10175798 rs10175798 Yes rs10173253 0.9 - 1.0 rs10175798-A LBH
ACTTCAACCCACACACATTCTTG
CCTTTTAGATTTCTTATGTACNC
AAATGAGTTTCACC[A/G]AAAAA
TTGGCTAGAAACTTCCCTTCTCC
TACTCACTGTCTTTTTTTAACCCC
AAGCCTTT
6q23 rs17264332 rs17264332 Yes rs6920220 0.9 - 1.0 rs17264332-G LOC1001
30476
ATAATCTCATATTCCTCCTACTG
TTATTTTATTAAGTACCTNATTTT
ATTTTTATTTTCT[A/G]CATGGTT
CAGCCTAGTTGTTTCTATTAAAG
CCAAGATAACTTCAATTGCTCAA
CAACAAG
1q25.1 rs2105325 rs2105325 Yes rs1557121 0.9 - 1.0 rs2105325-C LOC1005
06023
AAAATCATCATCTCCTCCCTGCT
TAACAAACAGTCCAGGTTTTGTA
ATGGCAAACATACT[A/C]CCTGC
ATGACCATTCACCCCTGGGACAC
CCTGCAGCAGCGTCCCCACCACT
AGTGAATGC
21q22.12 rs8133843 rs8133843 Yes rs9979383 0.8 - 0.9 rs8133843-A LOC1005
06403
ACCACTCTTAACACAGTTAAATG
GACATCTTTACAATATATAACTA
TAATTATCCAAAAG[A/G]ATATT
AATATCTATAGTATTTACTGTAT
ANAAAAACAGTTTTCATTATTAT
TAACAATTC
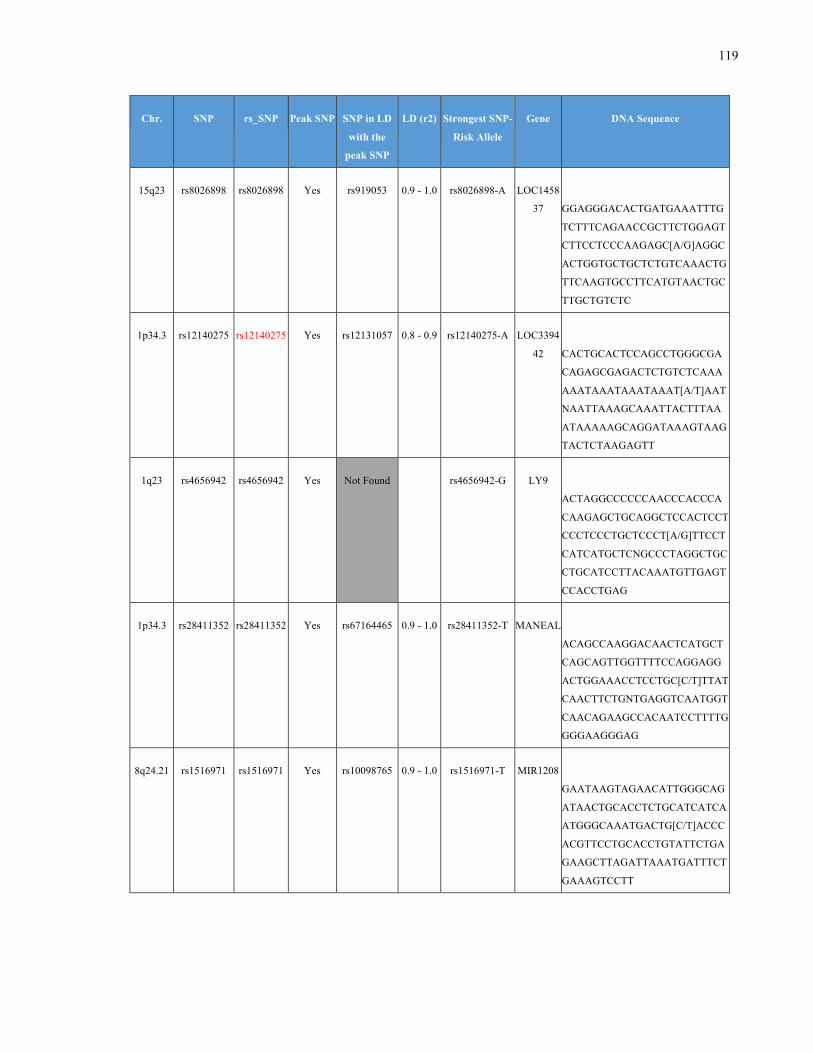
119
Chr. SNP rs_SNP Peak SNP SNP in LD
with the
peak SNP
LD (r2) Strongest SNP-
Risk Allele
Gene DNA Sequence
15q23 rs8026898 rs8026898 Yes rs919053 0.9 - 1.0 rs8026898-A LOC1458
37
GGAGGGACACTGATGAAATTTG
TCTTTCAGAACCGCTTCTGGAGT
CTTCCTCCCAAGAGC[A/G]AGGC
ACTGGTGCTGCTCTGTCAAACTG
TTCAAGTGCCTTCATGTAACTGC
TTGCTGTCTC
1p34.3 rs12140275 rs12140275 Yes rs12131057 0.8 - 0.9 rs12140275-A LOC3394
42
CACTGCACTCCAGCCTGGGCGA
CAGAGCGAGACTCTGTCTCAAA
AAATAAATAAATAAAT[A/T]AAT
NAATTAAAGCAAATTACTTTAA
ATAAAAAGCAGGATAAAGTAAG
TACTCTAAGAGTT
1q23 rs4656942 rs4656942 Yes Not Found
rs4656942-G LY9
ACTAGGCCCCCCAACCCACCCA
CAAGAGCTGCAGGCTCCACTCCT
CCCTCCCTGCTCCCT[A/G]TTCCT
CATCATGCTCNGCCCTAGGCTGC
CTGCATCCTTACAAATGTTGAGT
CCACCTGAG
1p34.3 rs28411352 rs28411352 Yes rs67164465 0.9 - 1.0 rs28411352-T MANEAL
ACAGCCAAGGACAACTCATGCT
CAGCAGTTGGTTTTCCAGGAGG
ACTGGAAACCTCCTGC[C/T]TTAT
CAACTTCTGNTGAGGTCAATGGT
CAACAGAAGCCACAATCCTTTTG
GGGAAGGGAG
8q24.21 rs1516971 rs1516971 Yes rs10098765 0.9 - 1.0 rs1516971-T MIR1208
GAATAAGTAGAACATTGGGCAG
ATAACTGCACCTCTGCATCATCA
ATGGGCAAATGACTG[C/T]ACCC
ACGTTCCTGCACCTGTATTCTGA
GAAGCTTAGATTAAATGATTTCT
GAAAGTCCTT
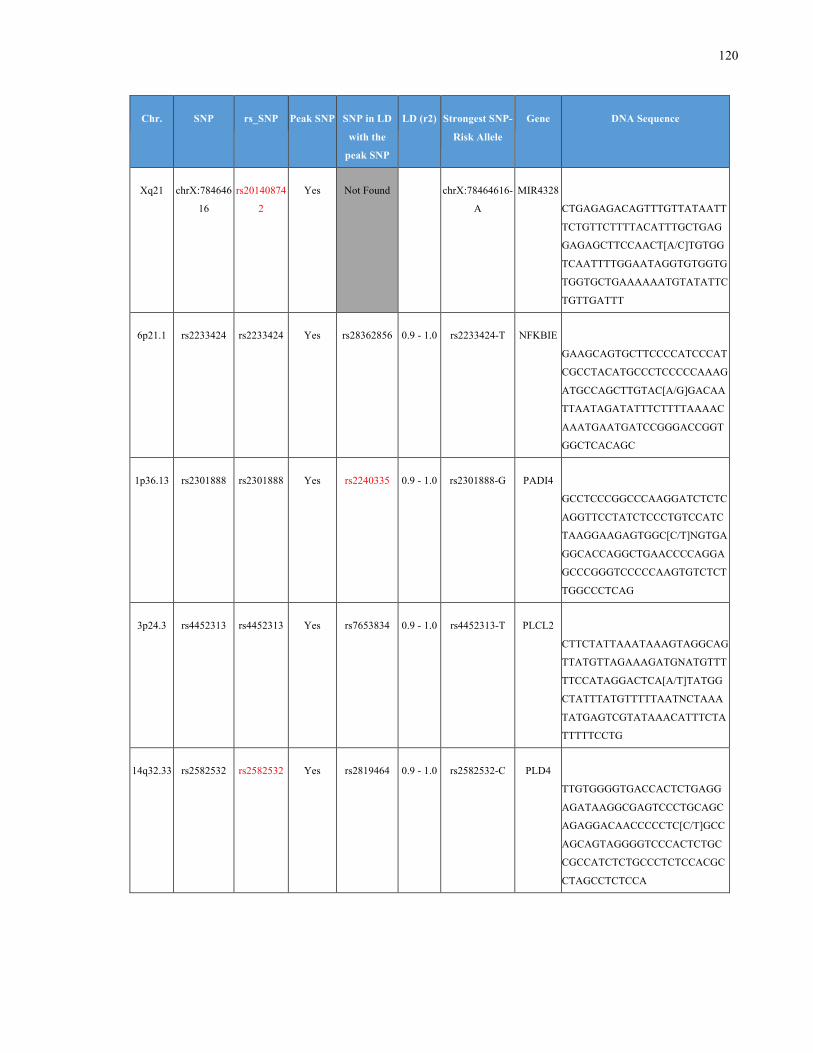
120
Chr. SNP rs_SNP Peak SNP SNP in LD
with the
peak SNP
LD (r2) Strongest SNP-
Risk Allele
Gene DNA Sequence
Xq21 chrX:784646
16
rs20140874
2
Yes Not Found
chrX:78464616-
A
MIR4328
CTGAGAGACAGTTTGTTATAATT
TCTGTTCTTTTACATTTGCTGAG
GAGAGCTTCCAACT[A/C]TGTGG
TCAATTTTGGAATAGGTGTGGTG
TGGTGCTGAAAAAATGTATATTC
TGTTGATTT
6p21.1 rs2233424 rs2233424 Yes rs28362856 0.9 - 1.0 rs2233424-T NFKBIE
GAAGCAGTGCTTCCCCATCCCAT
CGCCTACATGCCCTCCCCCAAAG
ATGCCAGCTTGTAC[A/G]GACAA
TTAATAGATATTTCTTTTAAAAC
AAATGAATGATCCGGGACCGGT
GGCTCACAGC
1p36.13 rs2301888 rs2301888 Yes rs2240335 0.9 - 1.0 rs2301888-G PADI4
GCCTCCCGGCCCAAGGATCTCTC
AGGTTCCTATCTCCCTGTCCATC
TAAGGAAGAGTGGC[C/T]NGTGA
GGCACCAGGCTGAACCCCAGGA
GCCCGGGTCCCCCAAGTGTCTCT
TGGCCCTCAG
3p24.3 rs4452313 rs4452313 Yes rs7653834 0.9 - 1.0 rs4452313-T PLCL2
CTTCTATTAAATAAAGTAGGCAG
TTATGTTAGAAAGATGNATGTTT
TTCCATAGGACTCA[A/T]TATGG
CTATTTATGTTTTTAATNCTAAA
TATGAGTCGTATAAACATTTCTA
TTTTTCCTG
14q32.33 rs2582532 rs2582532 Yes rs2819464 0.9 - 1.0 rs2582532-C PLD4
TTGTGGGGTGACCACTCTGAGG
AGATAAGGCGAGTCCCTGCAGC
AGAGGACAACCCCCTC[C/T]GCC
AGCAGTAGGGGTCCCACTCTGC
CGCCATCTCTGCCCTCTCCACGC
CTAGCCTCTCCA
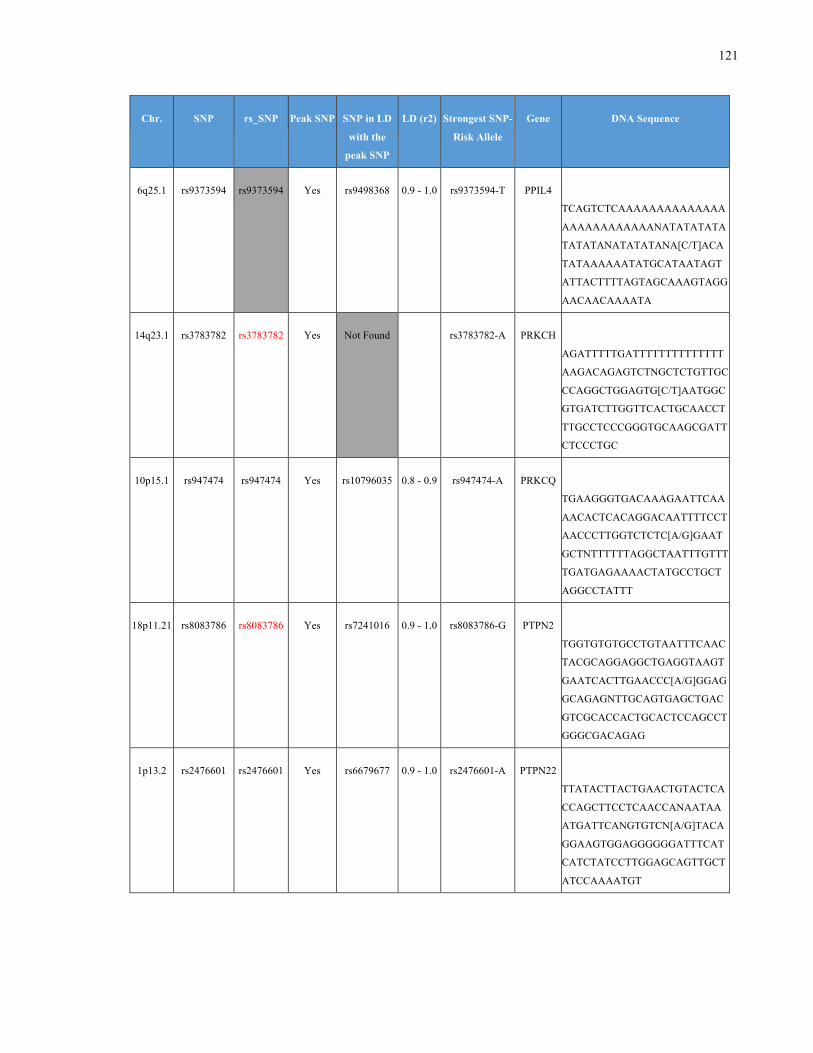
121
Chr. SNP rs_SNP Peak SNP SNP in LD
with the
peak SNP
LD (r2) Strongest SNP-
Risk Allele
Gene DNA Sequence
6q25.1 rs9373594 rs9373594 Yes rs9498368 0.9 - 1.0 rs9373594-T PPIL4
TCAGTCTCAAAAAAAAAAAAAA
AAAAAAAAAAAANATATATATA
TATATANATATATANA[C/T]ACA
TATAAAAAATATGCATAATAGT
ATTACTTTTAGTAGCAAAGTAGG
AACAACAAAATA
14q23.1 rs3783782 rs3783782 Yes Not Found rs3783782-A PRKCH
AGATTTTTGATTTTTTTTTTTTTT
AAGACAGAGTCTNGCTCTGTTGC
CCAGGCTGGAGTG[C/T]AATGGC
GTGATCTTGGTTCACTGCAACCT
TTGCCTCCCGGGTGCAAGCGATT
CTCCCTGC
10p15.1 rs947474 rs947474 Yes rs10796035 0.8 - 0.9 rs947474-A PRKCQ
TGAAGGGTGACAAAGAATTCAA
AACACTCACAGGACAATTTTCCT
AACCCTTGGTCTCTC[A/G]GAAT
GCTNTTTTTTAGGCTAATTTGTTT
TGATGAGAAAACTATGCCTGCT
AGGCCTATTT
18p11.21 rs8083786 rs8083786 Yes rs7241016 0.9 - 1.0 rs8083786-G PTPN2
TGGTGTGTGCCTGTAATTTCAAC
TACGCAGGAGGCTGAGGTAAGT
GAATCACTTGAACCC[A/G]GGAG
GCAGAGNTTGCAGTGAGCTGAC
GTCGCACCACTGCACTCCAGCCT
GGGCGACAGAG
1p13.2 rs2476601 rs2476601 Yes rs6679677 0.9 - 1.0 rs2476601-A PTPN22
TTATACTTACTGAACTGTACTCA
CCAGCTTCCTCAACCANAATAA
ATGATTCANGTGTCN[A/G]TACA
GGAAGTGGAGGGGGGATTTCAT
CATCTATCCTTGGAGCAGTTGCT
ATCCAAAATGT

122
Chr. SNP rs_SNP Peak SNP SNP in LD
with the
peak SNP
LD (r2) Strongest SNP-
Risk Allele
Gene DNA Sequence
1q31 rs17668708 rs17668708 Yes rs4915314 0.9 - 1.0 rs17668708-C PTPRC
TATTATACTTCACCTCTCAGAGG
CATTTAACGCTATTGACAACTTC
CTTCTTTTCAAAAN[C/T]CTGTCC
TCCCCTAATTTTCATGAAACATG
AAACTACCTTCTAGTTCTCTTAT
TTATCTCA
14q24.1 rs1950897 rs1950897 Yes rs10131490 0.9 - 1.0 rs1950897-T RAD51B
CAGATTATGAAGGGTTGAAATC
ATTCACTTTATCTAGTGGTGTTN
TGAAAACCAGTCTAC[A/G]CAAA
GGGAGGAAATAAAAAAACAAGC
CACCTGATTTTCAGCATTTGCTG
ATTTCCATGGT
15q14 rs8032939 rs8032939 Yes rs8035957 0.9 - 1.0 rs8032939-C RASGRP
1
GCAGATATAATAAGCACCCTGT
CCCAAGCCTGAAGAAGCTACAG
GCAATACTACAGTACA[C/T]GGT
ACAGTCAGGGCCTAGAGGGAGG
TAAACACGGGCAGTTCAGAGGA
AGGGGAAAGTCAG
21q22 chr21:359282
40
rs14786809
1
Yes rs2834532 0.9 - 1.0 chr21:35928240
-C
RCAN1
TGAAACCCTGTCTCTACGAAAA
ATACAAAAAATTAGCCGGGCAT
GGTGGCGGGTGCCTGT[C/T]GTC
TCAGCTACTCGGGAGGCTGAGG
CAGGAGAATGGTGTGAACCCGG
GAGGCAGAGCTTG
2p16.1 rs34695944 rs34695944 Yes rs12466919 0.9 - 1.0 rs34695944-C REL
GAGATTCTTGGTTCCTTCTGGTG
GGGAATGGTAGTAAGTCTGNTT
GCCTTCTCAANATAT[C/T]CCCTT
AAATGTCTCAAAAGTACCTTAA
GTAGCGGGGCACAGTGGCCCAT
GCCTGTAGTTA

123
Chr. SNP rs_SNP Peak SNP SNP in LD
with the
peak SNP
LD (r2) Strongest SNP-
Risk Allele
Gene DNA Sequence
22q13.1 rs909685 rs909685 Yes rs2069235 0.9 - 1.0 rs909685-A RPL3
GTCTGCCCACCCCTGGGCCTCTG
GCCTGGAAGGGCGAAGCCACTG
GCTTTGTGAGGGGGC[A/T]TGTC
TGCTTGGGTCATTTCTGCCTCTN
ATGCCTTCATTTAGCAAAGCTTT
ATTGAATCTG
10q21.2 rs6479800 rs6479800 Yes rs67630314 0.9 - 1.0 rs6479800-C RTKN2
TCTACTAAAAATACAAAAAATT
AGCCAGGTGTGGTGGTGTGCAC
CTGTAATCCCAGTTAC[C/G]CAG
GAGGCTGAGGCAGGAGGATGGC
ATGAACCCGGGAGGCGGAGGTT
GCAGTGAGCTGAG
10q22.3 rs726288 rs726288 Yes rs10887226 0.9 - 1.0 rs726288-T SFTPD
CAGCACCTGCTCGAGGAATGGC
AAATTGCCAGGCAAATGTGCAC
CACACTCCCAGCCTGC[A/G]CTC
AGGAAGGACATTACTAAGNACT
CAGGACTCTGGCTGCATTTTCAG
ACCAGCACTATC
12q24.12 rs10774624 rs10774624 Yes rs7137828 0.8 - 0.9 rs10774624-G SH2B3
AGCTAACATTTTTGTTTGTTTAG
AGATGGGGGTCTCACTATGTTGC
CCAGCTTGGCCTCC[A/G]ACTCC
TGAGCTNAAGTGATCCTCCCACT
TCAGCCTCCCAAAGTGCAGGGA
TTACAGGCAT
2p14 rs1858037 rs1858037 Yes rs11126034 0.9 - 1.0 rs1858037-T SPRED2
AAAATGAGGGCCAACCCAGAAA
AATGAAGAACGTGCCTCAAAAT
NAGGTCCCAAGACATA[A/T]CCC
CGCATCCAATCATACTGAATATT
TTTTTTGGCAGGAAAACTTGTTT
ATTTGGGGGAA
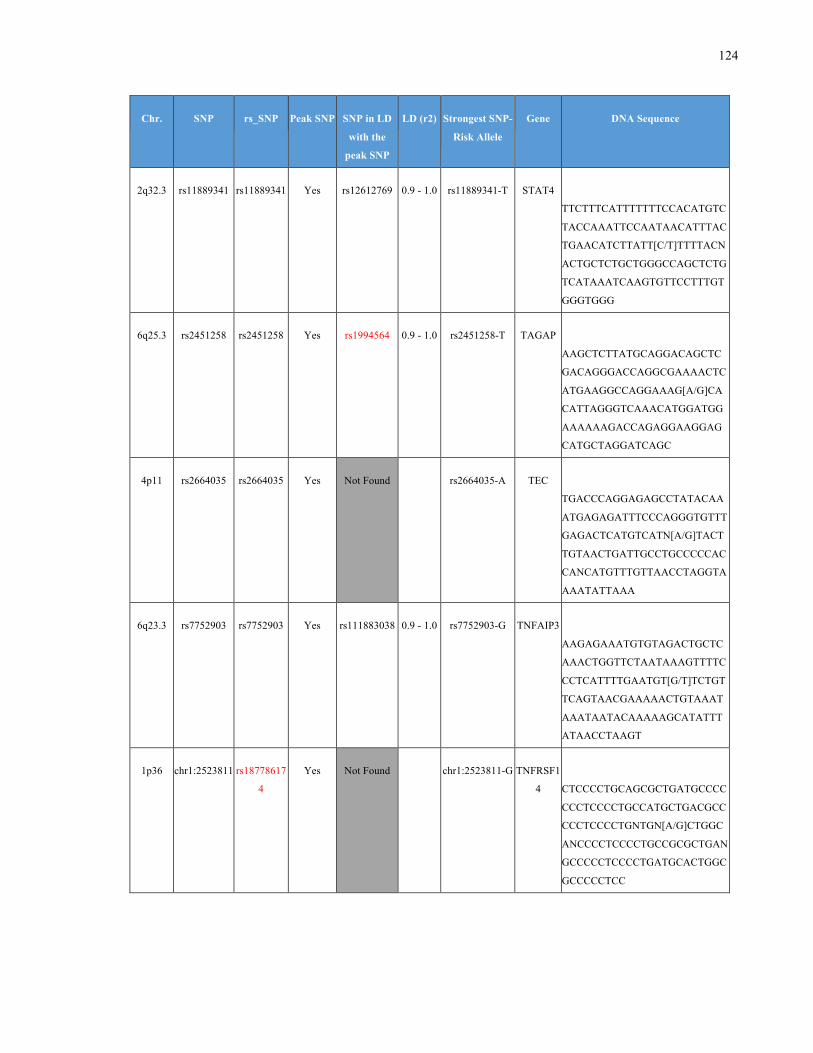
124
Chr. SNP rs_SNP Peak SNP SNP in LD
with the
peak SNP
LD (r2) Strongest SNP-
Risk Allele
Gene DNA Sequence
2q32.3 rs11889341 rs11889341 Yes rs12612769 0.9 - 1.0 rs11889341-T STAT4
TTCTTTCATTTTTTTCCACATGTC
TACCAAATTCCAATAACATTTAC
TGAACATCTTATT[C/T]TTTTACN
ACTGCTCTGCTGGGCCAGCTCTG
TCATAAATCAAGTGTTCCTTTGT
GGGTGGG
6q25.3 rs2451258 rs2451258 Yes rs1994564 0.9 - 1.0 rs2451258-T TAGAP
AAGCTCTTATGCAGGACAGCTC
GACAGGGACCAGGCGAAAACTC
ATGAAGGCCAGGAAAG[A/G]CA
CATTAGGGTCAAACATGGATGG
AAAAAAGACCAGAGGAAGGAG
CATGCTAGGATCAGC
4p11 rs2664035 rs2664035 Yes Not Found rs2664035-A TEC
TGACCCAGGAGAGCCTATACAA
ATGAGAGATTTCCCAGGGTGTTT
GAGACTCATGTCATN[A/G]TACT
TGTAACTGATTGCCTGCCCCCAC
CANCATGTTTGTTAACCTAGGTA
AAATATTAAA
6q23.3 rs7752903 rs7752903 Yes rs111883038 0.9 - 1.0 rs7752903-G TNFAIP3
AAGAGAAATGTGTAGACTGCTC
AAACTGGTTCTAATAAAGTTTTC
CCTCATTTTGAATGT[G/T]TCTGT
TCAGTAACGAAAAACTGTAAAT
AAATAATACAAAAAGCATATTT
ATAACCTAAGT
1p36 chr1:2523811 rs18778617
4
Yes Not Found chr1:2523811-G TNFRSF1
4
CTCCCCTGCAGCGCTGATGCCCC
CCCTCCCCTGCCATGCTGACGCC
CCCTCCCCTGNTGN[A/G]CTGGC
ANCCCCTCCCCTGCCGCGCTGAN
GCCCCCTCCCCTGATGCACTGGC
GCCCCCTCC
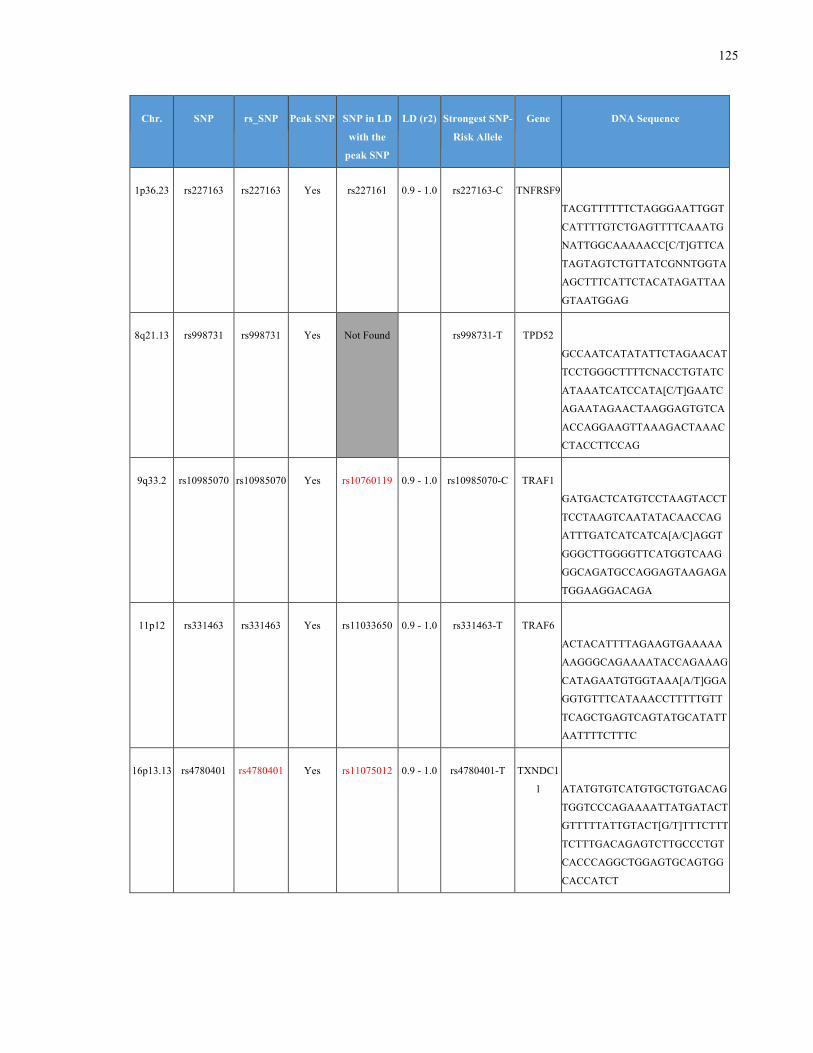
125
Chr. SNP rs_SNP Peak SNP SNP in LD
with the
peak SNP
LD (r2) Strongest SNP-
Risk Allele
Gene DNA Sequence
1p36.23 rs227163 rs227163 Yes rs227161 0.9 - 1.0 rs227163-C TNFRSF9
TACGTTTTTTCTAGGGAATTGGT
CATTTTGTCTGAGTTTTCAAATG
NATTGGCAAAAACC[C/T]GTTCA
TAGTAGTCTGTTATCGNNTGGTA
AGCTTTCATTCTACATAGATTAA
GTAATGGAG
8q21.13 rs998731 rs998731 Yes Not Found rs998731-T TPD52
GCCAATCATATATTCTAGAACAT
TCCTGGGCTTTTCNACCTGTATC
ATAAATCATCCATA[C/T]GAATC
AGAATAGAACTAAGGAGTGTCA
ACCAGGAAGTTAAAGACTAAAC
CTACCTTCCAG
9q33.2 rs10985070 rs10985070 Yes rs10760119 0.9 - 1.0 rs10985070-C TRAF1
GATGACTCATGTCCTAAGTACCT
TCCTAAGTCAATATACAACCAG
ATTTGATCATCATCA[A/C]AGGT
GGGCTTGGGGTTCATGGTCAAG
GGCAGATGCCAGGAGTAAGAGA
TGGAAGGACAGA
11p12 rs331463 rs331463 Yes rs11033650 0.9 - 1.0 rs331463-T TRAF6
ACTACATTTTAGAAGTGAAAAA
AAGGGCAGAAAATACCAGAAAG
CATAGAATGTGGTAAA[A/T]GGA
GGTGTTTCATAAACCTTTTTGTT
TCAGCTGAGTCAGTATGCATATT
AATTTTCTTTC
16p13.13 rs4780401 rs4780401 Yes rs11075012 0.9 - 1.0 rs4780401-T TXNDC1
1
ATATGTGTCATGTGCTGTGACAG
TGGTCCCAGAAAATTATGATACT
GTTTTTATTGTACT[G/T]TTTCTTT
TCTTTGACAGAGTCTTGCCCTGT
CACCCAGGCTGGAGTGCAGTGG
CACCATCT
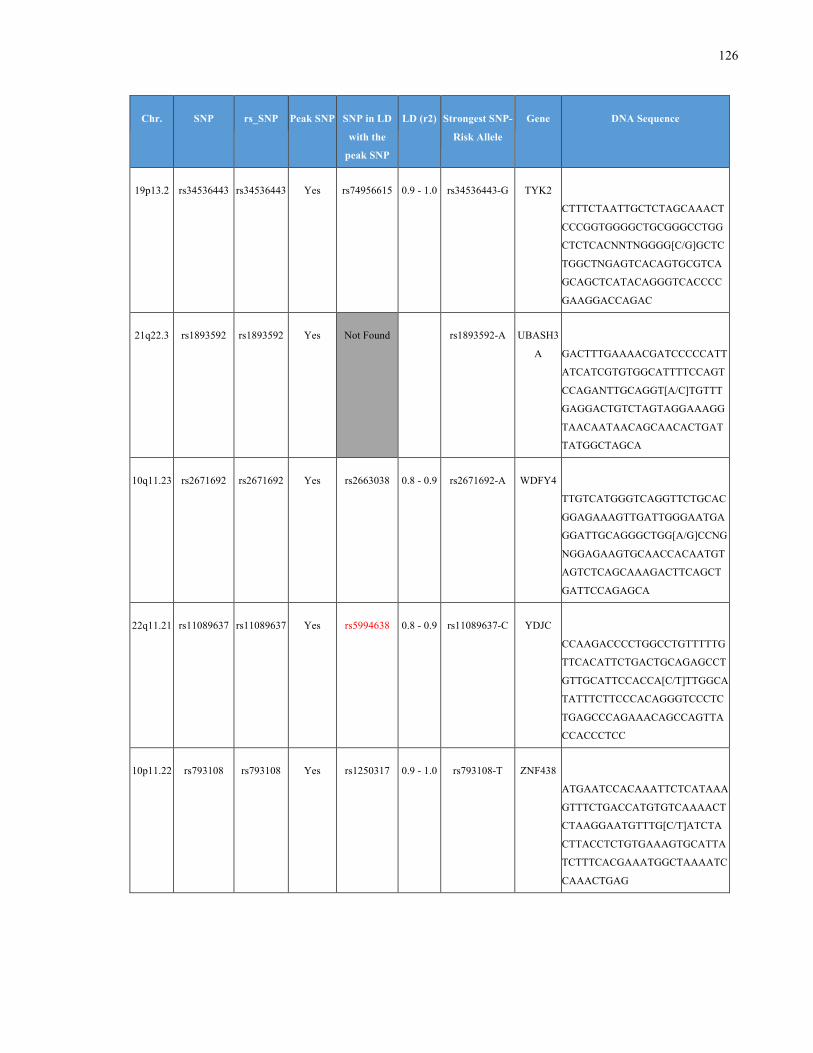
126
Chr. SNP rs_SNP Peak SNP SNP in LD
with the
peak SNP
LD (r2) Strongest SNP-
Risk Allele
Gene DNA Sequence
19p13.2 rs34536443 rs34536443 Yes rs74956615 0.9 - 1.0 rs34536443-G TYK2
CTTTCTAATTGCTCTAGCAAACT
CCCGGTGGGGCTGCGGGCCTGG
CTCTCACNNTNGGGG[C/G]GCTC
TGGCTNGAGTCACAGTGCGTCA
GCAGCTCATACAGGGTCACCCC
GAAGGACCAGAC
21q22.3 rs1893592 rs1893592 Yes Not Found
rs1893592-A UBASH3
A
GACTTTGAAAACGATCCCCCATT
ATCATCGTGTGGCATTTTCCAGT
CCAGANTTGCAGGT[A/C]TGTTT
GAGGACTGTCTAGTAGGAAAGG
TAACAATAACAGCAACACTGAT
TATGGCTAGCA
10q11.23 rs2671692 rs2671692 Yes rs2663038 0.8 - 0.9 rs2671692-A WDFY4
TTGTCATGGGTCAGGTTCTGCAC
GGAGAAAGTTGATTGGGAATGA
GGATTGCAGGGCTGG[A/G]CCNG
NGGAGAAGTGCAACCACAATGT
AGTCTCAGCAAAGACTTCAGCT
GATTCCAGAGCA
22q11.21 rs11089637 rs11089637 Yes rs5994638 0.8 - 0.9 rs11089637-C YDJC
CCAAGACCCCTGGCCTGTTTTTG
TTCACATTCTGACTGCAGAGCCT
GTTGCATTCCACCA[C/T]TTGGCA
TATTTCTTCCCACAGGGTCCCTC
TGAGCCCAGAAACAGCCAGTTA
CCACCCTCC
10p11.22 rs793108 rs793108 Yes rs1250317 0.9 - 1.0 rs793108-T ZNF438
ATGAATCCACAAATTCTCATAAA
GTTTCTGACCATGTGTCAAAACT
CTAAGGAATGTTTG[C/T]ATCTA
CTTACCTCTGTGAAAGTGCATTA
TCTTTCACGAAATGGCTAAAATC
CAAACTGAG

127
Chr. SNP rs_SNP Peak SNP SNP in LD
with the
peak SNP
LD (r2) Strongest SNP-
Risk Allele
Gene DNA Sequence
17p13.2 rs72634030 rs72634030 Yes rs60963557 0.8 - 0.9 rs72634030-A ZNF594
AGTGTTATGAGCAAGTGCCGGC
TAGAGCCTTTGCAGATAGTCCCC
AGGCTTGGGCTCCCT[A/C]CTCA
CTAGTCTGGCTGCATTTGCTTTG
TTTTTCCTTTCTCAAAGTTGGAG
CCTACATCTG
4q27 LD-
rs10023971
rs10023971 YES
ATAAATATAGTCTTACATATTTT
AGATTAATTGTAGCTANCTTTTG
AGCNTTTACTTTGT[A/G]TCAAAT
GTTGGGCCAAGCAATTTTCTGGC
TTCTATTATCTTCTATTATGTTTA
ATCCTTA
8q24.21 LD-
rs10098765
rs10098765 YES
ATATCTTTGAATACCTTGAAATT
CAAAGCATCTGTATGACAANTG
CACTAATATCAAAGC[A/G]GAAA
GACACAGACCAATAAAAATTAT
TTGNAAAAAAAAAAAAAAAAAA
ATAGAGAAAAAA
14q24.1 LD-
rs10131490
rs10131490 YES
TTTCTGAGATATTCAGCTTTTAT
TTCAACTATGCTTCCAGTATCTA
CAGGGGAGTCTGTN[A/G]GTCAC
ATGTTGAGCCAGGTTTTCTATTT
CAGAAGAGGAAGGAAAAGAAT
GTGTAGGGGAA
2p23.1 LD-
rs10173253
rs10173253 YES
GAAGCGTTGGGGTCTGTGGAAG
ACATGAAATGTACCACCNAGAT
CCGCCTTCTANGGAGG[A/G]CCT
TCTGCCCAGCTGCGGGTNTGGA
ACCAGCAGCCTGCCTCCAGCTGT
TTGTTCCTTCAA

128
Chr. SNP rs_SNP Peak SNP SNP in LD
with the
peak SNP
LD (r2) Strongest SNP-
Risk Allele
Gene DNA Sequence
17q12 LD-
rs1054488
rs1054488 YES
GTTTCAGTATTGAGATGGCTCAG
GAGAGGCTCTTTGATTTTTAAAG
TTTTGGGGTGGGGG[A/G]TTGTG
TGTGGTTTCTTTCTTTTGAATTTT
AATTTAGGTGTTTTGGGTTTTTTT
CCTTTAA
11q12.2 LD-
rs10792304
rs10792304 YES
TCATCTAACCCCTTTGTGCCTCA
GTTTCTCAATCTGTAAAACAGAG
CGGCGTGCGGAACA[C/T]AGTAA
GTACCACTAAGCATTTGCTGCNA
NGAGGACCCTGGCAACCATCTT
AGACAGTGGG
10p15.1 LD-
rs10796035
rs10796035 YES
AGTCCAGGGCCTGTACATACACT
GGTTCCTACAAGGGTGGTGATG
NGAAGTGAATGCTTG[A/G]GAAC
TGGGACTGGGATGTAAATTTNC
NGTTTGCCAGGGGCCAGCTCTG
GGACCTCAGGTG
10q22.3 LD-
rs10887226
rs10887226 YES
AACCTCTTTTTATTTCAACCTCG
AGAACTTCCTTTAGCACTTCTTG
CAAGNTGGACCTAG[C/T]GGTGA
CAAACTCCCTCAGTATATGTTTG
TNTGGGATAGTTTTTATCTCTCC
TTCACTAAT
6q27 LD-
rs10946216
rs10946216 YES
TTGGCCAAAGGGATGATCAATG
GCAGTCGGTCTGTTGCTTGGTCC
CCCCAACCCCTGCTC[C/T]TCTTG
GGNAGCCCCCCACCCACAGCTC
TCACCGGCCTTCCCTCTTTGCTA
CCACCACAGA

129
Chr. SNP rs_SNP Peak SNP SNP in LD
with the
peak SNP
LD (r2) Strongest SNP-
Risk Allele
Gene DNA Sequence
7p15.1 LD-
rs10951192
rs10951192 YES
TAAAAGGATCTACAAGCGCAAA
GTAAGAATAATCATATGAGACG
TTCAATTTGAAACAGG[C/G]TGG
TAGAGTCCAGGAATCATCTATA
AAGCTGTGAGATGTAGCATGGT
ATATCCTGCTATA
9p13.3 LD-
rs10972201
rs10972201 YES
AGGATGGTGTAGGAGGCAGGTA
GGAGGCCTCCCTTGGGCCTTGAG
GTTTCTGTGACCTTT[A/G]CNTAA
CCCTTGGCAGGTGGGATCCCAC
AAGAGTGCCTGATGTTGAATTTC
TCATCAGCAC
11q21 LD-
rs11021232
rs11021232 YES
GAAGAATGTCTGGCATTAGTATT
TAATGCCCTAGTGTTACCAGAAG
TCAATCTATTATGC[C/T]TTCTCT
TTTTCTGGTATTTGCATTTAAGT
CTTATCTCCAGTAAGATCCTAAA
GGCTCTAT
11p12 LD-
rs11033650
rs11033650 YES
TCAGAGTAGATGGAGTTAGCTG
AAGTTTAACATTGTGAGGCCTGG
GATGGGCTGGAATCC[A/G]ACAA
TCCATTTTCATAAACTTTAATTT
GGATGTGGTAGGTGATCTCAGG
TGTTCATCCAC
2p14 LD-
rs11126034
rs11126034 YES
CCTAAAAGGTGTGTGTAGGAGG
TGGCGGTGGTAGTCTTTGCTTTA
CAATGACTGNGGATA[C/T]GACC
TTCATCCAGGAACCAATTAAGCT
AAAAGCCAGGGGTCCTGCTTAT
GTGCAGGAGCC

130
Chr. SNP rs_SNP Peak SNP SNP in LD
with the
peak SNP
LD (r2) Strongest SNP-
Risk Allele
Gene DNA Sequence
6q23.3 LD-
rs111883038
rs11188303
8
YES
AGGACAGTAAGCATGGATGAGG
AAGTCACTGTGACTCATGGCAG
GGGAGGGTGGAGGGCA[A/C]CCT
CTGAGGAAGATGGANATATATN
CTGAAAGCCCTTCCTGCGGTCTA
TGAGGCCGGGTG
6p23 LD-
rs115686522
rs11568652
2
YES
ACATAAGTTGTCCCCTAGGTGAA
GGCCGTCTGCCACACTGACTGTN
TAATCTGAACTNGG[A/G]GCCAG
ANGTTCTGAGTCTTAGCGCCNCN
CTTGCTATTATCTTCCAGCATGA
TTTTTGGGC
2q33.2 LD-
rs11571316
rs11571316 YES
GATGCACAGAAGCCTTTTCTGAC
CTGCCTGTTTTCTATACACTGCT
ACACATTATAGAAA[C/T]CTTCN
AGCCCCAGCTCAAGNGCCAACA
AGCAATAACAACCTAATGGGCA
CTTCCTAATGC
2q11.2 LD-
rs1160542
rs1160542 YES
CTGTTTTCAGGTCACGTTCCTCT
AGCGCAGCAGATCCCACCTGGC
TACACGCTGGAATAA[A/G]CAAG
AGACTTCCAGAAACACAAATGC
NTGGGCTGTACCCCAGAGAGAT
TCCATCAGAGTC
21q22.11 LD-
rs11702844
rs11702844 YES
CCCAGGTAGTTTATGACATCGCT
GGGTTGTTGGNCTCTCCAAGCCC
AAAGTGACACTAGC[A/G]TTTCT
CTAGGCCTTGAACTACCTGGGG
NGTCAGAGCCACCAGCATTGAA
TGGGCATCAGT

131
Chr. SNP rs_SNP Peak SNP SNP in LD
with the
peak SNP
LD (r2) Strongest SNP-
Risk Allele
Gene DNA Sequence
1p34.3 LD-
rs12131057
rs12131057 YES
ATCATTAACTTTTTATGGAGAAA
GGAGTGGTCTGACATGANTATA
TANATAAAGTTTTGG[A/G]CAAT
GGCGAATTGCTGGGCTAATTGG
NCAGGGGCCTGGAAGAAGCAAG
ATGAAATGATCA
2p16.1 LD-
rs12466919
rs12466919 YES
AAGCCTCTTTCCTTTATAAATTA
CCCAGTCTCAGTTATGTCTTTAG
AAGCAGTATGAGAA[C/T]GGACT
AACACACCCANAAATCCTAAAA
TATTTTCTTTTTTAAAAAATAGA
GACAGAGTCT
10p11.22 LD-
rs1250317
rs1250317 YES
CAAGCTATTACTTGAAGCTTCTC
CCTTTTATTTCAGAAACTTCTTG
CATTTATTNGATTT[C/T]GTTCTA
AAGANNTGAAGTGTTATGGAAT
AAATTTGCTTACGGTGATGGATG
GGCATTTTC
2q32.3 LD-
rs12612769
rs12612769 YES
CAAGAAAACAAACTCAATTTAA
AAATGGGCCAAATACCATAATA
GATGTCTCACCANAGA[A/C]GAT
ATATAGATGANAAATAGGCATA
TGAAAAGATGCTCCACATCATA
CGTGGTCAGGGAA
13q14.11 LD-
rs12872801
rs12872801 YES
TAGAATTTTAACCCATGCAGGAC
TTAAAGAAAATAATTGCTATCTG
CTCCAGTCAAAGTC[C/T]ACAGT
GACATTCCAAGANCATGTGTCA
GGAAATTGACTGAGAAAAGAGT
TTTGAATTTTT
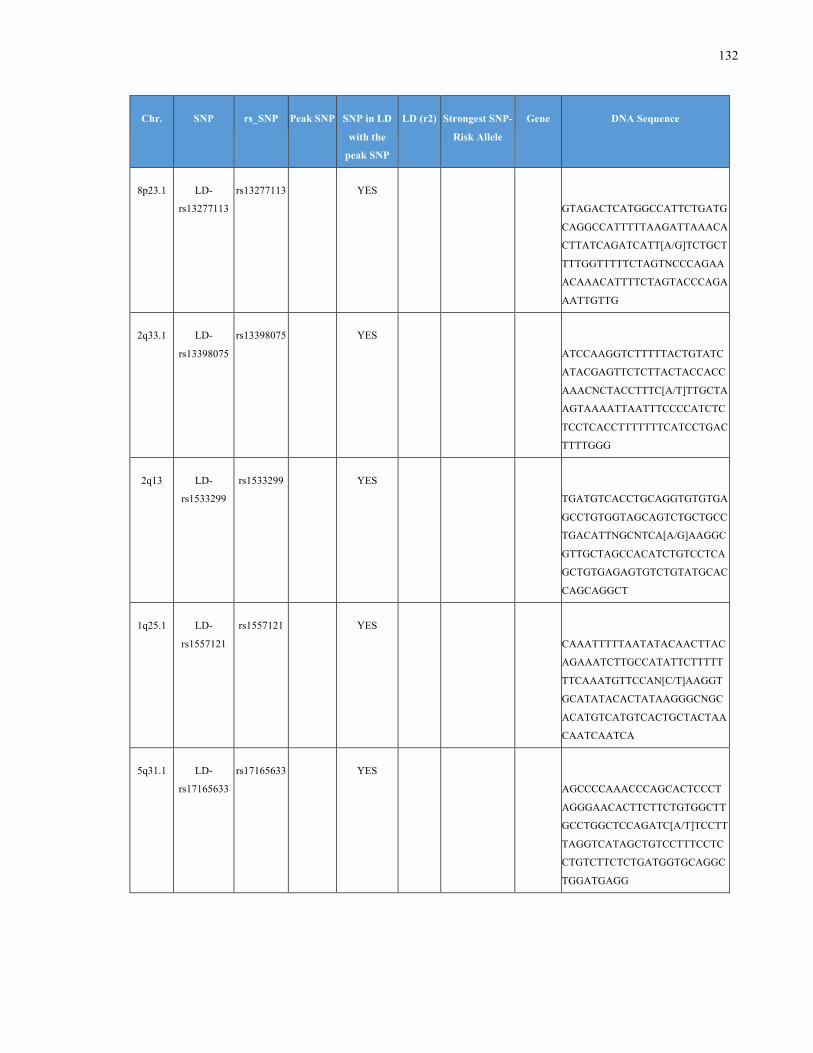
132
Chr. SNP rs_SNP Peak SNP SNP in LD
with the
peak SNP
LD (r2) Strongest SNP-
Risk Allele
Gene DNA Sequence
8p23.1 LD-
rs13277113
rs13277113 YES
GTAGACTCATGGCCATTCTGATG
CAGGCCATTTTTAAGATTAAACA
CTTATCAGATCATT[A/G]TCTGCT
TTTGGTTTTTCTAGTNCCCAGAA
ACAAACATTTTCTAGTACCCAGA
AATTGTTG
2q33.1 LD-
rs13398075
rs13398075 YES
ATCCAAGGTCTTTTTACTGTATC
ATACGAGTTCTCTTACTACCACC
AAACNCTACCTTTC[A/T]TTGCTA
AGTAAAATTAATTTCCCCATCTC
TCCTCACCTTTTTTTCATCCTGAC
TTTTGGG
2q13 LD-
rs1533299
rs1533299 YES
TGATGTCACCTGCAGGTGTGTGA
GCCTGTGGTAGCAGTCTGCTGCC
TGACATTNGCNTCA[A/G]AAGGC
GTTGCTAGCCACATCTGTCCTCA
GCTGTGAGAGTGTCTGTATGCAC
CAGCAGGCT
1q25.1 LD-
rs1557121
rs1557121 YES
CAAATTTTTAATATACAACTTAC
AGAAATCTTGCCATATTCTTTTT
TTCAAATGTTCCAN[C/T]AAGGT
GCATATACACTATAAGGGCNGC
ACATGTCATGTCACTGCTACTAA
CAATCAATCA
5q31.1 LD-
rs17165633
rs17165633 YES
AGCCCCAAACCCAGCACTCCCT
AGGGAACACTTCTTCTGTGGCTT
GCCTGGCTCCAGATC[A/T]TCCTT
TAGGTCATAGCTGTCCTTTCCTC
CTGTCTTCTCTGATGGTGCAGGC
TGGATGAGG

133
Chr. SNP rs_SNP Peak SNP SNP in LD
with the
peak SNP
LD (r2) Strongest SNP-
Risk Allele
Gene DNA Sequence
6p21.3 LD-
rs17427445
rs17427445 YES
CATATTAAAGCCCAAACATCTCA
TATAAACACTTTATTATNTGAAA
TTCTTGGCCATGGAATATC[A/G]
TATACTTNCATTTAATNTCTTCA
CCANCTCTATCCAAAAACAAAA
AAAACCCTTCAATCCCCATA
6p21 LD-
rs1885205
rs1885205 YES
GCGTCCCCCCATAGCTCCTGACT
CACTCTGGCCTTGGGCANACCCT
CATGGCCATGGACC[A/G]GGGAT
GGGGAGGTGNNAATCCTCTTTTG
TTCCCCATTTCCATACAGGGAAG
CATAGTTGT
2q33.2 LD-
rs1980421
rs1980421 YES
TCACATTTCTAAGTCTTACAGAT
ATAAATATTTTATGTTTGAGNTT
TGTCAACCAGGATT[A/G]TTTGA
ATAAATGTATAATTCTCTACAAC
NGTTAAGTTTACTAATTTATCAA
AATTGTTTC
5q21.1 LD-
rs1991797
rs1991797 YES
AATAGGGGCATTGTTGACAACT
CAAGAAAATTTCAGCAGAAATA
ATTGAAAATATCCCCC[A/C]TGG
GTTCTCTATTTACCCTAGGCAAA
AACAAAAAAATACACACTAGAA
ACCAGATCAGGC
22q13.1 LD-
rs2069235
rs2069235 YES
TTATTGAATCTGCTGGGCCCCAA
GGGAAGGCAGCGTGACTCAGAA
GCAGCCCTTGTTCTC[A/G]GGAA
GCCACAGTCCCACTGGGGAGTG
AGCCAGGTGCCCCCAGGCAGAG
GCCGCAAGAGCC

134
Chr. SNP rs_SNP Peak SNP SNP in LD
with the
peak SNP
LD (r2) Strongest SNP-
Risk Allele
Gene DNA Sequence
6p21.3 LD-
rs2227955
rs2227955 YES
GAAAATTGCTGCAAAGAATGCC
TTAGAATCCTATGNTTTTANCAT
GAAGAGTGTTGTGAGTGATG[A/
C]AGGTTTGAAGGGCAAGATTAG
TGNGTCTGATAAAAATAAAATA
TTGGATAAATGCAACGAGCTCC
1p36.23 LD-rs227161 rs227161 YES
ACTCAGGAGGCTGAGGTGAGAG
GATCACCCGAGCCTGGGAGGTG
GAAGCTGCAGTGAGCC[A/T]TGA
TTGTACCACCACACTTGGCCTNG
CGACAGAGCCAGAACTTGTCTC
CAAAAAAAGAAA
10q11.23 LD-
rs2663038
rs2663038 YES
TTGGTCTATTTGGGTACAGTCAG
CCCTTATTGTGCAATTCTCCTGN
GTTTATGAAGTAAG[A/G]CCATT
CAAAATNAAATTGACTGANCTTT
TGCCAAAAGTCCAGTTGTCAAGT
GTATGTTTT
14q32.33 LD-
rs2819464
rs2819464 YES
GCTGCCCGTCTGCCTGGAGCATT
TAAGGGAGCAAAGGTCCTNTCT
GGTGAGGGCAGGGAG[G/T]GTG
GGGAGCAGCTGTCCAAGAACAG
CCCTGGCACCTCGTTGCCCAGCC
ACAGCCCAGGAT
21q22 LD-
rs2834532
rs2834532 YES
AGGATGCAAAGGGGATAAGAAG
CAGCAACTACACCCTGGCTCTGT
AAGACNGCATGTCAT[C/T]ACAC
CTTACTCAAAGGGACTCCTCAAT
ATTTAATCAGCGATTTTTTACAT
TATTACCTAA

135
Chr. SNP rs_SNP Peak SNP SNP in LD
with the
peak SNP
LD (r2) Strongest SNP-
Risk Allele
Gene DNA Sequence
6p21.1 LD-
rs28362856
rs28362856 YES
CTACACTCATCCACCTTCCTTTC
TCCAATGCTGGAGATGGAAAAG
CTACATGTTCCCTTG[C/G]GGAT
AACCCTCTAAGGGCATTGCTGG
NNTTAGGCTGATAGCACTTGGA
ATAGTGGGGAGG
4q21 LD-
rs2867461
rs2867461 YES
TTTGTTAGCTTCTAAATTAAATA
GGAAGCATGATACAGAAGAATG
ATCTTTAGAGATGGG[A/G]ATTA
AATTGAGTATCAGTCTCAGGATT
NAAAAAAAGAAAATGATTGCTG
CAATTTCAGCC
Xq28 LD-
rs3027933
rs3027933 YES
GGGAAGAGCAAGGAAAAAGGT
GTGGTCCAGGCAGAGCCATACA
TCCCCTTCCTGCNNGTG[C/G]AG
AAGAGCACCCTACCTATTCTAGT
GTGGGAGGCTTCCCCGTTCTTTT
CTGGTGACCGAA
6p21.3 LD-
rs3096700
rs3096700 YES
CATGAAATGTAAAAATCATTCTT
AGCTCATGGGCTATACAAAAAA
AAAAAACAAGTNGCAGACTG[G/
T]ATTNGGCCCATTGGGTGGTAG
TTTGCTCATCCCTGGCTTAAAGA
AAAAAACAATTAATAAACCAG
6p21.3 LD-
rs3130070
rs3130070 YES
TGGGGCTTGGTTTAGTCCAGCCA
CGTCTGAGCCNGAGACGAAGAG
GTCCCTTTCTTACCT[A/G]TTGCA
GGTTCCTTGTTAAATGACTAAGG
AATGGTACTAAACTTTAGCTTTT
TGTCTTGGA
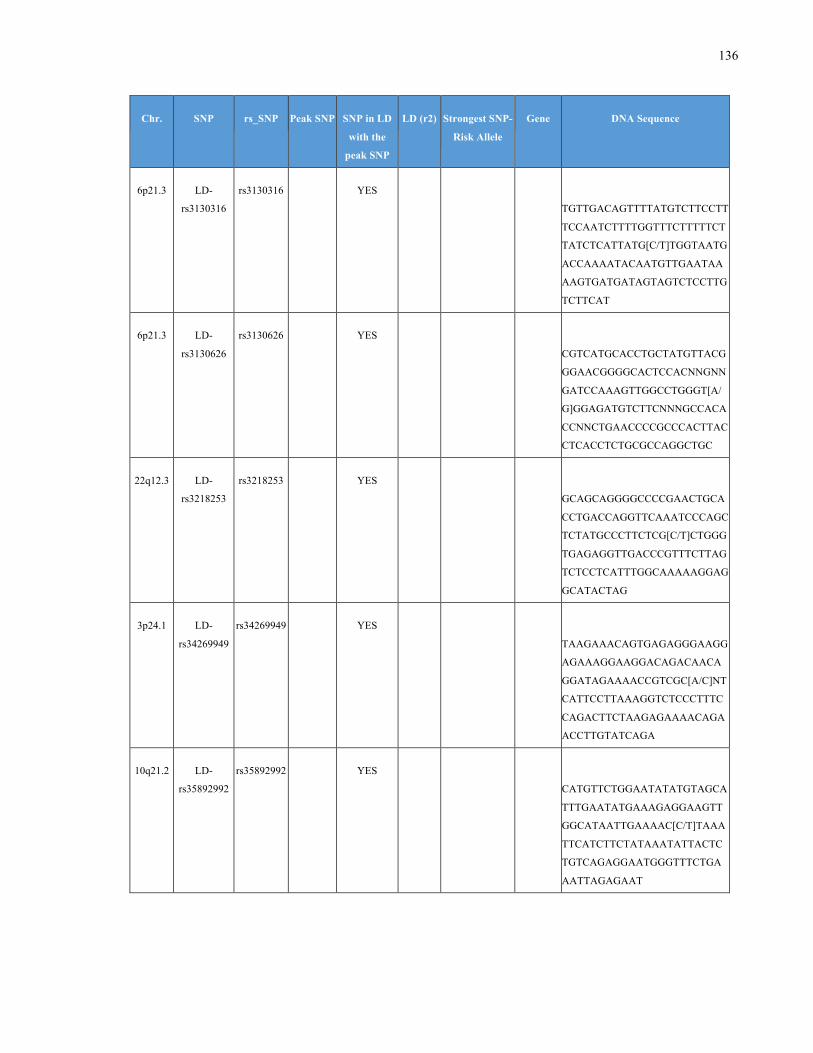
136
Chr. SNP rs_SNP Peak SNP SNP in LD
with the
peak SNP
LD (r2) Strongest SNP-
Risk Allele
Gene DNA Sequence
6p21.3 LD-
rs3130316
rs3130316 YES
TGTTGACAGTTTTATGTCTTCCTT
TCCAATCTTTTGGTTTCTTTTTCT
TATCTCATTATG[C/T]TGGTAATG
ACCAAAATACAATGTTGAATAA
AAGTGATGATAGTAGTCTCCTTG
TCTTCAT
6p21.3 LD-
rs3130626
rs3130626 YES
CGTCATGCACCTGCTATGTTACG
GGAACGGGGCACTCCACNNGNN
GATCCAAAGTTGGCCTGGGT[A/
G]GGAGATGTCTTCNNNGCCACA
CCNNCTGAACCCCGCCCACTTAC
CTCACCTCTGCGCCAGGCTGC
22q12.3 LD-
rs3218253
rs3218253 YES
GCAGCAGGGGCCCCGAACTGCA
CCTGACCAGGTTCAAATCCCAGC
TCTATGCCCTTCTCG[C/T]CTGGG
TGAGAGGTTGACCCGTTTCTTAG
TCTCCTCATTTGGCAAAAAGGAG
GCATACTAG
3p24.1 LD-
rs34269949
rs34269949 YES
TAAGAAACAGTGAGAGGGAAGG
AGAAAGGAAGGACAGACAACA
GGATAGAAAACCGTCGC[A/C]NT
CATTCCTTAAAGGTCTCCCTTTC
CAGACTTCTAAGAGAAAACAGA
ACCTTGTATCAGA
10q21.2 LD-
rs35892992
rs35892992 YES
CATGTTCTGGAATATATGTAGCA
TTTGAATATGAAAGAGGAAGTT
GGCATAATTGAAAAC[C/T]TAAA
TTCATCTTCTATAAATATTACTC
TGTCAGAGGAATGGGTTTCTGA
AATTAGAGAAT
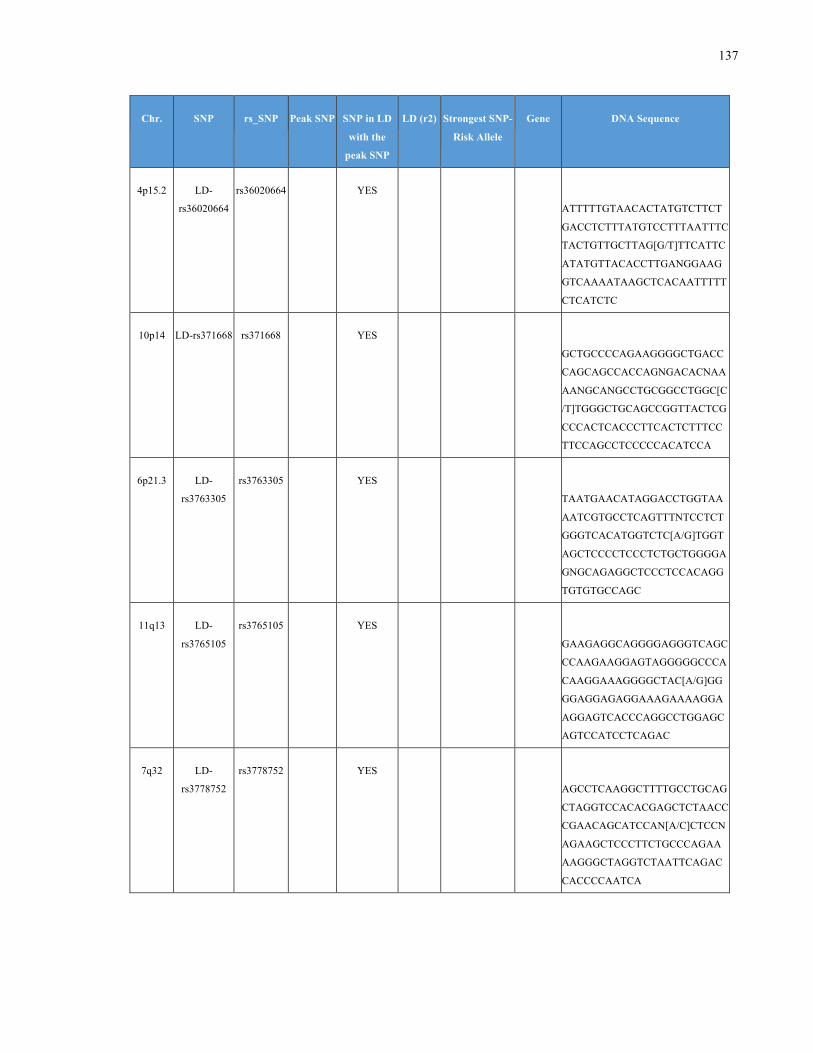
137
Chr. SNP rs_SNP Peak SNP SNP in LD
with the
peak SNP
LD (r2) Strongest SNP-
Risk Allele
Gene DNA Sequence
4p15.2 LD-
rs36020664
rs36020664 YES
ATTTTTGTAACACTATGTCTTCT
GACCTCTTTATGTCCTTTAATTTC
TACTGTTGCTTAG[G/T]TTCATTC
ATATGTTACACCTTGANGGAAG
GTCAAAATAAGCTCACAATTTTT
CTCATCTC
10p14 LD-rs371668 rs371668 YES
GCTGCCCCAGAAGGGGCTGACC
CAGCAGCCACCAGNGACACNAA
AANGCANGCCTGCGGCCTGGC[C
/T]TGGGCTGCAGCCGGTTACTCG
CCCACTCACCCTTCACTCTTTCC
TTCCAGCCTCCCCCACATCCA
6p21.3 LD-
rs3763305
rs3763305 YES
TAATGAACATAGGACCTGGTAA
AATCGTGCCTCAGTTTNTCCTCT
GGGTCACATGGTCTC[A/G]TGGT
AGCTCCCCTCCCTCTGCTGGGGA
GNGCAGAGGCTCCCTCCACAGG
TGTGTGCCAGC
11q13 LD-
rs3765105
rs3765105 YES
GAAGAGGCAGGGGAGGGTCAGC
CCAAGAAGGAGTAGGGGGCCCA
CAAGGAAAGGGGCTAC[A/G]GG
GGAGGAGAGGAAAGAAAAGGA
AGGAGTCACCCAGGCCTGGAGC
AGTCCATCCTCAGAC
7q32 LD-
rs3778752
rs3778752 YES
AGCCTCAAGGCTTTTGCCTGCAG
CTAGGTCCACACGAGCTCTAACC
CGAACAGCATCCAN[A/C]CTCCN
AGAAGCTCCCTTCTGCCCAGAA
AAGGGCTAGGTCTAATTCAGAC
CACCCCAATCA

138
Chr. SNP rs_SNP Peak SNP SNP in LD
with the
peak SNP
LD (r2) Strongest SNP-
Risk Allele
Gene DNA Sequence
10p14 LD-rs386680 rs386680 YES
CAGTCCTAGCTGGGACAGGGCC
AGTGCTGCCCCAGAAGGGGCTG
ACCCAGCAGCNACCAG[C/G]GAC
ACNAAAANGCANGCCTGCGGCC
TGGCNTGGGCTGCAGCCGGTTA
CTCGCCCACTCAC
6p21.3 LD-
rs3997872
rs3997872 YES
AGCATCAGGAGGCATTTTACGC
ACATACTTGCAACACTCNGACTN
ACCACAGCAGCAACAGAAGG[A/
T]GGCTATGAAGTTATNACAGNA
ANGTCCTATGTATTATAGTTATT
CAATGCAGTTGTGACTCAATA
1q21.3 LD-
rs4129267
rs4129267 YES
AGGTGGAAATGGAGAAATACTG
GGAGGGGCACTTGCTCAGCTTG
GAGTGGGGTCAATTCT[C/T]AAA
GGAAATGACATCACCTCATCTG
AGATCCAAAGGCCAAGTAGGGA
CTAGACCACAAAA
7q21.2 LD-rs42031 rs42031 YES
CATAAAACTTAAGATTAGAAAC
TTTCAAGTAAGGGTACAANGGG
TATCTTCAGAACTTTA[A/T]CCTA
AGCACATCAACGGAATTTTTCTA
GGNACCACAGAGAGTTAGAAAT
TAAATAATTGT
18q22.2 LD-
rs4891376
rs4891376 YES
AAAGTGTTGGGATTACAAGCGT
GAGCCACCATGACCAGCCAGAT
GTTAGTGTTTTTAAGA[A/G]GAA
AGCAAAATGAAAATTCAAGTGC
CATGATTACTTATAGAGGTTATC
TTTTAAAAAAGA

139
Chr. SNP rs_SNP Peak SNP SNP in LD
with the
peak SNP
LD (r2) Strongest SNP-
Risk Allele
Gene DNA Sequence
8q22.3 LD-rs507201 rs507201 YES
ACGGCTGAGCTTCTATATTCCTG
CACTGATCAGTGATTGAATATGA
GCTTCCCTAAGAAG[A/G]GACAT
GACCTTGGACAAGGAGGTTGTTT
CCAGTGGAGGCAATCCTGGATG
ATGACAGCAC
6p21.3 LD-rs510205 rs510205 YES
TGCTGGTTTTGGGTAATTGCCTT
TTAAACTCTTTAANGGGGGAAA
NACNTGCGGTGGGAA[C/G]ATGT
TACCAGAGTGAGAAACAAAGGC
AGTAAATTATTTTGTTCCATGTC
TTAGATCTTGA
17p13.2 LD-
rs60963557
rs60963557 YES
ATGGACTTGGGAAAGCAATGAT
AGTTTTAAGGGGTCACTCTNTGT
GTTTGTTTCATTTAG[A/C]TGGTA
AAAGTAAAATAGTATTTAAAGN
ACTCTGTTTAATTGGATGGAAGC
CTTTTTATAG
11q12.2 LD-
rs61897793
rs61897793 YES
CTACCTCTGATCTCTTCCCTTTG
GTACTGCNGTGCTTCTCTCNCCT
TTTCCTTGCTGTGG[A/G]CAAAA
GNAACCCTCACCCNCGCCCTAA
GAGCGTGTCTGCTCTTTTCACAG
CAGTCCCACC
1p13.2 LD-
rs6679677
rs6679677 YES GGAAACTATTCAGTGCTTCCTGC
GGCTACCAGNGAACAAGGTCTG
AATCCTTGCTCCCAA[A/C]CAAT
AATCTGTGATCTTAAGCAATTTA
TTCAACTAACAAGCCTGTTTTCT
CACCTGTATT

140
Chr. SNP rs_SNP Peak SNP SNP in LD
with the
peak SNP
LD (r2) Strongest SNP-
Risk Allele
Gene DNA Sequence
1p34.3 LD-
rs67164465
rs67164465 YES
AGGAGACTCTGAGCTCCTTTAGG
ACATCTTACTCATCTCTCTTTCTC
TCATGTGTTGTAC[A/G]AACACT
TGCTCCATATTCAGCCAGGCTTT
GTGTGTCTTGACAGAGCTAAAG
ACCAATGGG
10q21.2 LD-
rs67630314
rs67630314 YES
TCACTTAGAAAACGCAATCATTC
ATTTCTGAAATACCCANTAAATT
CTTTAGTTGAAATA[AATAA/G]A
GTGTAAAATAGCTTATACTATNA
ACAAAGAGTTTTTTGCCAGCCGT
TACCCAAATAATG
6q23 LD-
rs6920220
rs6920220 YES
CCATTGATAAATTATATTTTATC
TGCTTCCATCTGTTAGCAGGTAA
CNTCTCCACTAAAA[A/G]GATAT
GGTTCTGTAGAACAATGGCATAT
GCAGACAGTGATCTGTTATTCCA
CTATTCTCT
12q14.1 LD-rs701006 rs701006 YES
CCATAGTTTAGTCCAGTTAATTG
TGGGCCCCTTTGTCGGGCTAGTT
TTTGAGGGCAATAT[A/G]TAGGT
TTGTTCTGAGTCCAGGACGGCTC
TCAGTTGCCCTTTCCCTGGTTCT
CTCTGTTAA
11q24.3 LD-
rs7105899
rs7105899 YES
CAACCAGGCAGGCCGCGTGCCT
AGGAGAGCGGGCAGCGGGGTTG
GGGGGTNGGGTGGGGG[A/G]AT
GCCAATGCAGGGGCGGGGCTCC
CGGGCCTGAGAGAGAGGTGACA
GGCACCGGTGAACT

141
Chr. SNP rs_SNP Peak SNP SNP in LD
with the
peak SNP
LD (r2) Strongest SNP-
Risk Allele
Gene DNA Sequence
12q24.12 LD-
rs7137828
rs7137828 YES
TCCTCACTAATCAGTAACAACAC
TGAATGTAAATCGACTAAACTCT
CCAATCAAAAGATA[C/T]AGAGT
GGCTAAATGGATTNAAAAAAAA
GGCTGGGTGCGGTGGCTCACGC
CTGTAATCCCA
18p11.21 LD-
rs7241016
rs7241016 YES
AGGCAGTTTAAGCAAGAAAGGA
AAGAGAAGGGGGGAAAGTTGTG
CCAAGGCAAANAGAAC[A/G]AC
ATTTACAAACGCCCTAAGGGGA
GAATGGACACACACACTTCCAA
GAATACAACACAGT
11q22 LD-
rs73000527
rs73000527 YES
TGAACCAGGAGTTCAGTTTAATG
TAAGCTCGTTAGTTGATCTAAAA
TAAAAACACCTTGT[A/T]TGAAT
TTTAGCACTTTGTTTTTTGCAAA
ATAATTGTTTTCCTTACATTATA
TTTAAAACA
3p14.3 LD-
rs73077957
rs73077957 YES
AAATATAAAACTCTGAGGGAAA
AAAACCCTCGGGATATAGAAAT
TCCAGGCCCTTGGAGA[A/C]GCC
CAGGGTCACAGGCTGTGAGTTA
AATAAAAAACCCACCAAACTGA
TGAACTACCCATT
3q22.3 LD-
rs73230016
rs73230016 YES
CATGCTCTATTCTAGGTTAAATG
GTAAGTTTCATTGACTTCAGCCC
CAACTGCCTCTGCTCATAC[C/T]A
CTCTCCATCTCCATNTNACCTCC
ATCACATCACTCTTCCTCTTCTTC
CATACCTCTAGATCTCA

142
Chr. SNP rs_SNP Peak SNP SNP in LD
with the
peak SNP
LD (r2) Strongest SNP-
Risk Allele
Gene DNA Sequence
19p13.2 LD-
rs74956615
rs74956615 YES
TGGGGGCTGTCCGGGGTGGTTTG
AAAAATAAAACTTAGAAAAGGA
AACAGAAGTCAGTTG[A/T]NAAA
GTTAAAAAAAAAGGAGACAGTC
TCTGTATCTTCACGGGAGGTCAG
GGAAACCTCCA
1q23.1 LD-
rs7528684
rs7528684 YES
ACTTTCACATAAGTTGTTATGAG
GCTTCTGAACAGGAAAATAATA
CAAATGTACAGATCA[A/G]GGAC
TTCCCGTAATCTCACCCAGATCT
GCAAATTAGGAGATAAATCAGC
AAGCGTACCAC
3p24.3 LD-
rs7653834
rs7653834 YES
GTTGAGGGTTCAGAACTCAAAA
AGGTTCGCTCCAACTCTAGAATT
TATCNNAGGTACTTT[C/T]TACTG
GATGCTGACATGCAGAGCCTAA
GGTGGGAGCCATCTAAGAAGGA
TTCTGAGAAAG
1p13.1 LD-rs771587 rs771587 YES
TTCATTCTAATTTCCGTTTTTTGA
GAAAGCTCCATACTGTTTTCCAT
AATGGCTGTACTA[A/T]TTTACAT
TTCCACGGTCNGTGTACAAGGNT
TCCTTTTTTTCCACATCCTCACCA
ACATTT
6p21.3 LD-
rs7755224
rs7755224 YES
ATGCTATTAAGAAGATAATCCTT
GTTGACTGTAGTCCTGGTTGTTG
AGNCCATGCATATT[A/G/T]CTTT
TCCCTTCATTAGAGNAGGACTAN
AGTTGATAGCCATTATTACGAGA
GATGCCTCAG

143
Chr. SNP rs_SNP Peak SNP SNP in LD
with the
peak SNP
LD (r2) Strongest SNP-
Risk Allele
Gene DNA Sequence
15q14 LD-
rs8035957
rs8035957 YES
ATGACACCATCCTGGTAATTTTT
TTGGCATAGCNATTATAACCATC
TTGTATCTCCATGA[C/T]GTGATT
TTGGATCCTCTGGCAAGCTGCAT
TATTAACCTGAAAAAGCCATAC
ACTAACACT
17q12-
q21
LD-
rs8076131
rs8076131 YES
TCTCACTCAGCACAACCCCTGCT
GGACTGTGTCTCACTGAAGGCCT
AATGTGGGACATCT[A/G]CTCTT
AAGCTCTTCCCATCAGGAGGGA
AAGGAAGTGAGGCCTGTGGGTA
CAGGCAGCAGT
15q23 LD-rs919053 rs919053 YES
GCCGAGGAGAGAGAATCCCCTT
CTGGACAGCAGNATTCAATGAC
CACTTACTAAGNTGTG[C/T]GGA
CNAGGAGGAGGTGAGCAGAGCA
CAATCAAAAACAAGGAAGGAAG
GGAGAGAAGGAGA
6p21.3 LD-
rs9268145
rs9268145 YES
AATGACTAATTGAATTGACTTCT
ATTCCATTCTTGTGAACAGGACA
NTTGACATTTGTATTAGTT[G/T]A
TTTGCAAAACAAAATTTACTATT
GATTTCTTAAGGTAAGTTTCACA
TTCCTACTTTTATATTGC
6p21.3 LD-
rs9268500
rs9268500 YES
GTTTCCCCCTTTCCAAGAAACTA
CTGCTAGTAAGATTTTATGGGAC
AGGGGTAAAAATCAANATT[C/T]
TGAAATGGAGATTTAACAATCA
AANGAGTCAGGAGATTGTTGTT
ACACAAATATTGCCCATTTGC

144
Chr. SNP rs_SNP Peak SNP SNP in LD
with the
peak SNP
LD (r2) Strongest SNP-
Risk Allele
Gene DNA Sequence
6q21 LD-
rs9372121
rs9372121 YES
CTTTGGCTCCTCCTTCTCTGATA
CCCTGCCTAGCAAGTTCCAACCA
CTTCAGCAGCCCAG[A/G]ACTCC
AATTTGTGCATCCTCAGCTCAAC
TGAACTTCTTTGCTCTGCTTGAG
CTCCACTCT
6q25.1 LD-
rs9498368
rs9498368 YES
TCTCAACCTCAAAGGTGGATTTT
GAGGAAGACTGACATGGGCTGG
AATGGTGGTTTTCCA[A/G]AGAA
AGGTTATGAGGAAGCCCAACAG
GCAGAGCTATGCTAATTACATGT
GGGACCACAGT
16q24.1 LD-
rs9927316
rs9927316 YES
GCGCGGTCCAGGCGTTGAGCAA
TAGGGCTGCNCCNGGTGTCNTG
CCCGCCGCCCACCCCN[C/G]CCT
GCCTGCTCCACTTACACGGAGAC
GAGAGGCAGCTGCTGGTGTGGC
CGCGTGTGCATG
9q33.2 LD-
rs10760119
rs10760119 YES
CACTCCAGCAGCCTGGGTGACA
GAACAAGACACTGTCTCCAAAA
AAAAAAAAAAAAANAA[C/T]AG
ANGCTCCTGGTCCAGAGCTAGG
GGGNGGGGCTAGGGGGACAGAC
AGATTGATAGATAA
1q23.3 LD-
rs56383975
rs56383975 YES
GCCACTTTGTTCGTGGGCCCATT
GGGCGATCACAGGGGTGGCTGG
GGAAGGAGGCTGAGT[G/T]GNGT
CCATAGATCGGGTCATCCTATCC
ACTTGATTATTAAAATCCTCCTC
TGCTGAGGTC

145
Chr. SNP rs_SNP Peak SNP SNP in LD
with the
peak SNP
LD (r2) Strongest SNP-
Risk Allele
Gene DNA Sequence
16p13.13 LD-
rs11075012
rs11075012 YES
AAACATGGAAACCTAAAACGCG
ATGAGATTAACCCCAAAGAAAG
TAAAGGAGACCAGGCN[C/T]NGT
GACTCAGCCTGTAATTCCAGCAC
TTTGGGAGGCCGAGGCAGGCAA
ATCTCCTGAGGT
20q13.12 LD-
rs4810485
rs4810485 YES
ACCTGGCTCCTTCATCCCAGCCC
CTCTGGCCTCCCCCTNCTTTAGA
GGGCTGTAGATTCC[G/T]GCCTG
AAGCCTGGGCAGGAATGACCCA
TGGTATCAAGGAAAGCAAGGGA
AGCAGCAAGGG
2p15 LD-
rs6707337
rs6707337 YES
TAATCCCAGCACTTTGGGAGGCT
GAGGTGGGCGAATCATGAGTTC
AGGGGTTGAAGACCN[G/T]CCTG
GCCAACATGGTGAAACCCTGTG
TCTACTAAAAATACAAATATTAG
CCGGGCATGGT
12q13.2 LD-rs705700 rs705700 YES
GGTTGAAAAACATCACTGAGTT
AGTTTTCTTGTAGCTTCCACCTC
AACGGGAAAATTTCC[A/G]CTGG
ATCTGCTCTTGACTCCTAGTGTA
CTTCAAACCCTTCAGTCCACCAC
AGTCTAAAGG
1p36.13 LD-
rs2240335
rs2240335 YES
CTCAAGACAAGAGGGTTTCGGC
AGCTGTGCCCCCTCCCCANCCCA
TGCAGNTACCATCAC[G/T]CNTT
TGATGGGAAACTCCTTCAGGCCT
CTGTTCCTTGGAGAGTCGAAGAC
CACGGGCAGC

146
Chr. SNP rs_SNP Peak SNP SNP in LD
with the
peak SNP
LD (r2) Strongest SNP-
Risk Allele
Gene DNA Sequence
22q11.21 LD-
rs5994638
rs5994638 YES
ACCTCCTGGGTTCAAGCAATCTT
TTGCCTCAGCCTCCCTGGCAGCT
GGGGCTACAGGCAT[A/G]CACCA
CCACGCNCGGCTAATTCTTTTGT
ATTTTTAGTAGACACAGGGTTTC
GCCATGTTG
10p15.1 LD-
rs7072793
rs7072793 YES
GTCATTGAACTGGCTTTTCTGGT
TCACCTTACNGATGAACGCTCTG
TCGTCNTTTGCTGA[C/T]GCTGAG
GTTTCCAGTTGATGCTGCATGGC
ACGATGCAGGGATGTGAGAAGA
AGTTGGGGG
6q25.3 LD-
rs1994564
rs1994564 YES
ACCAAAACACCACACAAAGTAA
AGAGTCAATCANGATTCCNTCCC
TTTGNCCNTGAAGGC[C/T]GGCA
GATTTTTTAAAAANNAATTAATT
AATTAATTTTTTTTTTGAGACGG
AGTCTCGCTC
21q22.12 LD-
rs9979383
rs9979383 YES
AATCTTTATGCCAAAGTGGCATA
GTTTAGAGTGGCATCTTCTGATC
CCCATCANAATAAA[C/T]AGGTG
TAATACTGATACGACTANGAGA
CAGGCATAATTGTTGCGTCTTTT
CTTAGGTGGG
1q31 LD-
rs4915314
rs4915314 YES
TGGAGTACAGTGGCACCATCAC
ATCTCACTACAGCCTCAACACAC
ACTCATGGGCGTAGC[C/T]TCCC
AAGTAGCTGGGACTATAGGTGT
GCACCACCCTACCCGGATAATTT
TTGTATTTTAA
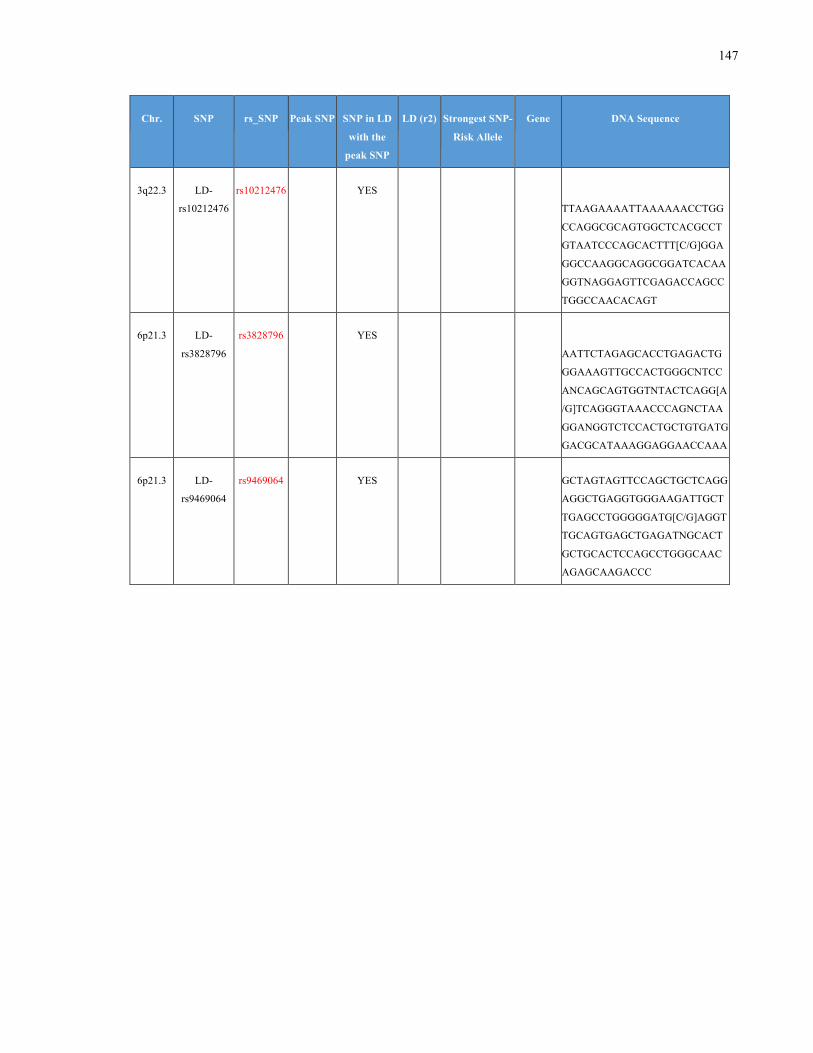
147
Chr. SNP rs_SNP Peak SNP SNP in LD
with the
peak SNP
LD (r2) Strongest SNP-
Risk Allele
Gene DNA Sequence
3q22.3 LD-
rs10212476
rs10212476 YES
TTAAGAAAATTAAAAAACCTGG
CCAGGCGCAGTGGCTCACGCCT
GTAATCCCAGCACTTT[C/G]GGA
GGCCAAGGCAGGCGGATCACAA
GGTNAGGAGTTCGAGACCAGCC
TGGCCAACACAGT
6p21.3 LD-
rs3828796
rs3828796 YES
AATTCTAGAGCACCTGAGACTG
GGAAAGTTGCCACTGGGCNTCC
ANCAGCAGTGGTNTACTCAGG[A
/G]TCAGGGTAAACCCAGNCTAA
GGANGGTCTCCACTGCTGTGATG
GACGCATAAAGGAGGAACCAAA
6p21.3 LD-
rs9469064
rs9469064 YES GCTAGTAGTTCCAGCTGCTCAGG
AGGCTGAGGTGGGAAGATTGCT
TGAGCCTGGGGGATG[C/G]AGGT
TGCAGTGAGCTGAGATNGCACT
GCTGCACTCCAGCCTGGGCAAC
AGAGCAAGACCC