Embed Size (px)
Citation preview
International Journals of Advanced Research in Computer Science and Software Engineering ISSN: 2277-128X (Volume-7, Issue-6)
Research Article
June 2017
© www.ijarcsse.com, All Rights Reserved Page | 254
A Novel Approach for Asthma Prediction Rajesh Kumar VRS
Professor & Head,
Department of Electronics and
Communication Engineering,
Sridevi Women’s Engineering,
College, Hyderabad, India
Rathish Babu TKS Professor,
Department of Computer
Science and Engineering,
Sridevi Women’s Engineering,
College, Hyderabad, India
Ramasubramanian M
Professor & Head,
Department of Computer
Science and Engineering,
Sridevi Women’s Engineering,
College, Hyderabad, India
DOI: 10.23956/ijarcsse/V7I6/0147
Abstract—About 334 million people across the globe are suffering from asthma. People with asthma are sensitive to
things which may not bother normal people at all. For example they may feel uncomfortable with increased levels of
smoke, pollen or fog in air. The number of people suffering from asthma has been rising sharply over the years,
pollution being one of the biggest reasons. Though controlling pollution is a broad topic, but preventing oneself from
asthma is an easier way out. It is important to keep track of what triggers asthma attack in a patient, because
symptoms do not occur right after the exposure to the triggering parameters. The delay in attack occurs depending on
how much the person is sensitive to the factor. Thus we try to propose a model of a smart asthma prediction system
using Internet of Things.
Keywords—Asthma, Sensor, Detector, Wearable, Temparature, Laser, Smarthphone.
I. INTRODUCTION
According to Global Burden of Disease Study (GBD) undertaken in 2008-2010, the number of people suffering from
asthma in the world may be as high as 334 million. The worst affected are the aged people between 75-79 years and
adolescence (ages 10-14) in terms of disability and premature death. Asthma is a chronic disease which causes uneasy
breath along with coughing and wheezing. There may various factors which may trigger an asthma attack, which varies
from person to person. Some of the common factors which trigger asthma are:
• Infections
• Food and food additives
• It can happen after an exercise.
• Smoking and chemical fumes
• Sinusities
• Outdoor allergens, such as pollens from grass, trees and weeds
• Indoor allergens, such as pet dander, dust mites and mold.
Here we try to measure and predict when a person is about to have an asthma attack using Internet of things (IoT).
Whenever he or she is about to have an asthma attack, a warning is sent to their smart phone as a notification.
Thus the person moves away to some safe zone free from factors which can trigger the attack. We propose a system
and method which will help an asthma patient to avoid some situations which cause breathing trouble. The following
work has already been done: Smart inhalers detect inhaler use and transmit that data. Smart inhalers contain sensors that
attach to existing inhalers and record when your medication is taken. They are Bluetooth-enabled, so can be paired
wirelessly with a smart device like a phone or tablet or with a computer to allow data to be transferred from the smart
inhaler automatically.
The devices link to smartphones via Bluetooth. Each manufacturer tends to have accompanying smartphone apps,
where you can look at your data or change reminder settings, and these may not be available for every type of
smartphone. The smart inhaler apps that have emerged so far appear to work with both iPhone and Android. In the future,
an app on your smart phone could receive and interpret the data from your smart inhaler and send you health advice and
reminders.
Your data could also be shared with your GP, asthma nurse or hospital team to help tailor care to your needs.
Knowing when and where your symptoms flare up may help identify personal triggers and allow a more individually
tailored self-management plan. When the user takes the inhaler, automatically a signal is sent to the mobile app via BLE
Bluetooth, at the same time by getting the signal the app starts gathering some real time parameter values like the
location by GPS, the body temperature, heart beat etc. using fitbit wearable.
II. RELATED WORK
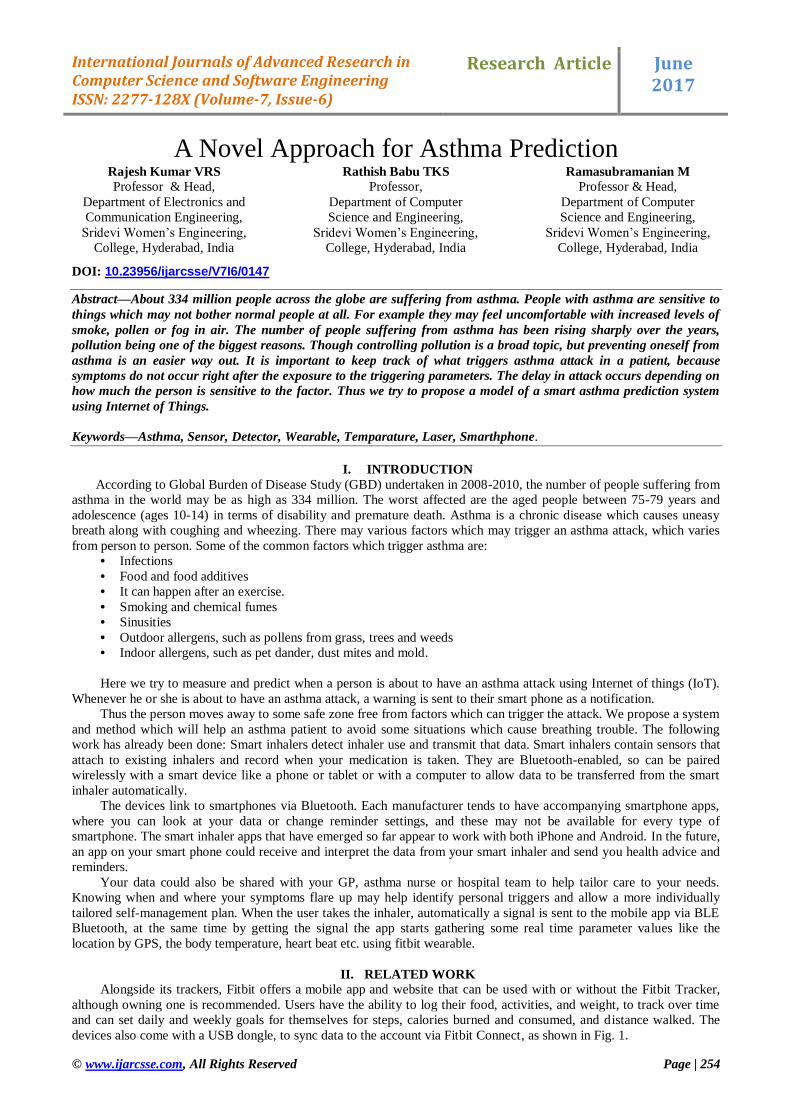
Alongside its trackers, Fitbit offers a mobile app and website that can be used with or without the Fitbit Tracker,
although owning one is recommended. Users have the ability to log their food, activities, and weight, to track over time
and can set daily and weekly goals for themselves for steps, calories burned and consumed, and distance walked. The
devices also come with a USB dongle, to sync data to the account via Fitbit Connect, as shown in Fig. 1.
Rajesh et al., International Journals of Advanced Research in Computer Science and Software Engineering
ISSN: 2277-128X (Volume-7, Issue-6)
© www.ijarcsse.com, All Rights Reserved Page | 255
Fig. 1 Fitbit wearables
If your tracker is paired to the Fitbit app on a mobile device, it syncs every time you open the app. It can also sync
periodically throughout the day if you have All-Day sync turned on. If you sync your tracker with a computer and Fitbit
Connect, it syncs automatically every 15 to 30 minutes assuming the tracker and computer are in proximity, and the
dongle is plugged in, if applicable.The Fitbit app uses Bluetooth Low Energy (BLE) technology to sync with your Fitbit
tracker. To initiate a sync, just open the Fitbit app on your mobile device.
You must have Bluetooth enabled on your mobile device to sync your tracker with the Fitbit app. If you are using
an Android mobile device, you must also have Bluetooth enabled in the Fitbit app. If your mobile device is in airplane
mode, it will not sync with your tracker until you turn off airplane mode, or until you manually turn on Bluetooth on your
mobile device.
Android devices must have both a BLE radio and software support. BLE is an optional component of Bluetooth 4.0,
meaning not all devices with Bluetooth 4.0 include BLE. Some devices have the hardware but not the software, while
others have both but software bugs prevent it from working. You can alter your daily step goal but the feature is slightly
hidden away. You need to open the Fitbit software and then make sure that you have a tile for steps displayed on the
dashboard. If it isn't already, click the small green menu tap at the top left and tick the Steps box. Then, once it's on the
dashboard, click the small gear icon in the bottom left of that tile.
While there's a lot more to the Fitbit Charge than simple step counting, the pedometer skills obviously play a big
part – so you'll want to make sure your walking is being tracked with as much accuracy as possible. The Fitbit Charge 2
main menu shows your steps taken, floors climbed, distance traveled, calories burned, heart rate and real-time exercise
stats on your wrist. Tapping around the tracker's screen on the actual band or the body of the tracker because it's not a
touchscreen - will bring up the different stats. Pressing the button takes you into specific menus where tapping will show
you more options for each.
If you're still not sure what all the tapping does, here's a cheat sheet:
Heart rate - Shows your current heart rate. Tap to switch to your resting heart rate.
Exercise - Tap to move through your exercise choices, then press and hold the button to start the specific
exercises. Press and hold the button again to end the exercise. Options include run, weights, treadmill, workout,
elliptical, bike and interval workout.
Alarms - Tap to scroll through any alarms you've set. Press and hold the button to disable or enable any alarms.
Stopwatch - Press and hold the button to start the stopwatch. Press the button to stop and resume the stopwatch.
Press and hold the button again to reset the stopwatch.
Relax - Tap to choose a guided breathing session. Press and hold the button to start the session.
If one of your main reasons for buying a new fitness tracker was to lose weight then it's obviously important that you
keep an eye on what you eat as well. The Fitbit app allows you to keep track of what you've eaten by logging your meals
and snacks using its built-in food database. The first step is to make sure your Fitbit knows which wrist it's sitting on.
You can select either dominant or non-dominant from within the app. Wearing your Charge on your dominant arm is
fine, but the hardware needs to know so it can adjust its sensitivity to account for the extra motion it will experience
during everyday wearing.
The next step, literally, is to get the stride-length sorted. Your Charge will guess your average length based on your
height and gender but you can guarantee better accuracy by changing this value under Personal Info on the Fitbit web
portal to your exact length. It's simple to measure your accurate length: go to a running track or somewhere that you
know the exact distance of, count your steps as you walk that distance, and then divide the total distance taken by the
number of steps to get your stride length. Fitbit's MobileRun mode uses GPS data to more accurately track your walks
and runs, and also lets you control your music playlists from inside the app. To use MobileRun, go into the app and select
the Exercise from the home screen. Tap the stopwatch in the top right corner and you'll see a map of your location.
Simply hit Start when you're ready to track your run.
Rajesh et al., International Journals of Advanced Research in Computer Science and Software Engineering
ISSN: 2277-128X (Volume-7, Issue-6)
© www.ijarcsse.com, All Rights Reserved Page | 256
The MobileRun feature uses the GPS connectivity of your smartphone to calculate distance, steps, active minutes
and calories burned, and this data overrides your tracker's recordings.Your weekly goal will be set to 70,000 steps by
default but you can now adjust the daily goal to whatever you so wish. And it doesn't have to be steps; you can change it
so the status lights indicate another value such as distance or calories.
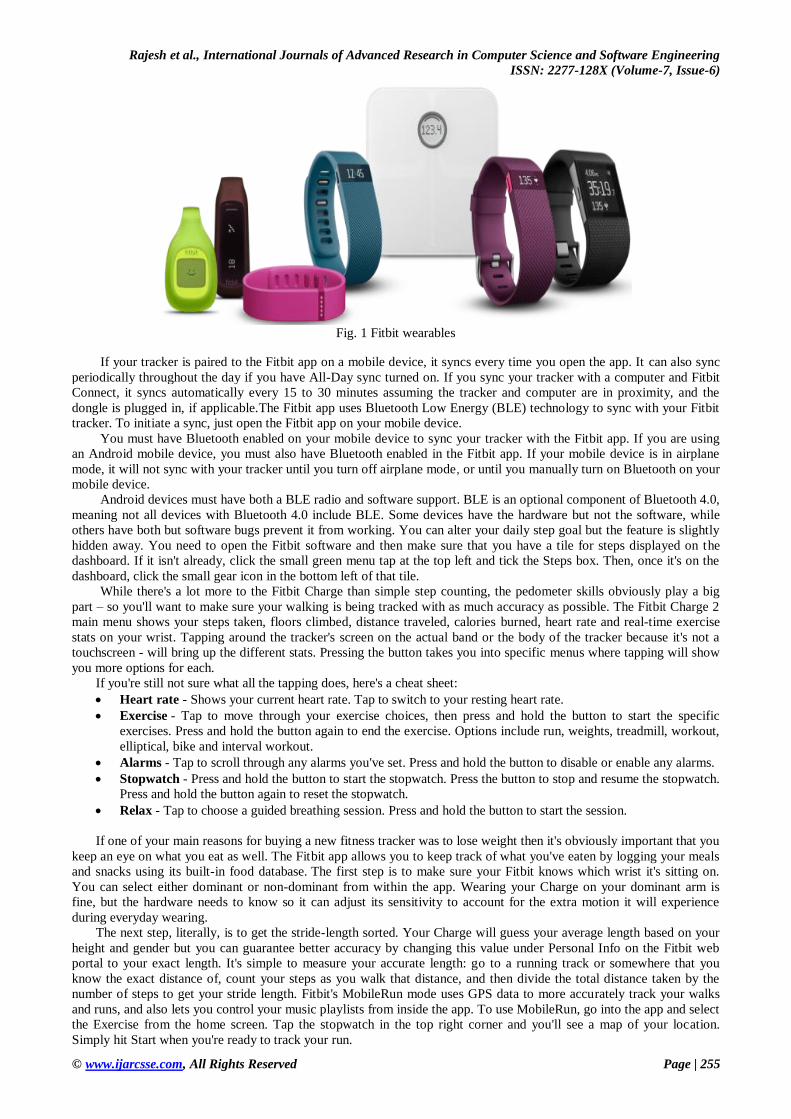
A. Mitsubishi electric sensor
Measuring toxic fumes in the air are often performed by experts and it requires the use of high-quality and costly
equipment. Mitsubishi Electric Corporation announced that it developed a small, high-precision air-quality sensor. This
is the first of its kind to detect all fine particles, even those which are very small to assess.
The new device, which can measure fine air particles no more than 2.5 µm in diameter or PM2.5, can accurately
measure the density or particles as well as other pollutants such as dust and pollen. PM2.5 generates scattered light and
this is measured by the device's double-sided mirror design. It can collect about 1.8 times more scattered light than
traditional single-sided designs. The company's original shape-discrimination algorithm distinguishes between pollen and
dust based on their differences in optical characteristics in the generated scattered light. Particle pollution or particulate
matter (PM) is a mixture of solid particles and liquid droplets in the air. When these particles are smaller than 2.5 µm in
diameter, may pose serious health problems such as respiratory diseases, cardiovascular problems and premature death.
With their small size, they can be inhaled and they can travel deeply into the respiratory tract. Exposure to fine
particles can cause irritation to the eyes, nose, throat and the lungs. For people suffering from an already diagnosed lung
condition like bronchial asthma or chronic obstructive pulmonary disease (COPD), inhalation of fine particles may
aggravate the condition. Mitsubishi Electric has developed a small, high-precision air-quality sensor, claimed to be the
first in the world to detect fine particles measuring no more than 2.5µm in diameter, called PM2.5, as well as pollen and
dust. It also senses the density of particles precisely.
Scattered light from PM2.5 particles is measured with a double-sided mirror design, which is said to collect about
1.8 times more scattered light than conventional single-sided designs. Mitsubishi says its shape-discrimination algorithm
distinguishes between pollen and dust based on the respective differences in the optical characteristics of their scattered
light. Long-term exposure, is associated with problems such as reduced lung function and the development of chronic
bronchitis and even premature death. Short-term exposure to particles (hours or days) can aggravate lung disease, cause
asthma attacks and acute bronchitis, and may also increase susceptibility to respiratory infections. In people with heart
disease, short-term exposure is linked to heart attacks and arrhythmias. Healthy children and adults may experience
temporary minor irritation when particle levels are elevated, as shown in Fig. 2.
Researchers have developed an integrated, wearable system that monitors a user's environment, heart rate and other
physical attributes with the goal of predicting and preventing asthma attacks. The researchers plan to begin testing the
system on a larger subject population this summer. In the energy-efficient smart building, occupancy detection and
localization is an area of increasing interest, as services, such as lighting and ventilation, could be targeted towards
individual occupants instead of an entire room or floor. Also, an increasing quantity and diversity of environmental
sensors are being added to smart buildings to ensure the quality of services provided by the building. The need for
particulate matter (PM) sensors in consumer devices such as air purifiers, is an example where manufacturing advances
have made the sensors much less expensive than laboratory equipment. Beyond their original intended use, air quality,
they can also be used for occupancy monitoring. The work presented in this article proposes to use a low-cost (< 8 USD)
PM sensor to infer the local movement of occupants in a corridor by sensing the resuspension of coarse (≥ 2.5 µm)
particles.
Fig. 2 Mitsubishi electric sensor
B. Health and environmental tracker (het)
The patch has sensors for monitoring movement, heart rate, respiratory rate, the amount of oxygen in the blood, skin
impedance and wheezing in the lungs. The wristband monitors air quality levels like the amount of ozone and volatile
organic compounds in the air and also measure temperature and humidity. The wristband also monitors health data
Rajesh et al., International Journals of Advanced Research in Computer Science and Software Engineering
ISSN: 2277-128X (Volume-7, Issue-6)
© www.ijarcsse.com, All Rights Reserved Page | 257
movement, heart rate and oxygen in the blood. The data from all of the sensors is sent wirelessly to a computer where
software collects and analyzes it. In testing, the sensors have been accurate and the system has successfully compiled the
data of users and their environment. They are working on making the prediction software now so that soon users could
use the system and pair it with their smartphones, getting alerts about their health and environment as they go through
their day and warnings when an attack is coming. The system, called the Health and Environmental Tracker (HET), is
composed of a suite of new sensor devices and was developed by researchers from the National Science Foundation's
Nanosystems Engineering Research Center for Advanced Self-Powered Systems of Integrated Sensors and Technologies
(ASSIST) at North Carolina State University. According to the Centers for Disease Control and Prevention, asthma
affects more than 24 million people in the United States. Asthma patients currently rely on inhalers to deal with their
symptoms, which can include often-debilitating asthma attacks.
―Our goal was to design a wearable system that could track the wellness of the subjects and in particular provide the
infrastructure to predict asthma attacks, so that the users could take steps to prevent them by changing their activities or
environment," says Alper Bozkurt, the principal investigator of a paper describing the work and an assistant professor of
electrical and computer engineering at NC State. "Preventing an attack could be as simple as going indoors or taking a
break from an exercise routine," says James Dieffenderfer, lead author of the paper and a Ph.D. student in the joint
biomedical engineering program at NC State and the University of North Carolina at Chapel Hill.The HET system
incorporates a host of novel sensing devices, which are incorporated into a wristband and a patch that adheres to the
chest.The patch includes sensors that track a patient's movement, heart rate, respiratory rate, the amount of oxygen in the
blood, skin impedance and wheezing in the lungs.The wristband focuses largely on environmental factors, monitoring
volatile organic compounds and ozone in the air, as well as ambient humidity and temperature. The wristband also
includes additional sensors to monitor motion, heart rate and the amount of oxygen in the blood.
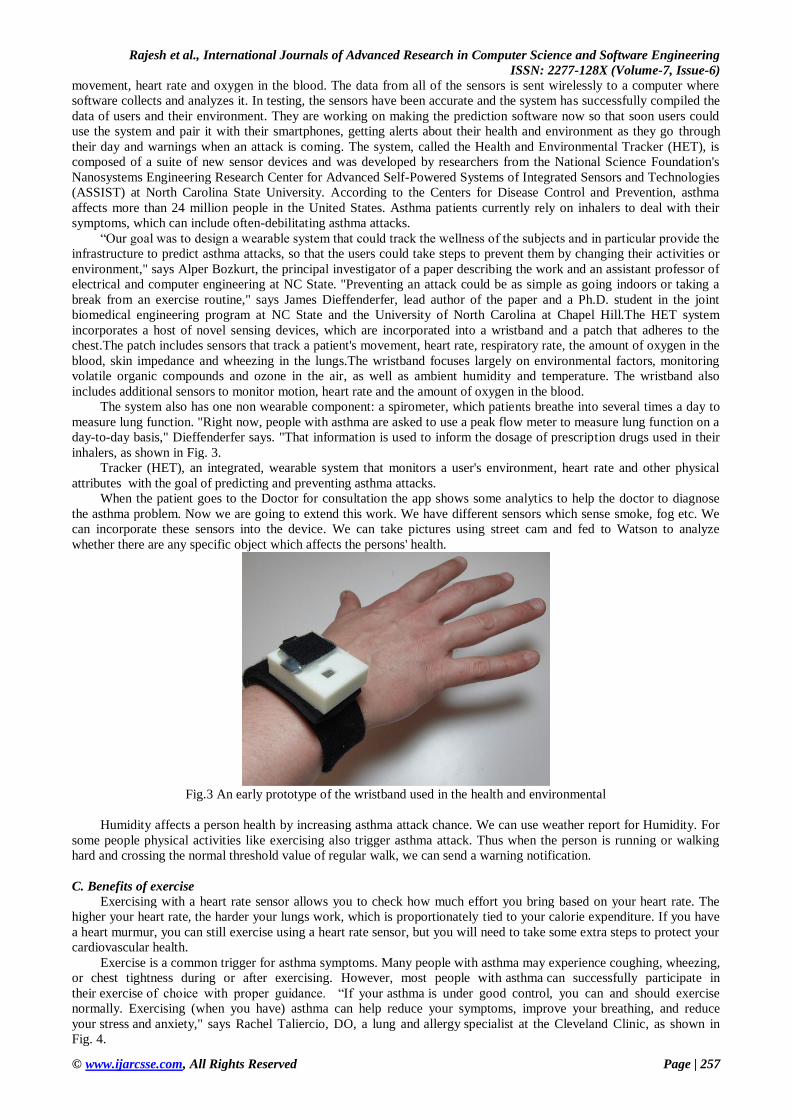
The system also has one non wearable component: a spirometer, which patients breathe into several times a day to
measure lung function. "Right now, people with asthma are asked to use a peak flow meter to measure lung function on a
day-to-day basis," Dieffenderfer says. "That information is used to inform the dosage of prescription drugs used in their
inhalers, as shown in Fig. 3.
Tracker (HET), an integrated, wearable system that monitors a user's environment, heart rate and other physical
attributes with the goal of predicting and preventing asthma attacks.
When the patient goes to the Doctor for consultation the app shows some analytics to help the doctor to diagnose
the asthma problem. Now we are going to extend this work. We have different sensors which sense smoke, fog etc. We
can incorporate these sensors into the device. We can take pictures using street cam and fed to Watson to analyze
whether there are any specific object which affects the persons' health.
Fig.3 An early prototype of the wristband used in the health and environmental
Humidity affects a person health by increasing asthma attack chance. We can use weather report for Humidity. For
some people physical activities like exercising also trigger asthma attack. Thus when the person is running or walking
hard and crossing the normal threshold value of regular walk, we can send a warning notification.
C. Benefits of exercise
Exercising with a heart rate sensor allows you to check how much effort you bring based on your heart rate. The
higher your heart rate, the harder your lungs work, which is proportionately tied to your calorie expenditure. If you have
a heart murmur, you can still exercise using a heart rate sensor, but you will need to take some extra steps to protect your
cardiovascular health.
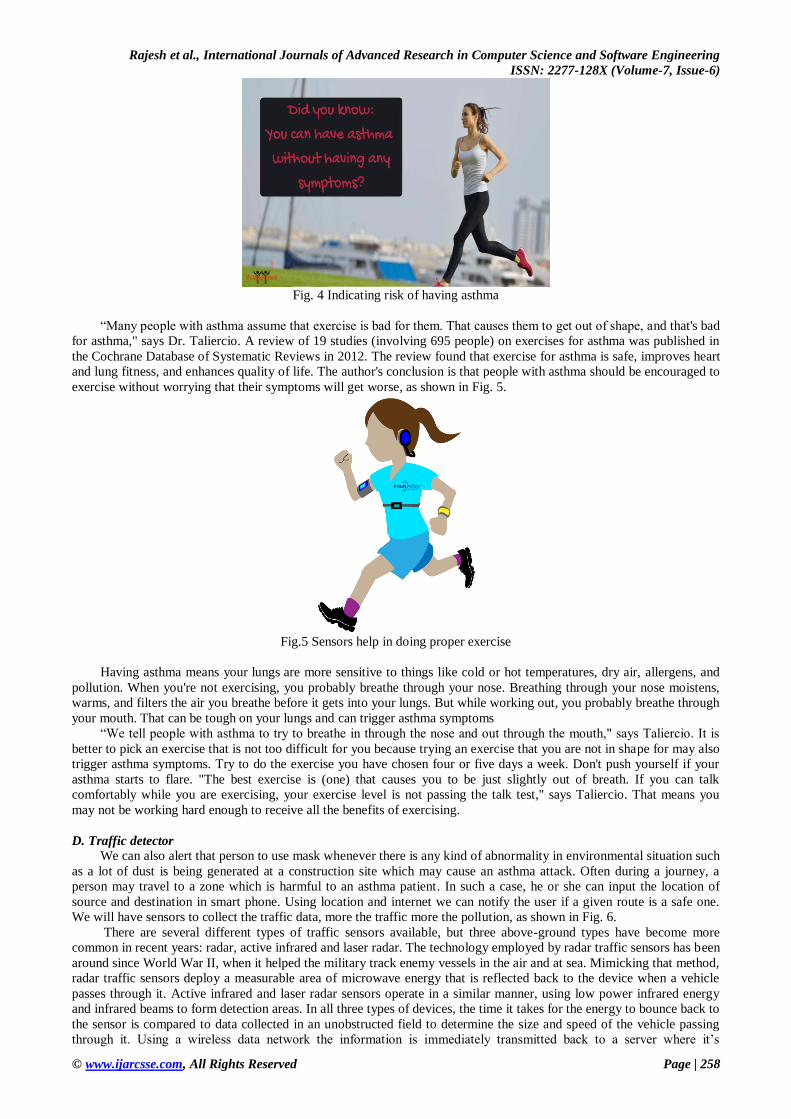
Exercise is a common trigger for asthma symptoms. Many people with asthma may experience coughing, wheezing,
or chest tightness during or after exercising. However, most people with asthma can successfully participate in
their exercise of choice with proper guidance. ―If your asthma is under good control, you can and should exercise
normally. Exercising (when you have) asthma can help reduce your symptoms, improve your breathing, and reduce
your stress and anxiety," says Rachel Taliercio, DO, a lung and allergy specialist at the Cleveland Clinic, as shown in
Fig. 4.
Rajesh et al., International Journals of Advanced Research in Computer Science and Software Engineering
ISSN: 2277-128X (Volume-7, Issue-6)
© www.ijarcsse.com, All Rights Reserved Page | 258
Fig. 4 Indicating risk of having asthma
―Many people with asthma assume that exercise is bad for them. That causes them to get out of shape, and that's bad
for asthma," says Dr. Taliercio. A review of 19 studies (involving 695 people) on exercises for asthma was published in
the Cochrane Database of Systematic Reviews in 2012. The review found that exercise for asthma is safe, improves heart
and lung fitness, and enhances quality of life. The author's conclusion is that people with asthma should be encouraged to
exercise without worrying that their symptoms will get worse, as shown in Fig. 5.
Fig.5 Sensors help in doing proper exercise
Having asthma means your lungs are more sensitive to things like cold or hot temperatures, dry air, allergens, and
pollution. When you're not exercising, you probably breathe through your nose. Breathing through your nose moistens,
warms, and filters the air you breathe before it gets into your lungs. But while working out, you probably breathe through
your mouth. That can be tough on your lungs and can trigger asthma symptoms
―We tell people with asthma to try to breathe in through the nose and out through the mouth," says Taliercio. It is
better to pick an exercise that is not too difficult for you because trying an exercise that you are not in shape for may also
trigger asthma symptoms. Try to do the exercise you have chosen four or five days a week. Don't push yourself if your
asthma starts to flare. "The best exercise is (one) that causes you to be just slightly out of breath. If you can talk
comfortably while you are exercising, your exercise level is not passing the talk test," says Taliercio. That means you
may not be working hard enough to receive all the benefits of exercising.
D. Traffic detector
We can also alert that person to use mask whenever there is any kind of abnormality in environmental situation such
as a lot of dust is being generated at a construction site which may cause an asthma attack. Often during a journey, a
person may travel to a zone which is harmful to an asthma patient. In such a case, he or she can input the location of
source and destination in smart phone. Using location and internet we can notify the user if a given route is a safe one.
We will have sensors to collect the traffic data, more the traffic more the pollution, as shown in Fig. 6.
There are several different types of traffic sensors available, but three above-ground types have become more
common in recent years: radar, active infrared and laser radar. The technology employed by radar traffic sensors has been
around since World War II, when it helped the military track enemy vessels in the air and at sea. Mimicking that method,
radar traffic sensors deploy a measurable area of microwave energy that is reflected back to the device when a vehicle
passes through it. Active infrared and laser radar sensors operate in a similar manner, using low power infrared energy
and infrared beams to form detection areas. In all three types of devices, the time it takes for the energy to bounce back to
the sensor is compared to data collected in an unobstructed field to determine the size and speed of the vehicle passing
through it. Using a wireless data network the information is immediately transmitted back to a server where it’s
Rajesh et al., International Journals of Advanced Research in Computer Science and Software Engineering
ISSN: 2277-128X (Volume-7, Issue-6)
© www.ijarcsse.com, All Rights Reserved Page | 259
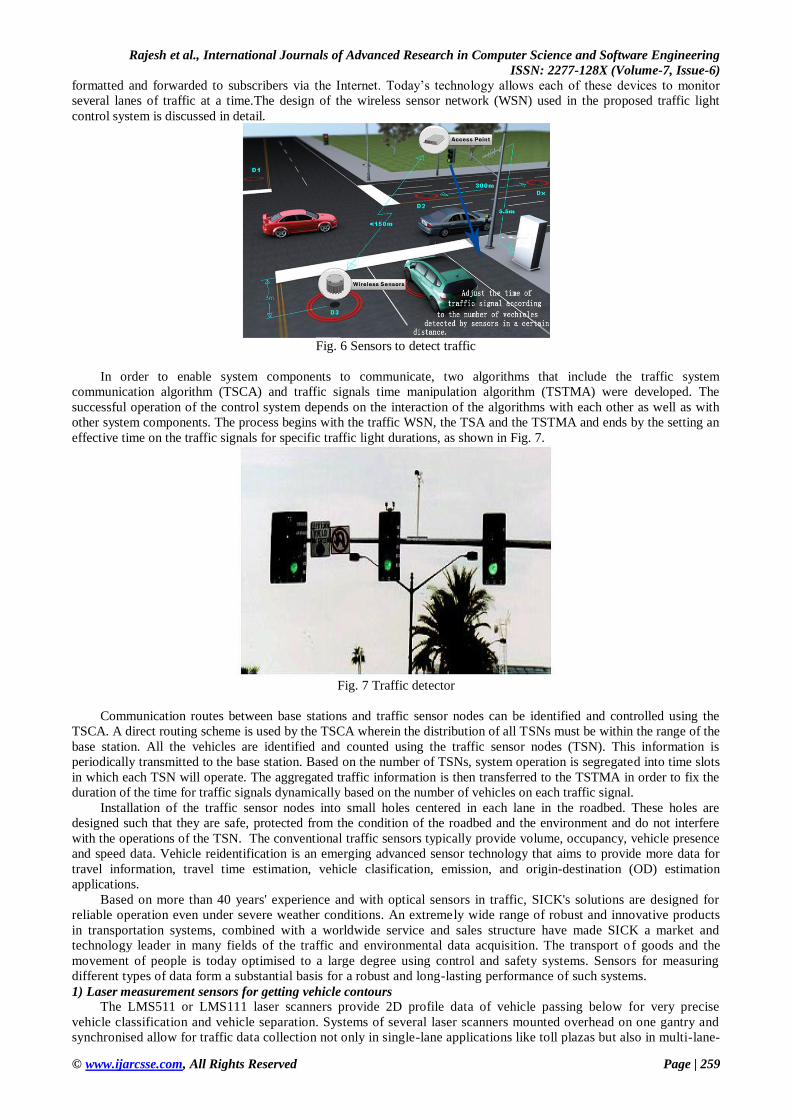
formatted and forwarded to subscribers via the Internet. Today’s technology allows each of these devices to monitor
several lanes of traffic at a time.The design of the wireless sensor network (WSN) used in the proposed traffic light
control system is discussed in detail.
Fig. 6 Sensors to detect traffic
In order to enable system components to communicate, two algorithms that include the traffic system
communication algorithm (TSCA) and traffic signals time manipulation algorithm (TSTMA) were developed. The
successful operation of the control system depends on the interaction of the algorithms with each other as well as with
other system components. The process begins with the traffic WSN, the TSA and the TSTMA and ends by the setting an
effective time on the traffic signals for specific traffic light durations, as shown in Fig. 7.
Fig. 7 Traffic detector
Communication routes between base stations and traffic sensor nodes can be identified and controlled using the
TSCA. A direct routing scheme is used by the TSCA wherein the distribution of all TSNs must be within the range of the
base station. All the vehicles are identified and counted using the traffic sensor nodes (TSN). This information is
periodically transmitted to the base station. Based on the number of TSNs, system operation is segregated into time slots
in which each TSN will operate. The aggregated traffic information is then transferred to the TSTMA in order to fix the
duration of the time for traffic signals dynamically based on the number of vehicles on each traffic signal.
Installation of the traffic sensor nodes into small holes centered in each lane in the roadbed. These holes are
designed such that they are safe, protected from the condition of the roadbed and the environment and do not interfere
with the operations of the TSN. The conventional traffic sensors typically provide volume, occupancy, vehicle presence
and speed data. Vehicle reidentification is an emerging advanced sensor technology that aims to provide more data for
travel information, travel time estimation, vehicle clasification, emission, and origin-destination (OD) estimation
applications.
Based on more than 40 years' experience and with optical sensors in traffic, SICK's solutions are designed for
reliable operation even under severe weather conditions. An extremely wide range of robust and innovative products
in transportation systems, combined with a worldwide service and sales structure have made SICK a market and
technology leader in many fields of the traffic and environmental data acquisition. The transport o f goods and the
movement of people is today optimised to a large degree using control and safety systems. Sensors for measuring
different types of data form a substantial basis for a robust and long-lasting performance of such systems.
1) Laser measurement sensors for getting vehicle contours
The LMS511 or LMS111 laser scanners provide 2D profile data of vehicle passing below for very precise
vehicle classification and vehicle separation. Systems of several laser scanners mounted overhead on one gantry and
synchronised allow for traffic data collection not only in single-lane applications like toll plazas but also in multi-lane-
Rajesh et al., International Journals of Advanced Research in Computer Science and Software Engineering
ISSN: 2277-128X (Volume-7, Issue-6)
© www.ijarcsse.com, All Rights Reserved Page | 260
free-flow (MLFF) traffic. The same laser scanners can also be used for red light and speed enforcement. Furthermore,
laser scanners of this kind, could be used for monitoring dangerous areas at level crossings.
2) Laser measurement systems for vehicle classification
The Traffic Information Collector (TIC) is an integrated traffic measurement system that is based on SICK laser
measurement technology, a technology that is used in thousands of traffic applications worldwide. The TIC102 AC
Pro is especially designed for multi-lane, free-flow applications such as tolling enforcement and traffic management.
The proven TIC102 (traffic information collector) profiling system has been supplemented with an additional laser
scanner for performing axle counting. The extended data record provides increased classification accuracy and
reliably determines and outputs the number of axles. Axle counting works in free-flowing traffic and stop-and-go
situations, day and night. All information can be accessed via a TCP interface or stored on the system and retrieved
for post-processing via FTP. The graphical installation wizard and various self-tests allow easy and economical
commissioning.
The system also functions in stop-and-go situations. Through a highly innovative configuration wizard that
includes a live 3D view of the traffic, installation of a multi-lane gantry is quick and easy. The system auto calibrates
in moving traffic and can be accessed remotely for maintenance. A software trigger increases the detection rate and
reading accuracy of third-party systems such as number plate recognition cameras and DSRC antennas. Additional
information such as vehicle speed and dimension are transmitted over the TCP interface.
3) Light grids for vehicle classification and separation
The sunlight-proof XLG light curtains are used at toll stations on single lanes. The resolution (distance between
two adjacent beams) is typically 30mm. Data from each beam is transmitted via serial interface. From this data, the
vehicle class, front / rear end and the number of axles can be derived easily with high accuracy.
4) Vehicle dimensioning for detecting hazardous loads
While a vehicle passes the profiler, the vehicle outside dimensions are measured with laser scanners. A three-
dimensional model of the vehicle can be produced for further inspection. This allows the user to easily identify
hazards such as load displacement and oversized loads and to take appropriate action. After driving through the
gantries and with the use of critical values, the measurement data is given out on the TCP interface. For safety on our
roads and for the protection of traffic infrastructure, particularly in tunnels, the monitoring of vehicle external
dimensions is becoming increasingly important.
So in such situations the user will receive a warning not to take a route where there is too much smoke produced
due to prolonged traffic jam. Source and Destination path of patients or end user. We can assume that a person travel
from point A to point H (see fig-2.4). We can define this path as an input in our application:
By analyzing regular activities of that person via mobile GPS tracker.
Put manually source and destination path in application.
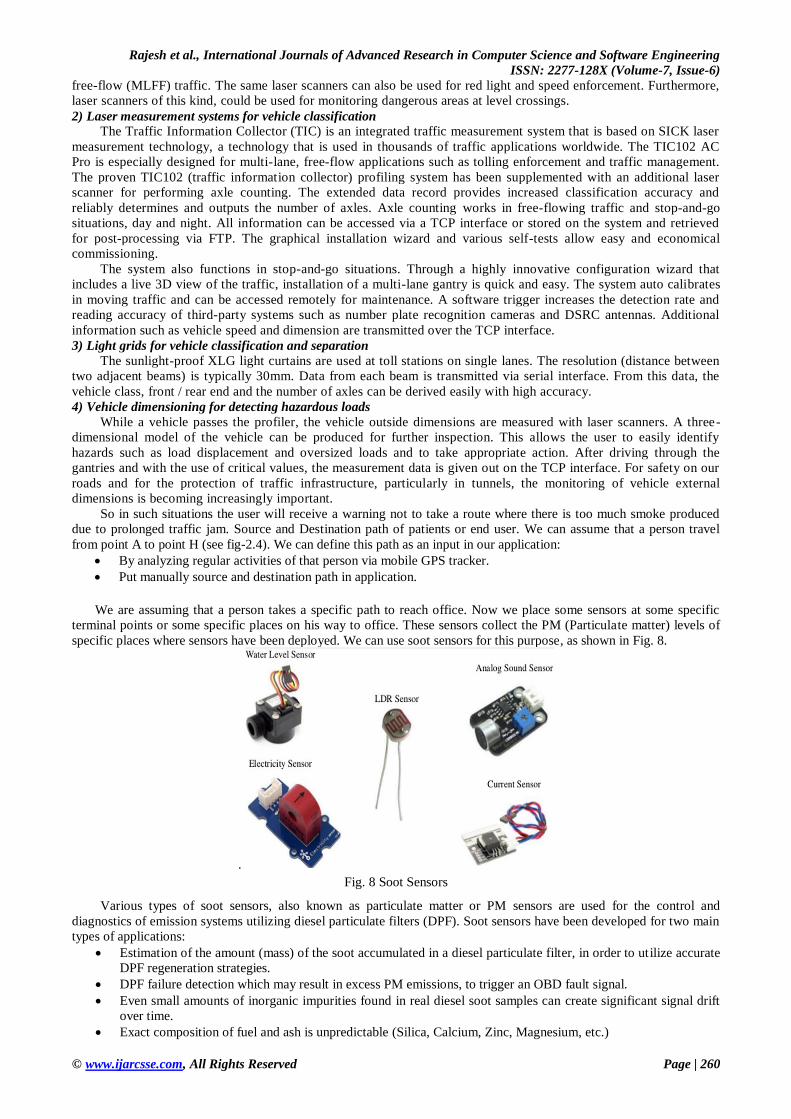
We are assuming that a person takes a specific path to reach office. Now we place some sensors at some specific
terminal points or some specific places on his way to office. These sensors collect the PM (Particulate matter) levels of
specific places where sensors have been deployed. We can use soot sensors for this purpose, as shown in Fig. 8.
.
Fig. 8 Soot Sensors
Various types of soot sensors, also known as particulate matter or PM sensors are used for the control and
diagnostics of emission systems utilizing diesel particulate filters (DPF). Soot sensors have been developed for two main
types of applications:
Estimation of the amount (mass) of the soot accumulated in a diesel particulate filter, in order to utilize accurate
DPF regeneration strategies.
DPF failure detection which may result in excess PM emissions, to trigger an OBD fault signal.
Even small amounts of inorganic impurities found in real diesel soot samples can create significant signal drift
over time.
Exact composition of fuel and ash is unpredictable (Silica, Calcium, Zinc, Magnesium, etc.)
Rajesh et al., International Journals of Advanced Research in Computer Science and Software Engineering
ISSN: 2277-128X (Volume-7, Issue-6)
© www.ijarcsse.com, All Rights Reserved Page | 261
An accurate estimate of a DPF soot mass allows devising a proper regeneration strategy (how often, when to start or
stop a regeneration), while inaccurate estimates result in unsuitable regeneration timing. If the soot mass is over-
estimated, too-frequent (excessive) regenerations take place, resulting in unnecessary fuel consumption penalty and rapid
system wear-out, amongst other adverse effects. Conversely, under-estimating a DPF soot mass may cause excessive
regeneration exotherms inside a DPF, inducing rapid aging, washcoat loss or DPF deterioration, or even a total DPF
failure. The other area of soot sensor application has been driven by advances in OBD regulations, especially those
adopted by the California ARB/US EPA, as well as by the EU OBD requirements. These OBD regulations demand more
diagnostic measures of the emission system, such as monitoring the DPF filtration efficiency and tailpipe PM emissions.
While US emission standards are expressed in terms of particle mass, European regulations (Euro 5 & Euro VI)
additionally include particle number (PN) limits applicable to diesel and GDI vehicles. Therefore, it may be desirable that
sensors for EU applications be also capable of PN emission monitoring.
Various technology approaches have been employed to devise soot sensors for the above applications—DPF soot
load estimation, DPF failure monitoring and PN emission monitoring. Based on the type of the sensing technology, soot
sensors may be divided into four main types:
Differential pressure (Delta-P)—The DPF soot load is estimated from the increase in the filter pressure drop.
Radio frequency (RF)—The DPF load is calculated based on the absorption of a microwave signal by soot
accumulated in the filter.
Accumulating electrode—A DPF failure is detected by measuring a change of electrical properties of an
electrode due to a time-dependent soot deposition. Resistance is the electrical property most commonly used,
and the corresponding devices are often called resistive electrode sensors or simply resistive sensors.
Commercially-available accumulators: Include risk of warranty issues (false + and -) Questionable if they meet
present requirements. Unlikely to meet requirements beyond 2016. But only option for near term. Real time PMTrac®
sensors show promise in simplicity, resolution, and durability. If the author formed enforcement policy, OBD DPF
failure detection via direct measurement of PM would not be mandated until reliability of sensors was proven.
In a vehicle equipped with a diesel particulate filter, particulate matter (PM) is created during the combustion
process and captured in the vehicle’s exhaust system by the diesel particulate filter. Delphi’s new Particulate Matter
Sensor helps detect leakage in the diesel particulate filter to meet system diagnostic standards. The patented sensor
combines fast response and high sensitivity with simplicity of design and self-diagnostic features. It is an affordable
sensing technology that offers manufacturers a low cost system integration path.
ELISA is a protein based method which involves the proteins being extracted from the sample and added to the
ELISA kit. A Sandwich ELISA is often used for allergen detection. The basic principle for this test is the binding of the
allergenic protein in the sample to the wells in the kit; any unbound proteins are removed. A particular colour is formed
after the addition of a chemical and with Sandwich ELISAs the greater the intensity of the colour, the greater the
concentration of allergen in the sample. Quantification can be made by comparing the intensity of the colour with
standards of known concentrations of allergens.
This technique identifies the presence of the allergenic protein through its molecular mass by measuring the mass to
charge ratio of the ions. This method is not limited to one allergen per analysis.
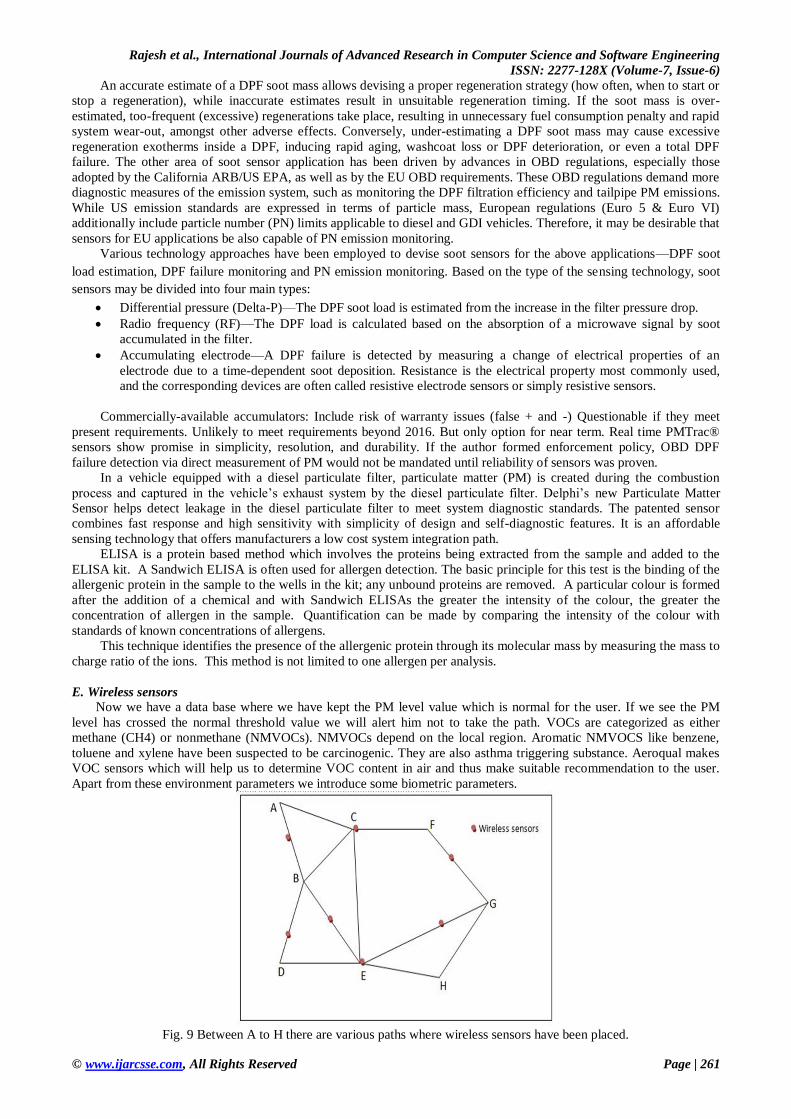
E. Wireless sensors
Now we have a data base where we have kept the PM level value which is normal for the user. If we see the PM
level has crossed the normal threshold value we will alert him not to take the path. VOCs are categorized as either
methane (CH4) or nonmethane (NMVOCs). NMVOCs depend on the local region. Aromatic NMVOCS like benzene,
toluene and xylene have been suspected to be carcinogenic. They are also asthma triggering substance. Aeroqual makes
VOC sensors which will help us to determine VOC content in air and thus make suitable recommendation to the user.
Apart from these environment parameters we introduce some biometric parameters.
Fig. 9 Between A to H there are various paths where wireless sensors have been placed.
Rajesh et al., International Journals of Advanced Research in Computer Science and Software Engineering
ISSN: 2277-128X (Volume-7, Issue-6)
© www.ijarcsse.com, All Rights Reserved Page | 262
It may happen that the user may unknowingly enter an environment which can trigger asthma attack. In such a
situation, the user will initially have irregular breathing pattern. For such a situation Spire can be used to monitor his
breathing pattern and warn him accordingly to leave the place, as shown in Fig. 9.
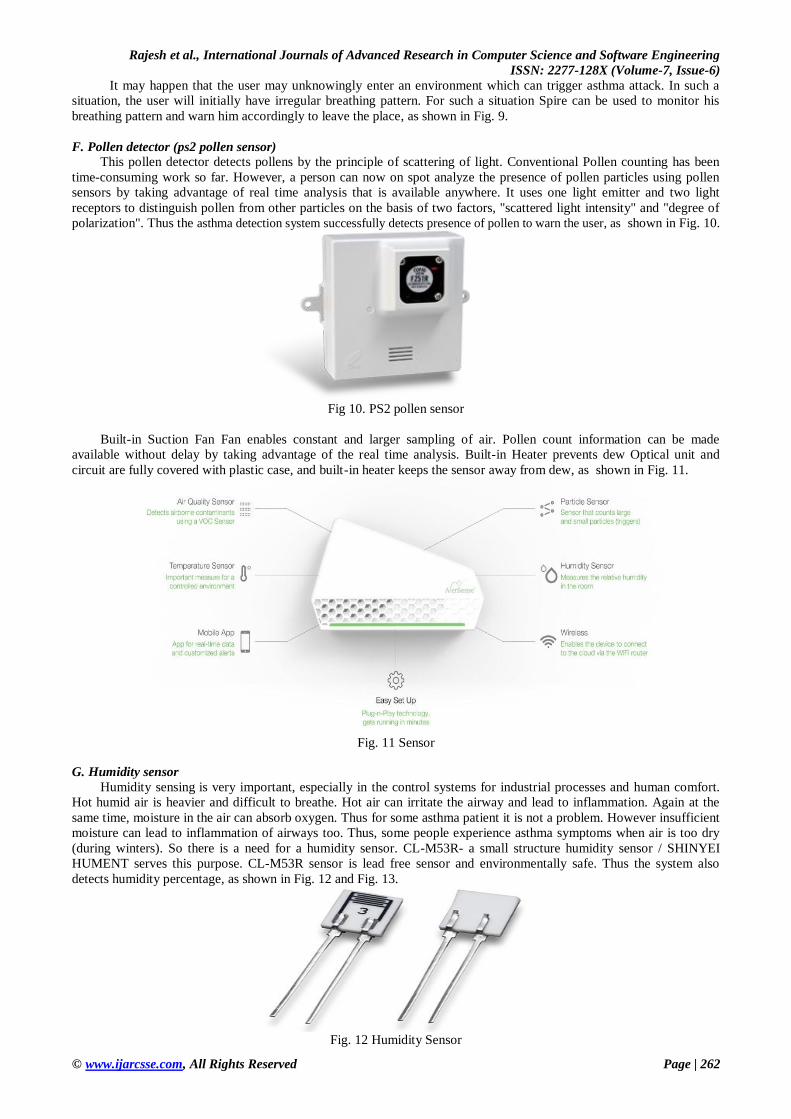
F. Pollen detector (ps2 pollen sensor)
This pollen detector detects pollens by the principle of scattering of light. Conventional Pollen counting has been
time-consuming work so far. However, a person can now on spot analyze the presence of pollen particles using pollen
sensors by taking advantage of real time analysis that is available anywhere. It uses one light emitter and two light
receptors to distinguish pollen from other particles on the basis of two factors, "scattered light intensity" and "degree of
polarization". Thus the asthma detection system successfully detects presence of pollen to warn the user, as shown in Fig. 10.
Fig 10. PS2 pollen sensor
Built-in Suction Fan Fan enables constant and larger sampling of air. Pollen count information can be made
available without delay by taking advantage of the real time analysis. Built-in Heater prevents dew Optical unit and
circuit are fully covered with plastic case, and built-in heater keeps the sensor away from dew, as shown in Fig. 11.
Fig. 11 Sensor
G. Humidity sensor
Humidity sensing is very important, especially in the control systems for industrial processes and human comfort.
Hot humid air is heavier and difficult to breathe. Hot air can irritate the airway and lead to inflammation. Again at the
same time, moisture in the air can absorb oxygen. Thus for some asthma patient it is not a problem. However insufficient
moisture can lead to inflammation of airways too. Thus, some people experience asthma symptoms when air is too dry
(during winters). So there is a need for a humidity sensor. CL-M53R- a small structure humidity sensor / SHINYEI
HUMENT serves this purpose. CL-M53R sensor is lead free sensor and environmentally safe. Thus the system also
detects humidity percentage, as shown in Fig. 12 and Fig. 13.
Fig. 12 Humidity Sensor
Rajesh et al., International Journals of Advanced Research in Computer Science and Software Engineering
ISSN: 2277-128X (Volume-7, Issue-6)
© www.ijarcsse.com, All Rights Reserved Page | 263
Fig. 13 Weather detector
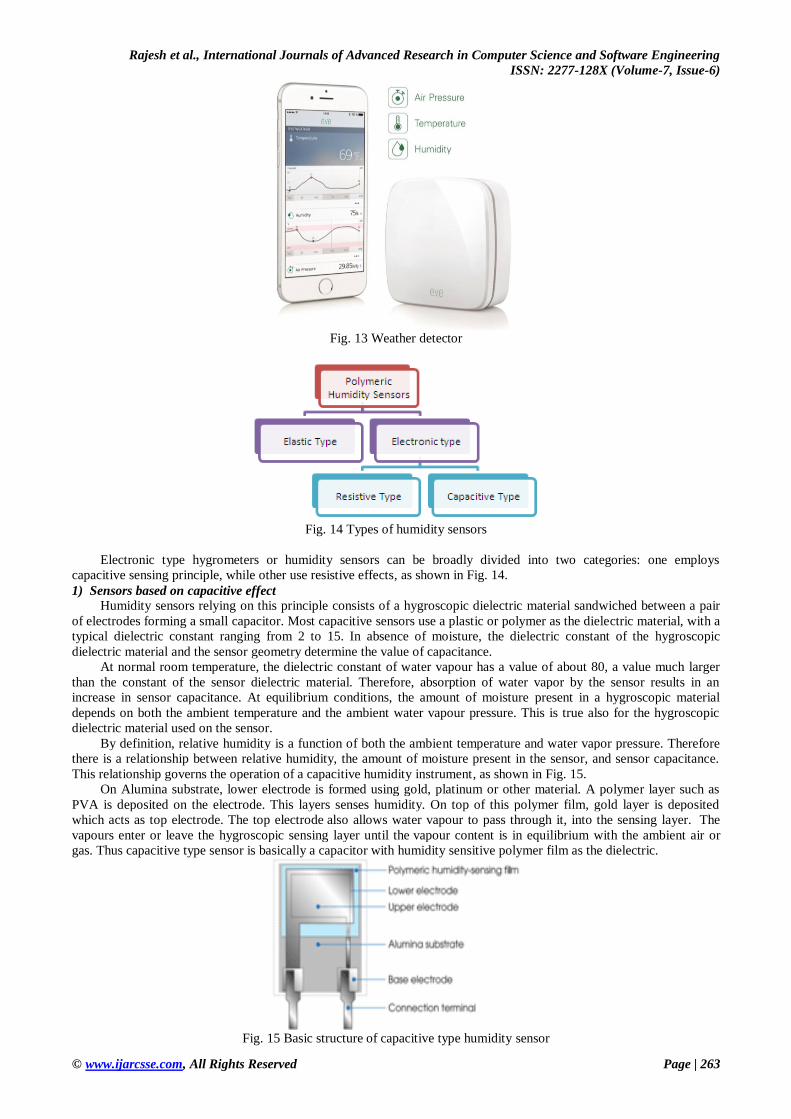
Fig. 14 Types of humidity sensors
Electronic type hygrometers or humidity sensors can be broadly divided into two categories: one employs
capacitive sensing principle, while other use resistive effects, as shown in Fig. 14.
1) Sensors based on capacitive effect
Humidity sensors relying on this principle consists of a hygroscopic dielectric material sandwiched between a pair
of electrodes forming a small capacitor. Most capacitive sensors use a plastic or polymer as the dielectric material, with a
typical dielectric constant ranging from 2 to 15. In absence of moisture, the dielectric constant of the hygroscopic
dielectric material and the sensor geometry determine the value of capacitance.
At normal room temperature, the dielectric constant of water vapour has a value of about 80, a value much larger
than the constant of the sensor dielectric material. Therefore, absorption of water vapor by the sensor results in an
increase in sensor capacitance. At equilibrium conditions, the amount of moisture present in a hygroscopic material
depends on both the ambient temperature and the ambient water vapour pressure. This is true also for the hygroscopic
dielectric material used on the sensor.
By definition, relative humidity is a function of both the ambient temperature and water vapor pressure. Therefore
there is a relationship between relative humidity, the amount of moisture present in the sensor, and sensor capacitance.
This relationship governs the operation of a capacitive humidity instrument, as shown in Fig. 15.
On Alumina substrate, lower electrode is formed using gold, platinum or other material. A polymer layer such as
PVA is deposited on the electrode. This layers senses humidity. On top of this polymer film, gold layer is deposited
which acts as top electrode. The top electrode also allows water vapour to pass through it, into the sensing layer. The
vapours enter or leave the hygroscopic sensing layer until the vapour content is in equilibrium with the ambient air or
gas. Thus capacitive type sensor is basically a capacitor with humidity sensitive polymer film as the dielectric.
Fig. 15 Basic structure of capacitive type humidity sensor
Rajesh et al., International Journals of Advanced Research in Computer Science and Software Engineering
ISSN: 2277-128X (Volume-7, Issue-6)
© www.ijarcsse.com, All Rights Reserved Page | 264
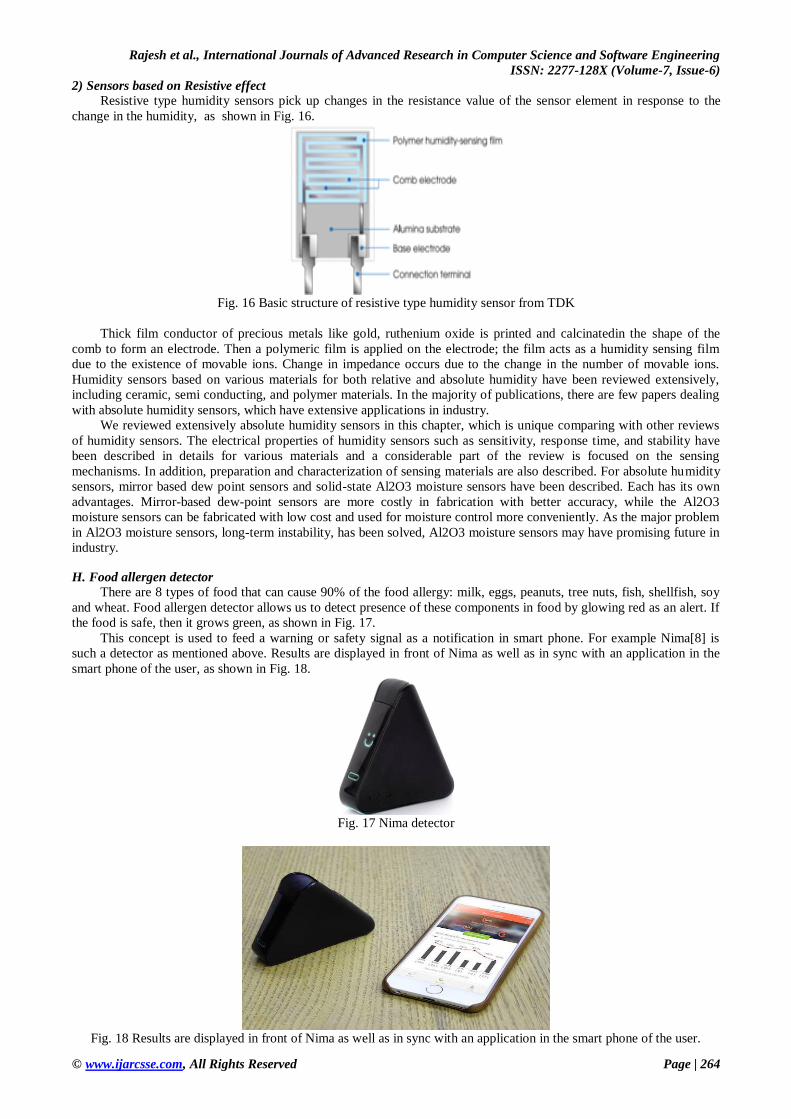
2) Sensors based on Resistive effect
Resistive type humidity sensors pick up changes in the resistance value of the sensor element in response to the
change in the humidity, as shown in Fig. 16.
Fig. 16 Basic structure of resistive type humidity sensor from TDK
Thick film conductor of precious metals like gold, ruthenium oxide is printed and calcinatedin the shape of the
comb to form an electrode. Then a polymeric film is applied on the electrode; the film acts as a humidity sensing film
due to the existence of movable ions. Change in impedance occurs due to the change in the number of movable ions.
Humidity sensors based on various materials for both relative and absolute humidity have been reviewed extensively,
including ceramic, semi conducting, and polymer materials. In the majority of publications, there are few papers dealing
with absolute humidity sensors, which have extensive applications in industry.
We reviewed extensively absolute humidity sensors in this chapter, which is unique comparing with other reviews
of humidity sensors. The electrical properties of humidity sensors such as sensitivity, response time, and stability have
been described in details for various materials and a considerable part of the review is focused on the sensing
mechanisms. In addition, preparation and characterization of sensing materials are also described. For absolute humidity
sensors, mirror based dew point sensors and solid-state Al2O3 moisture sensors have been described. Each has its own
advantages. Mirror-based dew-point sensors are more costly in fabrication with better accuracy, while the Al2O3
moisture sensors can be fabricated with low cost and used for moisture control more conveniently. As the major problem
in Al2O3 moisture sensors, long-term instability, has been solved, Al2O3 moisture sensors may have promising future in
industry.
H. Food allergen detector
There are 8 types of food that can cause 90% of the food allergy: milk, eggs, peanuts, tree nuts, fish, shellfish, soy
and wheat. Food allergen detector allows us to detect presence of these components in food by glowing red as an alert. If
the food is safe, then it grows green, as shown in Fig. 17.
This concept is used to feed a warning or safety signal as a notification in smart phone. For example Nima[8] is
such a detector as mentioned above. Results are displayed in front of Nima as well as in sync with an application in the
smart phone of the user, as shown in Fig. 18.
Fig. 17 Nima detector
Fig. 18 Results are displayed in front of Nima as well as in sync with an application in the smart phone of the user.
Rajesh et al., International Journals of Advanced Research in Computer Science and Software Engineering
ISSN: 2277-128X (Volume-7, Issue-6)
© www.ijarcsse.com, All Rights Reserved Page | 265
III. ARCHITECTURE
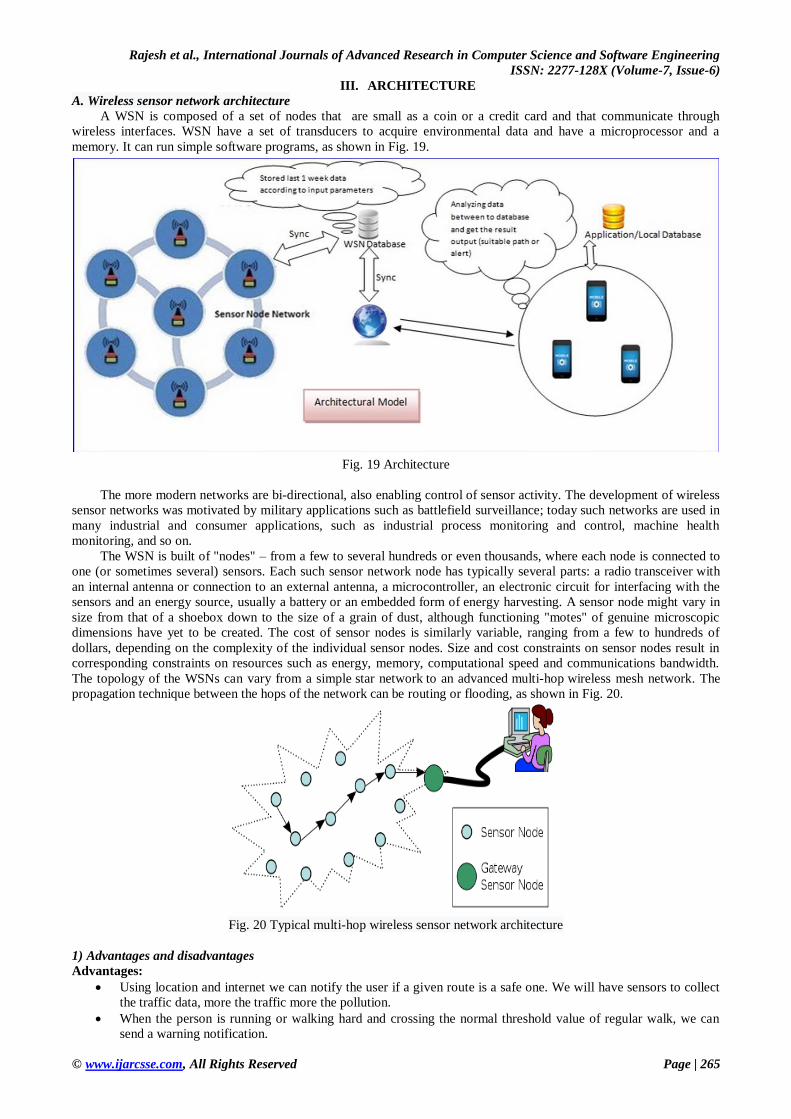
A. Wireless sensor network architecture
A WSN is composed of a set of nodes that are small as a coin or a credit card and that communicate through
wireless interfaces. WSN have a set of transducers to acquire environmental data and have a microprocessor and a
memory. It can run simple software programs, as shown in Fig. 19.
Fig. 19 Architecture
The more modern networks are bi-directional, also enabling control of sensor activity. The development of wireless
sensor networks was motivated by military applications such as battlefield surveillance; today such networks are used in
many industrial and consumer applications, such as industrial process monitoring and control, machine health
monitoring, and so on.
The WSN is built of "nodes" – from a few to several hundreds or even thousands, where each node is connected to
one (or sometimes several) sensors. Each such sensor network node has typically several parts: a radio transceiver with
an internal antenna or connection to an external antenna, a microcontroller, an electronic circuit for interfacing with the
sensors and an energy source, usually a battery or an embedded form of energy harvesting. A sensor node might vary in
size from that of a shoebox down to the size of a grain of dust, although functioning "motes" of genuine microscopic
dimensions have yet to be created. The cost of sensor nodes is similarly variable, ranging from a few to hundreds of
dollars, depending on the complexity of the individual sensor nodes. Size and cost constraints on sensor nodes result in
corresponding constraints on resources such as energy, memory, computational speed and communications bandwidth.
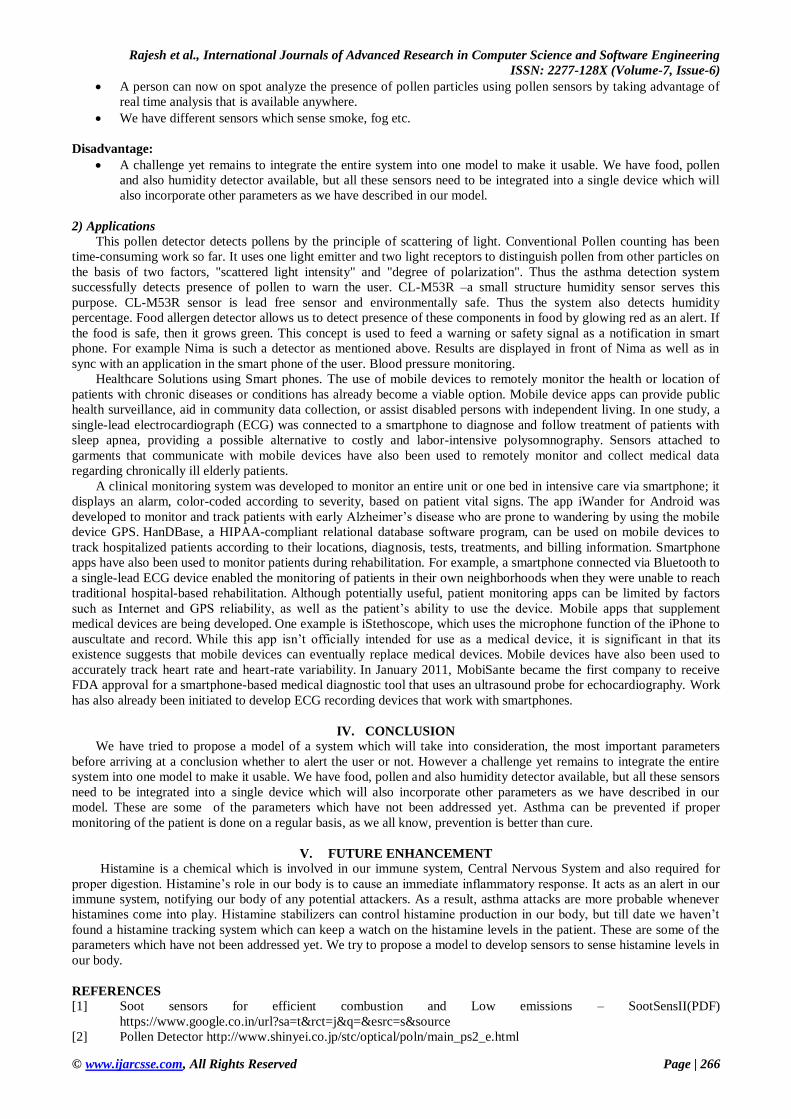
The topology of the WSNs can vary from a simple star network to an advanced multi-hop wireless mesh network. The
propagation technique between the hops of the network can be routing or flooding, as shown in Fig. 20.
Fig. 20 Typical multi-hop wireless sensor network architecture
1) Advantages and disadvantages
Advantages:
Using location and internet we can notify the user if a given route is a safe one. We will have sensors to collect
the traffic data, more the traffic more the pollution.
When the person is running or walking hard and crossing the normal threshold value of regular walk, we can
send a warning notification.
Rajesh et al., International Journals of Advanced Research in Computer Science and Software Engineering
ISSN: 2277-128X (Volume-7, Issue-6)
© www.ijarcsse.com, All Rights Reserved Page | 266
A person can now on spot analyze the presence of pollen particles using pollen sensors by taking advantage of
real time analysis that is available anywhere.
We have different sensors which sense smoke, fog etc.
Disadvantage:
A challenge yet remains to integrate the entire system into one model to make it usable. We have food, pollen
and also humidity detector available, but all these sensors need to be integrated into a single device which will
also incorporate other parameters as we have described in our model.
2) Applications
This pollen detector detects pollens by the principle of scattering of light. Conventional Pollen counting has been
time-consuming work so far. It uses one light emitter and two light receptors to distinguish pollen from other particles on
the basis of two factors, "scattered light intensity" and "degree of polarization". Thus the asthma detection system
successfully detects presence of pollen to warn the user. CL-M53R –a small structure humidity sensor serves this
purpose. CL-M53R sensor is lead free sensor and environmentally safe. Thus the system also detects humidity
percentage. Food allergen detector allows us to detect presence of these components in food by glowing red as an alert. If
the food is safe, then it grows green. This concept is used to feed a warning or safety signal as a notification in smart
phone. For example Nima is such a detector as mentioned above. Results are displayed in front of Nima as well as in
sync with an application in the smart phone of the user. Blood pressure monitoring.
Healthcare Solutions using Smart phones. The use of mobile devices to remotely monitor the health or location of
patients with chronic diseases or conditions has already become a viable option. Mobile device apps can provide public
health surveillance, aid in community data collection, or assist disabled persons with independent living. In one study, a
single-lead electrocardiograph (ECG) was connected to a smartphone to diagnose and follow treatment of patients with
sleep apnea, providing a possible alternative to costly and labor-intensive polysomnography. Sensors attached to
garments that communicate with mobile devices have also been used to remotely monitor and collect medical data
regarding chronically ill elderly patients.
A clinical monitoring system was developed to monitor an entire unit or one bed in intensive care via smartphone; it
displays an alarm, color-coded according to severity, based on patient vital signs. The app iWander for Android was
developed to monitor and track patients with early Alzheimer’s disease who are prone to wandering by using the mobile
device GPS. HanDBase, a HIPAA-compliant relational database software program, can be used on mobile devices to
track hospitalized patients according to their locations, diagnosis, tests, treatments, and billing information. Smartphone
apps have also been used to monitor patients during rehabilitation. For example, a smartphone connected via Bluetooth to
a single-lead ECG device enabled the monitoring of patients in their own neighborhoods when they were unable to reach
traditional hospital-based rehabilitation. Although potentially useful, patient monitoring apps can be limited by factors
such as Internet and GPS reliability, as well as the patient’s ability to use the device. Mobile apps that supplement
medical devices are being developed. One example is iStethoscope, which uses the microphone function of the iPhone to
auscultate and record. While this app isn’t officially intended for use as a medical device, it is significant in that its
existence suggests that mobile devices can eventually replace medical devices. Mobile devices have also been used to
accurately track heart rate and heart-rate variability. In January 2011, MobiSante became the first company to receive
FDA approval for a smartphone-based medical diagnostic tool that uses an ultrasound probe for echocardiography. Work
has also already been initiated to develop ECG recording devices that work with smartphones.
IV. CONCLUSION
We have tried to propose a model of a system which will take into consideration, the most important parameters
before arriving at a conclusion whether to alert the user or not. However a challenge yet remains to integrate the entire
system into one model to make it usable. We have food, pollen and also humidity detector available, but all these sensors
need to be integrated into a single device which will also incorporate other parameters as we have described in our
model. These are some of the parameters which have not been addressed yet. Asthma can be prevented if proper
monitoring of the patient is done on a regular basis, as we all know, prevention is better than cure.
V. FUTURE ENHANCEMENT
Histamine is a chemical which is involved in our immune system, Central Nervous System and also required for
proper digestion. Histamine’s role in our body is to cause an immediate inflammatory response. It acts as an alert in our
immune system, notifying our body of any potential attackers. As a result, asthma attacks are more probable whenever
histamines come into play. Histamine stabilizers can control histamine production in our body, but till date we haven’t
found a histamine tracking system which can keep a watch on the histamine levels in the patient. These are some of the
parameters which have not been addressed yet. We try to propose a model to develop sensors to sense histamine levels in
our body.
REFERENCES [1] Soot sensors for efficient combustion and Low emissions – SootSensII(PDF)
https://www.google.co.in/url?sa=t&rct=j&q=&esrc=s&source
[2] Pollen Detector http://www.shinyei.co.jp/stc/optical/poln/main_ps2_e.html

Rajesh et al., International Journals of Advanced Research in Computer Science and Software Engineering
ISSN: 2277-128X (Volume-7, Issue-6)
© www.ijarcsse.com, All Rights Reserved Page | 267
[3] Histamine http://www.mindbodygreen.com/0-11175/everything-youneed- to-know-about-histamine-
intolerance.html
[4] Food Allergy detector http://knegadesign.com/allergen/
https://www.pinterest.com/pin/51650726946424180/?from_navigate=true
[5] J. Höller, V. Tsiatsis, C. Mulligan, S. Karnouskos, S. Avesand, D. Boyle, From Machine-to-Machine to the
Internet of Things: Introduction to a New Age of Intelligence, Amsterdam, The Netherlands:Elsevier, 2014.
[6] G. Kortuem, F. Kawsar, D. Fitton, V. Sundramoorthy, "Smart objects as building blocks for the Internet of
Things", IEEE Internet Comput., vol. 14, pp. 44-51, Jan./Feb. 2010.
[7] K. Romer, B. Ostermaier, F. Mattern, M. Fahrmair, W. Kellerer, "Real-time search for real-world entities: A
survey", Proc. IEEE, vol. 98, no. 11, pp. 1887-1902, Nov. 2010.
[8] Z. Pang, "Technologies and architectures of the Internet-of-Things (IoT) for health and well-being", Jan. 2013.


![Wireless Networking Security ―Secured Nim‖: Blocking ...ijarcsse.com/Before_August_2017/docs/papers/Volume... · ... denoted 802.11i [4]. Other than the similarities between WPA](https://img.pdfslide.us/doc/110x75/5aab31a97f8b9aa9488bb171/wireless-networking-security-secured-nim-blocking-denoted-80211i.jpg)