Embed Size (px)
Citation preview
© 2015, IJARCSSE All Rights Reserved Page | 885
Volume 5, Issue 3, March 2015 ISSN: 2277 128X
International Journal of Advanced Research in Computer Science and Software Engineering Research Paper Available online at: www.ijarcsse.com
Statistical Analysis Software for Agricultural Research
Data Analysis Jayade K. G.
* Deshmukh P. D. Khot P. G.
Asst. Professor in Computer Science, Asst. Professor in Statistics Professor
Dr. PDKV, College of Agriculture, Dr. PDKV, College of Agriculture Dept. of Statistics, RTM Nagpur
Nagpur, Maharashtra, India Nagpur, Maharashtra, India University Nagpur, Maharashtra,
Abstract— Agriculture is the backbone of India and agriculture research is required for sustainable and modern
agriculture. India is the agricultural country and the rural India is depends on the agriculture. In India, many
organisations are working for research and development in agriculture. For sustainable agriculture, statistical
analysis on the research data is most important. With the use of computer in agriculture sector, statistical analysis
becomes easier. These software are very easy, gives fast result and are reliable. Statistical analysis is used for analysis
of agricultural research data. Many softwares have been used since the use of computer in agriculture. This research
paper is the study of statistical software used by the agricultural scientists in agriculture research for analysis of data.
Keywords— Statistical Analysis, Software, Agricultural Research, Data Analysis, IASRI, WASP, MS-Excel
I. INTRODUCTION
India has the total geographical area of 328.73 million hectors and Indian Agriculture is dependent on total sown
area of 141.58 million hectors (46.3% of total area). With limited available land resources Indian Agriculture have to
feed 1.267 billion (126.7 crore) Indian population. In India there are more than 1,00,000 agricultural scientists working
for agricultural research and development. Most of the agricultural scientists are working in Indian Council of
Agricultural Research (ICAR), State Agricultural Universities (SAUs), Krishi Vigyan Kendras (KVKs), Council of
Scientific and Industrial Research (CSIR), IITs, Central and State Government departments, Private Companies, NGOs,
etc. ICAR is the premier research organisation for co-ordinating, guiding and managing research and education in
agriculture including horticulture, fisheries and animal sciences in the entire country. With 99 ICAR institutes and 65
agricultural universities spread across the country this is one of the largest national agricultural research systems in the
world. Rural population and agricultural workers have been increased from 97.2 million in 1951 to 263 million in 2011
out of 1210.2 million population of India. Food grains production have been increased from 50.82 million ton in 1951 to
255.36 million ton in 2012-13. Agriculture is the backbone of India and agriculture research is required for sustainable
and modern agriculture. Statistical analysis is used for analysis of agricultural research data. Many software have been
used since the use of computer in agriculture.
II. STATISTICAL ANALYSIS FOR AGRICULTURAL RESEARCH
Statistical analysis is an important tool to extract as much information as possible from the given data. Statistical
computing methods enable to answer quantitative biological questions from research data and help plan new experiments
in a way that the amount of information generated from each experiment is maximized. Widespread use of computers
and specialized high end statistical software packages have helped and greatly improved the ability of researchers to
analyze and interpret voluminous data. Developments in computerized statistical analysis have enhanced the ability of
researchers to come up with better conclusions. This has helped in improving their statistical, computer-related and
networking skills of the researchers. For exploiting and sustaining these developed skills, availability of proper
computing and infrastructure facilities to agricultural research in National Agricultural Research System (NARS) is of
utmost consequence for improving their skills. The statistical computing support would be useful in improving the
quality of agricultural research and make it globally competitive and acceptable by way of publications in International
refereed Journals. The present project, therefore, targets at providing technical support on the component of statistical
computing by applications of general purpose statistical software package that help in undertaking appropriate,
sophisticated and computationally involved statistical analysis of data keeping in mind also the accuracy and precision of
analysis. It is expected to create a healthy statistical computing environment for the benefit of the scientists in NARS by
way of providing advanced, versatile, and innovative and state-of the art high end statistical packages and enable them to
draw meaningful and valid inferences from their research.
There are many softwares which are used by the agricultural scientists in agriculture research for
statistical analysis of their research data. Some examples of statistical softwares used are analysis functions and tools in
Jayade et al., International Journal of Advanced Research in Computer Science and Software Engineering 5(3),
March - 2015, pp. 885-890
© 2015, IJARCSSE All Rights Reserved Page | 886
MS-Excel, SAS, Indostat, Windostat, SPSS, SPAR, SPAB, SPBD, SPAD, SPFE, SPDA, SYSTAT, MSTAT, Gnumeric,
R, Online analysis of data, Web access statistical packages, etc. This software uses statistical formulas and convert to
softwares for data input, processing and output or result. The data analysis result of statistical software are very fast,
accurate, reliable, storage and saves lot of time of agricultural scientists. It does not require to do all the calculations
manually which are complex, critical, time consuming and always prone to error. Therefore, nowadays, almost all
agricultural scientists are using computers and statistical software to do their analysis of their research data. Some of the
softwares have been discussed here.
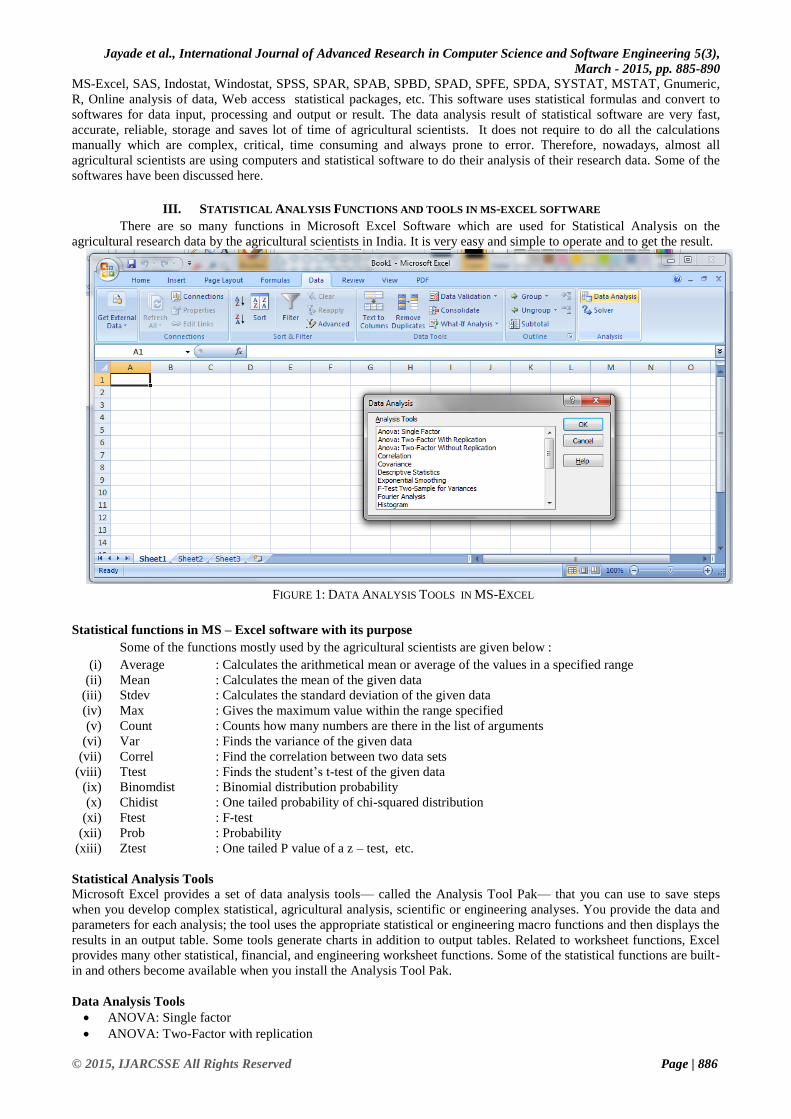
III. STATISTICAL ANALYSIS FUNCTIONS AND TOOLS IN MS-EXCEL SOFTWARE
There are so many functions in Microsoft Excel Software which are used for Statistical Analysis on the
agricultural research data by the agricultural scientists in India. It is very easy and simple to operate and to get the result.
FIGURE 1: DATA ANALYSIS TOOLS IN MS-EXCEL
Statistical functions in MS – Excel software with its purpose
Some of the functions mostly used by the agricultural scientists are given below :
(i) Average : Calculates the arithmetical mean or average of the values in a specified range
(ii) Mean : Calculates the mean of the given data
(iii) Stdev : Calculates the standard deviation of the given data
(iv) Max : Gives the maximum value within the range specified
(v) Count : Counts how many numbers are there in the list of arguments
(vi) Var : Finds the variance of the given data
(vii) Correl : Find the correlation between two data sets
(viii) Ttest : Finds the student’s t-test of the given data
(ix) Binomdist : Binomial distribution probability
(x) Chidist : One tailed probability of chi-squared distribution
(xi) Ftest : F-test
(xii) Prob : Probability
(xiii) Ztest : One tailed P value of a z – test, etc.
Statistical Analysis Tools
Microsoft Excel provides a set of data analysis tools— called the Analysis Tool Pak— that you can use to save steps
when you develop complex statistical, agricultural analysis, scientific or engineering analyses. You provide the data and
parameters for each analysis; the tool uses the appropriate statistical or engineering macro functions and then displays the
results in an output table. Some tools generate charts in addition to output tables. Related to worksheet functions, Excel
provides many other statistical, financial, and engineering worksheet functions. Some of the statistical functions are built-
in and others become available when you install the Analysis Tool Pak.
Data Analysis Tools
ANOVA: Single factor
ANOVA: Two-Factor with replication
Jayade et al., International Journal of Advanced Research in Computer Science and Software Engineering 5(3),
March - 2015, pp. 885-890
© 2015, IJARCSSE All Rights Reserved Page | 887
ANOVA: Two-Factor without replication
Correlation
Covariance
Descriptive statistics
F-test two-sample for variances
Histogram
Regression
t-test: two sample assuming equal variances
t-test: two sample assuming unequal variances
Z-test: two sample for means
IV. STATISTICAL SOFTWARE DEVELOPED BY IASRI
Indian Agricultural Statistical Research Institute, New Delhi have designed and developed so many softwares
for agricultural education, research, extension and administration. The software developed by IASRI are available in
packages, online facility. Some statistical software and facilities available in them are given below:
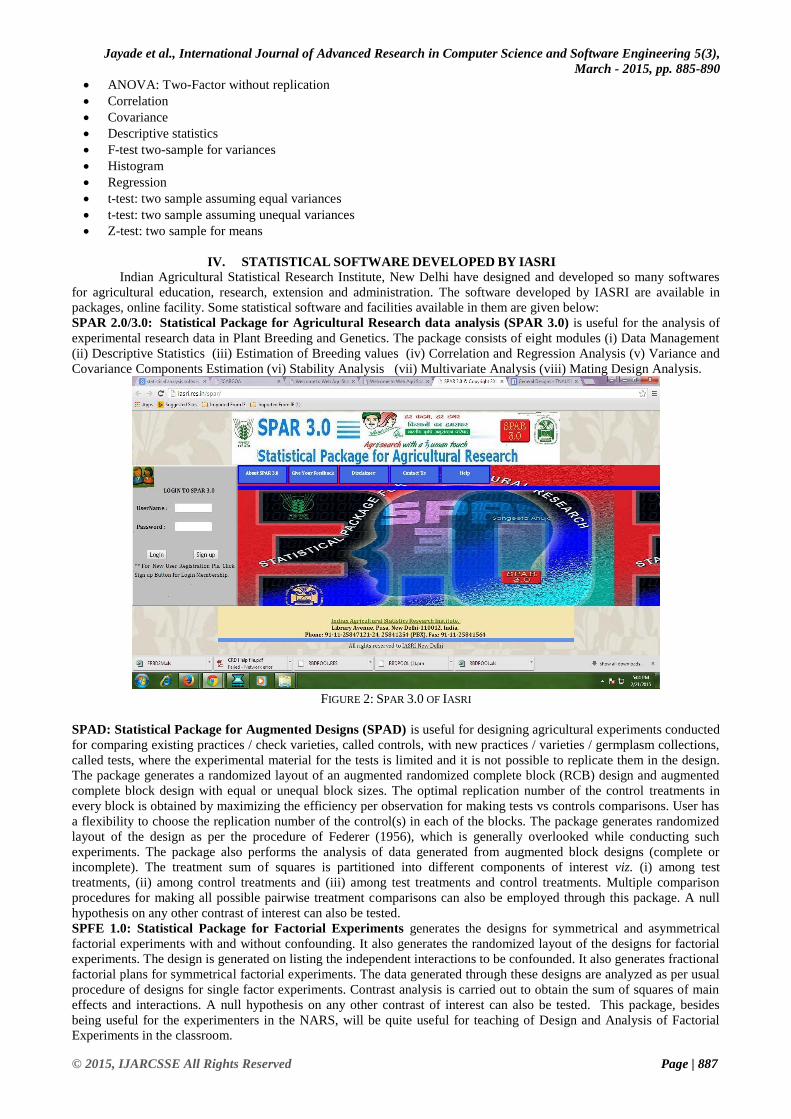
SPAR 2.0/3.0: Statistical Package for Agricultural Research data analysis (SPAR 3.0) is useful for the analysis of
experimental research data in Plant Breeding and Genetics. The package consists of eight modules (i) Data Management
(ii) Descriptive Statistics (iii) Estimation of Breeding values (iv) Correlation and Regression Analysis (v) Variance and
Covariance Components Estimation (vi) Stability Analysis (vii) Multivariate Analysis (viii) Mating Design Analysis.
FIGURE 2: SPAR 3.0 OF IASRI
SPAD: Statistical Package for Augmented Designs (SPAD) is useful for designing agricultural experiments conducted
for comparing existing practices / check varieties, called controls, with new practices / varieties / germplasm collections,
called tests, where the experimental material for the tests is limited and it is not possible to replicate them in the design.
The package generates a randomized layout of an augmented randomized complete block (RCB) design and augmented
complete block design with equal or unequal block sizes. The optimal replication number of the control treatments in
every block is obtained by maximizing the efficiency per observation for making tests vs controls comparisons. User has
a flexibility to choose the replication number of the control(s) in each of the blocks. The package generates randomized
layout of the design as per the procedure of Federer (1956), which is generally overlooked while conducting such
experiments. The package also performs the analysis of data generated from augmented block designs (complete or
incomplete). The treatment sum of squares is partitioned into different components of interest viz. (i) among test
treatments, (ii) among control treatments and (iii) among test treatments and control treatments. Multiple comparison
procedures for making all possible pairwise treatment comparisons can also be employed through this package. A null
hypothesis on any other contrast of interest can also be tested.
SPFE 1.0: Statistical Package for Factorial Experiments generates the designs for symmetrical and asymmetrical
factorial experiments with and without confounding. It also generates the randomized layout of the designs for factorial
experiments. The design is generated on listing the independent interactions to be confounded. It also generates fractional
factorial plans for symmetrical factorial experiments. The data generated through these designs are analyzed as per usual
procedure of designs for single factor experiments. Contrast analysis is carried out to obtain the sum of squares of main
effects and interactions. A null hypothesis on any other contrast of interest can also be tested. This package, besides
being useful for the experimenters in the NARS, will be quite useful for teaching of Design and Analysis of Factorial
Experiments in the classroom.
Jayade et al., International Journal of Advanced Research in Computer Science and Software Engineering 5(3),
March - 2015, pp. 885-890
© 2015, IJARCSSE All Rights Reserved Page | 888
SPBD Release 1.0: Statistical Package for Balanced Incomplete Block Designs enables a user to select and generate a
randomized layout of Balanced Incomplete Block (BIB) Design. The package generates BIB designs with replication
numbers up to a maximum of 20 for asymmetric BIB designs and 30 for symmetric BIB designs. The package also
provides the analysis of variance with both treatments adjusted and blocks adjusted sum of squares, adjusted treatment
means, variance of the estimated treatment contrasts and the contrast sum of squares, etc. The definitions of the
terminology used are available on-line. The package is useful for the experimenters, classroom teaching as well as for the
researchers in Statistics with special interest in Design of Experiments. or computing genetic parameters for one-way
and two-way classified data.
SPAB2.0: Statistical Package for Animal Breeding (SPAB2.0) has been developed keeping in view, the computing
requirements of scientists/students, mainly working in Animal Breeding and Animal Genetics research. The package is
Window based, Menu driven and works in a User friendly manner. In the present version of the package, 37 useful
programs of maximum utility are included. These programs have been grouped into ten modules. It has provisions for
Analysis of Mixed Model Data as provided in LSML Package developed by Walter R. Harvey, Best linear unbiased
prediction (BLUP) for Single traits, Best linear unbiased prediction (BLUP) for multiple traits, Adjustment for different
non-genetic effects, Sire evaluation using SRLS and Sire evaluation using REML. Computation of Mean and SE for
different classifications, Genetic parameters for half sib data, Genetic parameters for Full sib data, Coefficient of
Repeatability and Producing Ability. It provides computation of Selection Index (Hazel’s Method) Restricted Selection
Index, Sire Indices for different models, Osborne's index, Cunningham’s Selection Index. Diallel analysis can be
performed for data with unequal classifications, for different modeling situations viz., Analysis of complete 3 x 3 non-
orthogonal Diallel crosses data, Analysis of complete 4 X 4 or above non-orthogonal Diallel cross data with or without
pure breds, Analysis of 4 X 4 or above non-orthogonal Diallel cross data without reciprocals and pure breeds. One can
calculate Inbreeding coefficient, Genetic Gain and Genetic trend. Multivariate Analysis has programs for D Square
analysis, Multiple Regression Analysis (Step-up / Step-down methods, all possible combinations) and Principal
Component Analysis. Most of the Non-Parametric tests can also provided in the package. Help is provided and it is
having a User Manual which one can study and use. This package can aid in teaching the subject of statistical genetic to
the post-graduate students and helpful for the researchers in statistics with interest in animal sciences.
SSDA1.0: Software for Survey Data Analysis (SSDA 1.0) is useful for the analysis of survey data. SSDA analyzes the
data collected using systematic, simple random sampling (SRS), probability proportional to size (PPS), stratified, cluster,
two stage and stratified two stage sampling schemes. It provides the estimates of population mean, variance and design
efficiency of the sampling scheme in comparison to the simple random sampling without replacement. It also provides
descriptive statistics of the data without consideration of sampling design i.e. measures of central tendency like mean and
median and measures of dispersion like range, variance, coefficient of variation, skewness and kurtosis. The software is
completely menu driven and guides users step-by-step through data analysis process. It also has the facility to impute
missing data, if any, using commonly used imputation methods. This package is an aid in teaching the subject of analysis
of sample survey data to the post-graduate students and is also helpful to the researchers in statistics with interest in
sample surveys.
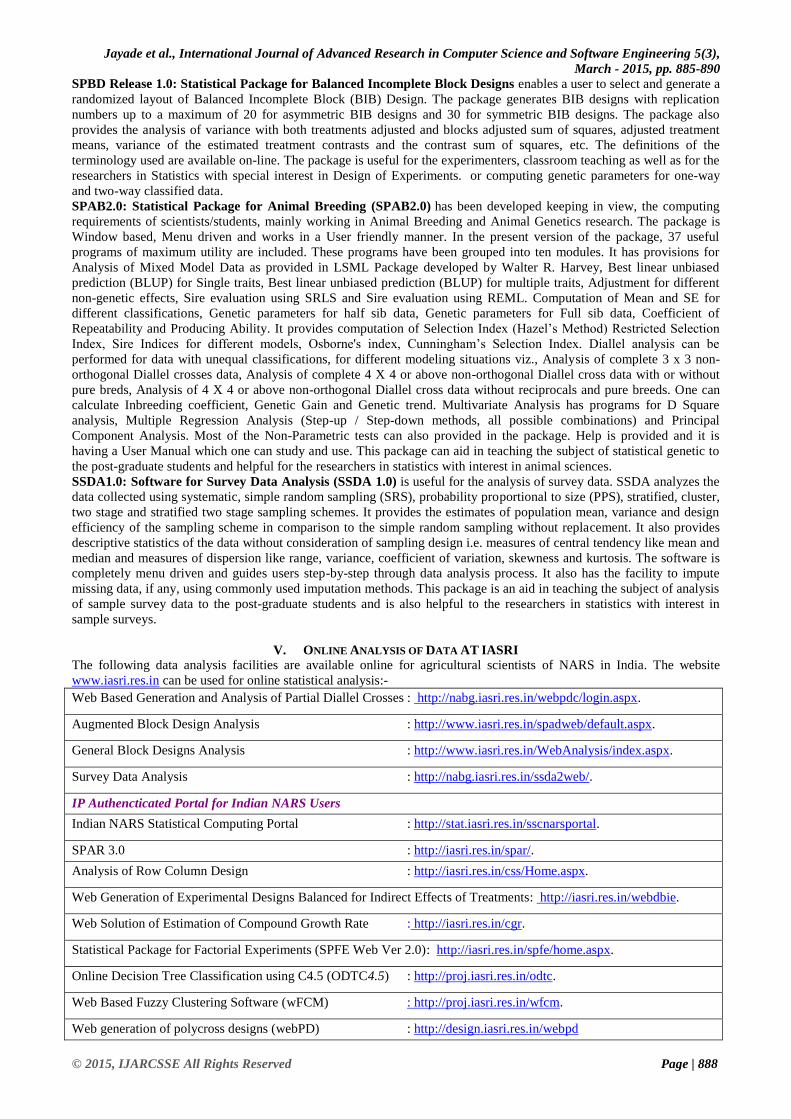
V. ONLINE ANALYSIS OF DATA AT IASRI
The following data analysis facilities are available online for agricultural scientists of NARS in India. The website
www.iasri.res.in can be used for online statistical analysis:-
Web Based Generation and Analysis of Partial Diallel Crosses : http://nabg.iasri.res.in/webpdc/login.aspx.
Augmented Block Design Analysis : http://www.iasri.res.in/spadweb/default.aspx.
General Block Designs Analysis : http://www.iasri.res.in/WebAnalysis/index.aspx.
Survey Data Analysis : http://nabg.iasri.res.in/ssda2web/.
IP Authencticated Portal for Indian NARS Users
Indian NARS Statistical Computing Portal : http://stat.iasri.res.in/sscnarsportal.
SPAR 3.0 : http://iasri.res.in/spar/.
Analysis of Row Column Design : http://iasri.res.in/css/Home.aspx.
Web Generation of Experimental Designs Balanced for Indirect Effects of Treatments: http://iasri.res.in/webdbie.
Web Solution of Estimation of Compound Growth Rate : http://iasri.res.in/cgr.
Statistical Package for Factorial Experiments (SPFE Web Ver 2.0): http://iasri.res.in/spfe/home.aspx.
Online Decision Tree Classification using C4.5 (ODTC4.5) : http://proj.iasri.res.in/odtc.
Web Based Fuzzy Clustering Software (wFCM) : http://proj.iasri.res.in/wfcm.
Web generation of polycross designs (webPD) : http://design.iasri.res.in/webpd
Jayade et al., International Journal of Advanced Research in Computer Science and Software Engineering 5(3),
March - 2015, pp. 885-890
© 2015, IJARCSSE All Rights Reserved Page | 889
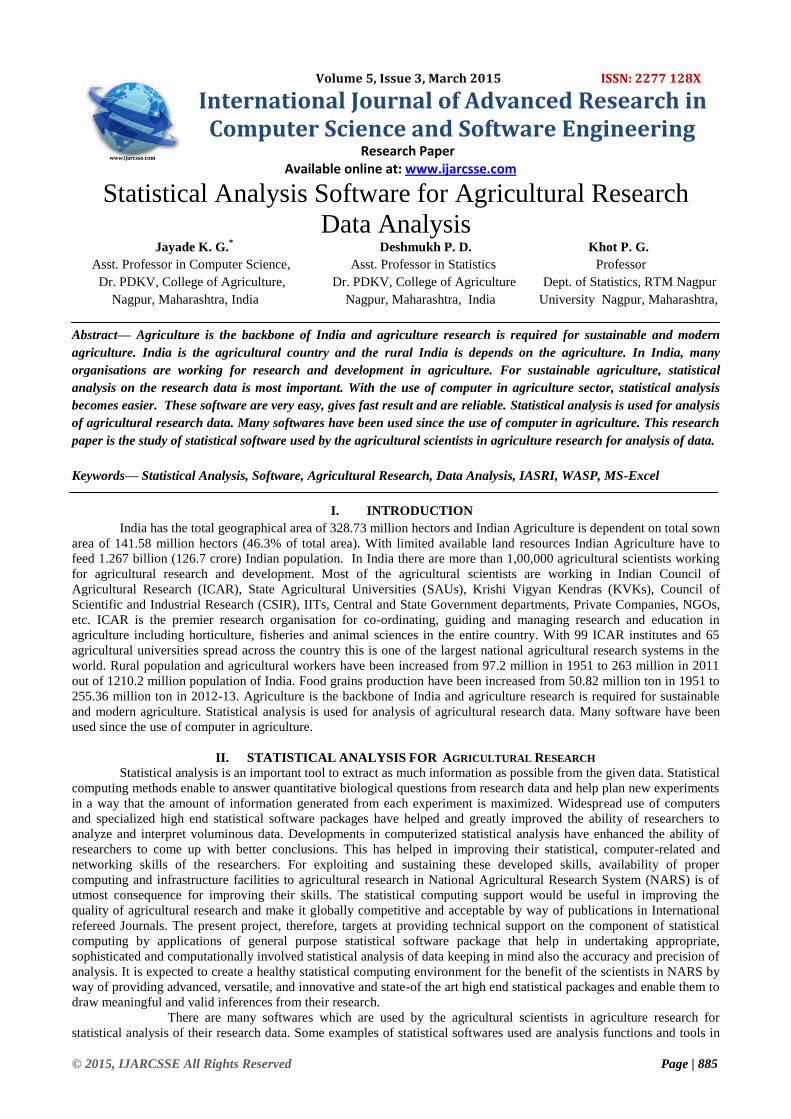
FIGURE 3: ONLINE ANALYSIS OF DATA ON IASRI WEBSITE
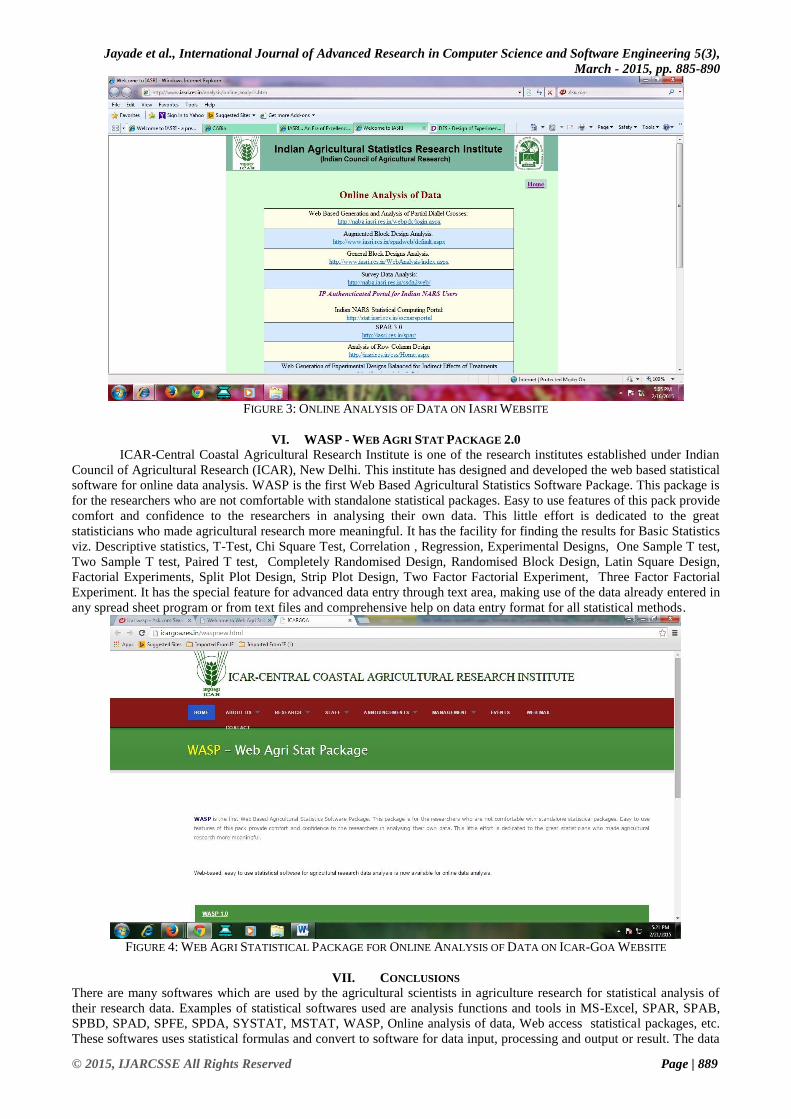
VI. WASP - WEB AGRI STAT PACKAGE 2.0
ICAR-Central Coastal Agricultural Research Institute is one of the research institutes established under Indian
Council of Agricultural Research (ICAR), New Delhi. This institute has designed and developed the web based statistical
software for online data analysis. WASP is the first Web Based Agricultural Statistics Software Package. This package is
for the researchers who are not comfortable with standalone statistical packages. Easy to use features of this pack provide
comfort and confidence to the researchers in analysing their own data. This little effort is dedicated to the great
statisticians who made agricultural research more meaningful. It has the facility for finding the results for Basic Statistics
viz. Descriptive statistics, T-Test, Chi Square Test, Correlation , Regression, Experimental Designs, One Sample T test,
Two Sample T test, Paired T test, Completely Randomised Design, Randomised Block Design, Latin Square Design,
Factorial Experiments, Split Plot Design, Strip Plot Design, Two Factor Factorial Experiment, Three Factor Factorial
Experiment. It has the special feature for advanced data entry through text area, making use of the data already entered in
any spread sheet program or from text files and comprehensive help on data entry format for all statistical methods.
FIGURE 4: WEB AGRI STATISTICAL PACKAGE FOR ONLINE ANALYSIS OF DATA ON ICAR-GOA WEBSITE
VII. CONCLUSIONS
There are many softwares which are used by the agricultural scientists in agriculture research for statistical analysis of
their research data. Examples of statistical softwares used are analysis functions and tools in MS-Excel, SPAR, SPAB,
SPBD, SPAD, SPFE, SPDA, SYSTAT, MSTAT, WASP, Online analysis of data, Web access statistical packages, etc.
These softwares uses statistical formulas and convert to software for data input, processing and output or result. The data

Jayade et al., International Journal of Advanced Research in Computer Science and Software Engineering 5(3),
March - 2015, pp. 885-890
© 2015, IJARCSSE All Rights Reserved Page | 890
analysis result of statistical softwares are very fast, accurate, reliable, storage and saves lot of time of agricultural
scientists. It does not require to do all the calculations manually which are complex, critical, time consuming and always
prone to error. It has the facility for finding the results for Basic Statistics viz. Descriptive statistics, T-Test, Chi Square
Test, Correlation , Regression, Experimental Designs, One Sample T test, Two Sample T test, Paired T test,
Completely Randomised Design, Randomised Block Design, Latin Square Design, Factorial Experiments, Split Plot
Design, Strip Plot Design, Two Factor Factorial Experiment, Three Factor Factorial Experiment. It has the special
feature for advanced data entry through text area, making use of the data already entered in any spread sheet program or
from text files and comprehensive help on data entry format for all statistical methods. Nowadays, almost all agricultural
scientists are using computer and statistical softwares for their research data analysis.
REFERENCES
[1] IndiaStat, Revealing India….Statistically. Population of India dated 22-2-2015. Website:
http://www.indiastat.com/default.aspx.
[2] Indian Agricultural Statistical Research Institute (IASRI), ICAR, New Delhi. Website: http://iasri.res.in/
[3] ICAR – Central Coastal Agricultural Research Institute, Goa, Web Access Statistical Packages.
http://icargoa.res.in/waspnew.html
[4] Statistical Functions and Data Analysis Tools in Microsoft Office Excel 2010 Software.
[5] Indian Council of Agricultural Research, New Delhi. http://www.icar.org.in