Embed Size (px)
Citation preview

A Non-Parametric Analysis of Rice Production Efficiency in Sri Lanka
Manoj Thibbotuwawa, Amin Mugera, and Ben White+
+ School of Agricultural and Resource Economics, Faculty of Natural and Agricultural
Sciences, the University of Western Australia M089, 35 Stirling Highway, Crawley WA
6009 Australia, Tel: +61-08-6488-4633, Fax: +61-08-6488-1098
Email: [email protected]
Contributed paper prepared for presentation at the 56th AARES annual conference,
Fremantle, Western Australia, February7-10, 2012
Copyright 2012 by Manoj Thibbotuwawa, Amin Mugera, Ben White. All rights reserved.
Readers may make verbatim copies of this document for non-commercial purposes by any
means, provided that this copyright notice appears on all such copies.
1
A Non-Parametric Analysis of Rice Production Efficiency in Sri Lanka
Abstract
This article investigates the production efficiency of rice farming in Sri Lanka using cross
section survey data of 90 farms. Past studies on rice farming have mostly focused on
technical efficiency (TE). Here, we examine technical efficiency, allocative efficiency (AE)
and cost efficiency (CE) using the data envelopment analysis (DEA) approach. On average,
the farms were 87% technically efficient; irrigated farms were more efficient (88%) than
rain-fed farms (82%). Average cost, allocative and scale efficiencies were 73%, 84% and
87%. Bias corrected TE estimate suggests an expected output expansion of 25% with a given
input combination in order to become fully efficient as opposed to 16% based on the original
estimates. In addition, a second stage Tobit regression shows that efficiency is influenced by
farm size, water security, ownership, seed quality, family labour endowment and female
labour participation.
Key words: technical efficiency, cost efficiency, bootstrap, rice farming, Sri Lanka
1. Introduction
Rice production efficiency has received substantial attention in recent empirical literature,
especially in the South and South-East Asian regions. This is partly because of its crucial role
in food security and the economic development of agricultural sectors in the regions
(Balcombe, et al., 2007, Coelli, et al., 2002, Dhungana, et al., 2004, Rahman, 2010, Rahman
and Rahman, 2009, Rahman, et al., 2009, Tan, et al., 2010, Wadud and White, 2000, Yao and
Shively, 2007). A key observation across empirical studies in the regions is that decline in
farm profitability can be related to disparities in technical efficiency across farms. This
suggests that an improvement in technical efficiency is essential for the ultimate survival of
rural agriculture.
As in other parts of Asia, rice is the staple food and principal crop in Sri Lanka. It occupies
the largest extent of land under any single crop1. The sector accounts for nearly 3 per cent of
the country’s Gross Domestic Production (GDP) and about 15 per cent of the agricultural
GDP (CBSL, 2010). About half of the agricultural labour force is employed in the sector.
Declining farm sizes and rising cost of production are the two major challenges facing rice
production in Sri Lanka. Due to land fragmentation, approximately 50 per cent of rice
production comes from small farms cultivating less than 1 acres and another 25 per cent
comes from farms cultivating between 1 to 2 acres. Only 3% of paddy cultivations come
from farms cultivating more than 5 acres (DCS, 2002). Timely availability of sufficient water
is very important for cultivation as rice is a high water intensive crop. Rice is cultivated under
1 It accounts for more than 900,000ha and about 34% of total agricultural land area in Sri Lanka.

2
different water regimes and there is a greater variability in productivity among these regimes.
Further, increasing cost of labour, machinery, fertilizer and agrochemicals has been an issue
of serious concern over the years (Thiruchelvam, 2005a).
Despite the significance of the rice sector in the Sri Lankan economy, and the recent
achievements of near self-sufficiency status in production, the country has been facing
widespread stagnation in paddy yields and declining profitability in recent years (IPS, 2011,
Kikuchi, et al., 2000, Rafeek and Samarathunga, 2000, Weerahewa, et al., 2003). According
to Abeysiriwardena (2003), rice is the least profitable venture of all farming activities in Sri
Lanka. Demand for rice is rising due to the growth of population by 1.1 per cent and per
capita income by 15 per cent annually2. It is projected that the rice production should grow at
the rate of 2.9% per year in order to meet the rising demand (DOA, 2011). Due to the scarcity
of new arable land, area expansion is not a viable solution anymore; therefore, the possible
solution to this problem could come through either yield improvement or the efficient use of
inputs, or a combination of both. However, empirical studies in Sri Lanka that focus on
identifying whether there are any scope for improving production efficiency and what factors
influence efficiency are still rare. As noted by Udayanganie, et al., (2006), there is a
considerable gap in research in terms of measuring the productive efficiency of paddy
cultivation in Sri Lanka.
Farmers in Sri Lanka are price takers in the output and factor markets and changes in these
markets highly affects their decisions on input allocation, costs structure and ultimately farm
income. While few of the available empirical studies have focused on the analysis of
technical efficiency, it is important to investigate the cost efficiency and allocative efficiency
of rice production.
The major objective of this study is to measure the production efficiency of the Sri Lankan
rice sector using the DEA procedure. We compute the following efficiency measures:
technical efficiency (TE), allocative efficiency (AE), cost efficiency (CE), scale efficiency
(SE). We also estimate the bias-corrected technical efficiency estimates and investigate the
factors that influence production efficiency differences in irrigated and rain-fed rice farms
while controlling farm size, resource utilization and resource ownership.
2 Average per cent change in per capita GDP between 2000 and 2010 is 15%, with the years 2007 and 2008
achieving more than 21% change.

3
This study contributes to the literature on Sri Lankan’s rice production economics in several
ways. To the best of our knowledge, this is the first study to analyze TE, AE, CE and SE of
rice production in Sri Lanka using the DEA approach. This is also the first attempt to apply
the bootstrapping procedure to correct for the bias generated by the deterministic DEA
model. No other study has measured the impact of the seed source, irrigation method, and
date of planting on efficiency measures, which could be of interest to policy makers in most
other Asian countries facing input market liberalization.
Results of this study have policy implications pertaining to better allocation and utilization of
resources for rural development and food security in Sri Lanka. The results are expected to be
of interest to policy makers in other Asian countries having similar background and issues.
The next section reviews relevant literature on rice production efficiency. Section three
describes the methods and data. Section four discusses the results followed by the concluding
comments in section five.
2. Literature Review on Rice production Efficiency
Production efficiency is one of the popular methods of benchmarking the performance of
economic entities in a similar industry. Technical efficiency measures the extent to which
inputs are converted in to outputs relative to the best practice given the available technology.
Allocative efficiency is related to selecting the mix of inputs that produces a given level of
output at minimum cost given the available input prices. Economic efficiency is a product of
TE and AE. Relaxing the assumption that all firms are fully efficient is used to estimate
frontier production functions and to measure the technical efficiencies of firms relative to the
best practice frontier using either parametric or non-parametric methods, or both (Coelli, et
al., 2005). A number of studies have examined the efficiency of rice farmers in developing
countries. Stochastic frontier analysis and Data Envelopment Analysis method are the most
frequently used methods in analyzing efficiency and factors explaining efficiency. Some of
the recent studies in rice farming in Asian region are summarized in Table 1.
-Insert Table 1-
The studies have estimated the efficiency measures and examined the managerial and socio
economic factors that explain efficiency differences across farms in the same region and/or in
different regions and over time. Most of the studies have focused on socio-economic issues
like age, farm managers’ experience, education attainment, farm size, land ownership and

4
labour use among others to analyse the determinants of technical efficiency. Most studies
showed greater efficiency differences across farms. However, the results of these studies are
mixed and inconclusive.
For example, some studies (Bäckman, et al., 2011, Brazdik, 2006, Khan, et al., 2010, Rahman
and Rahman, 2009, Rahman, et al., 2009, Tan, et al., 2010, Vu, 2008, Wadud, 2003) showed
a positive significant relationship between farm size and productive efficiency while some
others (Balcombe, et al., 2008, Wadud and White, 2000) found a positive and insignificant
relationship. The relationship was negative in the case of Balcombe, et al., (2007) and Yao
and Shively (2007). Most studies showed a positive significant relationship between
ownership and efficiency (Coelli, et al., 2002, Mariano, et al., 2011, Rahman and Rahman,
2009, Yao and Shively, 2007). Rahman (2010) estimated high efficiency for tenants than the
owner operators.
Excessive use of family labour is found to increase efficiency (Brazdik, 2006, Dhungana, et
al., 2004, Rahman and Rahman, 2009), and a positive relationship is found between hired
labour and efficiency (Yao and Shively, 2007). Negative relationship between large families
and efficiency is found in Coelli et al (2002) while Rahman (2010) finds a positive
relationship. Negating the popular notion on female labour use in developing countries, some
studies finds that female labour input significantly improves technical efficiency (Dhungana,
et al., 2004, Rahman, 2010).
Very few studies have estimated rice productive efficiency and its determinants in Sri Lanka
(Ekanayake and Jayasuriya, 1987, Gunaratne and Thiruchelvam, 2002, Karunarathne and
H.M.G.Herath, 1989, Thiruchelvam, 2005b, Thiruchelvam, 2005a, Udayanganie, et al.,
2006). While Gunaratne and Thiruchelvam (2002) has undertaken a comparative analysis
between major and minor schemes, all the other studies have been confined to the major
irrigation areas3 in Mahaweli Systems
4. All the studies have used stochastic frontier method
while none of the studies has given any attention to non-parametric method. In summary,
3 Rice lands are classified as major irrigation, minor irrigation and rain-fed based on the water source. Major
irrigation schemes are those having a command area of more than 80ha, where the water supply may be either
from a major tank or a river or a major stream diversion system. Minor schemes are those under village tanks,
which consist of less than 80ha. Rain-fed cultivations are those lands which are grown with rainfall. 4 The Mahaweli basin is the largest river basin of Sri Lanka covering an area of over 10,000 Sq. Km. Several
irrigation settlements were developed under the Accelerated Mahaweli Development Project namely System H,
B, C, G, L, Uda Walawe and Victoria.

5
land ownership and land size have been highlighted as the most important factors positively
influencing efficiency (Thiruchelvam, 2005b, Thiruchelvam, 2005a, Udayanganie, et al.,
2006). Gunaratne and Thiruchelvam (2002) underscored the importance of water
availability in improving technical efficiency by finding higher technical efficiency in major
irrigation schemes compared to minor schemes. Ekanayake and Jayasuriya (1987) and
Karunarathne and Herath (1989) finds no significant technical inefficiency among rice
farmers at the head ends in Mahaweli System H.
In general, despite the advantages of DEA over Stochastic Frontier Analysis (SFA)5, most
empirical studies have used SFA method. This is partly because the traditional DEA approach
is criticized for a lack of a solid statistical foundation and sensitivity to outliers. Ignoring the
statistical properties in the estimators could lead to biased DEA estimates and misleading
results. Bootstrapping DEA method introduced by Simar and Wilson (1998) provides a
statistically sound solution to overcome these problems and allows estimation of bias
corrected efficiency scores, variation and confidence intervals (Mugera and Langemeier,
2011). However, only a few empirical studies have measured the bias corrected technical
efficiency estimates in rice farms (Balcombe, et al., 2007, Vu, 2008).
In summary, results of the efficiency analysis are mixed, inconclusive and biased towards
estimating TE alone while neglecting other important aspects of efficiency like AE and CE.
Consequently, the present paper contributes to fill the current gap in the efficiency literature
by analyzing TE, bias corrected TE, AE, CE and SE and the factors determining the
efficiency across rice farms in Sri Lanka.
3. Methodology
The efficiency measurement method used in this paper is derived from those presented in
Wadud and White (2000), which are based on the method developed by Charnes et al. (1978)
using Farrell’s (1957) seminal work of measuring technical efficiency and estimating
production frontier. First, input oriented technical, scale, allocative and cost efficiencies are
estimated as farmers have more control over inputs than the output. Then following the
studies by Olson and Vu (2007) and Gocht and Balcombe (2006) based on the smooth
bootstrap procedure for DEA proposed by Simar and Wilson (2000), bias corrected technical
5 See Coelli et al. (2005) for a more detailed explanation
6
efficiency are calculated. Finally, the estimated efficiencies are used to identify the impact of
some resource utilization factors explaining performance differences among the farms using
Tobit regression analysis.
Technical Efficiency
Following Coelli et al. (2002), assume that there are n farms ( 1, 2 , ., 9 0 )n which produce a
single output m (m=1, i.e. rice) using k different inputs ( 1, 2 , ..., 5 )k representing seed,
fertilizer, chemicals, labour and machinery. For the th
i farm, input and output data are
represented by the column vectors i
x and i
y . The data for all n farms are represented by
K n input matrix, X and M n output matrix, Y . The Constant Return to Scale (CRS)
input oriented DEA model for the th
i farm can be expressed as,
1.
. . 0 ,
0 ,
0
i ii
i
i i
M in
s t Y y
x X
where is a scalar and is a 1n vector of constants. For Variable Return to Scale (VRS),
convexity constraint, '1 1n , is added, where 1n is a 1n vector of one. According to
Farrell’s definition in Coelli, et al. (2005), the input technical efficiency score ( ) gets a
value 0 1 . If the value is equal to one, the farm is on the frontier and hence technically
efficient.
Bootstrapping the TE estimates
This paper applies smoothed homogeneous bootstrap procedure following Simar and Wilson
(2000) to get bias corrected efficiency scores and their confidence intervals. Bootstrap
procedure repeatedly simulates the data generating process by re-sampling the sample data
and applying the original estimator to each simulated sample. This enables the investigation
of the sensitivity of efficiency scores to sampling variations (Mugera and Langemeier, 2011).
The analysis is done in R statistical software using the FEAR package.
Scale Efficiency and Return to Scale
Scale efficiency is calculated by the ratio /C R S V R S
S E T E T E . SE = 1 implies scale efficiency
or CRS while SE < 1 indicates scale inefficiency that can be due to the existence of either

7
increasing or decreasing returns to scale. To find out whether the firm is operating under
increasing or decreasing return to scale, an additional DEA equation with NIRS is imposed
with the restriction '1 1n for the CRS specification in equation (1). Therefore,
,
N IR S V R S N IR S V R S V R S C R ST E T E T E T E a n d T E T E relationships indicate the existence of DRS,
IRS and CRS respectively (Coelli, et al., 2005).
Allocative and Cost Efficiency
To measure the cost efficiency (CE), another DEA equation with cost minimization objective
is imposed, where *
m nx represents the cost minimizing vector of inputs m for the n
th farm
given the input prices m n
w .
2.
,
. . 0 ,
0 ,
1 1,
0 ,
ii ix
i
i
M in w x
s t Y y
x X
n
Allocative Efficiency (AE) is calculated residually as AE=CE/TE.
TE estimates were calculated assuming all the three return to scale (CRS, VRS and NIRS),
but only VRS assumption was imposed measuring AE and CE estimates for the simplicity of
the study.
Tobit Analysis explaining the efficiency shifters
Use of regression model to determine the farm specific attributes in explaining inefficiency is
a common practise in the literature with varying explanatory variables in different studies.
The dependant variable, i.e., production efficiency measure, has a censored distribution as it
lies between 0 and 1. Hence, Tobit regression model using the maximum likelihood approach
is the most consistent approach.
Three separate Tobit regressions were run taking VRS estimates of TE, AE and CE estimates
as the dependant variable as follows.
8
3.
*
* * 1
1
ii iy Z
y i f yy
O th e r w is e
e
where iy is DEA efficiency index and iz represents a vector of explanatory variables
(1, 2 ....8 )i . 1z =farm size,
2z =irrigation dummy,
3z =date of sowing dummy,
4z =seed
source dummy, 5
z =ownership dummy, 6
z =machinery use, 7
z =family labour use (%), 8
z
=female labour participation (%)
It is preferred using bias corrected TE estimates over the original estimates as the bias is
larger than the standard deviation (Mugera and Langemeier, 2011). However, because the
bias corrected measures of AE and TE were not readily available, the censored efficiency
measures were used as dependent variables to achieve consistency over the three efficiency
measures used in the analysis.
4. Data and Variables
The data used in this study comes from a survey of rice producers, conducted by the Institute
of Policy Studies of Sri Lanka during March to May 2008 in three irrigation systems: major
irrigation scheme, minor irrigation scheme and rain-fed in Sri Lanka. Samples were collected
from six Agrarian Service Centre (ASC) Divisions in six Districts. Districts and ASC
divisions were purposively selected to represent all the irrigation systems and climatic zones
while 15 randomly drawn farm households were selected in each ASC division. Total sample
is comprised of 90 farmers.
The rice lands in Sri Lanka can be categorized mainly as irrigated (major and minor) and
rain-fed based on method of water supply or as Maha and Yala based on the cultivation
season. The major cultivation season (Maha) is from October to March whereas the minor
cultivation season (Yala) is from April to September (Dhanapala, 2000). The data for the
present study comes from 2007/08 Maha Season. Major and minor irrigated cultivations are
represented by Ampara, Polonnaruwa, Kurunegala and Matara districts while Kegalle and
Kalutara districts represent rain-fed cultivation.

9
Data was collected on the quantity and price of the output (rice), quantities and price of the
inputs (seed, fertilizer, chemicals, labour and machinery) and some other cultivation related
variables such as farm size, source of seed, date of sowing, method of irrigation and
ownership type. The output is measured as kilograms (kg) of rice harvested and the price of
output is the per kg selling price of rice. Seed is measured as the total physical quantity in kg
and per kg price. The amount of fertilizer is measured as total kg applied and includes Urea,
Muriate of Potash (MOP) and Triple Super Phosphate (TSP) which are the three major
fertilizers used by the Sri Lankan farmers. Some other fertilizers like Zinc, Kieserite and
Ammonia are excluded because only a small proportion of farmers and in certain areas used
these. Price of all the three fertilizers remain fixed at a subsidized level of Rs.7/kg. Chemicals
are measured in liters and per liter price.
Labour input is measured as the number of workdays per person for all hired and family
labour. Weighted averages of the number of workdays and daily wage rate (Rs./day) of male
and female workers are calculated. Total machinery quantity is measured in cost of
machinery usage in rupees for tractors, threshers and combined harvesters, excluding the
labour cost.
Table 2 shows the summary statistics for the irrigated and rain-fed cultivations separately due
to the apparent differences in the yield of rice and per acre usage of certain inputs. As the
table shows, overall farm size is quite small with maximum of 6.5 acres. Average farm sizes
in the two systems are significantly different, i.e., 2.13 acres in irrigated and 1.22 acres in
rain-fed. Average yield levels are no exception to this with 2,220 kg/acre in irrigated and
1794 kg/acre in rain-fed. There is no much difference in the per acre quantities of inputs
except labour and machinery. Rain-fed cultivation is more labour intensive while in irrigated
areas machinery use is significantly higher. Labour is relatively cheaper in irrigated areas due
to surplus labour and lack of off farm activities.
-Insert Table 2-
5. Empirical Results
Analysis of production efficiencies
Summary statistics for the computed technical, cost, allocative and scale efficiencies are
reported in Table 3. Initial estimates of average technical efficiency were 0.75, 0.87 and 0.76
for CRS, VRS and NIRS respectively. Twenty-eight farms (31 per cent) were fully efficient

10
under the VRS, but this was much lower under the CRS and NIRS with 9 (10 per cent) and
13 (14 per cent) farms respectively. Minimum TE was 0.51 under VRS assumption and 0.32
under CRS and NIRS assumptions. This suggests that farms in the sample could have
produced the same output with up to 68 per cent per cent fewer inputs. Rice cultivations
under the major irrigation schemes have significantly higher TE scores compared to the
minor irrigation schemes and rain-fed cultivations under all the three assumptions. This
difference shows the significance of timely and sufficient availability of water resource.
Rain-fed cultivations are frequently subject to higher variability of rainfall while water
availability is more secured in major irrigation schemes.
The mean allocative efficiency score is 0.84 with minor (90 %) and major irrigation schemes
(87 %) having higher efficiency than the rain-fed systems (76 %). A majority of the farms in
this study are not allocative efficient, i.e. these farms did not make the correct allocation of
inputs to produce the output at minimum costs. From major and minor schemes, five and two
farms are defining the frontier respectively, but no farm from the rain-fed systems. These
scores indicate that there is a lot of space to reduce production cost by being more rational in
allocating inputs especially in rain-fed systems. Maximum possible cost reduction by proper
input allocation is 48 per cent.
The average cost efficiency is 0.73 per cent with a minimum of 0.33 per cent. Seven farms, 5
from major and 2 from minor, are defining the frontier. This suggests that the farmers can
reduce their input cost, on average, by 37 per cent without reducing their existing output and
this reduction can go up to a maximum of 67 percent. Cost efficiency in rain-fed farms is
significantly lower at 0.62, compared to 0.76 and 0.79 in minor and major irrigation farms.
Average scale efficiency (SE) is 0.87 with only 10 per cent of the farms having a SE score of
1. However, many farms are closer to the frontier. Fifty six per cent of farms have a SE score
higher than 0.90 and thirty-seven per cent of farms had an SE score higher than 0.95. Farms
under major irrigation schemes are more scale and cost efficient. Information on whether
farms operate at sub-optimal or super-optimal level can provide useful implications on
potential farm resource distribution to maximize productivity. Of all the farms, only 21 per
cent of farms were too large having DRS compared with 69 per cent being too small having
IRS and 10 per cent at an optimal scale of operation.
-Insert Table 3-

11
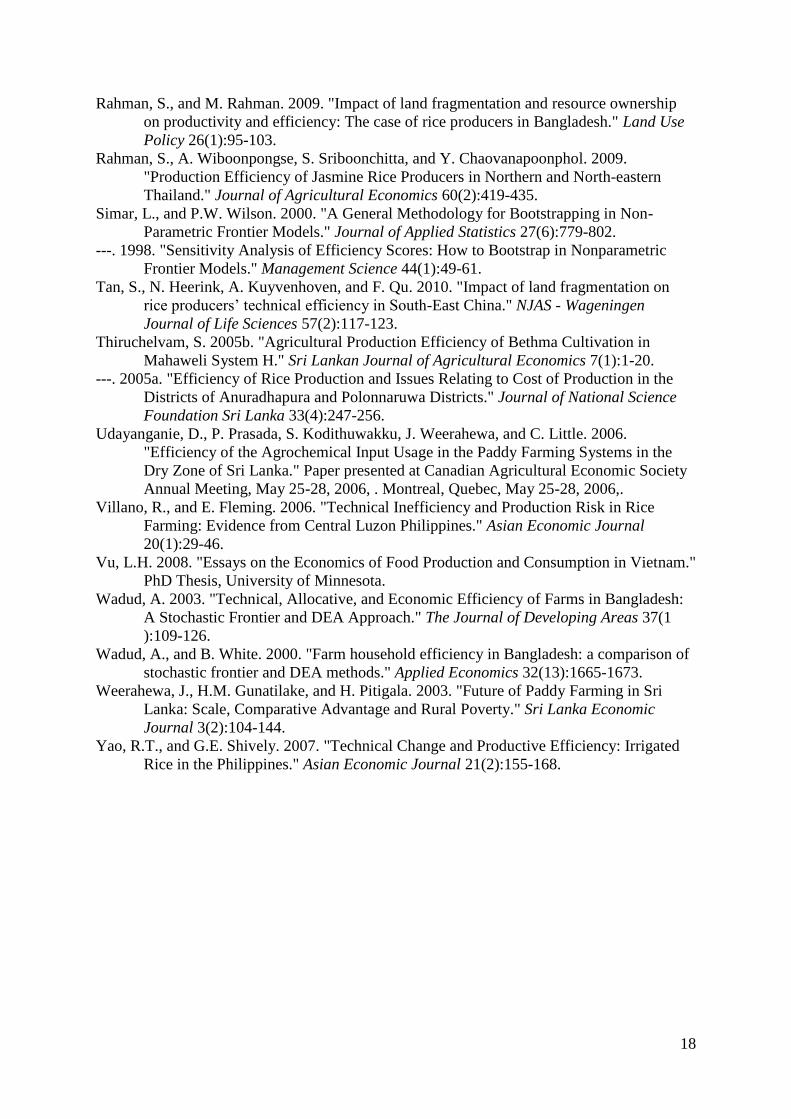
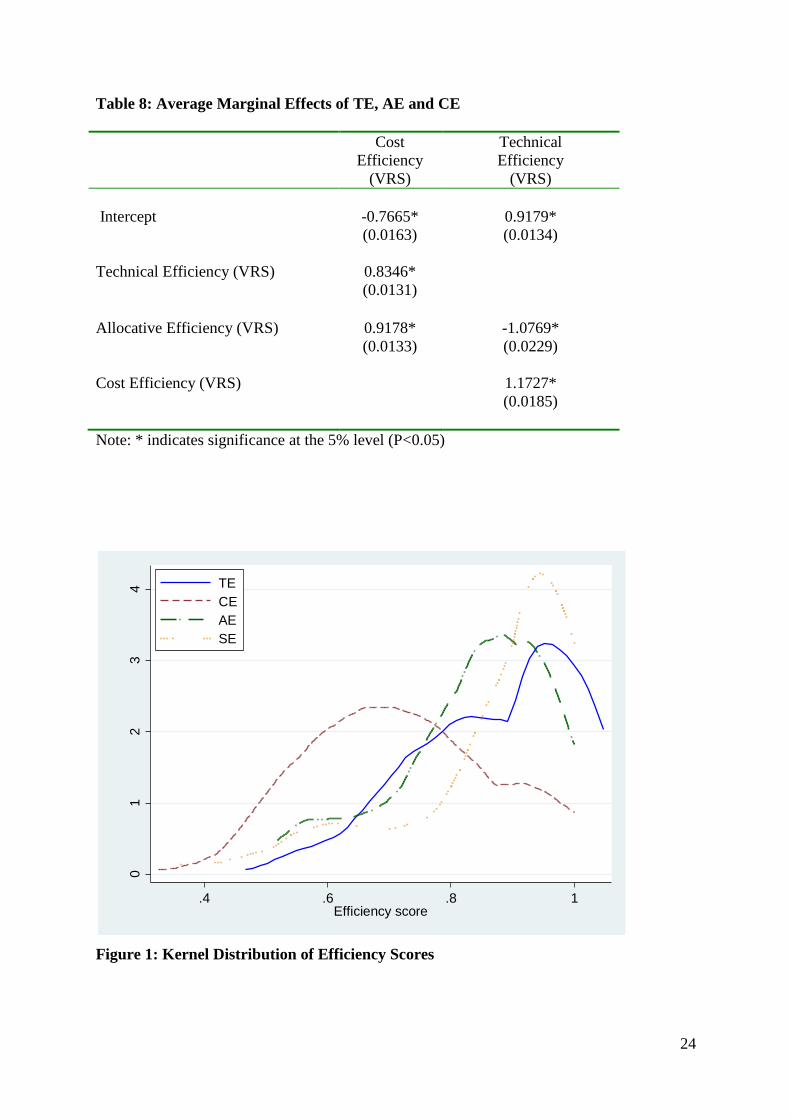
Figure 1 shows the kernel density estimates of the TE, CE, AE and SE estimates under VRS.
TE, AE and SE are more skewed towards the right, but the CE is more symmetrically
distributed. Hence, farms tend to be more technically and scale efficient followed by AE and
finally by CE. Based on the probability value of greater than 0.05 in the mean comparison
test between TE and SE6, mean difference is not statistically significantly different from zero,
but the per cent of farms with a score of 1 is higher for TE (31%) compared with SE (10%).
This implies that cost inefficiency is the most alarming issue that has to be given priority of
all.
-Insert Figure 1-
Bias corrected technical efficiency
Applying the bootstrap procedure, the average bias corrected technical efficiency was 80
percent compared to the original technical efficiency as 86 percent. Therefore the average
bias was 6 percent (Table 4). The maximum inefficiency under bias corrected TE was 52 per
cent as opposed to 49 percent in original TE scores. There is an obvious variability in lower
and upper bounds of corrected TE. However, Spearman’s rank correlation of 0.95 between
original and bias corrected efficiency estimates suggests a strong correlation of ranking of the
two estimates. Based on the original TE estimate, an average farm could expand its output by
about 15.5 per cent with a given input combination in order to become fully efficient.
However, the bias-corrected TE suggested an expected output expansion of 24.5 per cent.
The upper and lower bounds of the 95 per cent confidence interval (0.86 and 0.74) suggests
that the average possible expansion of technical efficiency ranges from 16 per cent to 35 per
cent.
Percentile results show that 50 per cent of the sample is having more than 17 per cent
inefficiency and 25 per cent having more than 27 per cent inefficiency. Only five per cent of
the sample is having less than 6 per cent inefficiency. Bias corrected efficiency results
disaggregated based on the irrigation method follows the same pattern as original efficiency
scores with higher inefficiency for rain-fed farms followed by minor and major.
-Insert Table 4-
6 Mean comparisons between the pairs, TE and AE; TE and CE; AE and CE showed significant mean
differences unlike TE and SE.
12
Analysis of farm input use
Following Coelli et al (2002), over use of inputs were calculated by the average ratio of
technically efficient input levels to cost efficient input levels for all five inputs separately7.
As can be seen in Table 5, on average, all the inputs except fertilizer were overused by the
farmers. Over use of labour is quite significant (63 per cent). However, this is not surprising
as it is customary to work all the family members in an average small plot of land on top of
using hired labour. Share of family labour in total labor is 52 per cent with 13% farms using
more than 75 per cent. Moreover, this reflects the lack of off-farm opportunities in rural areas
and inequitable development in favour of Colombo led Western province.
Machinery, chemicals and seed over use were 30%, 36% and 22% respectively. Input over
use is relatively higher in rain-fed than irrigated areas except in chemicals. Surprisingly,
fertilizer overuse is on average only 8 per cent even with a subsidy of about 90 per cent of the
market price. However, in the average overuse is 19 and 15 per cent in minor and rain-fed
areas as opposed to 1 percent underuse in major irrigated areas. This may be attributed to the
differences in infrastructure and poor targeting of the fertilizer subsidy. Thus, it is not
incorrect to highlight that the fertilizer subsidy may encourage overuse.
-Insert Table 5-
Results showed that the most of the farmers have overused inputs and employed an incorrect
input mix. The overuse of different inputs has different impacts on the efficiency measures.
Table 6 shows the Tobit regression results showing the relationship between excess use (i.e.
the difference between real input use and the cost efficient input level) of different inputs and
efficiency measures. According to the results, excess use of fertilizer, labour and machinery
has negative significant impact for both the TE and CE, while seed over use has a positive
significant impact. Results of labour and machinery overuse are similar for AE as well, but
fertilizer overuse is completely reverse with positive insignificant results. Relatively higher
negative impact of fertilizer overuse on TE and CE may have significant policy implications
on state fertilizer subsidy scheme which is intended to encourage more fertilizer use for
higher yield.
-Insert Table 6-
7 Input use ratio shows the input overuse by a technically efficient farm relative to the cost efficient farm for a
given output. Ratio of one indicates that the farm is both technically and cost efficient and no input overuse

13
Factors explaining efficiency differences
Efficiency scores were regressed on the farm level factors using a Tobit model. Farm size
(acres), irrigation method (dummy), seed source (dummy), date of sowing (dummy), seed
source (dummy), land ownership (dummy), machinery cost (% total cost), family labour (%
total labour) and female labour (% total labour) were used as the explanatory variables.
District dummy was excluded from the model as its higher correlation with the irrigation
method8.
Tobit results of the factors explaining efficiency estimates are presented in Table 7. Farm size
coefficient is positive for both TE and CE, which indicates larger farms are more efficient
than smaller farms (i.e., able to produce output and at a lower cost while using same level of
input as smaller farms). This can be attributed to greater access by the large farmers than
smaller farmers to input resources like irrigation, quality seeds, fertilizer and services like
credit, research and extension. Lower AE of large farms relative to small farms may be due to
poor selection of input mix due to increased access to various inputs and because of the
majority having DRS. According to the irrigation results, rain-fed farms are least efficient in
all three efficiency measures, while Major irrigated farms are the most efficient in TE. The
major reason may be that rain-fed and minor irrigation cultivations are often more prone to
water stress due to the uncertainty and variability of the rainfall and timely unavailability of
water than major irrigation cultivations. This may suggest that availability of water is a key
factor determining efficiency.
Early planters tend to be more efficient than the late planters in all three efficiency measures,
though this relationship is insignificant. This may be more related to the timely availability
and accessibility to the major input resources. Also relatively cheaper labour due to the
availability of surplus labour, may contribute for the higher cost efficiency. Results of the
seed source dummy indicates that the use of seed from private traders significantly improves
efficiency but the use of own seed seems to be significantly reduce efficiency than using state
produced seed. This could primarily be attributed to the quality of seed, which is often
believed to be poor if self produced. Private seed companies are more concerned about the
quality of their product and equipped with sufficient resources, modern technology, expertise
and infrastructure to produce high quality seeds.
8 Correlation coefficient between irrigation method and district was 0.82.
14
Tenancy results indicate that the owner operators are more technically efficient than tenants
are. This may be attributed to the over-use of inputs such as labour. There is a significant gap
between tenants and owner operators economically and socially. Due to the lack of off-farm
economic activities, tenants and their families tend to spent most of their time cultivating
their small rented land. In addition, this could be due to poor land quality as landowners may
rent out poor land and retain the high quality land for their own use. Tenants are allocatively
and cost efficient than landowners. This could be because they are more cost conscious in
selecting and allocating inputs than relatively rich land owners.
Use of machinery improves the allocative and cost efficiencies. Negative and significant
relationship between machinery use and technical efficiency contradicts the popular notion
that the mechanization and technological improvement leads to efficiency enhancement. On
the other hand, excessive machinery use in small plots might have the potential of
diminishing the technical efficiency. However, it is too early to hypothesize that technical
efficiency of small land plots can be improved by substituting some machinery with labour.
This could be a subject of further research.
The share of family labour endowment to total labour has positive impact on all three
efficiency measures. This could be because family labour put more effort on taking care of
the plants and this increases the efficiency of some other inputs. Female labour participation
significantly improves the TE and CE. A plausible explanation for this could be females are
used only for some specialized activities like planting and manual harvesting. This suggests
that labour specialization is useful for enhancing the productive efficiency.
-Insert Table 7-
Relationship of CE with TE and AE
Based on the results, there were 21 farms that were TE, AE and CE and 7 farms with only
TE. However, there were no farms either fully AE or/and CE without TE. Thus, it is
interesting to see whether CE induces the AE and TE. Table 8 shows the Tobit regression
results showing the relationship between TE, AE and CE. Results indicate that both TE and
AE lead to CE, but AE has the highest impact on CE. The relationship between TE and AE is

15
negative. Hence, in order to achieve CE, there should be a proper balance between AE and
TE, i.e. not only reduction of input but also correct input balance is required.
-Insert Table 8-
6. Conclusions
This study analysed technical, allocative, cost and scale efficiencies of Sri Lankan rice
farmers. Production efficiencies were measured using Data Envelopment Analysis method
under assumptions of constant return to scale, variable return to scale and non-increasing
return to scale. Allocative and cost efficiency estimates were measured under variable return
to scale assumption.
The results indicate considerable degree of inefficiency in Sri Lankan rice farms. On average,
farms tend to be more technically (0.87) and scale efficient (0.87), than allocative efficient
(0.84) or cost efficient (0.73). In general, farms under major irrigation schemes are relatively
more efficient than minor irrigation and rain-fed farmers. This shows the importance of
timely availability of water in improving technical efficiency. Bootstrapping method was
employed to determine the sensitivity of DEA VRS technical efficiency estimates to
sampling variation and to correct for the bias inherent in the deterministic measurement. The
average bias-corrected technical efficiency estimate was 0.80 with 0.12 confidence interval
width on average.
Allocative and cost inefficiency can be attributed largely to overuse of labour, chemicals and
machinery. Overuse of labour reflects the lack of off-farm employment opportunities in rural
areas. This suggests the need for policies that promote the creation of off-farm employment
to take off excess labor from farming. Machinery use is quite common among farmers at all
scale levels. Over use of machinery reduces farm TE while more machinery usage enhances
allocative efficiency. Hence, there should be a correct balance between employing machinery
and labour in small land plots. We can infer from overuse of fertilizer that subsidizing
fertilizer encourages overuse but the high over-use in rain-fed and minor irrigation areas than
the major irrigation areas may partly explain the so-called poor targeting and infrastructural
differences in different regions. Though it is too early to come to an extreme conclusion that
subsidizing fertilizer has to be eliminated, it is suggested to rectify the targeting issue and
infrastructural differences between regions to make it more effective.

16
These efficiency estimates were employed in the second step Tobit regression to evaluate
factors influencing the inefficiency. Results indicate that increasing land size, irrigation water
and ownership enhance TE. These have very important policy implications on the viability of
rural agriculture, as the sector currently consists of a large number of small farms and tenant
cultivators. From a policy perspective, any policy or programme to address the inefficiency in
the rice sector should take in to consideration the relationship of farm size, water availability
and ownership issue with the TE. In order to achieve economic of scale, cultivation systems
approach (Eg: Yaya system) should be promoted to organize small scale cultivations in to
comparatively larger organized collective systems with the collaboration of the government,
farmer organizations and the private sector. Existing tenurial and land legislations should be
reviewed in order to find a better solution for inefficiencies associated with land
fragmentation and tenancy.
Seed source results suggest that the use of quality seed is of high importance in maximizing
efficiency, so that the transformation of state seed production should be done with extreme
care in order not to deteriorate the seed quality. Private sector participation in the seed
industry should be increased. Self seed rice production by the farmers should be discouraged
unless it is coupled with sufficient extension services and training on quality seed rice
production. Use of more family labour and female labour should be encouraged especially in
small scale farms. Female labour should be attracted to the rice cultivation by minimizing the
wage gap between male and female labour and creating a hired labour market for female
labour, while labour specialization should be promoted.
References
Abeysiriwardena, D.S. (2003) Major Issues, ed. D.S. Abeysiriwardena, Dissanayake, D.M.N.
and Nugaliyadde. Department of Agriculture, Peradeniya.
Bäckman, S., K. Islam, and J. Sumelius. 2011. "Determinants of Technical Efficiency of Rice
Farms in North-Central and North-Western Regions in Bangladesh." The Journal of
Developing Areas 45(1):73.
Balcombe, K., I. Fraser, L. Latruffe, M. Rahman, and L. Smith. 2008. "An application of the
DEA double bootstrap to examine sources of efficiency in Bangladesh rice farming."
Applied Economics 40:1919-1925.
Balcombe, K., F. Lain, R. Mizanur, and S. Laurence. 2007. "Examining the technical
efficiency of rice producers in Bangladesh." Journal of International Development
19(1):1-16.
Brazdik, F. "Non parametric analysis of Technical Efficiency: Factors affecting Efficiency of
West Java Rice Farms." CERGE- Economics Institute, Charles University, Prague.
CBSL. 2010. Annual Report-2010. Colombo: Central Bank of Sri Lanka.

17
Coelli, T., S. Rahman, and C. Thirtle. 2002. "Technical, Allocative, Cost and Scale
Efficiencies in Bangladesh Rice Cultivation: A Non-parametric Approach." Journal
of Agricultural Economics 53(3):607-626.
Coelli, T.J., P. Rao, C.J. O'Donnell, and G.E. Battese. 2005. An introduction to efficiency and
productivity analysis. New York: Springer.
DCS (2002) Agricultural Census 2002. Colombo, Department of Census and Statistics of Sri
Lanka.
Dhanapala, M.P. (2000) Bridging the Rice Yield Gap in Sri Lanka, ed. M. Papademetrious,
Dent F.J. and Herath, E. M. Bangkok, Thailand., Food and Agricultural Organization
of the United Nations.
Dhungana, B.R., P.L. Nuthall, and G.V. Nartea. 2004. "Measuring the economic inefficiency
of Nepalese rice farms using data envelopment analysis." Australian Journal of
Agricultural and Resource Economics 48(2):347-369.
DOA (2011) Rice. Retrieved from http://www.agridept.gov.lk/index.php/en/crop-
recommendations/808, vol. 2011, Department of Agriculture, Sri Lanka.
Ekanayake, S.A.B., and S.K. Jayasuriya. 1987. "Measurement of Firm-Specific Technical
Efficiency: A Comparison of Methods." Journal of Agricultural Economics
38(1):115-122.
Gocht, A., and K. Balcombe. 2006. "Ranking efficiency units in DEA using bootstrapping an
applied analysis for Slovenian farm data." Agricultural Economics 35(2):223-229.
Gunaratne, S., and S. Thiruchelvam. 2002. "Comparative Study on Technical Efficiency of
Paddy Production under Major and Minor Irrigation Schemes in Anuradhapura
District." Tropical Agricultural Research Vol. 14.
IPS. "State of the Economy (SOE) report." Institute of Policy Studies of Sri Lanka.
Karunarathne, S.S., and H.M.G.Herath. 1989. "Efficiency of Rice Production under Major
Irrigation Conditions: A Frontier Production Function Approach." Tropical
Agricultural Research Vol.1.
Khan, A., F.A. Huda, and A. Alam. 2010. "Farm Household Technical Efficiency: A Study
on Rice Producers in Selected Areas of Jamalpur District in Bangladesh." European
Journal of Social Sciences 14(2):262-271.
Kikuchi, M., R. Barker, M. Samad, and P. Weligamage. 2000. "Comparative Advantage of
Rice Production in an Ex-rice Importing Country: The Case of Sri Lanka." Paper
presented at Third Conference of Asian Society of Agricultural Economists Jaipur,
India.
Mariano, M.J., R. Villano, and E. Fleming. 2011. "Technical Efficiency of Rice Farms in
Different Agroclimatic Zones in the Philippines: An Application of a Stochastic
Metafrontier Model." Asian Economic Journal 25(3):245-269.
Mugera, A.W., and M. Langemeier. 2011. "Does Farm Size and Specialization Matter for
Productive Efficiency? Results from Kansas." Journal of Agricultural and Applied
Economics 43(4):515-528.
Olson, K., and L.H. Vu. 2007. "Changes in Economic Efficiency and Factors Explaining
Differences between Minnesota Farm Households." Paper presented at American
Agricultural Economics Association Annual Meeting. Portland, US, July 29-August
1, 2007.
Rafeek, M.I.M., and P.A. Samarathunga. "An Analysis of Competitiveness of the Rice Sector
in Sri Lanka." Socio Economic and Planning Centre, Department of Agriculture.
Peradeniya. Sri Lanka.
Rahman, S. 2010. "Women’s Labour Contribution to Productivity and Efficiency in
Agriculture: Empirical Evidence From Bangladesh." Journal of Agricultural
Economics 61(2):318-342.
18
Rahman, S., and M. Rahman. 2009. "Impact of land fragmentation and resource ownership
on productivity and efficiency: The case of rice producers in Bangladesh." Land Use
Policy 26(1):95-103.
Rahman, S., A. Wiboonpongse, S. Sriboonchitta, and Y. Chaovanapoonphol. 2009.
"Production Efficiency of Jasmine Rice Producers in Northern and North-eastern
Thailand." Journal of Agricultural Economics 60(2):419-435.
Simar, L., and P.W. Wilson. 2000. "A General Methodology for Bootstrapping in Non-
Parametric Frontier Models." Journal of Applied Statistics 27(6):779-802.
---. 1998. "Sensitivity Analysis of Efficiency Scores: How to Bootstrap in Nonparametric
Frontier Models." Management Science 44(1):49-61.
Tan, S., N. Heerink, A. Kuyvenhoven, and F. Qu. 2010. "Impact of land fragmentation on
rice producers’ technical efficiency in South-East China." NJAS - Wageningen
Journal of Life Sciences 57(2):117-123.
Thiruchelvam, S. 2005b. "Agricultural Production Efficiency of Bethma Cultivation in
Mahaweli System H." Sri Lankan Journal of Agricultural Economics 7(1):1-20.
---. 2005a. "Efficiency of Rice Production and Issues Relating to Cost of Production in the
Districts of Anuradhapura and Polonnaruwa Districts." Journal of National Science
Foundation Sri Lanka 33(4):247-256.
Udayanganie, D., P. Prasada, S. Kodithuwakku, J. Weerahewa, and C. Little. 2006.
"Efficiency of the Agrochemical Input Usage in the Paddy Farming Systems in the
Dry Zone of Sri Lanka." Paper presented at Canadian Agricultural Economic Society
Annual Meeting, May 25-28, 2006, . Montreal, Quebec, May 25-28, 2006,.
Villano, R., and E. Fleming. 2006. "Technical Inefficiency and Production Risk in Rice
Farming: Evidence from Central Luzon Philippines." Asian Economic Journal
20(1):29-46.
Vu, L.H. 2008. "Essays on the Economics of Food Production and Consumption in Vietnam."
PhD Thesis, University of Minnesota.
Wadud, A. 2003. "Technical, Allocative, and Economic Efficiency of Farms in Bangladesh:
A Stochastic Frontier and DEA Approach." The Journal of Developing Areas 37(1
):109-126.
Wadud, A., and B. White. 2000. "Farm household efficiency in Bangladesh: a comparison of
stochastic frontier and DEA methods." Applied Economics 32(13):1665-1673.
Weerahewa, J., H.M. Gunatilake, and H. Pitigala. 2003. "Future of Paddy Farming in Sri
Lanka: Scale, Comparative Advantage and Rural Poverty." Sri Lanka Economic
Journal 3(2):104-144.
Yao, R.T., and G.E. Shively. 2007. "Technical Change and Productive Efficiency: Irrigated
Rice in the Philippines." Asian Economic Journal 21(2):155-168.

19
Table 1: Recent frontier efficiency studies on rice cultivation in Asia
Source: Authors own literature search
Authors Year Country Model Efficiency
measures
Other Asian countries
Wadud and White 2000 Bangladesh Stochastic and Non-parametric TE
Coelli et al 2002 Bangladesh Non-parametric TE, AE,
CE, SE
Wadud 2003 Bangladesh Stochastic and Non-parametric TE, AE,
CE, SE
Dhungana et al. 2004 Nepal Non-parametric TE, AE,
CE, SE
(Villano and Fleming) 2006 Philippines Stochastic TE
Brazdic 2006 Indonesia Non-parametric TE
Yao and Shively 2007 Philippines Stochastic TE
Balcombe et al 2007 Bangladesh Stochastic TE
Balcombe et al 2008 Bangladesh Non-parametric TE
Vu 2008 Vietnam Stochastic and Non-parametric TE, SE
Rahman and Rahman 2008 Bangladesh Stochastic TE
Rahman et al. 2009 Bangladesh Stochastic TE
Rahman 2010 Bangladesh Stochastic TE
Tan et al. 2010 China Stochastic TE
Khan et al. 2010 Bangladesh Stochastic TE
Backman et al.
Marino et al.
2011
2011
Bangladesh
Philippines
Stochastic
Stochastic
TE
TE
Sri Lanka
Ekanayake and
Jayasuriya
1987 Mahaweli ‘H’ Deterministic and Stochastic TE
Karunarathna and
Herath
1989 Major
Irrigation
Stochastic TE
Gunaratne and
Thiruchelvam
2002 Major & Minor Stochastic TE
Thiruchelvam 2005 Mahaweli ‘H’ Stochastic TE
Thiruchelvam 2005 Major & Minor Stochastic TE
Udayanganie et al. 2006 Major Stochastic TE

20
Table 2: Summary Statistics of Main Variables Irrigated Rain-fed
Mean SD Min Max Mean SD Min Max
Quantities
Rice (kg/ac) 2220.38 412.20 1568.00 3175.00 1794.09 313.49 1120.00 2240.00
Seed (kg/acre) 40.09 3.91 24.00 50.00 41.80 9.34 30.00 80.00
Fertilizer (kg/acre) 163.32 33.65 65.00 224.00 145.85 37.08 120.00 304.00
Chemicals (lit/ac) 1.63 1.03 0.00 4.40 1.32 1.40 0.00 5.50
Labour (days/acre) 18.13 9.16 7.60 55.84 33.59 14.00 12.68 79.36
Machinery (Rs/acre) 9579.71 2528.42 2600.00 16100.00 8969.28 1975.49 4166.67 14800.00
Prices
Rice (Rs/kg) 31.83 6.08 20.00 55.00 32.17 1.97 25.00 35.00
Seed (Rs/kg) 27.80 7.51 18.00 42.50 29.36 7.08 17.50 54.00
Fertilizer (Rs/kg) 7.00 0.00 7.00 7.00 7.00 0.00 7.00 7.00
Chemicals (Rs/kg) 1248.11 412.53 0.00 2250.00 1182.16 514.01 0.00 2000.00
Labour (Rs/day) 519.72 50.25 443.49 635.26 553.98 43.50 448.04 600.00
Other
Family labour (% of
labour))
48.74 18.63 5.97 92.98 57.44 21.88 9.62 95.35
Female labour (% of
labour)
20.37 19.21 0.00 56.52 7.38 11.02 0.00 41.67
Machinery (% of
total cost)
41.96 10.14 8.04 59.50 30.50 9.54 17.57 54.44
Labour (% of total
cost)
39.25 12.94 16.67 83.46 57.65 12.27 26.12 74.72
Farm size (acres) 2.13 1.46 0.25 6.50 1.22 0.83 0.25 3.00
Ownership (Binary) 0.60 0.49 0.00 1.00 0.60 0.50 0.00 1.00
Table 3: Technical, Allocative, Cost and Scale Efficiency Estimates
TEcrs TEvrs TEnirs CEvrs AEvrs SE
Mean 0.75 0.87 0.76 0.73 0.84 0.87
SD 0.16 0.13 0.17 0.15 0.12 0.15
Min 0.32 0.51 0.32 0.33 0.52 0.36
Max 1.00 1.00 1.00 1.00 1.00 1.00
IRS (%) 68.89
DRS (%) 21.11
CRS (%) 10.00
Irrigation
Major 0.83 0.91 0.85 0.79 0.87 0.91
Minor 0.69 0.85 0.70 0.76 0.90 0.82
Rain-fed 0.66 0.82 0.66 0.62 0.76 0.81

21
Table 4: Bias corrected Technical Efficiency Scores
TEvrs TEvrs
Bias
corrected
Bias Variance UB LB
Mean 0.8653 0.8031 0.0621 0.0023 0.8607 0.7391
SD 0.1270 0.1091 0.0277 0.0022 0.1263 0.0967
Min 0.5134 0.4814 0.0289 0.0004 0.5108 0.4514
Max 1.0000 0.9517 0.1285 0.0083 0.9980 0.9132
Percentile
1th
0.5134
0.4814
0.0289
0.0004
0.5108
0.4514
5th
0.6112 0.5790 0.0342 0.0006 0.6083 0.5428
25th
0.7753 0.7287 0.0422 0.0009 0.7714 0.6945
50th
0.8859 0.8318 0.0531 0.0014 0.8810 0.7447
75th
1.0000 0.8913 0.0777 0.0030 0.9941 0.8031
95th
1.0000 0.9353 0.1272 0.0081 0.9951 0.8661
Irrigation
Major
0.9065
0.8359
0.0706
0.0030
0.9017
0.7612
Minor 0.8493 0.7902 0.0591 0.0020 0.8446 0.7361
Rain-fed 0.8240 0.7686 0.0554 0.0018 0.8197 0.7096
Note: Results of the bootstrap efficiency estimates with 5000 replicates
Table 5: Input use ratios
Note: Ratio between cost efficient and technically efficient input levels ( * / )x x
Level of input use
Seed Fertilizer Chemicals Labour Machinery
Mean 1.22 1.08 1.36 1.63 1.30
SD 0.33 0.22 1.08 0.80 0.41
Min 0.82 0.60 0.00 0.70 0.41
Max 2.38 1.75 5.44 5.44 2.60
Over using farms
(%)
68.89 56.67 52.22 76.67 73.33
Major 1.19 0.99 1.64 1.31 1.29
Minor 1.18 1.19 1.19 1.50 1.33
Rain-fed 1.28 1.15 1.01 2.17 1.30

22
Table 6: Relationship between excess input use and efficiency measures
Technical
Efficiency
(VRS)
Allocative
Efficiency
(VRS)
Cost
Efficiency
VRS
Intercept 94.4130*
(1.3859)
90.1934*
(1.3393)
84.8071*
(1.4564)
Seed 0.0045*
(0.0020)
0.0021
(0.0019)
0.0056*
(0.0021)
Fertilizer -0.0152*
(0.0030)
0.0048
(0.0029)
-0.0084*
(0.0032)
Chemicals 0.0003
(0.0007)
0.0005
(0.0007)
0.0007
(0.0007)
Labour -0.0005*
(0.0001)
-0.0011*
(0.0001)
-0.0014*
(0.0001)
Machinery -0.0010*
(0.0002)
-0.0004*
(0.0002)
-0.0012*
(0.0002)
Note: * indicates significance at the 5% level (P<0.05)

23
Table 7: Impact of Farm Size and Resource Ownership and Use on Production
Efficiency
Variables
Technical
Efficiency
(VRS)
Allocative
Efficiency
(VRS)
Cost
Efficiency
VRS
Intercept 1.0530*
(0.0578)
0.5795*
(0.0620)
0.6391*
(0.0775)
Farm size 0.0207
(0.0107)
-0.0164
(0.0115)
0.0041
(0.0143)
Irrigation
Minor -0.0604*
(0.0302)
0.0662*
(0.0324)
0.0056
(0.0405)
Rain-fed -0.0998*
(0.0267)
-0.0721*
(0.0286)
-0.1463*
(0.0358)
Date of sowing
Intermediate -0.0008
(0.0228)
-0.0201
(0.0244)
-0.0234
(0.0305)
Late -0.0147
(0.0364)
-0.0549
(0.0390)
-0.0593
(0.0488)
Seed source
Private 0.0695*
(0.0287)
0.0454
(0.0308)
0.1080*
(0.0385)
Other farmers 0.0076
(0.0313)
0.0273
(0.0336)
0.0417
(0.0420)
Self -0.0735*
(0.0253)
0.0180
(0.0271)
-0.0381
(0.0339)
Tenancy -0.0437*
(0.0200)
0.0351
(0.0215)
0.0010
(0.0269)
Machinery usage
(% total cost)
-0.0056*
(0.0011)
0.0058*
(0.0012)
0.0005
(0.0015)
Family labour
(% total labour)
0.0008
(0.0005)
0.0012*
(0.0006)
0.0018*
(0.0007)
Female labour
(% total labour)
0.0022*
(0.0008)
-0.0008
(0.0009)
0.0012
(0.0011)
Log likelihood 93.5859 87.2438 67.1410
Pseudo R2 0.5977 0.4546 0.6466
Note: * indicates significance at the 5% level (P<0.05)
24
Table 8: Average Marginal Effects of TE, AE and CE
Cost
Efficiency
(VRS)
Technical
Efficiency
(VRS)
Intercept
-0.7665*
(0.0163)
0.9179*
(0.0134)
Technical Efficiency (VRS) 0.8346*
(0.0131)
Allocative Efficiency (VRS)
Cost Efficiency (VRS)
0.9178*
(0.0133)
-1.0769*
(0.0229)
1.1727*
(0.0185)
Note: * indicates significance at the 5% level (P<0.05)
Figure 1: Kernel Distribution of Efficiency Scores
01
23
4
Den
sity
.4 .6 .8 1Efficiency score
TE
CE
AE
SE