Embed Size (px)
Citation preview

Journal of Constructional Steel Research 59 (2003) 179–199www.elsevier.com/locate/jcsr
A new proposal of a simple model for thelateral-torsional buckling of unrestrained steel I-
beams in case of fire: experimental andnumerical validation
P.M.M. Vila Reala,∗, P.A.G. Pilotob, J.-M. Franssenc
a Department of Civil Engineering, University of Aveiro, 3810 Aveiro, Portugalb Department of Mechanical Engineering, Polytechnic of Braganca, Braganca, Portugal
c Department Civil Engineering, University of Liege, Liege, Belgium
Received 18 September 2001; received in revised form 21 February 2002; accepted 22 February 2002
Abstract
The behaviour of Steel I-Beams exhibiting lateral-torsional buckling at elevated temperaturehas been studied by means of experimental and numerical analysis. The authors in an earlierpaper have presented an analytical formula for the buckling resistance moment in the firedesign situation. This new proposal, different from the actual proposal of the Eurocode 3 Part1.2 has been validated in this work by comparison with the results from a set of 120 experi-mental and numerical tests performed on IPE 100 beams, submitted to temperatures varyingfrom room temperature to 600°C. The numerical simulations have been based on the measuredgeometrical dimensions of the cross-sections, the longitudinal imperfections, i. e. the out ofstraightness of the beams, the residual stresses and the yield strength. The Eurocode simplemodel promotes ultimate loads that depend mainly on the non-dimensional slenderness of thebeams. The analytical results provided by the Eurocode 3, for a certain range of the slender-ness, appear to be unsafe when compared with the numerical and experimental results. It isshown that the new proposal is safer than the Eurocode 3 formulas. 2002 Elsevier Science Ltd. All rights reserved.
Keywords: Steel beams; Lateral-torsional buckling; Fire; New proposal; Numerical and experimental vali-dation
∗ Corresponding author. Tel.:+351-234-370049; fax:+351-234-370094.E-mail address: [email protected] (P.M.M. Vila Real).
0143-974X/02/$ - see front matter 2002 Elsevier Science Ltd. All rights reserved.PII: S0143 -974X(02)00023-8

180 P.M.M. Vila Real et al. / Journal of Constructional Steel Research 59 (2003) 179–199
1. Introduction
The behaviour of steel I-beams at elevated temperatures has been analysed numeri-cally [1,2] leading to a new proposal for the evaluation of the lateral-torsional buck-ling resistance. This new proposal contains a scalar b that has to be calibrated toensure an appropriate safety level, which is done in this work throughout a large setof experimental tests and numerical simulations.
Although the problem of lateral-torsional buckling of steel I-beams at room tem-perature is well known [3–6] the same problem at elevated temperature is not. Amongthe work done in this field there is the paper by Bailey et al. [7], who used a three-dimensional computer model to investigate the ultimate behaviour of uniformlyheated unrestrained beams. In their work the computed failure temperature is relatedto the degree of utilisation when compared with the same temperature given by theCodes, but no analytical proposal is made for the lateral-torsional buckling resistancemoment in fire situation. Nevertheless the results presented indicate that the Eurocode3 Part 1.2 [8] overestimates the critical temperature for unrestrained simple beamsin fire resistance calculations, which is in accordance with the results of the authorsfor a certain range of the slenderness, as shown later in this paper.
The proposal the present paper aims to validate was based on the numerical resultsfrom the SAFIR program [9], a geometrical and materially non-linear code speciallyestablished to analyse three-dimensional structures, including the effect of warping,in case of fire. The capability of this code to model the lateral-torsional buckling ofbeams has been demonstrated [10] at room temperature by comparisons against theformulas of the Eurocode 3, Part 1.1 [11]. Franssen [12] has also compared theSAFIR program with four other structural codes in the case of plane buckling ofsteel heated columns. The program is capable of considering loads placed at anylevel on a cross-section and it is also possible to introduce residual stresses owingto the fibre type finite element used.
It must be emphasised that the simple model that this paper wants to validate,presented by Vila Real et al. [1,2], was established on the base of numerical simula-tions using characteristic values for initial out-of-straightness (L/1000) and residualstresses (0.3 × 235MPa), which are unlikely to be simultaneously present in a testor in a real building. In the experimental work, the geometrical imperfections andthe residual stresses were measured as well as the nominal yield strength of thematerial and the Young Modulus. These measured values were used in the numeri-cal calculations.
A set of 120 full-scale tests based on a reaction frame and on a hydraulic systemhas been carried out for beams of the European series IPE 100 with lengths varyingfrom 0.5 to 6.5 m. Three tests have been done for each beam length and for eachtemperature level, due to statistics requirements. The beams were electrically heatedby means of ceramic mat elements, heated by a power unit of 70 kVA. A ceramicfibre mat was used around the beam and the heating elements in order to increasethe thermal efficiency.
181P.M.M. Vila Real et al. / Journal of Constructional Steel Research 59 (2003) 179–199
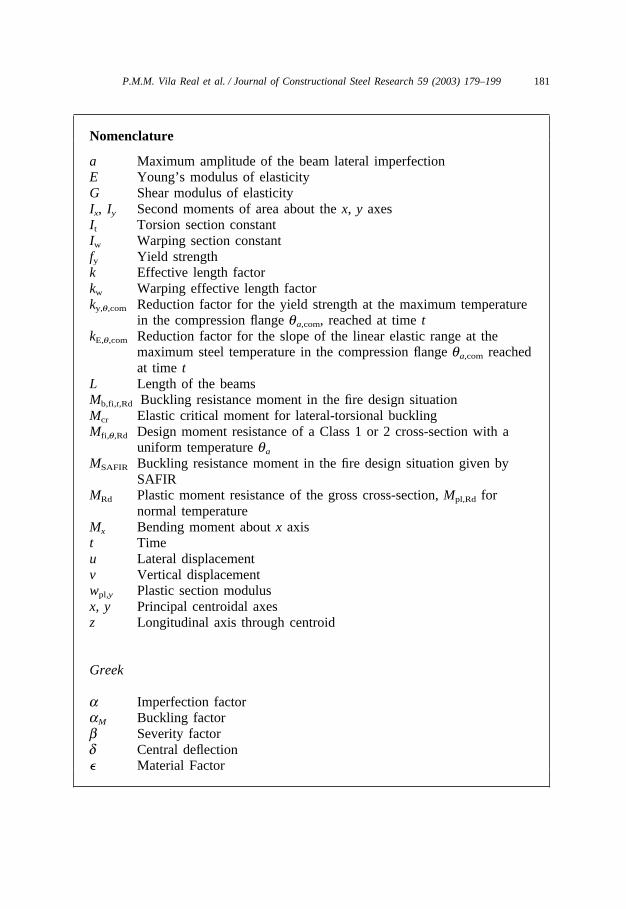
Nomenclature
a Maximum amplitude of the beam lateral imperfectionE Young’s modulus of elasticityG Shear modulus of elasticityIx, Iy Second moments of area about the x, y axesIt Torsion section constantIw Warping section constantfy Yield strengthk Effective length factorkw Warping effective length factorky,q,com Reduction factor for the yield strength at the maximum temperature
in the compression flange qa,com, reached at time tkE,q,com Reduction factor for the slope of the linear elastic range at the
maximum steel temperature in the compression flange qa,com reachedat time t
L Length of the beamsMb,fi,t,Rd Buckling resistance moment in the fire design situationMcr Elastic critical moment for lateral-torsional bucklingMfi,q,Rd Design moment resistance of a Class 1 or 2 cross-section with a
uniform temperature qa
MSAFIR Buckling resistance moment in the fire design situation given bySAFIR
MRd Plastic moment resistance of the gross cross-section, Mpl,Rd fornormal temperature
Mx Bending moment about x axist Timeu Lateral displacementv Vertical displacementwpl,y Plastic section modulusx, y Principal centroidal axesz Longitudinal axis through centroid
Greek
a Imperfection factoraM Buckling factorb Severity factord Central deflection� Material Factor
182 P.M.M. Vila Real et al. / Journal of Constructional Steel Research 59 (2003) 179–199
gM0 Partial safety factor (usually gM,1 � 1.0)gM,fi Partial safety factor for the fire situation (usually gM,fi � 1.0)q Rotationf Twist rotationlLT SlendernesslLT Non-dimensional slenderness at room temperaturelLT,q,com Non-dimensional slenderness for the maximum temperature in the
compression flange qa,com
lLT,fi Non-dimensional slenderness in the fire design situationcLT,fi Reduction factor for lateral-torsional buckling in the fire design
situation
2. Experimental and numerical case study
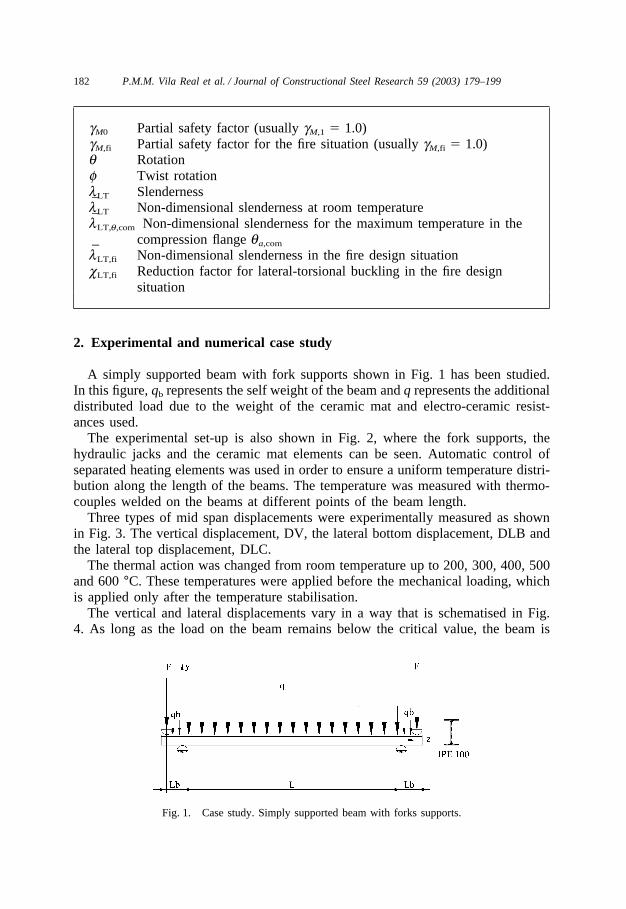
A simply supported beam with fork supports shown in Fig. 1 has been studied.In this figure, qb represents the self weight of the beam and q represents the additionaldistributed load due to the weight of the ceramic mat and electro-ceramic resist-ances used.
The experimental set-up is also shown in Fig. 2, where the fork supports, thehydraulic jacks and the ceramic mat elements can be seen. Automatic control ofseparated heating elements was used in order to ensure a uniform temperature distri-bution along the length of the beams. The temperature was measured with thermo-couples welded on the beams at different points of the beam length.
Three types of mid span displacements were experimentally measured as shownin Fig. 3. The vertical displacement, DV, the lateral bottom displacement, DLB andthe lateral top displacement, DLC.
The thermal action was changed from room temperature up to 200, 300, 400, 500and 600 °C. These temperatures were applied before the mechanical loading, whichis applied only after the temperature stabilisation.
The vertical and lateral displacements vary in a way that is schematised in Fig.4. As long as the load on the beam remains below the critical value, the beam is
Fig. 1. Case study. Simply supported beam with forks supports.

183P.M.M. Vila Real et al. / Journal of Constructional Steel Research 59 (2003) 179–199
Fig. 2. (a) Experimental set up. (b) Fork support and hydraulic jack.
Fig. 3. Measured mid-span beam displacements.
Fig. 4. Load versus mid-plane displacements; a—room temperature, b—elevated temperatures.
184 P.M.M. Vila Real et al. / Journal of Constructional Steel Research 59 (2003) 179–199
stable. However, as the load is increased a critical value is reached when slightlydeflected and twisted form of equilibrium becomes possible. The initial plane beamconfiguration is now unstable, and the lowest load at which this deflected conditionoccurs is called the beam critical load.
The stress–strain relationship used in the numerical simulation of the experimentaltests is a function of the measured material strength and varies with temperature,according to Eurocode 3, Part 1-2 [8].
A three-dimensional beam element with 15 degrees of freedom and three nodeshas been used to numerically simulate the behaviour and the buckling moment resist-ance of the beams loaded as shown in Fig. 1.
3. Lateral-torsional buckling: simple formulas
3.1. Lateral-torsional buckling according to the Eurocode 3
The design buckling resistance moment of a laterally unrestrained beam with aClass1 or 2 cross-section type, in case of fire is given in the Eurocode 3, Part 1-2[8] by
Mb,fi,t,Rd �cLT,fi
1.2wpl,yky,q,comfy
1gM,fi
(1)
where cLT,fiis the reduction factor for lateral-torsional buckling in the fire designsituation, given by
cLT,fi �1
fLT,q,com � �[fLT,q,com]2�[lLT,q,com]2(2)
and
fLT,q,com �12
[1 � a(lLT,q,com�0.2) � (lLT,q,com)2] (3)
wpl,y is the plastic section modulus; ky,q,com the reduction factor for the yield strengthat the maximum temperature in the compression flange qa,com, reached at time t; andgM,fiis the partial safety factor for the fire situation (usually gM,fi).Eq. (1) is used ifthe non-dimensional slenderness lLT,q,com for the temperature reached at time t,exceeds the value of 0.4. If the slenderness is lower than this threshold value, it isconsidered that no lateral buckling will occur and the full plastic bending resistanceis considered.
The constant 1.2 is an empirically determined value and is used as a correctionfactor that allows for a number of effects. The reduction factor for lateral-torsionalbuckling in fire design situation, cLT,fi, must be determined in the same way as it isat room temperature, but using the non-dimensional slenderness lLT,q,com (or lLT,fi,if the temperature field in the cross-section is uniform) given by

185P.M.M. Vila Real et al. / Journal of Constructional Steel Research 59 (2003) 179–199
lLT,q,com � lLT,fi � lLT�ky,q,com
kE,q,com
(4)
where ky,q,comis the non-dimensional slenderness at room temperature given by [11](for Class 1 or 2 cross-sections)
lLT �lLT
l1(5)
where
l1 � π�Efy
(6)
lLT � π�Ewpl,y
Mcr(7)
where Mcr is the elastic critical moment for lateral-torsional buckling of the beam.Substituting from Eqs. (6) and (7) in (5)
lLT � �wpl,yfy
Mcr
� �Mpl
Mcr
(8)
where Mpl is the plastic moment resistance of the gross cross-section; kE,q,com thereduction factor for the slope of the linear elastic range at the maximum steel tem-perature reached at time t.
The imperfection parameter a on Eq. (3) depends on the type of cross-section,being 0.21 for hot rolled sections or 0.49 for welded cross-section [8].
3.2. The new proposal
A new proposal for the lateral-torsional buckling resistance, based on numericalcalculations was proposed by Vila Real et al. [1,2]. According to this new proposal,and adopting for the lateral-torsional buckling a similar proposal as the one thatFranssen et al. [13] used to represent the behaviour of axially loaded columns whensubmitted to fire conditions, the design buckling resistance moment of a laterallyunrestrained beam with a Class 1 or 2 cross-section-type, can be calculated by
Mb,fi,t,Rd � cLT,fiwpl,yky,q,comfy
1gM,fi
(9)
where cLT,fi, is given by
cLT,fi �1
fLT,q,com � �[fLT,q,com]2�[lLT,q,com]2(10)
with

186 P.M.M. Vila Real et al. / Journal of Constructional Steel Research 59 (2003) 179–199
fLT,q,com �12
[1 � alLT,q,com � (lLT,q,com)2] (11)
The imperfection factor a, in this proposal, is a function of a severity factor b
a � be (12)
The severity factor b, which should be chosen in order to ensure an appropriatesafety level, has been taken as 0.65 [1,2], and the material factor � is given by
e � �235fy
(13)
where fy represents the nominal yield strength of the material in MPa. The remainingfactors should be calculated as in the Eurocode 3 [8].
Comparing Eqs. (1) and (9) we can verify that with this new proposal we do notuse the empirical constant 1.2 which is used as a correction factor in the proposalof the Eurocode 3.
Eqs. (10) and (11) are in fact exactly the same as Eqs. (2) and (3), except thatthe threshold limit of 0.20 for lLT does not appear in Eq. (11). The fact that thethreshold limit does not appear changes the shape of the buckling curve.
A comparison between this new proposal and the Eurocode 3 formulas is madein Fig. 5. In this figure on the vertical axis the following ratio is marked:
Mb,fi,t,Rd
Mfi,q,Rd
� cLT,fi (14)
where, Mb,fi,t,Rd is given by Eq. (1) or Eq. (9) and Mfi,q,Rd is the design momentresistance of a Class 1 or 2 cross-section with a uniform temperature θa given by
Mfi,q,Rd � ky,q
gM0
gM,fiMRd (15)
Fig. 5. Comparison between design buckling curve from EC3 and the new proposal.

187P.M.M. Vila Real et al. / Journal of Constructional Steel Research 59 (2003) 179–199
where, gM,0 � 1.0, gM,fi � 1.0 and MRd is the plastic resistance of the gross cross-section, Mpl,Rd, for normal temperature, which is given, using gM0 � 1.0, by
MRd �wpl,yfy
gM0
(16)
It can be verified in Fig. 5 that the shape of the buckling curve is different, withthe new one starting from cLT,fi � 1.0 for lLT,fi � 0.0 but decreasing even for verylow slenderness, instead of having a horizontal plateau up to lLT,fi � 0.4 as in thepresent version of the Eurocode 3 [8]. The lateral-torsional buckling curve nowdepends on the steel grade due to the parameter � that appears in the imperfectionfactor as it can be seen in Eq. (13) and in Fig. 5.
4. Critical moment
The critical moment, Mcr, necessary to evaluate the non-dimensional slendernesslLT,q,com, according the Eurocode 3 is obtained solving the following differentialequations [5,6]
(EIyu�)� � (Mxf)� � 0 (EIwf�)��(GItf�)� � (Mxu�) � 0 (17)
which describe the lateral-torsional buckling equilibrium of the beam. The first equ-ation represents the equality at equilibrium between the out-of-plane bending action�(Mxf)� and the flexural resistance (EIyu�)� and the second equation represents theequality between the torsion action �Mxu�, and the warping and torsional resistances(EIwf�)� and �(GItf�)�. The bending moment distribution Mx due to the transverseload q varies along the beam and so the differential equations have some variablecoefficients and are difficult to solve [5].
The critical moment can also be obtained by the energy method. Assuming thatthe approximate solution of the buckled shapes of the beam is given by the para-bolic formulas:
ud
�fq
�zL
�z2
L2 (18)
where d and q represent the values of u and f at mid-span and z represents the co-ordinate along the beam axis and substituting Eq. (18) and all the derivatives intothe following energy equation
12�
L
0
(EIyu�2 � EIwf�2 � GItf�2)dz �12�
L
0
2Mxfu�dz �12�
L
0
q(yq�y0)f2dz (19)
� 0
and taking into account the moment distribution along the buckling length due tothe uniformly distributed load, it can be verified that the critical load F (see Fig. 1)

188 P.M.M. Vila Real et al. / Journal of Constructional Steel Research 59 (2003) 179–199
Fig. 6. Effective lateral buckling length, l � kL.(a) Elevation; (b) plan.
is function of the material properties, the beam cross-section geometric characteristicsand also function of the distributed load. This critical force F when introduced intothe moment distribution, gives the critical moment, Mcr, at the supports. This momentcan be compared to the critical elastic moment, Mpb
cr for the pure bending case usingthe moment distribution factor aM [5,6] as shown in the following equation
Mcr � aMMpbcr � aM
π2EIy
(kL)2�� kkw�2Iw
Iy
�(kL)2GIt
π2EIy
(20)
where k represents the effective lateral buckling length factor and kw the factor whichaccounts for the beam end warping. Regarding the type of loading and support con-ditions used in the experimental tests, the value of k � 0.5 has been used to representthe total restraint of the lateral movement due to the load application process (seeFig. 6) and the value of kw � 1 to the free end warping condition.
Fig. 7 shows the plan view of the one-half deformed beam obtained numerically.It is clearly shown that when the load application point is laterally restrained theeffective lateral buckling length factor k must be approximately taken as 0.5.
Fig. 7. Plan view from the lateral deformation of the beam at 600 °C (displacements amplified by afactor 20). (a) Restrained lateral movement; (b) unrestrained lateral movement.

189P.M.M. Vila Real et al. / Journal of Constructional Steel Research 59 (2003) 179–199
Fig. 8. Deformed beam after heated to 600 °C. Experimental test.
The deformed shape of the beam obtained in the experimental tests is shown inFig. 8. The analytical calculations have shown that the moment distribution factoraM is not constant and depends on the buckling length of the tested beam as shownin Fig. 9.
5. Experimental evaluation
A multifunction reaction structure (Fig. 2) was used to test the beams at elevatedtemperatures and to apply the mechanical loads. The loads were applied by means
Fig. 9. Moment distribution factor aM (length in meters).

190 P.M.M. Vila Real et al. / Journal of Constructional Steel Research 59 (2003) 179–199
Fig. 10. (a) Points of measurement of the residual stresses.(b) Assumed distribution of the residual stresses.
of two hydraulic jacks with 600 k N of capacity each and the beams were heatedusing electric ceramic mats. Five hundred meters of IPE 100 profile was used, giving120 beams with lengths varying from 0.5 to 6.5 m.
5.1. Residual stresses
The magnitude and geometric distribution of the residual stresses may vary withthe geometry of the cross-section and with the straightening and cooling processes.The residual stresses were measured at four points (f1, f2, w1 and w2) as it is shownin Fig. 10.
Table 1Experimental results of residual stresses
Specimen Flange (f1) (Mpa) Flange (f2) (Mpa) Web (w1) (Mpa) Web (w2) (Mpa)
P31 NM 8 NM 1P23 NM NM NM 20P34 45 NM NM NMP33 41 15 NM 20P44 NM 4 NM 38P40 54 18 �22 26P37 80 6 �12 20P01 35 NM �32 6P21 46 7 �25 34P11 50 31 �12 NMAverage 50 13 �21 21
NM—not measured value.

191P.M.M. Vila Real et al. / Journal of Constructional Steel Research 59 (2003) 179–199T
able
2M
axim
umam
plitu
deof
the
geom
etri
cbe
ams
impe
rfec
tion
Tem
p.(°
C)
L=0
.5a
L=1
.5a
L=2
.5a
L=3
.5a
L=4
.5a
L=5
.5a
L=6
.5a
(m)
(m)
(m)
(m)
(m)
(m)
(m)
20P3
10.
5P3
31.
0P3
61.
5P0
13.
0P2
07.
0P2
23.
0P1
17.
020
P31
0.5
P33
1.0
P35
1.5
P02
1.0
P17
5.0
P23
3.0
P17
7.0
20P3
10.
5P3
33.
0P3
60.
5P0
73.
0P2
05.
0P2
73.
0P1
24.
020
0P3
10.
5P3
30.
5P3
81.
0P3
81.
5P2
32.
5–
NM
P19
3.0
200
P31
0.5
P34
1.0
P41
1.5
P38
3.0
P21
3.0
–N
MP2
04.
520
0P0
40.
5P3
30.
5P3
91.
5P3
91.
0P3
02.
5–
NM
P14
4.0
300
P05
0.5
P33
0.5
P38
1.0
P41
3.5
P28
3.0
–N
MP1
53.
530
0P0
20.
5P3
40.
5P3
71.
0P3
91.
5P2
43.
5–
NM
P16
4.0
300
P31
0.5
P34
1.0
P36
1.0
P40
1.0
P25
3.0
–N
MP1
36.
040
0P0
70.
5P2
01.
5P4
00.
5P4
01.
0P1
52.
5P2
52.
5P1
87.
540
0P0
60.
5P0
91.
0P4
61.
0P3
72.
0P2
52.
5P0
83.
0P1
02.
040
0P3
10.
5P0
80.
5P4
42.
0P4
14.
0P2
62.
0P0
92.
5P0
23.
550
0P3
10.
5P4
31.
0P4
31.
0P0
61.
0P1
61.
5P2
93.
0P0
53.
050
0P3
10.
5P4
21.
0P4
21.
0P0
41.
0P1
42.
5P2
72.
0P0
76.
050
0P1
00.
5P4
41.
0P4
50.
5P0
52.
0P1
83.
5P2
62.
0P0
64.
560
0P0
30.
5P4
61.
5P4
21.
5P1
00.
5P1
34.
0P2
84.
0P0
18.
060
0P0
10.
5P4
50.
5P4
30.
5P0
91.
5P1
23.
0P3
01.
0P0
36.
060
0P3
10.
5P4
31.
5P4
61.
0P0
31.
0P
2.0
P22
2.0
P04
2.0

192 P.M.M. Vila Real et al. / Journal of Constructional Steel Research 59 (2003) 179–199
The measurements were based on the drill hole method. Strain gauges were usedand it was necessary to introduce a mechanical interference in the system. Therequirement of keeping the disturbance as small as possible is a positive factor inthis method. The drill hole rosette requires a small drill hole of about 1.5 mm indiameter. This can be regarded as a non-destructive technique [14].
The residual stresses were measured on 10 different beams. Some of the measure-ments were not taken into account because the drilling tool broke. The average meas-
Table 3Cross-section dimensions
Specimen Tabulated technical data from Arbed
h (mm) 100 b (mm) 55 tf1 (mm) 5.7 tf2 (mm) 5.7 tw (mm) 4.1
P03 100.0 55.4 6.4 6.5 4.1P04 100.3 55.7 6.2 6.4 4.2P05 100.3 55.7 6.0 6.3 4.1P06 100.7 55.8 6.1 6.5 4.2P07 100.7 55.8 6.3 6.2 4.0P08 100.4 55.5 6.0 6.7 4.0P09 100.8 57.5 6.4 6.1 4.2P10 100.9 56.0 6.1 6.6 4.1P13 100.5 55.5 6.5 6.0 4.0P14 100.4 55.4 6.3 6.4 3.9P15 100.0 55.5 6.7 6.4 4.0P19 100.5 55.4 6.3 6.4 3.9P21 100.5 56.3 6.9 6.3 4.1P24 101.0 55.6 6.0 6.1 4.2P25 100.7 55.4 6.2 6.3 3.8P26 100.4 55.4 6.5 6.7 4.0P28 100.9 57.2 6.3 6.3 3.9P29 100.3 55.3 6.3 6.1 4.3P31 100.5 55.3 6.5 6.3 4.0P33 100.4 57.0 6.4 6.1 4.1P34 100.3 56.4 6.1 6.1 3.8P36 100.3 55.9 6.0 6.4 3.9P37 100.4 56.0 6.4 6.1 4.1P38 100.4 56.0 6.9 6.9 4.2P39 100.4 55.5 6.2 6.3 4.1P40 100.6 56.1 6.4 6.1 4.0P41 100.6 55.8 6.5 6.6 3.9P42 100.5 55.9 6.2 6.5 3.9P43 100.3 56.9 6.0 6.3 3.8P44 100.6 56.8 6.7 6.5 4.2P46 100.6 55.5 6.4 6.5 4.0Average 100.5 55.9 6.3 6.4 4.0SD 0.23 0.6 0.2 0.2 0.1
tf1 - top flange thickness; tf2 - bottom flange thickness

193P.M.M. Vila Real et al. / Journal of Constructional Steel Research 59 (2003) 179–199
Fig. 11. Tensile specimens.
ured values were used to represent the residual state of the tested beams and arelisted in Table 1.
5.2. Geometric imperfections
Two types of geometric imperfections were measured. One related to the cross-section dimensions, measured by digital callipers and the other related to the longi-
Table 4Material strength characterisation
Beam Location Maximum load (k N) Stress at Elasticity Yield strengthmaximum load modulus (Mpa)(Mpa) (Mpa)
P31 Web 55.410 412.031 209,447 305.024P31 Web 54.090 402.216 202,930 297.837P31 Web 54.630 406.231 324,456 302.828P31 Web 55.650 413.816 156,675 322.790P20 Web 56.910 432.447 257,548 321.287P24 Web 57.720 435.952 220,890 334.552P30 Web 58.820 445.606 232,605 345.125P30 Web 58.010 440.805 182,795 338.218P25 Web 57.610 440.443 294,006 330.025P21 Web 57.660 443.538 166,271 345.065P26 Web 56.750 419.438 262,188 316.866P31 Flange 57.150 424.970 146,026 325.984P31 Flange 54.090 402.216 202,930 297.837P31 Flange 69.800 452.772 186,776 315.000P31 Flange 60.480 449.732 229,050 311.811P31 Flange 62.070 450.566 262,974 312.377P31 Flange 63.170 453.026 217,057 316.210P31 Flange NM NM 249,754 315.000P31 Flange NM NM 146,223 325.000P31 Flange 63.543 453.294 265,968 320.000Average 58.531 432.172 220,828 320.000SD 4.007 18.540 49,019 14.000

194 P.M.M. Vila Real et al. / Journal of Constructional Steel Research 59 (2003) 179–199
Fig. 12. Lateral buckling resistance for each tested temperature. Experimental results. a) at room tem-perature; b) at 200°C; c) at 300°C; d) at 400°C; e) at 500°C; f) at 600°C.
Fig. 13. Beam design curves at elevated temperatures. Experimental results.

195P.M.M. Vila Real et al. / Journal of Constructional Steel Research 59 (2003) 179–199
tudinal lateral distance from an imaginary straight line, measured by a laser beammethod. In the numerical modelling, the measured longitudinal imperfections of thebeams have been approximated by the following expression
u(z) � asin�π × zL � (21)
where a is the measured maximum amplitude of the lateral imperfection, as is listedin Table 2.
The cross-section geometry imperfections were also measured and used in thenumerical calculation.
A set of 31 profiles from the originals 46 was used to measure the cross-sectiondimension as shown in Table 3. The calculated plastic modulus exceeds the foreseenvalues based on nominal dimensions.
Fig. 14. Lateral buckling resistance for each tested temperature. Numerical results. a) at room tempera-ture; b) at 200°C; c) at 300°C; d) at 400°C; e) at 500°C; f) at 600°C.

196 P.M.M. Vila Real et al. / Journal of Constructional Steel Research 59 (2003) 179–199
5.3. Material strength characterisation
A set of 20 tensile specimens extracted from the beams (see Fig. 11) was tested.The specimens were taken from the flange and web parts of the IPE100 beams, andfollow the Portuguese standard NP EN10002-1 [15]. Yield strength and elastic modu-lus evaluation are listed in Table 4, with its average values being respectively 320Mpa and 221 GPa.
5.4. Thermal action
Two different types of electro ceramic mat resistances measuring 1220 × 45 and610 × 85mm, with a maximum electric power of 2.7 kW each were used to heat thebeams. This material is able to support temperatures up to 1050 °C, although theexperiments were conducted up to 600 °C only and with a heat rate of 800 °C/h.
5.5. Lateral buckling resistance moments
The mechanical load was imposed as shown in Fig. 1. After temperature stabilis-ation a concentrated load F was increased by amounts of 2000 N until a certainvalue in which an increase in the displacement value did not correspond to a loadincrease. The experimental lateral buckling resistance moments are shown in Fig.12 for temperatures varying from room temperature up to 600 °C. Experimentalresults for tested temperatures above 400 °C have been plotted in the same chart asshown in Fig. 13.
Fig. 15. Beam design curves at elevated temperatures. Numerical results.
197P.M.M. Vila Real et al. / Journal of Constructional Steel Research 59 (2003) 179–199
6. Numerical evaluation
A set of 120 numerical calculations was made to calculate the buckling resistancemoment at elevated temperatures. A non-linear material and geometrical code, basedon two types of finite elements, made the study of the lateral-torsional buckling ofthe IPE 100 beams possible. Bi-dimensional plane linear elements were used todescribe the temperature field in the cross-section of the beams resulting from thethermal action. The warping function and the torsion stiffness have been calculatedfor each temperature level, according to the experimental measurements of the Youngmodulus and its temperature dependence according to the Eurocode 3.
The numerical lateral buckling resistance moments are shown in Fig. 14 for tem-peratures varying from room temperature up to 600 °C. The resistance momentsobtained by numerical simulation for all the temperatures were plotted in the chartin Fig. 15.
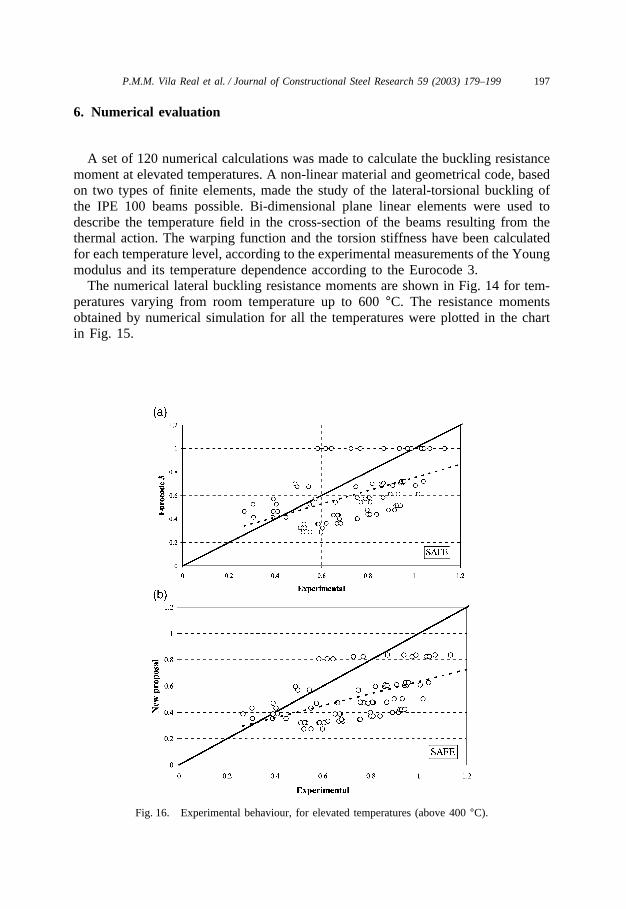
Fig. 16. Experimental behaviour, for elevated temperatures (above 400 °C).

198 P.M.M. Vila Real et al. / Journal of Constructional Steel Research 59 (2003) 179–199
Fig. 17. Numerical behaviour, for elevated temperatures (above 400 °C).
7. Experimental and numerical comparisons
Both experimental and numerical results have been compared with the simpleformulas from Eurocode 3 Part 1.2 and the new proposal. The results of these com-parisons are shown, respectively, in Figs. 16 and 17. The regression line is muchmore close to the ideal continuous line in the case of numerical calculation than forthe experimental results but in both cases the number of unsafe points is smallerwhen the new proposal is used. From these figures it is clear that the new proposalwith b � 0.65 is safer than the Eurocode 3.
8. Conclusions
The physical fact that elasticity modulus decreases faster than the yield strengthwhen the temperature increases, plus the fact that the stress–strain relationship atelevated temperature is not the same as at room temperature, produce a modificationof the lateral-torsional buckling curve at elevated temperature. The horizontal plateau

199P.M.M. Vila Real et al. / Journal of Constructional Steel Research 59 (2003) 179–199
valid at 20 °C up to a non-dimensional slenderness of 0.4 vanishes at elevated tem-peratures. The severity factor b � 0.65 suggested earlier in a previous work[1,2] hasbeen confirmed and it was shown that the new proposal for lateral-torsional buckling,is safer than the Eurocode 3 formulas.
Acknowledgements
This work was performed in the course of the research projectPRAXIS/P/ECM/14176/1998 sponsored by the Portuguese Foundation for Scienceand Technology. Special thanks to Prof Mario Vaz and the enterprise J. Soares Cor-reia are also due.
References
[1] Vila Real PMM, Franssen J-M. Lateral buckling of steel I beams under fire conditions—comparisonbetween the Eurocode 3 and the SAFIR code. Internal report No. 99/02, Institute of Civil Engineer-ing—Service Ponts et Charpents—of the University of Liege; 1999.
[2] VilaReal PMM, Franssen J-M. Numerical modelling of lateral buckling of steel I beams under fireconditions—comparison with Eurocode 3. J Fire Prot Eng, USA 2001;11(2):112–28.
[3] Papangelis JP, Trahair NS, Hancock GJ. Elastic flexural-torsional buckling of structures by computer.J Comput Struct 1998;68:125–37.
[4] Timoshenko PS, Gere JM. Theory of elastic stability. McGraw Hill Intern. Editions; 1963.[5] Trahair NS. Flexural-torsional buckling of structures. London: E&FN SPON-Chapman and Hall,
1993.[6] Trahair NS, Bradford MA. The behaviour and design of steel structures to AS 4100. E&FN SPON-
Chapman and Hall, 1998: London, 1998.[7] Bailey CG, Burgess IW, Plank RJ. The lateral-torsional buckling of unrestrained steel beams in fire.
J Constr Steel Res 1996;36:101–19.[8] CEN ENV 1993-1-2, Eurocode 3-design of steel structures-Part 1-2: general rules-structural fire
design; 1995.[9] Nwosu DI, Kodur VKR, Franssen J-M, Hum JK. User manual for SAFIR. A computer program for
analysis of structures at elevated temperature conditions. National Research Council Canada, Int.Report 782; 1999. p. 69.
[10] Vila Real PMM, Franssen J-M. Lateral buckling of steel I beams at room temperature-Comparisonbetween the EUROCODE 3 and the SAFIR code considering or not the residual stresses. Internalreport No. 99/01, University of Liege; 1999.
[11] CEN ENV 1993-1-1. Eurocode 3, design of steel structures-Part 1-1: general rules and rules forbuildings; 1992.
[12] Franssen J-M, Schleich JB, Talamona D, Twilt L, Both K. A comparison between five structuralfire odes applied to steel elements. In: Kashiwagi T, editor. Proceedings of the Fourth InternationalSymposium On Fire Safety Science. Boston, Mass: TAFSS; 1994. p. 1125–36.
[13] Franssen JM, Schleich JB, Cajot LG. A simple model for fire resistance of axially-loaded membersaccording to Eurocode 3. J Constr Steel Res 1995;35:49–69.
[14] Hoffman K. An introduction to measurements using strain gages. Germany: HBM publisher, 1989.[15] NP EN 10 002-1; CT12. Metallic materials: tensile tests. Part 1: test methodology; portuguese insti-
tute for quality; 1990 [in Portuguese].