Embed Size (px)
Citation preview

sensors
Article
A New Planar Microwave Sensor for BuildingMaterials Complex Permittivity Characterization
João G. D. Oliveira 1,2 , José G. Duarte Junior 1 , Erica N. M. G. Pinto 3,Valdemir P. Silva Neto 1 and Adaildo G. D’Assunção 1,*
1 Department of Communication Engineering, Federal University of Rio Grande do Norte, Caixa Postal 1655,Natal CEP 59078-970, RN, Brazil; [email protected] (J.G.D.O.); [email protected] (J.G.D.J.);[email protected] (V.P.S.N.)
2 SIDIA Institute of Science and Technology, Manaus CEP 69055-035, AM, Brazil3 Avenida Universitária Leto Fernandes, Federal Rural University of the Semi-Arid,
Caraúbas CEP 59780-000, RN, Brazil; [email protected]* Correspondence: [email protected]; Tel.: +55-84-99983-2893
Received: 24 August 2020; Accepted: 12 October 2020; Published: 6 November 2020�����������������
Abstract: A new microwave sensor is proposed to characterize the complex relative permittivityof building non-magnetic materials and used in the characterization of three concrete samples.The proposed sensor structure consists of a log-periodic planar antenna with microstrip elementstilted forward by an angle β and printed, alternately, on the top and bottom sides of a dielectriclayer. The operation principle is based on the measurement of the scattering parameters S11 and S21
in a free space propagation transmitter-receiver setup, for both cases with the material under test(MUT) sample (non-line-of-sight, NLOS) and without it (line-of-sight, LOS). A prototype is fabricatedand measured to determine the scattering parameters of concrete samples. After measurements, theobtained results are used in the efficient and accurate Nicolson–Ross–Weir (NRW) method, making itpossible to estimate the values of the complex relative permittivity of the concrete blocks. The sensordesign is demonstrated from initial simulations to measurements for validation of the developedprototype. The obtained results for the complex relative permittivity of concrete are in agreementwith those available in the literature and the difference between the simulated and measurementresults for the sensor antenna resonant frequency is 4.71%. The used measurement setup can beapplied to characterize different types of solid or liquid dielectric materials.
Keywords: microwave sensor; microstrip antenna; log-periodic; high directivity; concretecharacterization; dielectric measurements
1. Introduction
In the current scenario of mobile communications technologies, several studies have been carriedout seeking to discover and minimize possible problems that may arise in the communication channels.Several studies are being carried out showing that elements positioned between the transmitter/receiverterminals severely affect the characteristics and the transmission capacity of any radio link [1–5].In a communication system, one of the most common types of obstruction to the propagation ofelectromagnetic waves happens in the presence of materials used in the construction of buildings.In addition, the most used building material is concrete, being chosen for several works due to itsease of manufacture, low cost, and durability. Therefore, the study of the electrical characteristicsof this material has become increasingly important, in view of the numerous possible scenarios inmobile communications. As presented in [6], it is possible to monitor the hydration process of theconcrete depending on the chloride variation by measuring the permittivity, making it possible to
Sensors 2020, 20, 6328; doi:10.3390/s20216328 www.mdpi.com/journal/sensors
Sensors 2020, 20, 6328 2 of 15
confirm these properties by comparing them with other microstructural characterization techniques,such as energy dispersive X-ray (EDX) and scanning electron microscopy (SEM) [7]. It is worthwhileto mention the effectiveness of microwave sensors for the characterization of concrete propertiesand other construction materials, without destroying its matrix [8–12]. These sensors can be usedin works already carried out and thus identify problems without damaging the existing concrete ormortar structure.
Other types of sensors were developed, such as the microwave double waveguide sensors, whichserve to identify small gaps between the concrete structures and the metal [13,14], enabling anevaluation of the size of the gap between the concrete and metal, and from there technicaldecision-making regarding the maintenance of the structures. Small gaps or even the appearance ofcracks, variation in the mechanical properties, and the density of the material can also be monitoredusing non-invasive techniques [15–18]. This process can be applied to assess the change in theproperties of concrete structures and their degradation over time or even after changes in climaticconditions or natural phenomena.
Compressive strength is one of the most studied properties in concrete. From it, the amount ofload that the concrete supports and its durability are determined. However, a characteristic that affectsthis material is its water/cement ratio. Thus, producing a microwave sensor that can measure electricalproperties [18–23] and relate them to the amount of water and mechanical properties is very promising.
Identifying the properties of the concrete is clearly important but, in some structures, it is necessaryto identify the reinforcement materials (fibers) that were used to produce the concrete. Therefore,the study of a microsensor based on a V-shaped resonator (VSR) was proposed as an economical andnon-destructive solution to detect the type and percentage of content in fiber-reinforced concrete [24].In [25], a time domain technique is presented for determining the real and imaginary parts of thepermittivity and permeability of samples of linear materials in the frequency domain.
In the last decades, a great interest has been observed from researchers worldwide in thedetermination of the electromagnetic properties of materials for applications in wireless communicationsystems. In [26], a step-by-step procedure is proposed for the characterization of the permittivity ofdielectric materials using the NRW method. In [27], non-resonant measurement methods are presentedand used to determine the permittivity of dielectric materials. In [28–30], methodologies are proposedfor the electromagnetic characterization of concrete based on radar models relating the losses of thepropagating wave. In [31–34], studies were carried out on the electrical and magnetic parameters ofconcrete-based materials.
In addition, one of the most used methods in the electromagnetic characterization of materials,including concrete, is the Nicolson–Ross–Weir (NRW) method [35–37]. This method is basedon the characteristics of propagation and reflection of an electromagnetic wave within a set oftransmitter/propagation medium and sample/receiver. Parameters, such as the wavelength andscattering coefficients (S11 and S21), are used to obtain the electrical and magnetic characteristics of thepropagation medium or of a material under test (MUT) sample.
In this context, this work proposes a new microwave sensor to be used in the characterizationof the complex relative permittivity of concrete samples, based on simulated and measured valuesof the attenuation constant, for the propagation of electromagnetic waves. The used techniquecan be considered as non-destructive, as the physical structures of the samples were not changed.Some properties of the electromagnetic wave propagation and its interaction with lossy dielectricmedia are presented. Agreement is observed between the simulated and measured results.
2. Materials and Methods
2.1. Electrical Properties of Non-Magnetic Materials
The electromagnetic waves that propagate through buildings interact with their physical structures,causing a loss of propagation that depends on the electrical characteristics of the materials used in
Sensors 2020, 20, 6328 3 of 15
their construction. Therefore, a key factor in the study of wave propagation between different mediais the identification of each medium through which the wave propagates. Basically, the mediumidentification is defined by its main electrical parameters, which are the electrical permittivity, ε,electrical conductivity, σ, and magnetic permeability, µ. For building materials, a medium can beidentified as conductor if σ� ωε and dielectric if σ� ωε [38], whereω is the angular frequency.
The behavior of an electromagnetic wave propagating in the z+ direction is determined from thesolution of the wave equation, being represented by the expressions of the electric and magnetic fieldsindicated in Equations (1) and (2) [39]:
E(t, z) = E0e− jωt−γz, (1)
H(t, z) = H0e− jωt−γz =E0
ηe− jωt−γz, (2)
where γ is the propagation constant, given by γ = α + jβ, where α is the attenuation constant and β isthe phase constant, and η is the intrinsic impedance of the medium given by
√µ/ε. Therefore, it is
easy to understand how the electrical properties of materials are great impact factors on the behaviorof waves that come to interact with their structures.
2.2. Method for Relative Permittivity Determination Using Scattering Parameters
The most widely used method is that of Nicolson–Ross–Weir (NRW) [40], which enables the valuesof the complex relative permittivity (εr = ε′r − jε′′r ) and complex relative permeability (µr = µ′r − jµ′′r )to be obtained simultaneously. For non-magnetic materials, µr = 1. The NRW method requires,in the measurement setup, information on some parameters, such as the material thickness, d, and thedistance between the material under test (MUT) and the antennas, L.
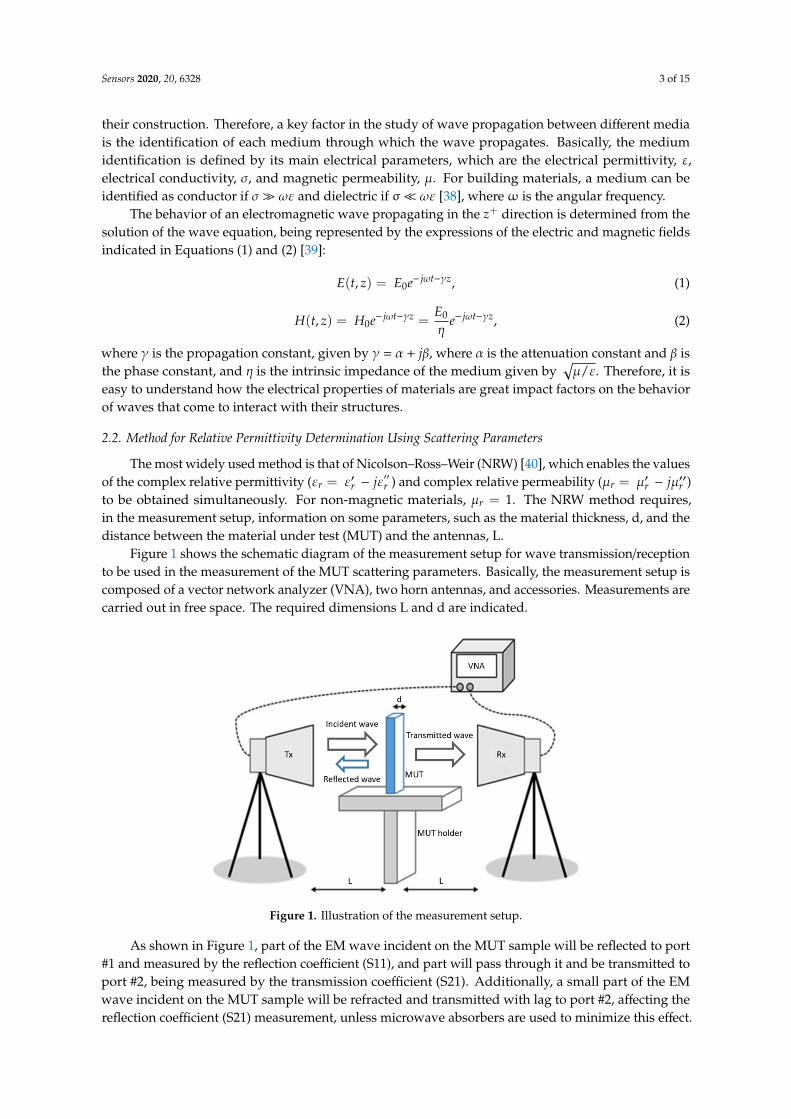
Figure 1 shows the schematic diagram of the measurement setup for wave transmission/receptionto be used in the measurement of the MUT scattering parameters. Basically, the measurement setup iscomposed of a vector network analyzer (VNA), two horn antennas, and accessories. Measurements arecarried out in free space. The required dimensions L and d are indicated.
Sensors 2020, 19, x FOR PEER REVIEW 3 of 15
media is the identification of each medium through which the wave propagates. Basically, the
medium identification is defined by its main electrical parameters, which are the electrical
permittivity, ε, electrical conductivity, σ, and magnetic permeability, μ. For building materials, a
medium can be identified as conductor if σ ≫ ωε and dielectric if σ ≪ ωε [38], where ω is the angular
frequency.
The behavior of an electromagnetic wave propagating in the �� direction is determined from
the solution of the wave equation, being represented by the expressions of the electric and magnetic
fields indicated in Equations (1) and (2) [39]:
�(�, �) = ����������, (1)
�(�, �) = ���������� =��
���������, (2)
where γ is the propagation constant, given by γ = α + jβ, where α is the attenuation constant and β is
the phase constant, and η is the intrinsic impedance of the medium given by �m/e. Therefore, it is
easy to understand how the electrical properties of materials are great impact factors on the behavior
of waves that come to interact with their structures.
2.2. Method for Relative Permittivity Determination Using Scattering Parameters
The most widely used method is that of Nicolson–Ross–Weir (NRW) [40], which enables the
values of the complex relative permittivity (�� = ��� − ���
��) and complex relative permeability (�� =
��� − ���
��) to be obtained simultaneously. For non-magnetic materials, �� = 1. The NRW method
requires, in the measurement setup, information on some parameters, such as the material thickness,
d, and the distance between the material under test (MUT) and the antennas, L.
Figure 1 shows the schematic diagram of the measurement setup for wave
transmission/reception to be used in the measurement of the MUT scattering parameters. Basically,
the measurement setup is composed of a vector network analyzer (VNA), two horn antennas, and
accessories. Measurements are carried out in free space. The required dimensions L and d are
indicated.
Figure 1. Illustration of the measurement setup.
As shown in Figure 1, part of the EM wave incident on the MUT sample will be reflected to port
#1 and measured by the reflection coefficient (S11), and part will pass through it and be transmitted
to port #2, being measured by the transmission coefficient (S21). Additionally, a small part of the EM
wave incident on the MUT sample will be refracted and transmitted with lag to port #2, affecting the
reflection coefficient (S21) measurement, unless microwave absorbers are used to minimize this
effect. Then, the measured scattering parameters (S11 and S21), the thickness of the MUT sample (d),
Figure 1. Illustration of the measurement setup.
As shown in Figure 1, part of the EM wave incident on the MUT sample will be reflected to port#1 and measured by the reflection coefficient (S11), and part will pass through it and be transmitted toport #2, being measured by the transmission coefficient (S21). Additionally, a small part of the EMwave incident on the MUT sample will be refracted and transmitted with lag to port #2, affecting thereflection coefficient (S21) measurement, unless microwave absorbers are used to minimize this effect.
Sensors 2020, 20, 6328 4 of 15
Then, the measured scattering parameters (S11 and S21), the thickness of the MUT sample (d), and itsdistance to the Tx and Rx antennas (L) are used in the expressions of the NRW method [41] to determinethe electrical characteristics of the MUT sample.
The main equations of the NRW method to determine the relative permittivity and magneticpermeability are shown in Equations (3) to (5) [26,42]:
µr =1 + Γ
Λ(1− Γ)√
1λ2
0−
1λ2
c
, (3)
εr =λ2
0
µr
(1λ2
c+
1Λ
), (4)
1Λ
= −[ 12πL
ln( 1
T
)]2, (5)
where λ0 and λc are the wavelengths in free space and at the cutoff frequency, respectively.The transmission, T, and reflection, Γ, coefficients of the MUT sample are determined using the
measured scattering parameters (S11 and S12) and Equations (6) to (8), presented in [26,42]:
K =(S11
2− S21
2) + 12(S21)
, (6)
Γ = K ±√
K2 − 1, |Γ| ≤ 1, (7)
T =(S11 − S21) + Γ
1− (S11 + S21)Γ. (8)
In this work, the propagation channel was modelled as a two-port network (quadripole) usingan equivalent transmission line and the scattering matrix, [S]. Thus, for non-magnetic materials,the expression for the relative permittivity, εr, is obtained as shown in Equation (9) [27]:
εr =[(
jcωL
)ln(T)
]2, (9)
where c is the free space velocity, andω is the angular frequency.The scattering parameters S11 and S21 are represented in phasor form, with the module and
phase indications, or as complex numbers, with the indications of the real and imaginary parts.Therefore, the transmission, T, and reflection, Γ, coefficients of the MUT sample (Equations (6) to (8))can also be expressed as phasors or complex numbers. Consequently, the use of complex numbersin Equations (3) to (5) results in obtaining the real and imaginary parts of the electrical permittivityand magnetic permeability. For non-magnetic materials, as in the case of most building materials,the relative magnetic permeability, µr, is equal to 1.
2.3. Description of the Concrete Used
Concrete is any product or mass produced from the use of a cementitious field [43]. It can beproduced from a mixture of hydraulic cement, water, gravel aggregate, fine aggregate, and chemicaladditives. The mixture of these materials forms a plastic paste, and from the cement hydration reactions,the concrete hardens until it creates a rock-like consistency. With this, we can classify concrete as acomposite material.
Composite materials have the characteristic of obtaining properties that materials alone cannot.In concrete structures, properties, such as durability, mechanical resistance, and porosity, are the mostresearched, usually through destructive tests. Therefore, the electrical characterization of this material

Sensors 2020, 20, 6328 5 of 15
becomes interesting due to the possibility that it is not necessary to extract a sample from the structureand still obtain data that are related to other properties of the concrete.
In this work, the proposal was to research a concrete conventionally used in Brazil, with a 1: 2: 3ratio and mechanical strength of 25 MPa, composed only of Portland cement, granite gravel, quartzsand, and water. In addition, it is known that the concrete hydration process and the amount of waterpresent in its structure directly influence the properties of the concrete. Therefore, after studying thecuring of the material and realizing that after 180 days of curing, the concrete already had a hydrationprocess close to 100%, it was decided to use samples with more than 180 days of curing, stored in aplace sheltered from the weather and without the presence of water.
3. Proposed Antenna Sensor Design
The development of a new planar antenna sensor is proposed for the electrical characterizationof concrete material. The chosen characterization technique is efficient and non-destructive,requiring measurements of the propagation of an electromagnetic wave in air, between the terminalsof two antennas, in the cases without and with concrete material blocks. In view of these requirements,a proposed microstrip antenna sensor was designed to achieve a directional radiation pattern,acceptable directivity, small size, low weight, low cost, and easy fabrication. Its structure is inspired bythe log-periodic antenna geometry shown in Figure 2 [44].
Sensors 2020, 19, x FOR PEER REVIEW 5 of 15
process close to 100%, it was decided to use samples with more than 180 days of curing, stored in a
place sheltered from the weather and without the presence of water.
3. Proposed Antenna Sensor Design
The development of a new planar antenna sensor is proposed for the electrical characterization
of concrete material. The chosen characterization technique is efficient and non-destructive, requiring
measurements of the propagation of an electromagnetic wave in air, between the terminals of two
antennas, in the cases without and with concrete material blocks. In view of these requirements, a
proposed microstrip antenna sensor was designed to achieve a directional radiation pattern,
acceptable directivity, small size, low weight, low cost, and easy fabrication. Its structure is inspired
by the log-periodic antenna geometry shown in Figure 2 [44].
Figure 2. Classical geometry of a wire log-periodic antenna.
Here, N is the number of dipoles of the antenna array and the wire dipoles dimensions are
lengths, Ln+1, diameters, dn+1, spacings, Sn+1, and positions, Rn+1, for n = 0, 1, 2,…, N − 1. The angle 2�
defines the imaginary envelope where the length limits of the dipole elements are contained.
In the design of a wire log-periodic antenna, its dimensions are defined by the geometric ratio,
τ, and spacing factor, , according to the expressions shown in Equations (10) and (13), respectively,
which are related to the antenna directivity, number of dipoles, N, designed bandwidth, Bs, and angle
�, as shown in Equations (12) and (13):
�
�=
����
��=
����
��=
����
��=
����
��, (10)
=����- ��
�����, (11)
� = 1 +ln(��)
ln���� �
, (12)
� = tan−1 ����
���. (13)
In the microstrip antenna design, inspired by the log-periodic antenna geometry, narrow strip
dipoles, tilted forward by an angle β, are printed on both sides of a dielectric FR4 substrate layer, as
shown in Figure 3. The arms of the dipoles placed at the right side of the antenna are interconnected
and printed on the top side of the dielectric substrate and those of the left side are interconnected and
printed on the bottom side. The proposed log-periodic antenna dimensions are determined, using
Equations (10) and (11), as a function of the operating frequency, f, scale factor, τ, and relative spacing,
. In addition, a small number of narrow strip dipoles, N = 4, was chosen to get a small-sized antenna.
Two log-periodic microstrip antenna geometries were proposed and analyzed, one without
(Figure 3a) and one with (Figure 3b) parasitic elements. The only difference between these antenna
geometries is the use of two symmetric and laterally placed wide strips on the top side of the antenna
substrate layer in Figure 3b.
Figure 2. Classical geometry of a wire log-periodic antenna.
Here, N is the number of dipoles of the antenna array and the wire dipoles dimensions are lengths,Ln+1, diameters, dn+1, spacings, Sn+1, and positions, Rn+1, for n = 0, 1, 2, . . . , N − 1. The angle 2αdefines the imaginary envelope where the length limits of the dipole elements are contained.
In the design of a wire log-periodic antenna, its dimensions are defined by the geometric ratio,τ, and spacing factor, σ, according to the expressions shown in Equations (10) and (13), respectively,which are related to the antenna directivity, number of dipoles, N, designed bandwidth, Bs, and angleα, as shown in Equations (12) and (13):
1τ=
Ln+1
Ln=
Sn+1
Sn=
dn+1
dn=
Rn+1
Rn, (10)
σ =Rn+1 − Rn
2Ln+1, (11)
N = 1 +ln(Bs)
ln(
1τ
) , (12)
α = tan−1[1− τ
4σ
]. (13)
In the microstrip antenna design, inspired by the log-periodic antenna geometry, narrow stripdipoles, tilted forward by an angle β, are printed on both sides of a dielectric FR4 substrate layer,
Sensors 2020, 20, 6328 6 of 15
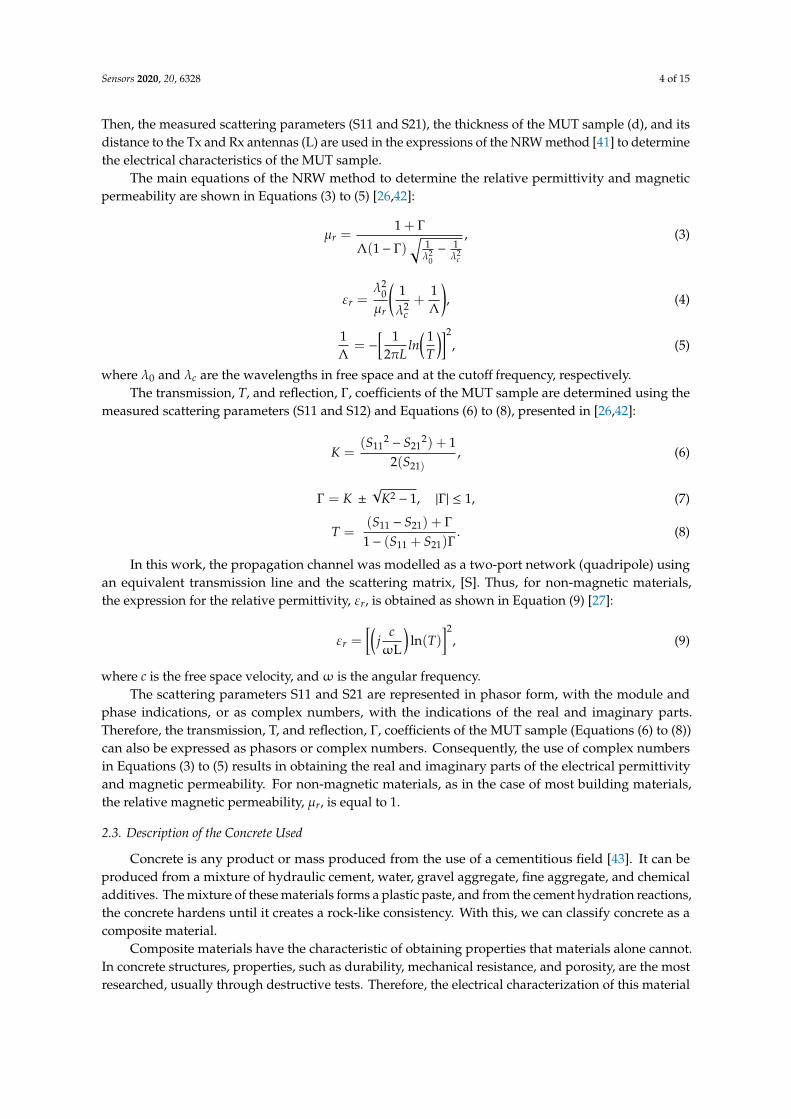
as shown in Figure 3. The arms of the dipoles placed at the right side of the antenna are interconnectedand printed on the top side of the dielectric substrate and those of the left side are interconnectedand printed on the bottom side. The proposed log-periodic antenna dimensions are determined,using Equations (10) and (11), as a function of the operating frequency, f, scale factor, τ, and relativespacing, σ. In addition, a small number of narrow strip dipoles, N = 4, was chosen to get asmall-sized antenna.Sensors 2020, 19, x FOR PEER REVIEW 6 of 15
Figure 3. Straight connected log-periodic microstrip structures. (a) Antenna. (b) Proposed antenna
sensor with two laterally placed wide strip parasitic elements.
To make the design and manufacture of the proposed log-periodic microstrip antenna easy, it
was fed through the straight connection of the strip dipole arms placed at the right and left side of
the antenna (Figure 3), which were printed on the top and bottom sides of the dielectric substrate,
respectively.
The proposed antenna sensor geometry, shown in Figure 3b, was simulated and analyzed using
Ansys HFSS software. Parametric analyses were carried out focusing on the antenna sensor resonant
frequencies, reflection coefficient, radiation pattern, and gain performances. The structural
parameters of the proposed antenna sensor are given in Table 1 and a summary of the main antenna
parameters results is presented in Table 2.
Table 1. Structural parameters of the proposed antenna sensor.
Parameters Descriptions Values
w (mm) Total sensor width 80
L (mm) Total sensor length 60
w1 (mm) Top feed line width 1.5
w2 (mm) Bottom feed line width 3.5
w3 (mm) Laterally placed wide strip width 5
L1 (mm) Dipole arm length 1 32.5
L2 (mm) Dipole arm length 2 24.12
L3 (mm) Dipole arm length 3 17.85
L4 (mm) Dipole arm length 4 13.16
Lt (mm) Center line length 38.08
c1 (mm) Dipole width 1 5
c2 (mm) Dipole width 2 3.74
c3 (mm) Dipole width 3 2.8
c4 (mm) Dipole width 4 2.09
S (mm) Spacing between feed point and dipole 1 4.61
s1 (mm) Spacing between dipoles 1 and 2 8.77
s2 (mm) Spacing between dipoles 2 and 3 6.19
s3 (mm) Spacing between dipoles 3 and 4 4.63
β (deg) Angle of tilted forward dipoles 75
Figure 3. Straight connected log-periodic microstrip structures. (a) Antenna. (b) Proposed antennasensor with two laterally placed wide strip parasitic elements.
Two log-periodic microstrip antenna geometries were proposed and analyzed, one without(Figure 3a) and one with (Figure 3b) parasitic elements. The only difference between these antennageometries is the use of two symmetric and laterally placed wide strips on the top side of the antennasubstrate layer in Figure 3b.
To make the design and manufacture of the proposed log-periodic microstrip antenna easy, it wasfed through the straight connection of the strip dipole arms placed at the right and left side of the antenna(Figure 3), which were printed on the top and bottom sides of the dielectric substrate, respectively.
The proposed antenna sensor geometry, shown in Figure 3b, was simulated and analyzed usingAnsys HFSS software. Parametric analyses were carried out focusing on the antenna sensor resonantfrequencies, reflection coefficient, radiation pattern, and gain performances. The structural parametersof the proposed antenna sensor are given in Table 1 and a summary of the main antenna parametersresults is presented in Table 2.
A prototype of the proposed antenna sensor was fabricated using microstrip technology on a FR-4dielectric substrate, with a relative permittivity of 4.4, loss tangent of 0.02, and thickness of 1.57 mm.Thereafter, measured results were obtained for the frequency response of the antenna sensor reflectioncoefficient and return loss parameters.
Figure 4 shows photos of the antenna sensor prototype and measurement setup, as well assimulation and measurement results of the reflection coefficient, S11 (dB). Good agreement is observedbetween the simulated and measured results with multiple operation bands at 2.25, 3.32, 4.56, 5.22,7.43, 8.73, and 12.9 GHz. In this work, the resonance band at 2.25 GHz was chosen for the antennasensor application.

Sensors 2020, 20, 6328 7 of 15
Table 1. Structural parameters of the proposed antenna sensor.
Parameters Descriptions Values
w (mm) Total sensor width 80L (mm) Total sensor length 60
w1 (mm) Top feed line width 1.5w2 (mm) Bottom feed line width 3.5w3 (mm) Laterally placed wide strip width 5L1 (mm) Dipole arm length 1 32.5L2 (mm) Dipole arm length 2 24.12L3 (mm) Dipole arm length 3 17.85L4 (mm) Dipole arm length 4 13.16Lt (mm) Center line length 38.08c1 (mm) Dipole width 1 5c2 (mm) Dipole width 2 3.74c3 (mm) Dipole width 3 2.8c4 (mm) Dipole width 4 2.09S (mm) Spacing between feed point and dipole 1 4.61s1 (mm) Spacing between dipoles 1 and 2 8.77s2 (mm) Spacing between dipoles 2 and 3 6.19s3 (mm) Spacing between dipoles 3 and 4 4.63β (deg) Angle of tilted forward dipoles 75
Table 2. Simulated results for the proposed antenna sensor main parameters.
Parameters Values
Maximum directivity 3.53Maximum gain 3.47
Radiation efficiency 98.25%Front to back ratio 33.18
Sensors 2020, 19, x FOR PEER REVIEW 7 of 15
Table 2. Simulated results for the proposed antenna sensor main parameters.
Parameters Values
Maximum directivity 3.53
Maximum gain 3.47
Radiation efficiency 98.25%
Front to back ratio 33.18
A prototype of the proposed antenna sensor was fabricated using microstrip technology on a
FR-4 dielectric substrate, with a relative permittivity of 4.4, loss tangent of 0.02, and thickness of 1.57
mm. Thereafter, measured results were obtained for the frequency response of the antenna sensor
reflection coefficient and return loss parameters.
Figure 4 shows photos of the antenna sensor prototype and measurement setup, as well as
simulation and measurement results of the reflection coefficient, S11 (dB). Good agreement is
observed between the simulated and measured results with multiple operation bands at 2.25, 3.32,
4.56, 5.22, 7.43, 8.73, and 12.9 GHz. In this work, the resonance band at 2.25 GHz was chosen for the
antenna sensor application.
Figure 4. Photos of the (a) proposed antenna sensor prototype, top view (left side) and bottom view
(right side), and (b) measurement setup. (c) Reflection coefficient simulation and measurement
frequency responses.
Moreover, resonance bands related to the electrical lengths of the dipoles and the effective
permittivity of the used dielectric substrate (FR4), neglecting the electromagnetic coupling between
the array elements, are obtained at 1.41 GHz (dipole-L1), 1.88 GHz (dipole-L2), 2.31 (dipole-L3), and
3.30 (dipole-L4). Other resonance bands are due to the electromagnetic coupling between the antenna
sensor strip dipole elements.
In the performed simulation, the antennas were positioned in the x-y plane, being oriented in
the positive direction of the y axis, from the longest to the shortest elements. The results of the
simulated reflection coefficients for the two antennas in Figure 3 are similar but that of the antenna
with two conducting strip parasitic elements (Figure 3b) presented a better resonance condition in
the frequency range between 2 and 3 GHz, the frequency range of interest.
Figure 4 shows photographs of the proposed antenna sensor prototype (Figure 4a) and
measurement setup (Figure 4b). Figure 4c shows the reflection coefficient simulation and
measurement frequency responses. The frequency range of interest is indicated as the sensing range.
The choice of the resonance band at 2.25 GHz was related to the vector network analyzer (VNA)
availability and to the growing number of communication system applications in the lower
microwave band (2–6 GHz).
Figure 4. Photos of the (a) proposed antenna sensor prototype, top view (left side) and bottomview (right side), and (b) measurement setup. (c) Reflection coefficient simulation and measurementfrequency responses.
Moreover, resonance bands related to the electrical lengths of the dipoles and the effectivepermittivity of the used dielectric substrate (FR4), neglecting the electromagnetic coupling betweenthe array elements, are obtained at 1.41 GHz (dipole-L1), 1.88 GHz (dipole-L2), 2.31 (dipole-L3),and 3.30 (dipole-L4). Other resonance bands are due to the electromagnetic coupling between theantenna sensor strip dipole elements.

Sensors 2020, 20, 6328 8 of 15
In the performed simulation, the antennas were positioned in the x-y plane, being oriented in thepositive direction of the y axis, from the longest to the shortest elements. The results of the simulatedreflection coefficients for the two antennas in Figure 3 are similar but that of the antenna with twoconducting strip parasitic elements (Figure 3b) presented a better resonance condition in the frequencyrange between 2 and 3 GHz, the frequency range of interest.
Figure 4 shows photographs of the proposed antenna sensor prototype (Figure 4a) andmeasurement setup (Figure 4b). Figure 4c shows the reflection coefficient simulation and measurementfrequency responses. The frequency range of interest is indicated as the sensing range. The choice ofthe resonance band at 2.25 GHz was related to the vector network analyzer (VNA) availability and tothe growing number of communication system applications in the lower microwave band (2–6 GHz).
Figure 5 shows the simulated 2-D and 3-D radiation pattern results of the antenna sensor, shown inFigure 3b, at 2.25 GHz.
Sensors 2020, 19, x FOR PEER REVIEW 8 of 15
Figure 5 shows the simulated 2-D and 3-D radiation pattern results of the antenna sensor, shown
in Figure 3b, at 2.25 GHz.
(a) (b)
Figure 5. Simulated radiation pattern of the proposed antenna sensor at 2.25 GHz. (a) 2-D radiation
pattern at f = 0 (x-z plane), in red color, and � = 90 (y-z plane), in black color. (b) 3-D radiation
pattern, with gain total (dB) results.
The radiation patterns of the two antennas shown in Figure 3 are similar, with maximum radiation
in the positive direction of the y axis and minimum radiation in the x axis direction, somewhat resembling
an omnidirectional radiation pattern shifted in the positive direction of the y axis.
4. Experimental Procedure and Results
The measurement setup was basically constituted by the proposed antenna sensor, used as a
transmitter, one horn antenna, with an operating range from 700 MHz to 12 GHz, a VNA connected
to the antennas and microwave absorbers, which enabled to obtain measured results of the reflection
and transmission coefficients for two cases: without and with insertion of an MUT sample. Figure 6a
shows the measurement setup of the case without any MUT sample placed between the sensor and
the horn antenna. Figure 6b shows the setup measurement with the insertion of the concrete MUT
sample. In the measurement setup, reflection and scattering effects were minimized using microwave
absorbers. The measured results for the free space S11 and S21 parameters are shown in Figure 7.
(a) (b)
Figure 6. Photos of the measurement setup, showing the proposed antenna sensor, horn antenna,
absorbers, and concrete block: (a) Setup without the MUT sample; (b) Setup with the MUT sample of
concrete.
Figure 5. Simulated radiation pattern of the proposed antenna sensor at 2.25 GHz. (a) 2-D radiationpattern at φ = 0◦ (x-z plane), in red color, and φ = 90◦ (y-z plane), in black color. (b) 3-D radiationpattern, with gain total (dB) results.
The radiation patterns of the two antennas shown in Figure 3 are similar, with maximumradiation in the positive direction of the y axis and minimum radiation in the x axis direction,somewhat resembling an omnidirectional radiation pattern shifted in the positive direction of they axis.
4. Experimental Procedure and Results
The measurement setup was basically constituted by the proposed antenna sensor, used as atransmitter, one horn antenna, with an operating range from 700 MHz to 12 GHz, a VNA connected tothe antennas and microwave absorbers, which enabled to obtain measured results of the reflectionand transmission coefficients for two cases: without and with insertion of an MUT sample. Figure 6ashows the measurement setup of the case without any MUT sample placed between the sensor andthe horn antenna. Figure 6b shows the setup measurement with the insertion of the concrete MUTsample. In the measurement setup, reflection and scattering effects were minimized using microwaveabsorbers. The measured results for the free space S11 and S21 parameters are shown in Figure 7.

Sensors 2020, 20, 6328 9 of 15
Sensors 2020, 19, x FOR PEER REVIEW 8 of 15
Figure 5 shows the simulated 2-D and 3-D radiation pattern results of the antenna sensor, shown
in Figure 3b, at 2.25 GHz.
(a) (b)
Figure 5. Simulated radiation pattern of the proposed antenna sensor at 2.25 GHz. (a) 2-D radiation
pattern at f = 0 (x-z plane), in red color, and � = 90 (y-z plane), in black color. (b) 3-D radiation
pattern, with gain total (dB) results.
The radiation patterns of the two antennas shown in Figure 3 are similar, with maximum radiation
in the positive direction of the y axis and minimum radiation in the x axis direction, somewhat resembling
an omnidirectional radiation pattern shifted in the positive direction of the y axis.
4. Experimental Procedure and Results
The measurement setup was basically constituted by the proposed antenna sensor, used as a
transmitter, one horn antenna, with an operating range from 700 MHz to 12 GHz, a VNA connected
to the antennas and microwave absorbers, which enabled to obtain measured results of the reflection
and transmission coefficients for two cases: without and with insertion of an MUT sample. Figure 6a
shows the measurement setup of the case without any MUT sample placed between the sensor and
the horn antenna. Figure 6b shows the setup measurement with the insertion of the concrete MUT
sample. In the measurement setup, reflection and scattering effects were minimized using microwave
absorbers. The measured results for the free space S11 and S21 parameters are shown in Figure 7.
(a) (b)
Figure 6. Photos of the measurement setup, showing the proposed antenna sensor, horn antenna,
absorbers, and concrete block: (a) Setup without the MUT sample; (b) Setup with the MUT sample of
concrete.
Figure 6. Photos of the measurement setup, showing the proposed antenna sensor, horn antenna,absorbers, and concrete block: (a) Setup without the MUT sample; (b) Setup with the MUT sampleof concrete.Sensors 2020, 19, x FOR PEER REVIEW 9 of 15
Figure 7. Reflection (S11) and transmission (S21) coefficients’ measured results for the free space
measurement setup: (a) Magnitude; (b) Phase in degrees.
As shown in Figure 6a,b, the antennas were placed at a distance of 80 cm and the concrete block
was located in the center position. Figures 8 and 9 shows that the insertion of the concrete block, with
a thickness of 5 cm, between the transmitter/receiver terminals, has a great effect on the phase of the
received signal (S21 parameter). This is an expected result due to the scattering phenomenon and to
the different properties of the concrete material sample, including its relative permittivity (which is
different from the free space one), through which the EM wave should propagate. These results were
used to characterize the MUT sample material that was inserted between the sensor and the receiving
antenna. In the experimental procedure, measurements were carried out for four concrete blocks, and
the obtained results of the reflection (S11) and transmission (S21) coefficients, including magnitudes
and phases, were saved for further processing.
Figures 8 and 9 show, respectively, the measured results of the transmission coefficient
magnitude and phase (in degrees) for the four samples of concrete.
Figure 8. Measured results of the magnitude of the transmission coefficient for the three concrete
block samples.
Figure 7. Reflection (S11) and transmission (S21) coefficients’ measured results for the free spacemeasurement setup: (a) Magnitude; (b) Phase in degrees.
As shown in Figure 6a,b, the antennas were placed at a distance of 80 cm and the concrete blockwas located in the center position. Figures 8 and 9 shows that the insertion of the concrete block, with athickness of 5 cm, between the transmitter/receiver terminals, has a great effect on the phase of thereceived signal (S21 parameter). This is an expected result due to the scattering phenomenon and tothe different properties of the concrete material sample, including its relative permittivity (which isdifferent from the free space one), through which the EM wave should propagate. These results wereused to characterize the MUT sample material that was inserted between the sensor and the receivingantenna. In the experimental procedure, measurements were carried out for four concrete blocks,and the obtained results of the reflection (S11) and transmission (S21) coefficients, including magnitudesand phases, were saved for further processing.
Figures 8 and 9 show, respectively, the measured results of the transmission coefficient magnitudeand phase (in degrees) for the four samples of concrete.
As shown in Figures 8 and 9, a great similarity is observed between the measured results for thetransmission coefficient (magnitude and phase) frequency behavior, due to the good uniformity of thefour concrete blocks samples, which will help to get accurate analysis results.

Sensors 2020, 20, 6328 10 of 15
Sensors 2020, 19, x FOR PEER REVIEW 9 of 15
Figure 7. Reflection (S11) and transmission (S21) coefficients’ measured results for the free space
measurement setup: (a) Magnitude; (b) Phase in degrees.
As shown in Figure 6a,b, the antennas were placed at a distance of 80 cm and the concrete block
was located in the center position. Figures 8 and 9 shows that the insertion of the concrete block, with
a thickness of 5 cm, between the transmitter/receiver terminals, has a great effect on the phase of the
received signal (S21 parameter). This is an expected result due to the scattering phenomenon and to
the different properties of the concrete material sample, including its relative permittivity (which is
different from the free space one), through which the EM wave should propagate. These results were
used to characterize the MUT sample material that was inserted between the sensor and the receiving
antenna. In the experimental procedure, measurements were carried out for four concrete blocks, and
the obtained results of the reflection (S11) and transmission (S21) coefficients, including magnitudes
and phases, were saved for further processing.
Figures 8 and 9 show, respectively, the measured results of the transmission coefficient
magnitude and phase (in degrees) for the four samples of concrete.
Figure 8. Measured results of the magnitude of the transmission coefficient for the three concrete
block samples.
Figure 8. Measured results of the magnitude of the transmission coefficient for the three concreteblock samples.
Sensors 2020, 19, x FOR PEER REVIEW 10 of 15
Figure 9. Measured results of the phase of the transmission coefficient for the three concrete block
samples.
As shown in Figures 8 and 9, a great similarity is observed between the measured results for the
transmission coefficient (magnitude and phase) frequency behavior, due to the good uniformity of
the four concrete blocks samples, which will help to get accurate analysis results.
Results of The NRW Method
The results of the measurement carried out without and with the insertion of three concrete
blocks placed between the terminals of the transmitting and receiving antennas were used, according
to the NRW method, to (indirectly) determine the value of the complex relative permittivity of the
concrete. The investigated concrete material is considered a non-magnetic material. Therefore, the
relative magnetic permeability, μr, is 1.
Figures 10 and 11 show, respectively, the real and imaginary parts of the relative permittivity of
the concrete material samples, as a function of frequency, according to the NRW method and the
measured values of the magnitude and phase of the transmission coefficient (S21) of the concrete
material blocks (Figures 8 and 9).
Figure 10. Real part of the relative permittivity of the three concrete samples, according to the NRW
method and the complex transmission coefficient (S21) measured results.
According to Figure 10, the frequency behavior of the real part of the relative permittivity values,
at lower frequencies (0.75 to 1.5 GHz) and for concrete samples 2 and 3, an excellent agreement is
Figure 9. Measured results of the phase of the transmission coefficient for the three concreteblock samples.
Results of The NRW Method
The results of the measurement carried out without and with the insertion of three concrete blocksplaced between the terminals of the transmitting and receiving antennas were used, according to theNRW method, to (indirectly) determine the value of the complex relative permittivity of the concrete.The investigated concrete material is considered a non-magnetic material. Therefore, the relativemagnetic permeability, µr, is 1.
Figures 10 and 11 show, respectively, the real and imaginary parts of the relative permittivityof the concrete material samples, as a function of frequency, according to the NRW method and themeasured values of the magnitude and phase of the transmission coefficient (S21) of the concretematerial blocks (Figures 8 and 9).
According to Figure 10, the frequency behavior of the real part of the relative permittivity values,at lower frequencies (0.75 to 1.5 GHz) and for concrete samples 2 and 3, an excellent agreement isobserved, despite the low deviation observed for the concrete sample 4 results. Nevertheless, at thisfrequency range, high deviation results are observed for concrete sample 1 results. Additionally,at higher frequencies (1.5 to 3 GHz) and for concrete samples 2, 3, and 4, excellent agreement is

Sensors 2020, 20, 6328 11 of 15
observed, despite the low deviation observed in the sample 1 results. In Figure 10, the frequencybehavior curves of the imaginary relative permittivity converged to ε′r u 3.39.
Sensors 2020, 19, x FOR PEER REVIEW 10 of 15
Figure 9. Measured results of the phase of the transmission coefficient for the three concrete block
samples.
As shown in Figures 8 and 9, a great similarity is observed between the measured results for the
transmission coefficient (magnitude and phase) frequency behavior, due to the good uniformity of
the four concrete blocks samples, which will help to get accurate analysis results.
Results of The NRW Method
The results of the measurement carried out without and with the insertion of three concrete
blocks placed between the terminals of the transmitting and receiving antennas were used, according
to the NRW method, to (indirectly) determine the value of the complex relative permittivity of the
concrete. The investigated concrete material is considered a non-magnetic material. Therefore, the
relative magnetic permeability, μr, is 1.
Figures 10 and 11 show, respectively, the real and imaginary parts of the relative permittivity of
the concrete material samples, as a function of frequency, according to the NRW method and the
measured values of the magnitude and phase of the transmission coefficient (S21) of the concrete
material blocks (Figures 8 and 9).
Figure 10. Real part of the relative permittivity of the three concrete samples, according to the NRW
method and the complex transmission coefficient (S21) measured results.
According to Figure 10, the frequency behavior of the real part of the relative permittivity values,
at lower frequencies (0.75 to 1.5 GHz) and for concrete samples 2 and 3, an excellent agreement is
Figure 10. Real part of the relative permittivity of the three concrete samples, according to the NRWmethod and the complex transmission coefficient (S21) measured results.
Sensors 2020, 19, x FOR PEER REVIEW 11 of 15
observed, despite the low deviation observed for the concrete sample 4 results. Nevertheless, at this
frequency range, high deviation results are observed for concrete sample 1 results. Additionally, at
higher frequencies (1.5 to 3 GHz) and for concrete samples 2, 3, and 4, excellent agreement is
observed, despite the low deviation observed in the sample 1 results. In Figure 10, the frequency
behavior curves of the imaginary relative permittivity converged to ��� ≊ 3.39.
Therefore, the used measurement setup is very appropriate to the considered higher frequency
range and this result is related to the positioning distance of the concrete block and the distance
between the antenna sensor and horn antenna, with respect to the operating frequencies.
In Figure 11, the frequency behavior curves of the imaginary part of the relative permittivity
converged to ���� ≊ 0.37.
Figure 11. Imaginary part of the relative permittivity of the three concrete samples, according to the
NRW method and the complex transmission coefficient (S21) measured results.
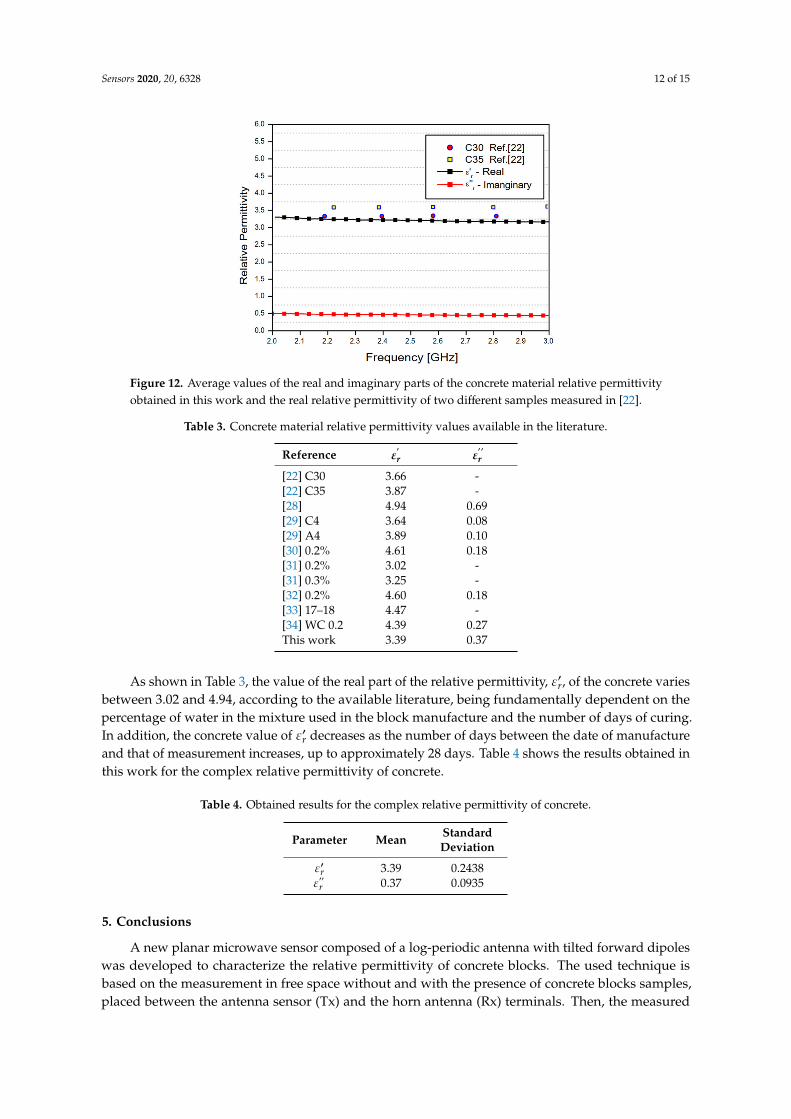
Figure 12 shows the average values of the real and imaginary parts of the concrete material
relative permittivity shown in Figures 10 and 11, as well as values of the real part of the relative
permittivity of two different samples measured in [22].
Figure 12. Average values of the real and imaginary parts of the concrete material relative permittivity
obtained in this work and the real relative permittivity of two different samples measured in [22].
As shown in Figures 10 and 11, the relative permittivity values depend on the operating
frequency. However, estimated values can be obtained through the average calculation within a
specific frequency range. In this work, average values for the concrete material relative permittivity
were calculated in the frequency range from 2 to 3 GHz, resulting in the complex relative permittivity
Figure 11. Imaginary part of the relative permittivity of the three concrete samples, according to theNRW method and the complex transmission coefficient (S21) measured results.
Therefore, the used measurement setup is very appropriate to the considered higher frequencyrange and this result is related to the positioning distance of the concrete block and the distancebetween the antenna sensor and horn antenna, with respect to the operating frequencies.
In Figure 11, the frequency behavior curves of the imaginary part of the relative permittivityconverged to ε′′r u 0.37.
Figure 12 shows the average values of the real and imaginary parts of the concrete material relativepermittivity shown in Figures 10 and 11, as well as values of the real part of the relative permittivity oftwo different samples measured in [22].
As shown in Figures 10 and 11, the relative permittivity values depend on the operating frequency.However, estimated values can be obtained through the average calculation within a specific frequencyrange. In this work, average values for the concrete material relative permittivity were calculated in thefrequency range from 2 to 3 GHz, resulting in the complex relative permittivity value εr = 3.39 − j0.37.The main results obtained in this analysis are shown in Table 3 and compared to other results in theavailable literature.
Sensors 2020, 20, 6328 12 of 15
Sensors 2020, 19, x FOR PEER REVIEW 11 of 15
observed, despite the low deviation observed for the concrete sample 4 results. Nevertheless, at this
frequency range, high deviation results are observed for concrete sample 1 results. Additionally, at
higher frequencies (1.5 to 3 GHz) and for concrete samples 2, 3, and 4, excellent agreement is
observed, despite the low deviation observed in the sample 1 results. In Figure 10, the frequency
behavior curves of the imaginary relative permittivity converged to ��� ≊ 3.39.
Therefore, the used measurement setup is very appropriate to the considered higher frequency
range and this result is related to the positioning distance of the concrete block and the distance
between the antenna sensor and horn antenna, with respect to the operating frequencies.
In Figure 11, the frequency behavior curves of the imaginary part of the relative permittivity
converged to ���� ≊ 0.37.
Figure 11. Imaginary part of the relative permittivity of the three concrete samples, according to the
NRW method and the complex transmission coefficient (S21) measured results.
Figure 12 shows the average values of the real and imaginary parts of the concrete material
relative permittivity shown in Figures 10 and 11, as well as values of the real part of the relative
permittivity of two different samples measured in [22].
Figure 12. Average values of the real and imaginary parts of the concrete material relative permittivity
obtained in this work and the real relative permittivity of two different samples measured in [22].
As shown in Figures 10 and 11, the relative permittivity values depend on the operating
frequency. However, estimated values can be obtained through the average calculation within a
specific frequency range. In this work, average values for the concrete material relative permittivity
were calculated in the frequency range from 2 to 3 GHz, resulting in the complex relative permittivity
Figure 12. Average values of the real and imaginary parts of the concrete material relative permittivityobtained in this work and the real relative permittivity of two different samples measured in [22].
Table 3. Concrete material relative permittivity values available in the literature.
Reference ε′
r ε′′
r
[22] C30 3.66 -[22] C35 3.87 -[28] 4.94 0.69[29] C4 3.64 0.08[29] A4 3.89 0.10[30] 0.2% 4.61 0.18[31] 0.2% 3.02 -[31] 0.3% 3.25 -[32] 0.2% 4.60 0.18[33] 17–18 4.47 -[34] WC 0.2 4.39 0.27This work 3.39 0.37
As shown in Table 3, the value of the real part of the relative permittivity, ε′r, of the concrete variesbetween 3.02 and 4.94, according to the available literature, being fundamentally dependent on thepercentage of water in the mixture used in the block manufacture and the number of days of curing.In addition, the concrete value of ε′r decreases as the number of days between the date of manufactureand that of measurement increases, up to approximately 28 days. Table 4 shows the results obtained inthis work for the complex relative permittivity of concrete.
Table 4. Obtained results for the complex relative permittivity of concrete.
Parameter Mean StandardDeviation
ε′r 3.39 0.2438ε′′r 0.37 0.0935
5. Conclusions
A new planar microwave sensor composed of a log-periodic antenna with tilted forward dipoleswas developed to characterize the relative permittivity of concrete blocks. The used technique isbased on the measurement in free space without and with the presence of concrete blocks samples,placed between the antenna sensor (Tx) and the horn antenna (Rx) terminals. Then, the measured
Sensors 2020, 20, 6328 13 of 15
results of the transmission coefficient (magnitude and phase), S21, were used according to the NRWmethod to estimate the concrete material complex relative permittivity.
Considering the main characteristics of the proposed sensor, such as a low profile, low cost,small size, ease of manufacture, and acceptable directivity values, it has great potential and can be usedto characterize different types of materials. After the measurements of three concrete samples, it waspossible to extract the approximate value of the complex relative permittivity of the measured concrete.
The results obtained show that, after a long curing period, the values of the complex permittivityof concrete blocks present little or no influence from the percentage of water in their composition,since the values found in the literature on the relative permittivity of liquids are higher than 50 and thevalues found in the measurement are lower than 5.
The main contributions of this work are related to the development and application of a newplanar sensor with acceptable directivity and a wide bandwidth. In addition, an accurate analysis isenabled on the determination of the electrical characteristics of dielectric materials, as these parametersare directly dependent on the frequency at which they are estimated. In addition, the use of theproposed sensor significantly reduces the complexity and cost of the setup measurement, besides beingused in a nondestructive technique.
As a proposal for future works, it would be interesting to investigate the application of the proposedsensor in the nondestructive characterization of other solid materials, as well as the development ofother types of planar sensors.
Author Contributions: J.G.D.O. contributed the idea, simulation, analysis, measurements, and paper writing;J.G.D.J. contributed on the antenna sensor idea, simulation, fabrication and measurements, E.N.M.G.P. contributedon the sample preparation and measurements; V.P.S.N. contributed the simulation, analysis, and assisted in thework development; A.G.D. contributed the antenna idea, the data analysis, measurements, and assisted in the workdevelopment and paper writing. All authors have read and agreed to the published version of the manuscript.
Funding: This research received no external funding.
Acknowledgments: This work was supported by CNPq, under covenant 573939/2008-0 (INCT-CSF), CAPES,Federal University of Rio Grande do Norte (UFRN), Federal Rural University of the Semi-Arid (UFERSA),and SIDIA Institute of Science and Technology.
Conflicts of Interest: The authors declare no conflict of interest.
References
1. Seidel, S.Y.; Rappaport, T.S. 914 MHz path loss prediction models for indoor wireless communications inmultifloored buildings. IEEE Trans. Ant. Propag. 1992, 40, 207–217. [CrossRef]
2. Young, W.F.; Holloway, C.L.; Koepke, G.; Camell, D.; Becquet, Y.; Remley, K.A. Radio-wave propagation intolarge building structures—Part 1: CW signal attenuation and variability. IEEE Trans. Ant. Propag. 2010, 58,1279–1289. [CrossRef]
3. Remley, K.A.; Koepke, G.; Holloway, C.L.; Grosvenor, C.A.; Camell, D.; Ladbury, J.; Young, W.F. Radio-wavepropagation into large building structures—Part 2: Characterization of multipath. IEEE Trans. Ant. Propag.2010, 58, 1290–1301. [CrossRef]
4. Cox, D.C.; Murray, R.R.; Norris, A.W. 800-MHz Attenuation Measured in and Around Suburban Houses.AT T Bell Lab. Tech. J. 1984, 63, 921–954. [CrossRef]
5. Philippidis, T.P.; Aggelis, D.G. Experimental study of wave dispersion and attenuation in concrete. Ultrasonics2005, 43, 584–595. [CrossRef]
6. Robert, A. Dielectric permittivity of concrete between 50 MHz and 1 GHz and GPR measurements forbuilding materials evaluation. J. Appl. Geophys. 1998, 40, 89–94. [CrossRef]
7. Shen, P.; Liu, Z. Study on the hydration of young concrete based on dielectric property measurement.Constr. Build. Mater. 2019, 196, 354–361. [CrossRef]
8. Bois, K.J.; Benally, A.; Nowak, P.S.; Zoughi, R. Microwave nondestructive determination of sand-to-cementratio in mortar. J. Res. Nondestruct. Eval. 1997, 9, 227–238. [CrossRef]

Sensors 2020, 20, 6328 14 of 15
9. Trabelsi, S.; Nelson, S.O. Microwave sensor for simultaneous and nondestructive determination of moisturecontent and bulk density of granular materials. In Proceedings of the 40th European Microwave Conference,Paris, France, 28–30 September 2010; pp. 493–496.
10. Zhang, Y.; Zhao, J.; Cao, J.; Mao, B. Microwave metamaterial absorber for non-destructive sensing applicationsof grain. Sensors 2018, 18, 1912. [CrossRef] [PubMed]
11. Teng, K.H.; Kot, P.; Muradov, M.; Shaw, A.; Hashim, K.; Gkantou, M.; Al-Shamma’a, A. Embedded smartantenna for non-destructive testing and evaluation (NDT&E) of moisture content and deterioration inconcrete. Sensors 2019, 19, 547.
12. Yang, Y.; Divsholi, B.S.; Soh, C.K. A reusable PZT transducer for monitoring initial hydration and structuralhealth of concrete. Sensors 2010, 10, 5193–5208. [CrossRef] [PubMed]
13. Islam, M.A.; Kharkovsky, S. Microwave dual waveguide sensor system for the measurement of gap betweenconcrete and metal surfaces. In Proceedings of the 2016 IEEE International Instrumentation and MeasurementTechnology Conference, Taipei, Taiwan, 23–26 May 2016; pp. 1–6.
14. Islam, M.A.; Kharkovsky, S. Detection and monitoring of gap in concrete-based composite structures usingmicrowave dual waveguide sensor. IEEE Sens. J. 2016, 17, 986–993. [CrossRef]
15. Chung, K.L.; Yuan, L.; Ji, S.; Zhang, C. Dielectric constant modelling of Chinese-standard concretes forwireless monitoring of structures. In Proceedings of the 2017 International Workshop on Electromagnetics:Applications and Student Innovation Competition, London, UK, 30 May–1 June 2017; pp. 186–188.
16. Chung, K.L.; Yuan, L.; Ji, S.; Zhang, C. Dielectric characterization of Guo Biao concrete. In Proceedings of the2017 International Applied Computational Electromagnetics Society Symposium (ACES), Suzhou, China,1–4 August 2017; pp. 1–2.
17. Sabrin, S.; Kharkovsky, S.; Salama, R. Dielectric resonator antenna integrated sensors for characterizationof concrete. In Proceedings of the 2017 Eleventh International Conference on Sensing Technology (ICST),Sydney, Australia, 4–6 December 2017; pp. 1–6.
18. Ozturk, M.; Sevim, U.K.; Akgol, O.; Unal, E.; Karaaslan, M. Determination of physical properties of concreteby using microwave nondestructive techniques. Appl. Comput. Electromagn. Soc. J. 2018, 33, 265–272.
19. Akgol, O.; Unal, E.; Bagmancı, M.; Karaaslan, M.; Sevim, U.K.; Öztürk, M.; Bhadauria, A. A Nondestructivemethod for determining fiber content and fiber ratio in concretes using a metamaterial sensor based on av-shaped resonator. J. Electron. Mater. 2019, 48, 2469–2481. [CrossRef]
20. Al-Mattarneh, H.M.; Ghodgaonkar, D.K.; Majid, W.M.B. Microwave sensing of moisture content in concreteusing open-ended rectangular waveguide. Subsurf. Sens. Technol. Appl. 2001, 2, 377–390. [CrossRef]
21. Chung, K.L.; Yuan, L.; Ji, S.; Zhang, C. Determination of water content for early-age concrete based ondielectric constant. In Proceedings of the 2017 International Workshop on Electromagnetics: Applicationsand Student Innovation Competition, London, UK, 30 May–1 June 2017; pp. 189–191.
22. Chung, K.L.; Yuan, L.; Ji, S.; Sun, L.; Qu, C.; Zhang, C. Dielectric characterization of Chinese standardconcrete for compressive strength evaluation. Appl. Sci. 2017, 7, 177. [CrossRef]
23. Jamil, M.; Hassan, M.K.; Al-Mattarneh, H.M.A.; Zain, M.F.M. Concrete dielectric properties investigationusing microwave nondestructive techniques. Mater. Struct. 2013, 46, 77–87. [CrossRef]
24. Jin, X.; Ali, M. Simple empirical formulas to estimate the dielectric constant and conductivity of concrete.Microw. Opt. Technol. Lett. 2019, 61, 386–390. [CrossRef]
25. Nicolson, A.M.; Ross, G. Measurement of the intrinsic properties of materials by time-domain techniques.IEEE Trans. Instrum. Meas. 1970, 19, 377–382. [CrossRef]
26. Vicente, A.N.; Dip, G.M.; Junqueira, C. The step by step development of NRW method. In Proceedings ofthe 2011 SBMO/IEEE MTT-S International Microwave and Optoelectronics Conference (IMOC 2011), Natal,Brazil, 29 October–1 November 2011; pp. 738–742.
27. Severo, S.L.S.; De Salles, A.A.A.; Nervis, B.; Zanini, B.K. Non-resonant permittivity measurement methods.J. Microw. Optoelectron. Electromagn. Appl. 2017, 16, 297–311. [CrossRef]
28. Xu, H.; Li, B.; Xu, S.; Feng, H. The measurement of dielectric constant of the concrete using single-frequencyCW radar. In Proceedings of the 2008 First International Conference on Intelligent Networks and IntelligentSystems, Wuhan, China, 1–3 November 2008; pp. 588–591.
29. Adous, M.; Quéffélec, P.; Laguerre, L. Coaxial/cylindrical transition line for broadband permittivitymeasurement of civil engineering materials. Meas. Sci. Technol. 2006, 17, 2241. [CrossRef]

Sensors 2020, 20, 6328 15 of 15
30. Bourdi, T.; Rhazi, J.E.; Boone, F.; Ballivy, G. Modelling dielectric-constant values of concrete: An aid toshielding effectiveness prediction and ground-penetrating radar wave technique interpretation. J. Phys. D2012, 45, 405401. [CrossRef]
31. Piladaeng, N.; Angkawisittpan, N.; Homwuttiwong, S. Determination of relationship between dielectricproperties, compressive strength, and age of concrete with rice husk ash using planar coaxial probe.Meas. Sci. Rev. 2016, 16, 14–20. [CrossRef]
32. Sandrolini, L.; Reggiani, U.; Ogunsola, A. Modelling the electrical properties of concrete for shieldingeffectiveness prediction. J. Phys. D 2006, 40, 5366. [CrossRef]
33. Büyüköztürk, O.; Yu, T.Y.; Ortega, J.A. A methodology for determining complex permittivity ofconstruction materials based on transmission-only coherent, wide-bandwidth free-space measurements.Cem. Concr. Compos. 2006, 28, 349–359. [CrossRef]
34. Chung, H.; Cho, J.; Ha, S.G.; Ju, S.; Jung, K.Y. Accurate FDTD dispersive modeling for concrete materials.ETRI J. 2013, 35, 915–918. [CrossRef]
35. Kalisiak, M.; Wiatr, W. Complete Meniscus Removal Method for Broadband Liquid Characterization in aSemi-Open Coaxial Test Cell. Sensors 2019, 19, 2092. [CrossRef] [PubMed]
36. Rusni, I.M.; Ismail, A.; Alhawari, A.R.H.; Hamidon, M.N.; Yusof, N.A. An aligned-gap and centered-gaprectangular multiple split ring resonator for dielectric sensing applications. Sensors 2014, 14, 13134–13148.[CrossRef]
37. Islam, M.T.; Hoque, A.; Almutairi, A.F.; Amin, N. Left-handed metamaterial-inspired unit cell for S-Bandglucose sensing application. Sensors 2019, 19, 169. [CrossRef] [PubMed]
38. Cruz, R.M.S. Analysis of the spectral scattering on the surfaces of complex structures for mobilecommunications applications (in Portuguese). Master’s Thesis, Federal University of Rio Grande doNorte, Natal, Brazil, 15 August 2005.
39. Wilson, R. Propagation Losses through Common Building Materials 2.4 GHz vs 5 GHz; Magis Networks, Inc.:San Diego, CA, USA, 2002; pp. 1–28.
40. You, K.Y.; Sim, M.S.; Mutadza, H.; Esa, F.; Chan, Y.L. Free-space measurement using explicit, reference-planeand thickness-invariant method for permittivity determination of planar materials. In Proceedings of the2017 Progress in Electromagnetics Research Symposium-Fall (PIERS-FALL), Singapore, 19–22 November2017; pp. 222–228.
41. Handoko, E.; Mangasi, A.M.; Iwan, S.; Randa, M.; Alaydrus, M. Measurement of complex permittivity andpermeability of hexagonal ferrite composite material using a waveguide in microwave band. In Proceedingsof the 2016 International Conference on Radar, Antenna, Microwave, Electronics, and Telecommunications(ICRAMET), Jakarta, Indonesia, 3–5 October 2016; pp. 28–30.
42. Knyazev, N.S.; Malkin, A.I. Dielectric permittivity and permeability measurement system. In Proceedings ofthe CEUR Workshop, Yekaterinburg, Russia, 9 December 2017; pp. 45–51.
43. Liu, Z.; Gong, Y.; Zhou, L. Impact of China’s highspeed train window glass on GNSS signals and positioningperformance. Satell. Navig. 2020, 1, 1–16. [CrossRef]
44. Balanis, C.A. Antenna Theory: Analysis and Design; Wiley Interscience: Hoboken, NJ, USA, 2005.
Publisher’s Note: MDPI stays neutral with regard to jurisdictional claims in published maps and institutionalaffiliations.
© 2020 by the authors. Licensee MDPI, Basel, Switzerland. This article is an open accessarticle distributed under the terms and conditions of the Creative Commons Attribution(CC BY) license (http://creativecommons.org/licenses/by/4.0/).