Embed Size (px)
Citation preview
Acta Psychologica 145 (2014) 118–127
Contents lists available at ScienceDirect
Acta Psychologica
j ourna l homepage: www.e lsev ie r .com/ locate /actpsy
A new perspective on visual word processing efficiency
Joseph W. Houpt a,⁎,1, James T. Townsend a, Christopher Donkin b
a Department of Psychological and Brain Sciences, Indiana University, Bloomington, IN 47405, USAb School of Psychology, The University of New South Wales, Sydney, NSW 2052, Australia
⁎ Corresponding author.E-mail addresses: [email protected] (J.W. Hou
(J.T. Townsend), [email protected] (C. Donkin).1 This research took place while the first author was
University. He is now at Wright State University, Dayton,supported by NIH-NIMH MH 057717-07 and AFOSR FA95
0001-6918/$ – see front matter © 2013 Elsevier B.V. All rihttp://dx.doi.org/10.1016/j.actpsy.2013.10.013
a b s t r a c t
a r t i c l e i n f oArticle history:Received 10 July 2013Received in revised form 14 October 2013Accepted 28 October 2013Available online xxxx
PsycINFO classification:2260 ResearchMethods & Experimental Design2323 Visual Perception
Keywords:Word perceptionWord superiority effectCapacity coefficient
As a fundamental part of our daily lives, visual word processing has receivedmuch attention in the psychologicalliterature. Despite the well established advantage of perceiving letters in a word or in a pseudoword over lettersalone or in random sequences using accuracy, a comparable effect using response times has been elusive. Someresearchers continue to question whether the advantage due to word context is perceptual. We use the capacitycoefficient, a well established, response time basedmeasure of efficiency to provide evidence of word processingas a particularly efficient perceptual process to complement those results from the accuracy domain.
© 2013 Elsevier B.V. All rights reserved.
1. Introduction
As a fundamental part of our daily lives, visual word processinghas received much attention in the psychological literature. However,the interest in visual word perception extends beyond its value incommunication. The written word is a complex stimulus with whichmost adults have a large amount of experience. Unlike faces, there isno reason to believe we have any innate ability to perceive words.Thus, word perception may represent the limit of perceptual learningin the absence of innate ability.
Due to the relative easewithwhichmost adults read, it is reasonableto assume that word perception is an efficient process. This is furthersupported by the intuition that with more experience with a processwe becomemore efficient and we are quite experienced with the writ-ten word. Often, the efficiency is measured using single letter percep-tion as a base line. When word context offers an advantage in theaccuracy or processing time of perceiving a letter, this supports theclaim that word perception is efficient.
From the early days of experimental psychology, researchers havebeen interested in the value of a word context for perceiving letters. Inone study, letters were displayed sequentially to participants at fasterand faster rates until they could no longer correctly identify the letters.
pt), [email protected]
a graduate student at IndianaOH 45435, USA. This work was50-07-1-0078 awarded to JTT.
ghts reserved.
They found that participants maintained accuracy with shorter dura-tions when the letters were presented as part of a word comparedwith random letter sequences (Cattell, 1886).
One problem with studies of this nature is that they do not controlfor the fact that forcing a string to be a word constrains the number ofpossible letters in the string. Hence, it is not clear from those early re-sults whether the advantage is a perceptual advantage or a decisionaladvantage. For example, if the last letter of a four letter word is “h”,then the second to last is most likely an “s”, “t” or “c.” Thus, there isredundant information about the identity of the second to last letter:both the perceptual information about the shape of that letter and thedecisional information about the letter conditioned on the last letterbeing an “h.” If random letter strings are used, there is no longer thesame constraint on the likely identity of the second to last letter: “x” isjust as likely as “s” so the only information is the perceptual informationabout the second to last letter.
In the late 1960's an alternative task was designed to eliminate thedecisional advantage of word context so as to examine the perceptualeffects. In this task a letter or word was tachistoscopically displayed toa participant. Participants then chose from two possible choices, oneof which was correct. In the letter condition, the choices were letters.In the word condition, both choices were words that differed in only asingle letter. This design is depicted in Fig. 1. Since both alternativeswere words, theword contextwas no longer informative as to the iden-tity of the letter. Participants were still more accurate at perceivingletters in the word condition than the letter condition (Reicher,1969). Furthermore, they found that participants are alsomore accuratewhen identifying letters in words than random letter sequences. This isknown as the word superiority effect.
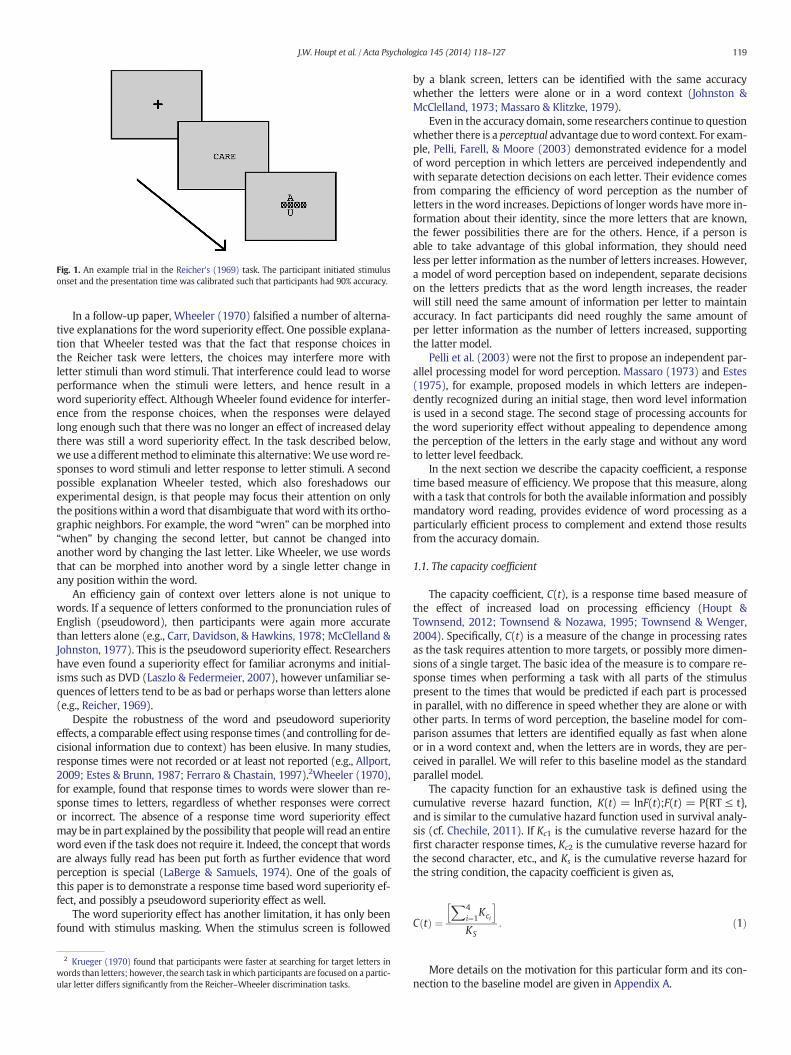
Fig. 1. An example trial in the Reicher's (1969) task. The participant initiated stimulusonset and the presentation time was calibrated such that participants had 90% accuracy.
119J.W. Houpt et al. / Acta Psychologica 145 (2014) 118–127
In a follow-up paper, Wheeler (1970) falsified a number of alterna-tive explanations for the word superiority effect. One possible explana-tion that Wheeler tested was that the fact that response choices inthe Reicher task were letters, the choices may interfere more withletter stimuli than word stimuli. That interference could lead to worseperformance when the stimuli were letters, and hence result in aword superiority effect. Although Wheeler found evidence for interfer-ence from the response choices, when the responses were delayedlong enough such that there was no longer an effect of increased delaythere was still a word superiority effect. In the task described below,we use a differentmethod to eliminate this alternative:Weuseword re-sponses to word stimuli and letter response to letter stimuli. A secondpossible explanation Wheeler tested, which also foreshadows ourexperimental design, is that people may focus their attention on onlythe positionswithin aword that disambiguate that wordwith its ortho-graphic neighbors. For example, the word “wren” can be morphed into“when” by changing the second letter, but cannot be changed intoanother word by changing the last letter. Like Wheeler, we use wordsthat can be morphed into another word by a single letter change inany position within the word.
An efficiency gain of context over letters alone is not unique towords. If a sequence of letters conformed to the pronunciation rules ofEnglish (pseudoword), then participants were again more accuratethan letters alone (e.g., Carr, Davidson, & Hawkins, 1978; McClelland &Johnston, 1977). This is the pseudoword superiority effect. Researchershave even found a superiority effect for familiar acronyms and initial-isms such as DVD (Laszlo & Federmeier, 2007), however unfamiliar se-quences of letters tend to be as bad or perhaps worse than letters alone(e.g., Reicher, 1969).
Despite the robustness of the word and pseudoword superiorityeffects, a comparable effect using response times (and controlling for de-cisional information due to context) has been elusive. In many studies,response times were not recorded or at least not reported (e.g., Allport,2009; Estes & Brunn, 1987; Ferraro & Chastain, 1997).2Wheeler (1970),for example, found that response times to words were slower than re-sponse times to letters, regardless of whether responses were corrector incorrect. The absence of a response time word superiority effectmay be in part explained by the possibility that peoplewill read an entireword even if the task does not require it. Indeed, the concept that wordsare always fully read has been put forth as further evidence that wordperception is special (LaBerge & Samuels, 1974). One of the goals ofthis paper is to demonstrate a response time based word superiority ef-fect, and possibly a pseudoword superiority effect as well.
The word superiority effect has another limitation, it has only beenfound with stimulus masking. When the stimulus screen is followed
2 Krueger (1970) found that participants were faster at searching for target letters inwords than letters; however, the search task inwhich participants are focused on a partic-ular letter differs significantly from the Reicher–Wheeler discrimination tasks.
by a blank screen, letters can be identified with the same accuracywhether the letters were alone or in a word context (Johnston &McClelland, 1973; Massaro & Klitzke, 1979).
Even in the accuracy domain, some researchers continue to questionwhether there is a perceptual advantage due toword context. For exam-ple, Pelli, Farell, & Moore (2003) demonstrated evidence for a modelof word perception in which letters are perceived independently andwith separate detection decisions on each letter. Their evidence comesfrom comparing the efficiency of word perception as the number ofletters in the word increases. Depictions of longer words have more in-formation about their identity, since the more letters that are known,the fewer possibilities there are for the others. Hence, if a person isable to take advantage of this global information, they should needless per letter information as the number of letters increases. However,a model of word perception based on independent, separate decisionson the letters predicts that as the word length increases, the readerwill still need the same amount of information per letter to maintainaccuracy. In fact participants did need roughly the same amount ofper letter information as the number of letters increased, supportingthe latter model.
Pelli et al. (2003) were not the first to propose an independent par-allel processing model for word perception. Massaro (1973) and Estes(1975), for example, proposed models in which letters are indepen-dently recognized during an initial stage, then word level informationis used in a second stage. The second stage of processing accounts forthe word superiority effect without appealing to dependence amongthe perception of the letters in the early stage and without any wordto letter level feedback.
In the next section we describe the capacity coefficient, a responsetime based measure of efficiency. We propose that this measure, alongwith a task that controls for both the available information and possiblymandatory word reading, provides evidence of word processing as aparticularly efficient process to complement and extend those resultsfrom the accuracy domain.
1.1. The capacity coefficient
The capacity coefficient, C(t), is a response time based measure ofthe effect of increased load on processing efficiency (Houpt &Townsend, 2012; Townsend & Nozawa, 1995; Townsend & Wenger,2004). Specifically, C(t) is a measure of the change in processing ratesas the task requires attention to more targets, or possibly more dimen-sions of a single target. The basic idea of the measure is to compare re-sponse times when performing a task with all parts of the stimuluspresent to the times that would be predicted if each part is processedin parallel, with no difference in speed whether they are alone or withother parts. In terms of word perception, the baseline model for com-parison assumes that letters are identified equally as fast when aloneor in a word context and, when the letters are in words, they are per-ceived in parallel. We will refer to this baseline model as the standardparallel model.
The capacity function for an exhaustive task is defined using thecumulative reverse hazard function, K(t) = lnF(t);F(t) = P{RT ≤ t},and is similar to the cumulative hazard function used in survival analy-sis (cf. Chechile, 2011). If Kc1 is the cumulative reverse hazard for thefirst character response times, Kc2 is the cumulative reverse hazard forthe second character, etc., and Ks is the cumulative reverse hazard forthe string condition, the capacity coefficient is given as,
C tð Þ ¼X4
i¼1Kci
h i
KS: ð1Þ
More details on the motivation for this particular form and its con-nection to the baseline model are given in Appendix A.
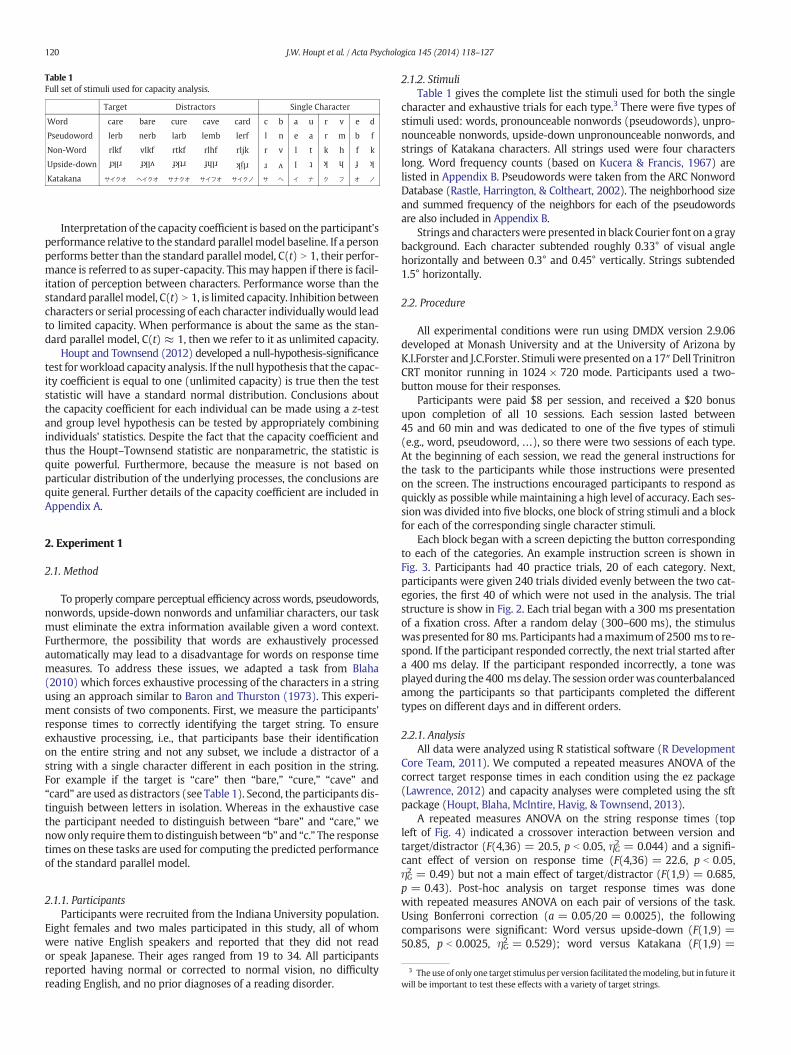
Table 1Full set of stimuli used for capacity analysis.
Target Distractors Single Character
Word care bare cure cave card c b a u r v e d
Pseudoword lerb nerb larb lemb lerf l n e a r m b f
Non-Word rlkf vlkf rtkf rlhf rljk r v l t k h f k
Upside-down
rlkf vlkf rtkf rlhf rljk r v l t k h f k
Katakana
120 J.W. Houpt et al. / Acta Psychologica 145 (2014) 118–127
Interpretation of the capacity coefficient is based on the participant'sperformance relative to the standard parallelmodel baseline. If a personperforms better than the standard parallel model, C(t) N 1, their perfor-mance is referred to as super-capacity. This may happen if there is facil-itation of perception between characters. Performance worse than thestandard parallelmodel, C(t) N 1, is limited capacity. Inhibition betweencharacters or serial processing of each character individuallywould leadto limited capacity. When performance is about the same as the stan-dard parallel model, C(t) ≈ 1, then we refer to it as unlimited capacity.
Houpt and Townsend (2012) developed a null-hypothesis-significancetest forworkload capacity analysis. If the null hypothesis that the capac-ity coefficient is equal to one (unlimited capacity) is true then the teststatistic will have a standard normal distribution. Conclusions aboutthe capacity coefficient for each individual can be made using a z-testand group level hypothesis can be tested by appropriately combiningindividuals' statistics. Despite the fact that the capacity coefficient andthus the Houpt–Townsend statistic are nonparametric, the statistic isquite powerful. Furthermore, because the measure is not based onparticular distribution of the underlying processes, the conclusions arequite general. Further details of the capacity coefficient are included inAppendix A.
2. Experiment 1
2.1. Method
To properly compare perceptual efficiency across words, pseudowords,nonwords, upside-down nonwords and unfamiliar characters, our taskmust eliminate the extra information available given a word context.Furthermore, the possibility that words are exhaustively processedautomatically may lead to a disadvantage for words on response timemeasures. To address these issues, we adapted a task from Blaha(2010) which forces exhaustive processing of the characters in a stringusing an approach similar to Baron and Thurston (1973). This experi-ment consists of two components. First, we measure the participants'response times to correctly identifying the target string. To ensureexhaustive processing, i.e., that participants base their identificationon the entire string and not any subset, we include a distractor of astring with a single character different in each position in the string.For example if the target is “care” then “bare,” “cure,” “cave” and“card” are used as distractors (see Table 1). Second, the participants dis-tinguish between letters in isolation. Whereas in the exhaustive casethe participant needed to distinguish between “bare” and “care,” wenowonly require them to distinguish between “b” and “c.” The responsetimes on these tasks are used for computing the predicted performanceof the standard parallel model.
3 Theuse of only one target stimulus per version facilitated themodeling, but in future itwill be important to test these effects with a variety of target strings.
2.1.1. ParticipantsParticipants were recruited from the Indiana University population.
Eight females and two males participated in this study, all of whomwere native English speakers and reported that they did not reador speak Japanese. Their ages ranged from 19 to 34. All participantsreported having normal or corrected to normal vision, no difficultyreading English, and no prior diagnoses of a reading disorder.
2.1.2. StimuliTable 1 gives the complete list the stimuli used for both the single
character and exhaustive trials for each type.3 There were five types ofstimuli used: words, pronounceable nonwords (pseudowords), unpro-nounceable nonwords, upside-down unpronounceable nonwords, andstrings of Katakana characters. All strings used were four characterslong. Word frequency counts (based on Kucera & Francis, 1967) arelisted in Appendix B. Pseudowords were taken from the ARC NonwordDatabase (Rastle, Harrington, & Coltheart, 2002). The neighborhood sizeand summed frequency of the neighbors for each of the pseudowordsare also included in Appendix B.
Strings and characterswere presented in black Courier font on a graybackground. Each character subtended roughly 0.33° of visual anglehorizontally and between 0.3° and 0.45° vertically. Strings subtended1.5° horizontally.
2.2. Procedure
All experimental conditions were run using DMDX version 2.9.06developed at Monash University and at the University of Arizona byK.I.Forster and J.C.Forster. Stimuli were presented on a 17″Dell TrinitronCRT monitor running in 1024 × 720 mode. Participants used a two-button mouse for their responses.
Participants were paid $8 per session, and received a $20 bonusupon completion of all 10 sessions. Each session lasted between45 and 60 min and was dedicated to one of the five types of stimuli(e.g., word, pseudoword, …), so there were two sessions of each type.At the beginning of each session, we read the general instructions forthe task to the participants while those instructions were presentedon the screen. The instructions encouraged participants to respond asquickly as possible while maintaining a high level of accuracy. Each ses-sion was divided into five blocks, one block of string stimuli and a blockfor each of the corresponding single character stimuli.
Each block began with a screen depicting the button correspondingto each of the categories. An example instruction screen is shown inFig. 3. Participants had 40 practice trials, 20 of each category. Next,participants were given 240 trials divided evenly between the two cat-egories, the first 40 of which were not used in the analysis. The trialstructure is show in Fig. 2. Each trial began with a 300 ms presentationof a fixation cross. After a random delay (300–600 ms), the stimuluswaspresented for 80 ms. Participants had amaximumof 2500 ms to re-spond. If the participant responded correctly, the next trial started aftera 400 ms delay. If the participant responded incorrectly, a tone wasplayed during the 400 msdelay. The session orderwas counterbalancedamong the participants so that participants completed the differenttypes on different days and in different orders.
2.2.1. AnalysisAll data were analyzed using R statistical software (R Development
Core Team, 2011). We computed a repeated measures ANOVA of thecorrect target response times in each condition using the ez package(Lawrence, 2012) and capacity analyses were completed using the sftpackage (Houpt, Blaha, McIntire, Havig, & Townsend, 2013).
A repeated measures ANOVA on the string response times (topleft of Fig. 4) indicated a crossover interaction between version andtarget/distractor (F(4,36) = 20.5, p b 0.05, ηG2 = 0.044) and a signifi-cant effect of version on response time (F(4,36) = 22.6, p b 0.05,ηG2 = 0.49) but not a main effect of target/distractor (F(1,9) = 0.685,p = 0.43). Post-hoc analysis on target response times was donewith repeated measures ANOVA on each pair of versions of the task.Using Bonferroni correction (a = 0.05/20 = 0.0025), the followingcomparisons were significant: Word versus upside-down (F(1,9) =50.85, p b 0.0025, ηG2 = 0.529); word versus Katakana (F(1,9) =

Fig. 2. Trial structure for Experiment 1. Trials beganwith a fixation cross, followed by a blank screen. After a brief, randomdelay the probe appeared for 80 ms. The probewas followed by ablank screen. Instructions indicating the probe and distractors were given at the beginning of each block.
121J.W. Houpt et al. / Acta Psychologica 145 (2014) 118–127
57.56, p b 0.0025, ηG2 = 0.697); pseudoword versus upside-down(F(1,9) = 34.8, p b 0.0025, ηG2 = 0.438); pseudoword versus Katakana(F(1,9) = 53.9, p b 0.0025, ηG2 = 0.643); and random versus Katakana(F(1,9) = 22.1, p b 0.0025, ηG2 = 0.398).
The ANOVA on the string condition accuracy (bottom left side ofFig. 4) indicated that there was an interaction between version andtarget/distractor (F(4,36) = 3.69, p b 0.05, ηG2 = 0.079) and main ef-fects of both version (F(4,36) = 3.64, p b 0.05, ηG2 = 0.11) and target/distractor F(1,9) = 17.6, p b 0.05, ηG2 = 0.081. Both the interaction(W = 0.072, p b 0.05) and the main effect of version (W = 0.033,p b 0.05) failed Mauchly's test of sphericity and only the interac-tion effect was significant after a Greenhouse–Geisser correction(GGe = 0.518, p b 0.05), not version (GGe = 0.376, p b 0.065). The ef-fects may be driven entirely by the accuracy on the distractors becausethere is no significant effect of version when the analysis is limited tothe hit rate (F(4,36) = 0.411, p = 0.31).
We found a similar pattern with the single character conditions(right side of Fig. 4). Therewas a significant effect of version on responsetime (F(4,36) = 4.64, p b .05, ηG2 = 0.089), but the main effect oftarget/distractor (F(1,9) = 0.424, p = 0.53) and the interaction(F(4,36) = 0.335, p = 0.85) were not significant. Post-hoc analysison target response times was done using repeated measures ANOVAon each pair of versions. Using Bonferroni correction (a = 0.05/20 = 0.0025), the only significant differences in response timeswere between the letters in the pseudoword and upside-down ver-sions (F(1,9) = 20.27, p b 0.0025, ηG2 = 0.098) and pseudowordand Katakana versions (F(1,9) = 20.0, p b 0.0025, ηG2 = 0.092). Theother test results were as follows: Word versus pseudoword (F(1,9) =0.104, p = 0.754); word versus random (F(1,9) = 3.29, p = 0.103);
Fig. 3. Example instruction screen indicating that the participant should click left if theysee care and right if they see bare, cure, cave, or card.
word versus upside-down (F(1,9) = 7.55, p = 0.023); word versusKatakana (F(1,9) = 8.40, p = 0.018); pseudoword versus random(F(1,9) = 7.07, p = 0.026); random versus upside-down (F(1,9) =0.0045, p = 0.948); and random versus Katakana (F(1,9) = 0.592,p = 0.461). There were not significant effects on accuracy of version(F(4,36) = 0.433, p = 0.784) and target/distractor (F(1,9) = 4.55,p = 0.062) and there was no significant interaction (F(4,36) = 1.28,p = 0.295).
Individual capacity coefficients are shown in Fig. 5. z-Scores for indi-vidual and group data, using the statistic in Houpt and Townsend(2012) are shown in Table 2. Each z-score indicates a test of the null-hypothesis that a participant performs equally to a standard parallelmodel. Significance values are based on a two-sided test. Nearly all par-ticipants are significantly different from standard parallel, usually betterin theword and pseudoword versions andworse in the random, upside-down and Katakana versions.
Using repeated measures ANOVA, we found a significant effect ofversion on capacity (F(4,36) = 22.64, p b 0.05, ηG2 = 0.58). For post-hoc analyses, we used the z-scores resulting from the mean differencebetween subjects' capacity z-scores in each pair of version of the task.Word capacity was significantly higher than pseudoword capacity(z = 7.27, p b 0.0025), random letter capacity (z = 22.9, p b 0.0025),upside-down capacity (z = 36.7, p b 0.0025), and Katakana capacity(z = 45.9, p b 0.0025). Pseudoword capacity was significantly higherthan random letter capacity (z = 15.6, p b 0.0025), upside-downcapacity (z = 29.4, p b 0.0025), and Katakana capacity (z = 38.6,p b 0.0025). Random letter capacity was higher than upside-downcapacity (z = 13.8, p b 0.0025), and Katakana capacity (z = 22.9,p b 0.0025). Upside-down capacity was significantly higher than Kata-kana capacity (z = 9.19, p b 0.0025).
3. Discussion
Participants responded faster to words and pseudowords than toupside-down nonwords and Katakana strings, following a word andpseudoword superiority effect respectively. However, the comparisonsbetween response times to words and response times to nonwordsand pseudowords were not significant, and thus do not indicate superi-ority effects.
One possible explanation of the basic string response time results isthat the individual characters were more difficult to process when theywere unfamiliar or upside-down. Even the trend toward faster perfor-mance on words compared to nonwords could be due to differencesin the speed with which the particular letters are processed: Wordstend to contain more common letters and include vowels, comparedto unpronounceable random letter sequences andmore common lettersare perceived faster than less common letters (Appelman & Mayzner,1981).

Strings
Res
pons
e T
ime
TargetDistractor
350
450
550
650
750
WordPseudo−
word RandomUpside−Down Katakana
Character
350
375
400
425
450
WordPseudo−
word RandomUpside−Down Katakana
Acc
urac
y
0.70
00.
775
0.85
00.
925
1.00
0
WordPseudo−
word RandomUpside−Down Katakana
0.70
00.
775
0.85
00.
925
1.00
0
WordPseudo−
word RandomUpside−Down Katakana
Fig. 4.Response times and accuracy fromExperiment 1. Error bars indicate the standard error of themean across trials andparticipants. The top twographs showmean response times; thebottom two show accuracy. The left graphs are data from the string tasks; the right graphs are from the corresponding single character tasks. To highlight variation across task version, thecharacter response times are shown on a smaller scale than the string response times. Both accuracy plots are on the same scale.
122 J.W. Houpt et al. / Acta Psychologica 145 (2014) 118–127
Herein lies the advantage of the capacity coefficient. By design, themeasure accounts for the processing time of each character in measur-ing the performance of the string. Despite accounting for faster process-ingwith letters than unfamiliar or upside-down characters, the capacityresults still indicate word and pseudoword superiority over Katakanaand upside-down strings. Furthermore, unlike the raw response timedata, the capacity coefficient indicates word and pseudoword superior-ity over random letter sequences.
Fig. 5 and Table 2 show that there are also superiority effects forwords and pseudowords over individual letters, i.e., assuming parallelprocessing of characters, participants were slower when the characterswere presented in isolation rather than in a string. In contrast, capacityfor upside-down and Katakana was limited.
Finding word and pseudoword superiority effects with responsetimes, by using workload capacity analysis, is notable because thesuperiority effects have only been reported in accuracy in the past.Furthermore, the accuracy superiority effects are dependent onpost stimulus masking. We have demonstrated a clear superiorityof words and pseudowords over single characters, random letterstrings, upside-down strings and unfamiliar characters without anymasking.
Results from Experiment 1 demonstrate that the capacity coefficientcan be used to find amore robust word and pseudoword superiority ef-fects than the traditional Reicher–Wheeler paradigm.With Experiment2, we verify that the response time superiority effects will hold up inthis design when there is post-stimulus masking, as in the original
300 500 700
01
23
4
Word
Time
C(t
)
300 500 700
Pseudoword
Time300 50
Ran
T
Fig. 5. Capacity coefficients for words, pseudowords, random letters, upside-down random lettefficients and the thick line indicates the average function across participants. The capacity coeffisible based on individual response time distributions.
paradigm. Additionally, in Experiment 1, the participants were onlyshown the instruction screen once, at the beginning of a block.Thus, differences in performance may be due to differences in theability to remember the target–response mapping across string type.In Experiment 2, we display the instruction screen on every trial. Afinal potential issue with Experiment 1 is the use of lower case letters.Words with lower case letters can vary more in their global shapethan thosewith only upper case letters (e.g., “BARD” and “CARE” versus“bard” and “care”). This can bias a participant to use global shape infor-mation in distinguishingbetween letter strings. In Experiment 2,we usethe same letter strings, but in upper case.
4. Experiment 2
4.1. Method
4.1.1. ParticipantsAs in Experiment 1, participants were recruited from the Indiana
University population. Ten females and 2 males participated in thisstudy, all of whom were native English speakers and reported thatthey did not read or speak Japanese. Their ages ranged from 19 to 34.All participants reported having normal or corrected to normal vision,no difficulty reading English, and no prior diagnoses of a reading disor-der. None of the participants from Experiment 1 participated in Experi-ment 2.
0 700
dom
ime300 500 700
Upside−Down
Time300 500 700
Katakana
Time
ers and Katakana in Experiment 1. Gray lines indicate individual participants' capacity co-cients for each participant are only plotted in regionswhere reasonable estimates are pos-

4 This wasmeasured using an accuracy analog to the capacity coefficient: To be correct onthe string, onemust correctly identify each character. Independent (and unlimited capacity)processingwould lead to P {Corrects} × P {Correctc2} × P{Correctc3} × P {Correctc4} where Sis the string and ci is the ith character.
5 An alternative, parametric approach for measuring capacity is given in Eidels, Donkin,Brown, and Heathcote (2010) that accounts for both response time and accuracy differ-ences. We attempted to fit their model for analyzing these data but there were too fewconditions across which we could constrain parameters, leading to unreliable parameterestimates. Townsend and Altieri (2012) provide a generalized capacity coefficient ac-counting for both accuracy and response time, althoughwe chose not to include it here be-cause it currently lacks methods for statistical hypothesis testing.
Table 2Workload capacity statistics for each participant in each version of the task in Experiment1. Under the null hypothesis the limit distribution of the statistic has a standard normaldistribution. Significance levels of z-tests are indicated by: ⁎⁎⁎: p b 0.001, ⁎⁎: p b 0.01,and ⁎: p b 0.05.
Word Pseudoword Random Upside-down Katakana
1 9.97⁎⁎⁎ 3.92⁎⁎⁎ 7.19⁎⁎⁎ −2.62⁎⁎ −4.43⁎⁎⁎
2 11.92⁎⁎⁎ 4.44⁎⁎⁎ −0.73⁎⁎⁎ −5.95⁎⁎⁎ −10.02⁎⁎⁎
3 8.19⁎⁎⁎ −6.29⁎⁎⁎ −6.88⁎⁎⁎ −10.88⁎⁎⁎ −12.34⁎⁎⁎
4 0.13⁎⁎⁎ −3.38⁎⁎⁎ −7.34⁎⁎⁎ −6.60⁎⁎⁎ −10.58⁎⁎⁎
5 0.79⁎⁎⁎ 10.70⁎⁎⁎ −2.36⁎ −6.27⁎⁎⁎ −6.86⁎⁎⁎
6 7.34⁎⁎⁎ 5.19⁎⁎ 10.61⁎⁎⁎ −2.58⁎⁎ −11.99⁎⁎⁎
7 9.34⁎⁎⁎ 3.25⁎⁎ −2.27⁎⁎⁎ −2.49⁎ −5.78⁎⁎⁎
8 7.17⁎⁎⁎ 7.84⁎⁎⁎ 4.68⁎⁎⁎ 2.86⁎⁎ −1.799 5.71⁎⁎⁎ 13.34⁎⁎⁎ −8.43⁎⁎⁎ −9.52⁎⁎⁎ −7.37⁎⁎⁎
10 3.88⁎⁎⁎ 2.45⁎⁎⁎ −2.46⁎ −7.44⁎⁎⁎ −9.40⁎⁎⁎
Group 20.38⁎⁎⁎ 13.11⁎⁎⁎ −2.52⁎ −16.28⁎⁎⁎ −25.47⁎⁎⁎
123J.W. Houpt et al. / Acta Psychologica 145 (2014) 118–127
4.1.2. StimuliThe stimuli were essentially the same as those used in the word,
pseudoword and random versions in Experiment 1, except with capitalletters. Because the main effects of interest are the word, pseudoword,and random versions, we did not run the upside-down and Katakanaversions in Experiment 2.
4.1.3. ProcedureUnlike Experiment 1, the stimuli were immediately followed by a
mask made of Xs and Os overlayed in each position that a letter wasshown (following Reicher, 1969). To allow participants to maintainhigh accuracy despite themask, we increased the stimulus presentationtime to 100 ms, which we chose based on pilot data. The trial structureis shown in Fig. 6.
4.2. Results
Response times in the string condition (top left of Fig. 7), showedwas a significant effect of version (F(2,22) = 12.6, p b 0.05, ηG2 =0.25) and a significant interaction between version and target/distractor(F(2,22) = 6.36, p b 0.05, ηG2 = 0.0046), both ofwhich failedMauchly'stest for sphericity (version: W = 0.194, p b 0.05; interaction: W =0.532, p b 0.05) but both remained significant after a Greenhouse–Geisser correction (version: GGe = 0.554, p b 0.05; interaction GGe =0.532, p b 0.05). There was not a significant main effect of target/distractor (F(1,11) = 0.177, p = 0.68).
Therewere also significant effects on accuracy in the string condition(bottom left of Fig. 7). Both main effects were significant (version:(F(2,22) = 14.42, p b 0.05, ηG2 = 0.41); target/distractor: (F(1,11) =12.6, p b 0.05, ηG2 = 0.072) as was the interaction (F(2,22) = 5.33,p b 0.05, ηG2 = 0.033)). Again, both version and the interaction failedtest for sphericity (version: W = 0.132, p b 0.05; interaction: W =0.531, p b 0.05) but remained significant after correction (version:GGe = 0.536, p b 0.05; interaction: GGe = 0.536, p b 0.05).
After Bonferroni correction (a = 0.05/3 = 0.0167), all but one ofthe pairwise comparisons on the target data were significant, the com-parison of response times in the word and pseudoword versions(F(1,11) = 6.49, p = 0.027). Accuracy comparisons: Word versuspseudoword (F(1,11) = 20.0, p b 0.0167, ηG2 = 0.374); word versusrandom (F(1,11) = 20.12, p b 0.0167, ηG2 = 0.475); pseudoword ver-sus random (F(1,11) = 13.23, p b 0.0167, ηG2 = 0.293). Responsetime comparisons: Word versus random (F(1,11) = 19.5, p b 0.0167,ηG2 = 0.302), pseudoword versus random (F(1,11) = 13.0, p b 0.0167,ηG2 = 0.202).
In the single character condition (right side of Fig. 7), there were nosignificant response effects of target/distractor (F(1,11) = 0.413,p = 0.53) version (F(2,22) = 1.59, p = 0.23) nor any significant inter-action (F(2,22) = 1.15, p = 0.33). There was a significant effect of
version on response time (F(2,22) = 3.48, p = 0.33) but neither tar-get/distractor (F(1,11) = 0.187, p = 0.67) nor the interaction was sig-nificant (F(2,22) = 0.0731, p = 0.93).
Individual capacity coefficients are shown in Fig. 8 and z-scores forindividual and group data are shown in Table 3. Nearly all participantsare significantly better than the standard parallel model in the wordand pseudoword versions. In the random letter condition, half of theparticipants did not have high enough accuracy to apply the capacity co-efficient. The accuracy results for these participants indicate limited ca-pacity because the pseudoword string condition had particularly lowaccuracy at the group levelwhile the letter level accuracywasnot signif-icantly different from the other letter conditions. In fact, all participantsexcept 10 and 11 had worse performance on the random letter stringsthan would be predicted by independent identification of each letter.4
However, of those participants that had high enough accuracy, fourhad significantly super-capacity performance at the a = 0.05 level.5
Due to the missing capacity values, we performed a series of pairedt-tests, in lieu of an ANOVA. With Bonferroni correction (a = .05/3 = .0167), word capacity was significantly higher than nonword ca-pacity (t(5) = 5.92, p b 0.0167) and pseudoword capacity was higherthan nonword capacity (t(5) = 5.92, p b 0.0167), but word andpseudoword capacity were not significantly different (t(10) = 0.773,p = 0.458).
4.3. Discussion
In Experiment 2, all of the single characters were letters, so the lackof any significant effect of version on letter response time and accuracyis not surprising. The random letter version differs from the other two inthat all of the characters are consonants, which may be processedslower or less accurate than vowels (Appelman & Mayzner, 1981), butthere was no evidence of that difference here. Instead, the capacity dif-ferences among the versions are due to the differences in responsetimes in the string conditions.Words and pseudowords were processedfaster than random letters and had higher capacity values, consistentwith Experiment 1 and theword and pseudoword effects. Also in keep-ing with Experiment 1, words and pseudowords were super-capacity,indicating superior performance of the letters in those contexts over let-ter in isolation. Thus, even using masking and upper case letters andminimizing the reliance on memory, there is still a clear indication ofthe standard superiority effects.
One unexpected result was that the random letter sequences werealso super-capacity for many participants, despite being significantlylower capacity than the word and pseudoword version. This may bedue to the extensive practice participants had with the target string.Even consonant sequences can show superiority effects if they arehighly familiar (Laszlo & Federmeier, 2007). Alternatively, the generallylower accuracy in random version may explain the super-capacity, asthe traditional capacity coefficient assumes high accuracy (this is whya half of the participants have NA listed in the Random column ofTable 3: their accuracy was too low). Hence, participants may haveweighed the relative importance of speed and accuracy differently ineach version, despite receiving the same instructions for each.

Fig. 6. Trial structure for Experiment 2. Trials began with a fixation cross, followed by a blank screen. After a brief, random delay the probe appeared for 100 ms. A mask was presentedimmediately following the probe. Instructions indicating the target and distractors were given before each trial.
124 J.W. Houpt et al. / Acta Psychologica 145 (2014) 118–127
5. General discussion
We demonstrated clear word and pseudoword superiority effects inresponse times using the capacity coefficient. This includes a superiorityof letter perception in word and pseudoword contexts over letters aloneand over letters embedded in random consonant sequences. Further-more, unlike the standard accuracy based effect, these superiority effectsare not dependent on the presence of amask. By using response times,wecan also draw conclusions about the structure of the perceptual processesthat were not possible to determine based on the accuracy effect.Foremost, we have clearly rejected an unlimited capacity, independent,parallel processing (standard parallel) model of word and pseudoword
Strings
Res
pons
e T
ime
TargetDistractor
560
670
780
890
1000
WordPseudo−
word Random
Acc
urac
y
0.70
00.
775
0.85
00.
925
1.00
0
WordPseudo−
word Random
Fig. 7.Response times and accuracy fromExperiment 2. Error bars indicate the standard error ofThe left graphs are data from the string tasks; the right graphs are from the corresponding singleshown on a smaller scale than the string response times. Both accuracy plots are on the same
perception; the models presented in Massaro (1973) and Pelli et al.(2003) are not consistent with the results reported herein.
To further explore the implications of the capacity coefficient results,we examine each of the multiple plausible explanations for those results.When the Houpt and Townsend (2012) z-test is significant, then at leastone of the assumptions of the standard parallel modelmust have been vi-olated. Note that each of these violations has been considered previouslyfor explanations of the accuracy based superiority effects.
One assumption that may have been violated is that of indepen-dence. If there is any type of facilitation between the letter processes,each letter would be processed faster within a word or pseudowordcontext which would explain the capacity coefficient values above one.
Character
560
595
630
665
700
WordPseudo−
word Random
0.70
00.
775
0.85
00.
925
1.00
0
WordPseudo−
word Random
themean. The top two graphs showmean response times; the bottom two show accuracy.character tasks. To highlight variation across task version, the character response times arescale.

400 600 800 1200
02
46
Word
Time
C(t
)
400 600 800 1200
Pseudoword
400 600 800 1200
Random
Time Time
Fig. 8. Capacity coefficients for words, pseudowords, and random letters in Experiment 2.Gray lines indicate individual participants' capacity coefficients and the thick line indicatesthe average function across participants. The capacity coefficients for each participant areonly plotted in regions where reasonable estimates are possible based on individualresponse time distributions.
Table 3Workload capacity statistics for each participant in each version of the task in Experiment2. Capacity coefficients for participants with lower than 80% accuracy on any of the singlecharacter conditions or the string condition in a particular version were not calculated.Under the null hypothesis the limit distribution of the statistic has a standard normaldistribution. Significance levels of z-tests are indicated by: ⁎⁎⁎: p b 0.001, ⁎⁎: p b 0.01,and ⁎: p b 0.05.
Word Pseudoword Random
1 6.01⁎⁎⁎ 4.44⁎⁎⁎ NA2 9.64⁎⁎⁎ 2.60⁎⁎⁎ −0.07⁎⁎⁎
3 7.75⁎⁎⁎ 12.6⁎⁎⁎ NA4 7.74⁎⁎⁎ 9.49⁎⁎⁎ 5.44⁎⁎⁎
5 4.31⁎⁎⁎ 7.03⁎⁎⁎ NA6 13.5⁎⁎⁎ 9.06⁎⁎⁎ 0.797 5.23⁎⁎⁎ 5.72⁎⁎⁎ NA8 9.66⁎⁎⁎ 11.0⁎⁎⁎ 1.96⁎
9 17.7⁎⁎⁎ 15.3⁎⁎⁎ 5.76⁎⁎⁎
10 14.5⁎⁎⁎ 11.3⁎⁎⁎ 3.95⁎⁎⁎
11 10.8⁎⁎⁎ NA NA12 −1.31⁎⁎⁎ −2.66⁎⁎⁎ NAGroup 30.5⁎⁎⁎ 5.9⁎⁎⁎ 7.28⁎⁎⁎
125J.W. Houpt et al. / Acta Psychologica 145 (2014) 118–127
There could be many explanations of this facilitation. For example, wordprocessing mechanisms may in fact take advantage of the considerableamount of co-occurrence between letters in English. As is often observed,there are only a fraction of possible four letter combinations used forwords and it would be surprising if we did not take some advantage ofthis reduction in uncertainty. This correlation between letters is an im-portant part of how connectionist models explain the word superiorityeffect (Coltheart, Rastle, Perry, Langdon, & Ziegler, 2001; McClelland &Rumelhart, 1981; Plaut, McClelland, Seidenberg, & Patterson, 1996).When the characters are less familiar, such as upside-down letters or Ka-takana characters, then their confusability may lead to inhibition amongthe perceptual processes and thus limited capacity.
A related component of many visual word processing models is thephonological pathway (e.g., Coltheart et al., 2001). If a phoneme is acti-vated as a possible interpretation of some letter combination, then itmay in turn send positive feedback to those letters, speeding up theirprocessing. Hence, a phonological component of visual word processingcould also lead to capacity coefficient values above one. Both thecorrelation between letters and the lack of a regular pronunciation ofthe nonwords imply that these predictions are consistent with lack ofevidence against the standard parallel model of nonword processing.The phonological explanation is also supported by the evidence of apseudoword superiority effect.
Another assumption of the standard parallelmodel is that the lettersare processed in parallel, with a separate detection of each letter. Analternative architecture that does predict capacity coefficient valuesabove one is the coactive architecture (Colonius & Townsend, 1997;Houpt & Townsend, 2012; Townsend & Nozawa, 1995; Townsend &Wenger, 2004) which pools information from multiple parallel sourcesfor single decision. By pooling activation from each of the letters whenprocessing a word, the word is processedmuch faster than if each letteris processed separately. A coactive architecture in this sense can bethought of as an extreme version of a facilitatory parallel model, inwhich all activation in each of the letters is shared (Eidels, Houpt, Pei,Altieri, & Townsend, 2011). Many connectionist models of visual wordperception assume a type of coactive architecture. In these models theactivation accumulated in favor of a letter is immediately passed on tothe word level. In this framework the type of parallel model assumedin the standard parallel would not pass on any activation until theletter process is complete. Similarly, a holisticmodel of word perception(e.g., Drewnowski & Healy, 1977) has a coactive form: informationpooled for a single identification. There is somemiddle ground betweenthese two extremes. One example is that of squelching suggested byPelli et al. (2003). In this case, the activation from the letter processwould only be passed on once it is above a certain threshold.
The particularly low capacity for the upside-down andKatakana ver-sions could be due to serial processing of the individual characters.Withunfamiliar characters, participantsmay be forced to check each positionin the string, one at a time. All else being equal, serial processing ismuchless efficient than parallel processing, so it leads to limited capacity. Itis important to note that the word and pseudoword results are not
necessarily inconsistent with serial processing, but for a serial modelto predict capacity-values above one it would need to include largeamounts of facilitation and/or require faster processing of individualcharacters as the number of characters increases (cf. Whitney, 2001).
A coactive architecture could also lead to violations of the assump-tion of unlimited capacity, so that seemingly more resources are avail-able to each component when more components are present. Capacityvalues above one imply that the participant dedicated more than fourtimes the resources in the word task compared to the letter task: Eachindividual letter process in the word has at least the resources availablethat were available when that letter was presented in isolation. In thissense the advantage is similar to chunking; when groups of letters arerecognized as a single unit, the resources that would have been dividedacross two individual letter units can be dedicated to a single chunkedunit. Participants probably do not have truly unlimited resources to ded-icate to the task, there is no doubt an upper limit on the number of let-ters a person can perceive at once, but having enough resourcesavailable to act super-capacity with four letters is not so unreasonable.
In addition to the group level findings, there intriguing individualdifferences indicted in these data, particularly in word and pseudowordprocessing capacity. This finding mirrors results reported in accuracybased studies (e.g., Reicher, 1969) and itwill be an interesting extensionof this work to compare the capacity measure to established measuresof individual differences in reading. In fact, research is currently under-way using the capacity coefficient to study dyslexia (Sussman, Houpt,Townsend, & Newman, 2011).
Another important finding in this paper is that the word superiorityeffect, asmeasured by the capacity coefficient, is not eliminated in the ab-sence of a post-stimulus mask. This raises the question as to why the ac-curacy based word superiority effect is less robust. One possibility, raisedin the introduction, is that words may be fully processed, even if the taskonly requires a decision on a part. Thus, the accuracy advantages of aword context might be mitigated by the fact that more is processed in aword context than in a nonword context. This is a special case of themore general issue that response time ismore sensitive to certain aspectsof perception, such as distinguishing exhaustive and self-terminatingstrategies and distinguishing coactive and parallel processing, than accu-racy (cf., Townsend&Ashby, 1983; Townsend&Nozawa, 1995). In futureresearch, it will be important to determine if capacity coefficient measureof word superiority is robust against other manipulations that may dis-rupt the accuracy based effect, such as attentional allocation and fixationlocation (e.g., Johnston &McClelland, 1974; Purcell, Stanovich, & Spector,1978) or the size of the word (Purcell et al., 1978).
We can also examine these results in the context of other configuralsuperiority effects measured by the capacity coefficient. For example,Eidels, Townsend, and Pomerantz (2008) demonstrated super-capacity

Word Kucera & Francisfrequency
Pseudoword Neighborhoodsize
Summed frequencyof neighbors
CARE 162 LERB 2 12BARE 29 NERB 2 12CURE 28 LARB 5 27CAVE 9 LEMB 2 26CARD 26 LERF 2 15
126 J.W. Houpt et al. / Acta Psychologica 145 (2014) 118–127
performance when participants could distinguish targets based on globaltopological properties of the stimulus. In contrast, they found limited orunlimited capacity when the stimuli were made of the same parts asthe super-capacity task, but the parts were organized in such a way thatthe targets were not distinguishable based on their topology. If thesame perceptual mechanisms underly the super-capacity in the Eidelset al. (2008) and the current study, this would suggest that the super-capacity performance is driven by global shape of the word, includingboth the outline as well as the shapes defined by neighboring letters.Without additional assumptions, the global shape explanation wouldimply super-capacity performance even in the nonwords. It may be thatthrough many years of experience we are specially attuned to the differ-ences between shapes generated by words but not so well attuned fornonword sequences. The shape as the lone explanation of the superiorityeffect may be a bit of a stretch, but global shape may still play a role inword perception, particularly if there is some sort of unitized representa-tion of the words that is used for recognition (cf., Healy, 1994).
Whether or not learning specific global shapes contributes toword superiority, it is likely that perceptual learning is an importantpart of many configural superiority effects. Blaha (2010) examinedthe effects of perceptual learning on the capacity coefficient. Usingstimuli that Goldstone (2000) had demonstrated could lead to per-ceptual unitization, Blaha measured the capacity coefficient for tar-gets over the course of multiple days of learning. When the stimuliwere novel, participants were extremely limited capacity. Over thecourse of about a week of training (relatively few trials comparedto the number of times we see common words), most participantsreached high levels of super-capacity. The parts used in those stimuliwere randomly generated “squiggly” lines, for which, like letters,there is no reason to believe people have any innate ability to formunitized representations. Given that Blaha used the same task struc-ture (with squiggly lines in place of letters) and found similar levelsof super-capacity at the end of training, we believe that perceptuallearning plays an important part in the capacity coefficient word su-periority effect. In future work, we hope to explore this connectionby using the capacity coefficient to measure word superiority at dif-ferent stages of the development of reading ability.
Finally, we reiterate the importance of going beyond the simpleANOVA analysis of these data. Merely finding an ordering of the meansin the string conditions says nothing about the relative processing effi-ciencies. For example, faster word processing than nonword processingcould be due to the letters in “care” being relatively faster to processthan the letters “rlkf”. Workload capacity analysis, however, takes theprocessing of the components into account in estimating efficiency.
5.1. Summary
We have demonstrated response time based evidence for visualword perception as a particularly efficient process using the capacity co-efficient. This includes evidence that words are more efficiently per-ceived than predicted by the individual letter reading times, andevidence from comparing word perception efficiency to nonword stim-uli. Based on the workload capacity analysis, there is also evidence for apseudoword superiority effect in the response time domain althoughnot as strong as for word superiority. The evidence we present negatesmodels of word processing that assume parallel, independent process-ing of letters with separate decision thresholds on each channel. Thisdeeper level of understanding of visual word perception required ashift from statistics based on comparing means toward a more theoret-ically rich, modeling-based approach.
Appendix A. Derivation of standard parallel capacity
The mathematical formulation of this construct can be derived asfollows. Suppose, as in our tasks, the participant can only respondwhen they have identified all of the letters (ci) in the word (S). Then
the probability that she has responded to the word is the probabilitythat she has already identified each of the letters,
P RTS≤tf g ¼ P RTc1≤t;RTc2
≤t;RTc3≤t;RTc4
≤tn o
: ðA:1Þ
If we assume that the letters are perceived independently and inparallel, then Eq. (A. 1) can be simplified to,
P RTS≤tf g ¼ P RTc1≤t
n oP RTc2
≤tgP RTc3≤t
n oPfRTc4
≤tn o
: ðA:2Þ
The capacity function for an exhaustive task is defined using thecumulative reverse hazard function, K(t) = 1 nF(t);F(t) = P{RT ≤ t},and is similar to the cumulative hazard function used in survival analy-sis (cf. Chechile, 2011). If Kc1 is the cumulative reverse hazard for thefirst character response times, Kc2 is the cumulative reverse hazard forthe second character, etc., and Ks is the cumulative reverse hazard forthe string condition, the capacity coefficient is given as,
C tð Þ ¼X4
i¼1Kci
h i
KS: ðA:3Þ
By taking the logarithm of both sides of Eq. (A. 2), we see that thebaseline model predicts capacity to be equal to 1,
log P RTS≤tf g½ � ¼log P RTc1
≤tn o
P RTc2≤t
n oP RTc3
≤tn o
P RTc4≤t
n oh i
log P RTS≤tf g½ � ¼X4
i¼1
log P RTci≤t
n oh i
KS ¼X4
i¼1
Ki
C tð Þ ¼ 1:
To measure a participant's performance against the baseline model,performance must be measured when each of the single characters arepresented in isolation and when all characters are used together.Response times from each of the single character conditions are usedto estimate the cumulative reverse hazard for each term in the sum inthe numerator of Eq. (A. 3). The times to respond to all of the characterstogether are used to estimate the cumulative reverse hazard function inthe denominator.
Following Houpt and Townsend (2012), we use the Nelson–Aalentype estimator for the cumulative reverse hazard function. We useG(t) for the number of responses that have occurred in a given conditionup to and including time t and Tj to indicate the jth response time in theordered list of all of the correct response times for that condition. Usingthat notation, the estimate is,
K̂ tð Þ ¼ −XT j ≤ t
1
G T j
� � :
Appendix B. Word and pseudoword details

127J.W. Houpt et al. / Acta Psychologica 145 (2014) 118–127
References
Allport, A. (2009). Recognition units in reading: Backward masking experiments. SpatialVision, 22, 473–491.
Appelman, I. B., & Mayzner, M. S. (1981). The letter-frequency effect and the generality offamiliarity effects on perception. Perception & Psychophysics, 30, 436–446.
Baron, J., & Thurston, I. (1973). An analysis of the word-superiority effect. CognitivePsychology, 4, 207–228.
Blaha, L. M. (2010). A dynamic Hebbian-style model of configural learning. (Ph.D. thesis).Indiana: Indiana University Bloomington.
Carr, T. H., Davidson, B. J., & Hawkins, H. L. (1978). Perceptual flexibility in word recogni-tion: Strategies affect orthographic computation but not lexical access. Journal ofExperimental Psychology. Human Perception and Performance, 4, 674–690.
Cattell, J. M. (1886). The time it takes to see and name objects. Mind, 11, 63–65.Chechile, R. A. (2011). Properties of reverse hazard functions. Journal of Mathematical
Psychology, 55, 203–222.Colonius, H., & Townsend, J. T. (1997). Activation-state representation of models
for the redundant-signals-effect. In A. J. Marley (Ed.), Choice, decision, andmeasurement: Volume in honor of R. Duncan Luce (pp. 245–254). Mahweh, N.J.:Erlbaum Associates.
Coltheart, M., Rastle, K., Perry, C., Langdon, R., & Ziegler, J. (2001). DRC: A dual route cas-caded model of visual word recognition and reading aloud. Psychological Review, 108,204–256.
R Development Core Team (2011). R: A language and environment for statistical computing.Vienna, Austria: R Foundation for Statistical Computing3-900051-07-0.
Drewnowski, A., & Healy, A. F. (1977). Detection errors on the and and: Evidence for read-ing units larger than the word. Memory and Cognition, 5, 636–647.
Eidels, A., Donkin, C., Brown, S. D., & Heathcote, A. (2010). Converging measures of work-load capacity. Psychonomic Bulletin & Review, 17, 763–771.
Eidels, A., Houpt, J. W., Pei, L., Altieri, N., & Townsend, J. T. (2011). Nice guys finish fast, badguys finish last: Facilitatory vs. inhibitory interaction in parallel systems. Journal ofMathematical Psychology, 55, 176–190.
Eidels, A., Townsend, J. T., & Pomerantz, J. R. (2008). Where similarity beats redundancy:The importance of context, higher order similarity, and response assignment.Journal of Experimental Psychology. Human Perception and Performance, 34,1441–1463.
Estes, W. K. (1975). The locus of inferential and perceptual processes in letter identifica-tion. Journal of Experimental Psychology. General, 104, 122–145.
Estes, W. K., & Brunn, J. L. (1987). Discriminability and bias in the word-superiority effect.Perception & Psychophysics, 42, 411–422.
Ferraro, F. R., & Chastain, G. (1997). An analysis of Reicher-task effects. The Journal ofGeneral Psychology, 124, 411–442.
Goldstone, R. L. (2000). Unitization during category learning. Journal of ExperimentalPsychology. Human Perception and Performance, 26, 86–112.
Healy, A. F. (1994). Letter detection: A window into unitization and other cognitive pro-cesses in reading text. Psychonomic Bulletinn & Review, 3, 333–344.
Houpt, J. W., Blaha, L. M., McIntire, J. P., Havig, P. R., & Townsend, J. T. (2013). Systemsfactorial technology with R. Behavior Research Methods. http://dx.doi.org/10.3758/s13428-013-0377-3 (Advance online publication).
Houpt, J. W., & Townsend, J. T. (2012). Statistical measures for workload capacity analysis.Journal of Mathematical Psychology, 56, 341–355.
Johnston, J. C., & McClelland, J. L. (1973). Visual factors in word perception. Perception &Psychophysics, 14, 365–370.
Johnston, J. C., & McClelland, J. L. (1974). Perception of letters in words: Seek not and yeshall find. Science, 184, 1192–1194.
Krueger, L. E. (1970). Search time in a redundant visual display. Journal of ExperimentalPsychology, 83, 391–399.
Kucera, H., & Francis, W. (1967). Computational analysis of present-day American English.Providence: Brown University Press.
LaBerge, D., & Samuels, S. (1974). Toward a theory of automatic information processing inreading. Cognitive Psychology, 6, 293–323.
Laszlo, S., & Federmeier, K. D. (2007). The acronym superiority effect. Psychonomic Bulletin& Review, 14, 158–1163.
Lawrence, M.A. (2012). ez: Easy analysis and visualization of factorial experiments. R packageversion 4.1-1.
Massaro, D. W. (1973). Perception of letters, words, and nonwords. Journal of ExperimentalPsychology, 100, 349–353.
Massaro, D. W., & Klitzke, D. (1979). The role of lateral masking and orthographic struc-ture in letter and word recognition. Acta Psychologica, 43, 413–426.
McClelland, J. L., & Johnston, J. C. (1977). The role of familiar units in perception of wordsand nonwords. Perception & Psychophysics, 22, 249–261.
McClelland, J. L., & Rumelhart, D. E. (1981). An interactive activation model of context ef-fects in letter perception: Part 1. An account of basic findings. Psychological Review,88, 375–407.
Pelli, D.G., Farell, B., & Moore, D. C. (2003). The remarkable inefficiency of word recogni-tion. Nature, 423, 752–756.
Plaut, D. C., McClelland, J. L., Seidenberg, M. S., & Patterson, K. (1996). Understanding nor-mal and impaired word reading: Computational principles in quasi-regular domains.Psychological Review, 103, 56–115.
Purcell, D.G., Stanovich, K. E., & Spector, A. (1978). Visual angle and the word superiorityeffect. Memory & Cognition, 6, 3–8.
Rastle, K., Harrington, J., & Coltheart, M. (2002). 358,534 nonwords: The ARC nonworddatabase. Quarterly Journal of Experimental Psychology, 55A, 1339–1362.
Reicher, G. M. (1969). Perceptual recognition as a function of meaningfulness of stimulusmaterial. Journal of Experimental Psychology, 81, 274–280.
Sussman, B.L., Houpt, J. W., Townsend, J. T., & Newman, S. D. (2011). EEG correlatesof visual word processing efficiency in dyslexia. Poster presented at: Society forNeuroscience annual meeting.
Townsend, J. T., & Altieri, N. (2012). An accuracy–response time capacity assessment func-tion that measures performance against standard parallel predictions. PsychologicalReview, 119, 500–516.
Townsend, J. T., & Ashby, F. G. (1983). The stochastic modeling of elementary psychologicalprocesses. Cambridge: Cambridge University Press.
Townsend, J. T., & Nozawa, G. (1995). Spatio-temporal properties of elementary perception:An investigation of parallel, serial and coactive theories. Journal of MathematicalPsychology, 39, 321–360.
Townsend, J. T., & Wenger, M. J. (2004). A theory of interactive parallel processing:New capacity measures and predictions for a response time inequality series.Psychological Review, 111, 1003–1035.
Wheeler, D.D. (1970). Processes in word recognition. Cognitive Psychology, 1, 59–85.Whitney, C. (2001). How the brain encodes the order of letters in a printed word: The
SERIOLmodel and selective literature review. Psychonomic Bulletin&Review, 8, 221–243.