Embed Size (px)
Citation preview

INFORMA TION, A NA LY SIS A ND A DV ICE FOR THE PA RL IA MENT
INF OR MAT I ON AND R ESE ARCH SER VICESP AR L I AME N T AR Y L I BR AR Y
Research Paper No. 10 2003–04
A new paradigm of international migration: implications for migration policy and planning in Australia
This paper argues that the global drivers of international migration have been transformed in the last decade and that this has greatly changed the context in which migration to and from Australia occurs and in which immigration policy is developed. The globalisation of labour markets, the development of an immigration industry, the proliferation of social networks, the information and transport revolutions, expansion of trade and economic change have all lead to international migration being within the calculus of choice of an increasing proportion of the world’s inhabitants. As a result, there has been a massive increase in global population movement and an increase in the complexity of the types of movement—permanent and temporary, legal and undocumented, forced and voluntary, work and non-work related, etc. In Australia much thinking about international migration remains anchored in a paradigm of movement that applied in the four decades following the Second World War, which focused almost entirely on permanent settlement. The contemporary situation is that the international migration impinging on Australia is now more complex especially with temporary residence becoming more important and more Australians than ever before migrating to live and work for extended periods in other countries. It is argued that much of the thinking and research on immigration in Australia neglects the new reality of international movements. International migration has been, and remains a crucial component of Australia’s economic, social and cultural development. It is important that Australia’s international migration research and thinking take full cognizance of these important changes.
Professor Graeme Hugo Consultant, Social Policy Section 8 March 2004
D E P A R T M E N T O F P A R L I A M E N T A R Y S E R V I C E S

ISSN 1328-7478 © Copyright Commonwealth of Australia 2004 Except to the extent of the uses permitted under the Copyright Act 1968, no part of this publication may be reproduced or transmitted in any form or by any means including information storage and retrieval systems, without the prior written consent of the Parliamentary Library, other than by Senators and Members of the Australian Parliament in the course of their official duties. This paper has been prepared for general distribution to Senators and Members of the Australian Parliament. While great care is taken to ensure that the paper is accurate and balanced, the paper is written using information publicly available at the time of production. The views expressed are those of the author and should not be attributed to the Information and Research Services (IRS). Advice on legislation or legal policy issues contained in this paper is provided for use in parliamentary debate and for related parliamentary purposes. This paper is not professional legal opinion. Readers are reminded that the paper is not an official parliamentary or Australian government document. IRS staff are available to discuss the paper’s contents with Senators and Members and their staff but not with members of the public. About the Author Graeme Hugo is Professor of Geography and Director of The National Centre for Social Applications of Geographical Information Systems at The University of Adelaide. He is currently an Australian Research Council Federation Fellow and has begun a research project on Australia’s Changing International Paradigm. He has published widely on population issues especially international and internal migration in Australia and South East Asia. Enquiries Information and Research Services publications are available on the ParlInfo database. On the Internet the Parliamentary Library can be found at: http://www.aph.gov.au/library/
IRS Publications Office Telephone: (02) 6277 2778
Published by Information and Research Services, Parliamentary Library, Department of Parliamentary Services, 2004.

Contents Executive summary . . . . . . . . . . . . . . . . . . . . . . . . . . . . . . . . . . . . . . . . . . . . . . . . . . . 1
Introduction . . . . . . . . . . . . . . . . . . . . . . . . . . . . . . . . . . . . . . . . . . . . . . . . . . . . . . . . 3
The ‘new’ international migration . . . . . . . . . . . . . . . . . . . . . . . . . . . . . . . . . . . . . . . . 4
Some data considerations. . . . . . . . . . . . . . . . . . . . . . . . . . . . . . . . . . . . . . . . . . . . . . 10
Changes in the origin of settlers to Australia . . . . . . . . . . . . . . . . . . . . . . . . . . . . . . . . 12
Increased temporary migration . . . . . . . . . . . . . . . . . . . . . . . . . . . . . . . . . . . . . . . . . . 17
Increasing ‘onshore’ migration. . . . . . . . . . . . . . . . . . . . . . . . . . . . . . . . . . . . . . . . . . 28
Increasing undocumented migration . . . . . . . . . . . . . . . . . . . . . . . . . . . . . . . . . . . . . . 33
An increasing focus on skills in migration. . . . . . . . . . . . . . . . . . . . . . . . . . . . . . . . . . 37
Regional migration schemes . . . . . . . . . . . . . . . . . . . . . . . . . . . . . . . . . . . . . . . . . . . 43
Emigration and the Australian diaspora . . . . . . . . . . . . . . . . . . . . . . . . . . . . . . . . . . . 56
Conclusion . . . . . . . . . . . . . . . . . . . . . . . . . . . . . . . . . . . . . . . . . . . . . . . . . . . . . . . . 68
Endnotes . . . . . . . . . . . . . . . . . . . . . . . . . . . . . . . . . . . . . . . . . . . . . . . . . . . . . . . . . 70
Appendix: Definitions of Australian state specific and regional migration schemes . . . . 77
Bibliography. . . . . . . . . . . . . . . . . . . . . . . . . . . . . . . . . . . . . . . . . . . . . . . . . . . . . . . 78
List of Tables
Table 1: Australia: permanent migration to and from the United Kingdom . . . . . . . . . . . 4
Table 2: Traditional migration countries: Asian populations around 2001 . . . . . . . . . . . 7
Table 3: Immigration and ethnicity related topics included in Australian Population Censuses, 1911–2001 . . . . . . . . . . . . . . . . . . . . . . . . . . . . . . . . . . . . . . . . . 12
Table 4: Europe-born persons in Australia, 1861–2001 . . . . . . . . . . . . . . . . . . . . . . . . 13
Table 5: Change in the composition of the Australian population by place of birth, 1947 and 2001 . . . . . . . . . . . . . . . . . . . . . . . . . . . . . . . . . . . . . . . . . . . . . . 16
Table 6: Australia: fastest and slowest growing groups of foreign-born persons, 1991–2001. . . . . . . . . . . . . . . . . . . . . . . . . . . . . . . . . . . . . . . . . . . . . . . . . 17
Table 7: Growth of population movement into and out of Australia, 1982–83 to 2002–03. . . . . . . . . . . . . . . . . . . . . . . . . . . . . . . . . . . . . . . . . . . . . . . . . . . 19
Table 8: Temporary business entry visa grants 2001–02 and 2002–03. . . . . . . . . . . . . . 24
Table 9: Temporary entrants to Australia . . . . . . . . . . . . . . . . . . . . . . . . . . . . . . . . . . 24
Table 10: Components of net overseas migration (‘000), 1983–2003 . . . . . . . . . . . . . . 26

Table 11: Australia: temporary business long stay migrants (Category 457) who were granted permanent residence 1999–2001 . . . . . . . . . . . . . . . . . . . . . . . 27
Table 12: Australia: origin countries of permanent and temporary resident arrivals 2002–03 . . . . . . . . . . . . . . . . . . . . . . . . . . . . . . . . . . . . . . . . . . . . . . . . . . . 27
Table 13: Migration Program 2002–03, offshore and onshore outcomes—refugee/humanitarian . . . . . . . . . . . . . . . . . . . . . . . . . . . . . . . . . . . . . . . . . 30
Table 14: Refugee entitlements in Australia, November 1999. . . . . . . . . . . . . . . . . . . . 32
Table 15: Temporary Protection Visas granted, 1999–2003 . . . . . . . . . . . . . . . . . . . . . 33
Table 16: Outcomes of Australia’s Humanitarian Program by component and category from 1997–98 to 2002–03 . . . . . . . . . . . . . . . . . . . . . . . . . . . . . . . 33
Table 17: Australia: number of overstayers, 1990–2003 . . . . . . . . . . . . . . . . . . . . . . . 34
Table 18: Main source countries for people refused immigration visas at Australian airports, 1995–2003 . . . . . . . . . . . . . . . . . . . . . . . . . . . . . . . . . . . . . . . . . . 36
Table 19: Numbers of boats and persons aboard arriving clandestinely in Australia and detected, 1989 to 2002–03. . . . . . . . . . . . . . . . . . . . . . . . . . . . . . . . . . . 37
Table 20: Australia: boat people, 1989–2003 status as at 17 April 2003 . . . . . . . . . . . . 37
Table 21: Program Management Structure (2001–02) Migration (non-Humanitarian) Program. . . . . . . . . . . . . . . . . . . . . . . . . . . . . . . . . . . . . . . . 39
Table 22: Australia: changes in labour force indicators by birthplace, 1996–2001 . . . . . 43
Table 23: Australia: distribution of population between states and territories, 1881–2001 . . . . . . . . . . . . . . . . . . . . . . . . . . . . . . . . . . . . . . . . . . . . . . . . . . . . . 44
Table 24: Australian states and territories: percentage distribution of the population by birthplace and overseas-born arriving in the last five years, 1996 and 2001 . . . . . . . . . . . . . . . . . . . . . . . . . . . . . . . . . . . . . . . . . . . . . . . . . . . . . 45
Table 25: Australian states and territories: natural increase, net overseas migration, net interstate migration and total population growth, financial years 1996–2001 . . . . . . . . . . . . . . . . . . . . . . . . . . . . . . . . . . . . . . . . . . . . . . . . . 46
Table 26: Australia: persons by section of state by birthplace by year of arrival at 2001 Census . . . . . . . . . . . . . . . . . . . . . . . . . . . . . . . . . . . . . . . . . . . . . . . . 46
Table 27: Distribution of migrants granted visas under state specific migration mechanisms, 1998–99 to 2002–03 . . . . . . . . . . . . . . . . . . . . . . . . . . . . . . . . 49
Table 28: Permanent residents, 1 July 2001 to 30 June 2003 grouped by visa category and location in Australia . . . . . . . . . . . . . . . . . . . . . . . . . . . . . . . . 51
Table 29: United States: change in population of foreign born living in selected states 1990 and 2000. . . . . . . . . . . . . . . . . . . . . . . . . . . . . . . . . . . . . . . . . . 52

Table 30: Temporary Business Entrants (subclass 457) and Permanent Arrivals in the Skill Visa Categories Compared. . . . . . . . . . . . . . . . . . . . . . . . . . . . . . . 54
Table 31: Australia: settlers and long-term migration, 1987 to 2002–03 . . . . . . . . . . . . 58
Table 32: Australia: permanent movement, financial years, 1968–69 to 2002–03 . . . . . 59
Table 33: Australia: long-term movement, 1959–60 to 2002–03. . . . . . . . . . . . . . . . . . 61
Table 34: National diasporas in relation to resident national populations. . . . . . . . . . . . 66
Table 35: Terms of Reference of the Australian Senate’s Legal and Constitutional References Committee Inquiry into Australian Expatriates . . . . . . . . . . . . . . 66
List of Figures
Figure 1: Countries with the largest international migrant stock, 2000 . . . . . . . . . . . . . . 5
Figure 2: Countries with the highest percentage of international migrant stock, 2000 (countries with population of one million or more inhabitants) . . . . . . . . . . . . 6
Figure 3: Overseas students in Australian universities, 1983–2001 . . . . . . . . . . . . . . . . . 8
Figure 4: Australia: immigrants from Europe, 1951–2003 . . . . . . . . . . . . . . . . . . . . . . 13
Figure 5: Immigrants from Europe as a percentage of total immigrants, 1951–2003. . . . 14
Figure 6: Australia: settler arrivals by region of last residence, 1947–2003. . . . . . . . . . 15
Figure 7: Australia: short-term movements, 1970–71 to 2001–03 . . . . . . . . . . . . . . . . 19
Figure 8: Australia: long-term arrivals and departures, 1959–60 to 2002–03 . . . . . . . . . 20
Figure 9: Australia: net permanent and long-term movement as a percentage of total net migration gain, 1983–2003 . . . . . . . . . . . . . . . . . . . . . . . . . . . . . . . . . . 21
Figure 10: Temporary migration to Australia by category, 1986 to 2003 . . . . . . . . . . . . 22
Figure 11: Australia: onshore residence visa grants, 1989–90 to 2002–03 . . . . . . . . . . 29
Figure 12: Australia: unauthorised arrivals, 1989-90 to 2002-03. . . . . . . . . . . . . . . . . . 31
Figure 13: Categories of immigration to Australia, 2002–03 . . . . . . . . . . . . . . . . . . . . 41
Figure 14: Australia: migration program outcomes by stream . . . . . . . . . . . . . . . . . . . 42
Figure 15: All overseas students in South Australia as a percentage of all overseas students in Australia, 1994–2003 . . . . . . . . . . . . . . . . . . . . . . . . . . . . . . . . . 55
Figure 16: Permanent departures of Australia-born and overseas-born persons from Australia, 1959–60 to 2002–03 . . . . . . . . . . . . . . . . . . . . . . . . . . . . . . . . . . 62
Figure 17: Australian resident long-term departures from Australia, 1959–60 to 2002–03. . . . . . . . . . . . . . . . . . . . . . . . . . . . . . . . . . . . . . . . . . . . . . . . . . . 63
Figure 18: Australian citizens living abroad, 31 December 2001 . . . . . . . . . . . . . . . . . 68


A new paradigm of international migration: implications for migration policy and planning in Australia
Executive summary The last decade has seen a major increase in both the scale and complexity of international population movements. The proportion of the global population for whom international movement is part of their calculus of choice as they examine their life chances has increased massively. The constellation of forces driving movement between countries is different and the context in which migration is occurring has been transformed in both origin and destination countries. A half century ago relatively few countries were influenced in a major way by international migration. Now a majority of the world’s nations are so affected. Australia was one of a handful of traditional migration countries (along with the US, Canada and New Zealand), which drew the bulk of their immigrants from Europe. Overwhelmingly the main type of international population movement was of more or less permanent migration involving settlement in the destination country.
This paper argues that in the contemporary situation the drivers of international migration have changed and as a result the international population movement influencing Australia has changed dramatically. Yet much Australian thinking and study of international migration remains anchored in a paradigm of migration which applied in the first four post-war decades. Policy making and research into international migration in Australia needs to be undertaken in such a way as to take account of the shifts which have occurred in the drivers of international migration and in the types of international movement affecting Australia.
Perhaps the greatest change which has occurred in Australian immigration in the last decade is that whereas in the first five post-war decades Australia emphatically eschewed acceptance of temporary workers in favour of an overwhelming emphasis on settlement migration there has been a reversal with a number of new visa categories designed to attract temporary residents to work in Australia (especially the temporary business and student visa categories). As a result there has been an exponential increase in non permanent migration to Australia so that while in 2001–2002 there were 88 900 incoming permanent settlers to Australia there were a total of 340 200 foreigners granted temporary residence in Australia in that year. On 30 June 2001 there were 554 200 people in Australia on a temporary basis of whom 289 300 had the right to work. These people differ in many important ways from permanent settlers but the bulk of our research and knowledge relates to the impact of the permanent settlers. The much larger numbers of temporary residents are also having significant effects on labour and housing markets as well as other areas of Australian society.
However, settler migration to Australia has also undergone profound change in the last decade or so. There has been a substantial reduction in the proportion of our migrants drawn from traditional sources of the UK and Europe while the numbers from Asia, Oceania and Africa have increased. Also our model of the immigrant settler being someone, who applies for immigration in a foreign country, is processed and then some time later arrives in the country needs modification. Three out of every 10 ‘settlers’ to Australia are ‘onshore’ immigrants in that they are already in Australia under a temporary residence visa and seek to transfer to permanent residence. There has been a substantial
1

A new paradigm of international migration: implications for migration policy and planning in Australia
shift in the balance of the settlement program away from family and humanitarian to skill selected immigrants. Accordingly the labour market performance of recent migrants has improved substantially while in the United States and Canada it has declined. There has also been a substantial increase in governmental efforts to influence where new immigrants settle in Australia. There has been a raft of State Specific and Regional Migration Schemes introduced in an attempt to reduce the proportion of immigrants being attracted to Sydney, and, to a lesser extent, some other major urban centres.
There is a tendency for Australia to be thought of purely as an ‘immigration country’. Yet it has a substantial outflow of emigrants which has increased in recent years with the internationalisation of labour markets and other globalisation effects. It is estimated that there are around one million Australians living on a permanent or long term basis overseas. In relation to the resident population this is one of the world’s major diasporas. The emigration of Australian residents is highly selective of young, highly educated, skilled and high income groups and has led to discussions of brain drain. Undoubtedly however, there is a ‘brain gain’ since skilled immigrants outnumber their emigrant counterparts yet suspicions remain that we may be losing the ‘brightest and best’ among our young people. The setting up a senate Inquiry into Australian Expatriates indicates the significance which is now being given to Australians overseas. It is argued that Australia needs to develop a policy toward its skilled workforce which includes four elements—recruitment, retention, return and re-engagement. A diaspora policy is an important part of that. It should seek to include the diaspora more on a cultural level; it is important that expatriates who still consider themselves Australian are included more in the mainstream of Australian life. On an economic level, there are a myriad of ways in which the expertise, experience and contacts of the diaspora can be harnessed to benefit Australia in a rapidly globalising economy. We must realize that there is much to gain from young Australians leaving Australia and acquiring experience, knowledge and connections in foreign nations. However, if a substantial proportion can return, the country can gain a double dividend—not just retaining their talents but having those talents enhanced by the period away. Perhaps we should be working toward policies which facilitate ‘brain circulation’ as opposed to attempting to stem ‘brain drain’.
There is no doubt that the last few years have seen a transformation of the scale, characteristics and significance of international population movements. This demands a continuous reassessment of Australia’s immigration policy and program as well as a full assessment of the global situation impinging on population movements to and from Australia. Australia can no longer confine its consideration of immigration to what is happening in Australia. The globalisation of capital, the transformation of international travel and communications systems, the instant worldwide distribution of information, the increasing levels of education, the internationalisation of many labour markets and the creation of political and environmental refugees, are among only a few of the processes and trends which are producing an exponential increase in all forms of international population movements and opening up such movement to a much broader spectrum of the world’s population. No nation can isolate itself from the global system of which population movement is an important part. These changes not only have important
2

A new paradigm of international migration: implications for migration policy and planning in Australia
implications for people wishing to come to Australia, but also for Australian residents wishing to move elsewhere.
All of the world’s nations are facing challenges associated with the new global regime of international migration in what has been termed the ‘Age of Migration’. However, few are as well positioned to meet those challenges as Australia. The long experience as a ‘country of immigration’, especially during the post-Second World War era, has given Australia an almost unique capacity not only to cope with new migration pressures but also to develop policy and program approaches which maximise the benefit of those developments. Australia has developed a culture of migration in which there is broad acceptance in the community of the benefits that immigration can deliver. This contrasts sharply with community attitudes in many nations. Moreover, Australian politicians have developed a more sophisticated understanding of the issues surrounding migration and settlement than in most other nations so that the capacity to formulate, develop, introduce and operate sound and effective policy is considerable. Finally, it is often overlooked that Australia is one of very few nations that has had a federal government department devoted to immigration and settlement for more than half a century. This has meant that there has been the development of a skilled and committed cadre of ‘immigration bureaucrats’ over a number of generations. This substantial body of people with a level of professionalism, knowledge and experience gives Australia a huge advantage in confronting the challenges created by the New Migration. The need for ‘Management of Migration’ has become the mantra emerging from international fora, conferences, summits and meetings concerned with international migration. However, an essential element in any migration management is the availability of human resources, institutions and infrastructure to develop and operate effective management strategies and Australia is extremely well positioned in that respect.
Introduction The last decade has seen a major increase in both the scale and complexity of international population movements.1 The proportion of the global population for whom international movement is part of their calculus of choice as they examine their life chances has increased massively. The constellation of forces driving movement between countries is different and the context in which migration is occurring has been transformed in both origin and destination countries. A half century ago relatively few countries were influenced in a major way by international migration. Now a majority of the world’s nations are so affected. Australia was one of a handful of traditional migration countries (along with the US, Canada and New Zealand), which drew the bulk of their immigrants from Europe. Overwhelmingly the main type of international population movement was of more or less permanent migration involving settlement in the destination country.
The present paper argues that in the contemporary situation, the drivers of international migration have changed and as a result the international population movement influencing Australia has changed dramatically. Yet much Australian thinking and study of international migration remains anchored in a paradigm of migration which applied in the first four post-war decades. Policy making and research into international migration in
3

A new paradigm of international migration: implications for migration policy and planning in Australia
Australia needs to be undertaken in such a way as to take account of the shifts which have occurred in the drivers of international migration and in the types of international movement affecting Australia. This paper attempts first to briefly consider the main dimensions of the ‘new’ global international migration and then considers the shifts which are occurring in Australia’s international migration patterns. It concludes with a consideration of some of the implications for future policy development and research to inform that policy.
The ‘new’ international migration International migration has increased in scale and complexity as both a causal factor and effect of globalisation. For half of the post-war era, global international migration has been dominated by movement from Europe to the ‘traditional’ migration countries of Australia, Canada, the United States and New Zealand. However almost all nations of the world are now influenced significantly by migration and non-Organisation for Economic Co-operation and Development (OECD) nations have become the dominant sources of migrants. One way in which the significance of the changes can best be demonstrated is by examining Table 1, which shows the numbers moving permanently between Australia and the United Kingdom since 1991. Australia has experienced a significant net gain of immigrant settlers from the UK for more than two centuries. Yet Table 1 indicates that while in the early 1990s, there were significantly more people moving permanently from the UK to Australia the net flow was reversed in 2001 and 2002. There was a net gain in 2003 but there may have been a new method adopted by the Department of Immigration, Multicultural and Indigenous Affairs (DIMIA) to make estimations.
Table 1: Australia: permanent migration to and from the United Kingdom Year From To Net 1991 20 867 6332 14535 1992 14465 6251 8214 1993 9484 5392 4092 1994 8661 4815 3846 1995 10 238 4835 5403 1996 10 520 5228 5292 1997 9001 5773 3228 1998 8424 6561 1863 1999 7211 6789 422 2000 7561 7466 95 2001 7027 7854 -827 2002 7525 8273 -748 2003 11 842 8408 3434 Source: DIMIA, Immigration update and Australian Bureau of Statistics (ABS) Migration
Australia, various issues.
This reflects a number of developments:
• Europe has been transformed from being the major global source of international migrants for much of the twentieth century to being a major destination for migrants
4

A new paradigm of international migration: implications for migration policy and planning in Australia
• London as one of the world’s global cities is now drawing people from all over the world due to its key role in the globalisation process2
• much of the contemporary flow from the UK is of people who come to Australia and seek temporary residence rather than permanent residence as working holiday makers, temporary business migrants and job transfers. Of course there is also a significant non-permanent flow from Australia to the UK.
Australia continues to be an important global player in migration but it is within quite a different context.
Figure 1 shows that in terms of total stock of migrants, Australia ranks ninth in the world. Other major destinations include the traditional migration countries, several European nations, areas of refugees’ settlement and Middle Eastern countries receiving large numbers of guest workers. Figure 2 indicates that Australia ranks similarly in the percentage that migrants make up of the total resident population in those destination countries.
Figure 1: Countries with the largest international migrant stock, 2000
Source: United Nations, International migration 2002, United Nations, New York, 2002.
5

A new paradigm of international migration: implications for migration policy and planning in Australia
Figure 2: Countries with the highest percentage of international migrant stock, 2000 (countries with population of one million or more inhabitants)
Source: United Nations, International migration 2002, United Nations, New York, 2002.
Whereas the dominant global flow in the early post-war decades was from Europe to the ‘traditional’ migration countries it now is from less developed to more developed nations, the so called south-north movement. In all more developed countries in 2000, 40 per cent of net population growth was due to net immigration from less developed countries (LDCs).3 Table 2, for example, indicates the estimated Asian-born population in a number of OECD nations.
6

A new paradigm of international migration: implications for migration policy and planning in Australia
Table 2: Traditional migration countries: Asian populations around 2001 Europe/Japan Australia US Canada New Zealand Total 2000 2001 2001 1996 2001
Afghanistan 29 465 11 296 39 000 11 815 735 92 311Bangladesh 91 701 9078 104 000 12 405 1185 218 369Brunei 216 2068 na 4310 na 6594Burma 187 10 973 22 000 3125 513* 36 798Cambodia 48 879 22 979 92 000 19 505 4770 188 133China 480 060 142 780 947 000 238 485 38 949 1 847 274Hong Kong 10 720 67 124 223 000 249 175 11 301 561 320India 248 800**** 95 452 1 024 000 240 560 20 889 1 629 701Indonesia 185 300*** 47 158 72 000 9340 3792 317 590Japan 9983 25 469 334 000 24 300 8622 402 374Korea, Republic of 653 906 38 902 826 000 52 170 17 934 1 588 912Laos 32 293 9565 117 000 14 905 1017 174780Macao 84 1948 na 7110 na 9142Malaysia 35 300**** 78 858 39 000 20 930 11 460 185 548Mongolia 136 126 na 20 na 282Nepal 335 2628 na 540 na 3 503Pakistan 932 568** 11 917 241 000 41 085 1317 1 227 887Philippines 237 761 103 942 1 273 000 190 395 10 137 1 815 235 Singapore 2,574 33485 23 000 8580 3912 71 551 Sri Lanka 167 000 53 460 na 72 355 6168 298 983 Taiwan 1916 22 418 246 000 52 480 12 486 335 300 Thailand 82 100**** 23 602 142 000 8085 5154 260 941 Vietnam 180 100**** 15 4833 758 000 141 080 3948 1 237 961 Other Asia na 12458 491 000 55 120 1485 560 036 Total Asia 3 431 384 982 519 7 013 000 1 477 875 165 774 13 070 552
* 1996 ** 1997 *** 1998 **** 1999 Source: ABS 2001 Census; US Census Bureau Current Population Survey 2001; New Zealand
2001 Census; Statistics Canada 1996 Census; OECD, Trends in international migration, 1999, 2000, 2001 and 2002.
The increased south-north mobility has taken a distinctive bifurcated form:
(a) barriers have been greatly reduced to the flow of the highly skilled between nations which has facilitated the permanent and temporary movement of skilled and wealthy persons, especially that from south to north countries, and
(b) barriers have been increasingly created against the flows of people who do not have high levels of education or wealth. Hence, while there is a flow of such people in the family and refugee-humanitarian components of migration from south to north countries, the flow is greatly constrained.
7

A new paradigm of international migration: implications for migration policy and planning in Australia
An important element in the south-north flow has been the increasing numbers of foreign students. Australia is one of the world’s major destinations of these students and in proportion to its native university students, Australia has the highest ratio of foreign students of any nation.
Figure 3 shows the growth of overseas students in Australian universities over the last two decades. It will be noted that the great majority are from Asian countries.
Figure 3: Overseas students in Australian universities, 1983–2001
0
20000
40000
60000
80000
100000
120000
1983
1985
1987
1989
1991
1993
1995
1997
1999
2001
Year
Num
ber
Overseas Students fromSouthern and Central AsiaOverseas Students fromNortheast AsiaOverseas Students fromSoutheast AsiaOther Overseas Students
Total Overseas Students
Source: Department of Education, Training and Youth Affairs (DETYA) Selected higher
education student statistics, various issues
The expansion of south-north migration has re-ignited debates about brain drain with increased flow of skilled migrants from less developed to more developed economies.4 There have been suggestions from commentators that destination countries accepting such migrants compensate origin countries for the costs incurred in educating and bringing up migrants. However, in the last few years, while there has been recognition of the negative effects of ‘brain drain’, it has been shown that emigration can have positive developmental implications for origin nations. This results from remittance flows from expatriate communities, economic linkages developed between origin and destination countries and return migration.5 The developmental implications of south-north migration are far from simple and are not well understood.
8

A new paradigm of international migration: implications for migration policy and planning in Australia
Other important developments in global migration include the increasing flows between non OECD nations. These are not predominantly skilled migrants but involve, particularly, an increased flow of temporary contract workers and refugees are also significant especially in Africa. In addition, there has been an expansion in the level of undocumented migration and of trafficking, especially of women and children. This undocumented migration (as well as the legal movement) is greatly facilitated by the massive growth of the global immigration industry. This involves a complex web of migration agents, travel providers, immigration officials, police, recruiters, and job placement agencies who facilitate international movement. Part of this industry is illegal and in some areas has been penetrated by large criminal syndicates such as the mafia, yazuka (Japan) and Chinese ‘snakeheads’. It is now one of the most profitable and pervasive forms of international crime.
A distinctive feature of the ‘new’ migration is the greatly increased involvement of women in international movement.
The elements driving the new patterns and levels of international migration are complex but some are briefly summarized below:
• the internationalisation of labour markets which has meant that many people now have knowledge of, and compete for, jobs in many countries
• the increasing demographic gradient between nations which has meant many developed economies (which have experienced low fertility over a long period) where local workforces are not growing or declining have labour shortages; while in less developed nations (where workforces are rapidly growing), labour surpluses are large
• widening gaps in economic well-being between less developed and more developed nations
• globalisation of media, which increases peoples’ information about other places
• universalisation of education in most countries
• reduction of time and travel costs between countries
• activities of transnational organisations especially companies with operations in many nations
• labour market segmentation, which has seen people in higher income countries eschewing low status, low income jobs which open up niches for migrants
• the proliferation of the international migration industry
• the increased involvement of national governments in origin countries realising the benefits that can accrue through migration
9

A new paradigm of international migration: implications for migration policy and planning in Australia
• the massive growth of social networks which facilitate the migration of family and friends by providing information about migration and help new migrants once they arrive at destinations.
All this has meant that international migration has become within the calculus of choice of a major part of the world’s population when they consider their life chances. The proliferation of migration networks and the migration industry have meant that international movement is being brought within reach of more and more of the world’s population. In addition to, and partly in response to, these global developments there have been a number of major shifts in Australian immigration policy and the impact has been a veritable sea change in the nature of Australian international migration. Before examining these shifts, it is necessary to make a few comments about the data sources employed.
The shift in Australia’s international migration regime must be seen in the context of a massive shift in global international population movement levels and patterns and the processes shaping them.6 Globalisation has seen an exponential increase in flows of goods, ideas, information, money and people between nations. However, while developed nations like Australia have sought to maximize the first four of these types of flows, most have sought to restrict the in-movement of people, especially those from ‘south’ nations. Nevertheless, there is considerable evidence that international population movement is inextricably linked to the other flows which constitute globalisation.7 Moreover, the full implications of contemporary global political, social and economic change for evolving levels and patterns of international migration are yet to be established.
Some data considerations One of the outcomes of Australia’s long history of substantial international migration is that the data sources regarding both stocks and flows of the movement are of high quality by international standards. Firstly, regarding flows, the main source employed here is the Movements Data Base (MDB) maintained by DIMIA. Each person entering or leaving Australia is required to complete arrival or departure cards containing questions on citizenship, birthplace, birth date, gender, occupation, marital status, type of movement, origin/destination, reason (for short-term movers only) and address in Australia. This information forms the basis of the MDB which is one of the few in the world to contain comprehensive information on both immigrants and emigrants. People leaving or coming in to Australia are classified into three types of categories according to their intended length of their stay in Australia or overseas:
• Permanent Movements
– Immigrants are persons arriving with the intention of settling permanently in Australia.
– Emigrants are Australian residents (including former settlers) departing with the stated intention of staying abroad permanently.8
• Long-Term Movements
10

A new paradigm of international migration: implications for migration policy and planning in Australia
– Overseas arrivals of visitors with the intended or actual length of stay in Australia of 12 months or more.
– Departures of Australian residents with intended or actual length of stay abroad of 12 months or more.
• Short-Term Movements
– Travellers whose intended or actual stay in Australia or abroad is less than 12 months.
Clearly there are some problems associated with the use of ‘intentions’ as the key element in the definitions of type of movement for the MDB. It is apparent that there are no guarantees that intentions will become reality and as a result there is a significant amount of category jumping which occurs.9 Zlotnik has also been critical of the concept of residence used in these definitions as a ‘fertile breeding ground for confusion’.10 Nevertheless the MDB provides useful and comprehensive information on flows of people into and out of Australia which has few equals globally.
Turning to sources of information about the stocks of migrants, the quinquennial national censuses of population and housing are utilised. Table 3 shows the immigration-related questions asked at Australian censuses and indicates that a comprehensive range of questions has been asked, especially in post-war censuses. Of particular interest was the introduction from 1971 of a birthplace of parents question which has been in each subsequent census and the experiment with an ancestry question in 1986 and 2001. The latter has been excluded from several censuses because, although it produced a great deal of new insight into the diversity of Australia’s population, it generally failed to identify third and older generations of immigrants.11 Censuses have been conducted in Australia each five years since 1961 and have a low rate of under-enumeration (less than 2 per cent). The census allows us to identify the first generation migrants and their Australia-born children and a number of their characteristics with a high degree of accuracy. However, the census does not provide information on former residents who have emigrated out of Australia. With respect to persons travelling out of Australia on a temporary basis, some information is obtainable if those persons left households behind who could report their absence in a question on the census schedule relating to usual residents who are absent on the night of the census. Visitors to Australia who happen to be in the nation on the night of the census are counted in the de facto enumeration but excluded from most data on birthplace.
11

A new paradigm of international migration: implications for migration policy and planning in Australia
Table 3: Immigration and ethnicity related topics included in Australian Population Censuses, 1911–2001
Topics – Persons 1911 1921 1933 1947 1954 1961 1966 1971 1976 1981 1986 1991 1996 2001
Birthplace * * * * * * * * * * * * * *
Birthplace of parents * * * * * * * *
Year of arrival * * * * * * * * * * * * * *
(Period of residence in Australia)
Citizenship * * * * * * * * *(1) *(1) *(2) * * *
Aboriginal/TSI origin * * * * * * *(3) *(4) *(4) * * * * *
(Race)
Ethnic origin *(5) *
Number of overseas residents or visitors * * * * * * *
Language use *(6) *(7) *(8) *(9) *(10) * * *
Religion * * * * * * * * * * * * * *
Source: J Paice, ‘The 1990s—is the Australian Census of Population and Housing revelant?’; ABS, How Australia takes a census.
Notes: (1) Prior to 1976, ‘nationality’ rather than ‘citizenship’ was asked. (2) Since 1986 the person has been asked whether or not they were an Australian citizen. (3) In all censuses prior to 1971 respondents were required to state their race and, where race was mixed,
to specify the proportion of each. (4) In the 1971 and 1976 censuses a question with response categories of European, Aboriginal, Torres
Strait Islander and other was included. (5) A question on each person’s ancestry was asked for the first time in 1986. (6) Question asked whether the person could read and write. (7) Question asked whether the person could read and write a foreign language if unable to read and write
English. (8) The 1976 census asked for ‘all languages regularly used’. (9) In 1981 ability to speak English was asked. (10) Since 1986 two separate questions have been asked – Language used and ability to speak English.
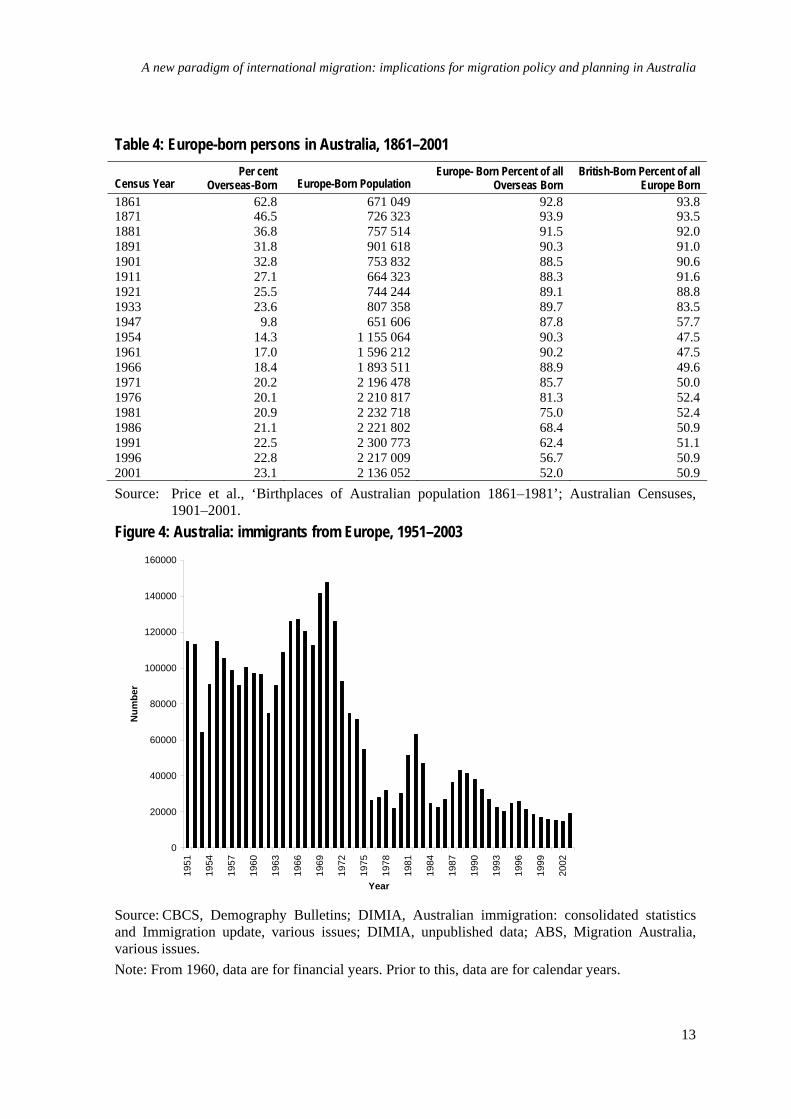
Changes in the origin of settlers to Australia Table 4 demonstrates that for the bulk of Australia’s post European settlement history, immigration has been dominated by Europeans, especially people from the United Kingdom and Ireland. In the early post-war years European migration reached its peak both in numerical and proportional terms (Figure 4 and Figure 5).
12
A new paradigm of international migration: implications for migration policy and planning in Australia
Table 4: Europe-born persons in Australia, 1861–2001
Census Year Per cent
Overseas-Born Europe-Born Population Europe- Born Percent of all
Overseas Born British-Born Percent of all
Europe Born 1861 62.8 671 049 92.8 93.81871 46.5 726 323 93.9 93.51881 36.8 757 514 91.5 92.01891 31.8 901 618 90.3 91.01901 32.8 753 832 88.5 90.61911 27.1 664 323 88.3 91.61921 25.5 744 244 89.1 88.81933 23.6 807 358 89.7 83.51947 9.8 651 606 87.8 57.71954 14.3 1 155 064 90.3 47.51961 17.0 1 596 212 90.2 47.51966 18.4 1 893 511 88.9 49.61971 20.2 2 196 478 85.7 50.01976 20.1 2 210 817 81.3 52.41981 20.9 2 232 718 75.0 52.41986 21.1 2 221 802 68.4 50.91991 22.5 2 300 773 62.4 51.11996 22.8 2 217 009 56.7 50.92001 23.1 2 136 052 52.0 50.9Source: Price et al., ‘Birthplaces of Australian population 1861–1981’; Australian Censuses,
1901–2001. Figure 4: Australia: immigrants from Europe, 1951–2003
0
20000
40000
60000
80000
100000
120000
140000
160000
1951
1954
1957
1960
1963
1966
1969
1972
1975
1978
1981
1984
1987
1990
1993
1996
1999
2002
Year
Num
ber
Source: CBCS, Demography Bulletins; DIMIA, Australian immigration: consolidated statistics and Immigration update, various issues; DIMIA, unpublished data; ABS, Migration Australia, various issues. Note: From 1960, data are for financial years. Prior to this, data are for calendar years.
13

A new paradigm of international migration: implications for migration policy and planning in Australia
Figure 5: Immigrants from Europe as a percentage of total immigrants, 1951–2003
0
10
20
30
40
50
60
70
80
90
100
1951
1954
1957
1960
1963
1966
1969
1972
1975
1978
1981
1984
1987
1990
1993
1996
1999
2002
Year
Per c
ent
Source: CBCS, Demography Bulletins; DIMIA, Australian immigration: consolidated statistics and Immigration update, various issues; DIMIA, unpublished data; ABS, Migration Australia, various issues.
Note: From 1960, data are for financial years. Prior to this, data are for calendar years.
There was a slowing down in the growth of the Australian European population in 1971 as the pressures to migrate out of many European countries diminished. At the same time the gradual dismantling of the White Australia Policy saw a considerable widening of the countries from which Australia drew settlers. Figure 6 shows how after 1970 the intake has increasingly been drawn from Asia, New Zealand and the Pacific, and to a lesser extent the Americas and Africa.
14

A new paradigm of international migration: implications for migration policy and planning in Australia
Figure 6: Australia: settler arrivals by region of last residence, 1947–2003
0
50000
100000
150000
200000
250000
300000*1
945-
47
1949
-50
1952
-53
1955
-56
1958
-59
1961
-62
1964
-65
1967
-68
1970
-71
1973
-74
1976
-77
1979
-80
1982
-83
1985
-86
1988
-89
1991
-92
1994
-95
1997
-98
2000
-01
Year
Num
ber
UK and Ireland Other Europe Africa Americas NZ and Pacific Middle East Asia
* Oct 1945–June 1947 Source: DIMIA, Australian immigration: consolidated statistics and Immigration update various
issues; DIMIA unpublished data.
The demographic impact of post-war immigration in Australia has been considerable. Rebecca Kippen and Peter McDonald of the Australian National University estimated that between the Second World War and 2000 immigration was responsible for adding 7 million to the population and that if post-war net immigration was zero the national population would be 12 million instead of over 19 million.12 However, more important than this numerical impact have been the social, cultural and economic transformations in which immigration has played a role. A major element in this has been the transformation of Australia from an overwhelmingly British dominated population to a multicultural society. Table 5 indicates this, showing that the proportion of the national population born in dominantly English speaking nations declined from 98.1 to 86 per cent between 1947 and 2001, while that born in Asian countries increased from 0.3 to 6.5 per cent. The shift which has occurred is evident in the rates of growth of various foreign-born groups.
15

A new paradigm of international migration: implications for migration policy and planning in Australia
Table 5: Change in the composition of the Australian population by place of birth, 1947 and 2001 1947 2001 Number of Persons Per cent Number of Persons Per cent English speaking origin 7 438 892 98.1 15 232 338 86.0
Australia 6 835 171 90.2 13 629 685 76.9 United Kingdom and Ireland 543 829 7.2 1 086 480 6.1 New Zealand 43 619 0.6 355 765 2.0 United States and Canada 10 304 0.1 80 983 0.5 South Africa 5969 0.1 79 425 0.4
Non-English speaking origin 140 466 1.9 2 485 110 14.0 Other Europe 109 586 1.4 1 046 967 5.9 Asia* 23 293 0.3 1 151 438 6.5 Other Africa 1531 0.0 104 811 0.6 Other America 1323 0.0 79 821 0.5 Other Oceania 4733 0.1 99 361 0.6
Total 7 579 358 100.0 17 717 448 100.0
Includes Middle East Source: ABS, 1947 and 2001 Censuses.
Table 6 shows that the Russian Federation was the only European group among the 10 fastest growing birthplace groups in the nation in the 1990s expanding at 6 per cent per annum. It will be noted that virtually all of the 10 fastest growing countries are ‘south’ nations, mainly from Asia. On the other hand, the slowest growing (indeed decreasing) birthplace groups were all European.
16

A new paradigm of international migration: implications for migration policy and planning in Australia
Table 6: Australia: fastest and slowest growing groups of foreign-born persons, 1991–2001*
Country of Origin Number of Persons 2001 Per cent Growth per Annum 1991–2001 Fastest growing groups:
Iraq 24 832 16.9 Afghanistan 11 297 15.3 Samoa 13 254 8.7 Pakistan 11 917 7.2 Korea, Republic of 38 902 6.4 China 142 781 6.1 Russian Federation 15 020 6.0 Taiwan 22 418 5.6 Thailand 23 599 5.3 South Africa 79 425 4.9 India 95 455 4.5
Slowest growing groups: Germany 108 220 -0.6 Cyprus 19 482 -1.3 Austria 19 313 -1.3 Malta 46 998 -1.3 Netherlands 83 325 -1.4 Spain 12 662 -1.5 Italy 218 718 -1.5 Portugal 15 441 -1.5 Greece 116 430 -1.6 Poland 58 113 -1.7 Hungary 22 752 -1.8
Countries with 10 000 or more persons in 2001.
Source: ABS, 1991 and 2001 Censuses.
Increased temporary migration Perhaps the greatest change which has occurred in Australian immigration in the last decade is that whereas in the first five post-war decades Australia emphatically eschewed acceptance of temporary workers in favour of an overwhelming emphasis on settlement migration, there has been a reversal with a number of new visa categories designed to attract temporary residents to for work, business and study purposes.13 As a result there has been an exponential increase in non permanent migration to Australia so that while in 2001–2002 there were 88 900 incoming permanent settlers to Australia there were a total of 340 200 foreigners granted temporary residence in Australia in that year.14 On 30 June 2001 there were 554 200 people in Australia on a temporary basis of whom 289 300 had the right to work. Although there has been a long history of significant non-permanent flows to Australia the contemporary flow is quite different in scale, in the involvement of large numbers of temporary residents with the right to work and in a plethora of new kinds of temporary migration to Australia.15 As Boyle16 points out: ‘It is the high intensity of exchanges and the new modes of contact that makes this an exciting new research arena’.
A key point here is that Australian knowledge of immigration remains largely focused on permanent settlement.17 There has been some consideration of flows of temporary workers such as students, working holiday makers as well as skilled workers.18
17

A new paradigm of international migration: implications for migration policy and planning in Australia
Nevertheless, these studies concentrate mainly on policy issues and there remains little analysis of the characteristics of temporary migrants and how they compare with settlers and the non-migrant population. Further, there is little in the way of an assessment of the effects of this large scale movement on housing and labour markets in Australia or on regional demographic change.
The exponential increase in non-permanent migration has not been confined to Australia. In the United States, for example, there were 4.6 million immigrants admitted between 1995 and 2000 while 142.8 million non-migrants were admitted, of whom 2.2 million were temporary workers, 2.8 million students and 3.6 million others with the right to work.19 Indeed in the international literature there have been calls for replacing the concept of ‘international migration’ which implies permanent settlement, with the term transnational migration. As Glick Schiller et al. point out:
… several generations of researchers have viewed immigrants as persons who uproot themselves, leave behind home and country, and face the painful process of incorporation into a different society and culture … A new concept of transnational migration is emerging, however, that questions this long-held conceptualisation of immigrants, suggesting that in both the US and Europe increasing numbers of migrants are best understood as ‘transmigrants’.20
The new concept of transnational migration emphasises the two-way and circular nature of many flows between countries.21 However, as in Australia these temporary movements to more developed economies have attracted little research attention compared with permanent settlement. A partial exception is the transfer of highly skilled managerial and professional workers.22 Nevertheless, careful studies of the nature, causes and impact of temporary movement compared with settlement are lacking especially in Australia. Despite this, policy makers in Australia and other more developed contexts are developing policies to encourage skilled temporary immigration.23
The shifts in the balance between permanent and temporary immigration of skilled workers to More Developed Countries, together with a more general transformation in the global context of international migration, have greatly reduced the contemporary relevance of much existing research on Australian international migration. This presents a substantial challenge to researchers and policy makers alike.
This transformation can be seen in Table 7 which shows that over the last two decades there has been an increase in non-permanent movement. Firstly, regarding short-term movement, it is clear that there has been an acceleration in both foreigners visiting Australia and Australians going overseas on a short-term basis. Figure 7 shows there has been a consistent increase in the number of overseas visitors until 1997–98 when the onset of the crisis in Asia saw a downturn in tourists and business travellers from countries such as South Korea and Indonesia which were hit hardest by the crisis. There was also a flattening off in 2001–02 reflecting the downturn in international travel following the 11th September events and the impact of Severe Acute Respiratory Syndrome (SARS). It will be noted that while the number of overseas visitors to Australia more than quadrupled over the period following 1982–83, the short-term movement of Australians overseas only
18

A new paradigm of international migration: implications for migration policy and planning in Australia
increased by 153 per cent. Nevertheless, it is clear that short-term visiting has greatly increased and this represents much more than an expansion of global tourism. It also represents a new global regime in which many people work for considerable periods in more than a single country.
Table 7: Growth of population movement into and out of Australia, 1982–83 to 2002–03
1982–83 2002–03 Percent Growth 1982–2003
Arrivals Permanent 83 010 93 914 13.1 Long-term - residents 48 990 95 784 95.5 - visitors 30 740 184 095 498.9 - total 79 730 279 879 251.0 Short-term - residents 1 240 800 3 309 851 166.8 - visitors 930 400 4 655 802 400.4 - total 2 171 200 7 965 653 266.9 Departures Permanent 24 830 50 463 103.2 Long-term - residents 47 020 86 211 83.3 - visitors 25 440 82 894 225.8 - total 72 460 169 105 133.4 Short-term - residents 1 259 100 3 293 336 161.6 - visitors 907 500 4 714 636 419.5 - total 2 166 600 8 007 972 269.6 Source: Bureau of Immigration and Population Research, Immigration update, June Quarter
1992; DIMIA, unpublished data.
Figure 7: Australia: short-term movements, 1970–71 to 2001–03
0
1000000
2000000
3000000
4000000
5000000
6000000
1970
-71
1972
-73
1974
-75
1976
-77
1978
-79
1980
-81
1982
-83
1984
-85
1986
-87
1988
-89
1990
-91
1992
-93
1994
-95
1996
-97
1998
-99
2000
-01
2002
-03
Year
Num
ber
Visitors Arriving Residents Departing Source: DIMIA, Australian immigration: consolidated statistics and Immigration update, various
issues; DIMIA, unpublished data.
19

A new paradigm of international migration: implications for migration policy and planning in Australia
However it is not only in short-term movement that there have been substantial changes. As indicated earlier, Australia has long had an emphasis on attracting permanent settlers to the country and a strongly expressed opposition to attracting temporary and contract workers. During the labour shortage years of the 1950s and 1960s, Australia’s migration solution to the problem contrasted sharply with that of European nations like Germany and France when it opted to concentrate on attracting permanent migrants to meet worker shortages rather than contract workers. However, in recent years attitudes have changed in Australia and it has been recognised that in the context of globalised labour markets it is essential to have mechanisms to allow non-permanent entry of workers in certain groups. Nevertheless, this form of entry has not been extended to unskilled and low-skilled areas and has been only open to people with particular skills and entrepreneurs. Hence there has been an increase in people coming to Australia as short-term or long-term entrants and being able to work here. There has been increasing pressure from some groups to include some unskilled workers to enter the country temporarily to meet labour shortages in some areas. The most notable example of this is in the area of harvest labour, especially in fruit, vegetables and vines where significant seasonal labour shortages have occurred in recent years.24 Nevertheless, the Government has not responded positively to these suggestions.
Figure 8: Australia: long-term arrivals and departures, 1959–60 to 2002–03
0
20000
40000
60000
80000
100000
120000
140000
160000
180000
200000
1959
-60
1961
-62
1963
-64
1965
-66
1967
-68
1969
-70
1971
-72
1973
-74
1975
-76
1977
-78
1979
-80
1981
-82
1983
-84
1985
-86
1987
-88
1989
-90
1991
-92
1993
-94
1995
-96
1997
-98
1999
-200
0
2001
-02
Year
Num
ber
Australian Residents Returning Overseas Visitors ArrivingAustralian Residents Departing Overseas Visitors Departing
Source: DIMIA, Australian immigration: consolidated statistics and Immigration update, various
issues; DIMIA, unpublished data.
The significance of people coming to work in Australia temporarily is especially evident in the increase in long-term arrivals to Australia shown in Figure 8. This has had an impact, at least in the short-term, on overall net migration gains in Australia. It will be noted from Figure 9 that an increasing proportion of Australia’s net migration gain in recent years has been from an excess of long-term arrivals over long-term departures and a reducing proportion has been from an excess of settler arrivals over permanent departures.
20

A new paradigm of international migration: implications for migration policy and planning in Australia
Indeed since 1999–2000 the net migration gain from long-term movement exceeded that from permanent movement.
Figure 9: Australia: net permanent and long-term movement as a percentage of total net migration gain, 1983–2003
0
20
40
60
80
100
12019
83
1984
1985
1986
1987
1988
1989
1990
1991
1992
1993
1994
1995
1996
1997
1998
1999
2000
2001
2002
2003
Year
Per
cent
Permanent Movement (%net) Long-term Movement (%net) Source: DIMIA, Immigration Update, various issues and unpublished data.
Figure 10 shows some recent trends in the major forms of temporary migration to Australia. One type of short-term movement of particular significance is the increasing tempo of migration of Asian students.25 Over the 1987 to 2000 period the number of full-fee overseas students in Australia increased from 7131 to 188 277.26 The crisis in Asia had some impact as shown but the numbers of new student visas given off-shore increased by 6 per cent to 67 130 over 1998–99, by 11 per cent to 74 428 in 1999–2000, by 15.5 per cent to over 86 000 in 2000–01, by 13 per cent to 97 560 in 2001–02 and by 12 per cent to 109 610 in 2002–03. The major sources are the USA (10 477 visas) and Asian countries such as the People’s Republic of China (14 215), Korea (7323), Malaysia (8032) and Hong Kong (6576).
Figure 10 also shows that there has been a significant increase in working holiday maker (WHM) temporary migration in recent years. This has been comprehensively reviewed in 1997 by the Australian Parliament Joint Study Committee on Migration.27 WHMs are foreign nationals aged 18–30 from selected countries with which Australia has a reciprocal arrangement, who can work under certain conditions for up to 12 months. Their numbers have increased dramatically and reached 85 200 in 2001–02 and 88 758 in 2002–03, more than doubling in the 1990s. Kinnaird reports that while the economic impact nationally of WHM migration is limited it has significant impacts in specific industries in specific areas.28 While Europeans dominate this category, there are significant numbers from Japan (9711 in 2002–03), Korea (5858) and Hong Kong (130).
21

A new paradigm of international migration: implications for migration policy and planning in Australia
22
Figure 10: Temporary migration to Australia by category, 1986 to 2003
Overseas Students
0
20000
40000
60000
80000
100000
1200007 8 9 0 1 2 3 4 5 6 7 8 9 0 1 2 3
Num
ber
100200300400500600700800900
1000
Num
ber o
f Wor
king
Hol
iday
Vis
asG
rant
ed (o
ff-sh
ore)
5001000
15002000
25003000
3500
Num
ber o
f Tem
pora
ry B
usin
ess
Entr
y Vi
sas
Issu
ed
0
100000
200000
300000
400000
500000
600000
Num
ber o
f Vis
as G
rant
ed/Is
sued
Source: D2
1986
-8
1987
-8
1988
-8
1989
-9
1990
-9
1991
-9
1992
-9
1993
-9
1994
-9
1995
-9
1996
-9
1997
-9
1998
-9
99-2
00
2000
-0
2001
-0
2001
-0
19Year
Working Holiday Makers
000000000000000000000
1986
-87
1987
-88
1988
-89
1989
-90
1990
-91
1991
-92
1992
-93
1993
-94
1994
-95
1995
-96
1996
-97
1997
-98
1998
-99
1999
-200
0
2000
-01
2001
-02
2002
-03
Year
Temporary Business Entrants
0
0000
0000
0000
00
1986
-87
1987
-88
1988
-89
1989
-90
1990
-91
1991
-92
1992
-93
1993
-94
1994
-95
1995
-96
1996
-97
1997
-98
1998
-99
1999
-200
0
2000
-01
2001
-02
2002
-03
Year
Total
1986
-87
1987
-88
1988
-89
1989
-90
1990
-91
1991
-92
1992
-93
1993
-94
1994
-95
1995
-96
1996
-97
1997
-98
1998
-99
999-
2000
2000
-01
2001
-02
2002
-03
IMIA Population flows: immigration aspects, various issues; A Rizvi, SOPEMI 004: Australia.

A new paradigm of international migration: implications for migration policy and planning in Australia
Since 1995 there has been a new visa category in Australia of Temporary Business Migrants. These are five types:
• business visitors who come for short periods and are in the ‘short-term’ arrival category
• temporary business residents who come for longer periods and are usually in the ‘long-term’ arrival category
• independent executives who enter Australia for the purpose of establishing or buying into a business and managing that business
• medical practitioners—qualified general and specialist medical practitioners where there is a demonstrated need for employing practitioners from overseas
• educational—this visa is for qualified people to join educational and research organisations to fill academic teaching and research positions that cannot be filled from within the Australian labour market.
Figure 10 indicates there has been a fall in this category since a peak in 1996–97 and a slight decrease after 2001–02 primarily due to the impact of SARS.29 Among the Business visitors, the USA accounts for 17.4 per cent and the United Kingdom 8.7 per cent and the main Asian groups are from China (19.4 per cent), Japan (6.3 per cent), India (4.8 per cent) and Indonesia (3.5 per cent). The Temporary Business Entry (Long Stay) subclass 457 visa enables highly qualified/skilled persons to enter Australia for up to four years to take up pre-nominated positions with approved Australian sponsor-employers, mostly in professional or management positions.30 The number of visas granted fell by 8.7 per cent from 36 902 in 2000–01 to 33 705 in 2001–02 but increased by 12.2 per cent to 37 859 in 2002–03. Rizvi attributes the fall to the 30.8 per cent drop in the number of Information and Communication Technology (ICT) professionals applying from offshore and the downturn in the Australian ICT industry in 2001–02.31 This was offset by some increase in nomination from other groups. For example, nurses increased by 144 per cent from 1049 to 2563. Rizvi attributes the increase in the last year to the:
… strong demand for skilled workers in the health industry with growth in the number of visas granted to registered nurses experiencing a 54 per cent increase in visa grants in 2002–03 over 2001–02 (1,901 visas in 2002–03 compared to 1,228 visa grants in 2001–02). Registered nurses are the largest single occupation sought by Australian employers. The Information, Communication and Technology (ICT) industry is the largest represented occupational group with 19.3 per cent of the top 50 occupations nominated by Australian employers seeking skilled overseas workers on a temporary basis.32
Rizvi explains that at 30 June 2003, there were 56 344 subclass 457 visa holders in Australia, an increase of 2.4 per cent on the 30 June 2002 figure of 55 001.33 Table 8 shows that Asians are not as predominant in this visa category as among some others, although four of the nine largest nations of origin are Asian (India, Japan, Korea and China).
23

A new paradigm of international migration: implications for migration policy and planning in Australia
Table 8: Temporary business entry visa grants 2001–02 and 2002–03 Country 2001–02 2002–03 % Growth United Kingdom 9662 11 677 20.8India 3078 3670 19.2USA 2642 2846 7.7Japan 2441 2278 -6.7South Africa, Republic of 1892 2210 16.8Irish Republic 1628 1648 1.2Korea, Republic of 1608 1259 -21.8PRC 1117 1165 4.3Canada 1052 1138 8.1Other countries 8653 9968 15.5
Source: A Rizvi, SOPEMI 2004: Australia, p. 7.
As a result of the changed patterns of non permanent migration the number of temporary residents in Australia at any one time make up a significant proportion of the population.
Table 9: Temporary entrants to Australia
Flow 2000–2001
Flow 2001–02
Flow 2002–03
Stock as at
30 June 2001
Stock as at
30 June 2002 Visitors 3 279 549 3 074 384 3 050 492 201 700 184 942 Overseas students 86 277 97 650 109 610 138 200 154 017 Working holiday makers 76 576 85 207 88 758 46 600 48 203 Temporary business visitors 260 957 258 020 254 180 12 600 12 462 Temporary business residents 40 493 33 705 37 859 56 000 55 001 Bridging visa holders(1) - - 63 200 61 431 Social, cultural, international relations program
37 912
35 167 34 252
25 700
26 849
Other 65 476 64 296 11 200 17 273 Total 3 847 240 3 648 429 554 200 560 178
(1) Bridging visas provide lawful status to non-citizens who would otherwise be unlawful.
Source: DIMIA, Population flows: immigration aspects, 2002; A Rizvi, SOPEMI 2004: Australia; DIMIA, Immigration, population and citizenship digest, 2003.
Table 9 presents official (DIMIA) estimates of the number of persons temporarily in Australia in mid-2001 and 2002. This indicates that there were over 200 000 people in Australia temporarily with work rights and a similar number without work rights. This represents a substantial number of people equivalent to 2–3 per cent of the permanently resident workforce. DIMIA estimates that at 30 June 2001 there were 554 200 persons in Australia on temporary visas – 202 500 had been in Australia for less than three months, 193 800 between three and twelve months and 157 800 longer.34 The largest group of the 554 200 were from the UK (93 400), followed by the USA (42 100), China (36 700), Japan (33 200) and Korea (33 100).
24

A new paradigm of international migration: implications for migration policy and planning in Australia
The increased flow of non permanent migrants has created problems for the ABS in calculating Australia’s annual levels of net migration. Since the mid-1980s the ABS has estimated net migration as the balance between permanent and long-term immigration and permanent and long-term emigration. However, a problem in the approach arose through ‘category jumping’ by people who changed their stated length of residence in, or absence from, Australia. The ABS overcame this through indirect estimates of this category jumping. A review of this in 1999 identified a number of problems in the methodology and the ABS announced in 2003, that given the increasing problems of estimating category jumping using this method, it would not estimate it until a new method could be devised.35 McDonald, Khoo and Kippen showed that the failure to take into account category jumping is leading to a systematic over-estimation of net international migration. This is largely because the increasingly large number of long-term temporary migrants to Australia often leave the country on a short-term basis while in Australia (e.g. students returning home during vacations, temporary business migrants on business and holiday trips, etc.).36 These people tend to identify as a long-term entrant on each arrival and as a short-term departure each time they leave on such a trip. This is leading to an over estimation of long-term arrivals. McDonald, Khoo and Kippen have proposed one new approach to estimating category jumping but it is understood the ABS is likely to adopt an alternative approach.37
As a result, there is a degree of uncertainty about current estimates of net migration in Australia. Nevertheless a key dimension of recent net migration gains, however, is that in recent years an increasing proportion of that gain has been derived from an excess of long-term (as opposed to permanent) arrivals over long-term departures such that by 1999–2000 they accounted for over half of the net gains. This is evident in Table 10, which shows that net migration gains by permanent movement were much larger than net gains by long-term movement until the mid-1990s. With the introduction of new temporary business movement categories, not only did the numerical net gains of long-term movers increase but their size relative to net permanent gains also increased until 2000 when for the first time it was larger. In the subsequent years the gap has increased such that in 2002 long-term net gains were twice as large as net permanent gains. This represents a significant departure in Australian immigration and raises a number of issues including the following:
• to what extent is the excess of long-term arrivals over long-term departures for the reasons discussed above? What is clear, however, is that even allowing for these problems, there is still an excess of long-term arrivals over long-term departures and this raises a number of important questions.
• to what extent is the long-term net gain a temporary phenomenon, which will eventually disappear? If all workers arriving under visa categories like temporary business, working holiday, student, etc. eventually leave Australia, one would expect the losses to eventually be more or less equal to the gains.
25

A new paradigm of international migration: implications for migration policy and planning in Australia
Table 10: Components of net overseas migration (‘000), 1983–2003 Permanent Movement Long-Term Movement Year
Ended 30 June Arrivals Departures Net Arrivals Departures Net
Category Jumpersa NOM Permb L-tb
1983 93.0 24.8 68.2 79.7 72.5 7.3 -2.2 73.3 90.4% 9.6% 1984 68.8 24.3 44.5 76.5 74.4 2.0 2.6 49.1 95.6% 4.4% 1985 77.5 20.4 57.1 85.7 74.9 10.9 5.7 73.7 84.0% 16.0% 1986 92.6 18.1 74.5 93.8 74.4 19.4 6.4 100.4 79.3% 20.7% 1987 113.5 19.9 93.6 90.9 75.4 15.5 16.6 125.7 85.8% 14.2% 1988 143.5 20.5 123.0 98.8 78.6 20.2 6.1 149.4 85.9% 14.1% 1989 145.3 21.6 123.7 104.6 91.0 13.6 20.2 157.4 90.1% 9.9% 1990 121.2 27.9 93.4 110.7 100.2 10.5 20.8 124.6 89.9% 10.1% 1991 121.7 31.1 90.6 114.7 110.5 4.2 -8.3 86.4 95.6% 4.4% 1992 107.4 29.1 78.3 126.8 115.2 11.6 -21.3 68.6 87.1% 12.9% 1993 76.3 27.9 48.4 127.4 113.2 14.2 -32.6 30.0 77.3% 22.7% 1994 69.8 27.3 42.5 137.6 112.7 24.9 -20.8 46.5 63.1% 36.9% 1995 87.4 26.9 60.5 151.1 118.5 32.6 -12.9 80.1 65.0% 35.0% 1996 99.1 28.7 70.5 163.6 124.4 39.2 -5.5 104.1 64.3% 35.7% 1997 85.8 29.9 55.9 175.2 136.7 38.5 -7.3 87.1 59.2% 40.8% 1998 77.3 32.0 45.3 188.1 154.3 33.8 7.2 86.4 57.3% 42.7% 1999 84.1 35.2 49.0 187.8 140.3 47.5 -11.0 85.1 50.7% 49.3% 2000 92.3 41.1 51.2 212.8 156.8 56.1 -8.2 99.1 47.7% 52.3% 2001 107.4 46.5 60.9 241.2 166.4 74.8 - 135.7 44.9% 55.1% 2002 88.9 48.2 40.7 264.5 171.4 93.0 23.1 110.6 30.4% 69.6% 2003 93.9 50.5 43.4 279.9 169.1 110.8 -28.9 125.3 28.1%` 71.9% Source: DIMA, Population flows: immigration aspects, 2000, p. 106; ABS, Australian
Demographic Statistics: June Quarter 2003, p. 24. a Category jumping is the net effect of persons whose travel intentions change from short-term to
permanent or long-term, or vice versa.
b The percentage contributions of permanent and long-term movement are based on the net migration totals before adjustment for category jumpers.
• Clearly, there is some leakage across from long-term to permanent settlement. It has been estimated that in 2000–01 about 10 per cent of skilled temporary entrants changed to permanent residence.38 This suggests that there is significant ‘category jumping’ from long-term to permanent status and hence some double counting in the net gains of permanent and long-term residents. The extent of category jumping has been estimated by the ABS and is included in Table 10. It would appear that the category jumping has been quite large (35 100) in 2002 suggesting that this is becoming a most important phenomenon. Table 11 presents data regarding the number of holders of a subclass 457 (Temporary Business Long Stay Migrants) visa who were granted permanent residence over the 1999–2001 period. This indicates that a significant proportion of this group are transferring to permanent residence and the numbers and rate appear to be increasing.
A number of issues flow from the last point. To what extent is temporary entry now becoming a ‘de facto’ settlement migration category? To what extent are individual persons seeing temporary entry as a strategy to eventually obtain permanent residence?
26

A new paradigm of international migration: implications for migration policy and planning in Australia
To what extent have people who intended to come to Australia to work and live for a limited period entered as settlers in the past because there was no temporary visa category available to them—but since 1995 have come into Australia under the new temporary visa categories?
Table 11: Australia: temporary business long stay migrants (Category 457) who were granted permanent residence 1999–2001
Year Number Granted
Permanent Residence As a Percent of 457
First Arrivals As a Percent of all Business Temporary Residence Visas
1999–2000 3019 27.8 8.62000–2001 5699 41.8 14.1
Source: GJ Hugo, ‘Temporary migration to Australia’, 2003.
The Government has introduced some mechanisms to facilitate the transfer from temporary to permanent residence. For example, some categories of foreign students can obtain more or less automatic permanent residence if they have particular skills in high demand in the labour market. Accordingly, in 2002–03 more than a half of skilled migrants accepted into Australia as permanent residents had a qualification from an Australian university.
Table 12: Australia: origin countries of permanent and temporary resident arrivals 2002–03 Permanent Resident Arrivals Temporary Resident Arrivals
Region No. % No. % UK/Ireland 12 346 13.1 96 700 39.5Northern Europe 2285 2.4 39 000 16.0Southern and Eastern Europe 4674 5.0 2900 1.2North America 2521 2.7 31 700 13.0Other America 1064 1.1 2 000 0.8Asia 34 529 36.7 59 600 24.4Middle East 7827 8.3 2100 0.9Africa 10 859 11.5 7900 3.2Oceania 18 021 19.1 2700 1.1Other/Not Stated 12 0.0 100 0.5Total 94 138 100.0 244 700 100.0Source: DIMIA, unpublished tabulations.
The interface between permanent and temporary work-related migration to Australia is an important area of both policy and theoretical significance but little is currently known regarding it. There are a number of important ways in which the temporary migrant intake differs from the permanent migration intake which need to be taken into account39. These include:
• the origins of temporary migrants are more focused on traditional origin countries than permanent migrants. Table 12 shows that Europe and North America account for 70.5 per cent of temporary resident arrivals and 23.2 per cent of permanent arrivals
27

A new paradigm of international migration: implications for migration policy and planning in Australia
• the temporary migrants have a more skilled profile, and
• the temporary migrants are more concentrated in Sydney and New South Wales.
Increasing ‘onshore’ migration Following from the increasing inflow of temporary residents has been a substantial increase in the proportion of new settlers in Australia who apply for settlement from within Australia because they are already in Australia as temporary residents. This reflects the strong connection and inter-relationship between various types of migration to Australia. Indeed, the Longitudinal Survey of Immigrants to Australia (LSIA) found that 43 per cent of all settlers coming to Australia had been to Australia previously—30 per cent on tourist visas and 5 per cent on student visas. This points to the growing interconnections between the various different types of international migration affecting Australia.
Figure 11 shows that there has been an increase in the numbers of ‘onshore’ settlers to Australia. In the early 1990s an important group who transferred from temporary to permanent status were the temporary residents of Chinese origin who were granted temporary protection visas following the Tiananmen Square incident. Many later applied for, and were granted, permanent residency. Others included people who came to Australia on holiday or to study and subsequently married an Australian. In recent years, however, the numbers of temporary residents seeking to become settlers has expanded. Indeed the Government has facilitated this process in some cases. It has been made easier, as noted, for students who have studied in Australia and gained an Australian qualification to become a settler on completion of their courses. There are also a significant number of the people entering Australia as temporary residents with temporary business visas who subsequently apply to settle in Australia. One study of long-standing temporary residents (Visa subclass 457) has found that 41.8 per cent of the group arriving in 2000–01 subsequently applied for permanent residency.40 Of particular interest currently are the substantial numbers of onshore asylum seekers who were granted Temporary Protection Visas. These were usually issued for three years and the next year will see this period having elapsed so that many of the holders will be ‘onshore’ applicants to become permanent settlers.
28

A new paradigm of international migration: implications for migration policy and planning in Australia
Figure 11: Australia: onshore residence visa grants, 1989–90 to 2002–03
0
5000
10000
15000
20000
25000
30000
3500019
89-9
0
1990
-91
1991
-92
1992
-93
1993
-94
1994
-95
1995
-96
1996
-97
1997
-98
1998
-99
1999
-200
0
2000
-01
2001
-02
2002
-03
Year
Pers
ons
Source: DIMIA Population Flows: Immigration Aspects, various issues and A Rizvi, SOPEMI
2004: Australia.
Table 13 shows how the various settlement categories are split between offshore and onshore applicants. It will be noted that in comparison with other recent years, the number of onshore applicants under the Refugee/Humanitarian category has been drastically reduced due to the Government interventions discussed earlier. However, it will be noted that the proportion of family settlers who are onshore (29.5 per cent) is a little greater than is the case for skilled settlers (27.7 per cent). This is mainly due to the substantial number of cases where temporary residents have partnered with an Australian resident and qualified to settle under the spouse/fiancé sub-categories, more than a third of whom are onshore. Among the skilled migrants, it is among the Employer Nominated and Regional Migration programs that the highest rate of onshore settlement occurs. These are clearly cases where people have entered as students or other workers and worked for an employer who has subsequently nominated them for permanent residence.
29

A new paradigm of international migration: implications for migration policy and planning in Australia
Table 13: Migration Program 2002–03, offshore and onshore outcomes—refugee/humanitarian
Category or Component Offshore Outcome
Onshore Outcome
Total Outcome
Percent Onshore
Spouse/interdependency(a) 19 060 10 670 29 710 35.9Child(b) 2410 270 2680 10.1Parent 370 150 510 29.4Preferential/Other Family(c) 1570 960 2520 38.1Fiance(a) 5350 - 5350 -Total Family 28 760 12 040 40 790 29.5ENS/LA/RSMS/STNI(d) 2770 7760 10 540 73.6Business Skills(e) 5020 1720 6 740 25.5Distinguished Talents 60 120 180 66.7Skilled Independent 30 210 7920 38 120 20.9Skilled Australian Sponsored(f) 9710 750 10 470 7.21 November - 20 20 100.0Total Skill 47 770 18 280 66 050 27.7Special Eligibility 210 1010 1230 82.1Total Program/Outcome 76 740 31 330 108 070 29.0Refugee/Humanitarian 11 656 869 12 525 6.9
Source: A Rizvi, SOPEMI 2004: Australia, p. 21.
• Figures have been rounded and totals may not be the exact sum of components.
• Outcome does not include permanent visas granted to New Zealand citizens (270 in 2002–03).
(a) Net outcome as places in the Migration Program taken by provisional visa holders who do not subsequently obtain permanent visas are returned to the Program in the year the application for permanent residence was refused or withdrawn (a total of 2,650 in 2002–03).
(b) Includes child-adoption, child dependent and orphan minor. (c) Includes aged dependent relatives, carers, orphan unmarried relatives and remaining
relatives. (d) Includes Employer Nomination Scheme, Labour Agreement, Regional Sponsored Migration
Scheme and State/Territory Nominated Independent Scheme. (e) Net outcome as cancelled visas are returned to the Program in the year in which they are
cancelled (a total of 840 in 2002–03). (f) Skilled Australian Sponsored categories includes skills tested brothers, sisters, nieces,
nephews, non-dependent children, working age parents, grandchildren and first cousins.
Another dimension of ‘onshore’ migration has been the change in the pattern of refugee/humanitarian migration. Australia has settled more refugees per 1000 residents than any country except Canada but most of these settlers were accepted from refugee camps based in foreign countries and were hence ‘offshore’ settlers. Australia’s offshore humanitarian migration program comprises two elements:
30

A new paradigm of international migration: implications for migration policy and planning in Australia
• The Refugee Program which provides protection for people outside their country fleeing persecution.
• Special Humanitarian Programs (SHP) which comprise the In-country Special Humanitarian Program for people suffering persecution within their own country, and the Global Special Humanitarian Program for people who have left their country because of significant discrimination amounting to a gross violation of human rights.
However, in recent years Australia has been forced to consider an ‘onshore component’ in this program with the increased numbers of asylum seekers arriving in the country. Figure 12 shows that the number of unauthorised arrivals in the country, the bulk who apply for asylum, decreased dramatically following the introduction of a range of policy initiatives.41 The unauthorised arrivals include both those coming by air without proper documentation and the so-called ‘boat people’.
Figure 12: Australia: unauthorised arrivals, 1989-90 to 2002-03
0
500
1000
1500
2000
2500
3000
3500
4000
4500
1989
/90
1990
/91
1991
/92
1992
/93
1993
/94
1994
/95
1995
/96
1996
/97
1997
/98
1998
/99
1999
/00
2000
/01
2001
/02
*200
2/03
Year
Num
ber
Boat ArrivalsAir Arrivals
Source: DIMIA, ‘Unauthorised Arrivals by Air and Sea’, Fact Sheet 74, 2002.
* To 15 October 2002
Accordingly, a new category in the humanitarian program in recent years is the Temporary Protection Visa (TPV). This was introduced in October 1999 and is granted to most of the asylum seekers who enter Australia unlawfully and who are assessed as meeting the requirements for refugee status. This is in contrast to those refugees who settle in Australia under the two traditional ‘offshore’ categories listed above, and Table 14 shows the substantial differences between the two groups in rights and access to services. The
31

A new paradigm of international migration: implications for migration policy and planning in Australia
Government maintains that this differentiation acts as a deterrent to undocumented immigrant arrivals and encourages refugees to stay in their country of first asylum, while critics argue that the creation of two classes of refugees is unfair and not within the spirit of the 1951 UN Convention Relating to the Status of Refugees.42 A later section discusses the marked increase in the number of asylum seekers arriving in Australia by boat or plane without documentation in the 1999–2001 period although there were very few arrivals in 2002 and 2003 following the Australian Government’s decision to process asylum applications offshore as part of the Pacific Solution.43
Table 14: Refugee entitlements in Australia, November 1999
Source: Australian Refugee Council, Position on Temporary Protection Visas, November 1999, 2000.
Table 15 shows the numbers of TPVs granted to asylum seekers arriving in Australia over the 1999–2003 period.
32

A new paradigm of international migration: implications for migration policy and planning in Australia
Table 15: Temporary Protection Visas granted, 1999–2003 1999–2000 871 2000–2001 4456 2001–2002 3892* 2002–2003 275 * Total onshore protection visas granted Source: DIMIA, ‘Temporary Protection Visas’, Fact Sheet 64, 2002; DIMIA, ‘Unauthorised
arrivals by air and sea’, Fact Sheet 74, 2003.
The composition of Australia’s humanitarian program in recent years is shown in Table 16Table 16. This indicates that the total intake in 2002–03 was 12 545, slightly more than in the previous year (12 349) but less than in 2000–01 (13 773). It is interesting that only 6.9 per cent of the intake (866 persons) were onshore migrants. This represents a substantial change to 2001–02 when 31.5 per cent of humanitarian migrants were onshore. This reflects the impact of Australia’s Pacific Solution and other policies designed to deter asylum seekers landing in Australia.
Table 16: Outcomes of Australia’s Humanitarian Program by component and category from 1997–98 to 2002–03
Component Category 97–98 98–99 99–00 00–01 01–02 02–03 Refugee 4010 3988 3802 3997 4160 4376Offshore SHP 4636 4348 3051 3116 4258 7280 SAC** 1821 1190 649 879 40 -Onshore 1588 1834 2458 5741 3891 866Temporary Humanitarian 164 6 3Total 12 055 11 360 9 960* 13 773 12 349 12 525Source: A Rizvi, SOPEMI 2003: Australia, 2002, p. 29 and SOPEMI 2004: Australia, 2003,
p. 47.
* In this year there were 5000 temporary safe haven visas to Kosovars offshore (4000) and Timorese (1900)
** Special Assistance Category (now defunct)
Increasing undocumented migration As indicated earlier, there has been an increase in global forces encouraging international migration but also a strengthening of barriers to this migration except for that of the highly skilled. Accordingly there has been a global proliferation of undocumented migration and the growth of an industry to facilitate that migration.44 Although being an isolated island protects Australia against this to some extent, Australia is now being influenced by undocumented migration of three types:
33

A new paradigm of international migration: implications for migration policy and planning in Australia
• overstaying whereby non-citizens enter Australia legally but overstay the term of their visa (overstayers)
• where non-citizens entering Australia legally otherwise ignore the terms of their visa, e.g. persons on a tourist visa working
• clandestine entry of non-citizens who do not pass through an immigration control point (illegal entrants).
In this section we will concentrate on the first and third of these types.
Table 17: Australia: number of overstayers, 1990–2003
Number Number from Asia Per cent 30 June 2003 59 800 na 30 June 2002 60 000* na 20 June 2001 60 102 27,823 46.29 31 December 2000 58 674* na 30 June 2000 58 748* 27,808 47.34 December 1999 53 131* na June 1999 53 143 23,741 44.67 June 1998 50 949 21,461 42.12 December 1996 45 100 na June 1995 51 307 na June 1993 79 755 na April 1992 81 400 na April 1990 90 000 na
Source: DIMIA, Population flows: immigration aspects, various issues; DIMIA, ‘Locating overstayers in Australia’, Fact Sheet 80, 2002, A Rizvi, SOPEMI 2004: Australia, 2003, p. 74.
* Excludes unauthorised arrivals by air and by boat.
Note: The introduction of the bridging visa scheme on 1 September 1994 influences the figures since prior to this time persons who did not have a valid visa but had come to the Department’s attention and were waiting for a visa determination or to leave the country were regarded as ‘overstayers’. Subsequently these people were not considered overstayers.
Much is known in Australia about overstayers since there is a high quality Movement Data Base and all persons arriving in and departing from the country are required to complete a card which facilitates matching and detection of overstayers. Table 17 shows that through the 1990s around 50 000 overstayers have been identified using this matching. In June 2003 there were 59 800 overstayers of whom 29 per cent had been in Australia for more
34

A new paradigm of international migration: implications for migration policy and planning in Australia
than 9 years and 19 per cent had been in the country for less than one year. Some 81.7 per cent of overstayers were persons who had overstayed tourist visas, 5.0 per cent temporary residents and 6.7 per cent students. The overstay rate was 0.48 per cent comprising 18 800 overstayers from 3 962 910 visitors in 2002–03 and 0.47 per cent of visa arrivals in 2001–02.45 It is estimated that approximately half of overstayers work illegally in Australia.46
Turning to the people who enter Australia illegally, it is clear that Australia has in recent times become a more important target for such movements. There are, of course, no data on persons who have been successful in such attempts but there are on the numbers that have been detected. These can be divided into those detected arriving by air and those coming by boat. The undocumented migrants arriving by air arrive either with no travel documents or present documentation which is found to be fraudulent but which they might have used for check-in at overseas airports. While many arrive as individuals, planning their own travel, some are part of organised people trafficking organisations which have become more active across the Asian region. It will be noted that the numbers arriving by air increased markedly in the 1990s and peaked at 2106 in 1998–99. Thereafter they fell to 1695 in 1999–2000, 1508 in 2000–01 and 1193 in 2001–02. The reasons for the fall in unauthorised arrivals in airports are not clear but may be associated with:
• sanctions on air carriers for bringing in unauthorised people leading to them checking documents of all incoming passengers more closely prior to travel
• feedback that such arrivals unable to make a case for asylum are sent back to where they came on the next available plane, and
• an increase in the use of boats among unauthorised arrivals.
The countries from which the unauthorised air arrivals originated are shown in Table 18. It will be noticed that there has been some significant variation over the years. In the years of largest gain Iraq, China, Indonesia and Sri Lanka were the largest groups.
However, in recent years the numbers from these origins have declined. The decline in the number of Iraqis is most interesting and dramatic (from 325 in 1998–99 to 37 in 2000–01) given their increasing numbers among boat arrivals. In recent times South Korea, New Zealand, Thailand and Malaysia have become more important with, in some cases, these being places of transit rather than the original place of birth/residence of the unauthorised arrivals.
Turning to people who seek to clandestinely enter Australia by boat, one small group are those who are detected aboard incoming ships who are stowaways. In 1998–99 these numbered 61, in 1999–2000, 26 and in 2000–01, 29. However, the main focus of attention regarding unauthorised arrivals has been on the so-called ‘boat people’.47 The numbers arriving on the northern shores of Australia from Indo-China over the period 1976–89 numbered only 2059 persons, although they attracted a great deal of attention.48 However, in the 1990s the numbers increased and reached unprecedented levels in 1999–2000 as
35

A new paradigm of international migration: implications for migration policy and planning in Australia
Table 19 indicates. The period 1999–2001 saw 8315 boat people detected compared with 1083 in the previous two years. This became the most discussed migration issue in Australia in recent years and it was a major element in the lead up to the 2001 national election.49
Table 18: Main source countries for people refused immigration visas at Australian airports, 1995–2003 Source Country 1995–96 1996–97 1997–98 1998–99 1999–2000 2000–01 2000–02 2002–03* China 92 235 268 112 73 65 95 33 Iraq ** 34 90 140 325 157 37 na na Indonesia 110 124 132 97 54 92 48 5 Sri Lanka 15 205 118 58 47 29 na na Somalia 87 110 78 30 11 3 na na Thailand 25 94 77 93 74 100 83 24 Kuwait** 0 19 61 32 4 2 na na New Zealand 49 40 59 92 107 111 128 26 South Korea 6 12 52 159 108 136 99 28 Algeria 21 61 51 87 14 2 na na Malaysia na na na na na na 160 24 United Kingdom na na na na na na 57 15 United States na na na na na na 61 5 India na na na na na na 41 1 Japan na na na na na na 31 1 Other 224 360 519 1021 1045 931 390 62 Total 663 1350 1550 2106 1694 1508 1193 224
Source: DIMA, ‘Unauthorised arrivals by air and sea’, Fact Sheet 81, 2000; DIMIA, ‘Unauthorised arrivals by air and sea’, Fact Sheet 74, 2002.
* To 15 October 2002 ** The figures used refer to the origin country of arrivals because citizenship is sometimes
difficult to determine.
36

A new paradigm of international migration: implications for migration policy and planning in Australia
Table 19: Numbers of boats and persons aboard arriving clandestinely in Australia and detected, 1989 to 2002–03 Year Number of Boats Total Arrivals Minimum/Maximum on Board 1989–90 3 224 26/119 1990–91 5 158 3/77 1991–92 3 78 10/56 1992–93 4 194 2/113 1993–94 6 194 4/58 1994–95 21 1,071 5/118 1995–96 14 589 4/86 1996–97 13 365 4/139 1997–98 13 157 3/30 1998–99 42 920 2/112 1999–2000 75 4,174 3/353 2000–01 54 4,141 2/231 2001–02 6 1,212 60/359 2002–03 1 65 65 Source: DIMIA, ‘Unauthorised arrivals by air and sea’, Fact Sheet 74, 2002.
The status regarding the 13 540 boat people who arrived in Australia since 1989 is shown in Table 20. It will be noted that some 68.9 per cent have been granted entry to Australia although 59.7 per cent had Temporary Resident Visas and only 8.9 per cent had been given permanent resident status. More than a fifth (27.3 per cent) had been repatriated.
Table 20: Australia: boat people, 1989–2003 status as at 17 April 2003 Number Percent
Removed 3702 27.3 Still in Detention 470 3.5 Granted Temporary Protection Visa 8077 59.7 Granted PPV 1200 8.9 Granted BVE 45 0.3 Other 3 0.0 Escaped 43 0.3 Total Unauthorised Boat Arrivals 13540 100.0
Source: DIMIA, ‘Temporary Protection Visas’, Fact Sheet 64, 2003.
An increasing focus on skills in migration There are three main components in the non-humanitarian part of the Australian migration program—Skill, Family, and Special Eligibility, the details of which are presented in Table 21. Some components, i.e. Business Skills, Employer Nominated Scheme (ENS), Distinguished Talent, Spouses and Dependent Children are demand driven and not subject to capping. Increases in demand for these visas, beyond planned levels, are compensated by reductions in other program components, i.e. Independent and Skilled-Australian Linked, Parents, Fiancés and Interdependents. Family Migration consists of a number of
37

A new paradigm of international migration: implications for migration policy and planning in Australia
categories under which a potential migrant can be sponsored by a relative who is an Australian citizen or permanent resident of Australia. For statistical purposes the various Family Migration classes and sub-classes were grouped in the following categories up to 1996–97:
• Preferential
– Spouse
– Prospective marriage
– Child
– Adoption
– Parent (meeting the balance of family test)
– Aged dependent relative
– Remaining relative
– Orphan relative
– Special need relative
• Concessional
– Non-dependent child
– Non-dependent brother or sister
– Non-dependent niece or nephew
– Parent of working age not meeting the balance of family test.
38

A new paradigm of international migration: implications for migration policy and planning in Australia
Table 21: Program Management Structure (2001–02) Migration (non-Humanitarian) Program Skill Family Special Eligibility Skilled Independent & Skilled- Parents and Preferential Family Can be capped Australian Sponsored* Can be capped subject to demand
in all other Family categories
• Points tested • Planning level adjusted subject to Fiancés & Interdependents demand in Business Skills and
ENS Can be capped subject to demand for spouse and dependent child places
Business Skills, ENS & Distinguished Talent
Demand driven Spouses & Dependent Children • Demand driven • Exempt from capping Contingency Reserve To be utilised if States and Territories, business employers and
regional authorities generate additional demand, and for ICT professionals with Australian qualifications
Source: DIMIA, Population flows: immigration aspects, 2002a
* Formerly Independent and Skilled-Australian Linked (until July 1999)
The Skill Migration component of the migration program is designed to contribute to Australia’s economic growth. It consists of a number of categories for prospective migrants where there is demand in Australia for particular occupational skills, outstanding talents or business skills. These categories are:
• Independent migrants—not sponsored by an employer or relative in Australia. Applicants must pass a points test which includes skills, age and English language ability (21 778 visas in 2001–02)
• Skilled-Australian Linked—commenced on 1 July 1997 (replacing the Concessional Family Category). Applicants must pass a points test on skills, age and English ability and receive additional points for sponsorship by relatives in Australia (4586 visas in 2001–02). Also includes Regional Linked for those sponsored by relatives in regional areas (not points tested)
• Employer sponsored—Employers may nominate (or ‘sponsor’) personnel from overseas through the Employer Nomination Scheme (ENS), Regional Sponsored Migration Scheme (RSMS) and Labour Agreements. These visas enable Australian
39

A new paradigm of international migration: implications for migration policy and planning in Australia
employers to fill skilled permanent vacancies with overseas personnel if they cannot find suitably qualified workers in Australia. A total of 1817 visas were granted in 2001–02
• Business Skills migration—encourages successful business people to settle permanently in Australia and develop new business opportunities (6409 visas in 2001–02)
• Distinguished talent—for distinguished individuals with special or unique talents of benefit to Australia (72 visas in 2001–02).
There are also several categories which cater for other types of visaed settler arrivals but are not included in the categories above. These are:
• former citizen of Australia
• former resident of Australia
• family of New Zealand Citizen for dependants of New Zealand citizens who have settled or intend to settle permanently in Australia.
In addition there are a number of categories for which visas were not required prior to 1 September 1994. These are:
• ‘New Zealand Citizens’, which refers to the arrival of New Zealand citizens under the Trans-Tasman Travel Arrangement, and
• Other (Non-Visaed) which refers primarily to the arrival in Australia of children born to Australian citizens overseas. It also includes residents of Cocos (Keeling) Islands, Norfolk Island, etc., and persons granted Australian citizenship overseas.
The 2002-03 migration program resulted in 108 070 non-humanitarian immigrants settling in Australia.50 This was the largest intake for over a decade. It was also the most number of skilled immigrants ever taken by Australia.51 The planning levels over the 2001–05 period are within the range of 100 000 and 110 000 places (66 000 in the Skill stream) per year and the actual level will depend upon:
• application rates in demand driven categories
• take up of state and regional specific categories
• extent of national skill shortages, and
• availability of ‘high standard’ applicants.52
Figure 13 presents the breakdown of the numbers in each category for the year 2002–03.
40

A new paradigm of international migration: implications for migration policy and planning in Australia
Figure 13: Categories of immigration to Australia, 2002–03
a. Includes settler arrivals plus onshore applicants. b. Includes Employer Nomination Scheme, Labour Agreement, Regional Sponsored Migration
State/Territory Nominated Independent Scheme. c. Excludes Other Non-Program Migration.
Refugee 4,376
Special Humanitarian Program 7,280
Onshore Protection 866
Temporary Humanitarian Concern3
Humanitarian 12,525
Family 40,790
Spouse/Fiances 35,060
Child 2,680
Parents 510
Other 2,520
ENS/LA/RSMS/STNIb 10,540
Business Skills 6,740
Distinguished Talents 180
Independent 38,120
Skilled Australian Linked10,470
Skill 66,050
1 November 20
Special 1,230
Migration Program 108,070
Total Migrants 136,959c
Otherc 16,364
Other Non-Program na
New Zealand Citizens16,364
Source:
From data in DIMIA, ‘Migration Program planning levels’, Fact Sheet 20, 2003; A Rizvi, SOPEMI 2004: Australia, 2003.41

A new paradigm of international migration: implications for migration policy and planning in Australia
Over recent times in Australia there has been greater government intervention to shape the content of the intake of immigrants so that it can better contribute to national development goals. This has seen greater emphasis on skills in migrant selection and in the development of business migration programs designed to attract entrepreneurs with substantial sums to invest in the destination country. Australia and Canada have micro-managed the qualifications of their migrant intake since the 1970s with the introduction of points assessment schemes. In Australia, recent years have seen a substantial shift toward skills/business migration and away from family migration as Figure 14 demonstrates. The diagram clearly shows an increasing proportion of permanent settlers in Australia come from the Skill section of the program. In 2002–03, there were 66 050 people granted Skill visas. This is an increase of 45.1 per cent over 2001–02 when 45 520 were granted such visas. In 2001–02, 22.6 per cent were onshore applicants compared with 27.7 per cent in 2002–03.
Figure 14: Australia: migration program outcomes by stream
0
10000
20000
30000
40000
50000
60000
70000
1989
-90
1990
-91
1991
-92
1992
-93
1993
-94
1994
-95
1995
-96
1996
-97
1997
-98
1998
-99
1999
-00
2000
-01
2001
-02
2002
-03
2003
-04
(pla
nned
)Year
Num
ber
Family Skill Special Eligibility
Source: DIMIA, Population flows: immigration aspects, various issues and DIMIA, ‘Temporary
Protection Visas’, Fact Sheet 64, 2003.
It is interesting in the context of the increased focus of Australia’s immigration program on skill that there is very strong evidence of the labour market performance of settlers improving considerably in the last decade. This has been demonstrated using data from the Longitudinal Survey of Immigrants in Australia (LSIA) and that from the ABS Labour Force Survey.53
Table 22 presents a comparison of the 1996 and 2001 census data and shows that whereas in 1996 the unemployment rate among immigrants arriving in Australia in the five years
42

A new paradigm of international migration: implications for migration policy and planning in Australia
before the census was 22.1 per cent, it was only half that for the equivalent group in 2001. Moreover, the workforce participation rate was higher. These findings are especially interesting since there is increasing concern in both the United States and Canada that the labour market performance of recently arrived immigrants is declining.54
Table 22: Australia: changes in labour force indicators by birthplace, 1996–2001 Unemployment Rate Participation Rate Australia Born 1996 8.7 74.1 2001 7.1 74.6 % Change -18.3 +0.7 Recent Migrants (arriving in the last 5 years) 1996 22.1 55.0 2001 11.0 60.0 % Change -49.8 +9.1 Longstanding Migrants 1996 9.5 70.5 2001 7.4 70.5 % Change -22.1 -
Source: ABS 1996 and 2001 Censuses, unpublished tabulations.
Regional migration schemes The spatial distribution of Australia’s population is an issue of considerable national importance. Examinations of the nation’s changing population distribution however almost always focus on the role of internal migration/population movement within Australia as the demographic process which shapes those patterns. In fact, however, it is also strongly influenced by the extent to which immigrants settle in a different spatial pattern to that exhibited by the resident national population.
It is to be expected that each cohort of immigrants will settle differently to both the resident Australian-born population and earlier generations of immigrants since the composition of the inflows and the context into which they arrive change over time. The distribution of job opportunities within Australia is changing over time as are the skills and work experience of immigrants. Moreover, research indicates the migrants frequently settle where earlier generations of their fellow countrymen have settled. Migrant networks are crucial in shaping where immigrants settle. Hence, in each of the countries with significant immigration there is a strong pattern of spatial concentration of immigrants especially recent immigrants. This is especially true of the United States where a majority of the immigrant population live in few states (Texas, Florida, New York and California).
First of all, with respect to interstate population distribution, Table 23 shows that a spatial shift has occurred in Australia’s post-war population away from the south-eastern states to the northern and western parts of the country. In 1947 the states of New South Wales,
43

A new paradigm of international migration: implications for migration policy and planning in Australia
Victoria, South Australia and Tasmania accounted for 78.4 per cent of the national population, but by 2001 they had 68.7 per cent of the total. On the other hand, Queensland increased its share from 14.6 per cent to 18.7 per cent and Western Australia from 6.6 per cent to 9.8 per cent.
Table 23: Australia: distribution of population between states and territories, 1881–2001 1881 1901 1921 1947 1961 1976 2001 1996 New South Wales 33.3 35.9 38.6 39.4 37.3 35.3 33.9 33.8 Victoria 38.3 31.8 28.2 27.1 27.9 26.9 24.9 24.7 Queensland 9.5 13.2 13.9 14.6 14.4 15.2 18.2 18.7 South Australia 12.3 9.5 9.1 8.5 9.2 9.1 8.1 7.8 Western Australia 1.3 4.9 6.1 6.6 7.0 8.4 9.6 9.8 Tasmania 5.1 4.6 3.9 3.4 3.3 2.9 2.6 2.4 Northern Territory 0.2 0.1 0.1 0.1 0.2 0.7 1.0 1.0 Australian Capital Territory 0.0 0.0 0.0 0.2 0.6 1.5 1.7 1.6 Total percentage 100.0 100.0 100.0 100.0 100.0 100.0 100.0 100.0 Total number (million) 2.2 3.8 5.4 7.6 10.5 13.9 18.3 19.4 Source: DT Rowland, ‘Population growth and distribution’, 1982, p. 25; ABS, Australian
Demographic Statistics June Quarter 2000, and June Quarter 2003.
While much of the shift in interstate distribution has been due to interstate population movements, it is also due to a propensity for immigrants to settle in particular states. Table 24 indicates that immigrants have settled disproportionately in New South Wales, Victoria and Western Australia and this has been an influential factor in shaping the distribution of the national population. It will be noted however that there has been a striking increase in the proportion of newcomers settling in Queensland. This may indicate that after an extended period of getting less than a proportionate share of immigrants Queensland is becoming a significant attraction to immigrants.
44

A new paradigm of international migration: implications for migration policy and planning in Australia
Table 24: Australian states and territories: percentage distribution of the population by birthplace and overseas-born arriving in the last five years, 1996 and 2001
Australia-Born (percent)
Overseas-Born (percent)
Persons Arriving in Last 5 Years
(percent) State/Territory 1996 2001 1996 2001 1996 2001
NSW 33.22 32.65 35.54 35.93 41.21 40.81
Vic 23.96 24.04 26.61 26.31 24.40 23.60
Qld 19.96 20.44 14.25 15.01 15.11 17.33
SA 8.15 8.07 7.74 7.22 4.52 4.10
WA 8.91 9.11 12.18 12.06 11.61 11.28
TAS 2.98 2.83 1.19 1.11 0.78 0.69
NT 1.13 1.16 0.75 0.72 0.73 0.72
ACT 1.68 1.68 1.71 1.63 1.61 1.47
Other Territories 0.02 0.01 0.03 0.02 0.02 0.01
Total 100.00 100.00 100.00 100.00 100.00 100.00
Source: ABS 1996 and 2001 Censuses.
The relative contributions of net international migration as well as net interstate migration and national increase to population change in the states and territories are shown in Table 25. It will be noted that in New South Wales, the largest state, there was a net international migration gain of almost one quarter of a million which accounted for 60.8 per cent of the State’s population growth between 1996 and 2001. Moreover the State experienced a significant net loss due to interstate migration, a longstanding pattern.55 In the past this has been the pattern in Victoria as well but a turnaround in the State’s economy saw it experience a small net interstate migration gain between 1996 and 2001. Conversely Queensland’s net international migration gain was not as large as the net gain by interstate migration. However, over the 1996 and 2001 inter-censal period the contribution of net international migration has increased and that of net interstate migration has declined. Queensland is increasing its proportion of the national immigrant intake and increased its share of recent migrations to Australia from 5.1 to 17.3 per cent between 1996 and 2001. On the other hand the shares in the traditional immigration states declined slightly (Table 24). In South Australia and Tasmania net international migration gains were not large enough to counter-balance the net outflow from interstate migration. Western Australia has remained an important destination for migrants.
45

A new paradigm of international migration: implications for migration policy and planning in Australia
Table 25: Australian states and territories: natural increase, net overseas migration, net interstate migration and total population growth, financial years 1996–2001
Natural Increase Net Overseas Migration
Net Interstate Migration
State No. % of
Growth No. % of
Growth No. % of
Growth
Total Population Growth No.
NSW 244 414 60.9 243 869 60.8 -86 925 -21.7 401 358 Vic 166 298 53.6 141 572 45.6 2 332 0.8 310 202 Qld 149 510 41.0 88 129 24.2 126 659 34.8 364 298 SA 39 745 118.9 19 621 58.7 -25 950 -77.7 33 416 WA 84 107 47.6 79 144 44.8 13 361 7.6 176 612 Tas 14 184 385.1 1550 42.1 -19 417 -527.2 -3683 NT 16 662 87.4 4172 21.9 -1773 -9.3 19 061 ACT 17 510 199.7 -453 -5.2 -8287 -94.5 8770 Australia* 732 649 56.0 576 221 44.0 - - 1 308 870 Source: ABS, Australian Demographic Statistics June Quarter 2002.
* Includes other territories.
Turning to the extent to which immigrants settle in urban and rural areas, Table 26 shows how migrants and the Australian-born are distributed between sections of state. It will be noted that immigrants are under-represented in all but the major cities category. Moreover among recent arrivals 89 per cent have settled in major cities compared to 59.9 per cent of the Australian-born and 80.6 per cent of longer standing immigrants. The under-representation in all non-metropolitan categories is much greater among recent arrivals than among immigrants of longer standing especially in rural areas. There appears to be a pattern whereby after a period of longer residence in Australia the overseas-born move more to non-metropolitan areas like the Australian-born population.56
Table 26: Australia: persons by section of state by birthplace by year of arrival at 2001 Census
Overseas Born Arrived Before Arrived After 1996 1996 Australian Born Total No. % No. % No. % No. % Major Urban 2 778 580 80.6 584 872 89.0 8 163 240 59.9 11 526 692 65.0
Other Urban 417 236 12.1 51 543 7.8 3 443 950 25.2 3 912 729 22.1
Bounded Locality 43 479 1.3 3 806 0.6 410 248 3.0 457 533 2.6
Rural Balance 207 476 6.0 17 062 2.6 1 606 337 11.8 1 830 875 10.3
Migratory 1380 - 196 - 5706 0.1 7282 - Total 3 448 151 100.0 657 479 100.0 13 629 481 100.0 17 735 111 100.0
Source: ABS 2001 Census, unpublished tabulations
There have been a number of attempts by governments to influence where in Australia migrants settle after they arrive in Australia.57 In Europe, several countries are attempting
46

A new paradigm of international migration: implications for migration policy and planning in Australia
to direct refugees to settle in particular areas.58 The last few years have seen a more concerted effort by DIMIA to influence where immigrants settle than at any time since the intake of displaced persons in the immediate post-Second World War period. In May 1996 the annual meeting involving Commonwealth, State and Territory Ministers for Immigration and Multicultural Affairs established a working party on regional migration which could herald a new era in patterns of migrant settlement. The working party examined ways in which a higher proportion of migrants might settle in regional Australia. Accordingly, a number of initiatives were taken to attract immigrants to areas which are currently receiving small intakes under the State Specific Migration Mechanisms (SSMMs).
SSRMs initiatives enable employers, state/territory governments or relatives to sponsor prospective skilled migrants. Mechanisms include the:
• Regional Sponsored Migration Scheme (RSMS)
• State/Territory Nominated Independent (STNI) scheme
• Skilled Designated Area Sponsored Visa Categories
• Skill Matching Database (SMD)
• Skill Matching Visa (SMV)
• Regional Established Business in Australia (REBA), and
• Two-stage State/Territory Sponsored Business Owner, Investor and Senior Executive visa categories.
Rizvi reports that:
Over the last 18 months the Government has implemented a number of enhancements to the initiatives, designed to attract a higher number of skilled and business migrants to regional Australia. Further enhancements are currently under consideration.59
Some of the key enhancements already implemented include:
• Temporary residence concessions for regional Australia, including changes to temporary residence to provide regional certifying bodies with a greater role in supporting sponsorships in regional Australia.
– Exceptions can be provided from the gazetted minimum skill and salary requirements for positions nominated under temporary business visas, which are located in regional and low population growth areas and have been certified by a Regional Certifying Body.
47

A new paradigm of international migration: implications for migration policy and planning in Australia
• Changes to the general skilled migration category. In order to encourage a greater proportion of students to consider studying and eventually settling in regional Australia, the following adjustments to the points-test, and eligibility criteria, were implemented:
– Additional points for overseas students who have recently completed their qualifications by studying and living nearby for a period of a least two years at the campus of an education institution in regional Australia, and
– The period of time students are required to attend a tertiary institution in Australia to be exempt from the work experience requirement increased from 12 months to two years.
Business Skills. Introduction of a two-stage process (i.e. a provisional visa and then the granting of permanent residence once a business is fully established) for the Business Skills categories with a much greater emphasis on state and territory government sponsorship and support at both stages (with immediate permanent residence only available for high calibre business migrants who have state/territory government support).
South Australia readily embraced the new regional immigration categories when they were introduced and in 1998–99, 1034 of the total of 2804 migrants entering Australia under this category came to the State. However, by 1999–2000 this was reduced to 702 out of 3309. Table 27 shows that while over the 1991–2003 period there was an increase in the number of Regional Sponsored migrants to Australia, South Australia’s share remained around 700 while its proportion fell from 26.9 per cent in 1999–2000 to 20.5 per cent in 2001–02. However the initiatives in 2002 and 2003 saw a significant change in regional migration as predicted by Rizvi.60 The overall number of State Specific Migration Scheme settlers increased by 91.5 per cent to 7921. Moreover, the continuing initiatives are likely to see an increase in 2003–2004. Rizvi reports that in the first quarter of 2003–2004 the number of SSRM grants was 2400, twice the level for the previous year.61
48

A new paradigm of international migration: implications for migration policy and planning in Australia
Table 27: Distribution of migrants granted visas under state specific migration mechanisms, 1998–99 to 2002–03 Category South Australia Other States Total No. % 1998–99 RSMS 436 329 765 STNI 169 0 169 Regional-Linked 29 38 67 SAL* 396 1348 1744 SSBS** 4 55 59 REBA 0 0 0 Total 1034 58.4 1770 2804 1999–2000 RSMS 373 291 664 STNI 9 0 9 Regional-Linked 16 179 195 SAL* 297 2087 2384 SSBS** 4 40 44 REBA 3 10 13 Total 702 26.9 2607 3309 2000-01 RSMS 437 584 1021 STNI 36 49 85 Regional-Linked 67 935 1002 SAL* 184 1,391 1575 SSBS** 16 106 122 REBA 10 31 41 Total 750 24.2 3096 3846 2001–02 RSMS 384 708 1092 STNI 51 206 257 Regional-Linked 137 1460 1597 SAL* 94 880 974 SSBS** 25 151 176 REBA 12 28 40 Total 703 20.5 3433 4136 2002–03 RSMS 436 1,302 1738 STNI 353 441 794 Regional-Linked SDAS 455 4,011 4466 SAL 20 504 524 SSBS 57 284 341 REBA 3 75 78 Total 1324 16.7 6617 7941
Source: DIMIA, Population flows: immigration aspects, various issues; Ruddock, various Media Releases 2002; B Birrell, ‘Redistributing migrants: the Labor agenda’, 2003; DIMIA unpublished data.
* Refers to applicants under this category who obtained bonus points because their sponsor lived in a designated area.
** Includes applicants processed under offshore subclass 129 (State/Territory Sponsored Business Owner), offshore subclass 130 (State/Territory Sponsored Senior Executive), onshore subclass
49

A new paradigm of international migration: implications for migration policy and planning in Australia
842 (State/Territory Sponsored Business Owner) and onshore subclass 843 (State/Territory Sponsored Senior Executive).
Acronyms RSMS – Regional Skilled Migrants Scheme STNI – State/Territory Nominated Independent SAL – Skilled-Australian Linked SSBS – State/Territory Sponsored Business Skills REBA – Regional Established Business in Australia Note: For Definitions of Current Programs See Appendix.
There seems little doubt that the state-specific and regional migration initiatives will result in increased numbers settling in Australia under this category in the next few years.62 The question becomes in which ‘regional’ areas will they settle? Table 27 shows that South Australia’s share of the SSRM immigrants in 2002–03 continued to decrease although the numbers of settlers under the scheme increased by 88.3 per cent. There can be little doubt that the major recipient of SSRM migrants in recent times has been Melbourne. Although Melbourne is not eligible for receiving migrants in all SSRM categories, it can receive those under the large regional linked Skilled-Designated Area Sponsor (SDAS), and to a lesser extent, the State Sponsored Skill category. Birrell has analysed the planned locations of a proportion of SSRM immigrants over the 2001–03 period and his results are shown in Table 28 and indicate that in the largest category (Regional Linked SDAS) Melbourne accounts for two-thirds of settlers.63
Family members living in ‘designated areas’ can sponsor relatives on a concessional basis. The migrants they sponsor do not have to pass the points test applied to independent (skilled) migrants. Instead they are required to possess the following minimum qualifications : ‘vocational English’, be aged less than 45, have an occupation listed on the ‘Skills Occupational List’ and have their occupational qualifications approved by the relevant assessment authority.64
50

A new paradigm of international migration: implications for migration policy and planning in Australia
Table 28: Permanent residents, 1 July 2001 to 30 June 2003 grouped by visa category and location in Australia
Per cent by Migration Category
Location Permanent Residents
RSMS and State/Territory
Schemes
Regional – Linked SDAS Other Skill
Not Skill Total
Sydney 52 421 8 5 38 38 37 NSW Remainder 3 969 5 2 2 4 3 Melbourne 35 011 21 67 21 26 25 Vic Remainder 1875 5 2 1 2 1 Brisbane 12 739 2 2 11 8 9 QLD Remainder 5 610 7 3 4 4 4 Adelaide 6 444 22 8 3 5 5 SA Remainder 374 3 0 0 0 0 Perth 18 063 9 3 18 9 13 WA Remainder 1181 6 2 1 1 1 Hobart 760 5 1 0 1 1 Tas Remainder 571 2 1 0 1 0 Darwin 643 1 1 0 1 0 NT Remainder 196 1 0 0 0 0 Canberra 1989 3 3 1 1 1 ACT Remainder 22 0 0 0 0 0 City total 128 071 70 90 93 88 90 Remainder total 13 797 30 10 7 12 10 100 100 100 100 100 State total 141 868 1937 3617 65 025 71 289 141 868 Not stated other 9178 238 160 7300 1480 9178 Total in category 151 046 2175 3777 72 325 72 769 151 046
Source: B Birrell, ‘Redistributing migrants: the Labor agenda’, 2003.
Note: Those with private box addresses or where location was not fully described in each state were apportioned on pro rata basis within each state. Categories shown here include spouses and children migrating with the principal applicant.
Special state and regional migration schemes are currently at a key point in Australia. There is a strong commitment of several state governments and the Federal Government to increase the number of permanent settlement visas issued under these initiatives. Moreover, the Labor opposition has committed to developing measures to ensure that at least 45 per cent of Australia’s new settlers go to rural and regional areas.65 This is based largely on a report by Withers and Powell.66 It is also important to note that Table 29 shows that there is a trend in the United States toward an increasing dispersal of immigrants.
51

A new paradigm of international migration: implications for migration policy and planning in Australia
Table 29: United States: change in population of foreign born living in selected states 1990 and 2000
1990 2000 State % % California 32.7 28.5Florida 8.4 8.6Illinois 4.8 4.9New York 14.4 12.4New Jersey 4.9 4.7Texas 7.7 9.3 72.9 68.4 Oregon 0.7 0.9Arizona 1.4 2.1Iowa 0.2 0.3Arkansas 0.1 0.2Georgia 0.9 1.9North Carolina 0.6 1.4Kentucky 0.2 0.3Tennessee 0.3 0.5Virginia 1.6 1.8 6.0 9.4
Source: US Bureau of Census.
Whereas in the past, six of the fifty states (California, New York, Florida, Texas, New Jersey and Illinois) accounted for over 70 per cent of new arrivals, newer migrants are increasingly being attracted to Oregon, Arizona, Iowa, Arkansas, Georgia, North Carolina, Kentucky, Tennessee and Virginia.67
On the other hand, there have been those who have been sceptical of Australian regional migration schemes. These include Birrell who shows that most ‘regional’ migrants thus far have settled in capital cities, especially Melbourne.68
One issue, which is rarely raised in the large amount of discussion on regional or state-specific migration schemes, is non-permanent migration. It has been argued here that Australia has entered a new paradigm of international migration with the new large scale acceptance of temporary workers. It is argued here that this movement should be included in consideration of regional or state-specific migration schemes because:
• the temporary migration is highly selective of very skilled persons
• although the full economic impact of the new temporary migration is yet to be researched in detail it is likely that such migrants make a significant economic contribution, and
• a substantial proportion of the temporary residents eventually settle in Australia.69
52

A new paradigm of international migration: implications for migration policy and planning in Australia
Moreover it is apparent that the temporary migration is even more selectively concentrated in east coast Australia than is permanent settlement. This means that regional areas and peripheral states are largely missing out on the advantages of this new type of movement. Table 30 for example compares arrivals in subclass 457 (Temporary Business Entry) visa over the 1997–2000 period.70 It will be noted, for example, that while South Australia generally receives over 4 per cent of permanent settlers it receives only half that proportion of Temporary Business Migrants to Australia.
Recently DIMIA announced that for the first time the Regional Migration Scheme will include some initiatives to direct temporary entrants as well as permanent entrants to the states like South Australia.71 These include:
• temporary residence visas for doctors who agree to go to an ‘area of need’ identified by a state health authority, and
• temporary residence concessions for regional Australia, which allow regional certifying bodies a greater role to support sponsorships.
53

A new paradigm of international migration: implications for migration policy and planning in Australia
Table 30: Temporary Business Entrants (subclass 457) and Permanent Arrivals in the Skill Visa Categories* Compared
1997/98 1998/99 1999/2000 Temporary Permanent Temporary Permanent Temporary Permanent Total number 11 932 25 985 11 894 27 931 10 823 32 350 % % % % % %Primary applicants 48.0 40.0 47.2 40.1 50.8 39.8Secondary applicants 52.0 60.0 52.8 59.9 49.2 60.2Intended residence NSW 47.7 43.4 48.8 43.7 52.3 42.7Victoria 21.0 17.5 25.3 17.5 25.5 19.6Queensland 10.9 13.8 9.0 13.0 9.0 12.1SA 2.5 4.4 2.1 4.5 2.5 3.8WA 16.2 19.1 10.9 19.5 7.4 20.1Tasmania 0.7 0.3 0.2 0.3 0.5 0.3NT 0.3 0.6 2.0 0.6 1.1 0.5ACT 0.7 0.9 1.7 0.9 1.7 0.9Sex Male 54.9 52.6 52.8 52.7 54.1 52.3Female 45.1 47.4 47.2 47.3 45.9 47.7Region of origin** Oceania 0.2 2.4 0.5 2.9 1.0 3.3UK and Ireland 26.1 22.5 26.8 19.6 28.3 18.5Other Europe and USSR 15.3 6.2 14.6 7.1 14.2 5.9Middle East and N. 0.9 2.9 1.3 2.6 2.1 2.3Southeast Asia 6.2 13.0 7.9 17.4 7.3 18.2Northeast Asia 21.2 23.0 16.5 20.2 13.9 16.1Southern Asia 4.4 10.8 6.6 8.9 10.2 15.0Northern America 17.3 2.6 14.7 1.8 14.9 1.6Other America 0.7 0.8 2.0 1.0 1.1 0.5Africa 7.8 16.2 9.0 18.5 7.2 18.5
Source: Khoo, Voight-Graf and Hugo, ‘Temporary skilled migration to Australia’, 2003.
* Includes primary migrants and dependents. Skill visa categories include Independent, Employer Nomination Scheme, Business skills and (from 1997/98) Skilled Australian-linked.
** Based on country of citizenship for temporary migrants: based on country of firth for permanent migrants.
Using South Australia as an example, a national study of 956 ‘back packers’ found 35 per cent had visited South Australia, but a survey in 2000 of 1774 Working Holiday Makers found that only 2 per cent worked in South Australia.72 Another group of temporary residents in Australia which has attracted considerable attention is that of overseas
54

A new paradigm of international migration: implications for migration policy and planning in Australia
students who have been found to make a considerable contribution to the economy. Indeed overseas students have been estimated to be the third largest earner of foreign exchange in Australia. South Australia has increased its share of overseas students to be a little below its share of the total population as Figure 15 indicates. There is a proposal that overseas students from regional universities who seek to gain permanent residence in regional areas will be given particular concessions. In addition it is planned to develop a regional 457 subclass visa category.
Figure 15: All overseas students in South Australia as a percentage of all overseas students in Australia, 1994–2003
4.0
4.5
5.0
5.5
6.0
6.5
7.0
7.5
8.0
1994 1995 1996 1997 1998 1999 2000 2001 2002 2003
Year
Perc
enta
ge
Source: DETYA, Students: Selected Higher Education Statistics, various issues
It is certainly true that attempts to influence where immigrants settle in Australia thus far have had only very marginal influences on the distribution of immigrants in Australia. All migration theory and empirical experience point to recent migrants concentrating in areas where:
(a) there are substantial communities of fellow country persons who were previous settlers who will act as anchors to assist them settle in Australia, and
(b) there are abundant job opportunities.
Programs which seek to divert new immigrants to peripheral areas where there are few previous immigrant settlers and limited economic opportunity will always have difficulty. Nevertheless it would not be advisable to dismiss SSRM schemes out of hand. The current situation is that DIMIA seems now to be ready to reduce the entry requirements substantially for people who will settle in peripheral areas. Undoubtedly this will be
55

A new paradigm of international migration: implications for migration policy and planning in Australia
attractive to the substantial numbers of potential immigrants who are unable to qualify for settlement under the national immigration regulations. As the suite of SSRM schemes increases and the concessions to SSRM entrants increase so that the gap between the criteria they need and those required for regular entrants widens, it would seem likely that the numbers entering under the scheme would increase. The effectiveness in terms of redistribution of the population and assisting the development of regional areas and peripheral states however, will depend upon:
(a) The definitions of ‘regional’ and ‘eligibility’ of the various states that are employed. If metropolitan Melbourne continues to be included in these definitions for the bulk of programs, it will continue to attract the bulk of the new immigrants. The question has to be asked as to whether that is an outcome which is in the spirit of the objectives of the SSRM program.
(b) The extent to which SSRM settlers are compelled to stay in their original location. This remains a key issue which seems to be adequately addressed by the intention in some key programs to offer new settlers a two stage visa: the first stage of temporary residence for up to three years and a second stage of permanent residence after three years of continuous residence in the designated location. It would be argued that after three years the location has gained a substantial economic benefit from the immigrant and if he/she is ever going to settle there they would have formed relationships, established networks, etc. within the three years which would facilitate this.
Hence, the eventual impact of the SSRM schemes is difficult to predict and cannot be based purely on past experience. Another issue relates to the fact that thus far, it is mainly the skill and family elements in the immigration program which have been the subject of the SSRM schemes. Is it possible to do more to include those considered in the regional/humanitarian part of the program as is the case in European nations? This could, for example, be built into the plans following the recent undertaking to take 5000 refugee settlers from Africa.
Emigration and the Australian diaspora
There is a tendency for Australia to be categorised as a purely immigration country but, in fact, it is also a country of significant emigration. Table 31 shows that over recent years departures on a permanent or long-term basis have been very substantial. In 2001–02 permanent departures numbered 48 241 compared with an average of 30 539 over the previous 14 years. This represented a 17.4 per cent increase over 1999–2000 and a 61.6 per cent increase over 5 years earlier. In 2002–03 there was a further 4.6 per cent increase in outflow, which reached 50 463 persons.
Table 32 shows the numbers of permanent departures is at record levels. It also indicates that there has been a substantial increase in the ratio of permanent emigration to permanent immigration and it has been comparatively high in recent years. Over the post-
56

A new paradigm of international migration: implications for migration policy and planning in Australia
war period there has been a close relationship between immigration and emigration trends with the latter tending to follow the former with a small time lag. This is because, as Table 31 indicates, former settlers have been a major part of emigration over the years. Moreover, the return migration effect has been understated in the data since a significant number of the Australian-born are children born in Australia to overseas-born returnees.
57

58
A new paradigm
of international migration: im
plications for migration policy and planning in Australia
Table 31: Australia: settlers and long-term migration, 1987 to 2002–03 Year
1987–88 1988–89 1989–90 1990–91 1991–92 1992–93 1993–94 1994–95 1995–96 1996–97 1997–98 1998–991999–
2000 2000–01 2001–02 2002–03
Permanent Migration
Arrivals 143 480 145 316 121 227 121 688 107 391 76 330 69 768 87 428 99 139 85 752 77 327 84 143 92 272 107 360 88 900 93 920
Departures 20 470 21 647 27 857 31 130 29 122 27 905 27 280 26 948 28 670 29 857 31 985 35 181 41 078 46 530 48 241 50 460
Net 123 010 123 669 93 370 90 558 78 269 48 425 42 488 60 480 70 469 55 895 45 342 48 962 51 194 60 830 40 659 43 460
Long-Term Migration
Arrivals 98 780 104 590 110 695 114 711 126 781 127 436 137 600 151 095 163 578 175 249 188 114 187 802 212 849 241 210 264 471 279 890
Departures 78 570 90 991 100 199 110 512 115 162 113 190 112 707 118 533 124 386 136 748 154 294 140 281 156 768 166 400 171 446 169 100
Net 20 210 13 599 10 496 4 199 11 619 14 246 24 893 32 562 39 192 38 501 33 820 47 521 56 081 74 810 93 025 110 790
Total Permanent and Long-
Term Net Gain 143 220 137 242 103 866 94 757 89 888 62 671 67 381 93 042 109 661 94 396 79 162 96 483 107 275 135 640 133 684 154 250
% Net Migration from Long-
Term Movement 14.1 9.9 10.1 4.4 12.9 22.7 36.9 35.0 35.7 40.8 42.7 49.3 52.3 55.2 69.6 71.8
Source: DIMIA, Immigration Update, various issues and unpublished data.

A new paradigm of international migration: implications for migration policy and planning in Australia
Table 32: Australia: permanent movement, financial years, 1968–69 to 2002–03 Permanent Departures
Former Settlers* Australia-Born** Financial Year
Settler Arrivals No. % of
Departures No. % of Departures
Total Departures
as % of Arrivals
1968–69 175 657 23 537 74.3 8 141 25.7 31 678 18.01969–70 185 099 26 082 72.3 10 000 27.7 36 082 19.51970– 71 170 011 28 244 71.8 11 072 28.2 39 316 23.11971–72 132 719 32 280 72.8 12 439 27.8 44 719 33.71972–73 107 401 31 961 71.2 12 945 28.8 44 906 41.81973–74 112 712 26 741 67.8 12 699 32.2 39 413 35.01974–75 89 147 20 184 64.0 11 361 36.0 31 545 35.41975–76 52 748 17 150 62.5 10 277 37.5 27 427 52.01976–77 70 916 15 447 62.8 9 141 37.2 24 588 34.71977–78 73 171 13 972 60.5 9 124 39.5 23 096 31.61978–79 67 192 13 797 54.3 11 632 45.7 25 429 37.81979–80 80 748 12 044 54.7 9 973 45.3 22 017 27.31980–81 110 689 10 888 55.8 8 608 44.2 19 496 17.61981–82 118 030 11 940 57.2 8 940 42.8 20 890 17.71982–83 93 010 15 390 62.0 9 440 38.0 24 830 26.71983–84 68 810 14 270 58.7 10 040 41.3 24 300 35.31984–85 77 510 11 040 54.2 9 340 45.8 20 380 26.31985–86 92 590 9 560 52.8 8 540 47.2 18 100 19.51986–87 113 540 10 800 54.2 9 130 45.8 19 930 17.61987–88 143 470 10 716 52.3 9 755 47.7 20 471 14.31988–89 145 320 15 087 69.7 6 560 30.3 21 647 14.91989–90 121 230 19 458 69.8 8 399 30.2 27 857 23.01990–91 121 688 21 640 69.5 9 490 30.5 31 130 25.61991–92 107 391 19 944 68.5 9 178 31.5 29 122 27.11992–93 76 330 18 102 64.9 9 803 35.1 27 905 36.61993–94 69 768 17 353 63.6 9 927 36.4 27 280 39.11994–95 87 428 16 856 62.6 10 092 37.4 26 948 30.81995–96 99 139 17 665 61.6 11 005 38.4 28 670 28.91996–97 85 752 18 159 60.8 11 698 39.2 29 857 34.81997–98 77 327 19 214 60.1 12 771 39.9 31 985 41.41998–99 84 143 17 931 50.1 17 250 49.0 35 181 41.81999–2000 92 272 20 844 50.7 20 234 49.3 41 078 44.52000–01 107 360 23 440 50.4 23 081 49.6 46 521 43.32001–02 88 900 24 095 49.9 24 146 50.1 48.241 54.32002–03 93 920 24 885 49.3 25 578 50.7 50 463 53.7
Sources: DIMIA, Australian Immigration: Consolidated Statistics and Immigration Update, various issues
* Data 1988–89 to 2002–-03 constitute permanent overseas-born departures due to a change in definition by DIMA. Data prior to this constitute former settler departures.
** Data prior to 1988-89 constitute permanent departures other than former settlers.
59

A New Paradigm of International Migration: Implications for Migration Policy and Planning in Australia
Turning to long-term departures, Table 33 indicates that this reached unprecedented levels in 2001–02 of 171 446. This was well above the 14 year average of 123 128 and 9.4 per cent more than two years earlier. Clearly, there has been a significant growth of movement out of Australia in recent years.73 There was a small fall to 169 100 in 2002–03 reflecting the impact of the insecurity created by September 11, the Bali bombings and the SARS outbreak.
60

A new paradigm of international migration: implications for migration policy and planning in Australia
Table 33: Australia: long-term movement, 1959–60 to 2002–03 Arrivals Departures Net Overseas Movement Australian
Residents Overseas Visitors
Total Australian Residents
Overseas Visitors
Total Australian Residents
Overseas Visitors
Total
1959–60 16 049 11 748 27 797 24 730 7 838 32 568 -8 681 3 910 -4 7711960–61 16 870 13 320 30 190 28 542 11 823 40 365 -11 672 1 497 -10 1751961–62 19 301 13 423 32 724 33 370 12 591 45 961 -14 069 832 -13 2371962–63 21 376 13 971 35 347 34 324 13 219 47 543 -12 948 752 -12 1961963–64 23 066 14 170 37 236 39 931 12 325 52 256 -16 865 1 845 -15 0201964–65 24 065 16 484 40 549 42 702 13 640 56 342 -18 637 2 844 -15 7931965–66 27 279 18 461 45 740 51 785 11 808 63 593 -24 506 6 653 -17 8531966–67 31 161 20 078 51 239 53 750 12 707 66 457 -22 589 7 371 -15 2181967–68 37 032 23 341 60 373 51 847 12 516 64 363 -14 815 10 825 -3 9901968–69 37 376 24 442 61 818 53 296 13 817 67 113 -15 920 10 625 -5 2951969–70 38 711 29 842 68 553 63 454 17 414 80 868 -24 743 12 428 -12 3151970–71 43 554 31 225 74 779 66 463 19 928 86 391 -22 909 11 297 -11 6121971–72 51 356 27 713 79 069 68 069 23 328 91 397 -16 713 4 385 -12 3281972–73 58 292 26 733 85 025 67 379 23 579 90 958 -9 087 3 154 -5 9331973–74 64 297 27 212 91 509 60 636 21 246 81 882 3 661 5 966 9 6271974–75 60 239 23 615 83 854 72 397 24 386 96 783 -12 158 -771 -12 9291975–76 60 224 21 687 81 911 64 475 21 528 86 003 -4 251 159 -4 0921976–77 59 193 26 133 85 326 68 792 19 724 88 516 -9 599 6 409 -3 1901977–78 57 311 28 043 85 354 60 099 19 194 79 293 -2 788 8 849 6 0611978–79 60 947 34 064 95 011 57 255 21 216 78 471 3 692 12 848 16 5401979–80 59 963 29 586 89 549 52 114 19 228 71 342 7 849 10 358 18 2071980–81 59 871 34 220 94 091 47 848 18 778 66 626 12 023 15 442 27 4651981–82 57 860 34 760 92 620 46 500 20 310 66 810 11 360 14 450 25 8101982–83 48 990 30 740 79 730 47 020 25 440 72 460 1 970 5 300 7 2701983–84 49 190 27 280 76 470 49 490 24 950 74 440 -300 2 330 2 0301984–85 53 770 31 980 85 750 51 710 23 160 74 870 2 060 8 820 10 8801985–86 56 560 37 250 93 810 49 690 24 670 74 360 6 870 12 580 19 4501986–87 53 597 67 325 120 922 48 854 26 538 75 392 4 743 40 787 45 5301987–88 54 804 43 978 98 782 50 499 28 054 78 553 4 305 15 924 20 2291988–89 53 798 50 766 104 564 57 733 33 258 90 991 -3 935 17 508 13 5731989–90 53 967 56 728 110 695 62 300 37 899 100 199 -8 333 18 829 10 4961990–91 59 062 55 649 114 711 66 883 43 629 110 512 -7 821 12 020 4 1991991–92 62 920 63 861 126 781 67 191 47 971 115 162 -4 271 15 890 11 6191992–93 69 594 57 842 127 436 65 446 47 744 113 190 4 148 10 098 14 2461993–94 75 600 62 000 137 600 64 786 47 921 112 707 10 814 14 079 24 8931994–95 79 063 72 032 151 095 68 377 50 156 118 533 10 686 21 876 32 5621995–96 79 206 84 372 163 578 70 253 54 133 124 386 8 953 30 239 39 1921996–97 80 170 95 079 175 249 73 777 62 971 136 748 6 393 32 108 38 5011997–98 84 358 103 756 188 114 79 422 74 872 154 294 4 936 28 884 33 8201998–99 67 910 119 892 187 802 82 861 57 420 140 281 -14 951 62 472 47 5211999–2000 79 651 133 198 212 849 84 918 71 850 156 768 -5 267 61 348 56 0812000–01 82 900 158 310 241 210 92 960 73 440 166 400 -10 060 84 870 74 8102001–02 88 598 175 873 264 471 92 071 79 375 171 446 -3 473 96 498 93 0252002–03 95 790 184 100 279 890 86 200 82 900 169 100 9 590 101 200 110 790
Source: DIMIA, Australian Immigration: Consolidated Statistics and Immigration Update, various issues
In considering this out-movement it is important to distinguish between that of Australian residents and people who have come from other nations. With respect to permanent
61
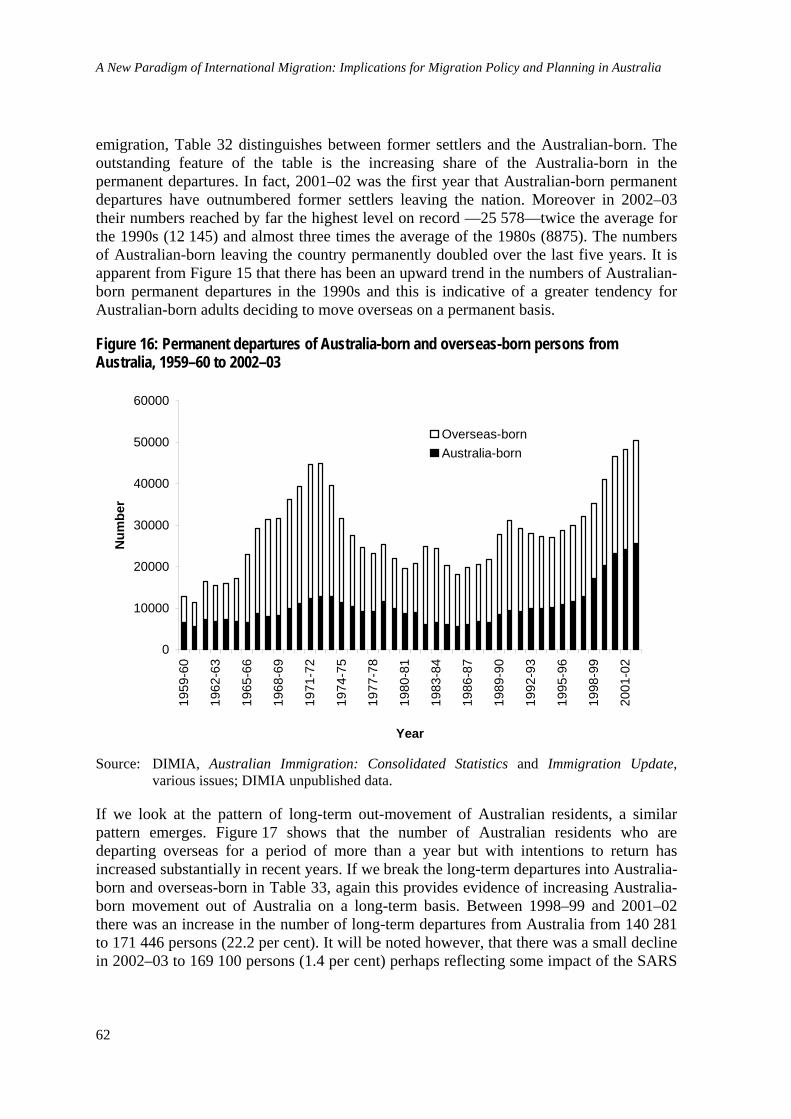
A New Paradigm of International Migration: Implications for Migration Policy and Planning in Australia
emigration, Table 32 distinguishes between former settlers and the Australian-born. The outstanding feature of the table is the increasing share of the Australia-born in the permanent departures. In fact, 2001–02 was the first year that Australian-born permanent departures have outnumbered former settlers leaving the nation. Moreover in 2002–03 their numbers reached by far the highest level on record —25 578—twice the average for the 1990s (12 145) and almost three times the average of the 1980s (8875). The numbers of Australian-born leaving the country permanently doubled over the last five years. It is apparent from Figure 15 that there has been an upward trend in the numbers of Australian-born permanent departures in the 1990s and this is indicative of a greater tendency for Australian-born adults deciding to move overseas on a permanent basis.
Figure 16: Permanent departures of Australia-born and overseas-born persons from Australia, 1959–60 to 2002–03
0
10000
20000
30000
40000
50000
60000
1959
-60
1962
-63
1965
-66
1968
-69
1971
-72
1974
-75
1977
-78
1980
-81
1983
-84
1986
-87
1989
-90
1992
-93
1995
-96
1998
-99
2001
-02
Year
Num
ber
Overseas-bornAustralia-born
Source: DIMIA, Australian Immigration: Consolidated Statistics and Immigration Update, various issues; DIMIA unpublished data.
If we look at the pattern of long-term out-movement of Australian residents, a similar pattern emerges. Figure 17 shows that the number of Australian residents who are departing overseas for a period of more than a year but with intentions to return has increased substantially in recent years. If we break the long-term departures into Australia-born and overseas-born in Table 33, again this provides evidence of increasing Australia-born movement out of Australia on a long-term basis. Between 1998–99 and 2001–02 there was an increase in the number of long-term departures from Australia from 140 281 to 171 446 persons (22.2 per cent). It will be noted however, that there was a small decline in 2002–03 to 169 100 persons (1.4 per cent) perhaps reflecting some impact of the SARS
62

A new paradigm of international migration: implications for migration policy and planning in Australia
epidemic and the shifting global security situation. The number of long-term departures who were Australian residents increased each year between 1993 and 2001 from 64 786 to 92 960. Subsequently however, it fell to 82 900 by 2003. There were net losses by long-term migration among Australian residents between 1998 and 2002 but a gain in 2002–03.
Figure 17: Australian resident long-term departures from Australia, 1959–60 to 2002–03
0
10000
20000
30000
40000
50000
60000
70000
80000
90000
100000
1959
-60
1961
-62
1963
-64
1965
-66
1967
-68
1969
-70
1971
-72
1973
-74
1975
-76
1977
-78
1979
-80
1981
-82
1983
-84
1985
-86
1987
-88
1989
-90
1991
-92
1993
-94
1995
-96
1997
-98
1999
-200
0
2001
-02
Year
Num
ber
Source: DIMIA, Australian Immigration: Consolidated Statistics and Immigration Update, various issues; DIMIA unpublished data
Settler loss has been an important feature of the post-war Australian migration scene with more than a fifth of all post-war settlers subsequently emigrating from Australia, most of them returning to their home nation. There has been concern about this settler loss among policy makers but it has a number of components including a group of migrants who never intended to settle permanently in Australia as well as people who are influenced by family changes, are not able to adjust to life in Australia, etc. The pattern of settler loss, while it varies between birthplace groups (e.g. it is high among New Zealanders but low among Vietnamese), has tended to remain a relatively consistent feature of the post-war migration scene in Australia and the fluctuations in its numbers are very much related to earlier levels of immigration. With an increase in the skill profile in immigration we can expect an increase in settler loss since skilled migrants have a greater chance of remigrating than family migrants. The recent upswing in settler loss—increasing by 38.8 per cent between 1998–9 and 2002–2003—would tend to support this. This is especially the case since the level of immigration was comparatively low in the mid-1990s and trends in settler loss in the past have tended to mirror immigration trends offset by around five years.74
Nevertheless, there has been a change in the level of out-movement of Australian residents with a consistent increase being in evidence. This has begun to attract policy attention since the profile of departures of residents tends to be younger and more educated than the population of the nation as a whole and the spectre of ‘brain drain’ has arisen.75 There can
63

A New Paradigm of International Migration: Implications for Migration Policy and Planning in Australia
be no doubt that the global international migration system with respect to highly skilled labour has been transformed since the 1960s, when the first ‘brain drain’ research was undertaken. Findlay has summarised the situation as follows:
… professional transients are replacing settler migrants in the international migration systems of many countries. Where settler emigration is still permitted, it is skilled migrants who find it easiest and quickest to receive work and residence permits ... Most nations, however, do not continue to favour large scale settler migration and instead seek to meet specific skill shortages by permitting (if not promoting) transient skill movements. The transient skill flows already dominate the migration systems of some countries such as the United Kingdom ... They involve the international circulation of high level manpower between countries, with the migrants neither seeking nor being encouraged to remain in any particular place for a long time period. Foreign assignments are commonly for one to three years ... Given the circulatory nature of these high level manpower movements, it has been suggested that these migration moves be seen as skill exchanges rather than brain drain.76
Whereas in the 1960s the dominant form of professional international migration tended to involve permanent migration from less developed to more developed nations, the current situation tends to be characterised by the transilience of such groups, that is, hyper mobility involving remigration and return.77 Seen in this context, it is somewhat unrealistic to expect that Australia will be isolated from this process and have its international migration of skilled groups dominated by traditional settler emigration movements. The greatly increased significance of transilience in skilled labour movements has been encouraged by a number of developments over the last decade or so:
• many highly skilled regional and national labour markets have been usurped by labour markets which overlap international boundaries
• the internationalisation of capital
• the exponential development of exchanges of all types through the development of communications
• the reduction in real time and money costs of travel
• the development of multinational corporations.
In the Australian context, the increasing tempo of emigration of Australian-born professionals may to some extent be due to Australia’s increasing incorporation into these international migration systems as well as a function of economic conditions within the country. Of course the situation should be monitored and subjected to detailed study, but there are a number of possible (and in several cases, probable) positive developments for the Australian economy which could accrue from this movement:
• most of the movement is not permanent in that many expatriate workers eventually return to Australia
64

A new paradigm of international migration: implications for migration policy and planning in Australia
• most of the migrants are remitting substantial sums of foreign exchange to Australia-based families, investments and bank accounts
• the extension of the skills and experience of the Australian workers involved
• the linkages which this is establishing between Australians and Australian companies and their overseas counterparts and markets will further assist in embedding Australia’s economy internationally, and
• it may be creating opportunities for Australian companies to supply goods and services to other countries because the Australian expatriate workers will be most familiar with Australian-based suppliers.
An increasing percentage of the outflow of Australians is to Asia and we may be seeing some integration of particular labour markets between Australia and some Asian countries. This has many significant implications for Australia in a number of areas and the emigration associated with it needs closer investigation. It is crucial for Australia to monitor the situation in Asia for its implications for international migration to and from Australia. On the one hand, there are the issues of skilled labour shortage in several nations which will have implications for emigration of one kind or another from Australia. In addition, in other nations there are surpluses of educated workers in some fields, due largely to mismatches in the output of the education systems and the specialised demands for employment in the economies of those nations. The latter forces will put pressures on immigration to Australia and other destination countries. These apparent contradictory forces in Asia are a function of the diversity of the region and the enormous differences between Asian countries with respect to labour surpluses and shortages. However, they are also related to emerging demands for particular skills in the rapidly growing economies of the region, which cannot be supplied immediately by their national education systems. Moreover, in many countries human resource development policies are mismatched with, and lagging behind, the rapidly changing labour market situation. This is producing a complex situation where, between and even within individual Asian countries, there are strong tendencies toward producing both immigration and emigration on significant levels.
It is estimated that the size of the Australian diaspora is around 900 000 persons and Table 34 indicates that this is equivalent to over 4 per cent of the national population. Australia’s diaspora is not only large in relation to the national resident population, it is highly selective in terms of education, income and age. For example a recent article in Business Review Weekly showed how Australians are strongly over-represented among chief executives of major global companies and organisations.78 Australian expatriates are forming more networks not only for business purposes but also to lobby for causes and issues which affect them like voting, taxation, superannuation, citizenship, etc.
65

A New Paradigm of International Migration: Implications for Migration Policy and Planning in Australia
Table 34: National diasporas in relation to resident national populations USA: 7 million – 2.5 percent of national population Australia: 900 000 – 4.3 percent of national population New Zealand: 850 000 – 21.9 percent of national population Philippines: 7.6 million – 9.4 percent of national population Source: US Census Bureau, Team 7 Final Report and Conference on an Enumeration of
Americans Overseas in the 2010 Census, 2002; Southern Cross, Estimates of Australian citizens living overseas as at 31 December 2001, 2002; R Bedford, Reflections on the spatial odysseys of New Zealanders, 2001; Commission of Filipinos Overseas, Personal communication, 4 February 2004.
Major countries of emigration such as Italy (formerly) and the Philippines (currently) have developed programs and strategies relating to their diasporas and the World Bank and other multilateral agencies are now looking at diasporas as being the key to development in origin nations. Despite the size and highly selective nature of its national diaspora, Australia has not developed a policy or set of programs toward its expatriates. Nationally, there is a debate about the issue of ‘brain-drain’. Some commentators point out currently that Australia most definitely experiences a ‘brain gain’ in that it records substantial net migration gains in all high skill occupational categories and in terms of people with high levels of qualifications.79 Others consider that it is not a simple numbers game and that Australia is experiencing a net loss of the ‘brightest and the best’ especially among our top homegrown scientists, innovators and business people. The reality is that we do not have sufficient information to test the latter proposition.
In late 2003 the Australian Senate’s Legal and Constitutional References Committee announced the setting up of an Inquiry into Australian Expatriates with the terms of reference as indicated in Table 35.
Table 35: Terms of Reference of the Australian Senate’s Legal and Constitutional References Committee Inquiry into Australian Expatriates . The extent of the diaspora . Factors driving Australians to live overseas . Costs, benefits, opportunities . Needs and concerns of overseas Australians . Policies/Programs in other countries to respond to needs . Ways they can be better used to promote Australia’s economic, social and cultural interests
This Senate Inquiry for the first time addresses in a substantial way the issue of Australia’s diaspora and it is hoped that it develops a clear policy with respect to it. Undoubtedly the formation of the Senate Inquiry has been in response to lobbying from such active expatriate networks as Southern Cross and Young Australian Professionals in America which have been highly effective in mobilizing modern information technology to organize large numbers of Australian expatriates across many nations. Figure 18 shows the approximate distribution of Australian expatriates across the globe.
66

A new paradigm of international migration: implications for migration policy and planning in Australia
A recent report has argued that Australia would benefit from developing a diaspora policy.80 It is argued that rather than argue as to whether Australia is experiencing a ‘brain drain’ or a ‘brain gain’ it needs to be recognized that as a small and peripheral nation (in the global economy), Australia has a lot to gain from experiencing a ‘Brain Circulation’ in which Australian skilled people go overseas and in which Australia receives skilled people from other countries. It argues that Australia, in order to achieve this, needs an international migration policy which embraces not only immigration but also emigration and especially circulation. This policy can be characterized as the four ‘R’s:
• Recruitment: Australia needs to build on its excellent and sustained record of recruiting high skilled persons. There needs to be a public debate about the impact of this on less developed nations and also associated policies considered which recompense the origin areas but also facilitate the immigrants having maximum developmental benefits on their home country.81
• Retention: Australia must ensure that there are opportunities for the small number among the ‘brightest and the best’ Australians to work productively and effectively in Australia so that they do not feel that it is absolutely essential for them to leave the country permanently to achieve their potential.
• Return: We must realize that there is much to gain from young Australians leaving Australia and acquiring experience, knowledge and connections in foreign nations. If a substantial proportion can return, the country can gain a double dividend —not just retaining their talents but having those talents enhanced during the period away.
• Re-engagement: It is apparent that many Australians resident overseas on a permanent or long-term basis still feel a strong sense of belonging to Australia and a deep concern for its wellbeing. There does appear to be a range of ways in which the expatriate community can be incorporated more into Australia. On a cultural level, it is important that expatriates who still consider themselves Australian are included more in the mainstream of Australian life. On an economic level, there are a myriad of ways in which the expertise, experience and contacts of the diaspora can be harnessed to benefit Australia in a rapidly globalising economy.
Accordingly, part of the New Migration undoubtedly is the whole issue of emigration and diaspora. There are no simple blueprints to follow to develop an effective policy in this area. There are many examples of diaspora related programs, reverse brain drain programs, expatriate intellectual networks, etc. but a great deal of innovatory and new thinking will need to go into the development of such a policy for Australia if it is to be effective.
67

A New Paradigm of International Migration: Implications for Migration Policy and Planning in Australia
Figure 18: Australian citizens living abroad, 31 December 2001
0 kms 3000
PacificIslands
200,000
100,000
50,000
<5,0001,000
NUMBER OF RESIDENTS
Source: Southern Cross, Estimates of Australian citizens living overseas as at 31 December 2001, 2002
Conclusion There is no doubt that the last few years have seen a transformation of the scale, characteristics and significance of international population movements. This demands a continuous reassessment of Australia’s immigration policy and program as well as a full assessment of the global situation impinging on population movements to and from Australia. Australia can no longer confine its consideration of immigration to what is happening in Australia. The globalisation of capital, the transformation of international travel and communications systems, the instant worldwide distribution of information, the increasing levels of education, the internationalisation of many labour markets and the creation of political and environmental refugees, are among only a few of the processes and trends which are producing an exponential increase in all forms of international population movements and opening up such movement to a much broader spectrum of the world’s population. As Richmond has eloquently shown, no nation can isolate itself from the global system of which population movement is an important part.82 These changes not only have important implications for people wishing to come to Australia, but also for Australian residents wishing to move elsewhere.
Australia is being influenced by a new paradigm of international population movement in the 21st Century. In the 1950s, 1960s and early 1970s the bulk of migrants to Australia came to settle permanently and made only intermittent visits to their country of origin to visit family and friends. Non-permanent movements into Australia are becoming of
68
A new paradigm of international migration: implications for migration policy and planning in Australia
greater significance and in some respects are meeting the needs previously met by permanent settlement. Clearly, these temporary movements have a significant effect on demand for goods and services, pressure on resources, employment and the environment.
However, even among the ‘permanent’ arrivals it can be anticipated that there will be more coming and going than was the case with their counterparts in earlier decades. This is a function of several factors:
• the internationalisation of many labour markets
• the closeness of many of the origin countries of the 1990s (e.g. New Zealand, Southeast Asia) compared with the European origins which dominated in the early years
• the relative cheapness of air travel, and
• the increased significance of business migration, which relies on the maintenance of a strong economic as well as social linkages with the home country.
This shift in the pattern of immigration also impinges on movement out of the country. We must adjust to the new pattern of movement and maximise its advantages for Australia.
The new widespread consciousness of international migration being an option for people to improve their life chances has great implications for Australia in its location on the edge of the Asia-Pacific region. There has been considerable attention paid to the changes in this region, which are likely to produce more pressure for immigration to Australia. From an Australian perspective it is crucial that any future developments of Australian immigration policy and variations in the immigration program should be undertaken with full appreciation of the rapidly changing international migration situation, especially with the Asian region. This is imperative for the maintenance of good relationships with other Asian nations, to be fair and equitable to all potential immigrants and to safeguard the wellbeing of resident Australians.
All of the world’s nations are facing challenges associated with the new global regime of international migration in what has been termed the ‘Age of Migration’.83 However, few are as well positioned to meet those challenges as Australia. The long experience as a ‘country of immigration’, especially during the post-Second World War era, has given Australia an almost unique capacity not only to cope with new migration pressures but also to develop policy and program approaches which maximise the benefit of those developments. Australia has developed a culture of migration in which there is broad acceptance in the community of the benefits that immigration can deliver. This contrasts sharply with community attitudes in many nations. Moreover, Australian politicians have developed a more sophisticated understanding of the issues surrounding migration and settlement than in most other nations so that the capacity to formulate, develop, introduce and operate sound and effective policy is considerable. Finally, it is often overlooked that Australia is one of very few nations that has had a federal government department devoted to immigration and settlement for more than half a century. This has meant that there has been the development of a skilled and committed cadre of ‘immigration bureaucrats’ over
69

A New Paradigm of International Migration: Implications for Migration Policy and Planning in Australia
a number of generations. This substantial body of people with a level of professionalism, knowledge and experience gives Australia a huge advantage in confronting the challenges created by the New Migration. The need for ‘Management of Migration’ has become the mantra emerging from international fora, conferences, summits and meetings concerned with international migration. However, an essential element in any migration management is the availability of human resources, institutions and infrastructure to develop and operate effective management strategies and Australia is extremely well positioned in that respect.
All immigration policy formulation in Australia should be undertaken in full recognition of the fact that the world immigration situation of the 21st Century is totally new. It is part of a set of powerful international processes which are creating strong new political, economic, financial, cultural and information linkages between countries. These forces of globalisation are crucial to an understanding of changing global immigration trends. To view immigration as an autonomous process in isolation from other international flows and linkages could lead to the development of irrelevant and ineffective policies. Sassen, in discussing the situation in the United States, has put this argument very strongly:
The Achilles’ heel of US immigration policy has been its insistence on viewing immigration as an autonomous process unrelated to other international processes. It should be clear by now that powerful international forces are at work behind the outflow of emigrants from the developing world and the influx of immigrants into the United States.84
While this may be a somewhat extreme statement, it does correctly draw attention to the fact that policies relating to international migration must take account of it being an integral part of a complex system of flows and linkages between countries. Australia’s policies relating to immigration cannot be formulated in isolation from other policies and relationships with those countries.
Endnotes
1. United Nations, International migration 2002, United Nations, New York, 2002.
2. Along with New York.
3. United Nations, op. cit.
4. For a recent example see a discussion of the recruitment of African doctors to work in rural Australia, ML Scott, A Whelan, J Dewdney and AB Zwi, ‘“Brain drain” or ethical recruitment’, Medical Journal of Australia, vol. 180, no. 4, 2004, pp. 174–176.
5. Total global international remittance flows are estimated to be US$100 billion and much larger than total Foreign Developmental Assistance. GJ Hugo, ‘Migration and development: a perspective from Asia’, IOM Migration Research Series no. 14, 2003.
6. H Zlotnik, ‘Trends of international migration since 1965: what existing data reveal’, International Migration, vol. 37, no. 1, 1999, pp. 21–62; S Sassen, The global city, 2nd ed., Princeton University Press, New York, 2001; S Castles, and M Miller, The age of migration:
70

A new paradigm of international migration: implications for migration policy and planning in Australia
international population movements in the modern world, 2nd ed., Macmillan, London, 1998; DS Massey et al., ‘Theories of international migration: an integration and appraisal’, Population and Development Review, vol. 19, no. 3, 1993, pp. 431–466. (Reprinted by International Union for the Scientific Study of Population); DS Massey et al., Worlds in motion: understanding international migration at the end of the millennium, Clarendon Press, Oxford, 1998; A Portes, ‘Immigration theory for a new century: some problems and opportunities’, International Migration Review, vol. 31, no. 4, 1997, pp. 799–825; E Meyers, ‘Theories of international immigration policy: a comparative perspective’, International Migration Review, vol. 34, no. 4, pp. 1245-1282 2000.
7. S Castles, ‘International migration at the beginning of the twenty first century: global trends and issues’, International Social Science Journal, vol. 165, 2000, pp. 269–281.
8. However, before 1974 former settlers were not classified as emigrants unless they had been in Australia for at least 12 months.
9. GJ Hugo, The economic implications of emigration from Australia, AGPS, Canberra, 1994, chapter three.
10. H Zlotnik, ‘The concept of international migration as reflected in data collection systems’, International Migration Review, Special Issue, vol. 21, 1987, pp. 933–34.
11. SE Khoo, Census 86: data quality—ancestry, Australian Bureau of Statistics, Canberra, 1989.
12. R Kippen and P McDonald, ‘Australia’s population in 2000: the way we are and the ways we might have been’, People and Place, vol. 8, no. 3, 2000, pp. 10–17.
13. GJ Hugo, D Rudd and K Harris, ‘Emigration from Australia: economic implications’, CEDA Information Paper no. 77, CEDA, Melbourne, 2001; Australia, Parliament, Report by the Committee of Inquiry into the Temporary Entry of Business People and Highly Skilled Specialists, 1995; B Birrell, ‘An evaluation of recent changes to the roles governing the entry into Australia of skilled business persons and doctors for temporary employment’, Paper presented at Australian Population Association 9th National Conference 1998.
14. A Rizvi, SOPEMI 2003: Australia, Report by Australia’s Correspondent to SOPEMI, November, 2002.
15. C Price, P Pyne and B Derrick, ‘Long-term migration: home visitors and transilients’, pp. 50–59 in CA Price (ed.), Australian Immigration: A Bibliography and Digest, ANU Press, Canberra, 1981.
16. P Boyle, ‘Population geography: transnationalism women on the move’, Progress in Human Geography, vol. 26, no. 4, 2002, p. 533.
17. M Wooden, R Holton, G Hugo and R Sloan, Australian immigration: a survey of the issues, AGPS, Canberra 1994; S Castles, W Foster, R Iredale and G Withers, Immigration and Australia: myths and realities, Allen and Unwin, Sydney, 1998; J Jupp, From White Australia to Woomera: the story of Australian immigration, Cambridge University Press, Cambridge, 2002.
18. I Dobson, ‘Overseas students in Australian higher education: trends to 1996’, People and Place, vol. 5, no. 1, 1997, pp. 24–29; B Kinnaird, ‘Working holiday makers: more than tourists—Implications of the Report of the Joint Standing Committee on Migration, People
71

A New Paradigm of International Migration: Implications for Migration Policy and Planning in Australia
and Place, vol. 7, no. 1, 1999, pp. 39–52; GJ Hugo, ‘International migration and agricultural labour in Australia’, Paper presented at Changing Face Workshop, Imperial Valley, California, 16–18 January 2001; B Birrell and E Healy, ‘Globalisation and temporary entry’, People and Place, vol. 5, no. 4, 1997, pp. 43–52; B Kinnaird, ‘Australia’s Migration Policy and skilled ICT professionals: the case for an overhaul’, People and Place, vol. 10, no. 2, 2002, pp. 55–69; R Iredale, ‘The need to import skilled personnel: factors favouring and hindering its international mobility’, International Migration, vol. 37, no. 1, 1999, pp. 89–124; R Iredale, ‘Migration policies for the highly skilled in the Asia-Pacific Region’, International Migration Review, vol. 34, no. 3, 2000, pp. 82–906.
19. MM Kent and M Mather, ‘What drives US population growth’, Population Bulletin, vol. 57, no. 4, 2002, p. 21.
20. N Glick Schiller, L Basch and C Szanton Blanc, ‘From immigrant to transmigrant: theorizing transnational migration’, Anthropological Quarterly, vol. 68, 1995, p. 48.
21. C Blanc, L Basch and N Glick Schiller, ‘Transnationalism, nation states and culture’, Current Anthropology, vol. 36, no. 4, 1995, pp. 683–86; L Basch, N Glick Schiller and C Blanc, Nations unbound: transnational projects, postcolonial predicaments and deterritorialised nation states, Gordon and Breach, New York, 1996.
22. For example, Organisation for Economic Co-operation and Development (OECD), ‘International mobility of the highly skilled’, OECD Proceedings, OECD, Paris, 2002; J Salt, International movements of the highly skilled labour, OECD, Paris, 1997; J Peixoto, ‘The international mobility of highly skilled workers in transnational corporations: the macro and micro factors of the organizational migration of cadres’, International Migration Review, vol. 35, no. 4, 2001, pp. 1030–1053; K Koser and J Salt, ‘Research Review 4: the geography of highly skilled international migration’, International Journal of Population Geography, vol. 3, no. 4, 1997, pp. 285–304.
23. Organisation for Economic Co-operation and Development (OECD), International mobility of the highly skilled, op. cit.
24. Hugo, ‘International migration and agricultural labour in Australia’, op. cit.
25. J Shu and L Hawthorne, ‘Asian student migration to Australia’, International Migration vol. 24, no. 1, 1996, pp. 65–96.
26. Department of Employment, Education and Training (DEETYA), Overseas student statistics 1994, AGPS, Canberra, 1995; Department of Education, Training and Youth Affairs (DETYA), Overseas student statistics 2000, AGPS, Canberra, 2002.
27. Australia, Parliament, Joint Standing Committee on Migration, Working holiday makers: more than tourists, August 1997, Australian Government Publishing Service, Canberra, 1997, Hhttp://www.aph.gov.au/house/committee/mig/report/holiday.pdfH
28. Kinnaird, ‘Working holiday makers: more than tourists—implications of the Report of the Joint Standing Committee on Migration’, op. cit.
29. Rizvi, SOPEMI 2004: Australia, op. cit., p. 33.
30. A Rizvi, SOPEMI 2003: Australia, Report by Australia’s Correspondent to SOPEMI, November 2002, p. 45.
72

A new paradigm of international migration: implications for migration policy and planning in Australia
31. ibid.
32. Rizvi, SOPEMI 2004: Australia, op. cit., p. 37.
33. ibid.
34. Department of Immigration and Multicultural and Indigenous Affairs (DIMIA), Immigration, population and citizenship digest, DIMIA, Canberra, 2002, p. 53. These figures do not include New Zealand citizens.
35. S Khoo and P McDonald, Category jumping: trends, demographic impact and measurement issues, Report to the Department of Immigration and Multicultural and Indigenous Affairs (DIMIA) and the Australian Bureau of Statistics (ABS), Canberra, 2000 Hwww.immi.gov.au/statistics/publications/category_jumping/catjump.pdfH; Australian Bureau of Statistics (ABS), ‘Estimated resident population and measurement of category jumping’, Demography Working Paper 2003/1, ABS, Canberra, 2003.
36. P McDonald, S Khoo and R Kippen, ‘Alternative net migration estimates for Australia: exploding the myth of rapid increase in numbers’, People and Place, vol. 11, no. 3, 2003, pp. 23–26.
37. ibid.
38. P Ruddock, ‘Record temporary entrants contribute to economy’, DIMIA Media Release MPS 1/2002, DIMIA, Canberra, 2002.
39. GJ Hugo, ‘Temporary migration to Australia: trends and implications’ Paper prepared for Annual Conference of New Zealand Geographical Society, Auckland, New Zealand, July 2003.
40. ibid.
41. GJ Hugo, ‘International migration and labour markets in Asia: Australia Country Paper 2003’ Paper prepared for the Ninth Workshop on International Migration and Labour Markets in Asia organised by the Japan Institute of Labour (JIL) supported by the Government of Japan, Organisation for Economic Cooperation and Development (OECD) and the International Labour Office (ILO), Japan Institute of Labour, Tokyo, 6–7 February 2003; GJ Hugo, ‘International migration and labour markets in Asia: Australia Country Paper 2004’ Paper prepared for the Tenth Workshop on International Migration and Labour Markets in Asia organized by the Japan Institute for Labor Policy and Training (JILPT) supported by the Government of Japan, Organisation for Economic Cooperation and Development (OECD) and the International Labour Office (ILO), Tokyo, 5–6 February 2004.
42. P Mares, Borderline: Australia’s treatment of refugees and asylum seekers, UNSW Press, Sydney 2001, pp. 24–25.
43. GJ Hugo, ‘From compassion to compliance?: trends in refugee and humanitarian migration in Australia’, GeoJournal vol. 56, 2002, pp. 27–37.
44. GJ Hugo, ‘Unauthorised international population mobility in Southeast Asia: A Review’ Paper for Regional Ministerial Conference on People Smuggling, Trafficking in Persons and Related Transnational Crime, February 2002.
73

A New Paradigm of International Migration: Implications for Migration Policy and Planning in Australia
45. Department of Immigration and Multicultural and Indigenous Affairs (DIMIA), ‘Locating overstayers in Australia’, Fact Sheet 80, DIMIA, Canberra, 2002; Rizvi, SOPEMI 2004: Australia, op. cit., p. 75; Rizvi, SOPEMI 2003: Australia, op. cit., p. 51.
46. Rizvi, SOPEMI 2003: Australia, op. cit., p. 50.
47. The ‘term was originally coined to describe people fleeing Vietnam after communist forces reunified the country in 1975. In Australia it has come to be applied to anyone who arrives in the country by boat in an unauthorised manner. Some people find the term pejorative, however it is a useful and apt description and now used widely’, Mares, op. cit., pp. x–xi.
48. N Viviani, The Indochinese in Australia, 1975–1995, Oxford University Press, Melbourne, 1996, p. 159.
49. GJ Hugo, ‘Australian Immigration Policy: the significance of the events of 11th September’, International Migration Review vol. 36, no. 1, Spring 2002.
50. Note: this excludes New Zealanders (15 850) and Humanitarian arrivals (12 525).
51. Rizvi, SOPEMI 2004: Australia, op. cit., p. 21.
52. Rizvi, SOPEMI 2003: Australia, op. cit. p. 21.
53. D Cobb-Clark, ‘Do selection criteria make a difference? visa category and the labour force status of Australian Immigrants’, Discussion Paper no. 397, Centre for Economic Policy Research, The Australian National University, 1999; D Cobb-Clark and B Chapman,. The changing pattern of immigrants labour market experiences, Discussion Paper no. 396, Centre for Economic Policy Research, The Australian National University, 1999; S Richardson, F Robertson and D Ilsley, The labour force experience of new migrants, AGPS, Canberra, 2001; B Birrell, IR Dobson, V Rapson and TF Smith, Skilled labour: gains and losses, DIMIA, Canberra, 2001.
54. S Martin, ‘Regional patterns of international migration: North American present and future’ Paper presented at Tenth Workshop on International Migration and Labour Markets in Asia organized by the Japan Institute of Labour, Tokyo, 5–6 February 2004; E Ruddick, ‘Immigrant economic performance—a new paradigm in a changing labour market’, Canadian Issues, April 2003.
55. GJ Hugo, ‘Recent Trends in Internal Migration and Population Redistribution in Australia’ Paper prepared for presentation at the Population Association of America 2003 Annual Meeting, Minneapolis, 1–3 May 2003.
56. M Bell and GJ Hugo, Internal Migration in Australia 1991–1996, Overview and the Australia-born, AGPS, Canberra, 2000, chapter 8.
57. GJ Hugo, ‘Regional development through immigration? the reality behind the rhetoric’, Research Paper no. 9 1999–2000, Department of Parliamentary Library, Information and Research Services, Canberra, 1999.
58. P Eden, P Fredriksson and O Aslund, ‘Settlement policies and the economic success of immigrants’, Journal of Population Economics, vol. 17, 2004, pp. 133–155.
59. Rizvi, SOPEMI 2004: Australia, op. cit.
74

A new paradigm of international migration: implications for migration policy and planning in Australia
60. Rizvi, SOPEMI 2003: Australia, op. cit., pp. 24–27.
61. Rizvi, SOPEMI 2004: Australia, op. cit., p. 26.
62. G Withers and M Powell, ‘Immigration and the regions: taking regional Australia seriously’ A report prepared for the Chifley Research Centre by Applied Economics P/L, October 2003.
63. B Birrell, ‘Redistributing migrants: the Labor agenda’, People and Place, vol. 11, no. 4, 2003, p. 20.
64. ibid., pp. 20-21.
65. Australian Labor Party, ‘Smarter settlement of new migrants can benefit all’, ALP News Statements, 4 October 2003: Hhttp://www.alp.org.au//media/1003/20005954.htmlH
66. Withers and Powell, ‘Immigration and the regions: taking regional Australia seriously’, op. cit.
67. Migration Policy Institute (MPI), ‘A new century: immigrants and the U.S.’, Migration Information Source, May 2002. Hhttp://www.migrationinformation.org/feature/print.cfm?ID=6H
68. Birrell, ‘Redistributing migrants: the Labor agenda’, op. cit.
69. Department of Immigration and Multicultural and Indigenous Affairs (DIMIA), ‘Record temporary entrants contribute to economy’, Media Release 2002, http:www.minister.immi.gov.au/media_releases/media02/r02001.htm
70. This visa category allows for a period of residence in Australia of up to four years. Applicants are sponsored by employers in Australia.
71. Rizvi, SOPEMI 2003: Australia, op. cit., p. 25.
72. Advertiser, 11 March 2003, p. 15; G Harding and E Webster, The working holiday maker scheme and the Australian labour market, Melbourne Institute of Applied Economic and Social Research, University of Melbourne, 2002, p. 25.
73. GJ Hugo, D Rudd and K Harris, ‘Emigration from Australia: economic implications’, CEDA Information Paper no. 77, CEDA, Melbourne, 2001.
74. GJ Hugo, The economic implications of emigration from Australia, op. cit.
75. GJ Hugo, D Rudd and K Harris, ‘Australia’s diaspora: it’s size, nature and policy implications’, CEDA Information Paper no. 80, CEDA, Melbourne, 2003.
76. AM Findlay, ‘A migration channels approach to the study of high level manpower movements: a theoretical perspective’, International Migration, vol. 28, no. 1, 1990, p. 15.
77. AJ Richmond, ‘International migration and global change’ Paper presented at International Conference on Migration, Centre for Advanced Studies, Faculty of Arts and Social Sciences, National University of Singapore, February 1991, p. 4.
78. D James, ‘Faces in a global gallery’, Business Review Weekly, 19 February, 2004, p. 66.
79. For example, B Birrell, IR Dobson, V Rapson and TF Smith, Skilled labour: gains and losses, DIMIA, Canberra, 2001.
80. Hugo, Rudd and Harris, Australia’s diaspora: it’s size, nature and policy implications, op. cit.
75

A New Paradigm of International Migration: Implications for Migration Policy and Planning in Australia
81. GJ Hugo, ‘Migration and development: a perspective from Asia’, IOM Migration Research Series no. 14, 2003.
82. Richmond, ‘International migration and global change’ op.cit. (Richmond 1991)
83. Castles and Miller, The age of migration: international population movements in the modern world, op. cit.
84. S Sassen, ‘America’s immigration “problem”’, World Policy Journal vol. 6, no. 4, 1989, p. 828.
76

A new paradigm of international migration: implications for migration policy and planning in Australia
Appendix: Definitions of Australian state specific and regional migration schemes RSMS (Regional Sponsored Migration Scheme) is designed to help more employers
operating businesses in regional areas fill skilled vacancies which cannot be filled from the local labour market. It covers all Australia except for Sydney, Melbourne, Brisbane, Perth, Gold Coast, Newcastle and Wollongong.
STNI (State/Territory Nominated Independent Scheme) enables States and Territories to nominate skilled-independent category applicants who are willing to settle in States/Territories where their skills are in demand. Only South Australia and Victoria are major users (with Adelaide and Melbourne the main locations).
SDAS (Skilled – Designated Area Sponsored). Families living in designated regional areas can sponsor skilled close relatives to migrate and settle in these areas. Unlike RSMS, regional linked SDAS does not impose a requirement that the migrant locates in the designated area where the sponsoring relative is located. Designated areas include all of Australia except Sydney, Wollongong, Newcastle, Brisbane and Perth.
SAL (Skilled Australian Linked) is now know as Skilled Australian Sponsored. Relatives sponsored under this category must pass the same selection test as skilled-independent migrants – though with bonus points for sponsorship. Only migrants who obtained bonus points because their sponsor lived in a designated area are shown in the table.
SSBS (State Sponsored Business Skills) is a scheme where States and Territories can sponsor business skills applicants applying to migrate as business owners or senior executives. Those shown above include applicants processed under offshore subclass 29 (State/Terr. Sponsored Business Owner), offshore subclass 130 (State/Terr. Sponsored Senior Executive), onshore subclass 842 (State/Terr. Sponsored Senior Executive).
REBA (Regional Established Business in Australia) allows people temporarily in Australia on Business (Long Stay) visas to apply onshore for permanent residence if they have successfully established a business venture in a designated area of Australia.
Source: Birrell 2003
77

A New Paradigm of International Migration: Implications for Migration Policy and Planning in Australia
Bibliography Australian Bureau of Statistics (ABS), Australian Demographic Statistics June Quarter 2000,
Catalogue No. 3101.0, ABS, Canberra, 2000. Australian Bureau of Statistics (ABS), Australian Demographic Statistics June Quarter 2002,
Catalogue No. 3101.0, ABS, Canberra, 2002. Australian Bureau of Statistics (ABS), Australian Demographic Statistics June Quarter 2003,
Catalogue No. 3101.0, ABS, Canberra, 2003. Australian Bureau of Statistics (ABS), ‘Estimated resident population and measurement of
category jumping’, Demography Working Paper, 2003/1, ABS, Canberra, 2003. Australian Bureau of Statistics (ABS), How Australia Takes a Census, Catalogue No. 2903.0,
ABS, Canberra, 2000. Australian Bureau of Statistics (ABS), Migration Australia, various issues, ABS, Canberra. Australian Labor Party, ‘Smarter settlement of new migrants can benefit all’, ALP News
Statements, 4 October 2003. http://www.alp.org.au//media/1003/20005954.htmlAustralian Refugee Council, ‘Position on Temporary Protection Visas, November 1999’, Position
Paper, 2000, www.refugeecouncil.org.au/position 01111999.htm. Basch, L, Glick Schiller, N, and Blanc, C, Nations unbound: transnational projects, postcolonial
predicaments and deterritorialised nation states, Gordon and Breach, New York, 1996. Bedford, R, ‘Reflections on the spatial odysseys of New Zealanders’, Briefing Paper no. 2, New
Directions Seminar, April 2001. Bell, M. and GJ Hugo, Internal migration in Australia 1991–1996, overview and the Australia-
born, AGPS, Canberra, 2000. Birrell, B, An evaluation of recent changes to the roles governing the entry into Australia of skilled
business persons and doctors for temporary employment, Paper presented at Australian Population Association, 9th National Conference 1998.
Birrell, B, ‘Redistributing migrants: the Labour sgenda’, People and Place, vol. 11, no. 4, 2003, pp. 15–26.
Birrell, B and E Healy, ‘Globalisation and Temporary Entry’, People and Place, vol. 5, no. 4, pp. 43–52, 1997.
Birrell, B, IR Dobson, V Rapson and TF Smith, Skilled labour: gains and losses, DIMIA, Canberra, 2001.
Blanc, C, L Basch, and N Glick Schiller, ‘Transnationalism, nation states and culture’, Current Anthropology, vol. 36, no. 4, 1995, pp. 683–86.
Boyle, P, ‘Population geography: transnationalism women on the move’, Progress in Human Geography, 2002, vol. 26, no. 4, pp. 531–45.
Bureau of Immigration and Population Research (BIMPR), Immigration Update, June Quarter 1992, AGPS, Canberra, 1993.
Castles, S, ‘International Migration at the Beginning of the Twenty First Century: Global Trends and Issues’, International Social Science Journal, vol. 165, 2000, pp. 269–281.
Castles, S and M Miller, The Age of Migration: International Population Movements in the Modern World, 2nd ed., Macmillan, London, 1998.
78
A new paradigm of international migration: implications for migration policy and planning in Australia
Castles, S, W Foster, R Iredale, and G Withers, Immigration and Australia: Myths and Realities, Allen and Unwin, Sydney, 1998.
Cobb-Clark, D, ‘Do Selection Criteria Make A Difference? Visa Category and the Labour Force Status of Australian Immigrants’, Discussion Paper no. 397, Centre for Economic Policy Research, The Australian National University, 1999.
Cobb-Clark, D and B Chapman, ‘The Changing Pattern of Immigrants Labour Market Experiences’, Discussion Paper no. 396, Centre for Economic Policy Research, The Australian National University, 1999.
Committee of Inquiry into the Temporary Entry of Business People and Highly Skilled Specialists, Business Temporary Entrants: Future Directions, AGPS, Canberra, 1995.
Department of Employment, Education and Training (DEETYA), Overseas student statistics 1994, AGPS, Canberra, 1995.
Department of Education, Training and Youth Affairs (DETYA), Overseas student statistics 2000, AGPS, Canberra, 2002.
Department of Education, Training and Youth Affairs (DETYA). Students: selected higher educations statistics, various issues, AGPS, Canberra.
Department of Immigration and Multicultural Affairs (DIMA), Population flows: immigration aspects, 2000 ed., DIMA, Canberra, 2000.
Department of Immigration and Multicultural and Indigenous Affairs (DIMIA). Australian Immigration: Consolidated Statistics, various issues, DIMIA, Canberra.
Department of Immigration and Multicultural and Indigenous Affairs (DIMIA), Immigration, population and citizenship digest, DIMIA, Canberra, 2003.
Department of Immigration and Multicultural and Indigenous Affairs (DIMIA), Immigration Update, various issues, DIMIA, Canberra.
Department of Immigration and Multicultural and Indigenous Affairs (DIMIA), ‘Locating overstayers in Australia’, Fact Sheet 80, DIMIA, Canberra, 2002.
Department of Immigration and Multicultural and Indigenous Affairs (DIMIA), ‘Migration Program planning levels’, Fact Sheet 20, DIMIA, Canberra, 2003.
Department of Immigration and Multicultural and Indigenous Affairs (DIMIA), Population flows: immigration aspects, various issues, DIMIA, Canberra..
Department of Immigration and Multicultural and Indigenous Affairs (DIMIA), Population flows: immigration aspects, AGPS, Canberra, 2002.
Department of Immigration and Multicultural and Indigenous Affairs (DIMIA), ‘Record Temporary Entrants Contribute to Economy’, Media Release, 2002 http:www.minister.immi.gov.au/media_releases/media02/r02001.htm
Department of Immigration and Multicultural and Indigenous Affairs (DIMIA), ‘Temporary Protection Visas’, Fact Sheet 64, AGPS, Canberra, 2002.
Department of Immigration and Multicultural and Indigenous Affairs (DIMIA), ‘Temporary Protection Visas’, Fact Sheet 64, DIMIA, Canberra, 2003.
Department of Immigration and Multicultural and Indigenous Affairs (DIMIA), ‘Unauthorised Arrivals by Air and Sea’, Fact Sheet 74, DIMIA, Canberra, 2002.
Department of Immigration and Multicultural Affairs (DIMIA), ‘Unauthorised Arrivals by Air and Sea’, DIMIA Fact Sheet 81, DIMA, Canberra, 2000.
79

A New Paradigm of International Migration: Implications for Migration Policy and Planning in Australia
Dobson, I, ‘Overseas students in Australian higher education: trends to 1996’, People and Place, vol. 5, no. 1, 1997, pp. 24–29.
Eden, P, P Fredriksson and O Aslund, ‘Settlement policies and the economic success of immigrants’, Journal of Population Economics, vol. 17, 2004, pp. 133–155.
Findlay, AM, ‘A migration channels approach to the study of high level manpower movements: a theoretical perspective’, International Migration, vol. 28, no. 1, 1990, pp. 15–24.
Forbes, S, ‘The 1992–93 migration program’, Post Migration no. 88, July 1992. Glick Schiller, N, L Basch, and C Szanton Blanc, ‘From immigrant to transmigrant: theorizing
transnational migration’, Anthropological Quarterly, vol. 68, 1995, pp. 48–63. Harding, G, and E Webster, The Working Holiday Maker Scheme and the Australian labour
market, Melbourne Institute of Applied Economic and Social Research, University of Melbourne, 2002.
Hugo, GJ, ‘Australian immigration policy: the significance of the events of 11th September’, International Migration Review, vol. 36, no. 1, Spring, 2002.
Hugo, GJ, ‘From compassion to compliance?: trends in refugee and humanitarian migration in Australia’, GeoJournal, vol. 56, 2002, pp. 27–37.
Hugo, GJ, The economic implications of emigration from Australia, AGPS, Canberra, 1994. Hugo, GJ, ‘International migration and agricultural labour in Australia’, Paper presented at
Changing Face Workshop, Imperial Valley, California, 16–18 January 2001. Hugo, GJ, ‘International migration and labour markets in Asia: Australia Country Paper 2003’
Paper prepared for the Ninth Workshop on International Migration and Labour Markets in Asia organised by the Japan Institute of Labour (JIL) supported by the Government of Japan, Organisation for Economic Cooperation and Development (OECD) and the International Labour Office (ILO), Japan Institute of Labour, Tokyo, 6–7 February 2003.
Hugo, GJ, ‘International migration and labour markets in Asia: Australia Country Paper 2004’ Paper prepared for the Tenth Workshop on International Migration and Labour Markets in Asia organized by the Japan Institute for Labor Policy and Training (JILPT) supported by the Government of Japan, Organisation for Economic Cooperation and Development (OECD) and the International Labour Office (ILO), Tokyo, 5–6 February 2004.
Hugo, GJ, ‘Migration and development: a perspective from Asia’, IOM Migration Research Series, No. 14, 2003.
Hugo, GJ, ‘Recent trends in internal migration and population redistribution in Australia’ Paper prepared for presentation at the Population Association of America 2003 Annual Meeting, Minneapolis, 1–3 May 2003.
Hugo, GJ, ‘Regional development through immigration? the reality behind the rhetoric’, Research Paper no. 9 1999–2000, Department of Parliamentary Library, Information and Research Services, Canberra, 1999.
Hugo, GJ, ‘Temporary migration to Australia: trends and implications’, Paper prepared for Annual Conference of New Zealand Geographical Society, Auckland, New Zealand, July 2003.
Hugo, GJ, ‘Unauthorised international population mobility in Southeast Asia’ A Review Paper for Regional Ministerial Conference on People Smuggling, Trafficking in Persons and Related Transnational Crime, February, 2002.
Hugo, GJ, D Rudd and K Harris, ‘Emigration from Australia: economic implications’, CEDA Information Paper no. 77, CEDA, Melbourne, 2001.
80

A new paradigm of international migration: implications for migration policy and planning in Australia
Hugo, GJ, D Rudd, and K Harris, ‘Australia’s diaspora: it’s size, nature and policy implications’, CEDA Information Paper no. 80, CEDA, Melbourne, 2003.
Iredale, R, ‘Migration policies for the highly skilled in the Asia-Pacific Region’, International Migration Review, vol. 34, no. 3, 2000, pp. 882–906.
Iredale, R, ‘The need to import skilled personnel: factors favouring and hindering its international mobility’, International Migration, vol. 37, no. 1, 1999, pp. 89–124.
James, D, ‘Faces in a global gallery’, Business Review Weekly, 19 February 2004, p. 66. Australia, Parliament, Joint Standing Committee on Migration (JSCM), Working holiday makers:
more than tourists, AGPS, Canberra, 1997. Jupp, J, From White Australia to Woomera: the story of Australian immigration, Cambridge
University Press, Cambridge 2002. Kent, MM, and M Mather, ‘What drives US population growth’, Population Bulletin, vol. 57, no.
4, 2002, pp. 3–40. Khoo, SE, Census 86: data quality—ancestry, Australian Bureau of Statistics, Canberra, 1989. Khoo, S, and P McDonald, Category jumping: trends, demographic impact and measurement
issues, Report to the Department of Immigration and Multicultural and Indigenous Affairs (DIMIA) and the Australian Bureau of Statistics (ABS), Canberra, 2000 www.immi.gov.au/statistics/publications/category_jumping/catjump.pdf.
Khoo, S, C Voight-Graf, and GJ Hugo, ‘Temporary skilled migration to Australia: the first five years of arrivals in the 457 Visa Subclass’, Australian Centre for Population Research, Research School of Social Sciences, Mimeo, The Australian National University, Canberra, 2003.
Kinnaird, B, ‘Australia’s Migration Policy and skilled ICT professionals: the case for an overhaul’, People and Place, 10, 2, 2002, pp. 55–69.
Kinnaird, B, ‘Working holiday makers: more than tourists—implications of the Report of the Joint Standing Committee on Migration’, People and Place, vol. 7, no. 1, 1999, pp. 39–52.
Kippen, R, and P McDonald, ‘Australia’s population in 2000: the way we are and the ways we might have been’, People and Place, vol. 8, no. 3, 2000, pp. 10–17.
Koser, K, and J Salt, ‘Research Review 4: the geography of highly skilled international migration’, International Journal of Population Geography, vol. 3, no. 4, 1997, pp. 285–304.
Mares, P, Borderline: Australia’s treatment of refugees and asylum seekers, UNSW Press, Sydney, 2001.
Martin, ‘Regional patterns of international migration: North American present and future’ Paper presented at Tenth Workshop on International Migration and Labour Markets in Asia organized by the Japan Institute of Labour, Tokyo, 5–6 February 2004.
Massey, DS, J Arango, GJ Hugo, A Kouaouci, A Pellegrino, and JE Taylor, ‘Theories of international migration: an integration and appraisal’, Population and Development Review, vol. 19, no. 3, 1993, pp. 431–466. (Reprinted by International Union for the Scientific Study of Population).
Massey, DS, J Arango, GJ Hugo, A Kouaouci, A Pellegrino, and JE Taylor, Worlds in motion: understanding international migration at the end of the millennium, Clarendon Press, Oxford, 1998, 362 pp.
McDonald, P, S Khoo and R Kippen, ‘Alternative net migration estimates for Australia: exploding the myth of rapid increase in numbers’, People and Place, vol. 11, no. 3, 2003, pp. 23–26.
81

A New Paradigm of International Migration: Implications for Migration Policy and Planning in Australia
Meyers, E, ‘Theories of international immigration policy: a comparative perspective’, International Migration Review, vol. 34, no. 4, 2000, pp. 1245–1282.
Migration Policy Institute (MPI), ‘A new century: immigrants and the US’, Migration Information Source, May 2002. http://www.migrationinformation.org/feature/print.cfm?ID=6
Organisation for Economic Co-operation and Development (OECD), ‘International mobility of the highly skilled’, OECD Proceedings, OECD, Paris 2002.
Organisation for Economic Co-operation and Development (OECD), Trends in international migration: continuous reporting system on migration: annual report, OECD, Paris, 1999.
Organisation for Economic Co-operation and Development (OECD), Trends in international migration: continuous reporting system on migration: annual report, OECD, Paris, 2000.
Organisation for Economic Co-operation and Development (OECD), Trends in international migration: continuous reporting system on migration: annual report, OECD, Paris 2001.
Organisation for Economic Co-operation and Development (OECD), Trends in international migration: continuous reporting system on migration: annual report, OECD, Paris, 2002.
Paice, J, ‘The 1990s—is the Australian Census of Population and Housing relevant?’ Paper presented at the Australian Population Association Conference, Melbourne, November 1990.
Peixoto, J, ‘The international mobility of highly skilled workers in transnational corporations: the macro and micro factors of the organizational migration of cadres’, International Migration Review, 35, 4, pp. 1030–1053.
Portes, A, ‘Immigration theory for a new century: some problems and opportunities’, International Migration Review, vol. 31, no. 4, 1997, pp. 799–825.
Price, C, P Pyne, and B Derrick, ‘Long-term migration: home visitors and transilients’, pp. 50–59 in CA Price (ed.), Australian immigration: a bibliography and digest, ANU Press, Canberra, 1981.
Price, CA et al., ‘Birthplaces of Australian population 1861–1981’, Working Papers in Demography no. 13, Australian National University, Canberra, 1984.
Richardson, S, F Robertson and D Ilsley, The labour force experience of new migrants, AGPS, Canberra, 2001.
Richmond, AJ, ‘International migration and global change’ Paper presented at International Conference on Migration, Centre for Advanced Studies, Faculty of Arts and Social Sciences, National University of Singapore, February 1991.
Rizvi, A, SOPEMI 2003: Australia, Report by Australia’s Correspondent to SOPEMI, November 2002.
Rizvi, A, SOPEMI 2004: Australia, Report by Australia’s Correspondent to the OECD 2003. Rowland, DT, ‘Population growth and distribution’, pp. 10–45 in ESCAP Population of Australia,
vol. 1, Country Monograph Series no. 9, United Nations, New York 1982. Ruddick, E, ‘Immigrant economic performance—a new paradigm in a changing labour market’,
Canadian Issues, April 2003. Ruddock, P, ‘ACT benefits from regional skilled migration’, Media Release MPS 69a/2002,
DIMIA, Canberra, 2002. Ruddock, P, Background paper on unauthorised arrivals strategy, DIMIA, Canberra, 2001. Ruddock, P, ‘Northern Territory benefits from regional skilled migration’, Media Release
MPS69c/2002, DIMIA, Canberra, 2002.
82

A new paradigm of international migration: implications for migration policy and planning in Australia
Ruddock, P, ‘Record temporary entrants contribute to economy’, DIMIA Media Release, MPS 1/2002, DIMIA, Canberra, 2002.
Ruddock, P, ‘Regional NSW benefits from skilled migration’, Media Release MPS 69b/2002, DIMIA, Canberra, 2002.
Ruddock, P, ‘Regional Queensland benefits from skilled migrants’, Media Release MPS69d/2002, DIMIA, Canberra, 2002.
Ruddock, P, ‘Regional WA benefits from skilled migration’, Media Release MPS 69h/2002, DIMIA, Canberra, 2002.
Ruddock, P, ‘South Australia attracts skilled migrants’, Media Release MPS 69e/2002, DIMIA, Canberra, 2002.
Ruddock, P, ‘Tasmania benefits from regional skilled migration’, Media Release MPS 69f/2002, DIMIA, Canberra, 2002.
Ruddock, P, ‘Victoria benefits under state specific migration initiatives’, Media Release MPS 69g/2002, DIMIA, Canberra, 2002.
Salt, J, International movements of the highly skilled labour, OECD, Paris, 1997. Sant, ME and PL Simons, ‘The conceptual basis of counterurbanisation: critique and
development’, Australian Geographical Studies, 31, 1993, pp. 113–126. Sassen, S, ‘America’s immigration “problem”‘, World Policy Journal, vol. 6, no. 4, 1989, pp. 811–
32. Sassen, S, The global city, 2nd ed., Princeton University Press, New York, 2001. Scott, ML, A Whelan, J Dewdney and AB Zwi, ‘“Brain drain” or ethical recruitment’, Medical
Journal of Australia, vol. 180, no. 4, 2004, pp. 174–176. Shu, J, and L Hawthorne, ‘Asian student migration to Australia’, International Migration, vol. 24,
no. 1, 1996, pp. 65–96. Southern Cross, Estimates of Australian citizens living overseas as at 31 December 2001, 2002
http://www.southern-cross-group.org/archives/Statistics/ Numbers_of_Australians_Overseas_in_2001_by_Region_Feb_2002.pdf.
United Nations, International migration 2002, United Nations, New York, 2002. US Census Bureau, Conference on an Enumeration of Americans Overseas in the 2010 Census, 26
and 27 November 2001, US Department of Commerce, Economics and Statistics Administration, US Census Bureau, 2002.
US Census Bureau, Team 7 Final Report – Emigration of Native Born, 5 October 2002. Viviani, N, The Indochinese in Australia, 1975–1995, Oxford University Press, Melbourne 1996. Withers, G, and M Powell, Immigration and the regions: taking regional Australia seriously, A
report prepared for the Chifley Research Centre by Applied Economics P/L, October 2003. Wooden, M, R Holton, GJ Hugo and R Sloan, 1994. Australian Immigration: A Survey of the
Issues. Canberra: AGPS. Zlotnik, H, 1987. The Concept of International Migration as Reflected in Data Collection Systems,
International Migration Review, Special Issue, Vol. 21. Zlotnik, H, 1999. Trends of International Migration Since 1965: What Existing Data Reveal,
International Migration, 37, 1, pp. 21–62.
83