Embed Size (px)
Citation preview

A NEW PARADIGM FOR THE HIRING AND EVALUATION OF INSTITUTIONAL ASSET
MANAGERS
Dan diBartolomeo Northfield Information Services 2011
A KIND OF FUNNY PHONE CALL
About a year and a half ago, I got a phone call from the CIO of a large US pension plan
The CIO posed an interesting question: If you had to hire/fire and allocate capital to external active managers in
a completely quantified mechanical process, how would you do it? I sent them a three page memo outlining my answer
A month later we had a face to face discussion The meeting was over by 11 AM so I spent the afternoon skiing
A month later a surprising call: the CIO said “let’s do it” I said “let’s do what?” He said “the mechanical manager process” I turned a staff member and said “this going to be fun”
We’re about halfway to live implementation on over $30 Billion in assets
MOTIVATION FOR THE MOVE
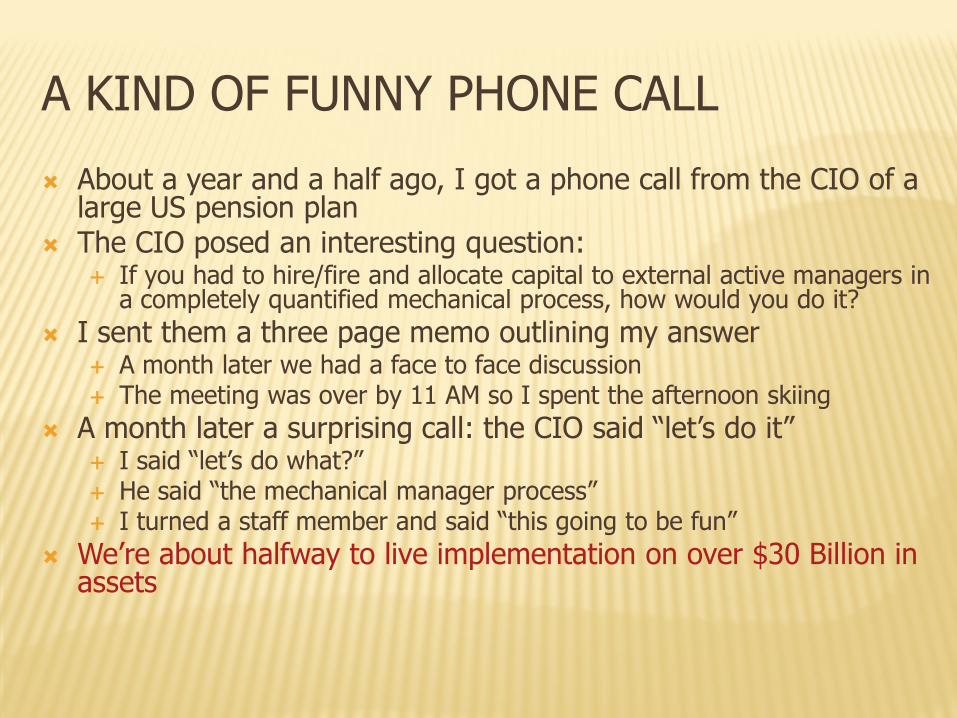
No value added Despite a large internal staff and a set of consultants, the plan sponsor
found their average manager performance was average The plan sponsor was not really compelled that the managers
they hired were skillful rather than lucky Potential skilled but unconventional managers were excluded
The plan sponsor wanted to preempt any problems with managers trying to improperly influence the process There have been numerous reported cases of bribes and political
contributions in attempts to get pension assets to manage A number of public and Taft-Hartley plans have senior decision makers
with political rather than investment experience All the fees and travel expenses entailed in the traditional seemed
frivolous in periods of fiscal austerity The lack of discipline in the process made allocating capital
between active and passive, and among active managers extremely subjective

HOW IT’S GOING TO WORK
The plan sponsor will be setting up a website Any firm that wants to manage money for the sponsor can go there at
any time and make application for consideration They will need to fill out a questionnaire, provide a spreadsheet of
performance and AUM history, and a brief strategy description New candidate managers and incumbents will be evaluated on a rolling
basis The process can deal with thousands of candidate managers
Capital will be reallocated between active and passive, and among active managers on a periodic basis
Traditional marketing will be very curtailed “Don’t call us, we’ll call you”
Customary verification and due diligence procedures will remain in place
A SPORTS TEAM DRAFTING NEW PLAYERS
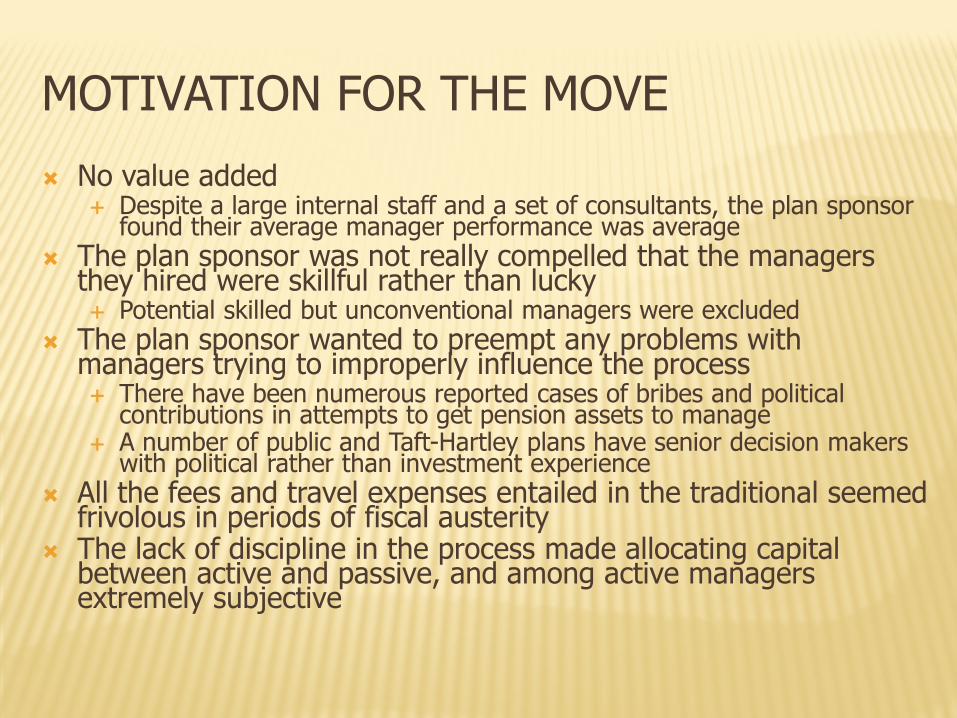
The first questions we want to answer: Have our existing managers added value? Would any of the candidate managers have added return to a material
degree to the fund’s performance if they had been employed in the past?
Is alpha positive and statistically significant?
Similar in spirit to a sports team drafting new players If your team already has a great hockey goalie, you are unlikely to want
a new one If you have a weak baseball outfielder, you might want to draft a
promising outfielder
First cut process is returns based style analysis Candidate manager return history is dependent variable Incumbent manager histories are the independent variables See diBartolomeo and Lobosco (1997) for confidence interval
calculations
QUANTIFYING THE QUALITATIVE
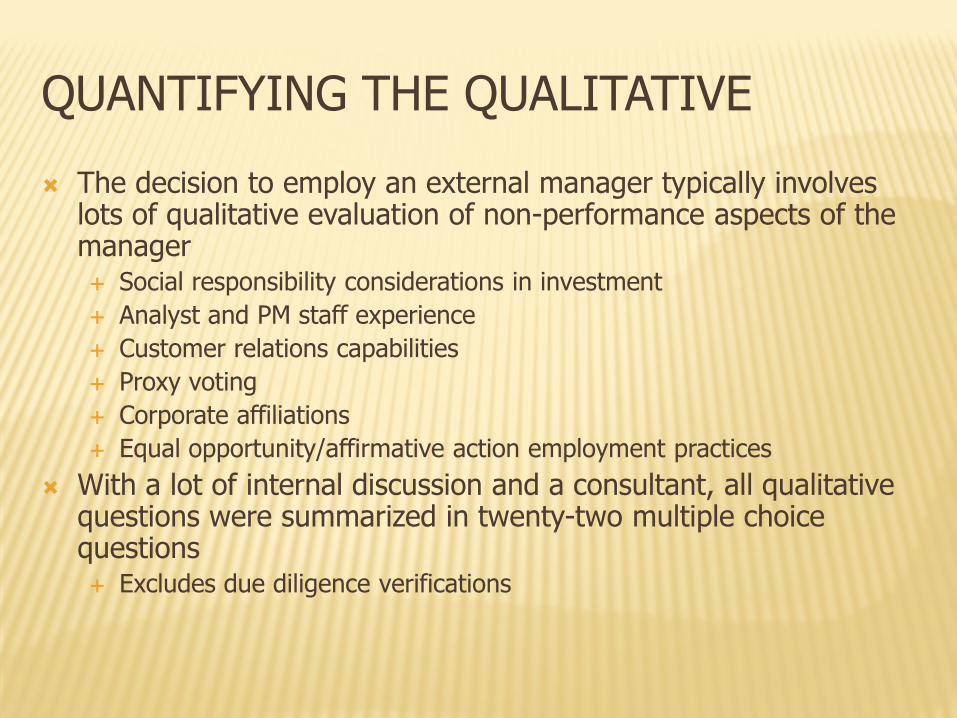
The decision to employ an external manager typically involves lots of qualitative evaluation of non-performance aspects of the manager Social responsibility considerations in investment Analyst and PM staff experience Customer relations capabilities Proxy voting Corporate affiliations Equal opportunity/affirmative action employment practices
With a lot of internal discussion and a consultant, all qualitative questions were summarized in twenty-two multiple choice questions Excludes due diligence verifications
QUANTIFYING THE QUALITATIVE PART 2
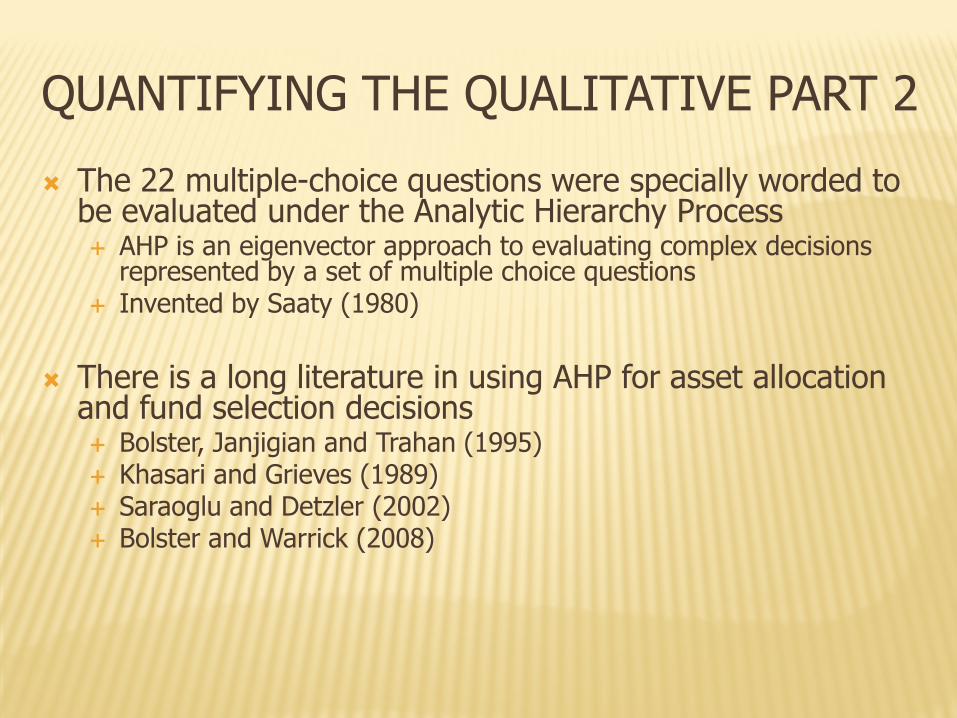
The 22 multiple-choice questions were specially worded to be evaluated under the Analytic Hierarchy Process AHP is an eigenvector approach to evaluating complex decisions
represented by a set of multiple choice questions Invented by Saaty (1980)
There is a long literature in using AHP for asset allocation
and fund selection decisions Bolster, Janjigian and Trahan (1995) Khasari and Grieves (1989) Saraoglu and Detzler (2002) Bolster and Warrick (2008)
QUANTIFYING THE QUALITATIVE PART 3
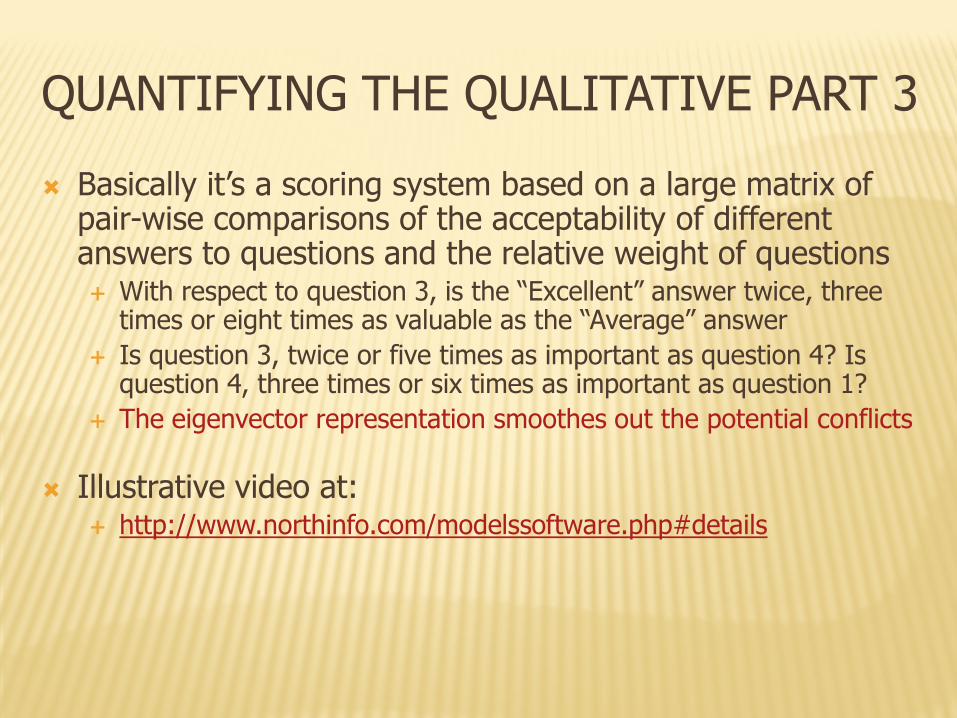
Basically it’s a scoring system based on a large matrix of pair-wise comparisons of the acceptability of different answers to questions and the relative weight of questions With respect to question 3, is the “Excellent” answer twice, three
times or eight times as valuable as the “Average” answer Is question 3, twice or five times as important as question 4? Is
question 4, three times or six times as important as question 1? The eigenvector representation smoothes out the potential conflicts
Illustrative video at:
http://www.northinfo.com/modelssoftware.php#details
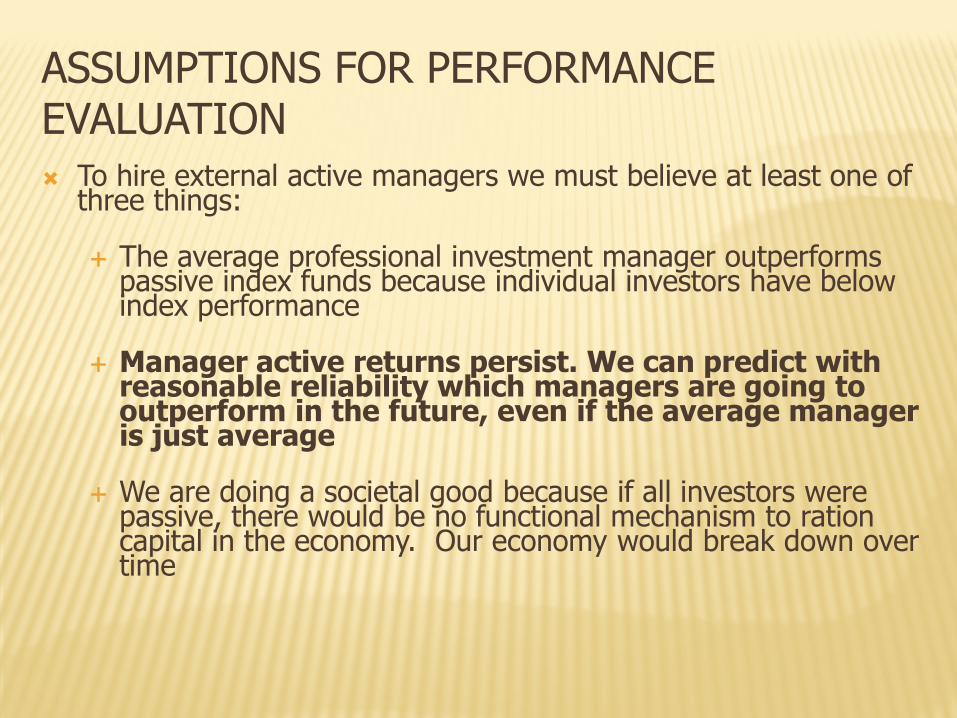
ASSUMPTIONS FOR PERFORMANCE EVALUATION To hire external active managers we must believe at least one of
three things: The average professional investment manager outperforms
passive index funds because individual investors have below index performance
Manager active returns persist. We can predict with reasonable reliability which managers are going to outperform in the future, even if the average manager is just average
We are doing a societal good because if all investors were passive, there would be no functional mechanism to ration capital in the economy. Our economy would break down over time
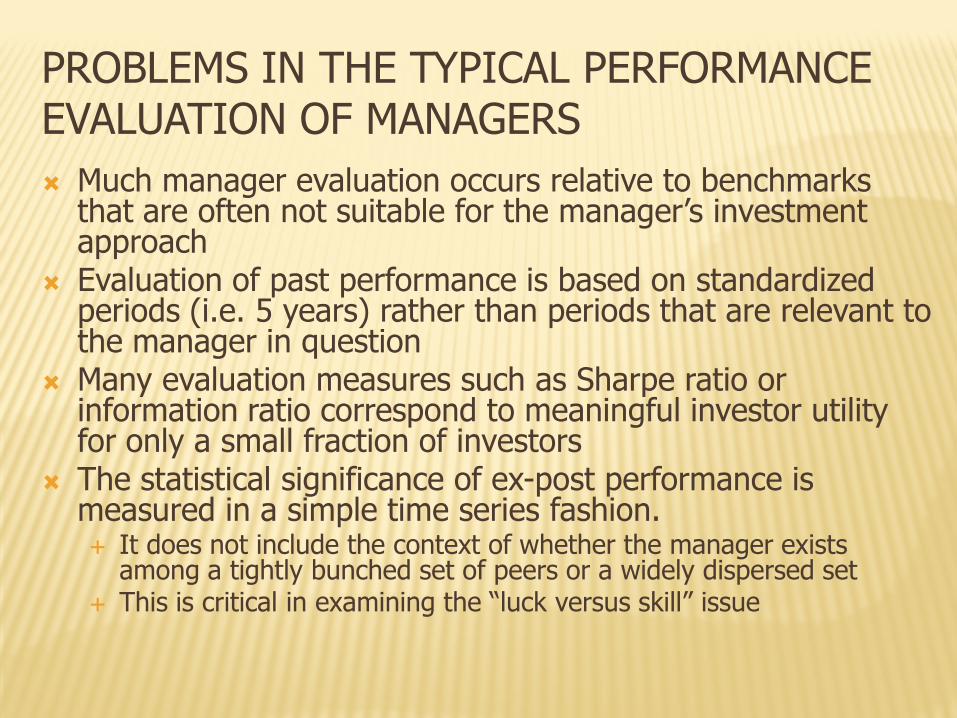
PROBLEMS IN THE TYPICAL PERFORMANCE EVALUATION OF MANAGERS Much manager evaluation occurs relative to benchmarks
that are often not suitable for the manager’s investment approach
Evaluation of past performance is based on standardized periods (i.e. 5 years) rather than periods that are relevant to the manager in question
Many evaluation measures such as Sharpe ratio or information ratio correspond to meaningful investor utility for only a small fraction of investors
The statistical significance of ex-post performance is measured in a simple time series fashion. It does not include the context of whether the manager exists
among a tightly bunched set of peers or a widely dispersed set This is critical in examining the “luck versus skill” issue
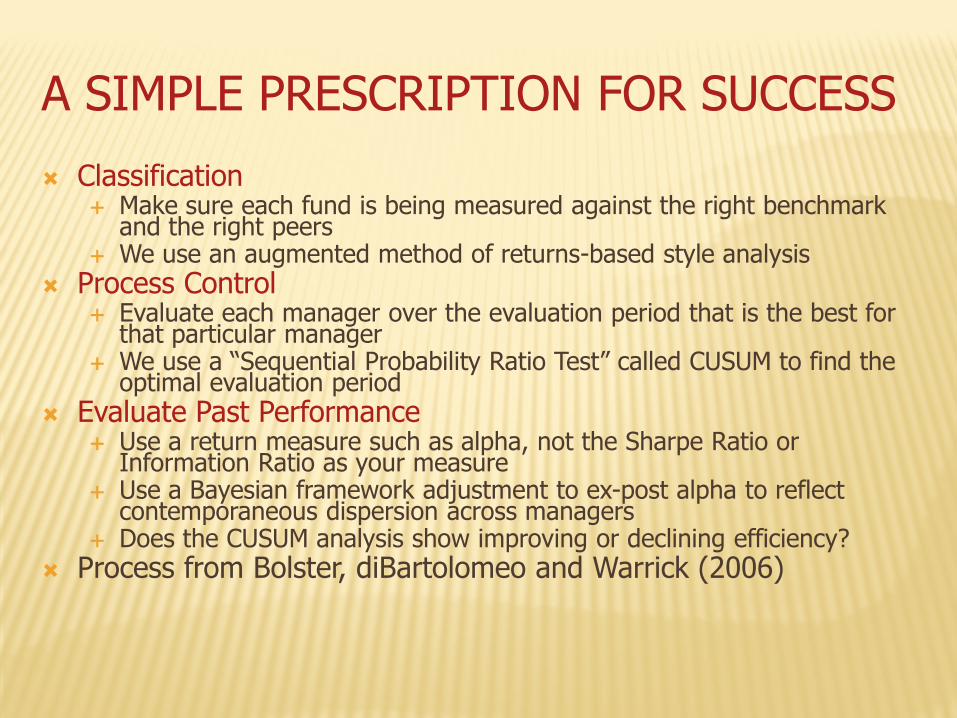
A SIMPLE PRESCRIPTION FOR SUCCESS
Classification Make sure each fund is being measured against the right benchmark
and the right peers We use an augmented method of returns-based style analysis
Process Control Evaluate each manager over the evaluation period that is the best for
that particular manager We use a “Sequential Probability Ratio Test” called CUSUM to find the
optimal evaluation period Evaluate Past Performance
Use a return measure such as alpha, not the Sharpe Ratio or Information Ratio as your measure
Use a Bayesian framework adjustment to ex-post alpha to reflect contemporaneous dispersion across managers
Does the CUSUM analysis show improving or declining efficiency? Process from Bolster, diBartolomeo and Warrick (2006)
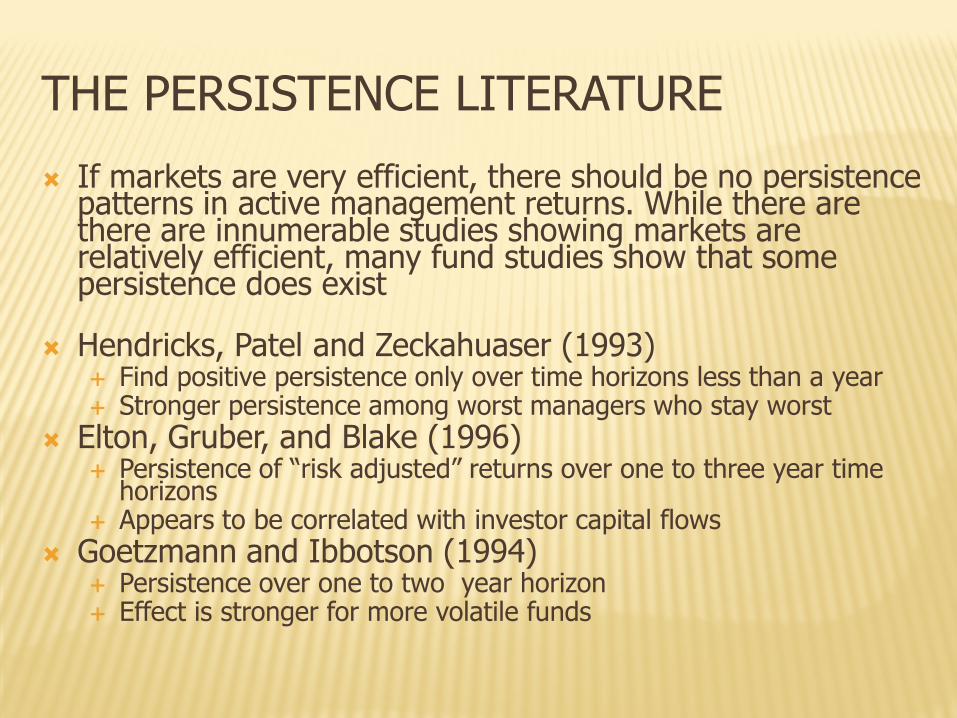
THE PERSISTENCE LITERATURE
If markets are very efficient, there should be no persistence patterns in active management returns. While there are there are innumerable studies showing markets are relatively efficient, many fund studies show that some persistence does exist
Hendricks, Patel and Zeckahuaser (1993) Find positive persistence only over time horizons less than a year Stronger persistence among worst managers who stay worst
Elton, Gruber, and Blake (1996) Persistence of “risk adjusted” returns over one to three year time
horizons Appears to be correlated with investor capital flows
Goetzmann and Ibbotson (1994) Persistence over one to two year horizon Effect is stronger for more volatile funds
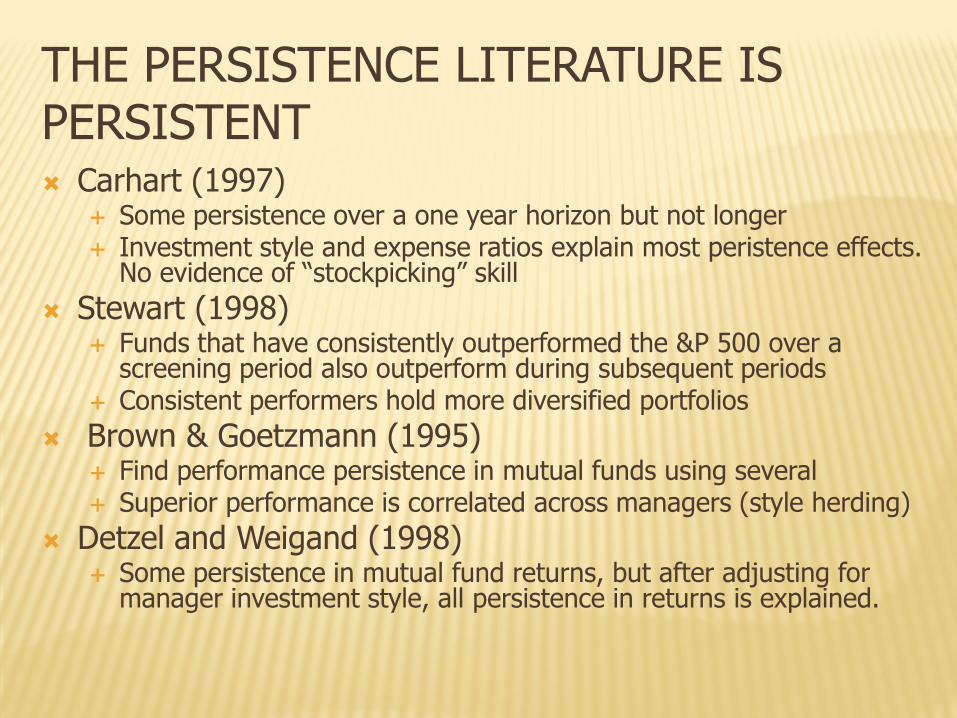
THE PERSISTENCE LITERATURE IS PERSISTENT Carhart (1997)
Some persistence over a one year horizon but not longer Investment style and expense ratios explain most peristence effects.
No evidence of “stockpicking” skill Stewart (1998)
Funds that have consistently outperformed the &P 500 over a screening period also outperform during subsequent periods
Consistent performers hold more diversified portfolios Brown & Goetzmann (1995)
Find performance persistence in mutual funds using several Superior performance is correlated across managers (style herding)
Detzel and Weigand (1998) Some persistence in mutual fund returns, but after adjusting for
manager investment style, all persistence in returns is explained.
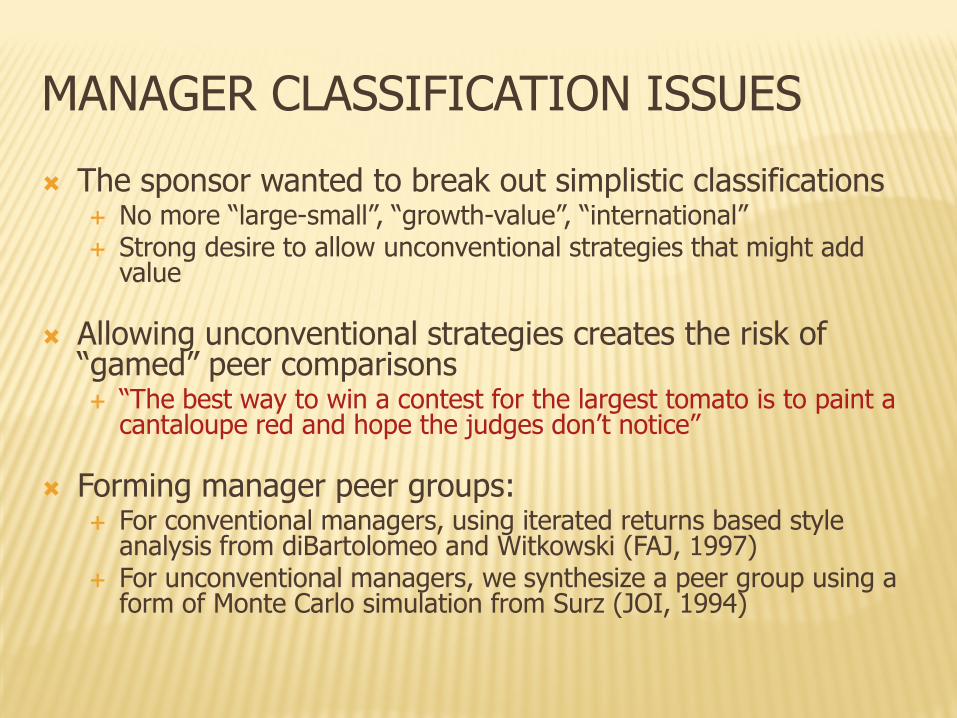
MANAGER CLASSIFICATION ISSUES
The sponsor wanted to break out simplistic classifications No more “large-small”, “growth-value”, “international” Strong desire to allow unconventional strategies that might add
value
Allowing unconventional strategies creates the risk of “gamed” peer comparisons “The best way to win a contest for the largest tomato is to paint a
cantaloupe red and hope the judges don’t notice”
Forming manager peer groups: For conventional managers, using iterated returns based style
analysis from diBartolomeo and Witkowski (FAJ, 1997) For unconventional managers, we synthesize a peer group using a
form of Monte Carlo simulation from Surz (JOI, 1994)
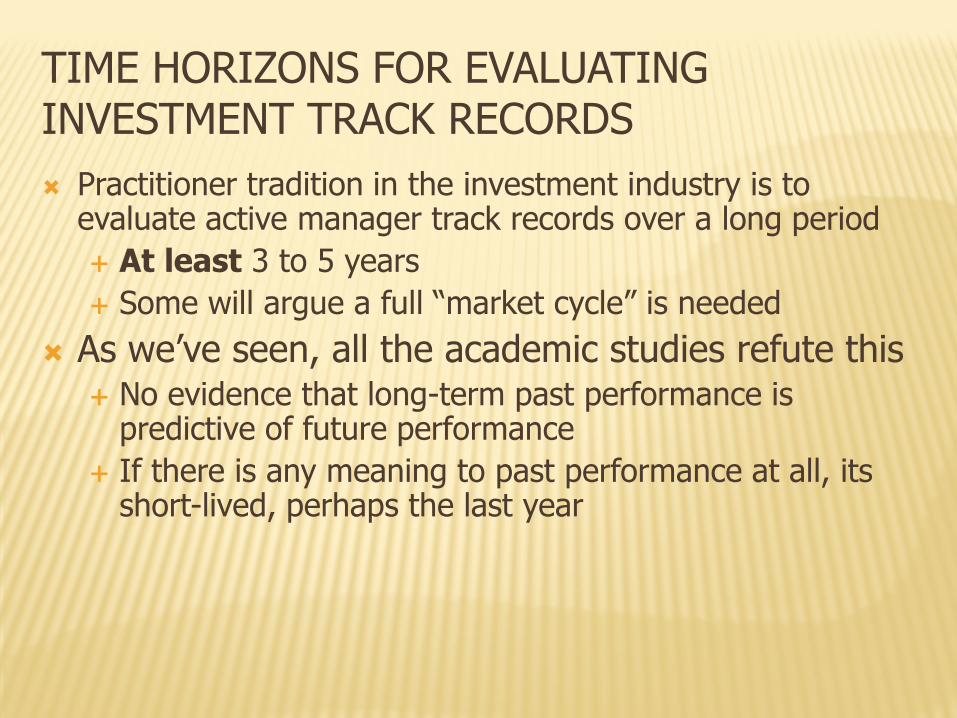
TIME HORIZONS FOR EVALUATING INVESTMENT TRACK RECORDS Practitioner tradition in the investment industry is to
evaluate active manager track records over a long period At least 3 to 5 years Some will argue a full “market cycle” is needed
As we’ve seen, all the academic studies refute this No evidence that long-term past performance is
predictive of future performance If there is any meaning to past performance at all, its
short-lived, perhaps the last year
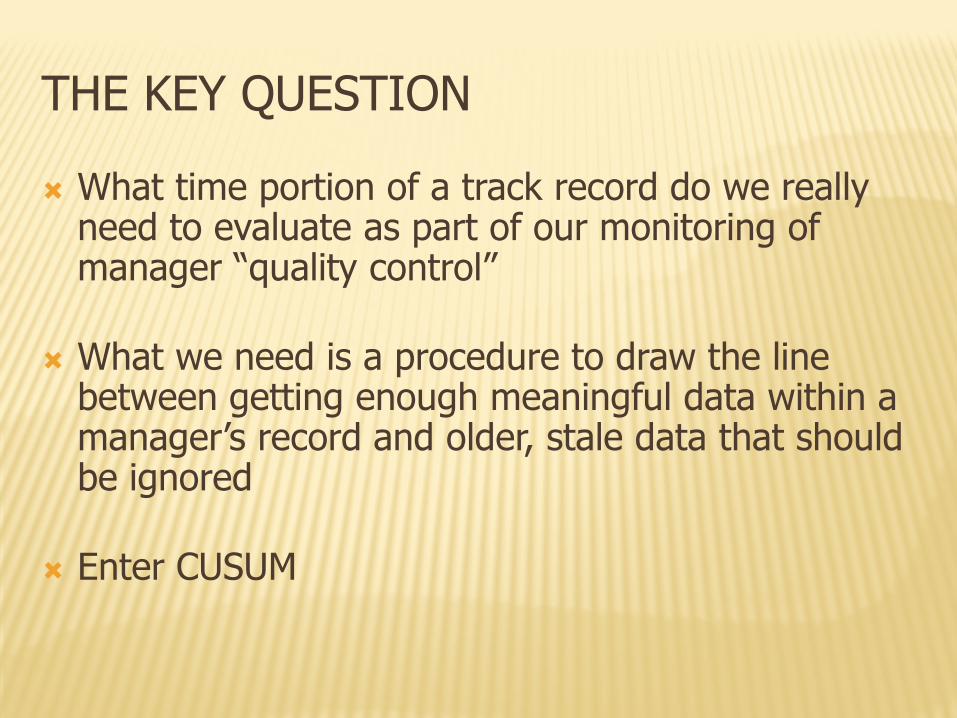
THE KEY QUESTION
What time portion of a track record do we really need to evaluate as part of our monitoring of manager “quality control”
What we need is a procedure to draw the line between getting enough meaningful data within a manager’s record and older, stale data that should be ignored
Enter CUSUM
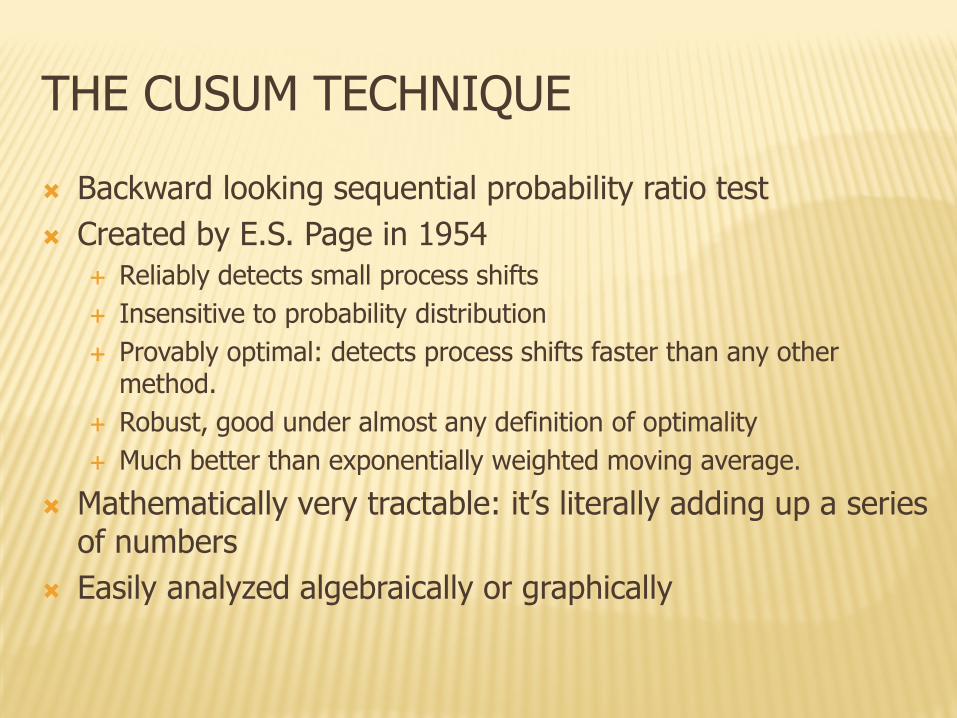
THE CUSUM TECHNIQUE
Backward looking sequential probability ratio test Created by E.S. Page in 1954
Reliably detects small process shifts Insensitive to probability distribution Provably optimal: detects process shifts faster than any other
method. Robust, good under almost any definition of optimality Much better than exponentially weighted moving average.
Mathematically very tractable: it’s literally adding up a series of numbers
Easily analyzed algebraically or graphically
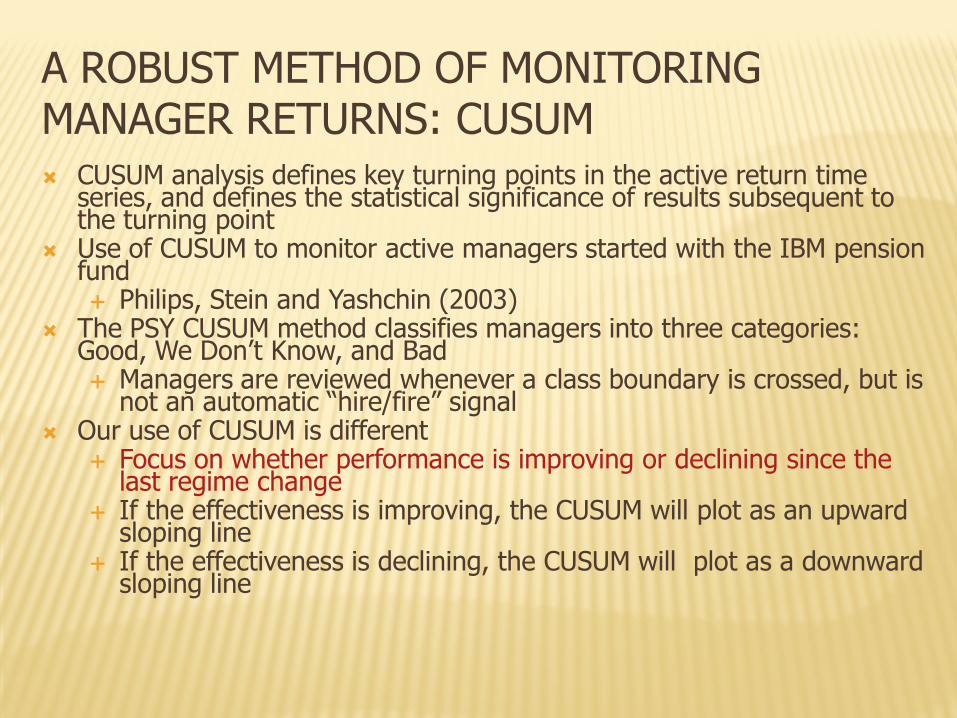
A ROBUST METHOD OF MONITORING MANAGER RETURNS: CUSUM CUSUM analysis defines key turning points in the active return time
series, and defines the statistical significance of results subsequent to the turning point
Use of CUSUM to monitor active managers started with the IBM pension fund Philips, Stein and Yashchin (2003)
The PSY CUSUM method classifies managers into three categories: Good, We Don’t Know, and Bad Managers are reviewed whenever a class boundary is crossed, but is
not an automatic “hire/fire” signal Our use of CUSUM is different
Focus on whether performance is improving or declining since the last regime change
If the effectiveness is improving, the CUSUM will plot as an upward sloping line
If the effectiveness is declining, the CUSUM will plot as a downward sloping line
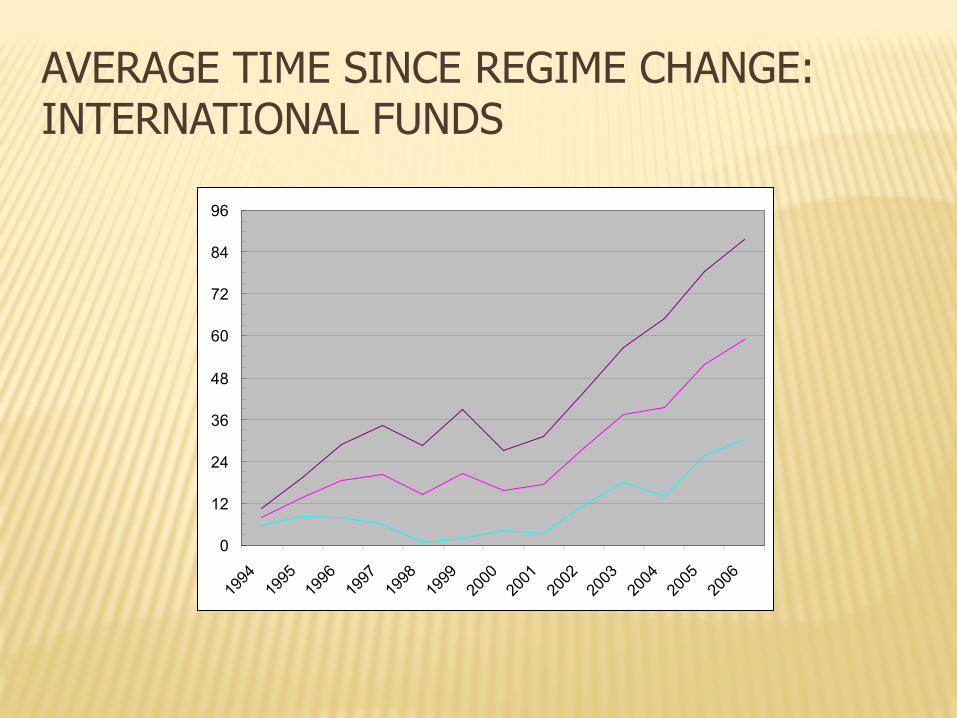
AVERAGE TIME SINCE REGIME CHANGE: INTERNATIONAL FUNDS
0
12
24
36
48
60
72
84
96
1994
1995
1996
1997
1998
1999
2000
2001
2002
2003
2004
2005
2006
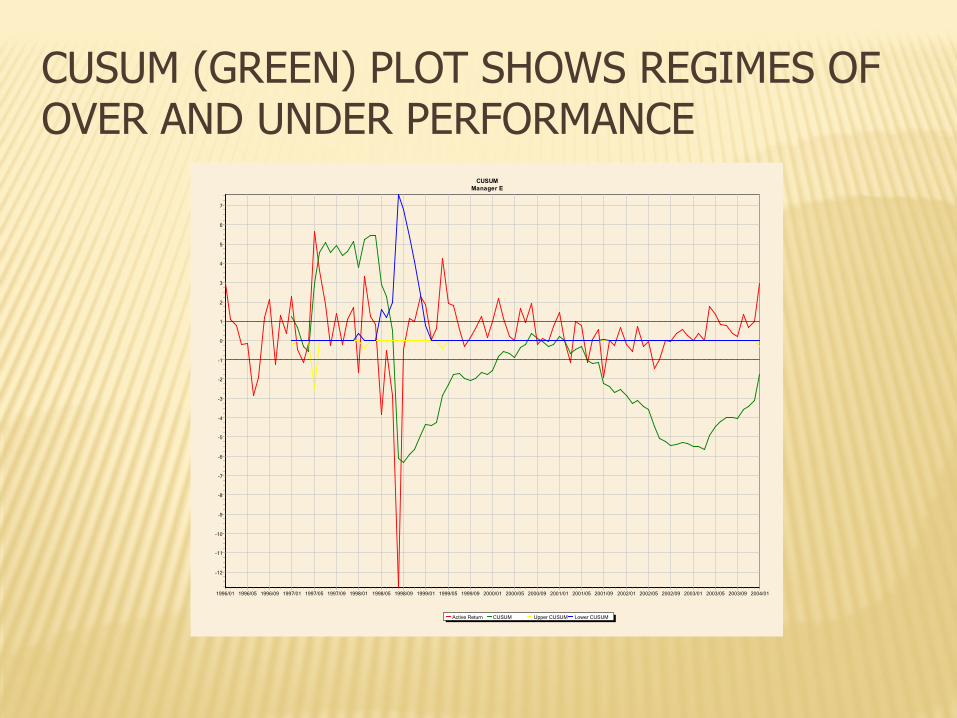
CUSUM (GREEN) PLOT SHOWS REGIMES OF OVER AND UNDER PERFORMANCE
CUSUMManager E
Active Return CUSUM Upper CUSUM Lower CUSUM
1996/01 1996/05 1996/09 1997/01 1997/05 1997/09 1998/01 1998/05 1998/09 1999/01 1999/05 1999/09 2000/01 2000/05 2000/09 2001/01 2001/05 2001/09 2002/01 2002/05 2002/09 2003/01 2003/05 2003/09 2004/01
7
6
5
4
3
2
1
0
-1
-2
-3
-4
-5
-6
-7
-8
-9
-10
-11
-12
NOW THAT WE KNOW THE “WHEN”, LETS DEAL WITH THE “WHAT” Many performance measures are not congruent to adding
value for investors deGroot and Plantinga (2001) Consider a manager that adds exactly one basis point of return in
every time period. The information ratio is infinite, but very little investor wealth is added
We chose to measure excess return above a carefully chosen benchmark that should reflect both risk and investing style This directly measures added value for investors Our CUSUM analysis is already a variation on information ratios
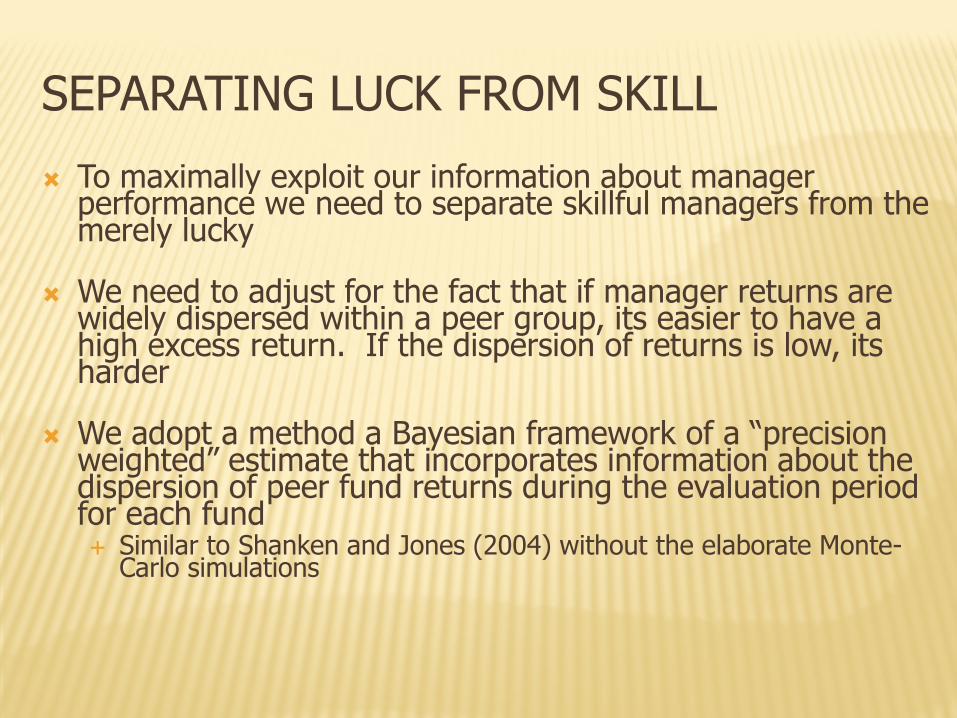
SEPARATING LUCK FROM SKILL
To maximally exploit our information about manager performance we need to separate skillful managers from the merely lucky
We need to adjust for the fact that if manager returns are widely dispersed within a peer group, its easier to have a high excess return. If the dispersion of returns is low, its harder
We adopt a method a Bayesian framework of a “precision weighted” estimate that incorporates information about the dispersion of peer fund returns during the evaluation period for each fund Similar to Shanken and Jones (2004) without the elaborate Monte-
Carlo simulations
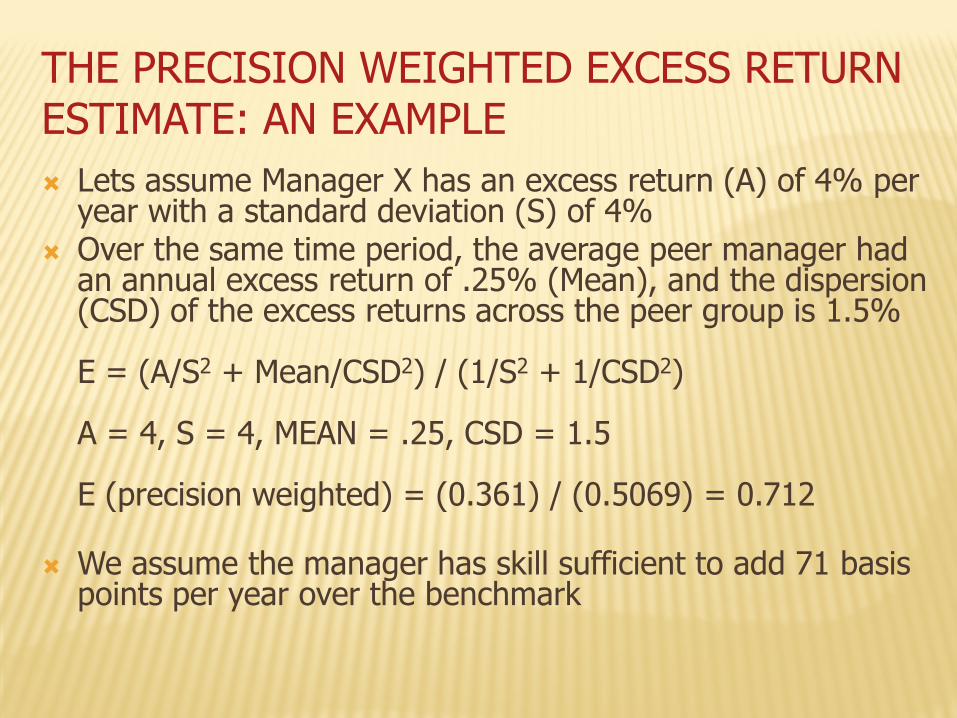
THE PRECISION WEIGHTED EXCESS RETURN ESTIMATE: AN EXAMPLE Lets assume Manager X has an excess return (A) of 4% per
year with a standard deviation (S) of 4% Over the same time period, the average peer manager had
an annual excess return of .25% (Mean), and the dispersion (CSD) of the excess returns across the peer group is 1.5% E = (A/S2 + Mean/CSD2) / (1/S2 + 1/CSD2) A = 4, S = 4, MEAN = .25, CSD = 1.5 E (precision weighted) = (0.361) / (0.5069) = 0.712
We assume the manager has skill sufficient to add 71 basis points per year over the benchmark
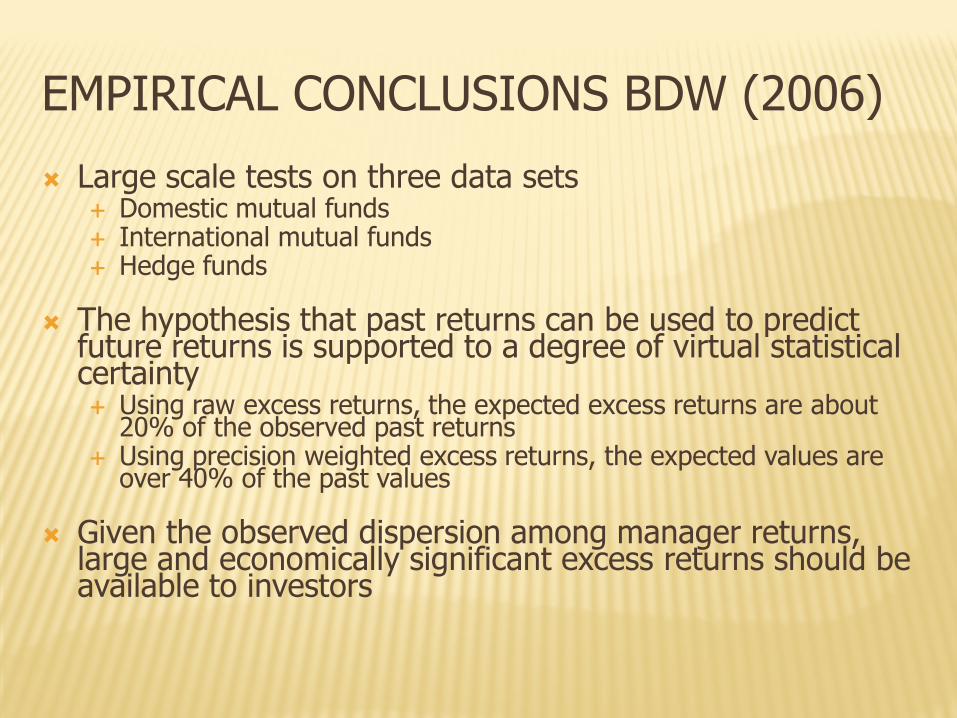
EMPIRICAL CONCLUSIONS BDW (2006)
Large scale tests on three data sets Domestic mutual funds International mutual funds Hedge funds
The hypothesis that past returns can be used to predict
future returns is supported to a degree of virtual statistical certainty Using raw excess returns, the expected excess returns are about
20% of the observed past returns Using precision weighted excess returns, the expected values are
over 40% of the past values
Given the observed dispersion among manager returns, large and economically significant excess returns should be available to investors
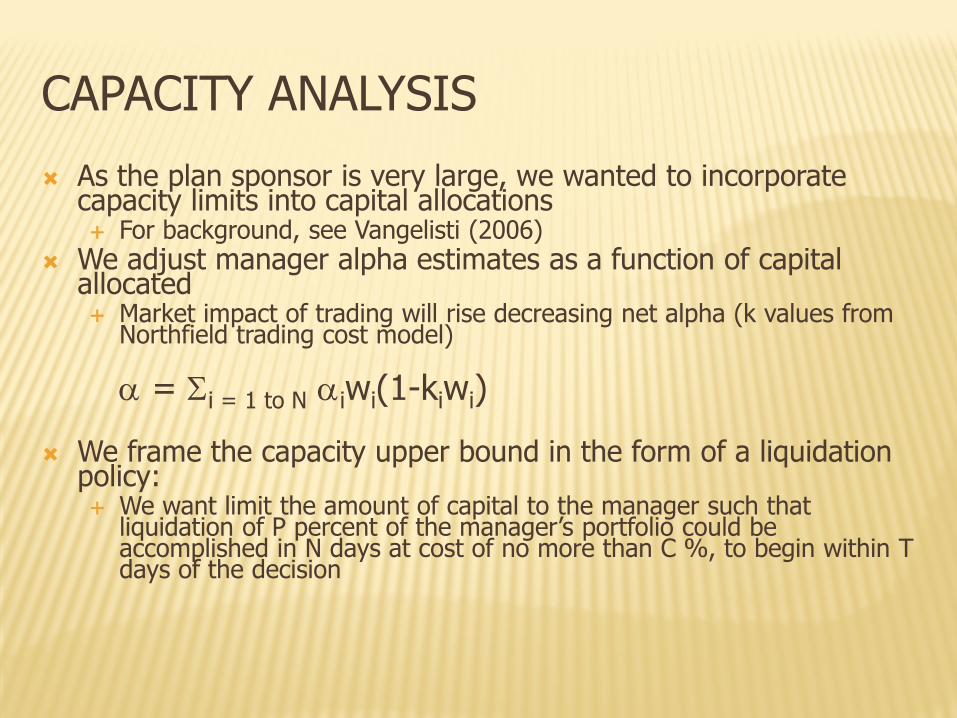
CAPACITY ANALYSIS
As the plan sponsor is very large, we wanted to incorporate capacity limits into capital allocations For background, see Vangelisti (2006)
We adjust manager alpha estimates as a function of capital allocated Market impact of trading will rise decreasing net alpha (k values from
Northfield trading cost model)
α = Σi = 1 to N αiwi(1-kiwi) We frame the capacity upper bound in the form of a liquidation
policy: We want limit the amount of capital to the manager such that
liquidation of P percent of the manager’s portfolio could be accomplished in N days at cost of no more than C %, to begin within T days of the decision
FINISHING THE JOB: HANDING OUT THE MONEY Capital allocations to external managers will be rebalanced
periodically Analytical process is a mean-variance optimization with some
bells and whistles See diBartolomeo (2003) for basic framework Market and active risks are defined separately so the active/passive
decision is automatically done at the same time Capacity limits Amortized hire/fire costs are included Ex-ante manager correlations from risk models on recent holdings
A new definition of active risk (not tracking error) will be
incorporated See diBartolomeo (2010)
CONCLUSIONS
We now believe it is entirely feasible for a plan sponsor to operate their manager evaluation, allocation and monitoring processes completely mechanically
The most challenging part of the process has the qualitative aspects of the manager evaluation process The AHP process has proven to be an excellent tool
The sponsor will have a process in place that: Is immune from being overly influenced by marketing Creates conviction that truly skillful managers are being hired Allows for a much broader range of managers and styles Explicitly addresses capacity limits and manager transition costs
We are confident this effort will have profound effects for asset management marketing in the future
REFERENCES Hendricks, Darryll, Jayendu Patel and Richard Zeckhauser. "Hot Hands In
Mutual Funds: Short-Run Persistence Of Relative Performance, 1974-1988," Journal of Finance, 1993, v48(1), 93-130.
Elton, Edwin J., Martin J. Gruber and Christopher R. Blake. "The Persistence Of Risk-Adjusted Mutual Fund Performance," Journal of Business, 1996, v69(2,Apr), 133-157.
Goetzmann, William N. and Roger G. Ibbotson. "Do Winners Repeat?," Journal of Portfolio Management, 1994, v20(2), 9-18.
Carhart, Mark M. "On Persistence In Mutual Fund Performance," Journal of Finance, 1997, v52(1,Mar), 57-82.
Stewart, Scott D. "Is Consistency Of Performance A Good Measure Of Manager Skill?," Journal of Portfolio Management, 1998, v24(3,Spring), 22-32.
Brown, Stephen J. and William N. Goetzmann. "Performance Persistence," Journal of Finance, 1995, v50(2), 679-698.
Detzel, Larry F. and Robert Weigand, “Explaining Persistence in Mutual Fund Performance”, Financial Services Review, 1998
REFERENCES diBartolomeo, Dan and Erik Witkowski. "Mutual Fund Misclassification:
Evidence Based On Style Analysis," Financial Analyst Journal, 1997, v53(5,Sep/Oct), 32-43.
Lobosco, Angelo and Dan DiBartolomeo. "Approximately The Confidence Intervals For Sharpe Style Weights," Financial Analyst Journal, 1997, v53(4,Jul/Aug), 80-85.
Page, E.S. “Continuous Inspection Schemes”, Biometrika, 1954 Philips, Thomas K., David Stein and Emmanuel Yashchin, “Using Statistical
Process Control to Monitor Active Managers”, Journal of Portfolio Management, 2003
deGroot, Sebastien and Auke Plantinga, “Risk Adjusted Performance Measures and Implied Risk Attitudes”, Journal of Performance Measurement, Winter 2001/2002
Jones, Christopher and Jay Shanken, “Mutual Fund Performance with Learning Across Funds”, Working Paper FMA Annual Meeting Proceedings, 2003.
Vangelisti, Marco. “The Capacity of An Equity Strategy”, Journal of Portfolio Management, 2006.
Bolster, P., Janjigian, V. and Trahan, E. “Determining Investor Suitability Using the Analytical Hierarchy Process,” Financial Analysts Journal, July/August, 1995
REFERENCES
Khasiri, S., Kamath, R., and Grieves, R. “A New Approach to Determining Optimum Portfolio Mix,” Journal of Portfolio Management, Spring 1989.
Saaty, J. K. The Analytic Hierarchy Process, McGraw-Hill, 1980. Saraoglu, H. and Detzler, M. “A Sensible Mutual Fund Selection Model,”
Financial Analysts Journal, May/June 2002 Bolster, P. and S. Warrick “Matching Investors with Suitable, Optimal and
Investable Portfolios”, Journal of Wealth Management, Spring 2008. Bolster, Paul, Dan diBartolomeo and Sandy Warrick “Forecasting Relative
Returns of Active Managers”, Proceedings of the FMA Annual Meeting, 2006.
diBartolomeo, Dan. “Active Risk Budgeting Using Northfield Systems”, Northfield News, July 2003.
diBartolomeo, Dan “Strategy Risk and the Central Paradox of Active Management”, Northfield Working Paper, June 2010